wpeF7.jpg (33251 bytes)

Tiger Software's

PEERLESS
STOCK
MARKET
TIMING
1915-2013

1/2/2014
            Click Refresh if this not current date.
)  

   Author: William Schmidt, Ph.D.  
  PO Box 9491 - San Diego, CA 92169 
  858-273-5900  
Email:
     william_schmidt@hotmail.com  

Welcome to Peerless Stock Market Timing
All Rights Reserved. (C) 2012 Wm. Schmidt, Ph.D

2012 Version Signals'
Peerless Shows History Does Repeat.
        
Track Record of Peerless Buys/Sells:  1928-1948  1948-2012


Peerless Is Alive and Growing.

Peerless changes somewhat as new research is done
and reported on our Hotline.  The changes must be reasonable
in terms of technical theory and back-test well.  
Here are the changes after the fact since 1982 and when
the signals were incorporated.

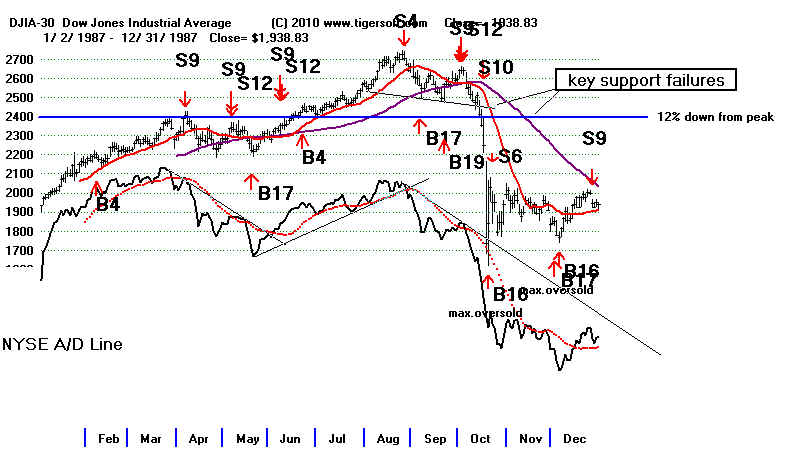
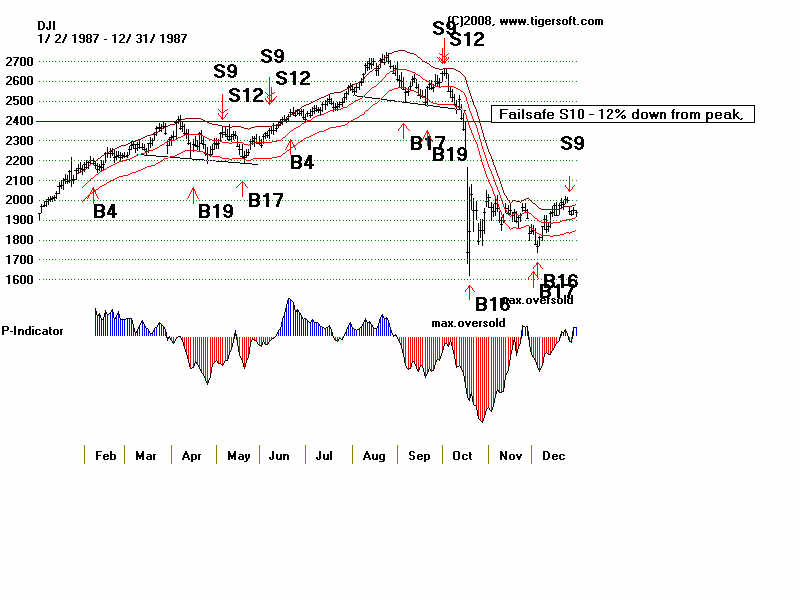
1) 8/26/87 Sell S4 (2701.95) was incorporated in 2009.
We used A/D Line uptrend break for judged Sell S6 back then.
The S6 occurred on 8/27/87 (2675.06).

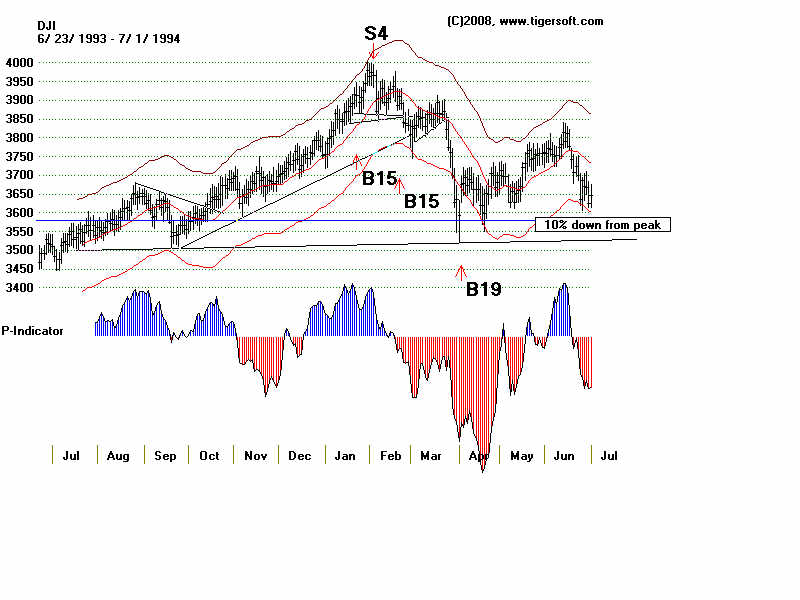
2) 2/3/94 S4  (3967.66) was was incorporated in 2009.
We used the completed head/shoulders for judged Sell S10
on 2/25/1994 (3838.78)

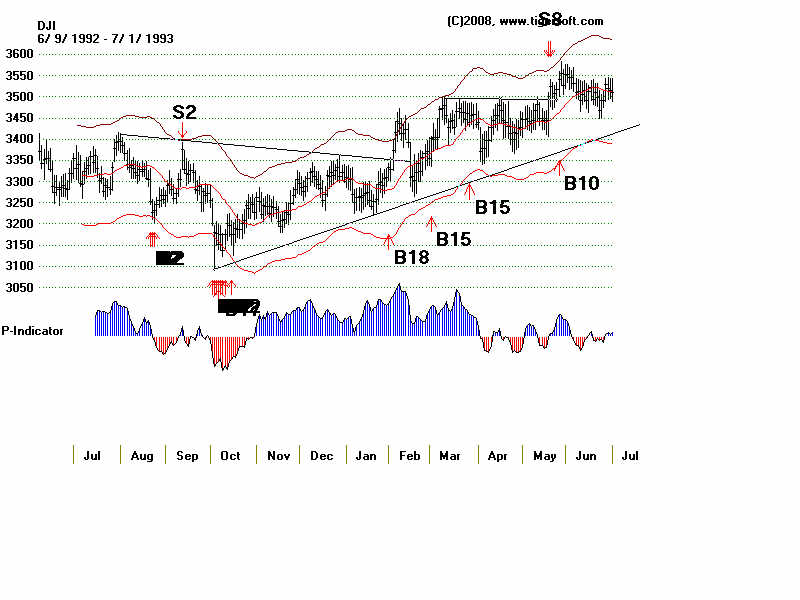
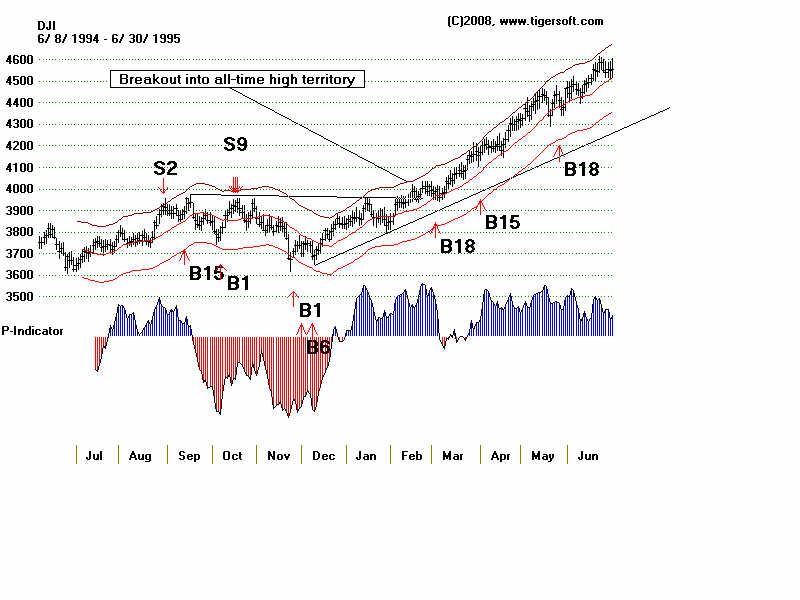
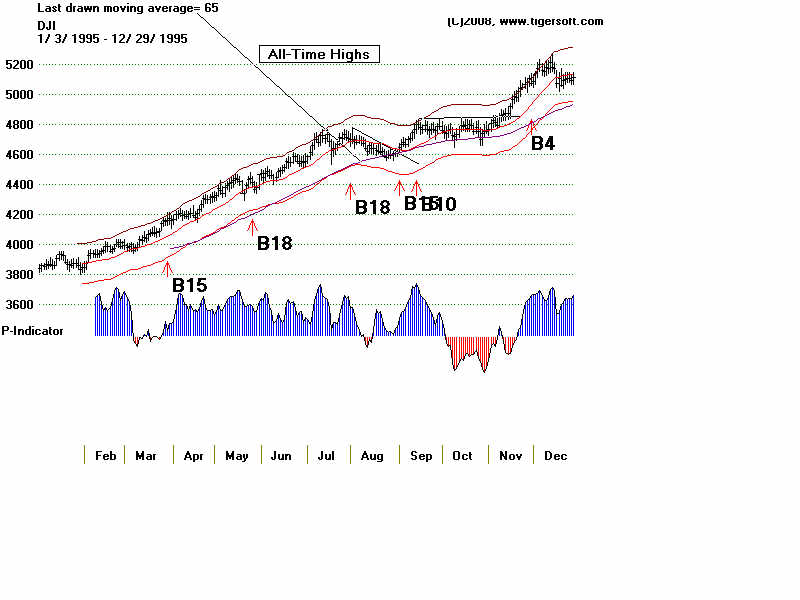
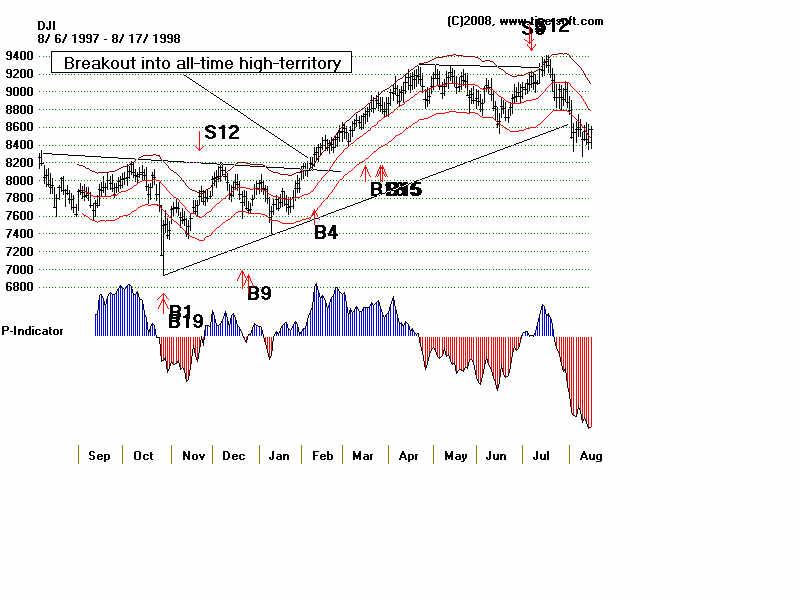
3) 3/10/1995 B10 (4035.610 was applied here even though
the A/D Line did not confirm the breakout because
I considered the pattern very bullish in the DJI, the
Accumulation Index was very positive and
the DJI was making a move into all-time high
where the path of least resistance was UP.  I remember
making a very good Futures trader from Merrill very unhappy
with this because he was short.  And he remained short
even though I was bullish.  He was forced to leave the
business a few months later.

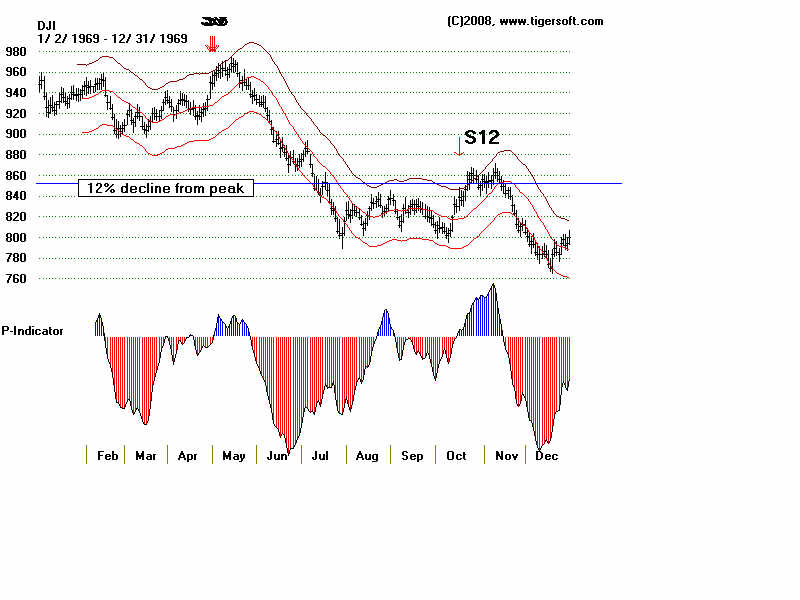
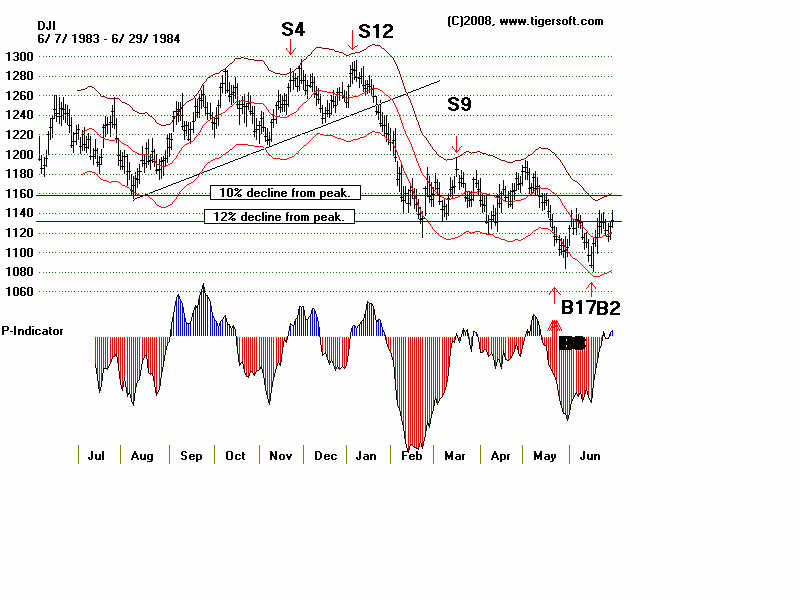
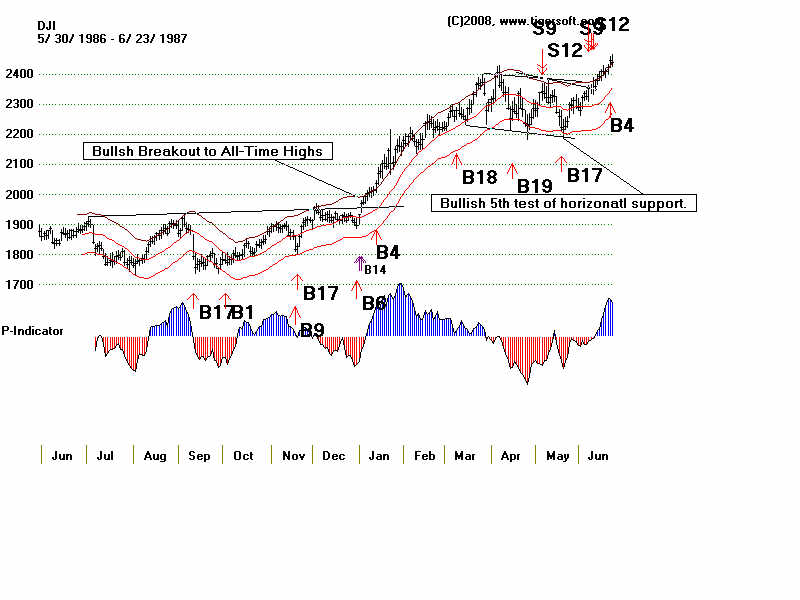
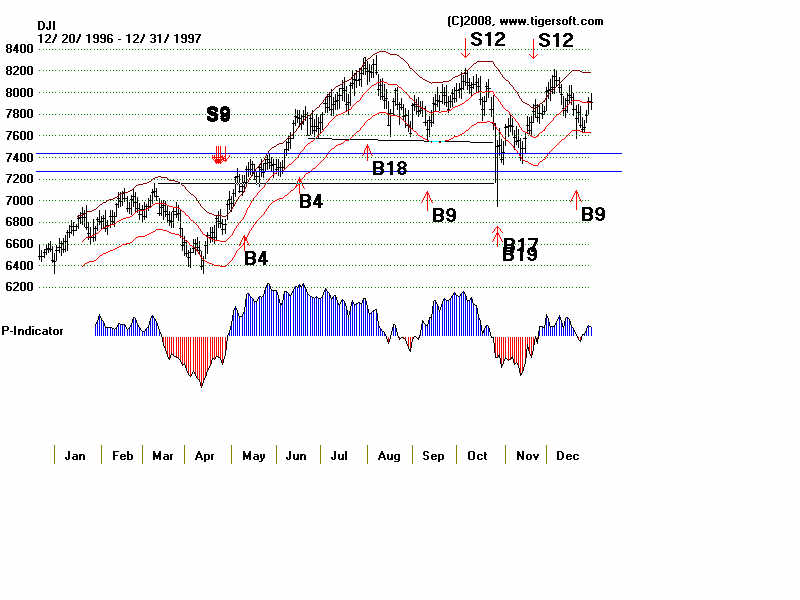
4) 10/3/1997 S12 was added real-time that night.
I showed the history of these back to the first one in 1966
for the first time in the next bu-weekly Peerless Forecasts.

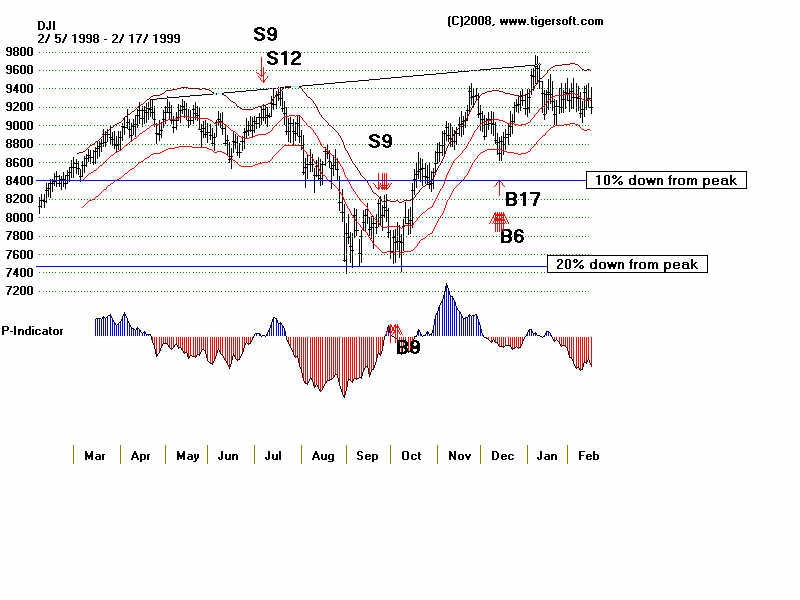
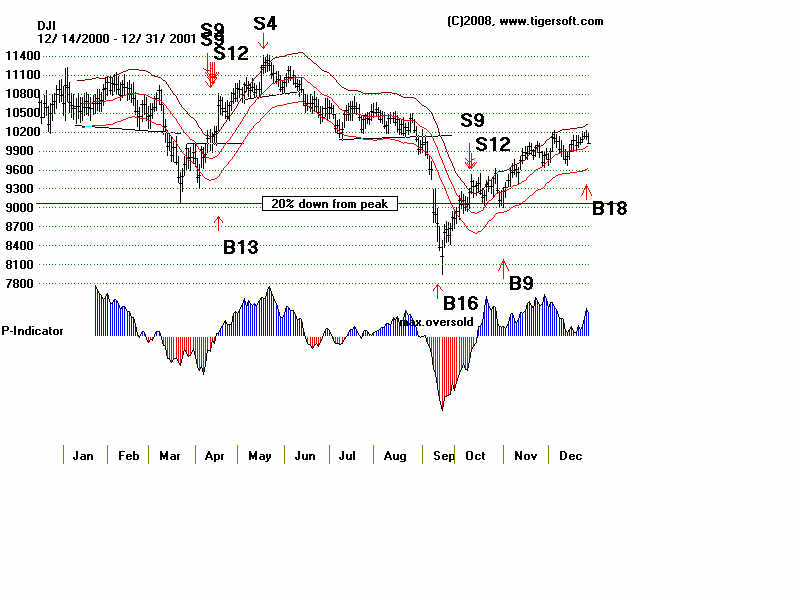
5)  Early 1999 A/D Line failures to confirm the DJI  brought
multiple Sell S9s that were minimized in importance at the time
because of how strong the NASDAQ was.  These were not revised
until 2009 Update when it was understood how bullish the 3rd
year in the Pres. Election cycle was.

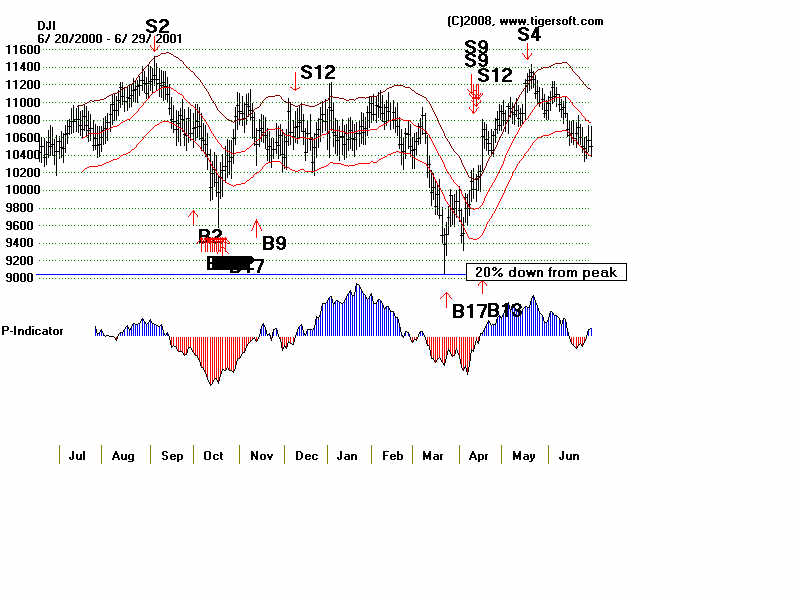
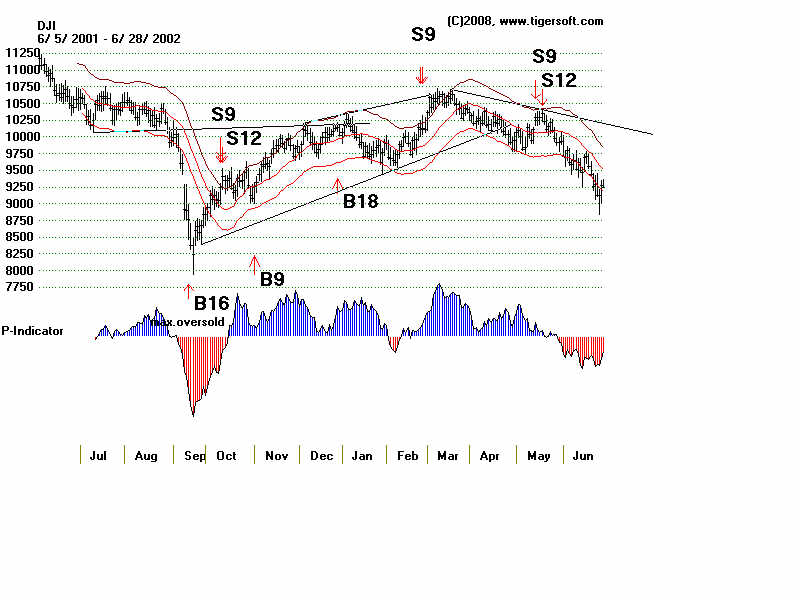
6) June B9s in 2001 were not considered trustworthy
because of how weak the NASDAQ was and because of bearish
head/shoulders earlier that year in May.  Research at the
time showed that such B9s were not to be trusted when
the Accum. Index was so red.  This led to a rule change
that dropped B9s when the Accum. Index was below
a key level in these cases.

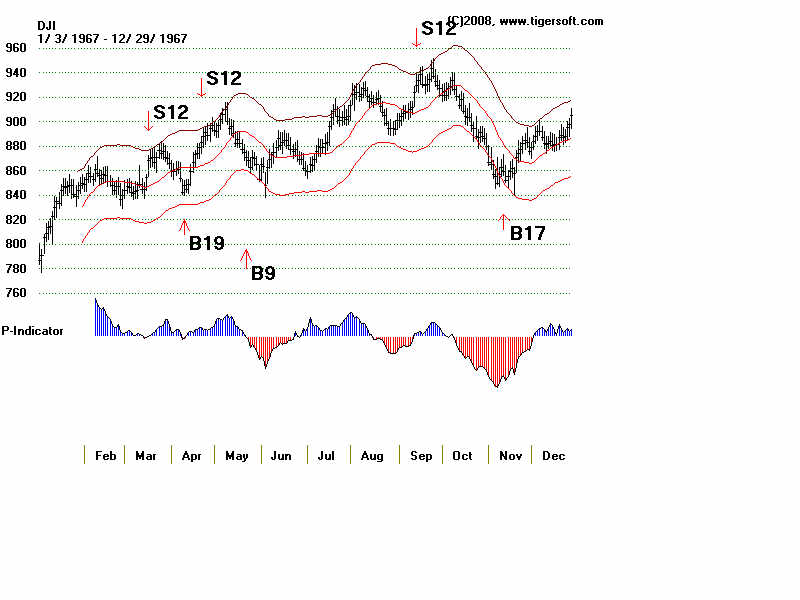
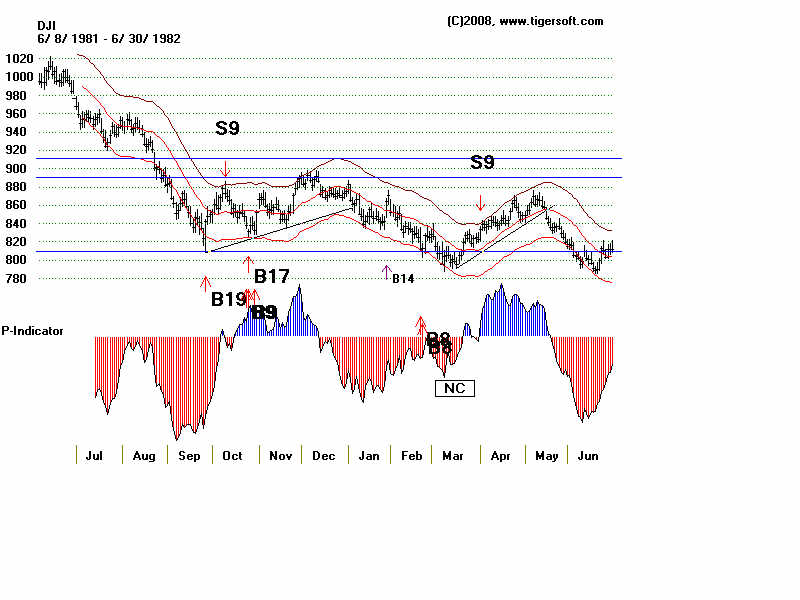
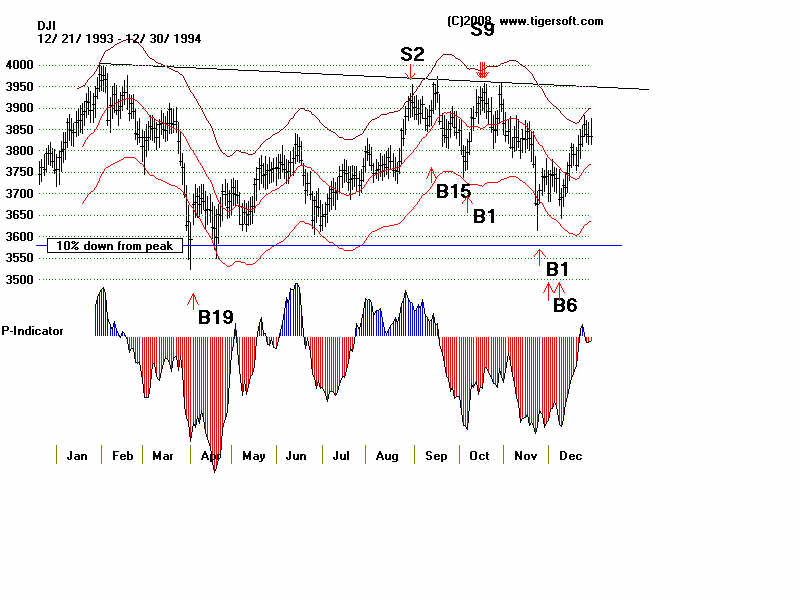
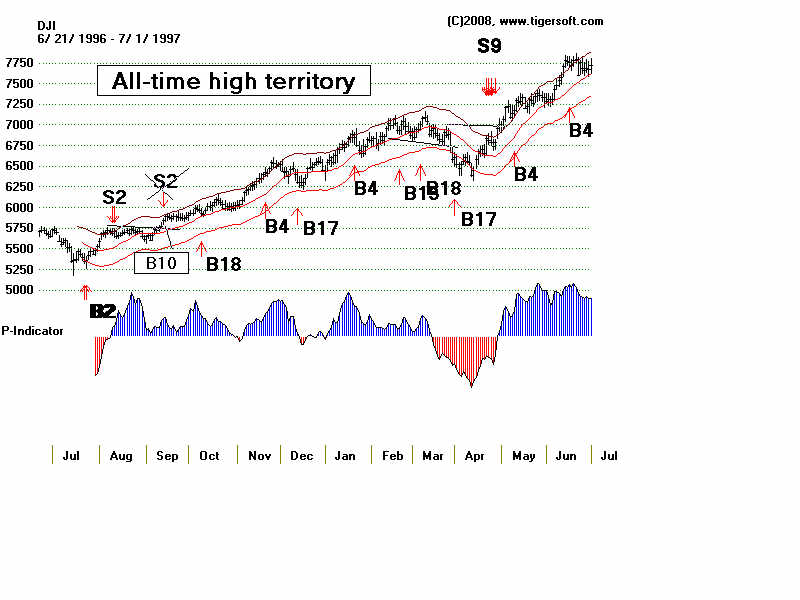
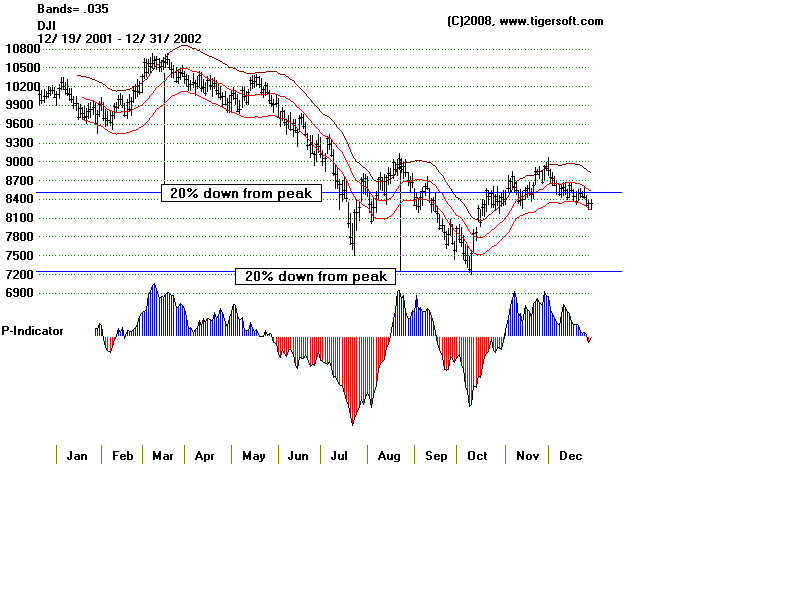
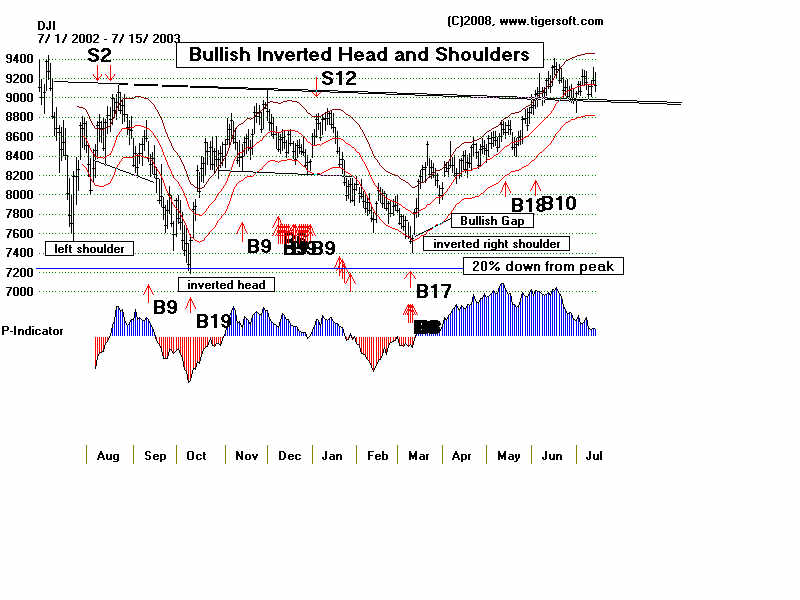
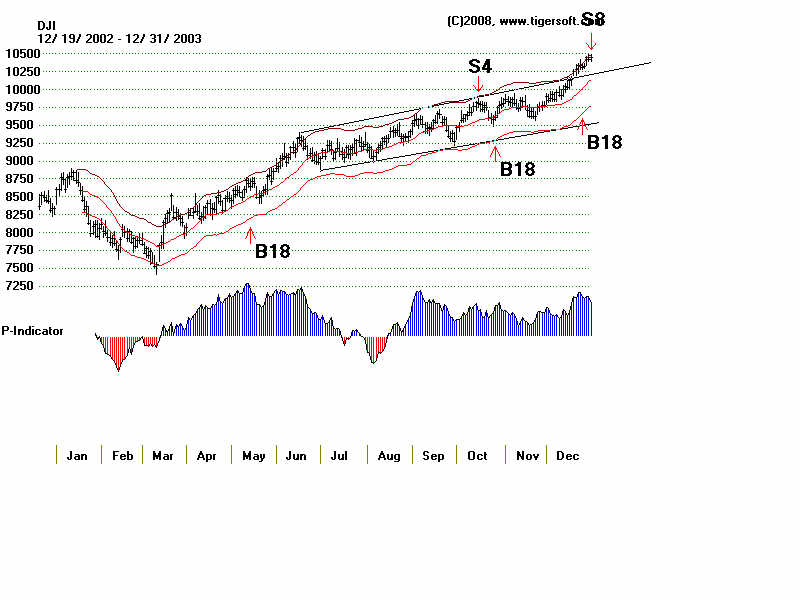
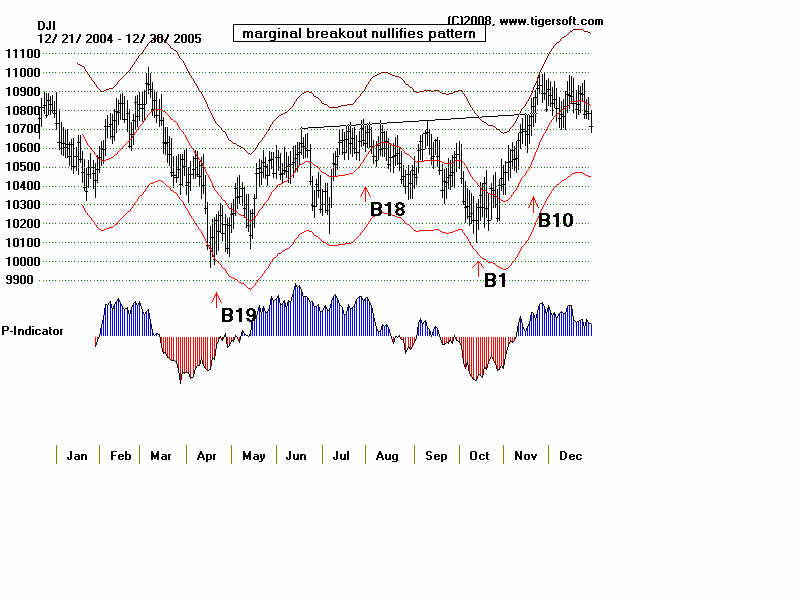
7) 7/24/02  Buy B19 was created on the night it occurred
based on research I did that night.  It proved correct.

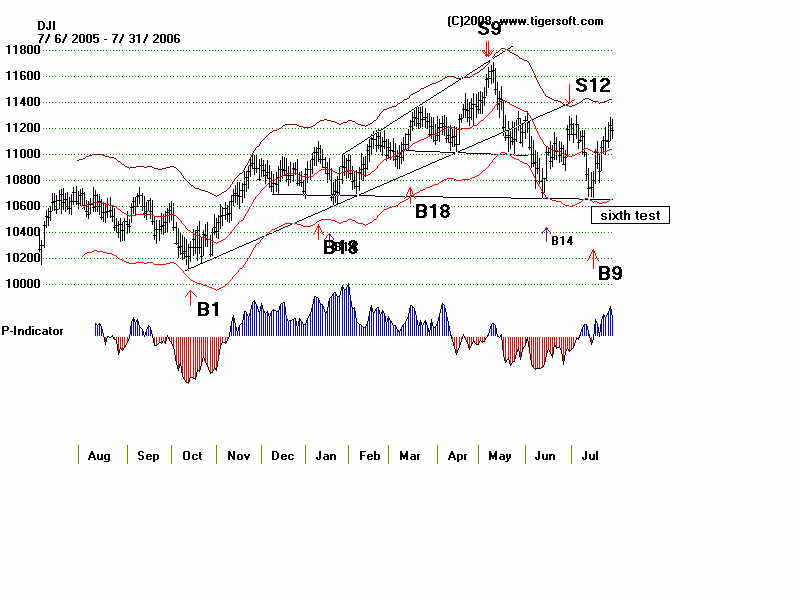
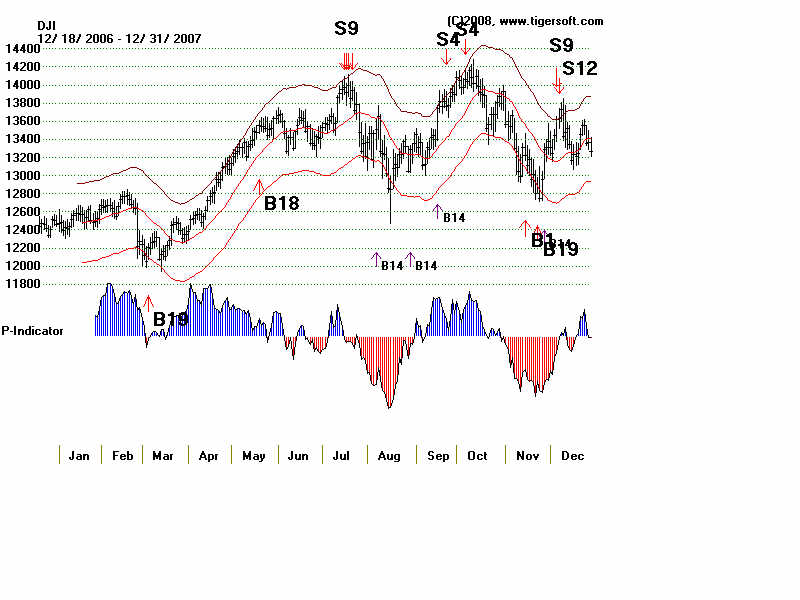
8) 7/18/2006 Buy B9 was reinstated for this case when
DJI had gotten up past the 65-dma with the AI having turned
positive.  The June 2001 B9 revisions had themselves to
be revised to allow for the Buy signal here. Now we would
have the Closing Power to use to see that this was a valid
reversal.

9) 1/6/2009 Sell S12 (9015.10) was added on 1/9/2009 (8599.18) 
despite very positive P-I based upon studying previous S12s in
severe bear markets back in 1930s for the first time.

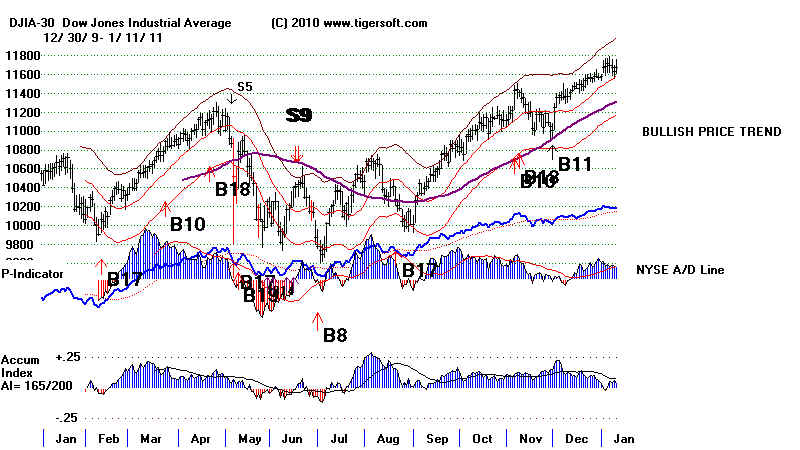
10) 7/21/2011 Sell S9v (12724.41) was added at close
on 7/22/2011 (12681) when I realized how powerful this signal
was between April and September.

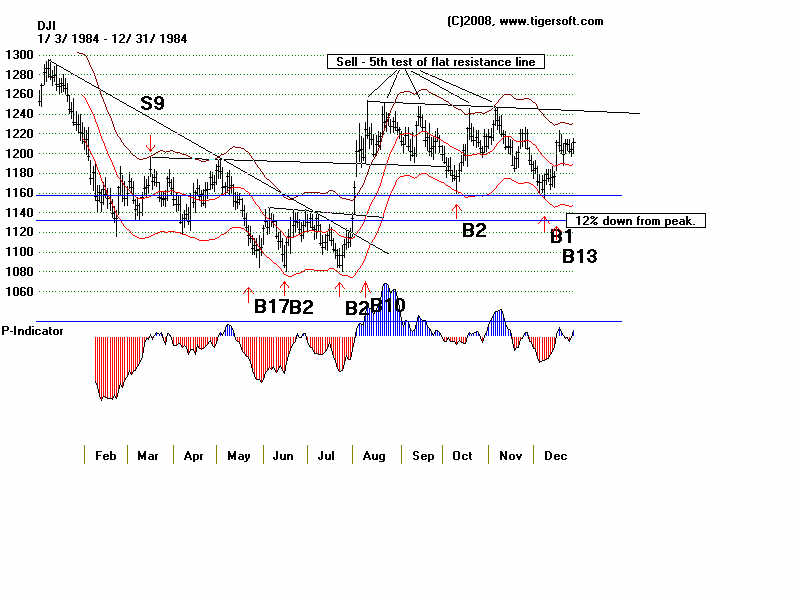
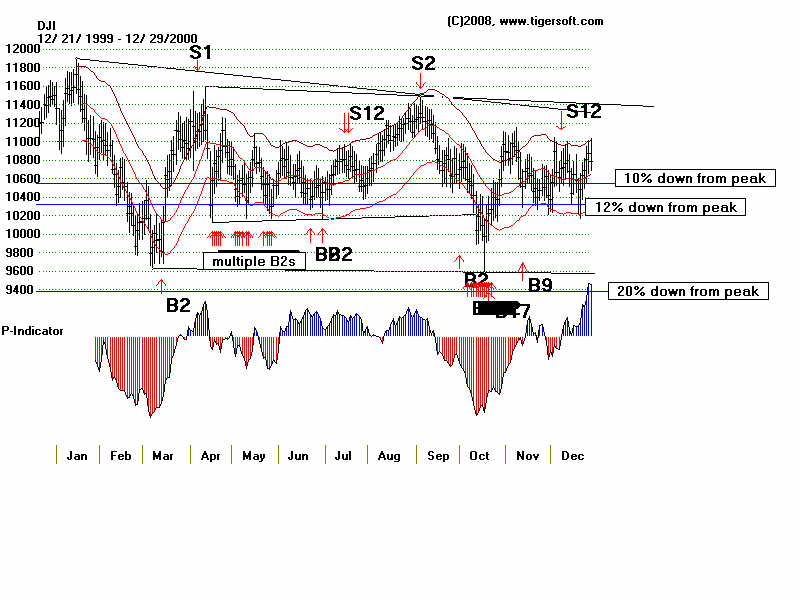
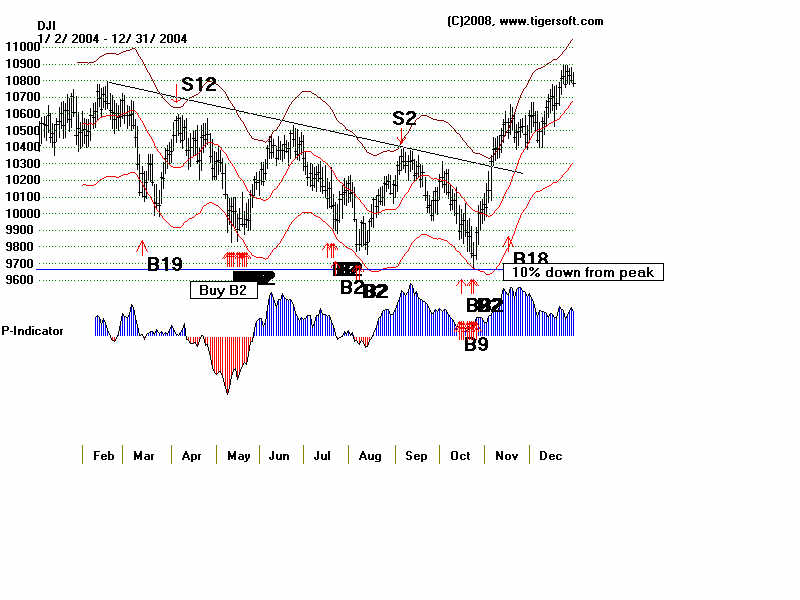
11) 5/14/2012 (12695.35) Buy B2 was dropped.  DJI did fall
to 12127.95 on 6/5/2012, but there was no Peerless Buy
signal there.  Because of format of data into yearly segments,
I have avoided testing the proposition that 200-day ma
is helpful, though clearly it is in some situations.


The Signals' Documentaon for the July 2012 version is shown below.

                                              Track Record:
         Each Type of Major Buy and Sell

                        January 2014 Peerless Results with notes from earlier versions.
                           
                       Buy B1  
                                      Sell S1 
                      
Buy B2                                     Sell S2   
                       Buy B3                                    Sell S3   

                       Buy B4                                   Sell S4   
                       Buy B5                                   Sell S5  
                       Buy B6                                   Sell S6
                       Buy B7                                    Sell S7
                       Buy B8                                   Sell S8  
                       Buy B9                                   Sell S9    Sell S9V   Sell S9B
                       Buy B10  False Breakouts    Head and Shoulders S10   Sell S10   Judged S10
                       False Breakdowns below well-tested support
                       Buy B11                                  Sell S11
                       Buy B12                                   Sell S12     Sell S9/S12 Combinations.

                       Buy B13--Santa Claus Buy
                       Buy B13 (2)                             Sell S13 and S13E
                             
This will have to be changed to make it distinctive from the B13 Santa Claus Buy.
                       Buy B14

                           Buy B15                                   Sell S15
                       Buy B16                                   Sell S16   
                       Buy B17                                   Advisory Sell S17   8/23/2013                   
                       Buy B18
                       Buy B19
                                            Sell S19
                            
Buy B20. 


Documentation for previous 2005 version.  
      2007 Version' Signals' Results: 1965-207
http://www.tigersoft.com/majorpeerless.htm

Peerless 2012 software is $395.  Order Now. 
Peerless Stock Market Timing: 1915-2011 book - $125.   Available in 2012.

------ OPERATING INSTRUCTIONS ------

Installation Instructions should have been sent you...

To place the signals on the current DJI use
PEERCOMM + Charts-2011 + Peerless Dalily DJI + DATA + Signals-1 + "DJI Major Buys and Sells (Normal Mode)". 

DJI.GIF (16139 bytes)

To redraw the graph showing the P-Indicator, A/D Line and Accumulation Index
with the SAVED Peerless signals on the current DJI use


PEERCOMM + Charts-2011 + Peerless Dalily DJI + + DATA
+ Operations + "DJ chart, PI, ADL and Accum Index" +OK + OK 
+ Signals(1) + "SuperImpose DJI Saved Signals"
+ Use Selected TigerSoft Signal + S5

wpe1AE.jpg (68488 bytes)

Experment:
PEERCOMM + Charts - 2011 + Peerless Dalily DJI + DATA87 +
Operations + Restore Simple Bar Chart
+ Moving Avg. + 65
+ Indic. 1 + NYSE A/D Line + Yes
+ Signals (1) + DJI Major Buys and Sells (Normal Mode)
+ Operations + What Happens to $10,000 (Buys/Sell Short)
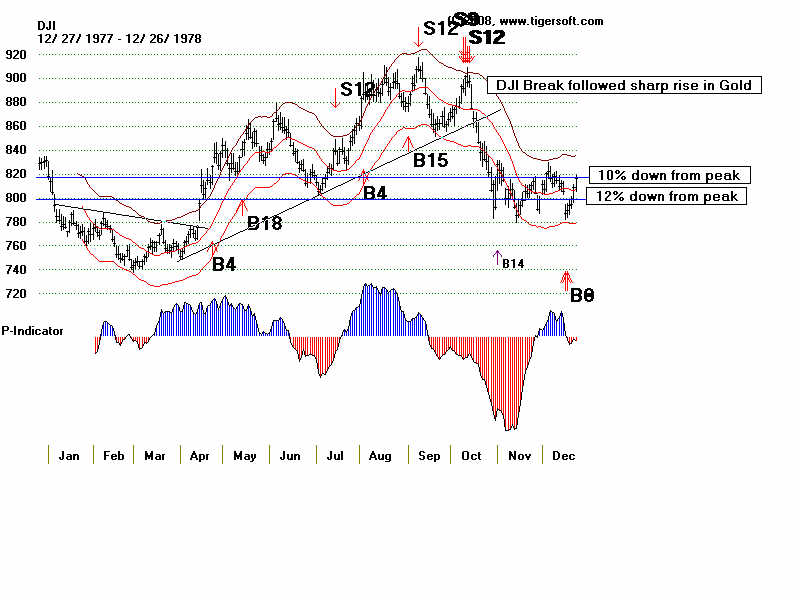
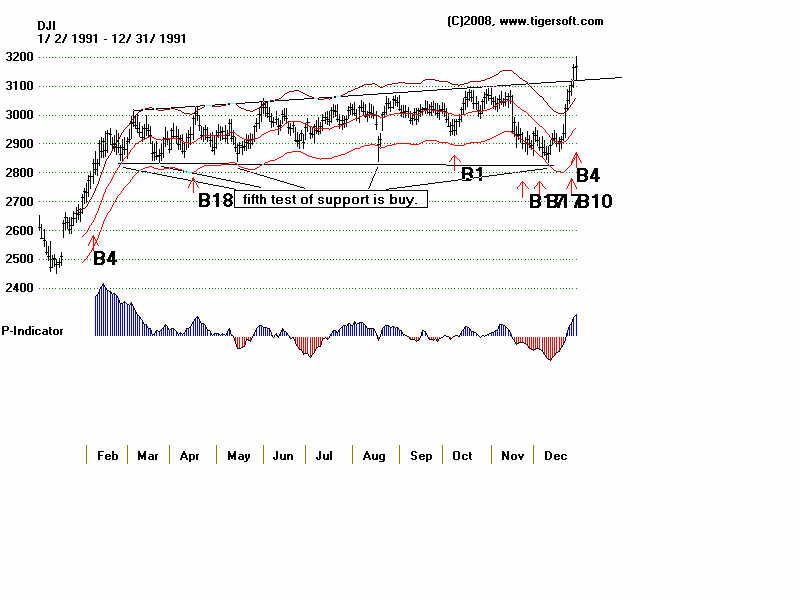
+ X + Lines + User Set Pct. Below Peak + OK 
+ Point Mouse at August peak + OK
Lines + Rubber Band Lines between Two Points
Now Point mouse at Sept low and drag the the line to the right through next bottom
+ Operations + Add or Edit Personal Reminder + "Key Support Failures" + OK
Drag the message where you like and draw other rubber band lines.


wpe1AB.jpg (55548 bytes)


Restore Simple Bar Chart + Moving Average


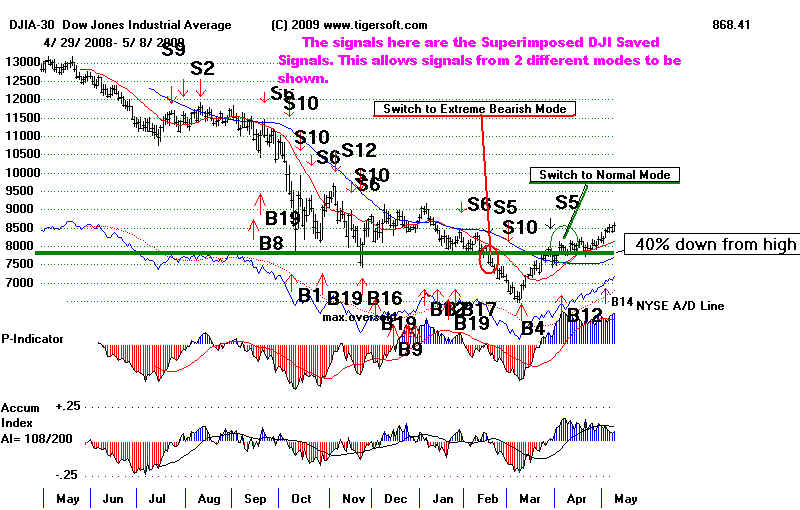
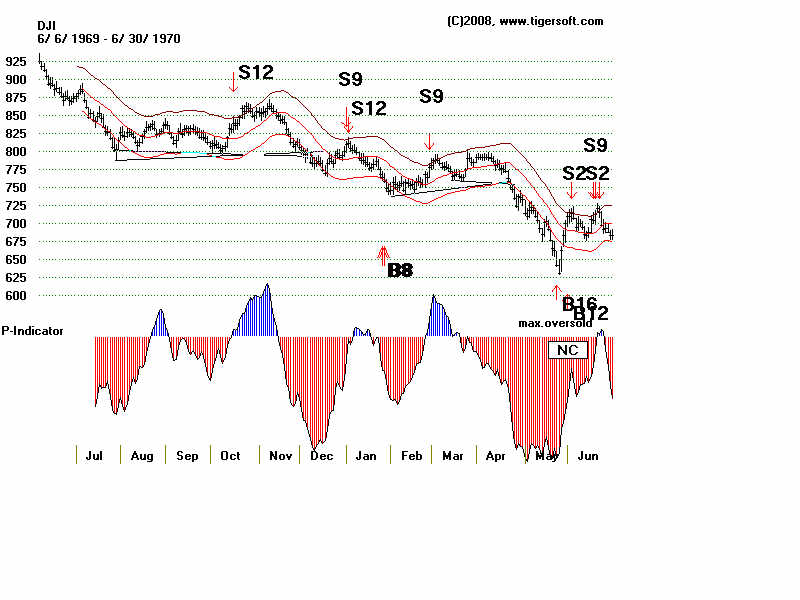
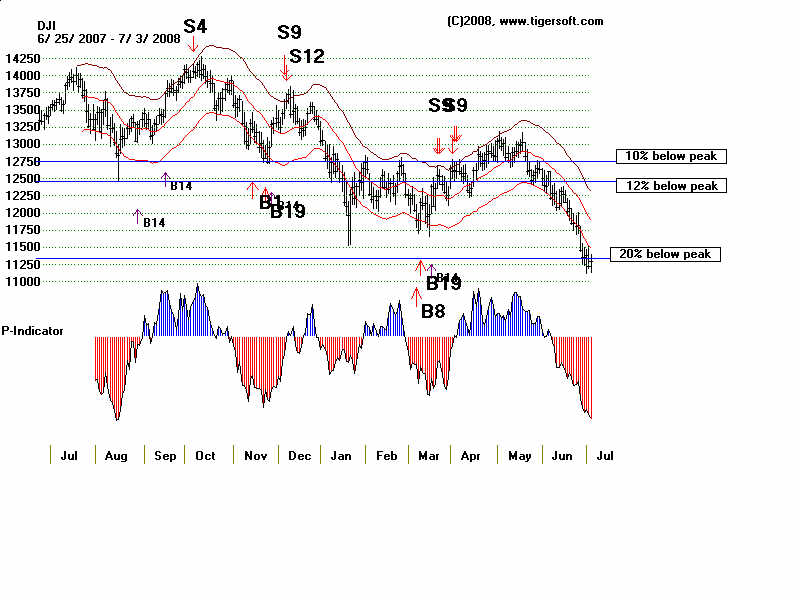
2008-  Peerless Chart of DJIA

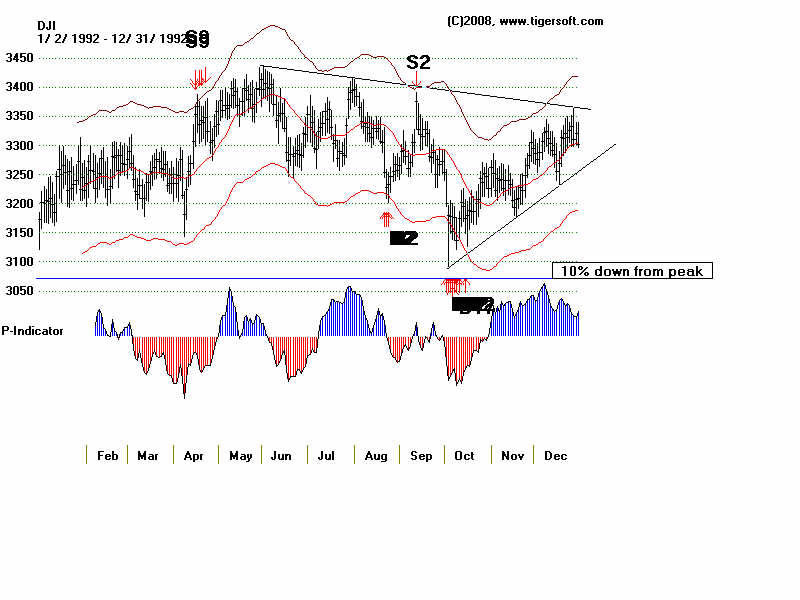
Use lines command to draw a line 40% down from a 10 month high.
With DJI chart on the screen, use
Lines + User Set Pct below Peak.

wpe157.jpg (66380 bytes)


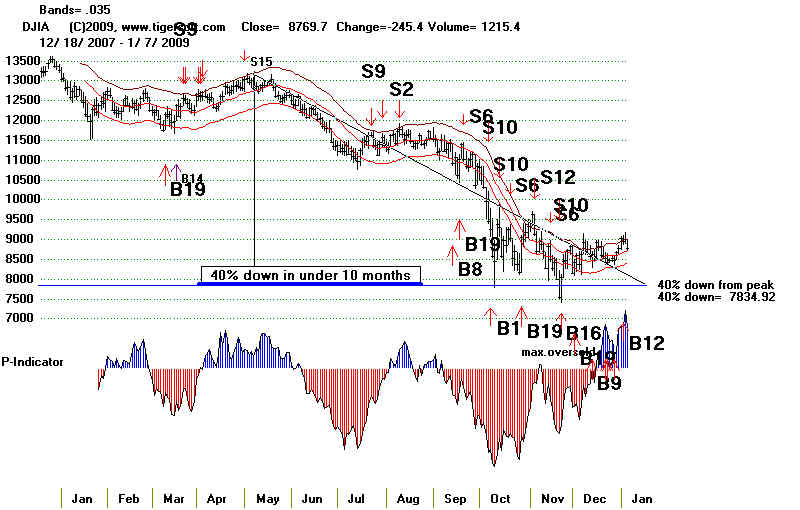
When the DJI has closed more than 40% down from a 10% month high,
switch to the bearish mode.  Use "Signals-1" + "DJI Signals - Extreme Bear Market Mode".
When it is above that level, display the normal signals use "Signals-1" +
"DJI Major Buys and Sells (Normal Mode)".
If you want to see the "Saved": signals for a period having both
normal and extreme bearish mode signals, use the "Superimpose DJI Saved Signals"
under Signals-1. 

Special Instructions and Signals
for When the DJI is in Extreme Bearish Mode:


www.tigersoftware.com/TigerBlogs/3-March-14-2009/index.html

www.tigersoftware.com/TigerBlogs/03-mar-01-firstof2009/index.html

www.tigersoftware.com/TigerBlogs/3-March--05-2009/index.html

Returning to Normal Market Mode

When the DJI recovers back above the 40%-Down Line used,
switch back to normal mode.  While an increase in volume was the key
to confirming a recovery and the start of a new bull market in the past,
superb breadth, as has been seen since March 9th shows a very
playable advance.  The NYSE A/D Line trend is very helpful because
once can watch it to see when neckline-resistance is too much for
a market that wants to, but is not quite ready, to start a bull market.
wpe15D.jpg (81202 bytes)

There are other signals under Signals-1.  The only one I suggest using all the time is
"
2.5% - Two Day Reversals Down." and Tiger Signals S5.

Two-Day Reversal Sell S6 signals mostly occur in very, very weak markets. 
Another sign of extreme weakness are optimized lower bands below -.12

S5s pont to head and shoulders patterns.

Others signals are on the DJI are often used in our nightly Hotline to make points about the narket's
technical confitions. 
Two-Day Reversal Sell S6 signals mostly occur in very, very weak markets. 
Another sign of extreme weakness are optimized lower bands below -.12


Note that this is not the finished product.
It will take some time to integrate TigerSoft and the Power-Ranker fully
into this package.  But Peerless Stock Market Timing is sold as
a stand-alone program.  An it is important that the signals
that are back-tested and studied the most are released.
A link will be provided each purchaser to revisions as they come out.


Instructions and Comments


The installation file is elsewhere.

Opening the installation file peerless.exe, places a new file - peerless.exe -
into the folder (directory) c:\peerless\winpeer
Contact us for its location.  Its price is $298 to existing subscribers.

After downloading it, to run peerless.exe you may Click Start + Run and
enter "
c:\peerless\winpeer\peerless.exe"

You may also use drag the file peerless.exe onto your desk top
and double-click it tp run it.


Please read:

(1) When you graph the DJI
and choose signals, there are now two modes -
"Major Peerless Signals".  "Extreme Bearish Market Mode"
There are many new signals.  All the old signals have been re-inspected
and back-tested to 1942.  Most have been revised.

(2) Documentation will be provided here for the signal's effectiveness,
as they occur or as soon as time permits.

(3) The Help routines in the software will exlplain the general basis
of the signals. Super-imposing is not yet available, but will be added soon.

(4) Under Lines, see that you can place horizontal lines 10%, 12% or whatever...
below a peak you designate.  You will also be able to draw a line
above a bottom.  10% rebonds are quite common.

5) The Vertical Line command command shows valuable information.
These are the key values for the Peerless signals.  The materials will
try to show these key values for each of the signals. 

Date - Close - Close/21-dma - 21-day ma ROC - P-Indicator - Current Accum. Index - V-Indicator - OBVPct

                       
                               Peerless Shows History Does Repeat.
        
Track Record of Peerless Buys/Sells:  1928-1948  1948-2012


            Peerless  Historical Charts of DJI

                              DJI Graphs: 1928-1965   A newer set of charts with current signals is being worked on.
                              Peerless Users should have the data themselves to produce all the charts since 1966
                              Normal Peerless Buy and Sell Signals are studied from links at the bottom of this page.

                              See also "Extremely Bearish Conditions"  Rules for When the DJI is down more than 40%
                                                         from its 10 Month high. 
                                                             Lessons of the 1930s:   Calling Bottoms in the DJI: 1929-1938
                                                             Penetrations of the 10-day ma: 1929-1938
                                                            Volume, Bear Market Rallies vs Major Bear Market Bottoms: 1929-1941

                              The Biggest Bear Markets: 1915-2008
                              Graphs and Signals for Presidential Election Years: 1944-2004
                              Year after Presidential Election: 1945 - 2005: Januaries to Junes

                              Year after Presidential Election: 1945 - 2009: Junes to Decembers
                              Two Years after Presidential Election: 1942 - 2006
                              Three Years after Presidential Election: 1943 - 2007
                               WHAT TO DO WHEN THE DJI TURNS DOWN AFTER A LONG ADVANCE
                               AND THE NYSE A/D LINE HAS BEEN MUCH STRONGER THAN THE DJI


                              Seasonality 1

               NEW       Year-End Pivots up and down
                              Initial Rallies off A Bear Market Bottom
                              Januaries
                              Februaries
                              Marches
                              Aprils
                              Mays
                              Junes
                              Julys
                              Augusts
                              Septembers
                              Octobers
                              Novembers
                              Decembers - Seldom Bearish.     
                              Santa Claus Rallies in A Bear Market.
                              V-Bottoms: 1942, 1949 and 1971
                              DJI Bottoms and NYSE A/D Line Trend-Breaks: 1959-2009

                                                                     1965-2008

                   Bull Markets          Tops              Trading Ranges            Bear Markets          Bottoms
                  1965-1966           1967-1968                                                1966                         1966-1967
                  1967
                                                                             1968                            1968-1969                                                
                                                                                                                 1969
                  1970                                                                                       1969-1970                 1970-1971 
                  1970-1971             1971
                  1971-1972                                         1972   
                                               1972-1973                                                1973
                                                                            1973-1974                   1974                          1974-1975
                  1975                                                   1975
                  1975-1976                                          1976
                                               1976-1977                                               1977                            1977-1978
                  1978                       1978                                                                                           1978-1979
                                                 1979                                                       1979-1980                  1979-1980
                  1980                        1980                                                        1980                           1980
                                                 1980-1981                                               1981
                                                                          1981-1982                                                        1982
                  1982-1983  
                  1983                       1983-1984                                              1983-1984                  1984  
                  1984                                                   1984
                  1984-1985                                          1984-1985
                  1985
                  1985-1986                                           1986
                  1986-1987               1987                                                       1987                         1987-1988
                                                                              1988
                   1988-1989  
                   1989                                                    1989
                                                1989-1990             
                                                 1990                                                       1990                          1990-1991
                                                                               1991                                                           1991-1992
                                                                               1992
                   1992-1993
                   1993                      1993-1994            1994                                                         1994-1995
                   1995
                   1995-1996
                   1996
                   1996-1997              1997                    1997                                                         1997-1998
                                                                                                                                                  1998
                   1998-1999              1999                     1999
                                                   1999-2000           1999-2000
                                                                                2000
                                                   2000-2001           2000-2001             2000-2001
                                                   2001                                                   2001                          2001-2002
                   2001-2002               2002                                                   2002                         2002-2003
                   2003                         2003-2004           2004                                        
                   2004-2005                                                                                                            2004-2005
                                                                               2005
                   2005-2006               2005-2006
                   2006                       2006
                   2006-2007               2007
                                                  2007-2008          2007-2008                2008 (see above chart)
                                                                                                              2008-2009 (see above chart).


                                                                 Reversing Buys and Sells.
                                                            Peerless Track Record: 1942-2009 
                                                                 All Major Buys and Sells 
.                                                          Peerless Track Record: 1942-2009