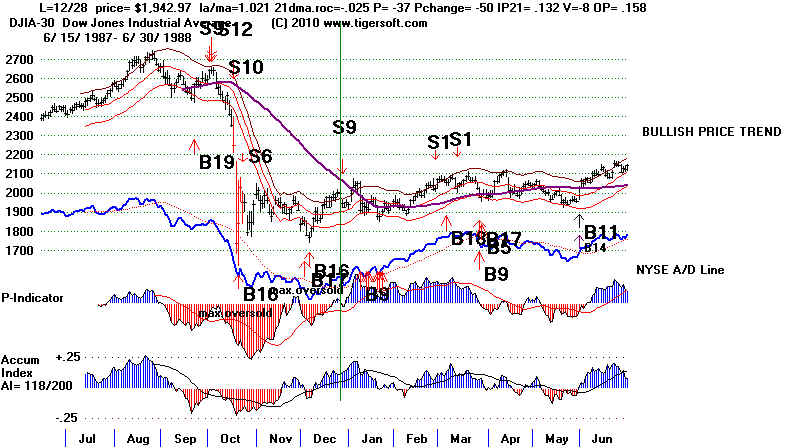
-----------------------------------------------------------------------------------------------------------------------------------------------------
There have been 136 Sell S9s since 1928. The average gain is 9.8%.
However, 11 (8.1%) of the Sell S9s brought a loss. The biggest was almost 5%.
Use a stop loss of 5% if you go short on a Sell S9. November and December
Sell S9s are often not worth going short. Their average gains would only have been 2.5% and
6.2%. February and March Sell S9s are consistenly quite profitable, but they do
not occur in the 3rd year of the 4-year Presidential cycle.
Size of Gains if S9 Used to Sell Short DJI
and position covered on next Peerless Buy
     >10%      38  28.7%
     5%-9.99%  57  41.9%
     2%-4.99%  23  16.9%
     0%-1.99%   7   5.1%
     losses    11   8.1%
SELL S9s:
1928-2013 19290131 S9 317.5 .054
19290201 S9 319.7 .06
19290228 S9 317.4 .045
19290301 S9 321.2 .056
19290314 S9 316.3 .041
19290418 S9 311.9 .059
19290426 S9 314.2 .066
19290507 S9 321.9 .089
19290614 S9 313.7 -.047
19290903 S9 381.2 .45
19291204 S9 254.6 .086
19291211 S9 258.4 .099
19300417 S9 294.1 .416
19300529 S9 275.1 .375
19300714 S9 234.2 .266
19300826 S9 235.5 .27
19310623 S9 143.9 .31
19310630 S9 150.2 .339
19310702 S9 151.6 .345
19320113 S9 84.4 .069
19320216 S9 85.8 .449
19320301 S9 81.9 .422
19320607 S9 47.5 .099
19320615 S9 50.6 .154
19330918 S9 105.3 .077
19340411 S9 105.2 .127
19340620 S9 98.3 .118
19340821 S9 92.6 .064
19340927 S9 93.4 -.02
19341008 S9 92.5 -.03
19360402 S9 160.4 .067
19370211 S9 190.3 .13
19370303 S9 192.9 .142
19370310 S9 194.4 .149
19370813 S9 189.3 .376
19380107 S9 128.2 .039
19380119 S9 130.1 .053
19380413 S9 114.9 .042
19380421 S9 115.4 .046
19380510 S9 117.9 .062
19390913 S9 154.1 .049
19420106 S9 113.9 .14
19420511 S9 99.2 -.018
19420521 S9 99.7 -.013
19460110 S9 199.2 .018
19510430 S9 259.1 .064
19561206 S9 492.7 .046
19600519 S9 624.6 .013
19601014 S9 596.5 .051
19610803 S9 715.7 .034
19620705 S9 583.9 .009
19620716 S9 588.1 .016
19660106 S9 985.46 .213
19660914 S9 806.23 .06
19661025 S9 793.09 .004
19690430 S9 950.18 .175
19690501 S9 949.22 .174
19700105 S9 811.31 .058
19700227 S9 777.59 .175
19700601 S9 710.36 .058
19700617 S9 704.68 .05
19700715 S9 711.66 .006
19710826 S9 906.1 .088
19720412 S9 966.96 .033
19720522 S9 965.31 .05
19720803 S9 947.7 .027
19720810 S9 952.89 .033
19730108 S9 1047.86 .114
19730411 S9 967.41 .096
19730711 S9 908.19 .037
19730905 S9 899.08 -.046
19731026 S9 987.06 .201
19740222 S9 855.99 .273
19740304 S9 853.18 .271
19740607 S9 853.72 .271
19750829 S9 835.34 .048
19750904 S9 838.31 .052
19770315 S9 965.01 .164
19781010 S9 891.63 .112
19790921 S9 893.94 .096
19800213 S9 903.84 .14
19801114 S9 986.35 .053
19810107 S9 980.89 .043
19811009 S9 873 .04
19820401 S9 833.24 .067
19820712 S9 824.87 .058
19821207 S9 1056.94 .061
19830726 S9 1243.69 .061
19840316 S9 1184.36 .083
19860812 S9 1835.49 .03
19870406 S9 2405.54 .063
19870506 S9 2342.19 .052
19870609 S9 2352.7 -.039
19871001 S9 2639.2 .341
19871228 S9 1942.97 .016
19891004 S9 2771.09 .057
19891011 S9 2773.36 .058
19900712 S9 2969.8 .174
19900719 S9 2993.81 .181
19920415 S9 3353.76 .03
19941019 S9 3936.04 .066
19960812 S9 5704.98 -.023
19970212 S9 6961.63 .05
19970219 S9 7020.13 .058
19970422 S9 6833.59 -.049
19980708 S9 9174.97 .168
19980923 S9 8154.41 .064
19990709 S9 11193.69 .105
19990817 S9 11117.07 .09
19991210 S9 11224.7 -.003
19991228 S9 11476.71 .128
20000814 S9 11176.14 .084
20020226 S9 10115.26 .19
20020517 S9 10353.08 .209
20020808 S9 8712.02 .062
20020816 S9 8778.06 .069
20060505 S9 11577.74 .049
20070717 S9 13971.55 .067
20071207 S9 13625.58 .099
20080324 S9 12548.64 .093
20080402 S9 12608.92 .097
20080723 S9 11632.38 .061
20080730 S9 11583.69 .058
20080808 S9 11734.32 .07
20090518 S9 8504.08 .021
20090604 S9 8750.24 .049
20090611 S9 8770.92 .051
20091113 S9 10270.47 -.004
20100616 S9 10409.46 .061
20100726 S9 10542.43 .026
20100809 S9 10698.75 .04
20110503 S9 12807.51 .051
20110705 S9 12569.87 .086
20110721 S9 12724.41 .098
20110831 S9 11613.53 .083
20111205 S9 12097.83 .027
------------------------------------------------
No. = 136 .098
PE        24    .094
PE +1     37    .088
PE +2     49    .104
PE +3     26    .104
------- All Years ----- Jan 10 .080 Feb 10 .157 Mar 9 .158 Apr 16 .087 May 13 .086 Jun 13 .113 Jul 18 .101 Aug 17 .085 Sep 9 .087 Oct 10 .09 Nov 2 .025 Dec 9 .062 ----- PE ----- -----PE +1 ---- -----PE +2 ---- -----PE +3 ---- Jan 1 .069 3 .070 6 .087 0 ---- Feb 2 .295 5 .069 3 .217 0 ---- Mar 3 .199 5 .110 1 .271 0 ---- Apr 4 .057 5 .069 5 .140 2 .064 May 2 .031 6 .111 6 .111 2 .052 Jun 2 .127 3 .018 low 5 .112 3 .203 Jul 2 .060 1 .037 9 .100 6 .127 Aug 5 .038 2 .205 6 .127 4 .077 Sep 0 ---- 3 .160 3 .035 3 .066 Oct 1 .051 4 .038 4 .038 1 .341 Nov 1 .053 1 -.004 0 ---- 0 ---- Dec 1 .046 2 .093 1 .061 5 .053 1-10 47 .103 11-20 55 .088 21-31 34 .108
|
-----------------------------------------------------------------------------------------------------------
Last edited 2/17/2013
Sell S9s - - Rhymes with Strychnine and just as Deadly.
Sell S9s require a nearly negative P-Indicator reading when the
DJI closes
more than 2% over the 21-day
ma or the DJI's high is more an 2.6% over
the 21-day ma. Sell S9s
are not allowed in the beginning of the third year of a
Presidential cycle.
They are disallowed if the DJI rallies back too quickly from
a low. Depending on how
far the DJI is from the 21-day ma, the IP21 level must
also be low.
There two other types
Peerless Sells that are labeled as S9s for convience's
sake. One is the Sell
S9V. The DJI's must be over the 2.5% band with the V-Indicator
negative. See
details here.... The other occurs when the P-Indicator Sell S9V turns
negative after being positive
for more than 100 straight days. In these cases, the
DJI must have closed above
the 21-day ma. See details here...
Work in progress.
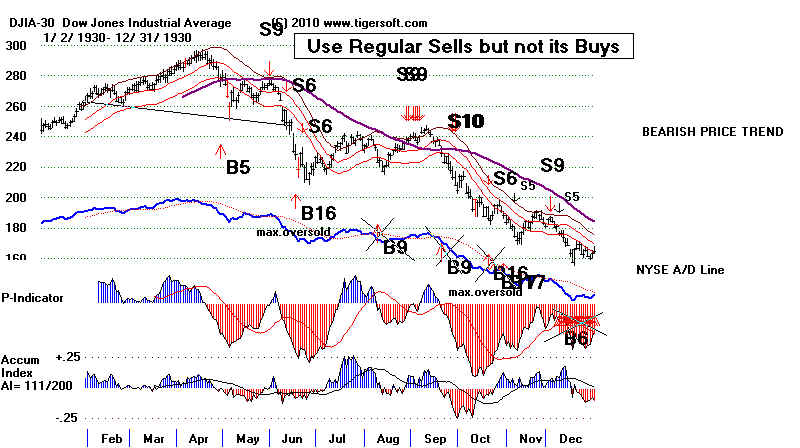
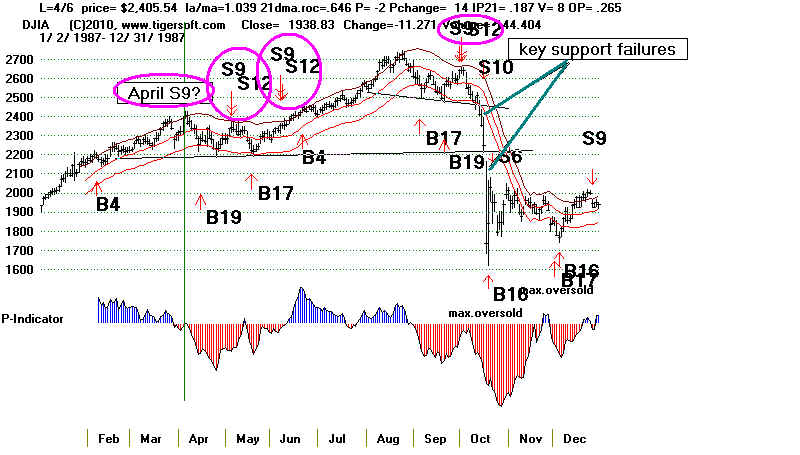
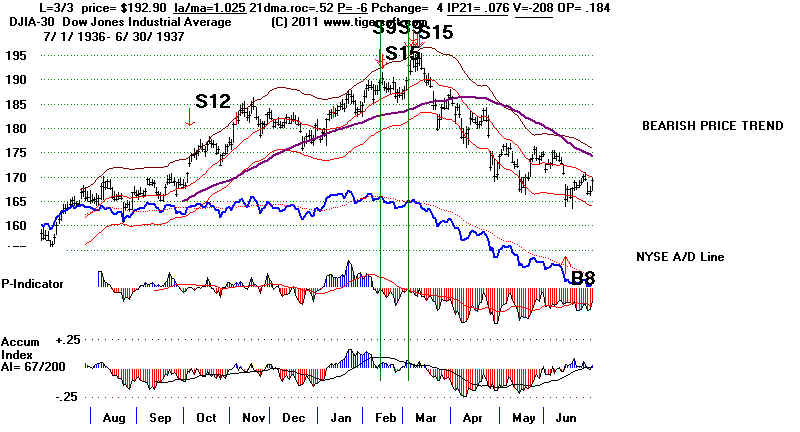
The major tops of 1929-1930, 1937, 1957, 1973, 1978, 1979,
1980, 1981, 1987, 1990, 1998, 2000,
2007-2008 all
began with Sell S9s. Multiple Sell
S9s and A Support
Failure Are Deadly.
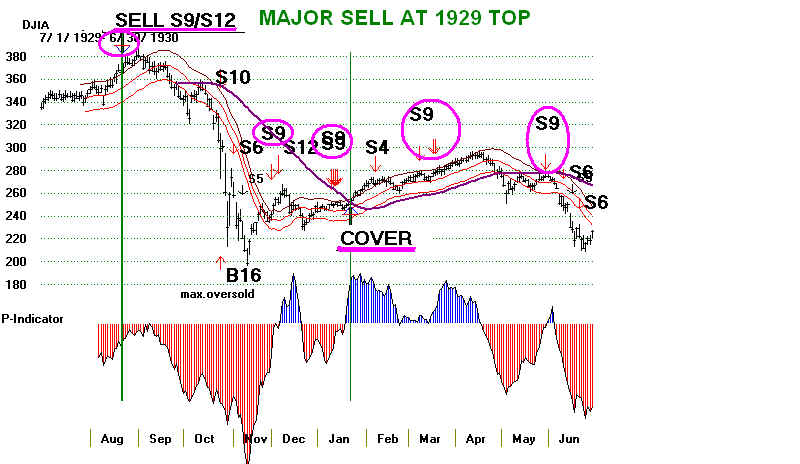
1929-1930
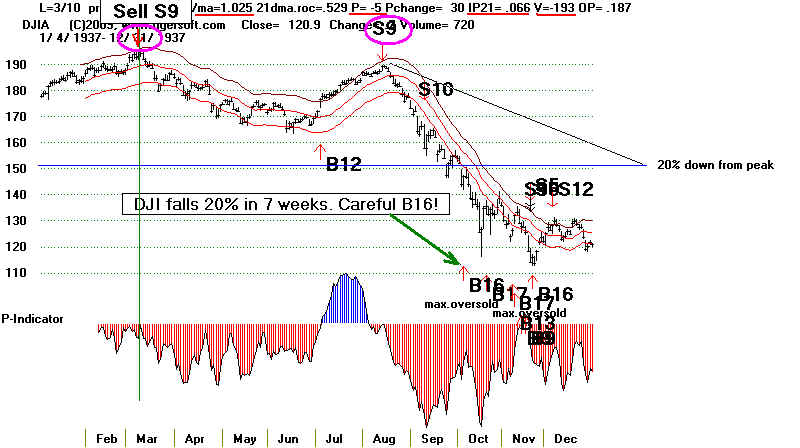
1937
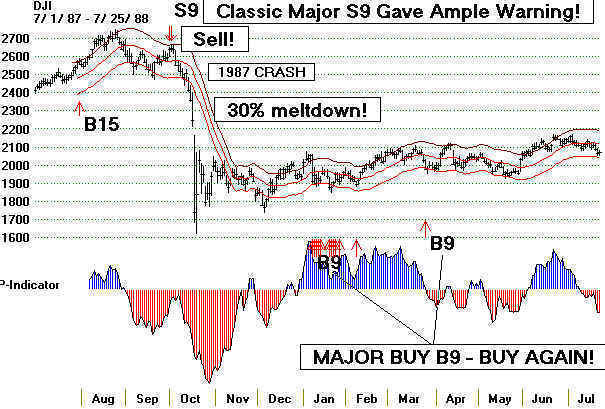
1987
Sell S9s occur when the DJI closes near the
upper band with
the P-Indicator negative.
Sell S9s occur on
strength. Especially when the
DJI is running
into, or nears, all-time high territory,
it is safer to
wait for the S9 to be "clinched". A
Sell S9 is
"clinched" when the number of daily
NYSE declines
exceed the number of NYSE advances
at the end of
trading, wither the same day as the
S9 or on a
subsequent day. If a new Peerless B9
occurs the S9 is
cancelled or reversed.
See the history
of Clinched S9s since 1965.
They reliably
predict a decline to at least the
lower band.
The median decline on the 115 S9s since
1928 is 5.5% at
the time of the next Buy signal.
The average
decline is 9.1%. In 32.3% of the cases
of Sell S9s the
DJI fell more than 8% at the point
of the next
reversal.
Because S9s
can occur on successive days,
here we consider
the first Sell S9 in a week to be
the key S9 in a
cluster. So, calculations are based
on gains per
cluster.
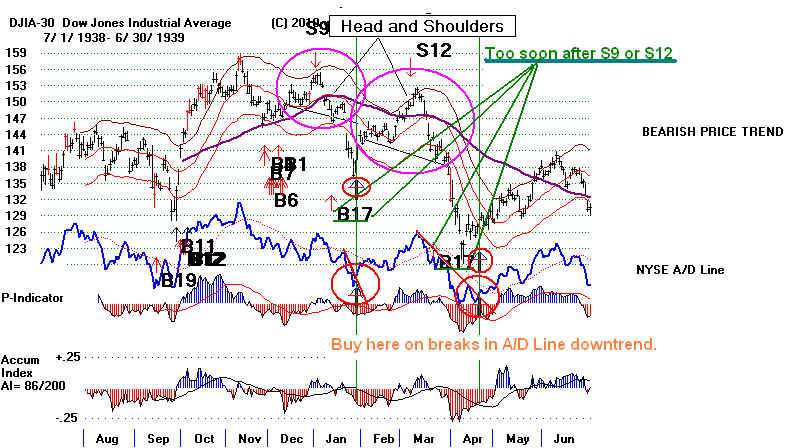
it is best to let
a Sell S9 play itself out if the market
turns down
sharply and not buy for at least 15 trading
days even if
there is a Buy signal. In these cases,
wait for the A/D
Line downtrend to be broken. This
is even more true
if a head and shoulders pattern
develops...
Use The 65-Day MA
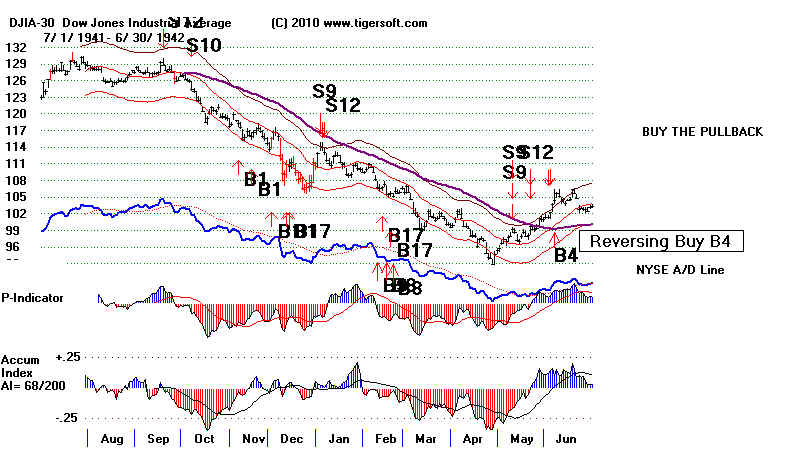
We have to be careful of Sell S9s
that occur on recoveries after a sell-offs of less
than 44% from the bull market
highs. The market often recovers past them. This is not
true when the DJI drops more than
44% in a year. In these cases we would use the
Extreme Bearish Mode. The DJI
surpassing the 65-day ma with positive readings
from the P-Indicator and/or the
Accumulation Index should be treated as signals to cover
any short sales. Until there
are new automatic Peerless signals, then trade the trend
of the NYSE A/D Line. See the bad
S9/S12 signals in May 1942, January 1958.
August 1962, October 1966 and July
1970.
The Biggest Sell S9 Declines
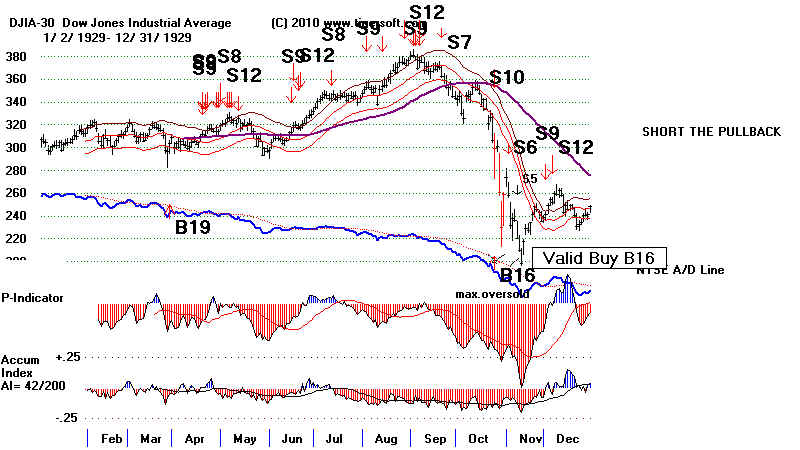
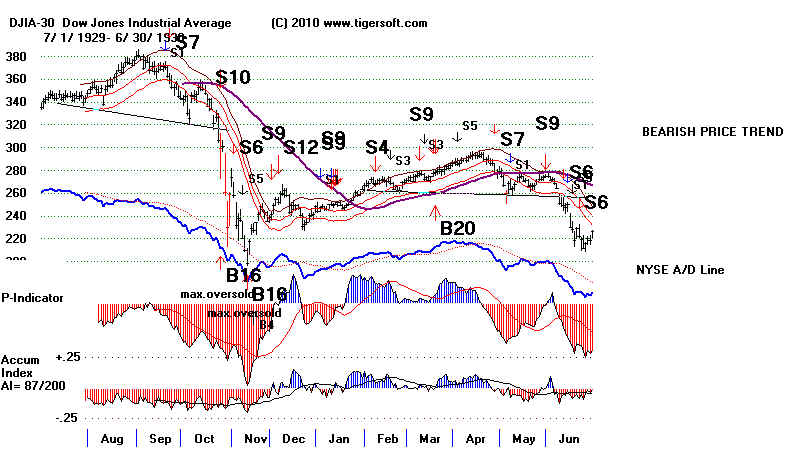
The more sets of Sell S9s occurring without a
break in the market, the more dangerous the
market becomes. Sell S9s that occur in September
and early October are more likely to bring a severe
break in the market.
1929 Top - Marked by Multiple S9s
1930 Top - Marked by Multiple S9s
1987 Top - Marked by Multiple S9s
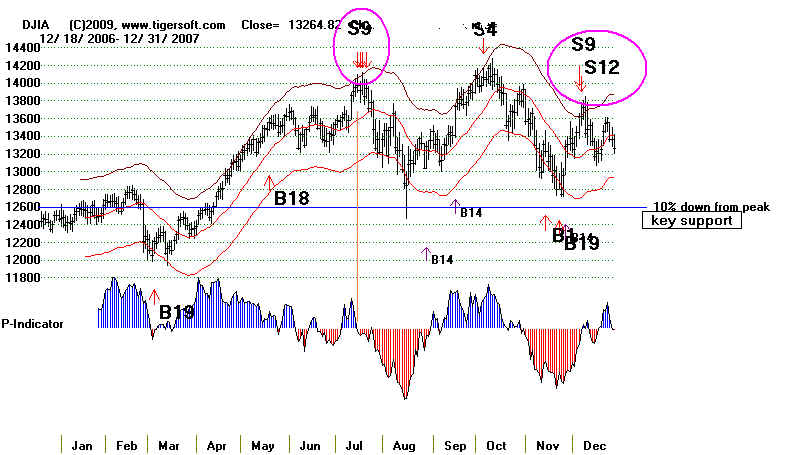
|
Reversing Sell S9s: 1929-2011 * = Extreme Bearish Mode signal. ** = P-I turns negative for first time after 100 days being positive. Peerless Date DJI Pct. Peerless Date DJI Pct. Signal Gain Signal Gain -------------------------------------------------=======------------------- (1-5) Sell S9 2/1/1929 312.6 3.6% Buy B17 2/8/1929 301.5 5.3% Sell S9 2/28/1929 317.4 4.5% Buy B17 3/27/1929 303.2 2.9% Sell S9 4/18/1929 311.9 27.0% *Buy B16 11/13/1929 198.7 35.1% Sell S9 4/11/1934 105.2 4.5% Buy B9 4/30/1934 100.5 -1.5% Sell S9/S5 6/19/1934 99.0 12.4% Buy B8 9/17/1934 86.7 7.7% (6-10) Sell S9/S12 9/27/1934 93.4 -6.6% Buy B6 12/20/1934 99.6 4.9% Sell S9 8/13/1937 189.3 37.6% *Buy B8 11/19/1937 118.1 8.6% Sell S9 9/13/1939 154.1 2.8% Buy B1 11/14/1939 149.8 -3.3% Sell S9 1/6/1942 113.9 6.2% Buy B9 2/10/1942 106.8 -7.1% Sell S9 5/11/1942 99.2 -5.2% Buy B4 6/5/1942 104.4 35.8% (11-15) Sell S9 6/7/1943 141.8 3.9% Buy B17 8/10/1943 136.2 8.6% Sell S9 5/15/1945 164.0 -3.6% Buy B10 8/24/1945 169.9 17.2% Sell S9 1/10/1946 199.2 3.4% Buy B17 2/20/1946 192.4 10.4% Sell S9 4/14/50 215.38 -1.6% Buy B4 8/9/50 216.9 6.2% Sell S9 7/8/57 518.4 10.3% Buy B1 10/2/57 465.0 -3.7% (16-20) Sell S9 1/7/58 447.8 -2.4% Buy B10 2/4/58 458.7 41.7% Sell S9/S12 7/1/59 650.2 -2.4% Buy B17 9/9/59 637.6 5.3% Sell S9 10/14/60 596.5 4.1% Buy B2 10/24/60 571.9 3.2% Sell S9 8/3/61 715.7 4.1% Buy B16 6/22/62 539.2 8.3% Sell S9 7/5/62 583.9 0.3% Buy B1 10/4/62 582.4 20.4% (21-25) Sell S9 10/25/66 703.09 0.4% Buy B6 12/1/66 788.95 12.4% Sell S9 4/30/69 950.18 24.4% Buy B8 1/27/70 763.99 1.8% Sell S9 2/27/70 777.59 17.5% Buy B16 5/25/70 641.36 9.9% Sell S9 6/17/70 704.68 5.0% Buy B7 7/7/70 669.36 6.3% Sell S9 7/15/70 711.66 0.6% Buy B7 8/13/70 707.35 32.5% (26-30) Sell S9 4/6/72 959.44 2.5% Buy B2 5/2/72 935.2 3.2% Sell S9 8/3/72 947.7 2.7% Buy B2 10/16/72 921.66 12.4% Sell S9 9/4/73 895.13 -5.0% Buy B4 9/25/73 940.55 4.9% Sell S9 10/26/73 987.06 20.1% Buy B16 12/5/73 788.31 8.5% Sell S9,S15 3/24/76 1009.21 4.2% Buy B2 10/5/76 966.76 1.8% (31-35) Sell S9 3/15/77 965.01 16.4% Buy B9 12/6/77 806.91 -1.7% Sell S9 9/21/79 893.94 10.9% Buy B17 11/7/79 796.67 8.6% Sell S9 11/14/80 986.35 5.3% Buy B17 12/9/80 934.04 3.3% Sell S9 1/2/81 980.89 4.1% Buy B9 1/23/81 940.19 8.9% Sell S9 10/9/81 873.00 4.0% Buy B9 10/23/81 837.99 -0.6% (36-40) Sell S9 4/1/82 833.24 6.7% Buy B8 8/11/82 777.21 36.0% Sell S9 12/7/82 1056.94 6.1% Buy B6 12/15/82 992.64 7.9% Sell S9 7/26/83 1243.69 6.1% Buy B17 8/9/83 1168.27 9.2% Sell S9 4/29/86 1825.89 -0.1% Buy B9 7/9/86 1826.07 0.5% Sell S9 8/12/86 1835.49 2.3% Buy B17 9/11/86 1792.89 34.2% (41-45) Sell S9 4/6/87 2405.54 7.7% Buy B17 5/19/87 2221.28 5.9% Sell S9 6/8/87 2351.64 -4.0% Buy B4 6/22/87 2445.51 10.5% Sell S9 12/28/87 1942.97 1.6% Buy B9 1/8/88 1911.31 6.3% Sell S9 10/4/89 2771.09 4.8% Buy B17 10/17/89 2638.73 6.5% Sell S9 7/12/90 2969.80 17.4% Buy B8 9/24/90 2452.97 6.3% (46-50) Sell S9 10/17/94 3923.93 5.7% Buy B6 12/1/94 3700.87 49.9% Sell S9 4/22/97 6833.59 -4.9% Buy B4 5/9/97 7169.53 10.5% Sell S9 2/26/02 10115.26 2.3% Buy B19 7/24/02 8191.29 7.9% Sell S9 5/5/2006 11577.74 4.9% Buy B14 6/15/2006 11015.19 1.2% Sell S9 1/5/2007 12398.01 2.3% Buy B17 3/2/2007 12114.1 15.3% (51-55) Sell S9 7/17/2007 13971.15 4.9% Buy B14 9/25/2007 13289.29 3.7% Sell S9 3/24/2008 12548.64 9.3% Buy B2 7/8/2008 11384.21 2.2% Sell S9 7/23/2008 12632.38 6.1% Buy B8 9/15/2008 10917.51 0.9 Sell S9 11/13/2009 10270.47 0.9% Buy B17 1/22/2010 10226.94 2.3 --------------------------------------------------------------------------- N=54 work in progress |
                            Sell S9s: 1929-2013
         Signals shown here are the first Sell S9s in a week.
                             (Sell S9Vs are shown elsewhere.)
    Sell S9     Date        DJI      Gain/Loss  Paper Loss
    ========================================================
1   S9...S12    2/1/1929   319.7    +5.7%        Zero
    LA/MA   ANNROC           P        IP21       V-I      Opct
    1.043  .545        -20    -.002     -408  .29
    Declined to LB (lower band) and timely Buy B17.
-------------------------------------------------------------------------
2   S9         2/28/1929    317.4   +4.5%        Zero
    LA/MA     ANNROC          P        IP21       V-I       Opct
    1.021  .13        -27  +.057  -459  .146
    also S9   3/1/1929    321.2    +5.6%
     Reversing Sell
          Declined below LB and then Buy B19.
-------------------------------------------------------------------------
3   S9        3/14/1929   316.3    +4.1%    Zero
    LA/MA     ANNROC          P        IP21       V-I         Opct
    1.022   .227      -3       -.015   -276  .092
     Declined below LB.  Reversed with B19
    198.7  11/13/29  B16
-------------------------------------------------------------------------
4   S9        4/18/1929   311.9   +2.5%      4% paper loss
    LA/MA     ANNROC       P        IP21       V-I         Opct
    1.024 -.219   -60     +.01   -710  -.131
    also S9...S12    4/22/1929   315.3   +3.5%
     Declined below LB.  Reversed with B19       Reversing Sell
--------------------------------------------------------------------------
5   S9          4/26/1929   314.2   +3.2%  2% paper loss
    LA/MA     ANNROC          P        IP21       V-I         Opct
    1.023  .427         -8     -.038     -239   .061
    S9          4/ 29/ 1929   313.8   +36.7%
        Declined below LB.  Reversed with B19

---------------------------------------------------------------------------
  6   S9       5/7/1929    321.9    +5.5%   No paper loss.
    LA/MA      ANNROC          P        IP21       V-I         Opct
    1.028  .778    -15     -.081     -235   .271
    S9        5/10/1929  325.7   +39.0%
    DJI fell below LB.  Reversed with B19.
--------------------------------------------------------------------------
7   S9...S12    6/14/1929   313.7    -5.5%  5.5% maximum paper loss
    LA/MA     ANNROC          P        IP21       V-I         Opct
   1.021  -.221    -59   -.035     -542   .162
    S9          6/ 19/ 1929   316.4   +37.2%            198.7  11/13/29  B16
    S9          6/ 20/ 1929   317.7   +37.5%            198.7  11/13/29  B16
    5.5% maximum paper loss or closed out when DJI closed above flat 4x tested resistance
        into all-time high territory should normally be used by traders to cover their shorts.
        There is too much risk of a significant additional advance. That took place on 7/2/1929.
        Eventually the DJI did decline below the Lower Band if one had only used the automatic
        Peerless Buys and Sells.
--------------------------------------------------------------------------
8   S9      8/2/1929    353.1   +43.7%  -5.5%  5.5% maximum paper loss
   LA/MA         ANNROC          P        IP21       V-I          Opct
   1.024   .384          -32    -.111     -402   .217
    5.5% maximum paper loss - The DJI's peak (highest closing) was on 9/3/1929 at 381.20.
        The DJI Declined below LB.  Use "Extreme Bear Market" mode Buy B16 to close out
        a short position.
--------------------------------------------------------------------------
9   S9     8/13/1929   354     Loss = - 5.5%  5.5% maximum paper loss
   LA/MA     ANNROC          P        IP21       V-I         Opct
   1.021   .416  -64 -.088  -570   .218
    5.5% maximum paper loss - The DJI's peak (highest closing) was on 9/3/1929 at 381.20.
        The DJI Declined below LB.  Use "Extreme Bear Market" mode Buy B16 to close out
        a short position.
-------------------
--------------------------------------------------------------------------

10  S9     9/3/1929    381.2   +43.0%   No paper loss
    LA/MA     ANNROC          P        IP21       V-I         Opct
    1.051   .025  -14 -.126  -351   .139
    S9          9/ 4/ 1929    379.6
    S9          9/ 6/ 1929    376.3
    Declined below LB - The multiple Sell signals, 9 months' DJI divergence
    from the NYSE A/D Line downtrend and head/shoulders top set up the
    biggest bear market in history.  Use "Extreme Bear Market" mode Buy B16 to
          close out a short position on 10/24/1929 at 217.3.
-----------------------------------------------------------------------------------------------------------------------------------------------------
-----------------------------------------------------------------------------------------------------------------------------------------------------
   The Peerless Sell S13 on 10/23/1929 tells us to switch to bearish mode.
   Sell Sell S9/S12 signals are not as reliable in it, because of the
   much greater volatility in brief bear market short-covering rallies.
   The next 9 Sell S9s are treated as though there was no Extreme Beairsh
   Mode.

X   S9   12/2/1929
    December S9 signals are not allowed in the Extreme Bearish Mode.
    Decembers bring rallies in this mode.
   LA/MA        ANNROC          P        IP21       V-I            Opct
   1.024   -.949   -62    -.002     -1233   -.108
   DJI rallied to 290 peak in 3 months before declining.Paper Loss = 18%
   Eventually declined below LB
   December S9 signals are not allowed in the Extreme Bearish Mode.
   Decembers bring rallies in this mode.
   The 12/2/11930 Sell S9 is also not allowed.
----------------------------------------------------------------------------
 X S9...S12    1 10/1930   250     +31.2%            198.7  11/13/29  B16
   LA/MA        ANNROC          P        IP21       V-I          Opct
   1.023   .593       -57    -.047     -547   -.01
    S9          1/ 13/ 1930   249.6   +31.2%            171.8  1/23/31   B7
    S9          1/ 14/ 1930   250.4   +31.3%            171.8  1/23/31   B7
    S9          1/ 15/ 1930   251.5   +31.7%            171.8  1/23/31   B7
  DJI rallied to 290 peak in 3 months before declining.
  January S9 signals are not allowed in the Extreme Bearish Mode.
----------------------------------------------------------------------------
 X  S9        3/10/1930   276.9   +38.0%
   LA/MA       ANNROC          P        IP21       V-I         Opct
   1.026   .367    +15    -.02     -150   -.01
  DJI rallied to 290 peak in 6 weeks before declining. Paper Loss = 5.5%
     Eventually declined below LB
   March S9 signals are not allowed in the Extreme Bearish Mode.
----------------------------------------------------------------------------
  X   S9        3/18/1930   277.3   +38.0%
    LA/MA          ANNROC          P        IP21       V-I          Opct
    1.023   .299    +23    -.008     -115   .311
  DJI rallied to 290 peak in 5 weeks before declining.
    S9          3/19/1930   277.9   +38.2%            171.8  1/23/31   B7
  Paper Loss = 5%      Eventually declined below LB
  March S9 signals are not allowed in the Extreme Bearish Mode.
---------------------------------------------------------------------------
11.   S9       5/29/1930   275.1   +19.0% Gain  No paper loss.
   LA/MA          ANNROC          P        IP21       V-I         Opct
   1.022   -.181       -8       -.001     -461  .12
   Declined below LB.  Here the regular Peerless is used to close
   out this large and quick profit. A May S9 is allowed in
   Extreme Bearish Mode.
---------------------------------------------------------------------------
12    S9   8/27/1930   237.9  +21.6%    paper loss.=3%
   LA/MA          ANNROC          P        IP21       V-I         Opct
   1.033   -.026       -36     +.034     -277  .114
   Declined below LB.  Here the regular Peerless B16 is used to close
   out this large and quick profit. August S9s are allowed in the
   Extreme Bearish Mode.
   other S8s: 8/28/1930, 9/2/1930,9/4/1930
-----------------------------------------------------------------------------
13    S9   9/5/1930   240.4  +22.5%   paper loss.= 1%
   LA/MA          ANNROC          P        IP21       V-I         Opct
   1.022   -.181       -8       -.001     -461  .12
   Declined below LB.  Here the regular Peerless B16 is used to close
   out this large and quick profit. August S9s are allowed in the
   Extreme Bearish Mode.

-----------------------------------------------------------------------------

 14   S9      8/19/1931     141.70  +21.8%    No Paper loss
    LA/MA       ANNROC            P        IP21       V-I         Opct
    1.022  -.428     -53   +.038    -170  .078
     Declined below LB.  Here the regular Peerless B16 is used to close
     out this large and quick profit. August S9s are allowed in the
     Extreme Bearish Mode

==============================================================================================
 X   S9  10/27/1931
     March S9s are Not allowed in the Extreme Bearish Mode


 X    3/1/1932     81.90
    LA/MA        ANNROC            P        IP21       V-I         Opct
    1.028   +.779    -36    -.041    -117   .028
    Declined below LB.
    March S9s are Not allowed in the Extreme Bearish Mode


==============================================================================================
15  S9       9/18/1933  105.3   +7.7%  No Paper Loss
    LA/MA     ANNROC          P        IP21       V-I         Opct
    1.03   +.689   -17  +.097  -163    .161
   DJI fell below the lower band.  Note the completed head/shoulders.

-----------------------------------------------------------------------------------------------------------------------------------------------------
16  S9          4/11/1934   105.2    +4.5%   1% paper loss.
    LA/MA     ANNROC          P        IP21       V-I         Opct
    1.02   +.117  +33  +.016  -17    .208
    S9          4/ 12/ 1934   104.8    +4.1%            100.5   4/30/34  B9
    S9          4/ 13/ 1934   104.9    +4.2%            100.5   4/30/34  B9
  DJI fell below the lower band. Completed head/shoulders.   .
     1934's chart shows that the volatility was higher back then.  When bands are
     optimized to bracket 95% of the highs and lows, instead of the normal 3.5%, the
     upper band is 5.5% and the lower band is 8%.  In an Extreme Bear, we see lower bands
     below 12%.  So, this was still a vast improvement from 1932 and 1932-1933 when
     the lower band was 20% below the 21-day ma.

     Note also in the chart below that the S9 here did not quite have the P-Indicator in negative
     territory.  The V-Indicator was, however, a -.17.  This would also have been a Sell S9V
     if it had occurred between May and September.  The Sell S9 sometimes is produced when
     the upper band is reached and the V-I is negative and the P-I and IP21 are almost negative.


-----------------------------------------------------------------------------------------------------------------------------------------------------
17  S9      6/19/1934  99    +12.4% , no paper loss
   LA/MA         ANNROC          P        IP21       V-I         Opct
   1.033   +.473     +9       -.001      -6    .154
    S9...S12    6/ 20/ 1934   98.3     +7.1%
  DJI fell below the lower band and no paper loss..
  Reversed:  91.3   8/9/34   B13
-----------------------------------------------------------------------------

18. S9/S12  8/21/1934  92.60  +6.4%      Paper loss = 1%.
  LA/MA     ANNROC           P         IP21       V-I           Opct
  1.029   +.093  +31     -.021      -87   -.014
  DJI fell below the lower band.  A perfect B8 occurred at bottom on 9/17/1934.
-----------------------------------------------------------------------------

19. S9/S12  9/27/1934  93.40  5.2% Loss  5.2% Paper Loss
  LA/MA          ANNROC          P        IP21       V-I         Opct
  1.029   -.105       -40     -.036      -80   -.117
  5.2% Paper Loss.
  Reversed: 11/8/1934 B10  97.3

  Note: Septembers should bring weakness.
  When they do not it can be a warning of higher prices ahead.
     The S9/S12 should have been reversed by a classic breakout past well-tested flat resistance
     on 11/7/34 with the DJIA at 97.60. Traders should have seen this coming by the failure of the DJI
     on the last decline to fall to its lower band.  See next chart.

-----------------------------------------------------------------------------
   20.  S9     10/5/1934  92.9     4.7% loss  Paper loss = 4.7%
  LA/MA         ANNROC          P        IP21       V-I         Opct
  1.028   .145         -17     -.014      -49   .028
  Also S8 on 10/8/1934.  5.2% loss.
  The S9/S12 was reversed by a classic breakout B10 past well-tested
     flat resistance on 11/7/34 with the DJIA at 97.30.


-------------------------------------------------------------------------------------------------------------------------------------------------
  X     This next Sell S9 is not allowed because of the bullish seasonality in the year before
           a Presidential Election.   It is an extreme NNC by the P-Indicator with
           the DJI 4.7% over the 21-dma.  Possibly, it  should be allowed.
    2/18/1935  107.20   +6.6%      100.1   3/5/35   B17   100.1
  LA/MA          ANNROC          P         IP21       V-I         Opct
  1.047   .618      -5    +.151        -7   .318
  This case shows an extreme variance between P-Indicator and IP21.
    It would have been reversed on 3/4/35   B17   100.1
-------------------------------------------------------------------------------------------------------------------------------------------------
   21  S9...S12...S15   4/3/1936    160.1   +7.2%   1% Paper Loss.
   LA/MA     ANNROC          P        IP21       V-I         Opct
   1.024  .198        -37    -.126     -250   .035
    S9...S12    4/ 6/ 1936    161.9    +8.2%
    S9          4/ 7/ 1936    160.9    +7.6%
    S9          4/ 8/ 1936    160.9    +7.6%
  This was a classic S9 after a long advance.
  The DJI fell 11% and recovered.
  DJIA fell below the lower band.

--------------------------------------------------------------------------------------------------------------------------------------------------------
X ( S9/S12 10/6/1936 174.4
1.034 .523 -1 +.005 -69 .202
This was treated as an S12. But it is doubtful because of the just completed
price breakout past 3 recent highs that line up perfectly. Another problem here:
it is a Presidential Election year and normally the DJI rallies from an October low in
that year to give partisans a chance to celebrate. It would have brought a 4% loss.
-------------------------------------------------------------------------------------------------------------------------------------------------------
22 S15...S9 2/11/1937 190.3 +13.0% 2% Paper Loss.
LA/MA ANNROC P IP21 V-I Opct
1.022 .468 -11 .055 -203 .227
Reversed:
DJIA fell far below the lower band to a Buy B8 in June..
-----------------------------------------------------------------------------
23 S9 3/3/1937 192.9 +14.2% No Paper Loss.
LA/MA ANNROC P IP21 V-I Opct
1.025 .52 -6 .075 -208 .18
S9 3/ 9/ 1937 193.3 +14.4%
S9 3/ 10/ 1937 194.4 +14.9%
Reversed:
DJIA fell far below the lower band to a Buy B8 in June..
 ----------------------------------------------------------------------------
24 S9 8/13/1937 189.3 +36.1% no paper loss
LA/MA ANNROC P IP21 V-I Opct
1.024 .62 -2 -.042 -43 .243
DJIA fell far below the lower band. No Paper Loss.
Reversed: 118.10 12/31/37 B8
Because of speed of deep collapse, users should use Extreme Bearish
Mode. Note the warning Sell S13 to that effect. The normal MAX Oversold
Condition should NOT be applied. That would have given a premature
but on 10/6/1937 at 147.20 as opposed to the Extreme's Buy B16 on 11/23/1937
with the DJI at 115.80.
Transition to Extreme Mode from Normal Mode when S13 appears.
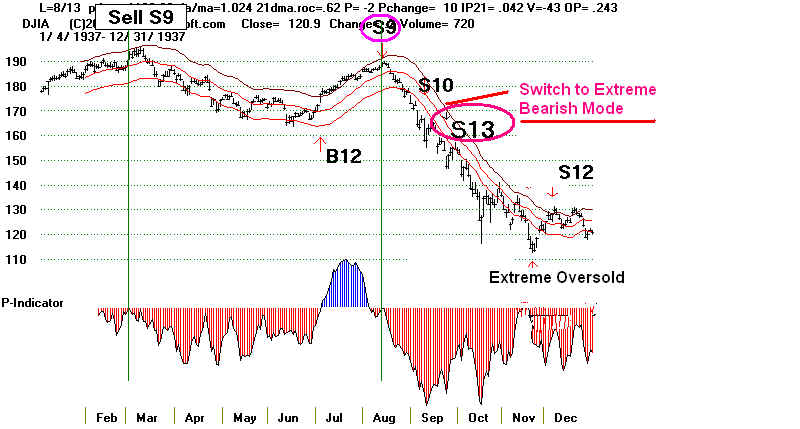 Transition back from Extreme Mode to Normal Mode when 200-day ma broken
This is the simplest approach. But we did not use it in 2008-2009.
Instead, we used the 40% down from the year's highs line as
the boundary of which to use.
Here is Extemel Mode chart for 1937-1938.
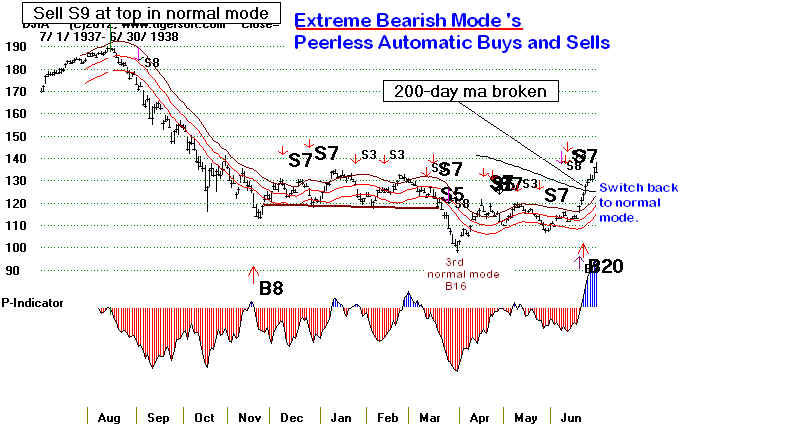 Normal Sell S9s during the Extreme Bearish Mode are not counted here because they
are not considered reliable until the DJI rises past the 200-day ma. They do produce
declines to the lower band or tests of neckline-supports, but knowing when to cover is
problematic. The normal mode Buys are mostly premature, except for the January B9
and March 31 Buy B16.
Note in the chart that the normal Buy B16 worked perfectly on 4/31/1938 in the breakdown
of the DJI on 3/31/1938 below the continuation H/S neckline. This was the 3rd normal
B16 in 12 months.
1/6/1938 128.9 -0.7%
1.035
1/19/1938 130.1 +5.3%
1/21/1938 130.7 +5.7%
4/13/1938 114.9 -7.8%
4/14/1938 116.8 -6.1%
4/18/1938 118.9 -4.2%
4/20/1938 115.4 -7.4%
4/25/1938 116.2 -6.6%
4/26/1938 113.9 -8.8%
5/10/1938 117.9 -5.1%
 =====================================================================================
25 S9 9/13/1939 151.4 +3.2% No Paper Loss.
LA/MA ANNROC P IP21 V-I Opct
1.095 1.181 -43 + .138 +56 +.317
very high
DJIA fell only to the lower band and then Buy B13 on 12/18/1939. No Paper Loss.
-----------------------------------------------------------------------------
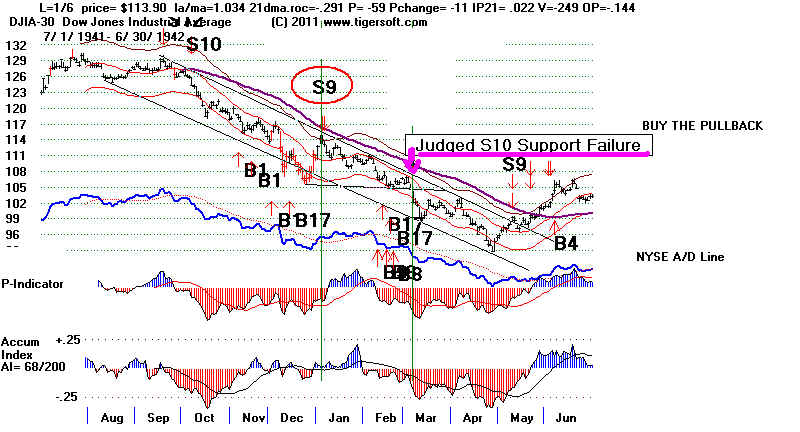
26 S9 1/6/1942 113.9 +5.6%
LA/MA ANNROC P IP21 V-I Opct
1.034 .291 -59 .022 -249 -.143
S9 1/ 7/ 1942 113.1 +5.6%
DJIA fell far below the lower band. No Paper Loss.
The February Buy signals on weakness were premature. A reversal
did not take place until 4/28/1942.
---------------------------------------------------------------------------
 27  S9...S12    5/ 11/ 1942   99.2   -5.2%  Paper loss = 5.2%
    LA/MA       ANNROC          P           IP21               V-I         Opct
         1.027    -.062     -42     -.162            -53      -.027
    The DJI rallied past 65-day ma with posiitve internals.
    This probably should have meant covering,before the Buy B4.

---------------------------------------------------------------------------
  28  S9        5/21/1942   99.7      -4.7%   Paper loss = 4.7%
    LA/MA     ANNROC            P             IP21            V-I         Opct
          1.03    -.308             -12               0            -26    .141
    The DJI rallied past 65-day ma with posiitve internals.
    This probably should have meant covering,before the
    Buy B4 on 6/5/1942.
---------------------------------------------------------------------------
29 S9 6/2/1942 101.3 -3.1% Paper loss = 3.1%
LA/MA ANNROC P IP21 V-I Opct
1.024 .555 22 .12 -2 .213
Also 6/3/1942 102.2 -2.2%
 ===========================================================================
S9<B> #1 6/7/1943 141.8 +1.7%
LA/MA ANNROC P IP21 V-I Opct
1.016 .248 -11 .012 -113 .055
This is called an S9<B>. It is differerent from typical S9s.
It occurs when P-Indicator finally turns positive after
being negative after being positive for more than 100 straight
days. The DJI must also be above the 21-dma.
---------------------------------------------------------------------------
X S9<B> 5/15/1945 141.8 +1.7%
LA/MA ANNROC P IP21 V-I Opct
.998 .116 -2 .013 -87 .151
This was not an S9<B>. The DJI must also be above the 21-dma
at the time of the signal..
===========================================================================
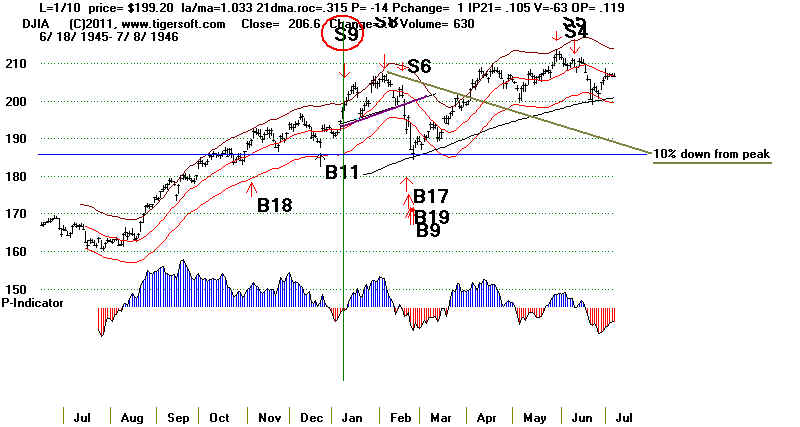
30 S9 1/10/1946 199.2 +3.4% Paper loss - 3.7%
LA/MA ANNROC P IP21 V-I Opct
1.033 .315 -14 .105 -63 .119
DJI completed a compact , asymmetrical head/shoulders. Internals
did not weaken much, but DJI did drop below lower band. Note in chart
below how DJI turned back up at rising 140-day (30-wk ma). This
also down exactly 10% from the highest closing.
===========================================================================
S9<B> #1 6/7/1943 141.8 +1.7%
LA/MA ANNROC P IP21 V-I Opct
1.016 .248 -11 .012 -113 .055
This is called an S9<B>. It is differerent from typical S9s.
It occurs when P-Indicator finally turns positive after
being negative after being positive for more than 100 straight
days. The DJI must also be above the 21-dma.
---------------------------------------------------------------------------
X S9<B> 5/15/1945 141.8 +1.7%
LA/MA ANNROC P IP21 V-I Opct
.998 .116 -2 .013 -87 .151
This was not an S9<B>. The DJI must also be above the 21-dma
at the time of the signal..
===========================================================================
30 S9 1/10/1946 199.2 +3.4% Paper loss - 3.7%
LA/MA ANNROC P IP21 V-I Opct
1.033 .315 -14 .105 -63 .119
DJI completed a compact , asymmetrical head/shoulders. Internals
did not weaken much, but DJI did drop below lower band. Note in chart
below how DJI turned back up at rising 140-day (30-wk ma). This
also down exactly 10% from the highest closing.
 ---------------------------------------------------------------------------
31 S9 4/14/1950 215.3 +3.5% Paper loss = 4.2%
LA/MA ANNROC P IP21 V-I Opct
1.026 .443 -28 -43 .022 -189 .404
----------------------------------------------------------------------------------------------------------------------------------------------------------------------------------------
32 S9 4/30/1951 259.10 +6.4% Paper loss = 1.5%
LA/MA ANNROC P IP21 V-I Opct
1.024 .50 +26 -21 .179 -23 .336
----------------------------------------------------------------------------------------------------------------------------------------------------------------------------------------
---------------------------------------------------------------------------
The next occurence is not an S9 because of the special bullishness of the first quarter
in the year before a Presidential Election.. See also 1999.
X 2/ 1/ 1955 409.7 -0.1%
LA/MA ANNROC P IP21 V-I Opct
1.028 .024 -3 10 047 -292 .154
2/ 2/ 1955 407.1
---------------------------------------------------------------------------
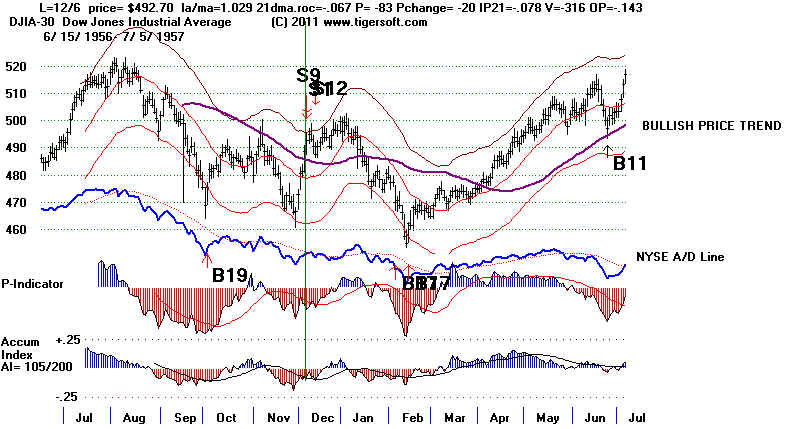
33 S9/S12 12/6/1956 492.7 +4.6% 1% paper loss.
LA/MA ANNROC P IP21 V-I Opct
1.029 -.067 -83(-20) -.078 -316 .143
DJI rallied to 496.00 and then fall below lower band.
 ---------------------------------------------------------------------------
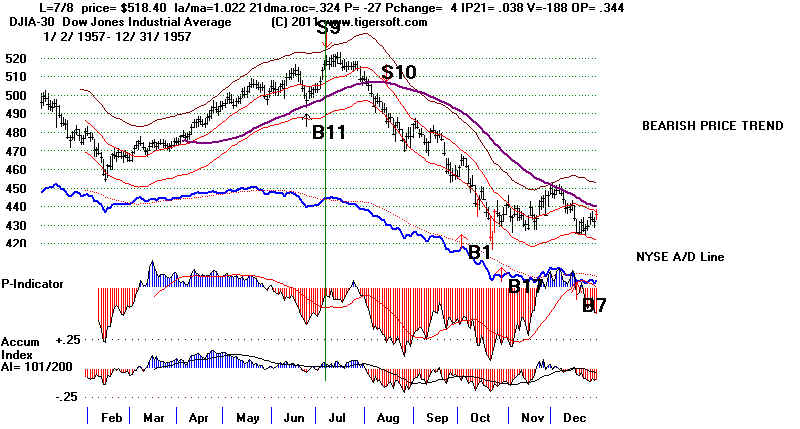
34 S9 7/8/1957 518.4 +10.3% No paper loss
LA/MA ANNROC P IP21 V-I Opct
1.022 .324 -27 4 -86 .038 -188 .311
Reversing. DJI fell below lower band.
The Buy B1 on 10/2/1957 was premature. Expect more of
a selling climax on a decline like this into OCtober.
 -------------------------------------------------------------------------------------------------------------------------------------------------------------------------------------[----
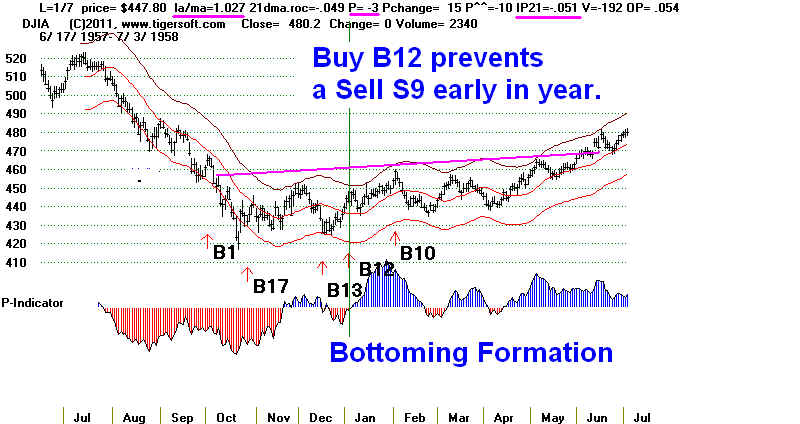
The date below did not give a Sell S9 or S12 because of the B12 signal on the day before.
 X  1/7/1958    447.8  -2.4%
    LA/MA         ANNROC          P                                  IP21             V-I              Opct
    1.027 -.049  -3 15 -10 -.051  -192  .054
---------------------------------------------------------------------------

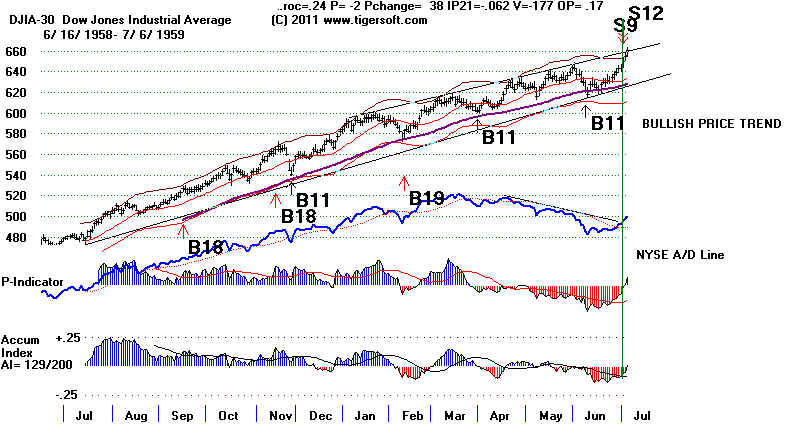
    35  S9...S12    7/1/1959    650.2    +4.0%  4.3% paper loss.
    LA/MA       ANNROC             P                             IP21         V-I              Opct
         1.03   .24    -2(+38) -.062   -177   .166

   Note: Selling short right before the July 4th holiday is not
        a good idea.  DJI rallied to 674.90 and then fall below
        lower band, with the completed H/S probably  spooking traders.
---------------------------------------------------------------------------
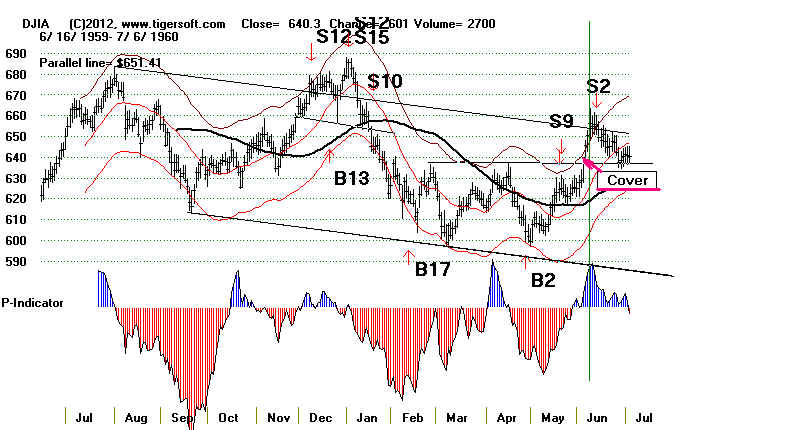
36 S9 5/19/1960 624.6 -0.2% 5.1% paper loss
LA/MA ANNROC P IP21 V-I Opct
1.022 .115 -39(+28) -.02 -310 .047
DJI rallied to 656.40 and then fall below lower band.
S9 5/20/ 1960 625.2 -0.1% 626 7/18/60 B2
Note: The surpassing by the DJI of the 640 resistance
with the DJI above the 65-dma and the P-Indicator very positive,
all should have caused short covering before the 5.0% stop
maximum loss was reached.
 37 S9 10/14/1960 596.5 +4.1% No paper loss
LA/MA ANNROC P IP21 V-I Opct
1.021 .124 -70(+27) -.078 -390 .032 .
DJI fell to lower band.
S9 10/17/1960 593.3 +3.6%
Reversing.
---------------------------------------------------------------------------
38 S9 8/3/1961 715.7 -1.7% loss 3% paper loss.
LA/MA ANNROC P IP21 V-I Opct
1.032 .395 -8(-9) .017 -185 .281
DJI rallied to 734.30 on 11/15. A Santa Claus
Buy was given on 12/18/1961. That rally was short-lived.
The DJI then fell far below the lower band. The big decline
was reversed by Buy B16 with DJI at 539.2 on 6/22/62.
Also S9 8/7/1961 719.5
----------------------------------------------------------------------------
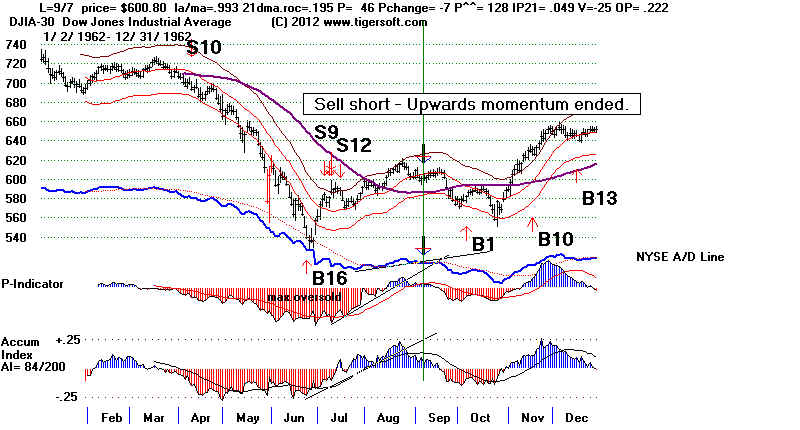
39 S12, S9 7/5/1962 583.9 +0.3% 5.4% paper loss.
There was a paper loss of 5.41% (615.5 -583.9)/583.9
If one had held throughout the rally, there
would have been a gain of 0.3%. It is to avoid
this loss that we place the maximum paper loss at 5.5%
LA/MA ANNROC P P** IP21 V-I Opct
1.025 -.23 -301 16 -987 -.093 -871 -.218 Reversing.
DJI rallied to 612 and then fell to lower band.
S9 7/ 9/ 1962 580.8 +0.4%
1.024 -.448 -348 7 -967 -.065 -1110 -.238
S9...S12 7/ 10/ 1962 586 +1.2%
1.034 -.327 -451 -103 -1252 -.103 -1390 -.13
Reversed: 578.7 10/2/62 B1
-------------------------------------------------------------------------
40 7/16/1962 588.1 +1.0% 4% paper loss.
LA/MA ANNROC P IP21 V-I Opct
1.034 .527 -284 35 .082 -742 -.137
Reversed:
Note: Early July S9s are problematic. They warn of a decline,
but they are premature. In practice,it is better to waitin
these cases for the internal strength indicators' rising
trendlines to be broken. This would have produced a Sell
Short judged signal on 9/7/1962 with the DJI at 600.89 and
would have resulted in a 3.1% gain instead of a 5% maximum loss.
The reversing signal was a Buy B1 at 578.7 on 10/2/62.
 ---------------------------------------------------------------------------
41 S9 9/14/1966 806.23 +6.0% No Paper Loss
LA/MA ANNROC P IP21 V-I Opct
1.018 -.43 -225 +24 -.104 -15 -.22
DJI immediately declined slightly below the lower band.
This was reversed by Buy B8 on 10/3/66 at 757.96.
Also S9...S12 9/15/1966 814.3 +6.9%
S9 9/16/1966 814.3 +6.9%
S9 9/19/1966 810.85 +6.5%
S9 9/20/1966 806.01 +6.0%
---------------------------------------------------------------------------
---------------------------------------------------------------------------
41 S9 9/14/1966 806.23 +6.0% No Paper Loss
LA/MA ANNROC P IP21 V-I Opct
1.018 -.43 -225 +24 -.104 -15 -.22
DJI immediately declined slightly below the lower band.
This was reversed by Buy B8 on 10/3/66 at 757.96.
Also S9...S12 9/15/1966 814.3 +6.9%
S9 9/16/1966 814.3 +6.9%
S9 9/19/1966 810.85 +6.5%
S9 9/20/1966 806.01 +6.0%
---------------------------------------------------------------------------
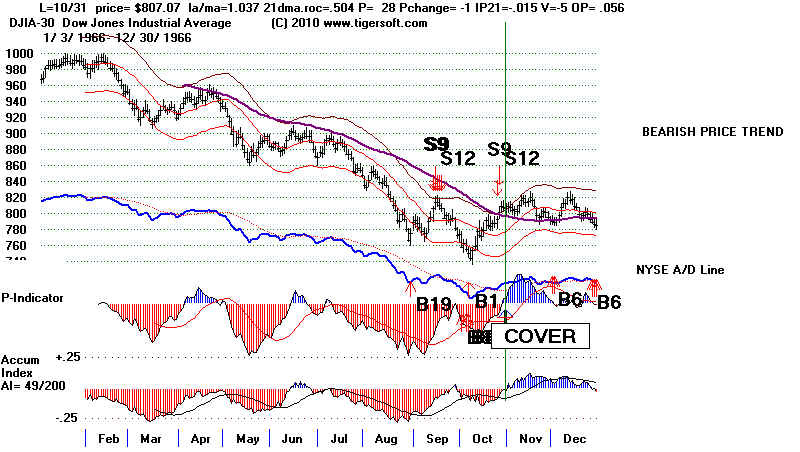
    42  S9  10/25/1966  793.09  +0.4%  4% Paper Loss
    LA/MA          ANNROC                  P                                IP21         V-I              Opct
    1.026  .008    -82 +3    -.08 -11   .048
    DJI rose to 823 before falling one half to lower band from mvg.
    avg. Reversed:  789.75  12/1/66  B6
----------------------------------------------------------------------- .
     43  S9    4/30/1969   950.18  +19.0%  Paper Loss = 1.9%
    LA/MA       ANNROC          P               P^^        IP21         V-I              Opct
          1.025      .189           -30  +11   -66      .083     -1           .138

    S9    5/1/1969
    LA/MA       ANNROC          P               P^^        IP21         V-I              Opct
          1.023      .207           -22  +7    -49      .087      -1           .131
    S8    5/2/1969
    LA/MA       ANNROC          P                 P^^        IP21         V-I              Opct
          1.03       .337            14   +36    +32     .109       0          .190
     DJI rallied to 968.85  and then fall below the lower band.
    Reversed: 769.93  12/17/69 B13
---------------------------------------------------------------------------
    44  S9    1/5/1970    811.31  +5.8%       No paper loss
     LA/MA       ANNROC          P               P^^        IP21         V-I              Opct
            1.027       .271           -15  +72  -31    -.034      -1           .086
           DJI fell immediately below the lower band.   Reversed: 763.99  1/27/70  B8
---------------------------------------------------------------------------------------------------------------------------------------------------------------------------------------------

     45  S9    2/27/1970    777.59  +8.6%   Paper Loss = 1.9%
     LA/MA       ANNROC          P               P^^        IP21         V-I              Opct
            1.03       .296             61  +48   129      .023     -1           .006
           DJI rallied to 788.15.  Paper loss = 10.56/777.59 amd then fall below the lower band.
           Reversed:  710.36  6/1/70  B12
 --------------------------------------------------------------------------
 --------------------------------------------------------------------------
     X  S9    6/1/1970   710.36   +5.0%
     LA/MA       ANNROC          P                 P^^        IP21         V-I              Opct
            1.028      -.40         -237 +40   -501     -.026     -3           -.125
     This S9 had a simultaneous B12.  The B12 cancels the S9.
     This is not considered an S9 or a Sell.
     Reversed: 669.36  7/7/70   B7
---------------------------------------------------------------------------
---------------------------------------------------------------------------

     46  S9   6/17/1970   704.68   +5.0%    Paper Loss = 1.6%
      LA/MA       ANNROC          P                 P^^        IP21         V-I              Opct
              1.026       .23         -109  +38  -230      .001     -2          -.139
          DJI rallied to 716.11 and then fall to the lower band.
     S9    6/22/1970   716.11   +6.5%   669.36  7/7/70
     LA/MA       ANNROC          P                 P^^        IP21         V-I              Opct
        1.032       .929             5   -7      12       .071       -1           .061
     Reversed: 669.36 7/7/70   B7
---------------------------------------------------------------------------
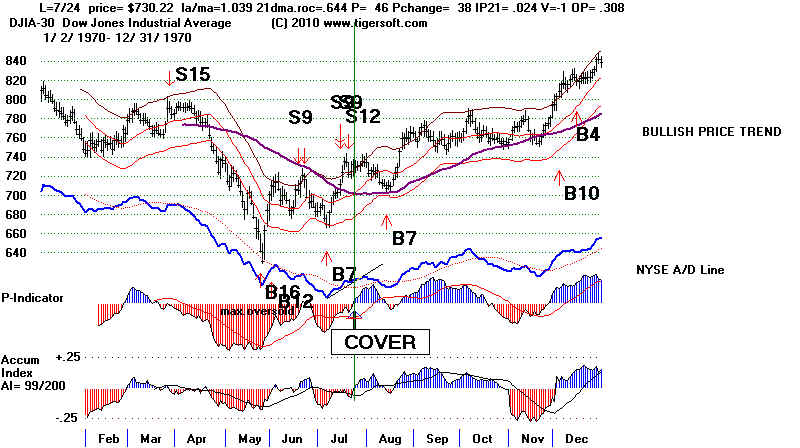
    47 S9...S12   7/15/1970   711.66  +0.6%  Paper Loss = 3.3%
    LA/MA       ANNROC          P                 P^^        IP21         V-I              Opct
             1.023       .416         -87   16     -184    - .016      -2           .193
    S9          7/ 21/1970   722.07   +2.0%
    DJI rallied to 735.56.   Then fell to near the lower band on 8/13/70
         where a B7 occurred.   Reversed: 707.35  8/13/70  B7
    LA/MA       ANNROC          P                 P^^        IP21         V-I              Opct
    1.033       .028         -88   -42     -185    - .065      -2           .076
-----------------------------------------------------------------------
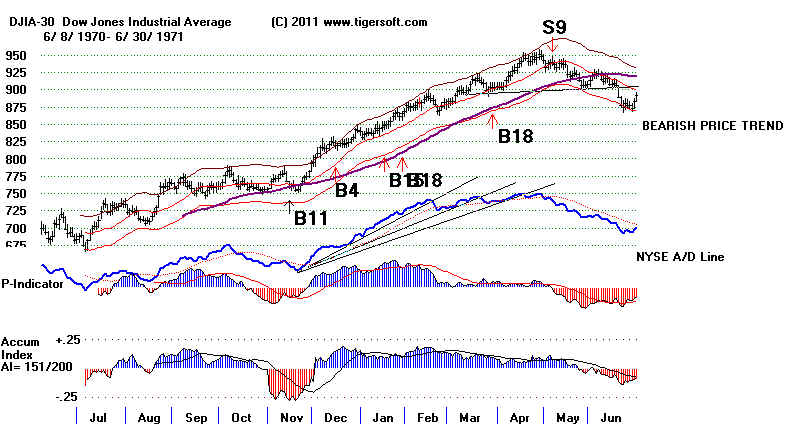
Below is a special type of Sell S9. The P-Indicator turns
negative after being positive 100 straight days. It is seen
when the earlier 6 months' data is graphed.
S9<B> #2
5/6/1971 937.39 +3.7% No Paper loss.
LA/MA ANNROC P P^^ IP21 V-I Opct
.999 .313 -15 -34 -32 .076 -1 .279
Head and shoulders breakdown followed this S9B. DJi fell below the lower band. No Paper loss.
888.95 8/16/71 B13
 ---------------------------------------------------------------------------
    47  S9    8/17/1971   899.9   +8.2%    Paper Loss = 2.3%
    LA/MA     ANNROC       P          P^^      IP21     V-I         Opct
          1.038         .048           -93  33   -196      .153     -1         - .001
          DJI rallied to 920.93 on 9/9/1971 before falling below lower band, a consequence
          of the Head/Shoulders pattern that formed.

---------------------------------------------------------------------------
-
         48  S12,  S9    8/26/1971   906.1 +8.8%   Paper Loss = 1.6%
          LA/MA     ANNROC       P          P^^      IP21     V-I         Opct
          1.041         .467           24  33     50       -.105      -1           .173
          Reversed: 826.15  11/10/71 B17
          DJI rallied to 920.93 on 9/9/1971 before falling below lower band, a consequence
          of the Head/Shoulders pattern that formed.
---------------------------------------------------------------------------
    49  S15,S9      4/12/1972   966.96  +5.7% No Paper Loss
    LA/MA     ANNROC          P        IP21       V-I         Opct
         1.023         .483                -2        .087         0            .237
          Reversed:  911.72  7/18/72  B2
---------------------------------------------------------------------------
    50  S9...S12    5/22/1972   965.31  +5.6%  Paper Loss = 0.6%

    LA/MA           ANNROC          P           IP21       V-I            Opct
     1.023    .019    -89 -.031   -2   .128
     S9          5/ 24/ 1972   965.46   +5.6%
     S9          5/ 25/ 1972   969.07   +5.9%
     DJI declined to lower band.
     Reversed: 911.72  7/18/72  B2
---------------------------------------------------------------------------
   51    S9        5/30/1972   971.18   +6.1%   No Paper Loss
   LA/MA     ANNROC          P        IP21       V-I         Opct
        1.025          .214             -19       -.005        -1           .224
       DJI declined to lower band.
        Reversed: 911.72  7/18/72  B2
---------------------------------------------------------------------------
    52   S9...S12    8/3/1972  947.7 +2.7% Paper Loss = 2.3%
          921.66  10/16/72 B2
    LA/MA     ANNROC          P        IP21       V-I         Opct
     1.022          .183            -92       -.056       -2           -.13
    S9          8/ 4/ 1972    951.76   +3.2%
    S9          8/ 7/ 1972    953.12   +3.3%
    S9          8/ 8/ 1972    952.44   +3.2%
    S9          8/ 9/ 1972    951.16   +3.1%
     Reversed: 911.72  7/18/72  B2   921.66  10/16/72 B2
---------------------------------------------------------------------------
    53  S9   8/10/1972   952.89   +3.3%  Paper Loss = 1.8%
    LA/MA     ANNROC          P        IP21       V-I         Opct
           1.022          .373             -5       . 06          -1           ,01
           Reversed:   921.66  10/16/72 B2
---------------------------------------------------------------------------
    54  S9   1/8/1973    1047.86 +9.0%   Paper Loss = 0.4%
    LA/MA     ANNROC          P        IP21       V-I         Opct
    1.022          .290              -72        .052         -2           ,138
    S9          1/ 11/ 1973   1051.7  +16.9%
     Reversed: 953.75  2/26/73  B17
---------------------------------------------------------------------------
    55   S9  4/11/1973   967.41   +9.6%  No Paper Loss
    LA/MA     ANNROC          P        IP21       V-I          Opct
           1.023         - .109          -158       . 049        -3        -.095
           Reversed:   874.17  8/15/73  B17
---------------------------------------------------------------------------
    56  S9   7/11/1973   908.19  +3.7%   Paper Loss = 2.06%
    LA/MA     ANNROC          P        IP21       V-I         Opct
          1.024         - .093          -60      -.01         -2         .118
          Reversed:   874.17  8/15/73  B17
          Note: The short-covering rally in July never turned up the 65-dma.
---------------------------------------------------------------------------
    57  S9    9/5/1973   899.00  -4.6%  Paper Loss = 4.6%
    LA/MA     ANNROC          P           IP21       V-I         Opct
    1.016         - .182          -79        .013        -2        -.189
    S9   9/6/1973   901.04      -4.4%
    Reversed:   940.55  9/25/73  B4
    Note: Here the short-covering rally in September turned up the 65-dma with
          the P-Indicator positive and rising.  This was a warning to cover..
---------------------------------------------------------------------------

    58 S9     10/26/1973  987.06  +20.1%  No Paper Loss
    LA/MA     ANNROC          P        IP21       V-I         Opct
           1.021     .417                -9        .163        -1          .242
           Reversed:     788.31  12/5/73  B16
---------------------------------------------------------------------------
    59 S9...S12    2/22/1974   855.99   +4.0%   Paper Loss = 4.2%
    LA/MA        ANNROC          P        IP21         V-I           Opct
     1.027           -.214              21      -.083         -2         -.08
    S9          2/ 26/ 1974   858.51   +27.6%
    S9          2/ 28/ 1974   860.53   +27.7%
     Reversed:   621.95  6/3/74  B19
---------------------------------------------------------------------------
    59 S9          3/4/1974    853.18   +3.7%   Paper Loss = 4.5%
    LA/MA     ANNROC          P        IP21       V-I          Opct
          1.024       -.034               40        .014        -1          .131
          Reversed:   621.95  6/3/74  B19
---------------------------------------------------------------------------
59 S9 6/6/1974 845.35 +26.4% Paper Loss = 1.7%
LA/MA ANNROC P IP21 V-I Opct
1.023 -.026 -117 -.065 -2 .001
S9...S12 6/ 7/ 1974 853.72 +27.1%
S9 6/ 11/ 1974 852.08 +27.0%
S9 6/ 12/ 1974 848.56 +26.7%
S9 6/ 13/ 1974 852.08 +27.0%
Reversed: 621.95 9/27/74 B8
===========================================================================
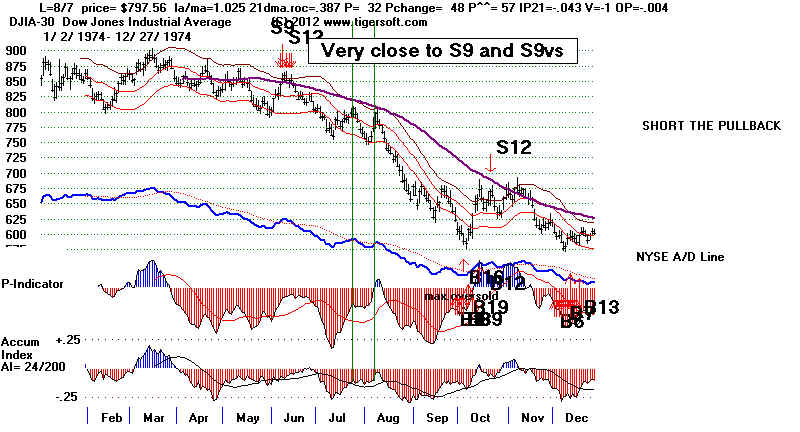
Note
7/24/1974 did not produce an automatic Sell S9, but you can see
in the chart below how close it came to doing so. Given the
bear market, this had to be interpreted as severely bearish.
LA/MA ANNROC P P^^ IP21 V-I Opct
1.019 -.159 -121 -216 -.089 -2 -.022
8/7/1974 did not produce an automatic Sell S9, but you can see
how close it came to doing so.
LA/MA ANNROC P P^^ IP21 V-I Opct
1.025 .387 32 57 -.042 -1 -.004
 ===========================================================================
   59 S9...S12    9/4/1975   838.31   +5.2%    No Paper Loss
    LA/MA     ANNROC      P            IP21       V-I         Opct
    1.026          .411          -61         -.023      -2          .195
    S9     9/5/1975    835.97   +4.9%
    Reversed: 795.1   9/16/75  B17
---------------------------------------------------------------------------
    60  S15.S9    3/24/1976  1009.21  +4.2%   Paper Loss = 0.5%
    LA/MA     ANNROC          P        IP21       V-I         Opct
          1.024         .192              -64     -.033      -1          .253
           Reversed:  966.76  10/5/76  B9...B2
---------------------------------------------------------------------------
    61  S9        3/15/1977  965.01   +6.4%   Paper Loss = 0.3%
    LA/MA     ANNROC          P        IP21       V-I         Opct
          1.024         .216               26       .06          -1          .052
          Reversed:   903.24  5/25/77  B9
-----------------------------------------------------------------------------------

    62   S9...S12    10/10/1978  891.63  +11.7%  Paper Loss = 1.1%
    LA/MA     ANNROC          P        IP21       V-I         Opct
    1.02          -.219          -139     -.136      -5   -.184
    S9...S12    10/ 11/ 1978  901.42  +12.6%
    S9          10/ 12/ 1978  896.74  +12.2%
    S9          10/ 13/ 1978  897.09  +12.3%
    Reversed:   787.51  12/18/78 B6...B9

------------------------------------------------------------------------------------------------------------------------------------------------------------------------------------------

    63   S9          9/21/1979   893.94  +10.9%  Paper Loss = 0.7%
    LA/MA               ANNROC             P        IP21        V-I         Opct
          1.017 (low)         .11               -69       .049       -1           .152
           The high was 2.623% over the 21-day ma.  This satisfies the need for the market being "over-bought".
           Late September S9s can be considered riskier because they are nearer October, often a month
           if steep declines.  So, the threshold can be lower regarding LA/MA, than earlier in the month....
           Perhaps 10/5/78 should have been a Sell S9.  A new closing high was made and P-I was 05.
           The close here was 1.018 of the ma.
           Reversed:    796.67  11/7/79  B9
------------------------------------------------------------------------------------------------------------------------------------------------------------------------------------------
    64  S9...S4     2/13/1980   903.84  +14.0%  No Paper Loss
    LA/MA     ANNROC          P        IP21       V-I         Opct
          1.028        .478                -26       -.01        -1           .205
          Reversed:    777.65  3/28/80  B19

------------------------------------------------------------------------------------------------------------------------------------------------------------------------------------------
    65    S9      11/14/1980  986.35  +5.3%  Paper Loss = 0.5%
    LA/MA     ANNROC          P          IP21       V-I         Opct
    1.042   .175      -93    -.11   -1   .182
    also S9 11/19/1980  991.04  +5.8%
          Reversed:    934.04  12/9/80  B17

------------------------------------------------------------------------------------------------------------------------------------------------------------------------------------------
    65 S9...S12    1/2/1981  972.78  +3.5%   Paper Loss = 3.5%
    LA/MA     ANNROC          P        IP21       V-I         Opct
    1.029         -.264             -71       -.04         -5         -.016
    also S9 1/7/1981    980.89  +4.3%
     Reversed:   938.91  1/26/81  B9

----------------------------------------------------------------------------------------------------------------------------------------------------------------------------------------
    66  S9    10/9/1981  873    +4.0%      No Paper Loss
    LA/MA     ANNROC          P        IP21       V-I         Opct
        1.024          .148             -12        .066      -4        -.123
          Reversed:  837.99  10/23/81 B9

------------------------------------------------------------------------------------------------------------------------------------------------------------------------------------------
    67   S9    4/1/1982  833.24  +6.7%     Paper Loss = 3.4%
    LA/MA     ANNROC          P        IP21       V-I         Opct
           1.026          .265            45       .004         0         .135
           Reversed:   777.21  8/11/82  B8

------------------------------------------------------------------------------------------------------------------------------------------------------------------------------------------
    68   S9    7/12/1982  824.87 +5.8%    Paper Loss = 0.9%
    LA/MA     ANNROC          P        IP21       V-I         Opct
    1.026          .388            -13         .07        -3        .121
    Also S9     7/ 13/ 1982   824.2   +5.7%
     S9          7/ 14/ 1982   828.39  +6.2%
     S9          7/ 15/ 1982   828.2   +6.2%
     S9          7/ 16/ 1982   828.67  +6.2%
     Reversed:  777.21  8/11/82  B8

------------------------------------------------------------------------------------------------------------------------------------------------------------------------------------------
    69  S9   12/7/1982   1056.94 +6.1%    No Paper Loss
    LA/MA     ANNROC          P        IP21       V-I         Opct
          1.028          .06             +21       -.05         -4          -.048
    Reversed:    992.64  12/15/82 B6

------------------------------------------------------------------------------------------------------------------------------------------------------------------------------------------
    70  S9   7/26/1983  1243.69  +6.1%   No Paper Loss
    LA/MA     ANNROC          P        IP21       V-I         Opct
          1.024          .02             -73        .058        -4           .183
          Reversed:  1168.27 8/9/83   B17


------------------------------------------------------------------------------------------------------------------------------------------------------------------------------------------
    71  S9   3/16/1984  1184.36  +5.7%     No Paper Loss
    LA/MA     ANNROC          P        IP21       V-I         Opct
          1.024         .264              +7        .001        1           .111
          Reversed:   1125.31 5/22/84  B17

------------------------------------------------------------------------------------------------------------------------------------------------------------------------------------------------
    X  S9  10/14/1985 1354.73    -6.3%
    LA/MA     ANNROC          P        IP21       V-I         Opct
    1.025         .318             -34       .052       -1           .094
          Reversed:      1440.02 11/18/85 B4

   This case was exceptional.  One of the DJI stockS, General Foods
   was overnight bid up dramatically on a hostile take-over offer
   by Philip (addiction, cancer,emphysema) Morris.  That
   took the DJI more quickly to the upper band than would otherwise
   have happened. No automatic Peerless Sell signal appears here.  At the time, it was not considered
        a trustworthy example of a Sell S9 because of the huge jump in GF and how it exaggerated the rise of the
        DJI on what would have otherwise not been a much bigger down day.

------------------------------------------------------------------------------------------------------------------------------------------------------------------------------------------
------------------------------------------------------------------------------------------------------------------------------------------------------------------------------------------------
   Special S9 - The signal below is an instance the rule giving an
   automatic Sell when the P-Indicator turns negative after
   being positive 100 straight dayy and with the DJI above
   the 21-day ma.
    S9<B> #3 S9    4/29/1986  1825.89   +3.6%   No Paper Loss
    LA/MA     ANNROC          P         IP21       V-I         Opct
          1.01         .048              -1        .049       -9          .112
          Reversed:    1826.07 7/9/86
--------------------------------------------------------------------------------------------------------------------------------------------------------------------------------------------
------------------------------------------------------------------------------------------------------------------------------------------------------------------------------------------

    72         S9    5/28/1986   1878.28  +2.3%    Paper Loss = 1.6%
    LA/MA     ANNROC          P        IP21       V-I         Opct
          1.047         .229             -19        .052        -2        -.11
          Reversed:  1792.89 9/11/86  B17

------------------------------------------------------------------------------------------------------------------------------------------------------------------------------------------
    72   S9    8/12/1986  1835.49    +2.3%   Paper Loss = 4.6%
    LA/MA     ANNROC          P        IP21       V-I         Opct
          1.01         .048               -1        .049        -9          .112
          Reversed:   1792.89 9/11/86  B17
------------------------------------------------------------------------------------------------------------------------------------------------------------------------------------------

    73  S9     4/6/1987   2405.54  +6.3%     No Paper Loss
    LA/MA     ANNROC          P        IP21       V-I         Opct
          1.039         .646              -2        .187       +8          .27
           Reversed:   2342.19 4/14/87  B5

------------------------------------------------------------------------------------------------------------------------------------------------------------------------------------------
    74 S9...S12  5/6/1987  2342.19  +5.2%    No Paper Loss
    LA/MA     ANNROC          P        IP21       V-I         Opct
          1.021        -.328            -185     -.079       -15         -.15
          Reversed:  2221.28 5/19/87  B17

------------------------------------------------------------------------------------------------------------------------------------------------------------------------------------------
    74   S9...S12   6/8/1987   2351.64 -4.0%   Paper Loss =   4.0%
    LA/MA     ANNROC          P        IP21       V-I         Opct
    1.026         .088             -32      -.045        -4          -.18
    S9          6/ 9/ 1987    2352.7
    S9          6/ 10/ 1987   2353.61
               These last 3 sell signals were never clinched
               before the next Buy.  When the DJI is at an
               all-time high it can help to wait for daily
               declines to exceed advances and then act on the Sell.
            Reversed:     2445.51 6/22/87  B4
------------------------------------------------------------------------------------------------------------------------------------------------------------------------------------------
    75   86  S9   10/1/1987   2639.2  +30.2%    Paper Loss  =  0.1%
    LA/MA     ANNROC          P        IP21       V-I         Opct
    1.026         .131             -98      -.009        -12          -.026
    Also S9...S12    10/ 2/ 1987   2640.99   +30.3%
    LA/MA     ANNROC          P        IP21       V-I         Opct
    1.026         .18              -56       -.017        -7           .068
           Reversed:   1841.01 10/20/87  B16
------------------------------------------------------------------------------------------------------------------------------------------------------------------------------------------
    76  87  S9    12/28/1987  1942.97  +1.6%    No Paper Loss
    LA/MA     ANNROC          P        IP21       V-I         Opct
    1.021        -.025              -37       .132        -8           .157
    This a dubious Sell because of cross-currents from tax loss selling
    at the end of the year and because current Accum. Index reading was
    a very positive +.132 on this day.
     Reversed:  1942.97 12/28/87  B9
Paper Loss = 88/2031.50
 ============================================================================
  The early 2013 update will disallow this instance because the DJI
  did not close 2.0% above the 21-dma and the hypothetical high
  was not 2.6% over the 21-day ma. and making a new 50-day high.made.

  X S9          9/6/1988    2065.26     -0.1%
    LA/MA     ANNROC          P        IP21       V-I         Opct
          1.017     -.315             -128      -.087       -16         -.139
    low
     S9          9/ 7/ 1988    2065.79
    LA/MA     ANNROC          P        IP21       V-I         Opct
    1.018 -244              -110   -.063     -13        -.054
    low
         Reversed:    2067.03 11/11/88  B17
------------------------------------------------------------------------------------------------------------------------------------------------------------------------------------------
    77  S9    10/4/1989   2771.09   +4.8%   Paper Loss  =  0.1%
    LA/MA     ANNROC          P        IP21       V-I         Opct
    1.028  .177              -49     .018       -13        -.054
    S9    10/11/1989  2773.36   +4.9%
     Reversed:    2638.73 10/17/89  B17

------------------------------------------------------------------------------------------------------------------------------------------------------------------------------------------
    78 S9     7/12/1990  2969.8    +17.4%    Paper Loss  =  1.0%
    LA/MA     ANNROC          P        IP21       V-I         Opct
          1.025  .15              -45      .052      -10        .233
        Reversed:   2452.97 9/24/90   B8
------------------------------------------------------------------------------------------------------------------------------------------------------------------------------------------
    79 S9     4/15/1992  3353.76   +3.0%   Paper Loss  =  1.8%
    LA/MA     ANNROC          P        IP21       V-I         Opct
    1.03  .358              -56      .049      -11        .239
    S9          4/ 20/ 1992   3336.31   +2.5%
    S9          4/ 21/ 1992   3343.25   +2.7%
    S9          4/ 23/ 1992   3348.61   +2.8%
    Reversed:  3254.1  8/21/92   B2

------------------------------------------------------------------------------------------------------------------------------------------------------------------------------------------
     80  S9   10/19/1994  3936.04  +5.8%    No Paper Loss
     LA/MA     ANNROC          P        IP21       V-I         Opct
             1.021        .207            -114    -.009     -17          .017
             Reversed:   3708.27 11/25/94  B1
------------------------------------------------------------------------------------------------------------------------------------------------------------------------------------------
-------------------------------------------------------------------------------------------------------------------------------------------------------------------------------------------------

        80  S9   8/12/1996  5704.90  -2.3%   Paper Loss  =  2.3%
     LA/MA     ANNROC          P        IP21       V-I         Opct
             1.034        .420             +76     ,118      -7          .313
             Reversed:  5838.52  9/13/96  B10
             The signal above is an Sell S9V.  It is the V-Indicator'e negativity that produces the Sell.
------------------------------------------------------------------------------------------------------------------------------------------------------------------------------------------

     81 S9V     2/12/1997  6961.63  +5.0%  Paper Loss  =  1.8%
     LA/MA     ANNROC          P        IP21        V-I         Opct
             1.025         .35              +59      .103      -6          .021
             Also S9s on  2/14/97, 2/18 and, 2/19
             Reversed:   6611.05   4/1/97  B17
             The signal above is an Sell S9V.  It is the V-Indicator'e negativity that produces the Sell.
------------------------------------------------------------------------------------------------------------------------------------------------------------------------------------------
-------------------------------------------------------------------------------------------------------------------------------------------------------------------------------------------------
    82   S9 4/22/1997   6833.59  -4.9%   Paper Loss  =  4.9%
    LA/MA     ANNROC          P        IP21       V-I         Opct
     1.03        .052             -172      .075         -48         .046
    S9         4/23/1997   6812.72       -5.2%
    S9         4/24/1997   6792.25       -5.6%
    S9         4/28/1997   6783.02       -5.5%
    Paper loss =  4.9%
    Reversed:   7169.53 5/9/97    B4
------------------------------------------------------------------------------------------------------------------------------------------------------------------------------------------
    83   S9  7/8/1998    9174.97   +16.8%  Paper  Loss = 1.5%
    LA/MA     ANNROC      P        IP21       V-I         Opct
          1.03          .141          + 2      -.025       -17        .058
         Reversed:  7632.53 10/1/98   B9
------------------------------------------------------------------------------------------------------------------------------------------------------------------------------------------
    84    S9 9/23/1998   8154.41   +6.4%    No Paper Loss
    LA/MA     ANNROC          P        IP21       V-I         Opct
    1.026          .616          -201      .018       -90        -.051
    S9          9/ 25/ 1998   8028.77   +4.9%
    S9          9/ 28/ 1998   8108.84   +5.9%
    S9          9/ 29/ 1998   8080.52   +5.5%
          Reversed:  7632.53 10/1/98   B9
          In on-going big declines, the internal strength indicators are normally much more negative
          than in a rising market that reverses with a Sell S9.  This means that much lower levels
          for the P-Indicator, etc. are not signs of another big decline.
------------------------------------------------------------------------------------------------------------------------------------------------------------------------------------------
------------------------------------------------------------------------------------------------------------------------------------------------------------------------------------------
 Note:
   The next Sell S9 are not allowed because of the bullish seasonality in the year before
   a Presidential Election for the first four months.  The magnet of 10000 was drawing prices
   upwards and the DJI was at an all-time high.
X  S9          2/ 23/ 1999   9544.42   -11.6%
    LA/MA     ANNROC          P        IP21       V-I         Opct
     1.026          .543           -254       .065       -58          .04
                Big Loss!
                This was clinched the same day.
      Reversed: 10654.67 5/24/99   B9
X  S9          3/ 9/ 1999    9693.76    -9.9%
    LA/MA     ANNROC          P        IP21       V-I         Opct
     1.033          .495            -177       .04        -52        -.141
                Big Loss!
                This was clinched the same day.
     Reversed: 10654.67 5/24/99   B9
X  S9          3/ 17/ 1999   9879.41      -7.8%
    LA/MA     ANNROC          P        IP21       V-I         Opct
     1.033          .727            -41       .045        -18        -.13
                Big Loss!
                This was clinched the same day.
    S9          3/ 19/ 1999   9903.55      -7.6%
                Big Loss!
                This was clinched the same day.
    S9          3/ 22/ 1999   9890.51      -7.7%
                Big Loss!
                This was clinched the same day.
     Reversed: 10654.67 5/24/99   B9
X  S9          3/ 29/ 1999   10006.78     -6.5%
    LA/MA     ANNROC          P        IP21       V-I         Opct
     1.027          .858            -30       .029        -2         -.12
                Big Loss!
                This was clinched on 3/30/199 with DJI at 9913.26
     Reversed:  10654.67 5/24/99   B9
X S9...S12    4/ 7/ 1999    10085.3      -5.6%
    LA/MA     ANNROC          P        IP21       V-I         Opct
    1.021          .432             -177    - .011       -41         -.138
               Big Loss!
               This was clinched the same day.
    S9          4/ 8/ 1999    10197.69     -4.5%
               This was clinced on 4/20/1999 with DJIA at 10448.55
    S9          4/ 9/ 1999    10173.83     -4.7%
               This was clinced on 4/20/1999 with DJIA at 10448.55
               10654.67 5/24/99   B9
    S9          4/ 12/ 1999   10339.51     -3.0%
               This was clinced on 4/20/1999 with DJIA at 10448.55
    S9          4/ 13/ 1999   10395.01     -2.5%
               This was clinced on 4/20/1999 with DJIA at 10448.55
    S9          4/ 14/ 1999   10411.66     -2.3%
               This was clinced on 4/20/1999 with DJIA at 10448.55
          Reversed:  10654.67 5/24/99   B9
------------------------------------------------------------------------------------------------------------------------------------------------------------------------------------------
------------------------------------------------------------------------------------------------------------------------------------------------------------------------------------------
============================================================================
    85          7/9/1999  11193.69  +7.1%   No Paper Loss
        LA/MA     ANNROC          P        IP21       V-I         Opct
        1.025        -.077           -425   - .025    -119       -.126
        Automatically reversed:   10401.23 10/4/99   B1
    Note:
    As a decline after the first Sell S9 of the year, covering at
    the lower band would have been reasonable.  It usually takes
    more than one set of Sell S9s to bring a deeper decline.

------------------------------------------------------------------------------------------------------------------------------------------------------------------------------------------
     86  S9...S12    8/17/1999   11117.07  +6.4%  Paper Loss = 1.9%
        LA/MA     ANNROC          P         IP21        V-I         Opct
        1.025        -.077        -425      - .025     -119      -.126
        Paper Loss = 2%
        S9   8/20/ 1999   11100.6   +6.3%
        S9   8/23/ 1999   11299.76  +8.0%
        S9   8/24/ 1999   11283.3   +7.8%
             Reversed:  10401.23 10/4/99   B1

------------------------------------------------------------------------------------------------------------------------------------------------------------------------------------------
     86  S9 12/10/1999   11224.70  -0.3%   Paper Loss = 0.3%
        LA/MA     ANNROC          P        IP21        V-I         Opct
        1.021        .68              -391       .01        -60         .001
         Reversed:  11257.43 12/17/99   B13

----------------------------------------------------------------------------

     87 S9  12/28/1999  11476.71  +12.8%   Paper loss = 2.1%
        LA/MA     ANNROC          P         IP21       V-I         Opct
        1.026          .52              -315   - .052      -85         .157
                    Reversed:   10963.80  2/4/2000   B17
                   As this was the 3rd Sell S9 in 4 months, a decline below the lower band should have been
                   expected.  A testing of the

------------------------------------------------------------------------------------------------------------------------------------------------------------------------------------------
     88 S9 8/14/2000   11176.14  +4.3%   Paper loss = 1.2%
        LA/MA     ANNROC          P         IP21       V-I         Opct
                    1.039          .403            32      - .004      -53          .222
         Reversed:   8759.13  10/2/01   B2


------------------------------------------------------------------------------------------------------------------------------------------------------------------------------------------

             89 S9  8/22/2000  11139.15  +4.0%   Paper loss = 1.5%
           LA/MA     ANNROC          P        IP21       V-I         Opct
                    1.027        .499            108        .023        -5           .392
                   8/23/ 2000   11144.65  +4.0%
                    Reversed:   8759.13  10/2/01   B2
                  This is an Sell S9V.  It is the V-Indicator'e negativity that produces the Sell
-------------------------------------------------------------------------------

       90  S9  2/5/2001  10965.85  +13.3%    No Paper Loss
        LA/MA     ANNROC          P        IP21       V-I         Opct
          1.025          .059           287       .069        -3           .039
                Reversed:   8759.13  10/2/01   B2
               This is an Sell S9V.  It is the V-Indicator'e negativity that produces the Sell

----------------------------------------------------------------------------
-----------------------------------------------------------------------------
 X  The signals below appear using the 2007 version of Peerless.
    But new versions have eliminated it.  They now consider the
    rate of recovery from the lows.
    S9          4/ 11/ 2001   10013.46  +12.5%
        LA/MA     ANNROC          P        IP21       V-I         Opct
        1.024  -.337      -140  .016  -187   .002
    The paper loss here would have been 13%.
    S9          4/ 12/ 2001   10126.94  +13.5%
    S9          4/ 16/ 2001   10158.56  +13.8%
   Reversed: 8759.13  9/19/01   B16
-----------------------------------------------------------------------------
 X  The signals below appear using the 2007 version of Peerless.
    But new versions have eliminated it.  They now consider the
    rate of recovery from the lows.
    S9.     10/ 10/ 2001  9240.86    -0.2%
        LA/MA     ANNROC          P        IP21       V-I         Opct
        1.032  -1.409     -212 .053    -245  -.258
    S9          10/ 11/ 2001  9410.45    +1.6%
    9263.9   11/1/01   B9
--------------------------------------------------------------------
    91  S9   2/26/2002   10115.26  +19.0%   Paper loss = 5.1%
        LA/MA       ANNROC          P                    IP21         V-I         Opct
        1.027  .333       68         .047  -160  -.062
                        high
        S9  2/ 27/2002   10127.58  +19.1%
        LA/MA     ANNROC           P                    IP21         V-I         Opct
        1.027   .316      93         .02   -147  -.055
                             high
      Reversed:  8191.25  7/24/02   B19
               This is an Sell S9V.  It is the V-Indicator'e negativity that produces the Sell
------------------------------------------------------------------------------------------------------------------------------------------------------------------------------------------
     92  S12, S9  5/17/2002   10353.08  +20.9%   No Paper Loss
        LA/MA     ANNROC          P                    IP21         V-I         Opct
        1.028   .175      48         .018   -148   .079
        Reversed:  8191.25  7/24/02   B19
         This is an Sell S9V.  It is the V-Indicator'e negativity that produces the Sell S9.
---------------------------------------------------------------------------
     93  S9  8/8/2002   8712.02  +4.6%    Paper loss = 3.9%
        LA/MA     ANNROC          P                    IP21         V-I          Opct
        1.039  -.144    -271      .063   -327  -.254
        also S9 8/12/202  8688.89 -5.4%
        Reversed:  8191.25  9/3/02   B9
        Note
        After such a long and brutal decline, we should look
        for a test of the lows and not buy prematurely at the lower band.
        This is worthy of more study.
-----------------------------------------------------------------------------
      94  S9  8/16/2002   8778.06  +5.4%   Paper loss = 3.1%
        LA/MA     ANNROC          P                    IP21         V-I         Opct
        1.028   .175      48         .018   -148   .079
        also S9 8/12/202  8688.89 +5.4%
        Reversed:  8191.25  9/3/02   B9
        Note
        After such a long and brutal decline, we should look
        for a test of the lows and not buy prematurely at the lower band.
        This is worthy of more study.

=============================================================================

    This was a SPECIAL S9 -
    P-I turns negative after being positive for 100 days
    and DJI is above 21-dma.
    S9      2/20/2004   10619.03   +6.1%  No Paper Loss
        LA/MA      ANNROC          P                    IP21         V-I         Opct
        1.028   .175     -9         .018   -148   .079
             Reversed:  9968.51  5/18/04   B2
==============================================================================
    94  S9  5/5/2006    11577.74   +4.9%  Paper loss = 0.6%
        LA/MA     ANNROC          P                 IP21         V-I         Opct
        1.026  .357     -10              .035       -62  .158
        S9  5/8/2006    11584.54   +4.9%
        Reversed:  11015.19  6/15/06   B14
=============================================================================
    SPECIAL S9 - P turns negative after being positive for 100 days
    and DJI is above 21-dma.
               1/ 5/ 2007    12398.01   +2.3%   No Paper Loss.
        LA/MA       ANNROC          P                    IP21         V-I         Opct
        1.021   .11      -8        .017   -119   .112
        Reversed:  12207.59  3/6/07    B19
=============================================================================
      95  S9   7/17/2007   13971.55   +4.9%  Paper Loss =   0.2%
        LA/MA           ANNROC          P            IP21           V-I         Opct
        1.028    .291    -27  -.083  -121  .068
        S9  7/18/2007   13918.22   +4.4%
        S9  7/19/2007   14000.41   +5.1%
        S9  7/23/2007   13943.42   +4.7%
        Reversed:   13289.29  8/29/07   B14

------------------------------------------------------------------------------------------------------------------------------------------------------------------------------------------
       96 S9  12/7/2007   13625.58   +3.4%   Paper Loss =   0.7%
        LA/MA        ANNROC          P               IP21              V-I         Opct
        1.034    .295     -15   -.035   -105   .032
        Reversed:   11899.69  3/7/08    B8

------------------------------------------------------------------------------------------------------------------------------------------------------------------------------------------
        97  S9  3/24/2008   12548.64   +9.3%  Paper Loss =   4.1%
        LA/MA        ANNROC          P               IP21           V-I         Opct
        1.024     .257     -209      .116     -208   .072
        S9  3/25/2008
        Reversed:  11384.21  7/8/08    B2

------------------------------------------------------------------------------------------------------------------------------------------------------------------------------------------

        98  S9 4/2/2008    12608.92   +9.7% Paper Loss =   3.6%
        LA/MA        ANNROC          P             IP21           V-I         Opct
        1.031   .341        -75     .042    -185   -.059
        S9...S4     4/ 3/ 2008    12626.03   +9.8%
        S9          4/ 4/ 2008    12609.42   +9.7%       )
        Reversed: 11384.21  7/8/08    B2
------------------------------------------------------------------------------------------------------------------------------------------------------------------------------------------

        99   S9  5/2/2008    13058.20   +9.7%  No Paper Loss
        LA/MA        ANNROC          P             IP21           V-I         Opct
        1.031   .341        -75     .042    -185   -.059
        Reversed: 11384.21  7/8/08    B2

------------------------------------------------------------------------------------------------------------------------------------------------------------------------------------------
        100  S9    7/23/2008  11632.38   +6.1%  Paper Loss =   1.3%
          LA/MA        ANNROC          P                    IP21           V-I         Opct
          1.022      -.22     -266       -.002   -211  .052
          Reversed: 10917.51  9/15/08   B8

------------------------------------------------------------------------------------------------------------------------------------------------------------------------------------------

         101  S9    7/30/2008   11583.69   +5.8%   Paper Loss =   1.7%
          LA/MA        ANNROC          P                     IP21        V-I         Opct
          1.023      .246    -105      .058    -158  .146
          Reversed: 10917.51  9/15/08   B8

------------------------------------------------------------------------------------------------------------------------------------------------------------------------------------------

          102 S9  8/8/2008      11734.32   +7.0%    No Paper Loss
          LA/MA        ANNROC          P                   IP21           V-I         Opct
          1.03       .529        91         .088      -81    .071
          Reversed: 10917.51  9/15/08   B8
          This is an Sell S9V.

------------------------------------------------------------------------------------------------------------------------------------------------------------------------------------------

          103   S9, S12      11/13/2009    10270.47   -0.4%  Paper Loss =   3.2%
          LA/MA        ANNROC          P                 IP21           V-I         Opct
          1.027  .247     -110      -.007    -216    .081
          10172.98  1/22/09   B17
                        Reversed:    10308.26   12/17/09  B13
------------------------------------------------------------------------------------------------------------------------------------------------------------------------------------------

          104 S9    6/17/2010    10434.17  +6.3%   Paper Loss =   0.1%
          LA/MA        ANNROC           P                   IP21           V-I          Opct
          1.028     -.09       92         .038    -107  -.115
          Reversed: 9773.02   6/30/10   B8
                        This is an Sell S9V.
------------------------------------------------------------------------------------------------------------------------------------------------------------------------------------------

         105  S9    7/26/2010   10542.43   +2.6%  Paper Loss =   1.5%
          LA/MA        ANNROC           P                    IP21           V-I          Opct
          1.041   .459       442        .166     -11   .037
                          high
         2 Follow-up S9s from 7/27/2010 - 7/28/2010
         Reversed :10698.75 8/19/10   B17
                      This is an Sell S9V.
------------------------------------------------------------------------------------------------------------------------------------------------------------------------------------------

          106  S9V    8/9/2010  12569.87   +4.0%     No Paper Loss
          LA/MA        ANNROC           P                  IP21           V-I          Opct
          1.025   .572       477       .246    -15     .047
                          high
          Reversed : 10698.75 8/19/10   B17
                          This is an Sell S9V.
------------------------------------------------------------------------------------------------------------------------------------------------------------------------------------------
------------------------------------------------------------------------------------------------------------------------------------------------------------------------------------------

         107 S9V     5/2/2011     12807.36 +5.9%   No Paper Loss
         LA/MA        ANNROC           P                IP21           V-I          Opct
         1.028    .467     212      .147    -17    .332
                         high
                 5/3/2011     12807.51    +5.9%
         LA/MA        ANNROC           P                 IP21           V-I          Opct
         1.027   .412        113      .154     -47    .335
                         high
         Reversed : 6/8/2011  12048.94
          This is an Sell S9V
----------------------------------------------------------------------------

        107  S9V     7/5/2011     12569.87   +10.3%  Paper Loss =   1.2%
         LA/MA        ANNROC           P                   IP21           V-I          Opct
         1.037     .412       239      -.034     -48    .081
                 7/6/2011     12626.02   +10.7%
         LA/MA        ANNROC           P                     IP21           V-I          Opct
         1.039     .526       345         .004     -10    .163
         Reversed : 8/12/11 8/11/11    B7
          This is an Sell S9V

-----------------------------------------------------------------------------
         108 S9V     7/21/2011     12724.41   +12.4%  No Paper Loss
         LA/MA        ANNROC           P             IP21         V-I          Opct
         1.025   . 513      269     .085    -51   .005
                      Reversed : 12048.94  6/8/11   B17
------------------------------------------------------------------------------------------------------------------------------------------------------------------------------------------

          109 S9     8/30/2011    11559.95    +6.8%  Paper Loss =   4.1%
          LA/MA        ANNROC           P                   IP21           V-I          Opct
          1.025     -.603      7         -.018    -224    .144
          S9          8/31/2011    11613.53    +7.3%
          Reversed :    10808.71  10/4/11   B19
------------------------------------------------------------------------------------------------------------------------------------------------------------------------------------------

          110 S9      12/5/2011     12097.83   +2.7%  No Paper Loss
          LA/MA        ANNROC           P                    IP21           V-I          Opct
          1.022      .054     -62         -.006     -77   .006
            Reversed : 11766/26  12/19/11  B13
==========================================================
         Number of trades =  110
                  Avg. Gain=      %  Median Gain =  %
                  Losses =
                              Losses over 5% =
                 Gains = 92  (80%)             Cases
                               Gains over 1% = 88                      1%-2%        2 cases
                               Gains over 2% = 86                      2%-3%        4 cases
                               Gains over 3% = 82                      3%-4%        8 cases
                               Gains over 4% = 74                      4%-5%        9 cases
                               Gains over 5% = 63  (52.1%)       5%-6%      13 cases
                               Gains over 6% = 50  43.5%)        6%-8%      13 cases
                               Gains over 8% = 37  (32.2%)       8%-10%      4 cases
                               Gains over 10% = 33  (28.7%)     10%-20%  14 cases
                               Gains over 20% = 19  (16.5%)      >20%        19 cases
