There are two different Sell S8s. One is for Extreme Bear Markets like those
seen between 1929 and 1932. We can also apply them profitably in the deep bear
market of 1937-1938. None took place in 2008-2009. The second type of Sell S8,
which is presented further below, occurs in more normal market environments.
It is easy to distinguish the two Sell S8s. The first occurs on profound weakness
and only shows up on a chart when the user chooses to apply the "Extreme Bear
Market" signals. The second occurs only in a bull market.
The Two Different Sell S7s
Extreme/Deep Bear Market Sell S8s
The IP21 falls below -.21 for the first time in 30 trading days.
19300929 S8 208.1 .129 -.218
19310415 S8 164.7 .397 -.221
19311208 S8 86.5 .080 -.287
19320401 S8 72.2 .345 -.223
19320607 S8 47.5 .099 -.238
19380325 S8 108.6 .089 -.262
19380620 S8 118.6 -.042 -.269
none in 2008-2009
-------------------------------------------------------------------------------
No.= 7 Avg. = .157
Normal
Market Mode Sell S8s
There have been 21 "normal" Sell S8s. The average DJI decline at the time
of the next Peerless Buy was 9.2%. Both losses occurred in June of 1987. Much bigger
gains from short sales on the Sell S8 would have been made in the year after the Presidential
Election. Besides in Junes (1.0%), the smallest average declines on these Sell S8s took
place in Presidential Election Years (5.6%) and in the last 10 days of the month (6.0%).
Trading results if one had shorted the DJI on these normal Sell S8s.
>10% 4
5%-9.99% 7
2%-4.99% 4
0%-1.99% 0
Losses 2
Normal Market
Mode Sell S8s: 1928-2013 19370816 S8 189.3 .376
19410714 S8 127.9 .135
19430602 S8 142.4 .044
19500518 S8 220.6 .058
19550727 S8 468.5 .044
19550920 S8 483.7 .053
19720530 S8 971.18 .056
19790822 S8 885.84 .087
19870610 S8 2353.61 -.039
19870618 S8 2408.13 -.016
19871005 S8 2640.18 .341
19900717 S8 2999.75 .182
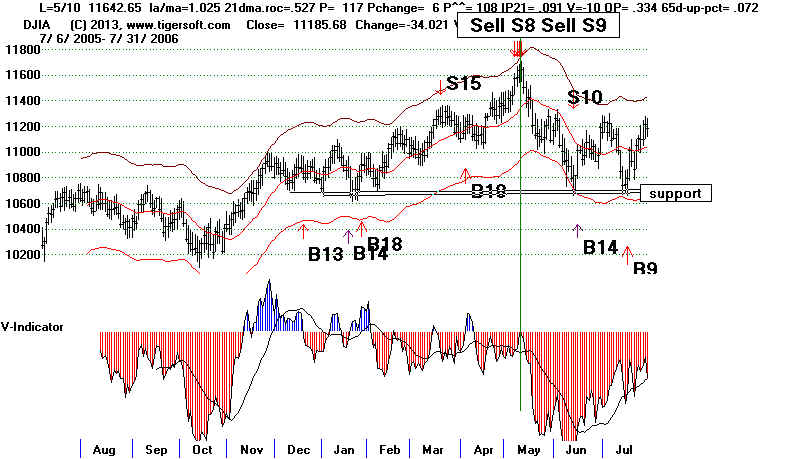
20060505 S8 11577.74 .049
20090608 S8 8764.49 .05
20110502 S8 12807.36 .051
20120919 S8 13577.96 .056
20130712 S8 15464.3 .037
-------------------------------------------------
no. = 17 Avg. = .092
PE 2 .056 (low)
PE +1 4 .150 (high)
PE +2 3 .096
PE +3 8 .071
January      0    ---
February     0    ---
March        0    ---
April        0    ---
May          4   .054
June         4   .010  (very low)
July         4   .100
August       2   .232
September    2   .055
October      1   .341
November     0    ---
December     0   ----
1-10 5 .107 11-20 8 .099 21-31 4 .060 (low)
|
==========================================================================================================
edited 4/15/2013 (C)
2013 Wm. Schmidt, Ph.D.
Sell S8s occur after very low volatility after an advance.
They put to practice the old adage that dullness after a big rally is often bearish.
A Sell S8 can occur when there is less than 0.1% change in DJI prices
for three straight days or when there is less than 0.03% change for two
days and the V-Indicator is negative above the 2.4% upper band. They
can only occur between late April and October. The DJI must not be
above the 3.6% upper band. Too much strength is shown if they are.
See May 1990. For the same reason, they are not allowed for 15 trading
days after a Buy B4. (Example of this would be 8/22/1979).
These are seldom, if ever, the only Peerless Sell signal at a top.
But they do serve to reinforce these signals. Their success from
May to October emphasizes the power of the typical bearish
seasonality then.
I first noticed that unusually low volatility can call a major top back in early
October 1987. Look how how close to each other the three closings were
just before the market collapsed in 1987. Two days in a row with almost
no change and negative V-Indicator readings also can be important turning
points, too.
10/1/1987 2639.2
10/2/1987 2640.99 change +.000678
10/5/1987 2640.18 change - .000307
....
10/19/1987 1738.74
The 2007 top also showed a similar pattern:
7/17/2007
13971.55
7/18/2007 13918.22
7/19/2007 14000.41
in 2006,
5/8/2007 11584.54
5/9/2005 11639.77
5/10/2005 11642.65
in 1994
1/31/1993 3978.36
2/1/1994 3964.01
2/2/1994 3975.54
but failing in 1991 was
1/7/1992 3204.83
1/8/1992 3203.94
1/9/1992 3209.53
1/10/1992 3199.46
Consider 2007
7/17/2007 13971.55
7/18/2007 13918.22
7/19/2007 14000.41
Sell
S8 - 4/14/2013
3-Days in a Row with Almost Zero Change
Three days in a row with such low volatility is unusual. Here
are the
cases going back to 1965 where the daily change is less than 0.1% and
the DJI is in a rising trend, along with the the outcomes. Red indicates a decline.
It seems best to not apply this rule from the beginning of November to
late April. These exceptions are months with a strong upwards seasonal
bias.
As developed now, this signal would have been consistently profitable,
assuming that a paper loss of 3.4% would have been used.
#1
9/19/2012 DJI fell
from 13577.96 to 12588.31 on 11/16/2013 no paper loss
9/19/2012
1.024 .275 290 38 290 .023 35 .213 .061
Also a Sell S4 +3.5 no paper loss
#2
5/3/2011 DJI fell
from 12807.51 to 11879.27 on 6/15/2011
no paper loss
5/3/2011
1.027 .412 113 -99 113 .154
-47 .335 .076 also Sell S9 +5.9% no paper loss
#3
6/9/2009 DJI
fell from 8763.06 to 8146.52 on 7/10/2009
no paper loss no paper loss
6/9/2009
1.03 .264 182 -76
170 .047 -152 .057 .243 also Sell S7 +5.0%
X 11/10/2004
DJI rose from 10386.37 to 10827.12 on 12/23/2005
11/20/2004 1.034
.366 352 36 329 .033 35 .052
.042
4+% paper loss
Novembers S8s are not safe. The month is too strong.
X (1/7/2004 DJI fell from 10529.03 to 10063.64 on 3/23/2004 2.0% paper loss)
1/7/2003
1.027 .776 525 27 492 .186
120 .215 .09 also S12 + 5% no paper
loss
Early Januaries are
often pivot months, but the program eliminates all Januaries.
X (1/13/2003 DJI fell from 8785.98 to 7524.06 on 3/11/2003. no paper loss
1/13/2003 1.028
.274 195 -12 189 .049 -32
-.054 .17 also S12 + 5% no paper loss
Early Januaries are often pivot
months, but the program eliminates all Januaries.
#4
7/28/1997 DJI fell
from 8121.11 to 7161.15 on 10/2797
1.6% paper loss
7/28/1997 1.024
.703 277 6 338 .098
21 .38 .163 Also S11 +3.1%
1.6% paper loss
X
(2/25/1991 DJI went sidewise for 10 months.)
2/2/1991 1.025
1.038
341 -26 629 .203 36 .087 123
very high
Februaries are not
allowed.
X
5/16/1990 DJI rose from 2819.68 to 2999.75 before starting a bear
market. 6.4% paper loss
5/16/1990 1.038 .236 -11 3 -22
.06 4 .246 .071
too high
X
3/2/1988 DJI fell from 2071.29 to
1941.48 on 5/23/1988. 1.7% paper loss
3/2/1988
1.04 .76 190 10
326 .128 13 .01
.077 Also S1 +4.5% 3.3% paper loss)
too high
Marches are not
allowed.
X (2/24/1988
DJI fell from 2039.95 to 1941.48 on
5/23/1988. Also S1 +4.5% 3.3% paper loss)
2/24/1988
1.039 .568 188 -29 323 .087 11
-.078 .07
too high
Februaries are not allowed.
#5
10/5/1987 DJI fell from
2640.18 to 1738.74 on 10/19/2007. no paper loss
10/5/1987 1.025
.188 -47 9 -91 -.006
-3 .069 .077 also S9/S12
+30.0% no paper loss
#6
6/18/1987 reversed at a
small loss by Buy B4.
6/18/1987 1.035 .96 187 49 370
.084 21 .388 .051 also S9/S12 Loss = 1.6% Paper loss = -1.6%
#7 6/10/1987 1.025 .241 -14
-27 .016 1 .022 .039 also S9/S12 Loss = 3.9% Paper loss = -3.9%
X (2/5/1987 reversed at a
small loss by Buy B4. )
X
(12/28/1986 reversed at a small loss
by Buy B4.)
X
(12/20/1985 This fails, but Decembers are too bullish a month to
use this signal.)
#8
8/22/1979 DJI fell from 885.84 to 796.67 on
11/7/1970. 1.7% paper loss
X
( 1/23/1967 Late Januaries are too bullish to apply the signal here.)
#9
4/17/1963 DJI fell to 687.8 on 7/23/1963.
Paper loss = 2.2%
#10
9/20/1955 DJI fell from 483.7 to 438.6 on
10/11/1955.
Paper loss
= 0.8%
#11
5/25/1948 DJI fell from 189.7 to 173.2 on 12/1/1948.
Gain = +1.8% Paper loss = 1.8%
#12 7/14/1941 DJI fell from
127.9 to 106.3 on 12/23/1941. Gain = +16.9% Paper loss = 1.7%
Sell S8 - 4/14/2013
2-Days in a Row with Almost Zero
Change
with Negative V-Indicator at Upper Band.
May to October only
May 2, 2011 Perfect sell before drop below LB Also S9/S12 +3.5% No paper
loss.
1.028 .467 212
-50 211 .147 -17 .332 .063
June 8, 2009 Perfect sell before drop below LB
1.032 .498 258 6
241 .074 -98 .149 .247
May 10, 2006 Perfect sell before quick sell-off
1.025 .527
258 6
241 .074 -98 .149 .247
July 17, 1990 Perfect sell before bear market. +18.2% No paper loss.
1.032 .262
117 6
108 .091 -10 .349 .072
October 5, 1987 Perfect sell before bear market. Also S9/S12
30,0%
1.025 .188 -47 9
-91 -.006 -3 .069 .077
September 21, 1979 Perfect sell before mini
May 30, 1972 Perfect sell before quick
X
November to April only
The DJI failed to decline 10
times. A decline resulted only three times.
4/12/2013 ????
3/19/2013 DJI continued to rally
3/12/2013 DJI continued to rally
1/5/2013 DJI continued to rally
12/21/2012 DJI continued to rally
4/11/2011 DJI continued to rally
2/2/2011 DJI continued to rally
1/25/2011 DJI continued to rally
1/4/1999 DJI rose and then fell only to lower band.
4/17/1989 DJI continued to rally
2/5/1986 DJI continued to rally.
1/9/1984 Excellent Sell before bear market.
11/23/1983 DJI fell to lower band.
12/9/1970 DJI continued to rally.
DJI is at least 1.8% over 21-day ma with P-Indicator is under 25
and V-Indicator +1. This is a signal that only occurs in May in the
year after a Presidential Election. The P-Indicator fails to confirm a
70 day price high.
Sell S8
Date DJI Gain
------------- ----------- --------
5 / 28 / 1945 168.2 Loss = -.01.... But DJI did drop to lower band first,.
la/ma= 1.018 P=9 IP21= .031 V=-68 OPct =.156
5 / 13 / 1965 938.9 Gain = .051 DJI fell 11% in 6 weeks, below lower band.
la/ma = 1.018 P=24 IP21 = .11 V=-262 OPct=.254
5 / 2 / 1969 957.17 Gain = .189 DJI began bear market
la/ma = 1.03 P=14 IP21 = .109 V= 0 OPct=.19
==========================================================