BEAR MARKET BOTTOMS
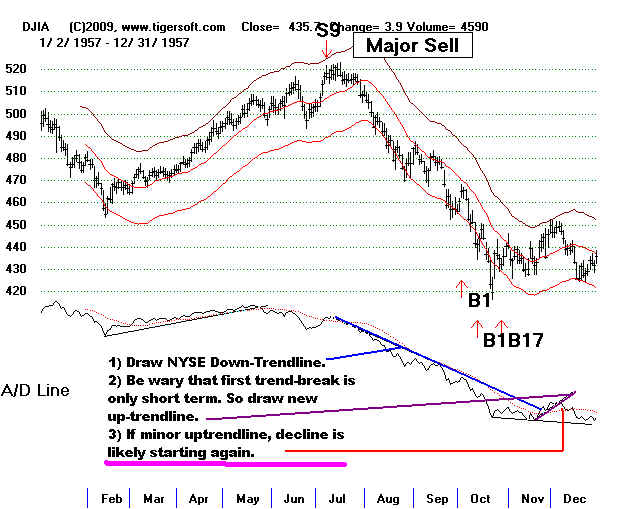
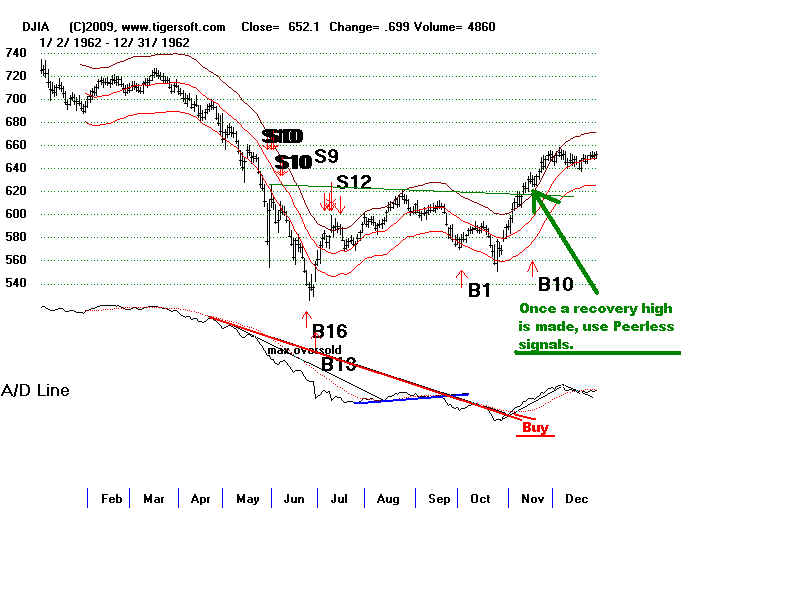
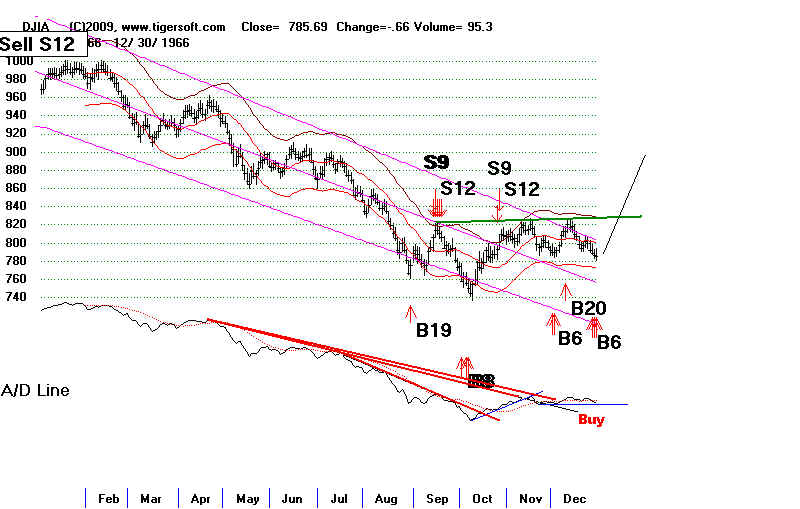
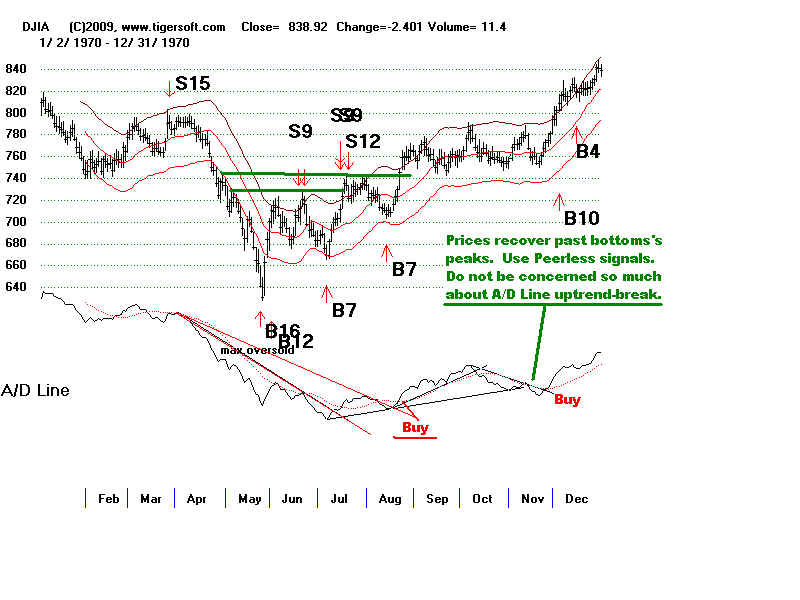
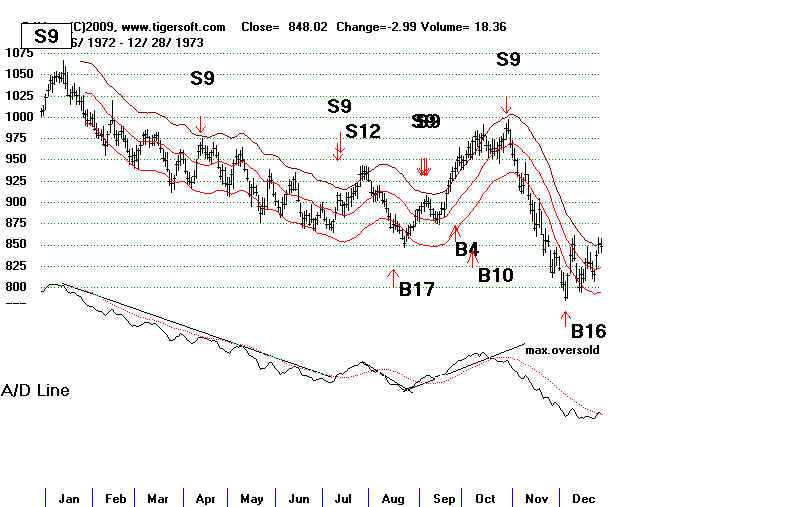
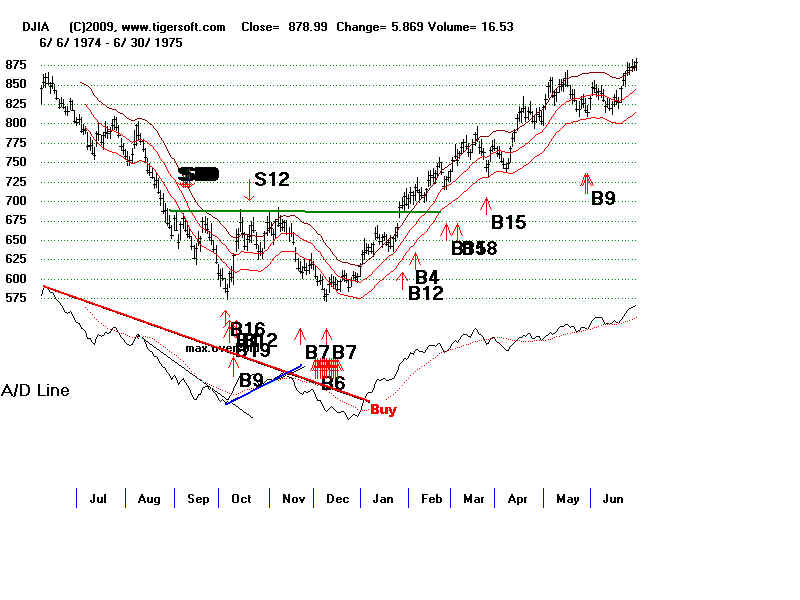
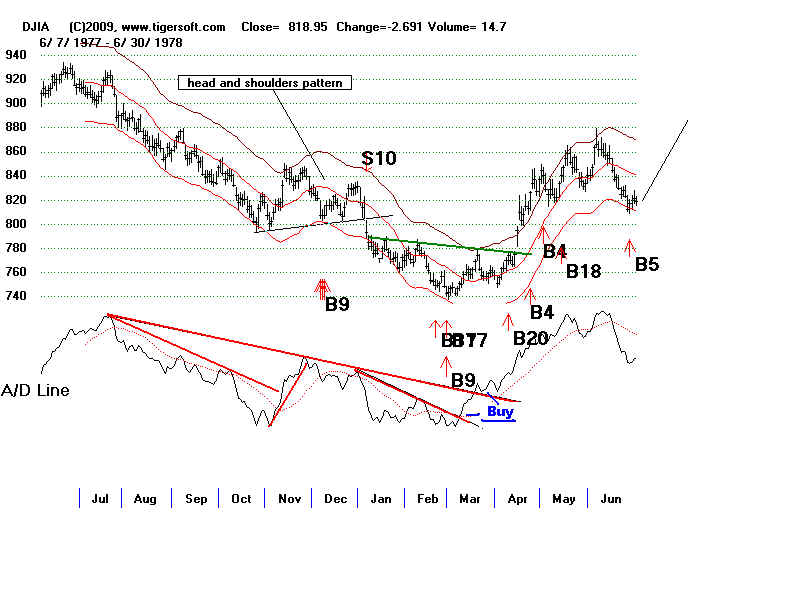
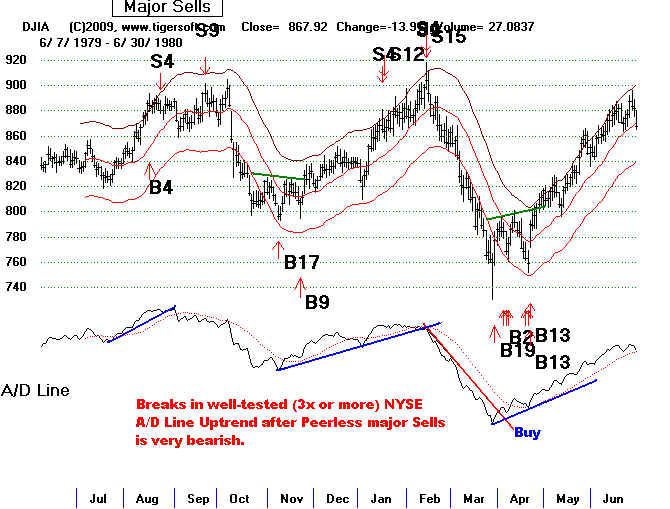
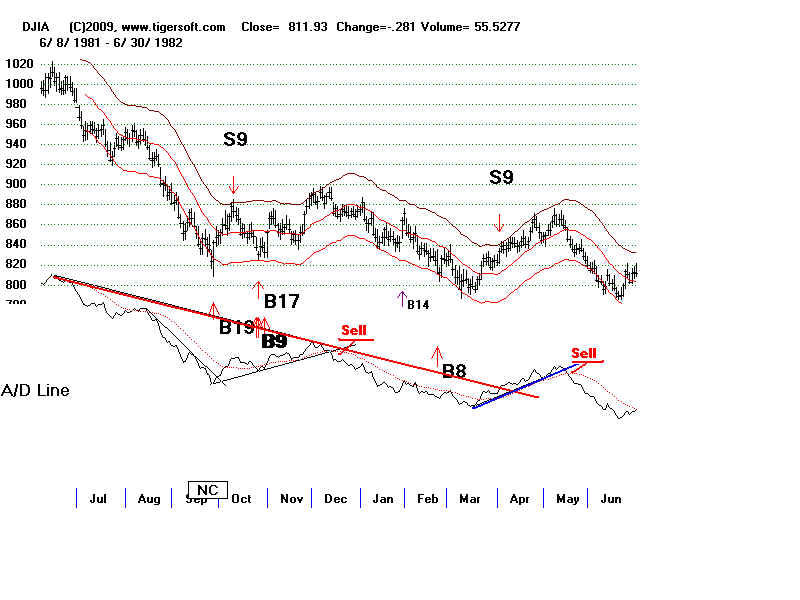
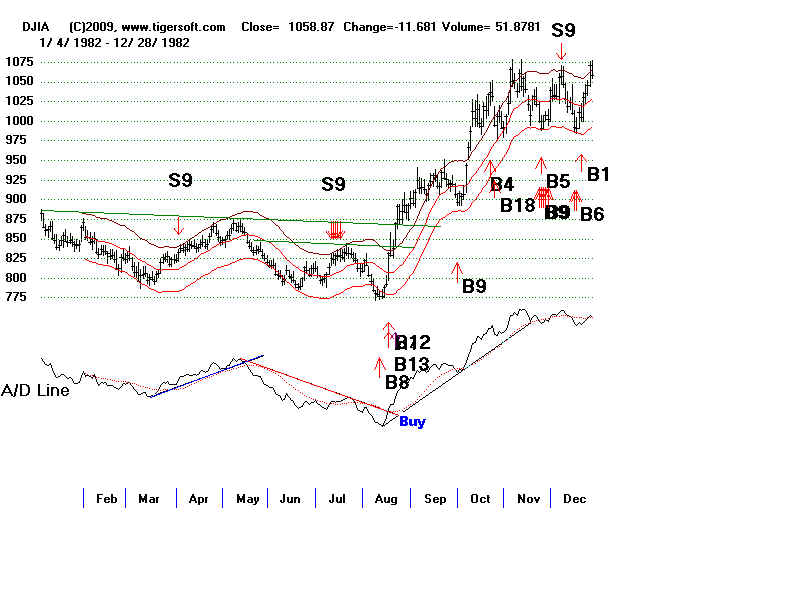
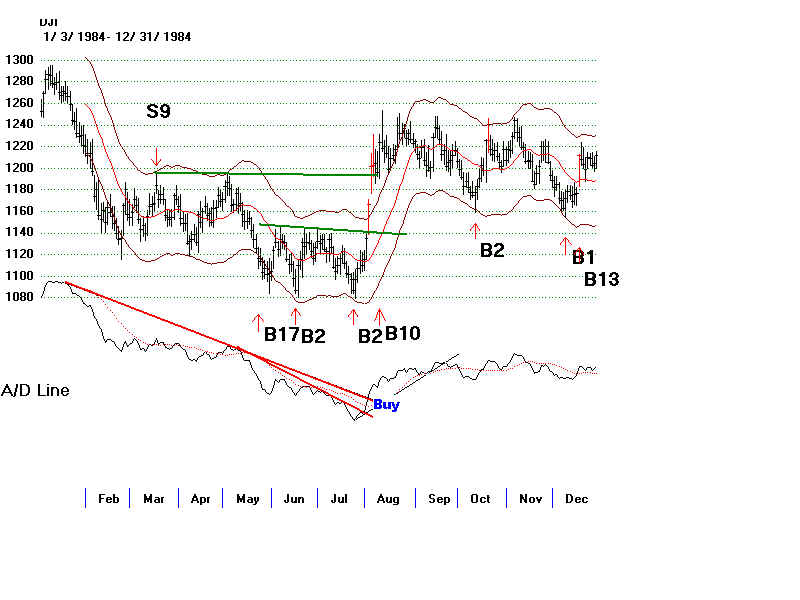
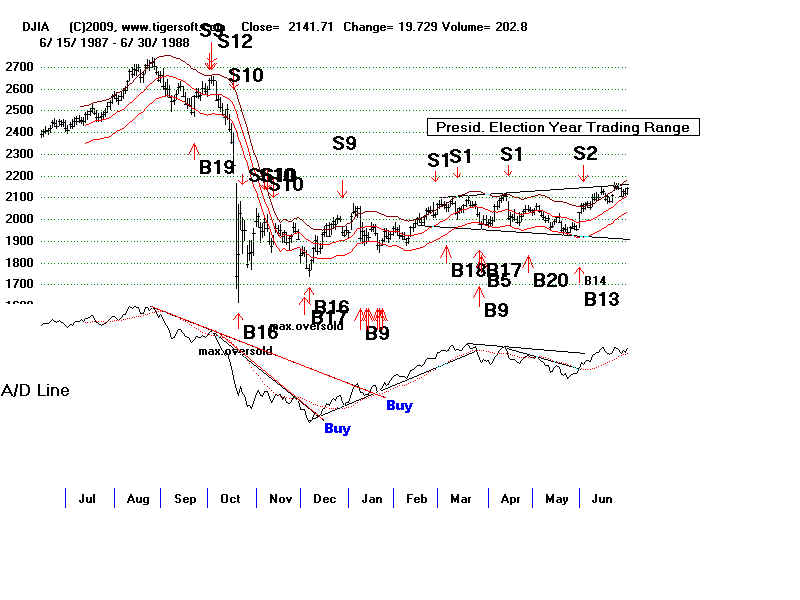
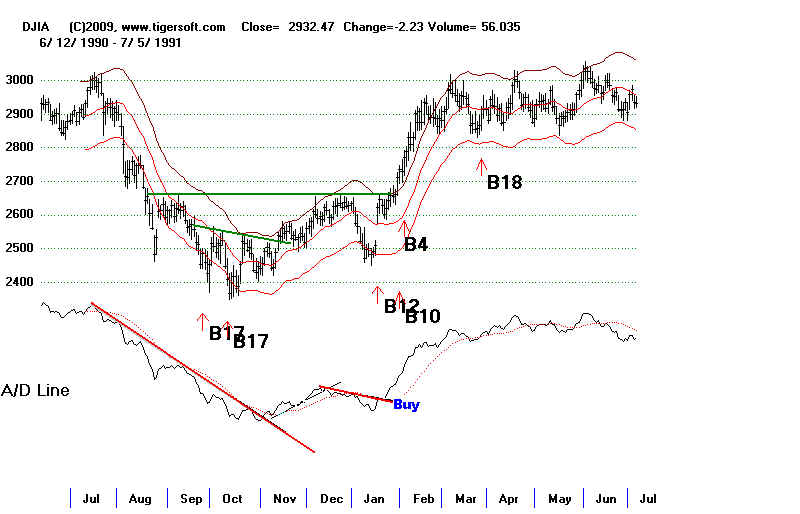
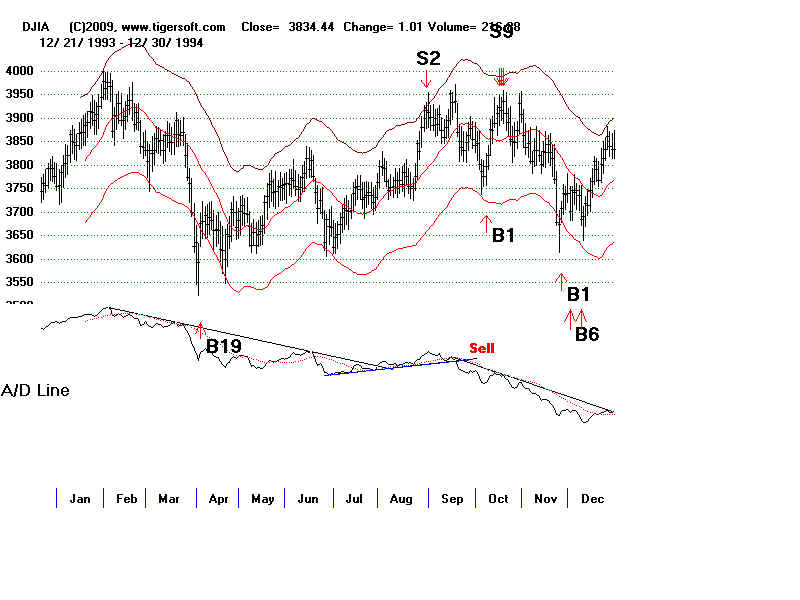
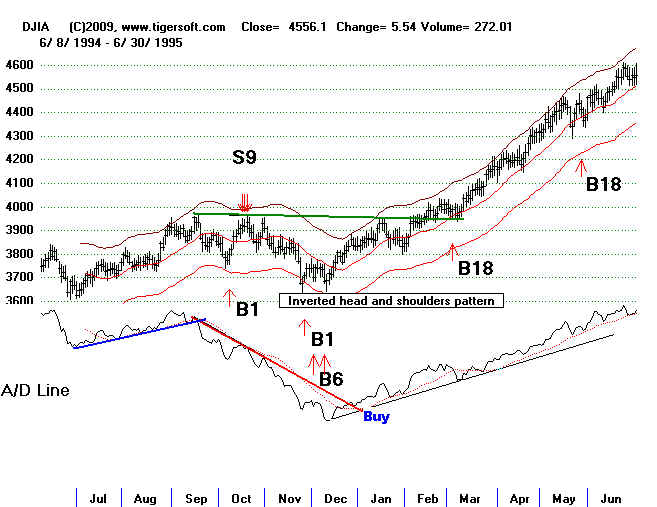
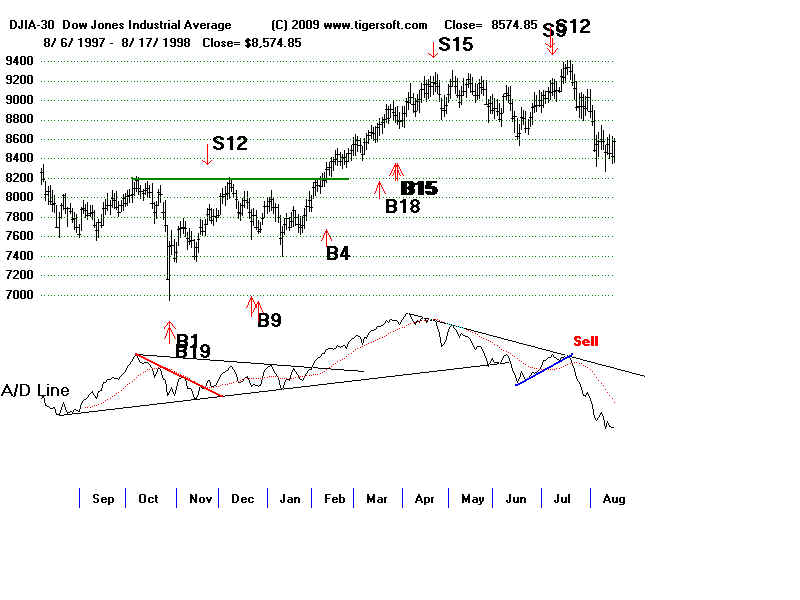
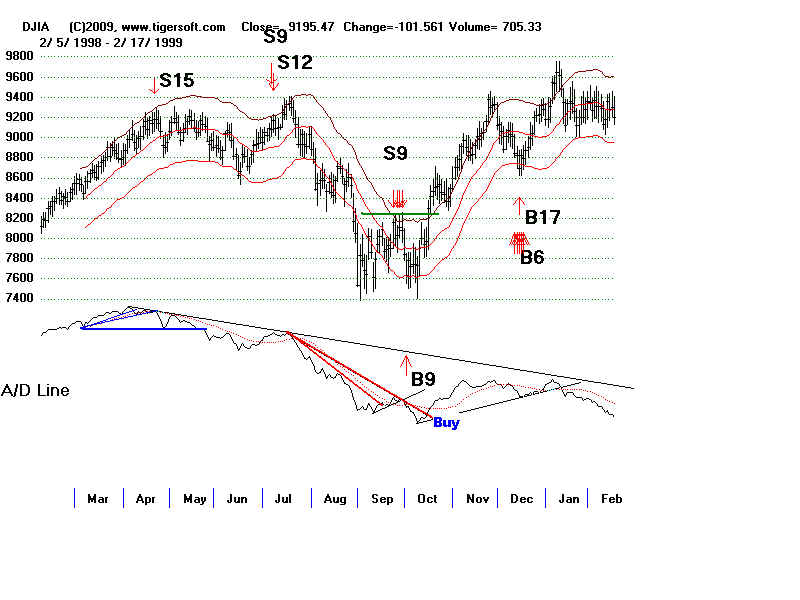
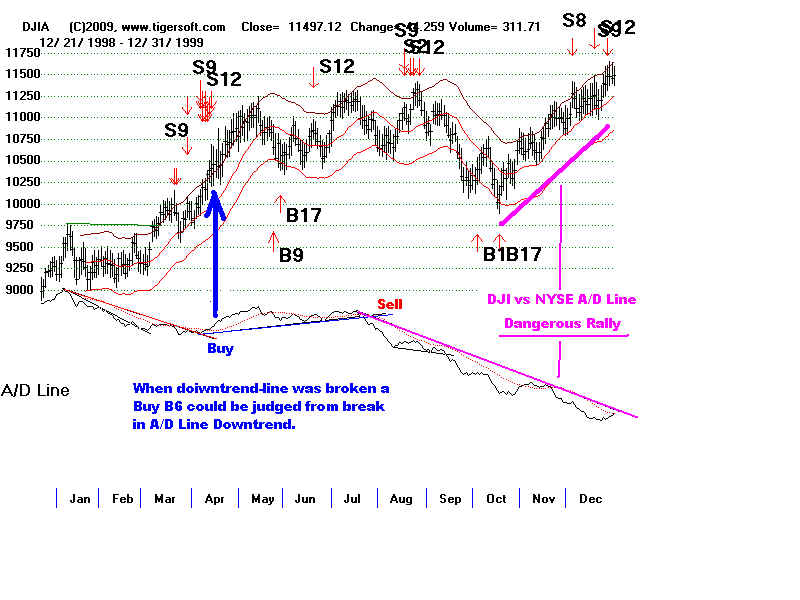
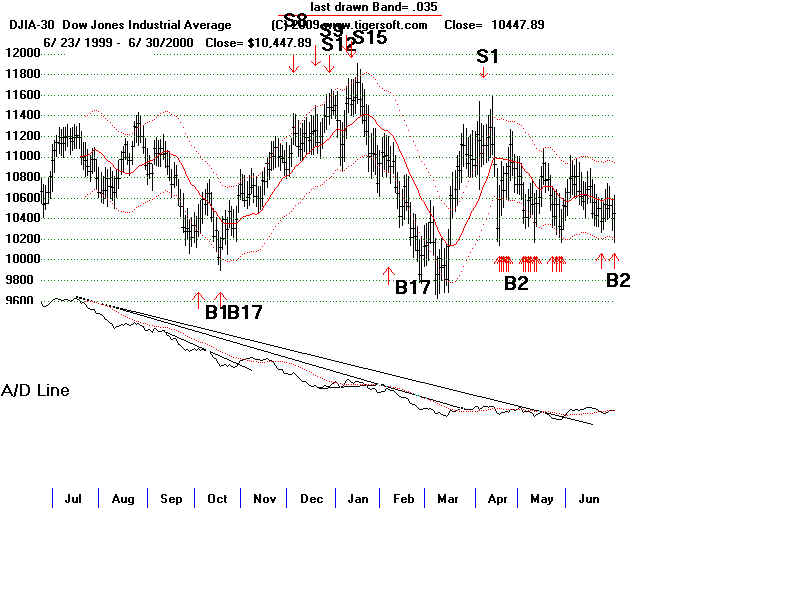
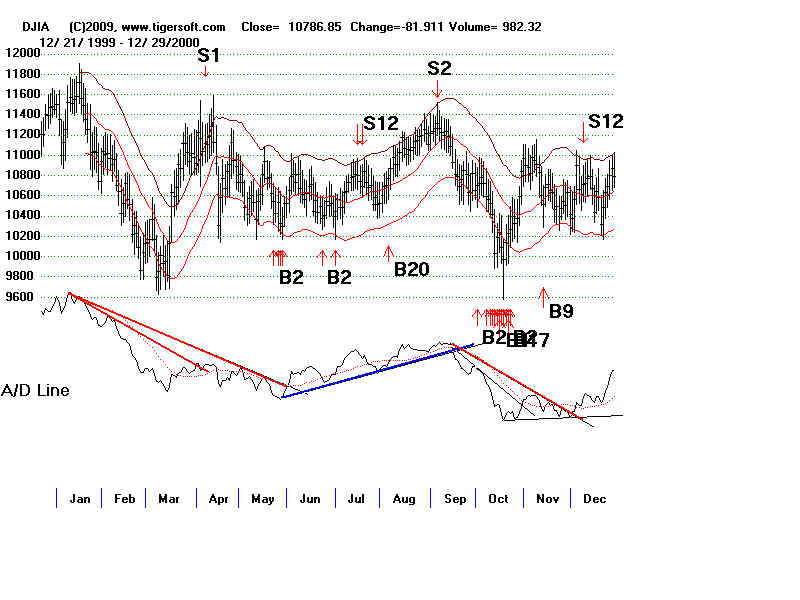
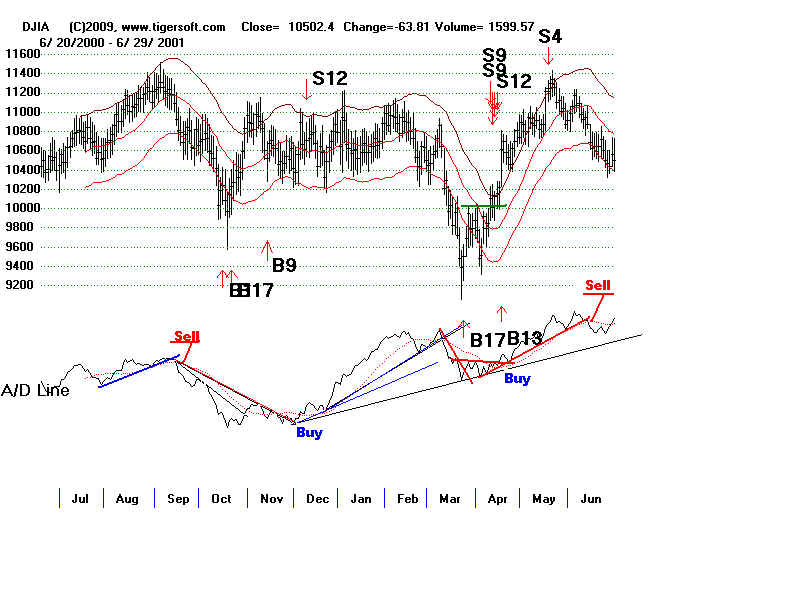
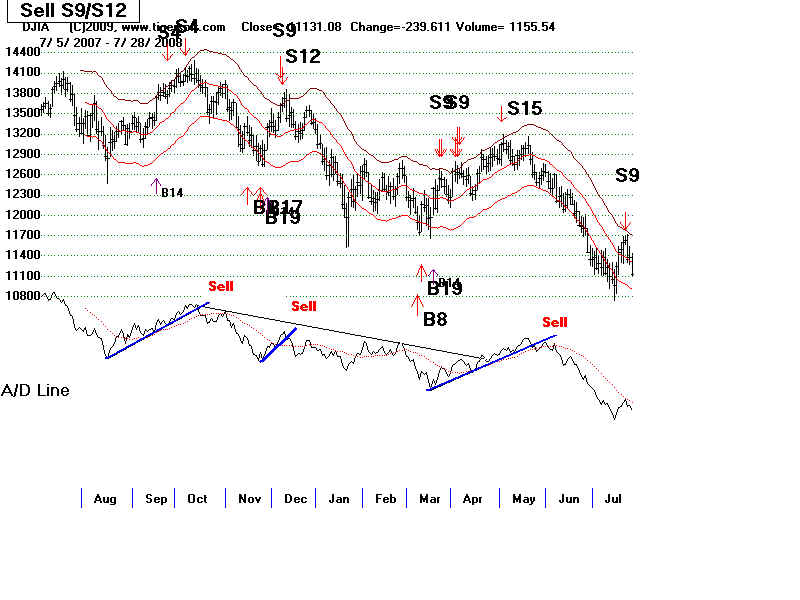
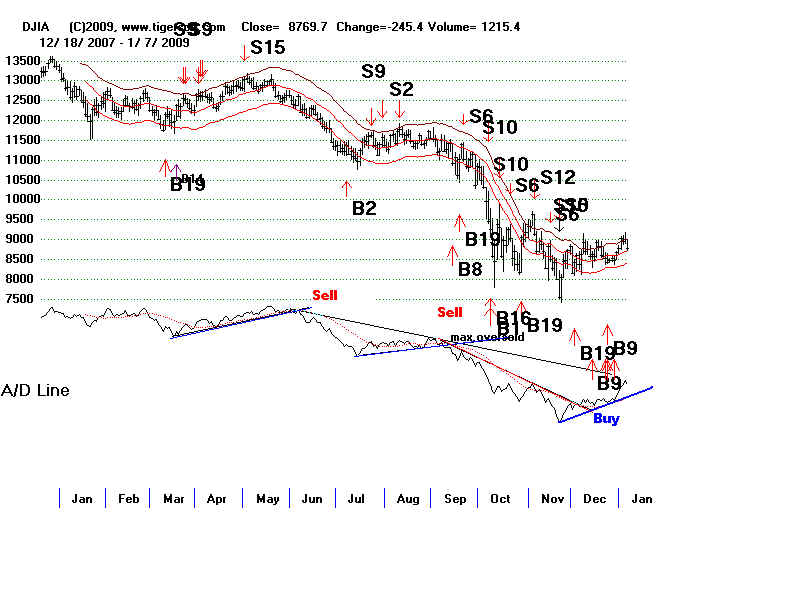
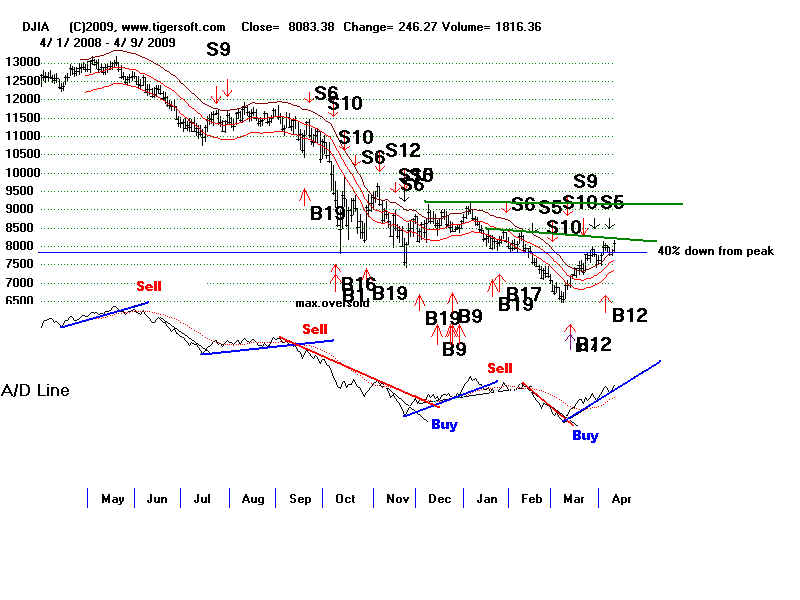
                     and NYSE A/D LINE TRENDS
                                  1959-2009

         
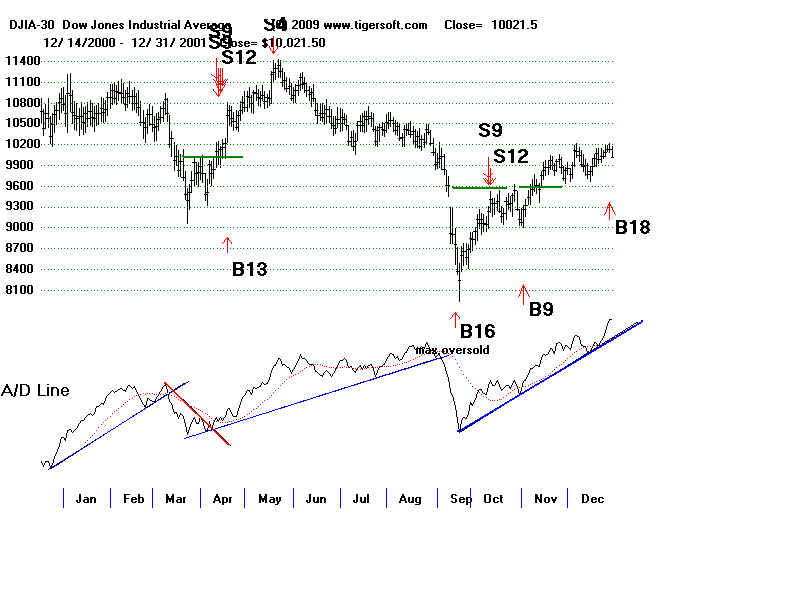
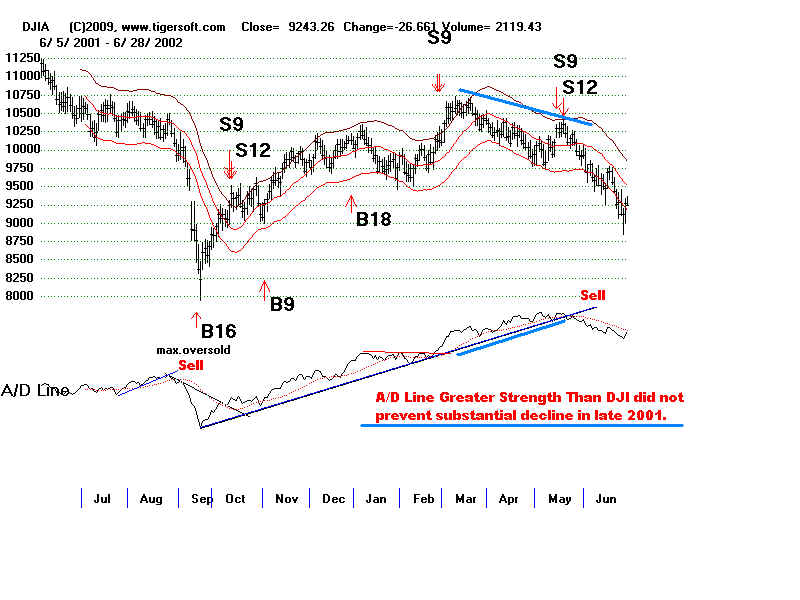
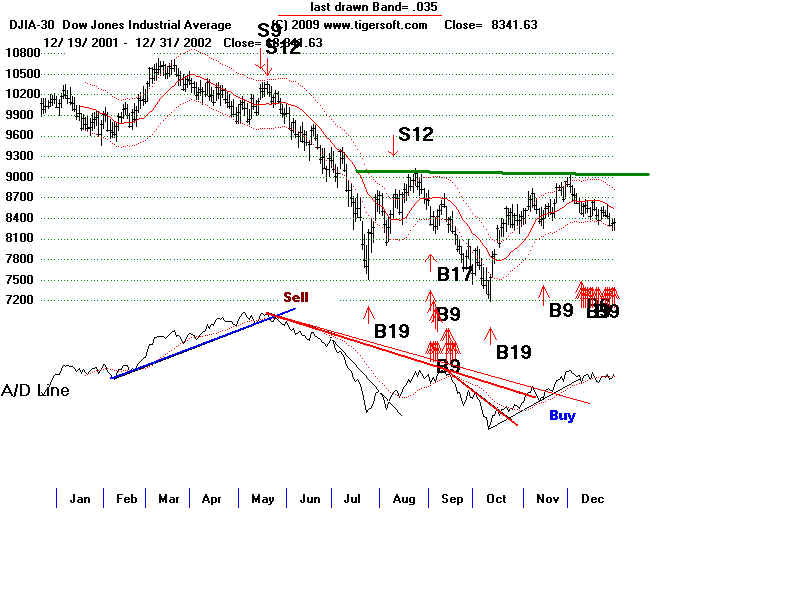
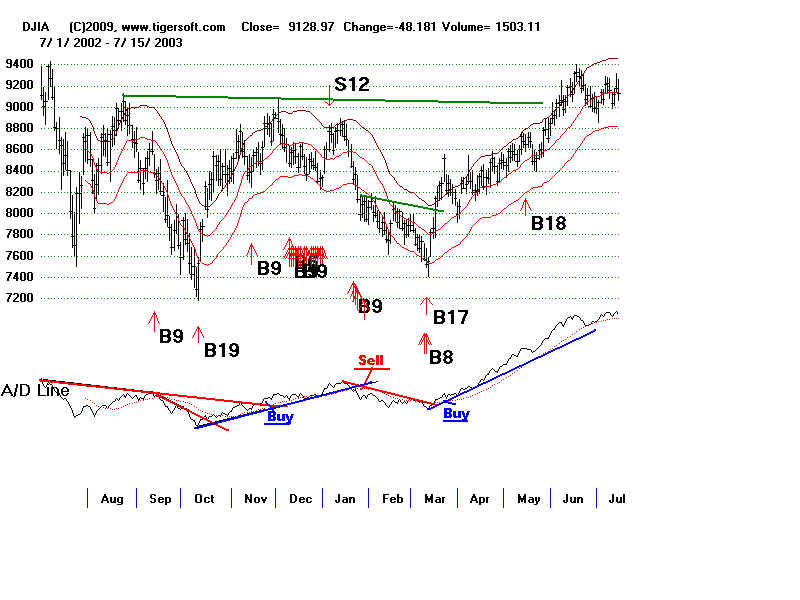
The NYSE A/D Line will often show you when
      key trend changes are taking place in the stock market.
      But there are also times when the DJI and the A/D Line  
      are moving in different directions. 
            After a Peerless Buy a break in the NYSE A/D Line
      is bullish.  Until the DJI is able to make a breakout above
      its bottom formation resistance, the NYSE A/D Line uptrend
      must be watched.  If the A/D Line breaks below its uptrend
      before there is a price breakout above the bottom pattern's
      resistance, expect another decline.


1959
wpe157.jpg (56380 bytes)
1957-1958
wpe158.jpg (59813 bytes)
1959-1960
wpe159.jpg (61879 bytes)
1960
wpe15A.jpg (53968 bytes)
1962
62.BMP (1440054 bytes)
1966
wpe15B.jpg (59084 bytes)
1970
70.BMP (1440054 bytes)
1973
wpe15C.jpg (51312 bytes)


1974-1975
7475.BMP (1440054 bytes)
1977-1978
7778.BMP (1440054 bytes)
1979-1980
wpe15D.jpg (59642 bytes)
1981-1982
8182.BMP (1440054 bytes)
1982
82.BMP (1440054 bytes)
1984
84.BMP (1440054 bytes)
1987-1988
8788.BMP (1440054 bytes)
1990-1991
wpe15E.jpg (49377 bytes)
1994
94.BMP (1440054 bytes)
1994-1995
wpe15F.jpg (50613 bytes)
1997-1998
9798.BMP (1440054 bytes)
1998
98.BMP (1440054 bytes)
1999
99.BMP (1440054 bytes)
1999-2000
9900.BMP (960054 bytes)
2000
00.BMP (1440054 bytes)
2000-2001
0001.BMP (1440054 bytes)
2001
01.BMP (1440054 bytes)
2001-2002
0102.BMP (1440054 bytes)
2002
02.BMP (1440054 bytes)
2002-2003
0203.BMP (1440054 bytes)
2007-2008
0708.BMP (1440054 bytes)
2008
08.BMP (1440054 bytes)
2008-2009
09.BMP (1440054 bytes)