The Buy B6 occurs only on DJI weakness in Decembers of the Second
Year in the Presidential Cycle.
There were 13 Buy B6s since 1928. The average gain was 23.4% The
biggest of these gains, and there were 4 of them, occurred in the first
10 days of December. These brought a whopping 41.1% gain in the
DJI at the time of the next Peerless Sell.
In 7 of the 13 cases, there would have been no paper loss if one had gone long
the Buy B6 and sold on the next Peerless Sell. In only once instance was the
paper loss greater than 1.8%; it was 3.7%
Size of Gains
>10% 10 9 69.2%
5%-9.99% 2 15.4%
2%-4.99% 2 15.4%
0%-1.99% 0
Losses 0
Buy B6s: 1928-2013 la/ma Paper Loss
19341220 B6 99.6 .044 .980 none
19661202 B6 789.47 .124 .981 0.4%
19661228 B6 788.58 .125 .984 0.4%
19741202 B6 603.02 .434 .942 3.7%
19741209 B6 579.94 .491 .933 none
19781218 B6 787.51 .125 .975 none
19821216 B6 990.25 .081 .971 none
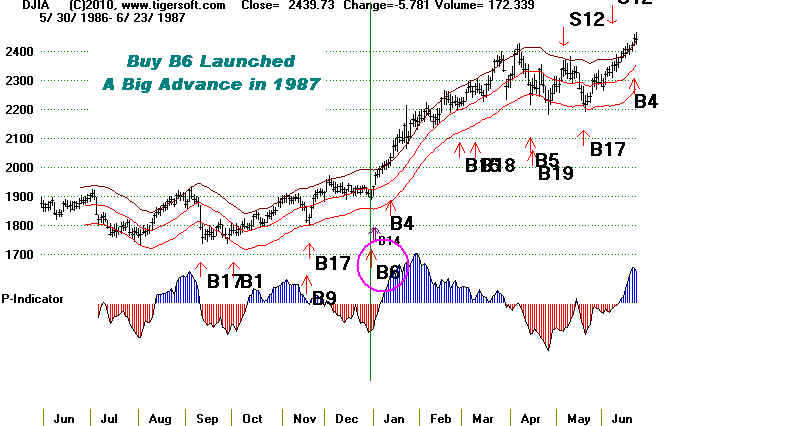
19861231 B6 1895.91 .269 .985 none
19941201 B6 3700.87 .499 .978 0.4%
19941208 B6 3685.73 .506 .98 none
19981210 B6 8841.58 .259 .976 0.2%
20021218 B6 8447.35 .039 .975 1.7%
20021231 B6 8341.63 .052 .978 none
===================================================================
No.=13 Avg.=.234
(All B6s since 1945: No.= 12 Avg/ = .250)
10 2 2
PE 0
PE +1 0
PE +2 14 .252
PE +3 0
All were in December 14 .252
1-10 5 .411 (very high)
11-20 5 .196
21-30 4 .122
Code:
For i = 22 To rn
If (yr(i) + 2) / 4 <> Int((yr(i) + 2) / 4) Then 391
If mo(i) <> 12 Then 391
If la(i) / ma(i) < .981 Then pi = i: S9(i) = 106: mb(i) = 6: pi = i: : B6Arrows (pi)
391 Next i
For i = 22 To rn
If da(i) < 25 Then 392
If (yr(i) + 2) / 4 <> Int((yr(i) + 2) / 4) Then 392
If mo(i) <> 12 Then 392
If la(i) / ma(i) < .987 Then pi = i: S9(i) = 106: mb(i) = 6: pi = i: : B6Arrows (pi)
392 Next i
|
=======================================================
Buy B6 - December Weakness
(C) 2011 All rights reserved. www.tigersoft.com
Updated 6/1/2011
December Buy in Years of Congressional Mid-Term Elections (1943, 1947, 1951...)
on DJI declines more than 2.9% under 21-day ma, or more than 1.3% under the 21-day ma
after December 5th. This was profitable in 10 of the 11 cases 1934.
Clearly seasonality is important. The market is often poised for a big advance at
the start of the year after the Congressional election. 7 of the 11 B6s brought
gains ranging from 10% to 43.4%. Only with the December 1938 Buy B6, with war
with Germany seeming more and more likely, did the market not rally. Here a
paper loss of 15% would have been suffered unless one heeded our warnings
about trading with the trends of the Closing Power when head and shoulders patterns
appear.
Reversing Buy B6s
Buy B6 12/20/1934 99.6 4.9% Sell S12 1/2/1935 104.5 4.2%
Buy B6 12/1/1938 148.6 3.4% Sell S12 1/3/1939 153.6 4.1%
BUY   B6     12/2/74     603.02   45.5% SELL  S8     7/1/75      877.42  9.4%

BUY   B6   12/15/82   992.64 7.9%  SELL  S12  1/6/83 1070.92 3.8%
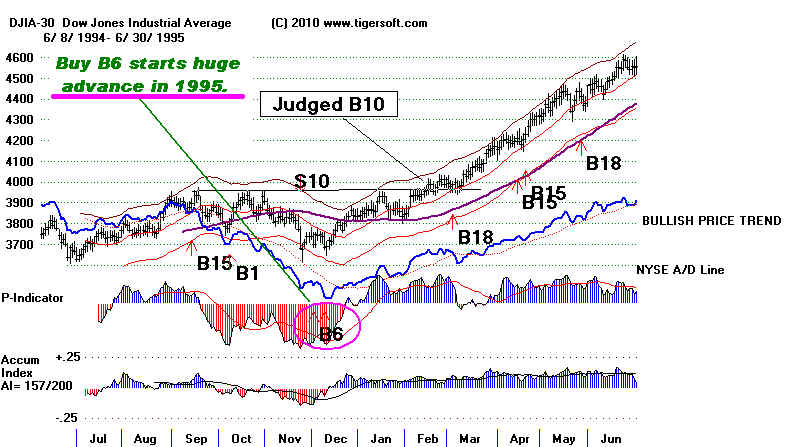
BUY B6 12/1/94 3700.87 49.9% SELL S1 2/27/96 5549.21 1.1%
Buy B6: Trading Results: 1930-2010 December 1930 B6s were not counted. The Extreme Bearish Mode does not use them.Date DJI Gain Reversing Sell ------------- ----------- -------- ------------------- 1 12/30/1934 99.6 +4.9% 104.5 1/2/1935 S12 .98 -.035 6 -.057 35 .042 The DJI rose immediately and reached the upper band. No paper loss. S12
-------------------------------------------------------------------------- 2 12/1/1938 148.6 -3.5% 143.3 7/31/1939 S8 .979 -.196 -34 -.007 -107 -.024 DJI rose quickly to 155 and upper band. Internals were weak there in January, but there was no automatic Sell. Pne should have noted the megaphpone pattern and, at least, sold the B6 long positions when NYSE A/D Line broke its uptrendlines. The DJI fell to 126 for a paper loss of 15%. The next automatic Sell was on 7/31/1939
-------------------------------------------------------------------------- No B6s in 1942 because market was too strong and never much fell back in December below its 21-day ma -------------------------------------------------------------------------- No B6s in 1946 because market was too strong and never much fell back in December below its 21-day ma ------------------------------------------------------------------------- 3 12/4/1950 222.3 +18.3% 262.90 8/3/1951 S4 .971 -.177 198 .103 264 .223 This was also a Buy B9. There was no paper loss. ------------------------------------------------------------------------- No B6s in 1954 because market was too strong and never much fell back in December below its 21-day ma ------------------------------------------------------------------------- No B6s in 1958 because market was too strong and never much fell back in December below its 21-day ma ------------------------------------------------------------------------- No B6s in 1962 because market was too strong and never much fell back in December below its 21-day ma ------------------------------------------------------------------------- 4 12/1/1966 789.75 +10.0% 868.49 3/16/67 S12 .98 -.256 11 .049 2 -.097 The DJI rallied to upper band and then fell to 785. This was a paper loss of 1/2%. It then rallied strongly.
12/2/1966 789.47 +10.0%
.981 -.298 -13 .037 1 -.175
12/28/1966 788.58 +10.1%
.984 -.187 3 -.013 -1 -.086
12/29/1966 786.35 +10.4%
.982 -.132 -9 -.002 - -.09
12/30/1966 785.69 +10.5%
.981 -.088 -13 -.022 -2 -.109
-------------------------------------------------------------------------
B6s in 1970 because market was too strong and never much fell back
in December below its 21-day ma
-------------------------------------------------------------------------
5 12/2/1974 603.02 +43.4% 864.83 6/23/1975 S2
.942 -1.157 -139 -.167 -3 -.083
The DJI rallied to past the upper band. First, it fell to 577
before rallying. This was a paper loss of 4%.
.
12/3/1974 596.61 +45.0%
.937 -1.177 -179 -.175 -3 -.083
12/4/1974 598.64 +44.5%
.944 -1.095 -163 -.194 -3 -.017
12/5/1974 587.06 +47.3%
.932 -1.848 -226 -.279 =3 -.098
12/6/1974 577.6 +49.7%
.923 -1.729 -286 -.239 -4 -.074
12/9/1974 579.94 +49.1%
.933 -1.75 -314 -.238 -3 -.084
12/10/1974 593.87 +45.6%
.961 -1.404 -296 -.214 -4 .005
12/11/1974 595.35 +45.3%
.969 -1.489 -297 -.256 -4 .008
12/12/1974 596.37 +45.0%
.976 -1.218 -283 -.212 -3 .094
12/13/1974 592.77 +45.9%
.975 -1.294 -280 =.239 -3 -1.92
12/16/1974 586.83 +47.4%
.971 -1.401 -297 -.25 -4 -.196
--------------------------------------------------------------------
6 12/18/1978 787.51 +11.8% 880.29 8/24/79 S4
.975 -.098 8 -.007 -2 .038
The DJI rallied immediately. There was no paper loss.
12/19/1978 789.85 +11.5%
.978 -.116 -21 .004 -2 .036
-------------------------------------------------------------------
7 12/15/1982 992.64 + 6.7% 1243.69 7/26/83 S9
.971 -.335 -63 -.187 -8 -.183
The DJI rallied from a low of 990 the next day.
There was almost no paper loss.
12/16/1982 990.25 + 6.9%
.97 -.207 -29 -.212 -6 -.017
-----------------------------------------------------------------------
8 12/31/1986 1895.91 +23.5% 2351,64 6.8.87 S12
.985 -.103 -179 .072 -16 -.191
The DJI rallied immediately. There was no paper loss.
 -----------------------------------------------------------------------
There were no B6s in 1990 because market was too strong and never
much fell back in December below its 21-day ma
-------------------------------------------------------------------------
9 12/1/1994 3700.87 +47.5% 5458.53 2/20/96 S1
.978 -.51 -294 -.136 -48 -.228
The DJI fell back less than 1/2% and rallied very strongly.
There was no significant paper loss
12/8/1994 3685.73 +48.1%
.98 -.458 -305 -.067 -58 -.311
-----------------------------------------------------------------------
There were no B6s in 1990 because market was too strong and never
much fell back in December below its 21-day ma
-------------------------------------------------------------------------
9 12/1/1994 3700.87 +47.5% 5458.53 2/20/96 S1
.978 -.51 -294 -.136 -48 -.228
The DJI fell back less than 1/2% and rallied very strongly.
There was no significant paper loss
12/8/1994 3685.73 +48.1%
.98 -.458 -305 -.067 -58 -.311
 ------------------------------------------------------------------------
10 12/10/1998 8841.57 +22.8% 10855.55 6/19/99 S12
(+7.9% 9544.42 2/23/99 S9 old system)
.976 -.029 -75 .009 -40 .073
The DJI fell back 2% more and then rallied. Paper loss = 2%.
12/11/1998 8821.76 +8.2%
.973 -.003 -77 .04 -39 .076
12/14/1998 8695.6 +9.8%
.96 -.176 -130 .028 -51 -.019
12/15/1998 8823.3 +8.2%
.975 -.127 -123 .044 -48 -.006
12/16/1998 8790.6 +8.6%
.972 -.29 -138 .031 -52 -.094
-----------------------------------------------------------------------
11 12/9/2002 8473.41 +3.5% 1/6/2003 S12
.981 -.155 89 -.034 -92 -.083
The DJI fell back to 8304 and then rallied. Paper loss = 2%.
12/13/2002 8433.71 +4.0%
.973 .048 188 .016 -42 -.09
12/18/2002 8447.35 +3.9%
.975 -.054 90 -.003 -121 -.192
12/19/2002 8364.8 +4.9%
.966 -.151 93 -.031 -133 -.192
12/24/2002 8448.11 +3.9%
.98 -.492 21 -.028 -184 -.266
12/26/2002 8432.61 +4.0%
.981 -,576 27 -.064 -191 -.358
12/27/2002 8303.78 +5.7%
.968 -.516 16 -.051 -174 -.34
12/30/2002 8332.85 +5.3%
.974 -.831 -55 -.093 -209 -.356
12/31/2002 8341.63 +5.2%
-----------------------------------------------------------------------
There were no B6s in 2006 because market was too strong and never
much fell back in December below its 21-day ma
==========================================================
Using only first B6 in a month: Number of trades = 11
Avg. Gain = 16.7%
First Halves in 1915, 1919, 1923, 1927...2007
Did these )1942, 1946, 1950...) Decembers lead to strong
first halves in the next year.
Dec. 31st 6/30 Gain
----------------------
1915 yes 56 70.10
1919 yes 83 106.90
1923 no 99 88.40
1927 yes 155 166.20
1931 no 170 150.20
1935 yes 105 118.40
1939 no 153 130.60
1943 yes 119.60 143.40
1947 flat 177.20 177.30
1951 yes 235.40 242.60
1955 yes 404.40 451.40
1959 yes 583.70 643.60
1963 yes 652.10 706.90
1967 yes 785.69 860.26
1971 yes 838.92 891.14
1975 yes 616.24 878.99
1979 yes 805.01 841.98
1983 yes 1046.54 1221.96
1987 yes 1895.91 2418.53
1991 yes 2633.66 2906.75
1995 yes 3834.44 4556.10
1999 yes 9181.42 10970.80
2003 yes 8341.63 8985.44 includes Jan-March decline
2007 yes 12463.15 13408.52 inludes February decline
------------------------------------------------------------------------
10 12/10/1998 8841.57 +22.8% 10855.55 6/19/99 S12
(+7.9% 9544.42 2/23/99 S9 old system)
.976 -.029 -75 .009 -40 .073
The DJI fell back 2% more and then rallied. Paper loss = 2%.
12/11/1998 8821.76 +8.2%
.973 -.003 -77 .04 -39 .076
12/14/1998 8695.6 +9.8%
.96 -.176 -130 .028 -51 -.019
12/15/1998 8823.3 +8.2%
.975 -.127 -123 .044 -48 -.006
12/16/1998 8790.6 +8.6%
.972 -.29 -138 .031 -52 -.094
-----------------------------------------------------------------------
11 12/9/2002 8473.41 +3.5% 1/6/2003 S12
.981 -.155 89 -.034 -92 -.083
The DJI fell back to 8304 and then rallied. Paper loss = 2%.
12/13/2002 8433.71 +4.0%
.973 .048 188 .016 -42 -.09
12/18/2002 8447.35 +3.9%
.975 -.054 90 -.003 -121 -.192
12/19/2002 8364.8 +4.9%
.966 -.151 93 -.031 -133 -.192
12/24/2002 8448.11 +3.9%
.98 -.492 21 -.028 -184 -.266
12/26/2002 8432.61 +4.0%
.981 -,576 27 -.064 -191 -.358
12/27/2002 8303.78 +5.7%
.968 -.516 16 -.051 -174 -.34
12/30/2002 8332.85 +5.3%
.974 -.831 -55 -.093 -209 -.356
12/31/2002 8341.63 +5.2%
-----------------------------------------------------------------------
There were no B6s in 2006 because market was too strong and never
much fell back in December below its 21-day ma
==========================================================
Using only first B6 in a month: Number of trades = 11
Avg. Gain = 16.7%
First Halves in 1915, 1919, 1923, 1927...2007
Did these )1942, 1946, 1950...) Decembers lead to strong
first halves in the next year.
Dec. 31st 6/30 Gain
----------------------
1915 yes 56 70.10
1919 yes 83 106.90
1923 no 99 88.40
1927 yes 155 166.20
1931 no 170 150.20
1935 yes 105 118.40
1939 no 153 130.60
1943 yes 119.60 143.40
1947 flat 177.20 177.30
1951 yes 235.40 242.60
1955 yes 404.40 451.40
1959 yes 583.70 643.60
1963 yes 652.10 706.90
1967 yes 785.69 860.26
1971 yes 838.92 891.14
1975 yes 616.24 878.99
1979 yes 805.01 841.98
1983 yes 1046.54 1221.96
1987 yes 1895.91 2418.53
1991 yes 2633.66 2906.75
1995 yes 3834.44 4556.10
1999 yes 9181.42 10970.80
2003 yes 8341.63 8985.44 includes Jan-March decline
2007 yes 12463.15 13408.52 inludes February decline