AND THE NYSE A/D LINE HAS BEEN MUCH STRONGER THAN THE DJI
(C) 2011 William Schmidt, Ph.D. 6/6/2011
There are three cases of this since 1965. Two conclusions
emerge: 1) Sell if the NYSE A/D Line uptrend is broken and
2) Sell if the DJI closes more than 13.5% down from its high.
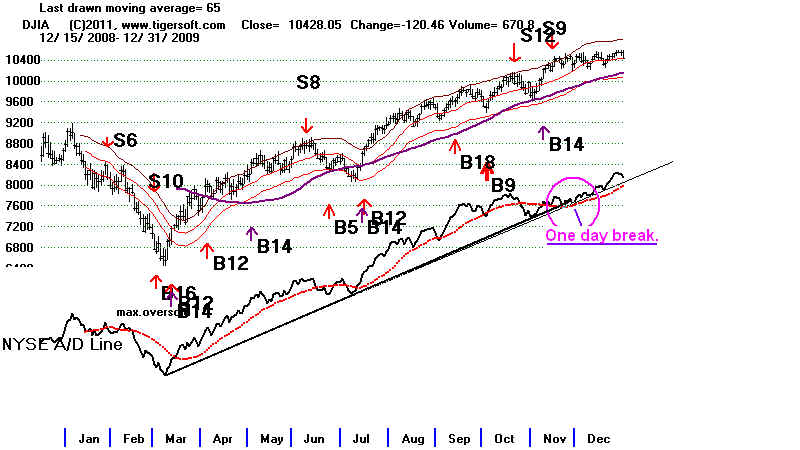
The Lesson of the 2009 chart is that we should require a very
clear break in the NYSE A/D Line uptrend. The break should
probably be for 2 days, not just one. And if the market turns
up the sharply on the second day, consider the test of the A/D Line
uptrend successful and Buy.
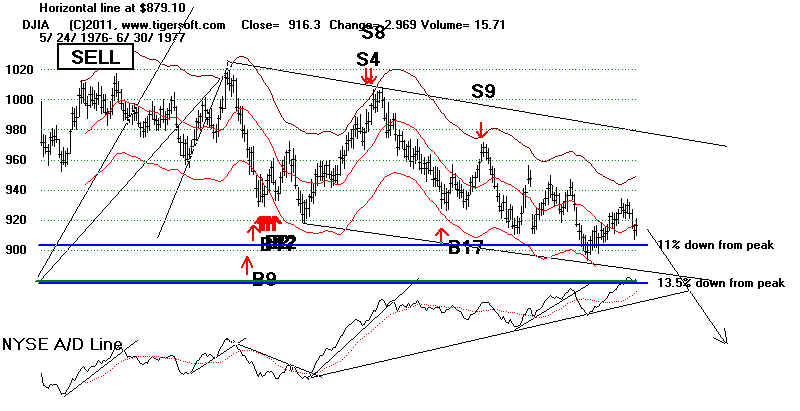
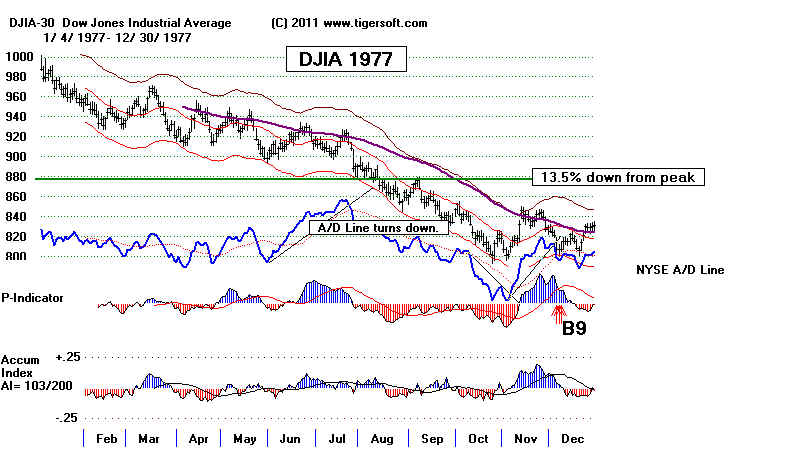
In the first half of 1977 the DJI started gradually declining.
The NYSE A/D Line not only held up, it made new highs in May
and June of 1977 while the DJI was down 10% from its high.
Only when the DJI broke below 880, and had declined 13.5% from
its peak, the NYSE began to play catch-up on the downside and
fell more sharply. A decline in the DJI is common in the years
after a Presidential Election. In this case, Peerless Sell signals
on the DJI would have helped.
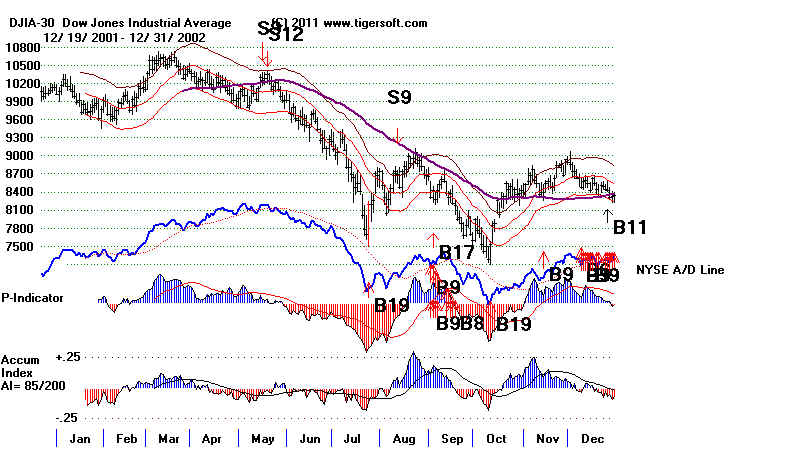
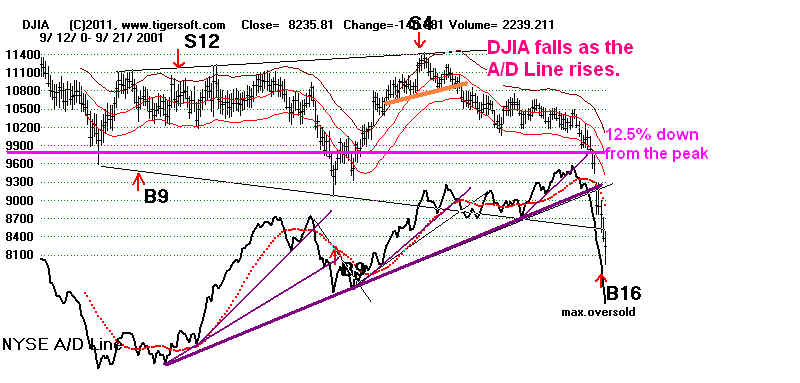
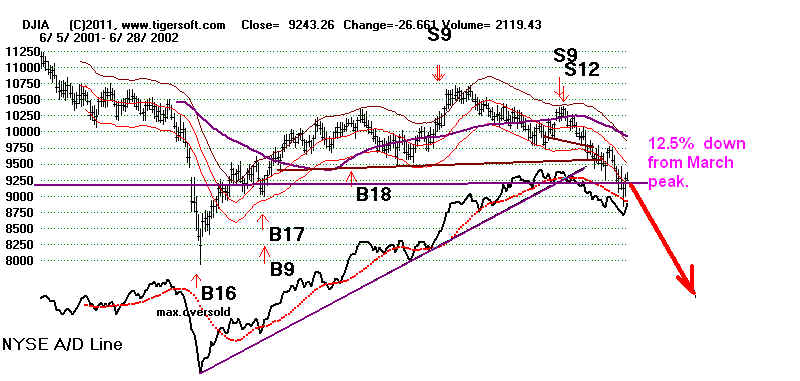
In August 2001, the NYSE A/D Line made new highs even though
the DJI was down nearly 10% from its highs. Only after the A/D
Line broke its uptrend and the DJI has fallen 13.5%, did the A/D
Line turn steeply down with the DJI in the days before the 9/11
attack on the World Trade Center. This was also in a year after
a Presidential Election. Apparently, terrorists were busy selling
short DJI-30 stocks before the attack, but did not bother with
somewhat smaller corporations.
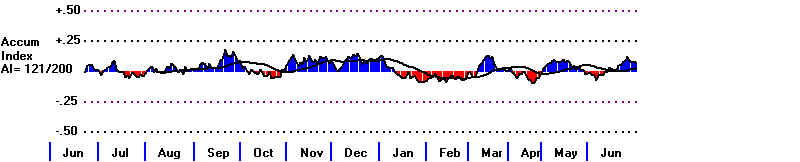
Only in May 2002, when the A/D Line had broken its uptrend
did the A/D Line stop making new highs and get in synch with the
falling DJI. The decline of both accelerated when the DJI fell
below the 13.5% fail-safe level down from its March high. The
2002 decline was a continuation of the bubble-break of 2000.
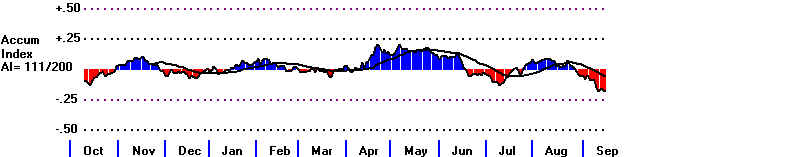
In November 2009, the NYSE A/D Line uptrend of 8 months was
violated for a day and then turned up. This proved a good short-
term Buy despite the Sell S9. The next break was more significant.
A few months later the DJI tested the 13.5% fail safe level, held
and then turned up. The trendbreaks of the A/D Line were helpful
in this period.

1977

2002