Sell on DJI Rallies To Upper Band after March
in the Presidential Election Year and in September the
year before the Presidential Electon when Internals
Are Not Especially Bullish.
Sell S2s: 1928-2013 19321111 S2 68.0 .135
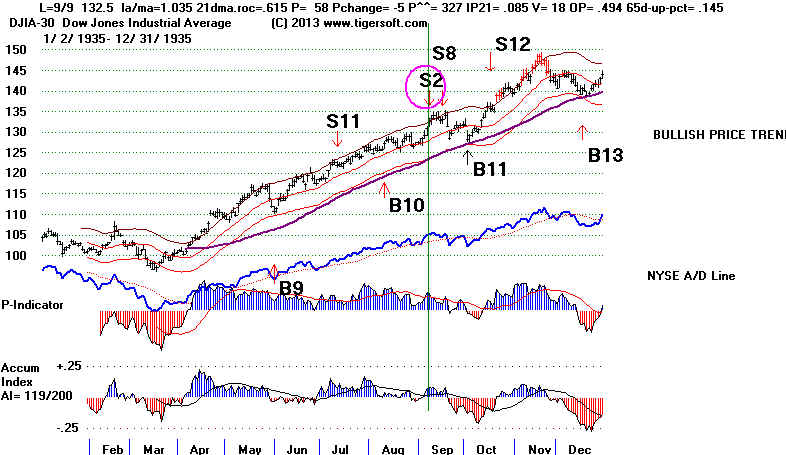
19350909 S2 132.5 .033
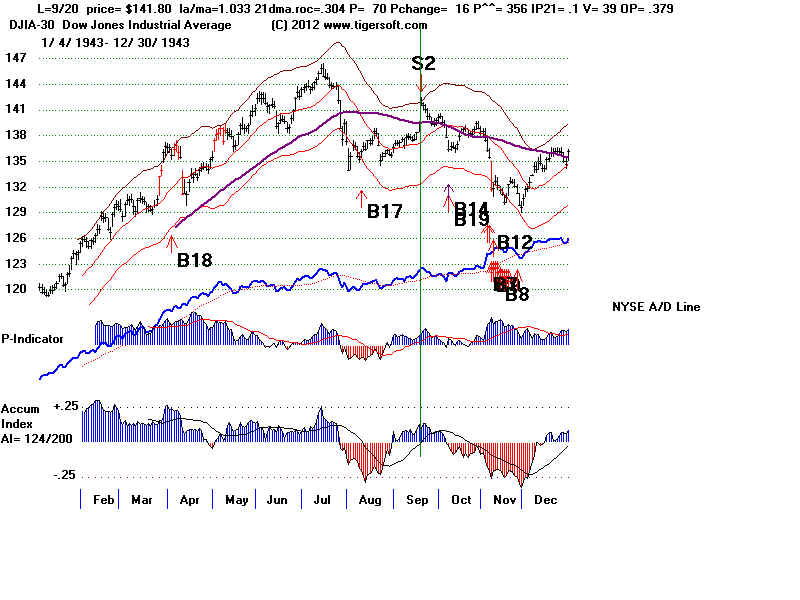
19430920 S2 141.8 .071
19480615 S2 193.2 .05
19481022 S2 189.8 .061
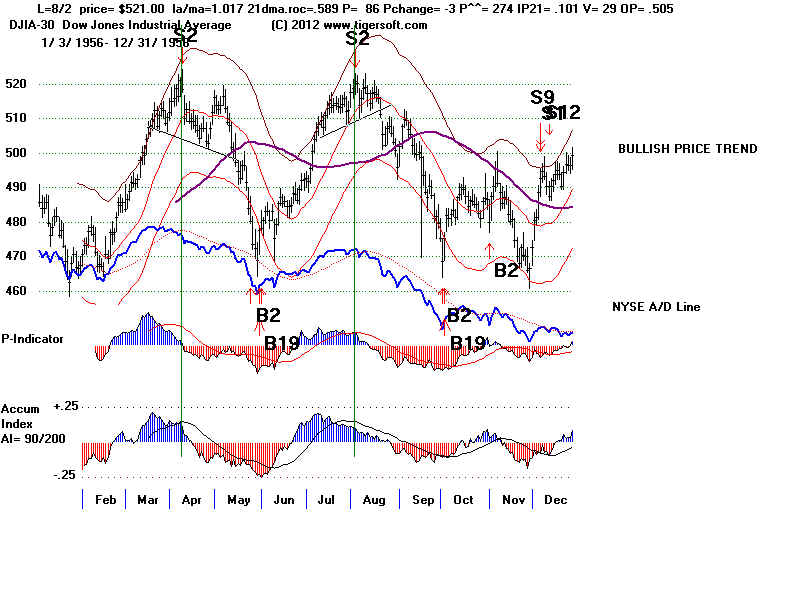
19560409 S2 518.5 .079
19560802 S2 521 .075
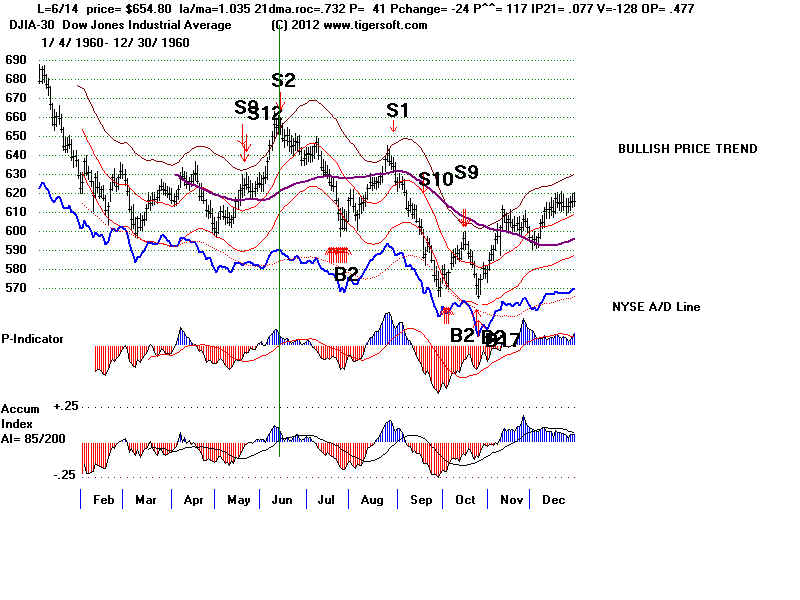
19600614 S2 654.8 .058
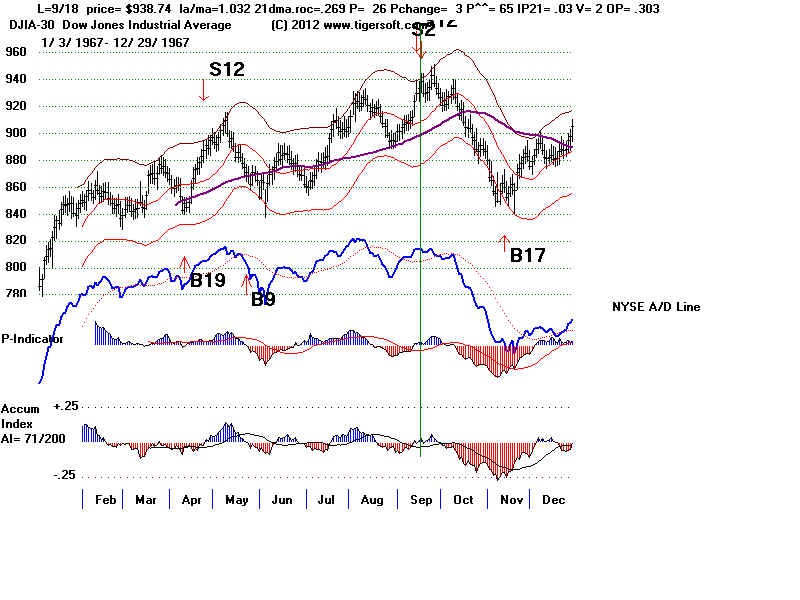
19670918 S2 938.74 .084
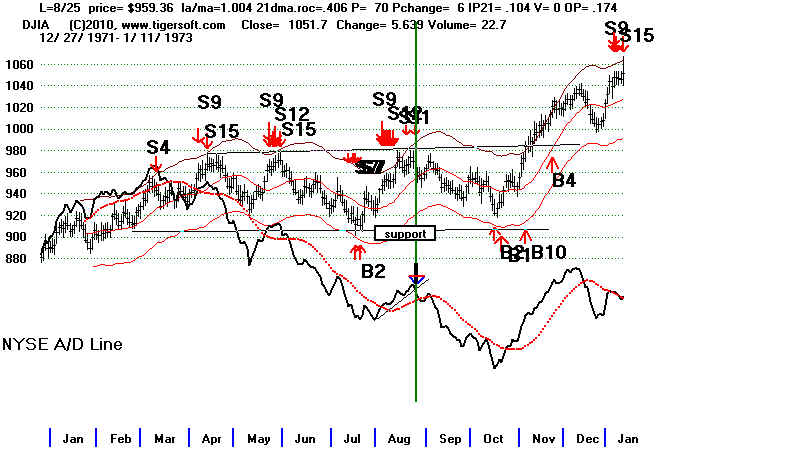
19710907 S2 920.93 .103
19960520 S2 5748.82 .041
20000425 S2 11124.82 .049
20000906 S2 11310.64 .095
20001030 S2 10835.77 .029
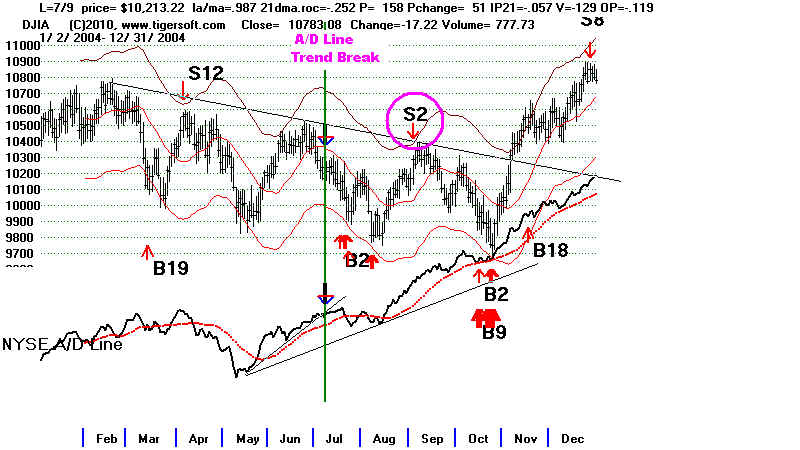
20040902 S2 10290.28 .038
20070919 S2 13815.56 .062
----------------------------------------------------
no.=16 .066
2 9 5 0 0 PE 11 .065 PE +1 0 ---- PE +2 0 ---- PE +3 5 .076 January 0 ---- February 0 ---- March 0 ---- April 2 .099 May 1 .041 June 2 .054 July 0 ---- August 1 .069 September 7 .045 October 2 .045 November 1 .135 December 2 .049 1-10 6 .075 11-20 6 .078 21-31 5 .050 |
==============================================================================
3/30/2013 - last edited.
(C) 2013 Wm. Schmidt, Ph.D. www.tigersoft.com All rights strictly reserved.
Sell on DJI Rallies To Upper Band from April to September
in the Presidential
Election Year and in September the
year before the
Presidential Electon.
There have been 16 Sell S2s since 1929.
The average DJI drop afterwares
5.2%. All but three brought a DJI decline of at least 3% at the time of the
next Peerless Buy. The average DJI decline on a Sell S2 was 5.2%. None
brought a loss. And the biggest paper loss was only 3.0%. In 12 of the
16
cases of S2s there was no paper loss. This is remarkable in that the
key value's average internal strength readings were relatively high.
The average adjusted P-I was +320, the average IP21 was +.077 and
the average OPct was +.278. Only the V-Indicator's average readings
were somewhat low, a +34.8.
Sell S2s taking place when the A/ D Lie fails to confirm the DJI advance
typically fall further. The average DJI decline was 7.1% in their 7 cases,
compared with only 3.7% in the 9 instances where the A/D Line was
confirming the DJI strength.
The DJI must not have just jumped or fallen 2% from
the previous day
for the Sell S2 to be given.
The DJI may close only 1.2% over the 21- day ma provided the P-I Daily
change is negative (examples: the two cases in 1948) or the V-I is barely positive
or negative and the the P-I or IP21 are negative (examples: 1960 and
the two cases in 2000).
The P-Indicator and IP21 are allowed to be much higher if the DJI closes
3% over the 21-dma and this takes place in June, September or October
of the Presidential Election Year or the year before.
More than a third of all Sell S2s occurred in Septembers the year before
the Presidential Election: 1935, 1943, 1967, 1971, 1995 and 2007.
Most (9 of the 16) Sell S2s occurred
with the 3% to 4.1% over the 21-day ma
In these cases, the internals are allowed to be quite positive in these
cases, but the P-I must not be more than +33 above its value on the previous day
in these cases. This factor and the DJI closing so close to the upper
3.5% at this time makes to market vulnerble in Septembers before the 20th
of the month. Late September and October are notoriously weak unless
the Fed is busy pumping money into the system. As for the, the higher internal
strength readings on some Sell S2s, they can be taken as a sign that the
market is over-bought and ready for a pullback.
The key values' highest levels reached for S2s when the DJI is close to
the upper band show that the readings can be quite positive and
still produce a decline at this time of year:
21-day ROC +1.051
P-I
+255
P-I Daily Change +32
Adjusted P-I +679
IP21
+.179
V-I
+182
OPct
+.477
65 day pct change. +.145
The internal strength parameters are lower in a typical Presidential
Election Year and in September which is historically the weakest month.
Volatility
tends to be lower from
June to September, especially in a
Presidential
Election year.
The reasons why there are no Sell S2s
in the year after
a Presidential Election are that if a Republican is
in the White House, the stock market should already
be declining and in the second year after it, there is often
a recovery in the second half of the year.
Sell S2s give us a way to trade profitably when
the market is relatively quiet and the internal strength
indicators are too high for other signals. The P-Indicator
should not be more than +40 above its previous day's
reading. In 8 of 11 cases it was below its previous
day's level.
Sell S2 Internals
PI^ - P-Indicator is not
adjusted for increaing number of stocks traded on NYSE.
Date Pct Gain
Paper Loss
LA/MA ANN ROC
P-I P=I Change Adjusted
IP21 V-I
OPct 65-day
Change PI
Pct Change
( PI^ - P-Indicator Adjusted for increaing number of stocks traded on NYSE. )
----------------------------------------------------------------------------------------------------------------------------------------------------------------------------------------t
9/9/1935 +3.3% 1.7%
1.035 .615
58 -5
327 .085
18 .256 .145
9/20/1943 +3.8% none
1.033 .304
70 16
356
.10 39 .397 .013
( 10/7/43 B14 and B19
seem early in October.)
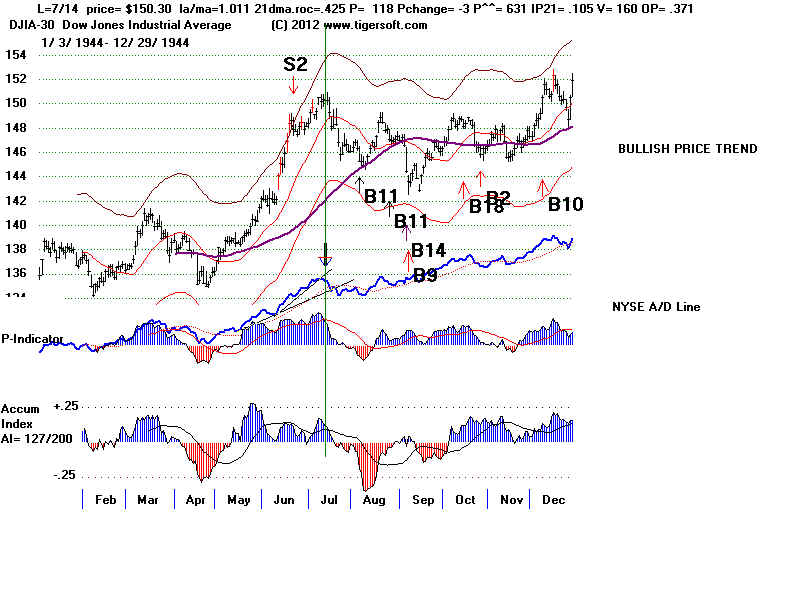
6/21/44 +1.8% 1.3%
1.032 .708
127 -13 679 .113 182 .328 .053
6/15/48 +2.8% none
1.012 .287
13 -43
55 .042
-54 .116
.135
10/22/1948 +3.8% +3.0% 1.041 .694
110 11
469
.179 65 .445
.028
4/9/1956 +7.4% none
1.016
.610 12 -21
40 .109 -147
.437 .066
8/2/1956 +10.0% none
1.017 .589
86 -3
274 .101
29
.505 .013
6/14/1960 +4.4% none
1.035 .732
41 -24
117 .077 -128 .477 .074
9/18/1967 +8.4% none
1.032 .269
26 3
65 .030
2
.267 .059
9/7/1971 +10.3% none
1.034 1.051
105 32
436
.000 1
.433 -.003
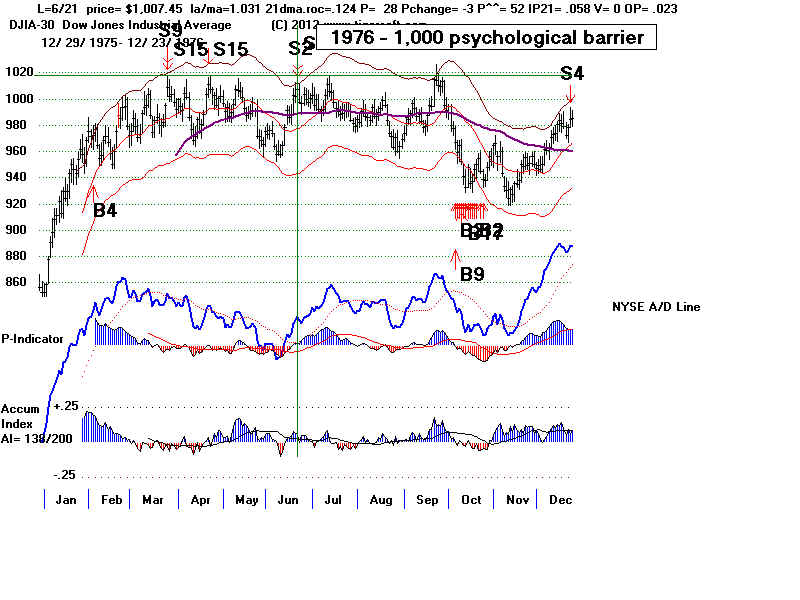
6/21/1976 +4.0% none
1.031 .124
28 -3
52
.058 0
.023 .027
9/14/1995 +0.9% none
1.032 .413
237 24
328
.080 14
.151 .066
4/25/2000 +5.4% none
1.015 .013 -25 66
-25 -.034
-43 -.092 -.012
9/6/2000 +5.4% none
1.017 .476
103 -12
103
.013 -6
.392 .043
9/8/2004 +4.1% none
1.021 .589 532 -18
498 .172
89 .146 .006
9/19/2007 +7.4% +2.5%
1.027 .621
255 15
320
.106 69
.278 .045
-----------------------------------------------------------------------------------------------------------------------------------------------------
Avg. +5.2%
+0.53% 1.026
.480 111 +1.6
254
.077 34.8
.278 5.07%
More thoughts on Sell S2s.
Since 1968, except for 2008, the stock
market has tended to move only modestly
in
the middle of the Presidential Campaign, from April to mid-September. Selling at
the upper
band or at well-tested resistance after a rally is usually a good idea at this time.
The Sell S2
makes this automatic. Using NYSE A/D Line up-trend-breaks to clinch or confirm the
Sell
S2 at this time also works well.
Know that volatility is lower in the Summer of a Presidential Election year, at least
until
there is a decisive breakout above well-tested resistance can be used by the alert trader
even when there is no Sell S2. If the DJI reaches well-tested resistance in June or
September
in a Presidential Election year, be prepared for a decline back to the lower band even if
there is
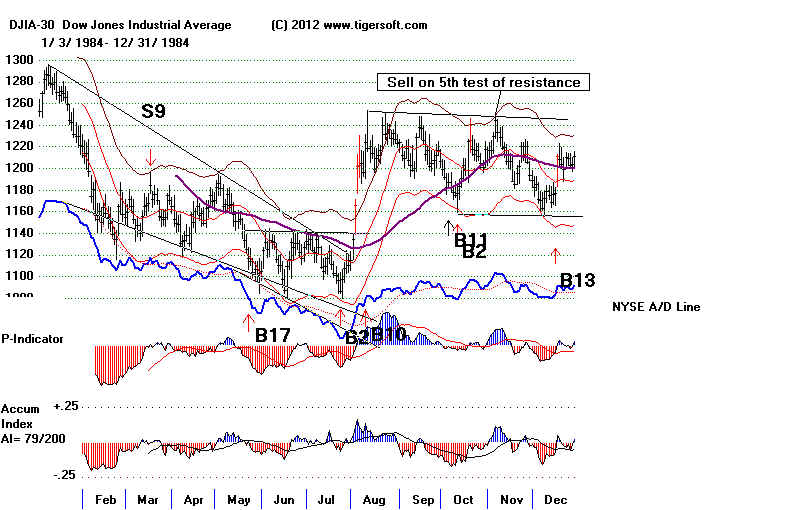
no other Peerless Sell. Below are some examples. A retreat on a third test in
June 1984
called on the DJI to plumb for support. A fifth test of resistance very often brings
a decline.
This was true in November 1984.
Sell S2s with A/D Line NC vs
Sell S2s with no A/D Line NC
June 1948 2.8
April 1956 7.4
September 1935 3.3%
Aug 1956 10.0
September 1943 3.8%
June 1960 4.4
June 1944
1.8%
Sept 1967 8.4
October 1948 3.8%
Sept 1971 10.3
June 1976 4.0%
April 2000 5.4
Sept 1995
0.9%
--------------------
Sept 2000 5.4%
Avg - 7.1%
Sept 2004 3.1%
Sept 2007
7.4%
---------------------------
3.7%
Judged Sell S2s? The Sell S2 is NOT just a signal for Presidential Election years. It is true that most S2s and more trading ranges occur in Election years. (Examples: 1972, 1976, 1984, 1988, 2000, 2004), but Trading ranges do occur in other years after March. 1983, 1991, 1996 and 2005. Watch for and use well-tested support and resistance lines when they do. 1984 Judged Sell Judged Sell 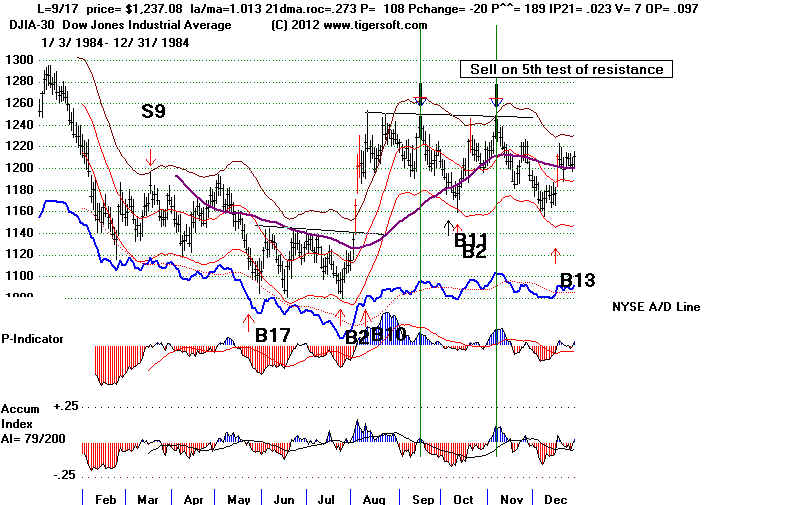 |
2004
Judged Sell 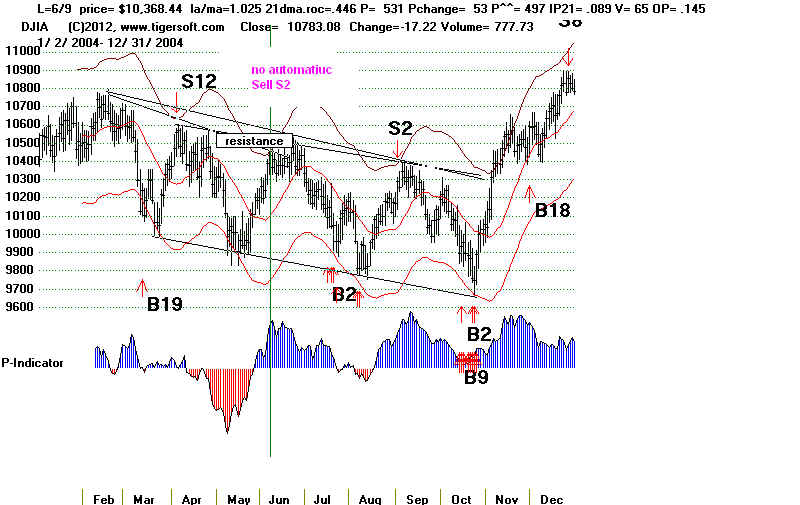 |
Date DJI Gain
------------- ----------- --------
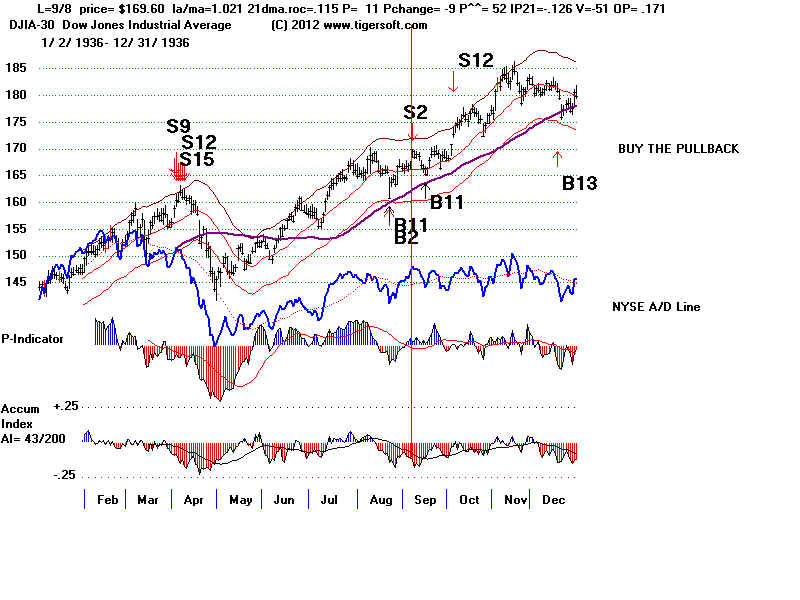
#1 9/9/35 132.5 +3.3% 1.7% paper loss
Also 9/10/36 133.2 +3.8%
LA/MA ANN ROC P-I P ch IP21 V-I OPct
1.035 .615 58 -5 .085 18 .492
Reversing Sell....DJI declined to the lower band where a Buy B11 occurred.
--------------------------------------------------------------------------------------------------------------------------------
X Signal cancelled due to Presidential Election Year seasonality.
9/8/36 169.6 +2.6% No paper loss
LA/MA ANN ROC P-I P ch IP21 V-I OPct
1.021 .115 11 -9 .126 -51 .171
Reversing Sell...DJI declined to the lower band where a Buy B11 occurred.
-------------------------------------------------------------------------------------------------------------------------------
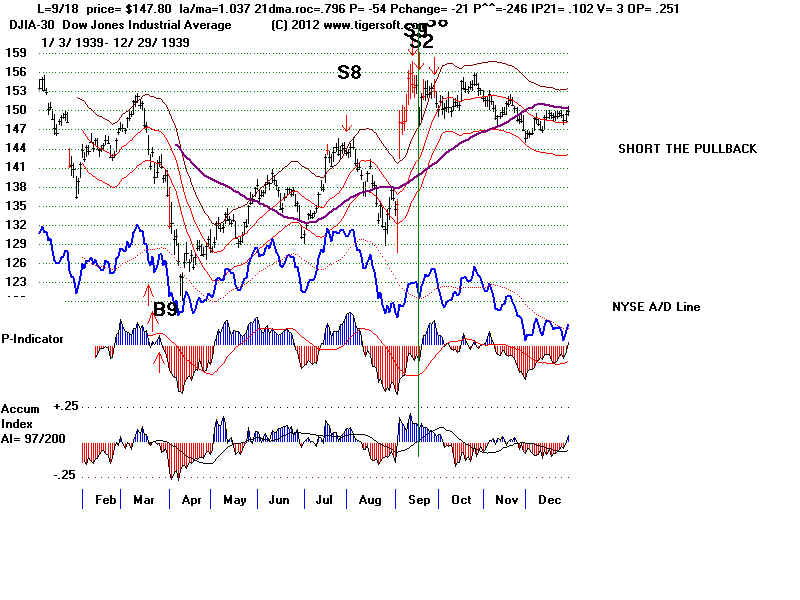
X 9/18/39 147.8 LOSS = 0.9% 3.4% paper loss
This was down 4% from previous day and is not allowed in 2013 software.
LA/MA ANN ROC P-I P ch IP21 V-I OPct
1.037 .796 -54 -21 .102 3 .251
NOT a Reversing Sell... DJI rallied to 153.10 and then declined to the lower band (9/27/39)
| 1935 |
1943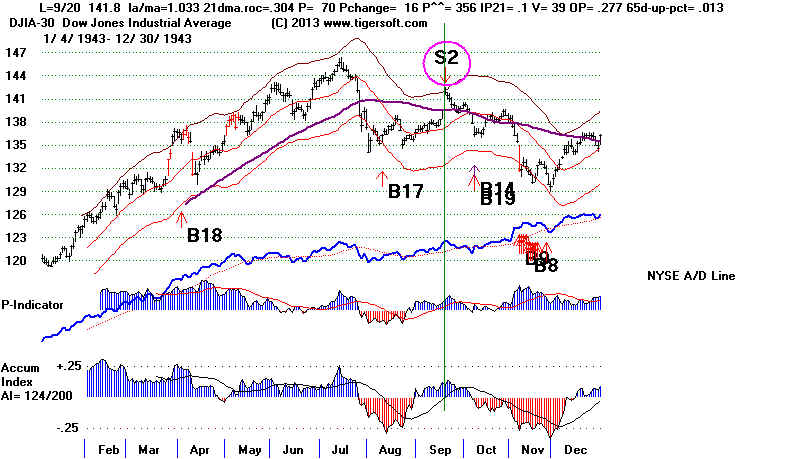 |
1944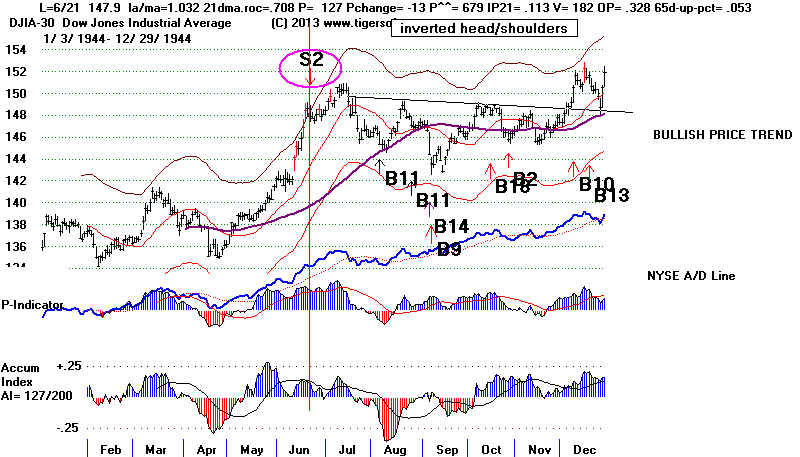 |
1948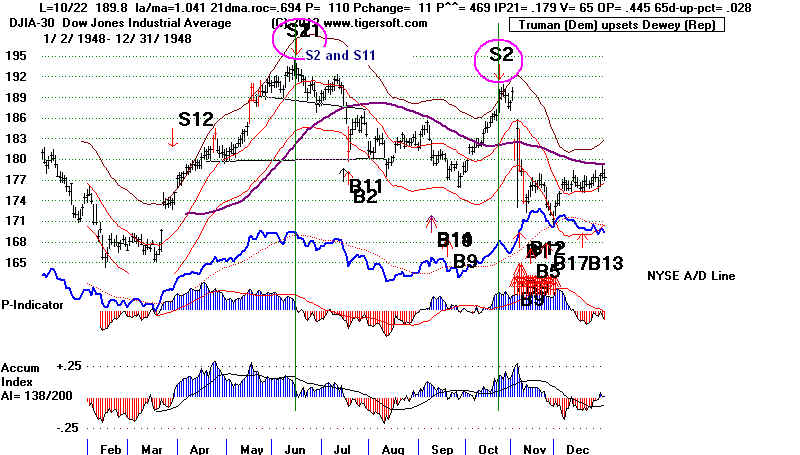 |
1956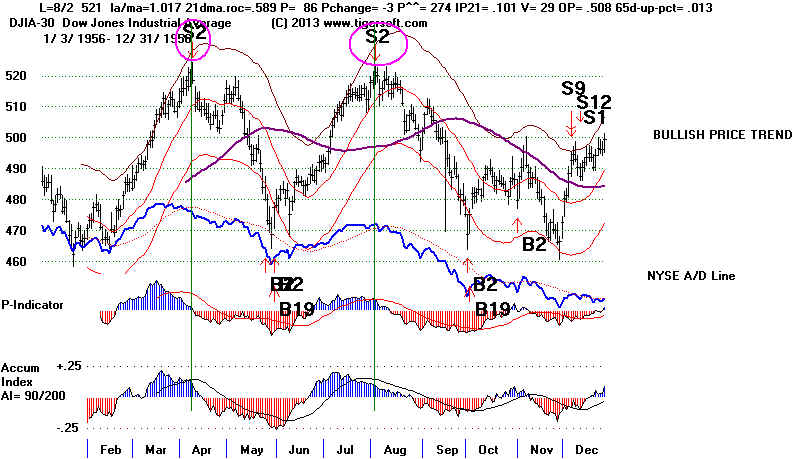 |
1960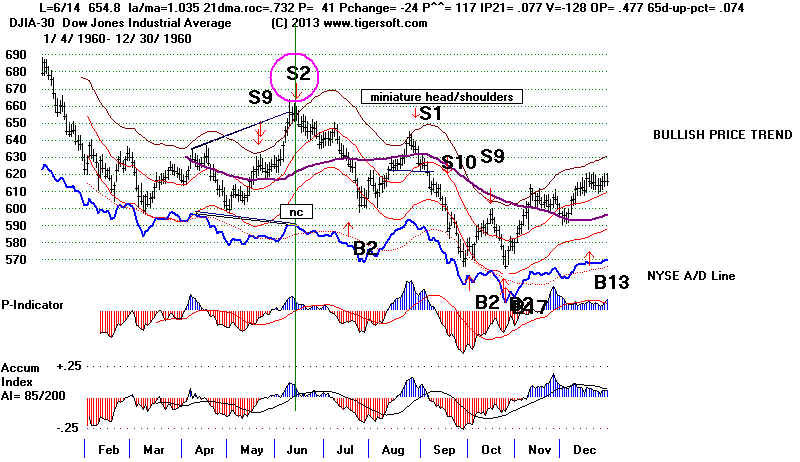 |
1967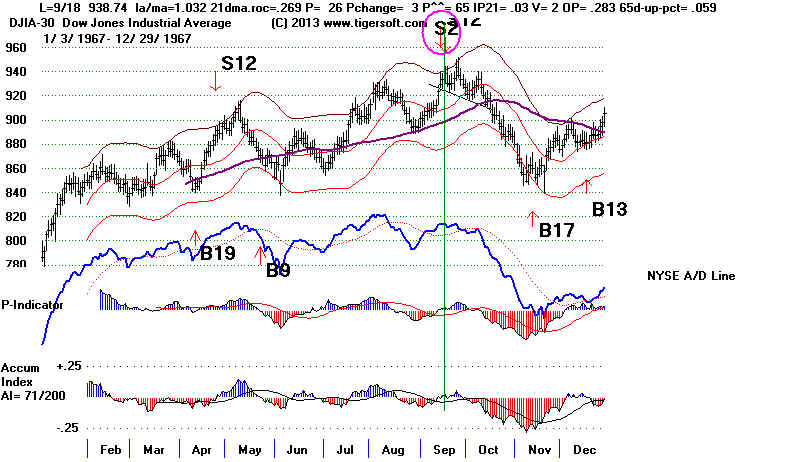 |
1971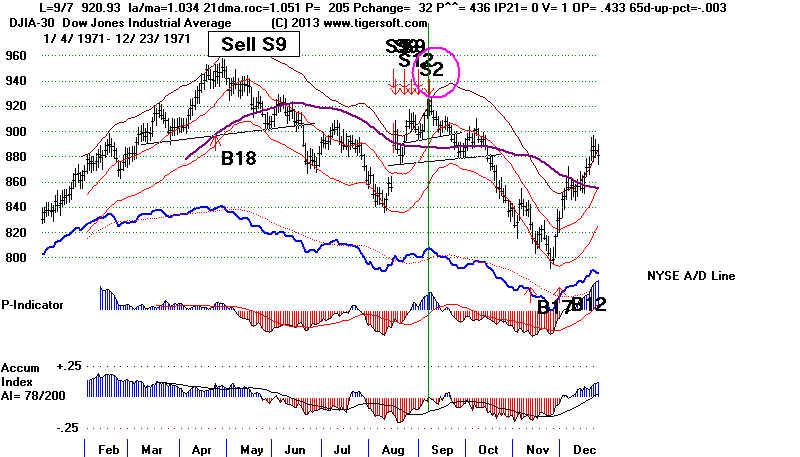 |
1976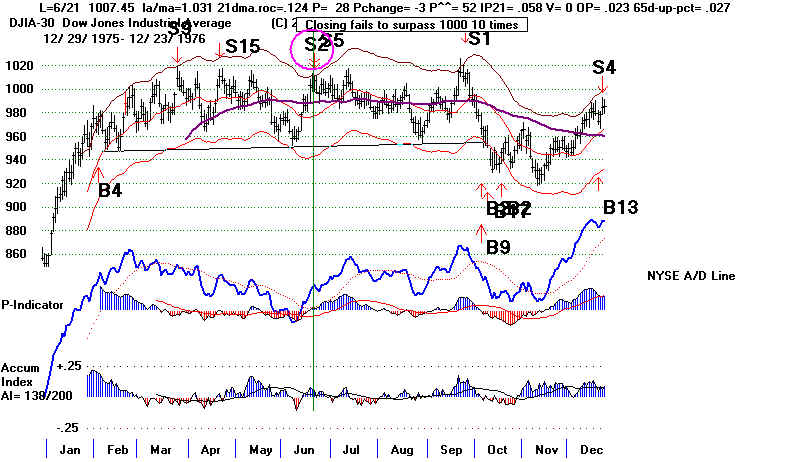 |
1995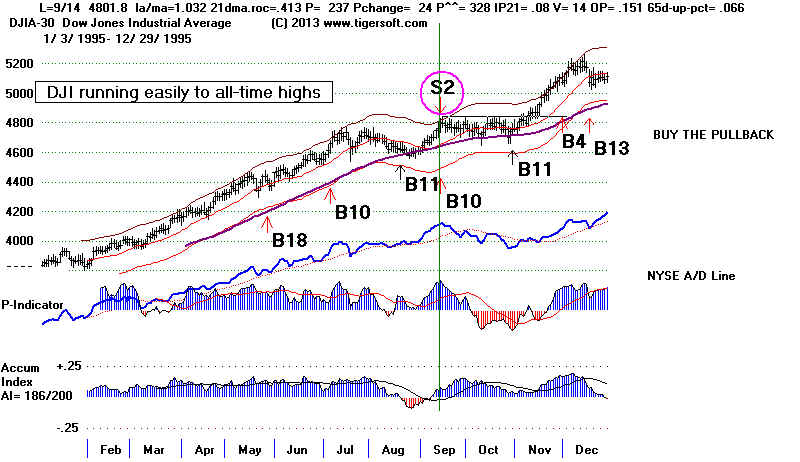 |
2000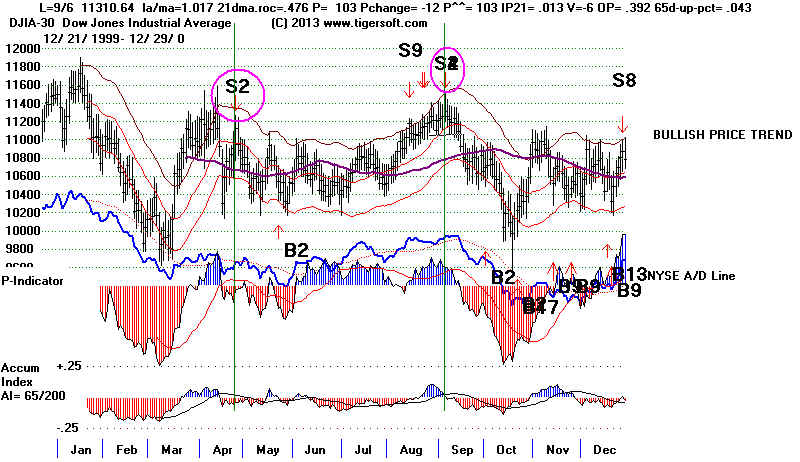 |
2004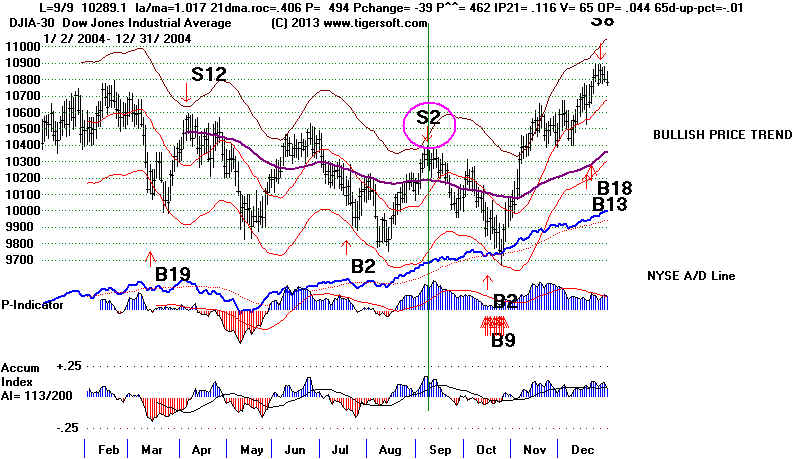 |
2007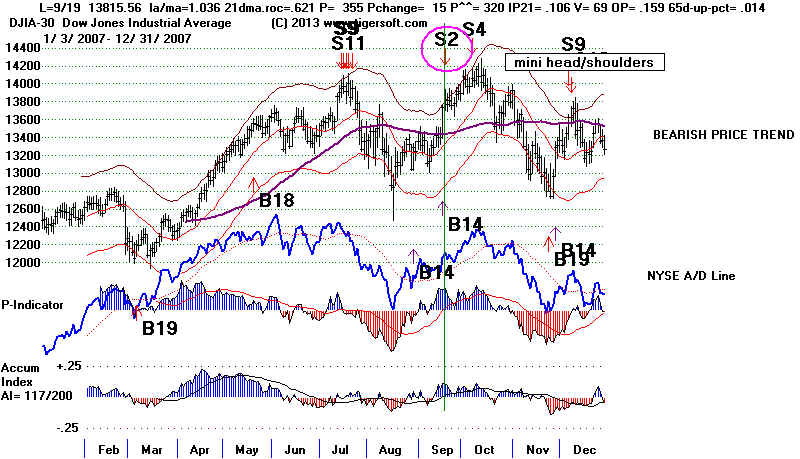 |
Code
Static
A(15)
A(1) = Val(text1.Text)
A(2) = Val(text2.Text)
A(3) = Val(text3.Text)
A(4) = Val(text4.Text)
A(5) = Val(text5.Text)
A(6) = Val(text6.Text)
A(7) = Val(text7.Text)
A(8) = Val(text8.Text)
A(9) = Val(text9.Text)
A(10) = Val(text10.Text)
A(11) = Val(text11.Text)
A(12) = Val(text12.Text)
A(13) = Val(text13.Text)
A(14) = Val(text14.Text)
'A(15) = Val(text15.Text)
For i = 1 To 14
SUM = SUM + A(i)
Next i
AVG = SUM / 14
TEXT16.Text = Str$(AVG)
-------------------------------------------------------------------------------------------------------------------------------
No Sell S2s in 1940-1942
------------------------------------------------------------------------------------------------------------------------
#2 9/20/43
147.8
+3.8% No paper loss
LA/MA
ANN ROC P-I P
ch IP21 V-I
OPct
1.033
.304 70 16 .10 39
.379
Reversing Sell...
DJI rallied to 153.10 and then declined to
the lower band (9/27/39)
After forming a head/shoulders pattern,
it fell 5% further.
-------------------------------------------------------------------------------------------------------------------------------
#3 6/21/1944
147.9
+1.8% 1.3% paper loss
LA/MA ANN ROC P-I P ch
IP21
V-I OPct
1.032
.708 127 -13 .113 192 .393
Reversing Sell...
DJI rose to 150 and then fell towards lower band.
Waiting for the NYSE A/D Line uptrend to be broken would
have helped a trader get the actual top.
A/D Line
Trend Break
------------------------------------------------------------------------------------------------------------------------
-----
#4 ( Also S11) 6/15/1948 193.20 Gain =
+2.8% No paper loss
LA/MA ANN ROC
P-I P ch IP21
V-I OPct
1.018 .157 14
9 .128 39 0
Reversing Sell...DJI immediately fell to the lower band.
A completed head/shoulders dropped the
DJI down below the lower band.
------------------------------------------------------------------------------------------------------------------------
-----
#5 4/9/1956
518.50
+7.4% No paper loss
LAMA ANN ROC
P-I P ch IP21
V-I
OPct
1.016 .61 12 -21 .109
-147 .437
DJI fell below the lower band.
A completed head/shoulders dropped the DJI
down below the lower band.
-------------------------------------------------------------------------------------------------------------------------------
#6 8/2/1956
521.0
+10.0% No paper loss
LA/MA ANN ROC
P-I P ch IP21
V-I OPct
1.017 .589 86 -3 .101
29 .505
DJI fell below the lower band.
-------------------------------------------------------------------------------------------------------------------------------
#7 6/14 /1960 654.8
4.4% No
paper loss
LA/MA ANN
ROC P-I P
ch IP21
V-I OPct
1.035 .732 41 -24
.077 128 .477
DJI immediately declined. With A/D Line very weak, it would
not have helped to wait for the A/D line trend-break to go short.
See how the decline brought a drop to well-tested support.
S9
-------------------------------------------------------------------------------------------------------------------------------
#8 9/18
/1967 938.74
8.4% No
paper loss
LA/MA
ANN ROC P-I P ch
IP21 V-I
OPct
1.032 .269 26 3
.03 2 .303
Not reversing bond...
DJI rallied to 943 and then declined below the lower band.
With A/D Line very weak, it would not have helped to wait for the A/D line
trend-break to go short. See how the decline brought a drop to well-tested support.
-------------------------------------------------------------------------------------------------------------------------------
No Sell S2 in 1972 but waiting for the NYSE A/D Line uptrend
to be broken on the July-August Summer rally would have helped
a trader pick a short-term top and make a profitable quick trade
of 3.9% on a short sale initiated and closed out on the A/D Line
trend-breaks. The automatic S1 signal would have been superior,
but not the S9s.
A/D Line
Trend Break
-------------------------------------------------------------------
#9 6/21/1976
1007.45 +4.0% Paper loss = 0.7%
LA/MA
ANN ROC P-I P ch
IP21 V-I
OPct
1.031 .124 28 -3
.058 0 .023
Note that using the NYSE A/D Line uptrend-break in the September
rally when there was no Sell would have gained a trader 2.5%
using the next Peerless Buy to cover the short sale.
A/D Line Trend Breaks
--------------------------------------------------------------------
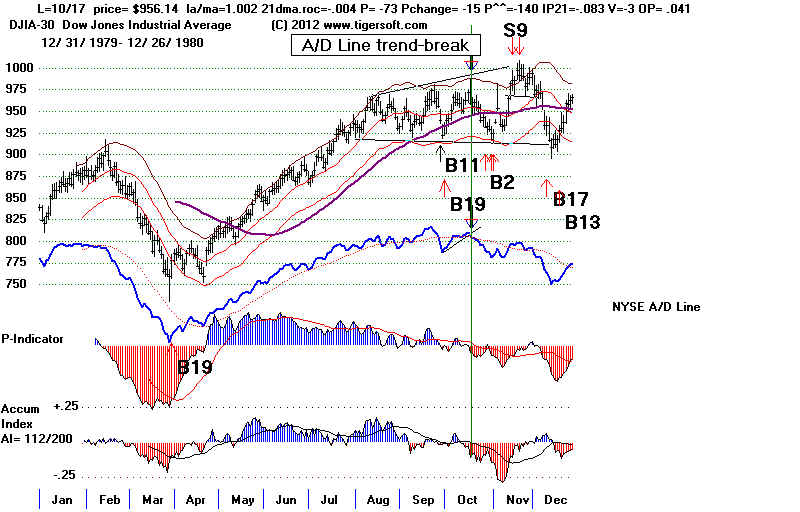
No Sell S2 in 1980 but waiting for the NYSE A/D Line uptrend
to be broken on the September rally would have helped
a trader pick a short-term top and make a profitable quick trade
of 3.1% on a short sale initiated on the A/D Line trend-break
and closed out on the next Peerless Buy or else buying at the
well-tested support line.
A/D Line
Trend Break
--------------------------------------------------------------------
No Sell S2 in 1984 but Selling on fifth test of flat resistance
would have worked out well here. A/D Line trendbreaks are late here.
----------------------------------------------------------------
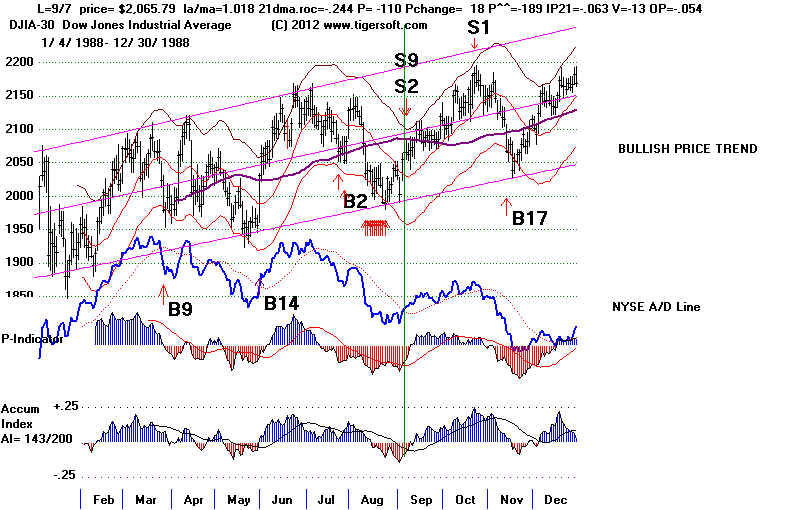
X Eliminated in 2012 updates.
9/6/88
2065.26 Loss = 0.1% Paper loss = 5.6%
LA/MA
ANN ROC P-I P ch
IP21 V-I
OPct
1.017 -.315 -128 21
-.087 -16 -.139
Waiting for for the NYSE A/D Line uptrend to be broken on the
August-September-October rally would have helped a trader
make a profitable quick trade of 4.5% on a short sale
initiated on the A/D Line trend-break and closed out on the
next Peerless Buy.
A/D Line
Trend Break
----------------------------------------------------------------
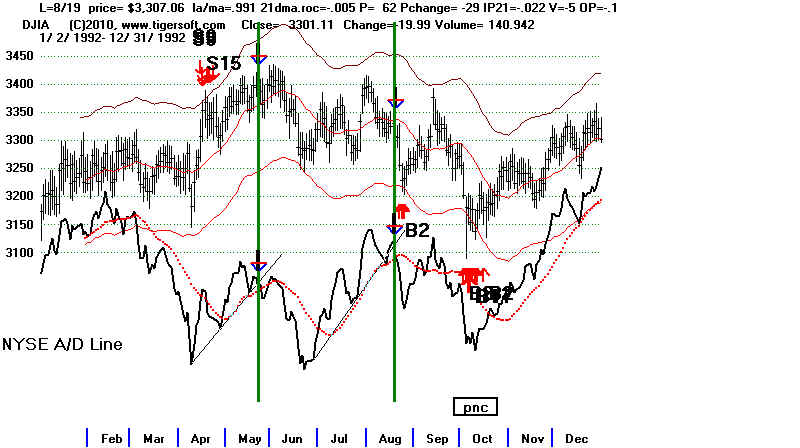
No Sell S2 in 1992 but waiting for the NYSE A/D Line uptrend
to be broken on the April-June and July-August rallies would
have helped a trader make a profitable quick trade of 3.9%
and 1.6% on short sales initiated on the A/D Line trend-break
and closed out on the next Peerless Buy.
A/D Line Trend Breaks
-----------------------------------------------------------------------
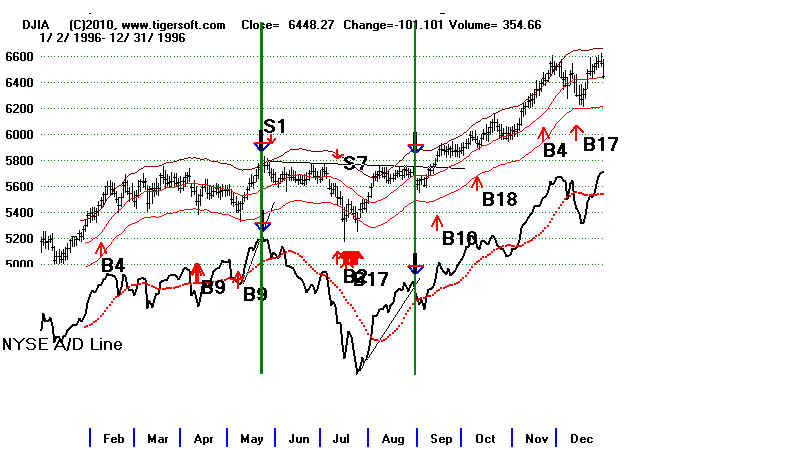
No Sell S2 in 1996 but waiting for the NYSE A/D Line uptrend
to be broken on the May and July-August rallies would
have helped a trader make one profitable quick trade of 3.1%
but also have caused a loss of 4.0% on short sales initiated
on the A/D Line trend-break and closed out on the next Peerless Buy.
When the DJI is at or near an all-time high, traders should realize
that short sales are much riskier, because of how easily prices
can be advanced in the absence of significant resistance.
A/D Line Trend Breaks
---------------------------------------------------------------------
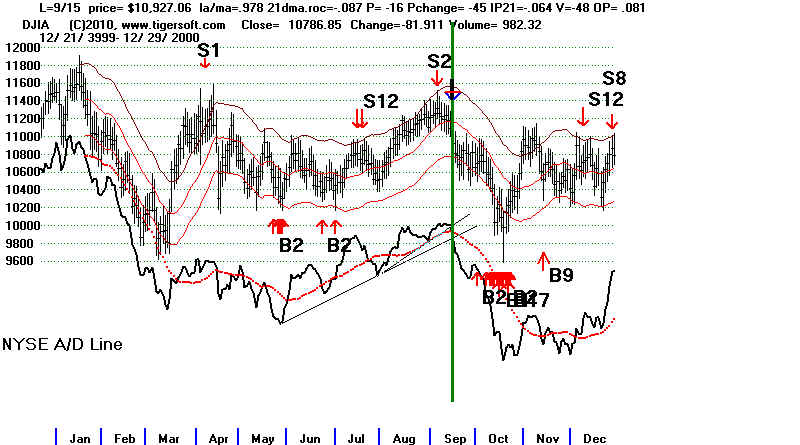
#10 9/6/2000
11310.64 +5.4% No paper loss
LA/MA
ANN ROC P-I
P ch
IP21 V-I
OPct
1.017 .476 103
-12 .013 -6 .392
In this case, using the A/L Line trendbreak in September
would have meant a trading gain of 2.1%, 3.3% less than
using the Peerless Sell S2.
A/D Line
Trend Break
----------------------------------------------------------------------
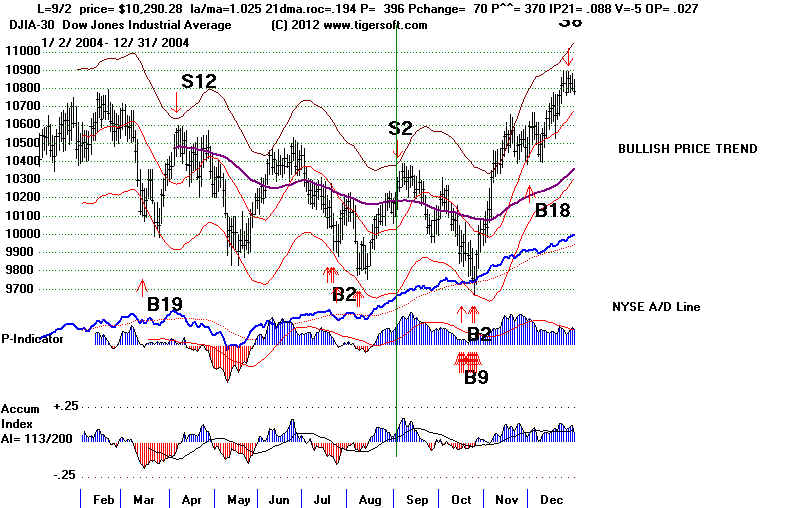
#11 9/8/2004
10313.36 +4.1%
LA/MA ANN ROC
P-I P ch
IP21 V-I
OPct
1.021 .589
532 -18 .172 89 .146
The A/D Line strength compared to the DJI was so pronounced
in this year that it would not have seemed prudent to even
take the Sell S2 short sale, though in this case it proved
profitable. Using the A/D Line trend break in July would
have enabled a trader to make a 0.8% quick gain. When breadth
is this strong vis-a-vis the DJIA, it is usually better to
focus on the Peerless buy signals.
A/D Line
Trend Break
--------------------------------------------------------------------
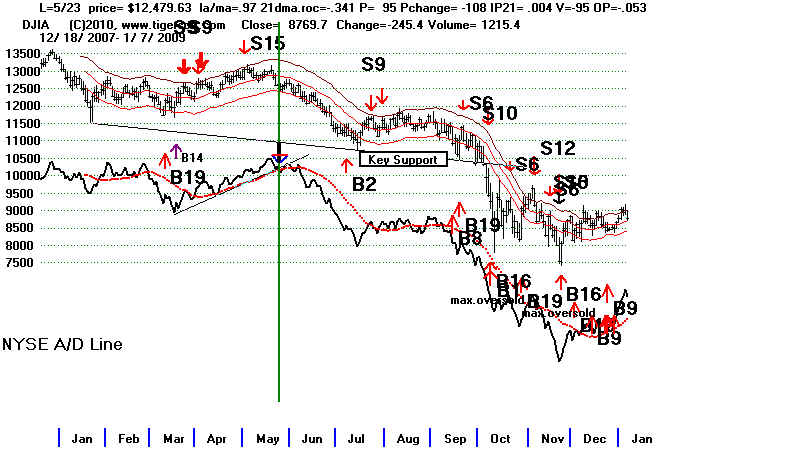
No Sell S2 in 2008 but waiting for the NYSE A/D Line uptrend
to be broken on the March-May rally would have helped a trader
make one profitable quick trade of 8.8% in case the trader
had ignored the automatic Sells at this time.
A/D Line
Trend Break
==========================================================
Automatic Sell S2s
Number of trades = 11
Avg. Gain= 4.9%