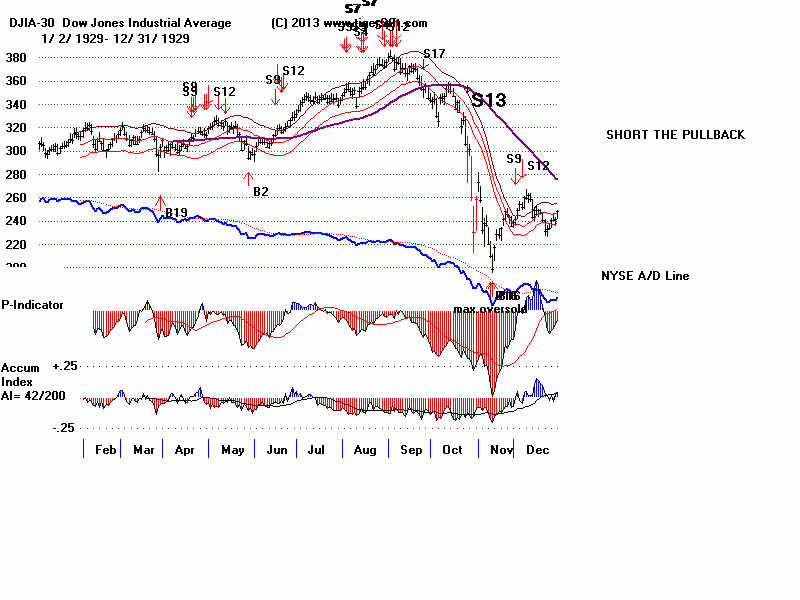
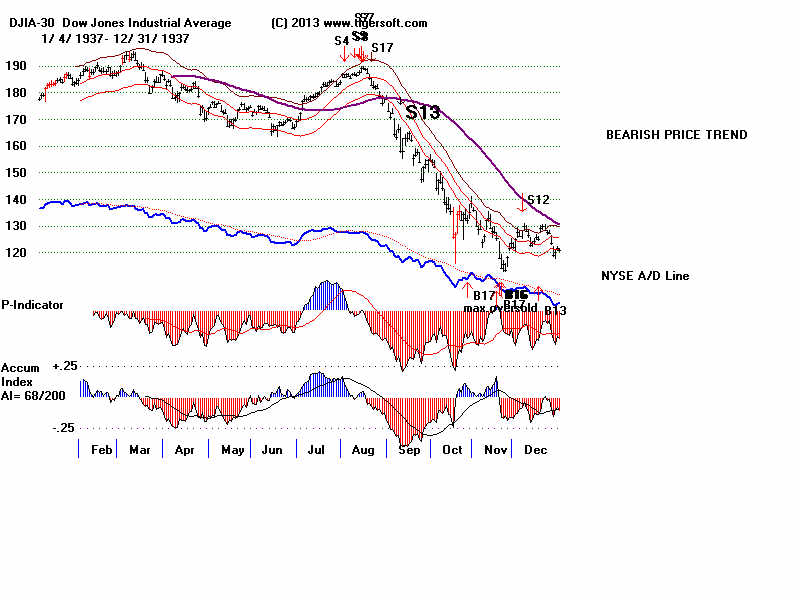
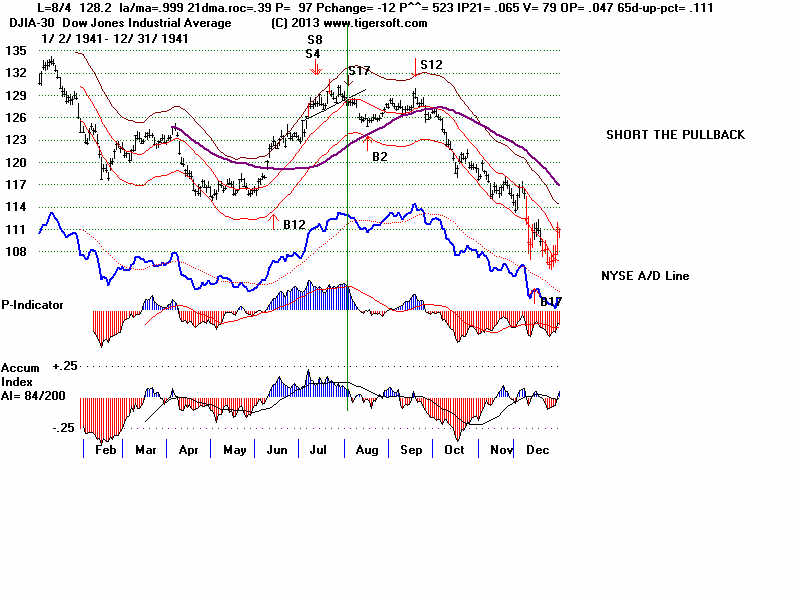
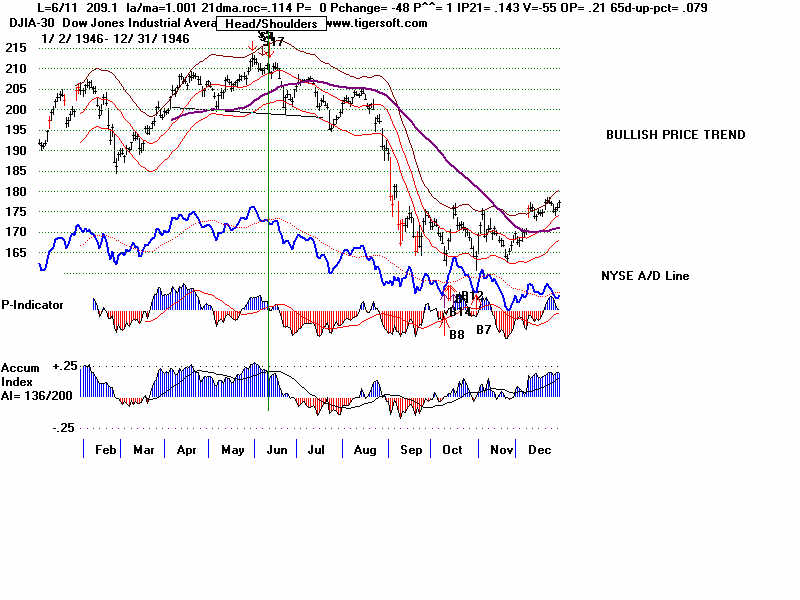
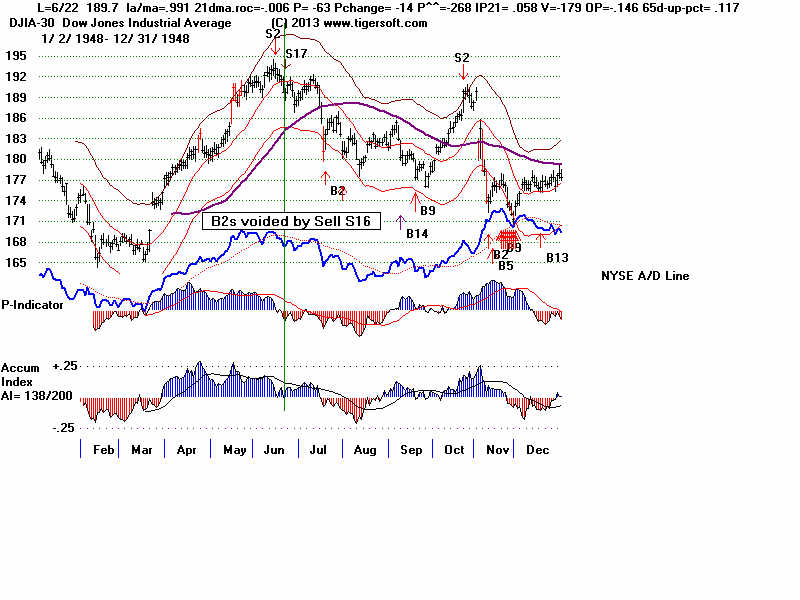
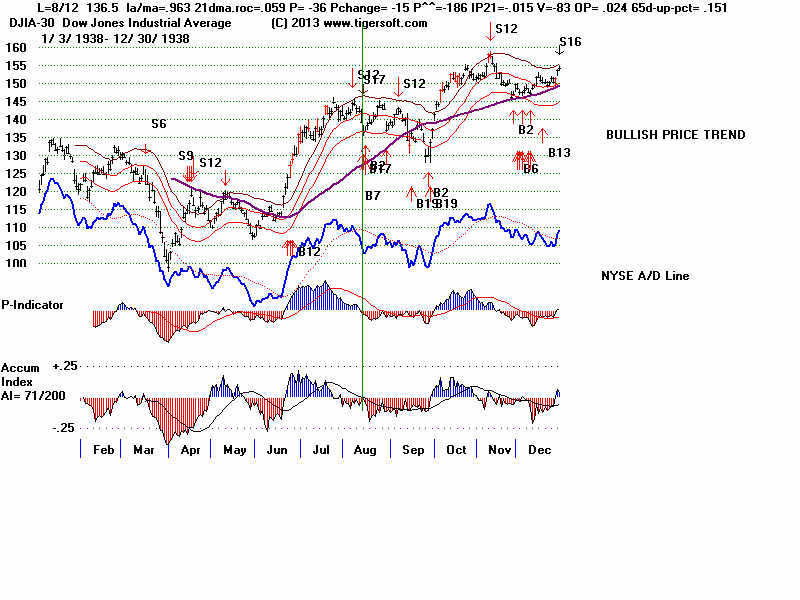
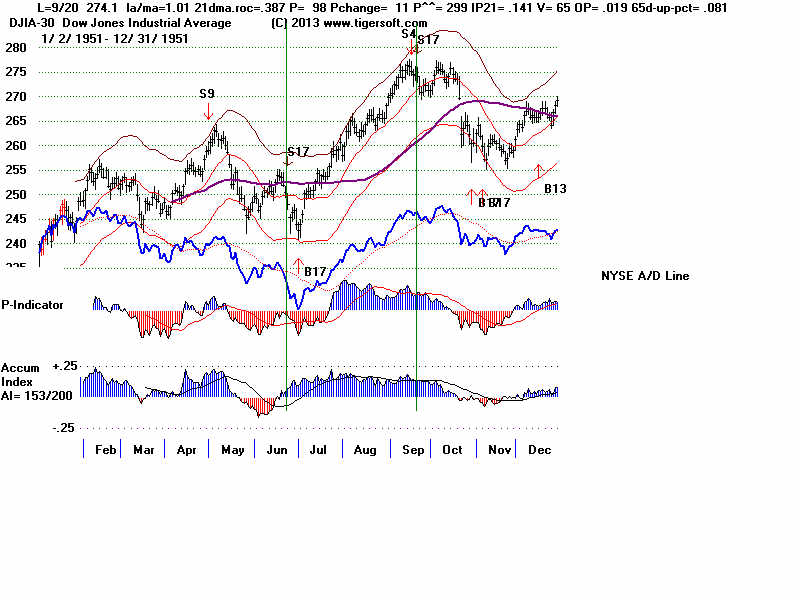
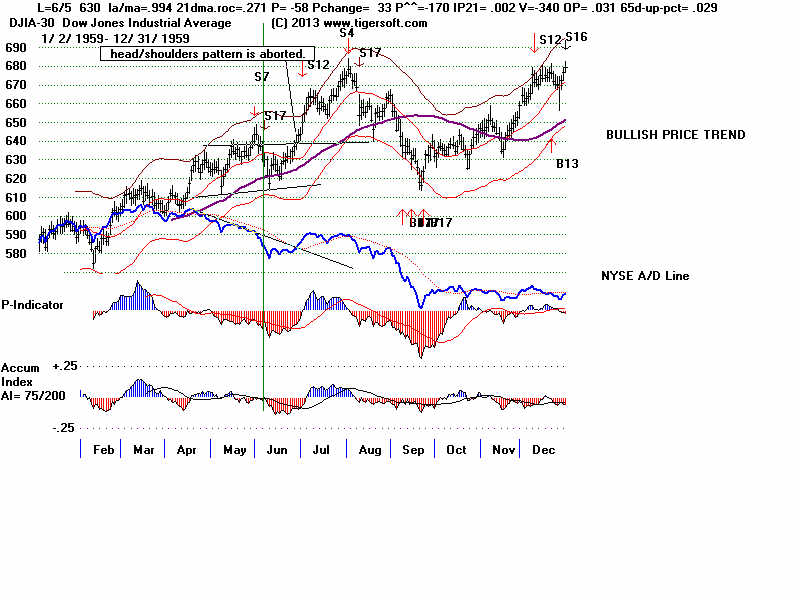
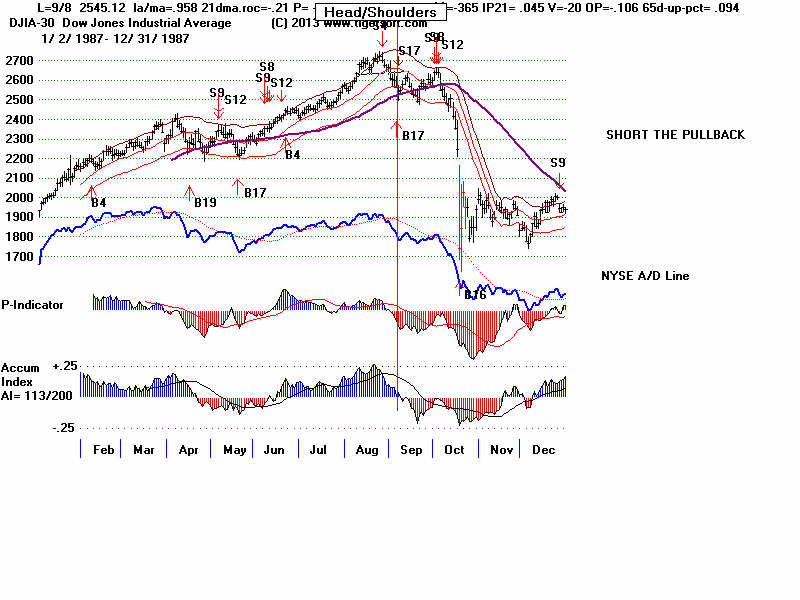
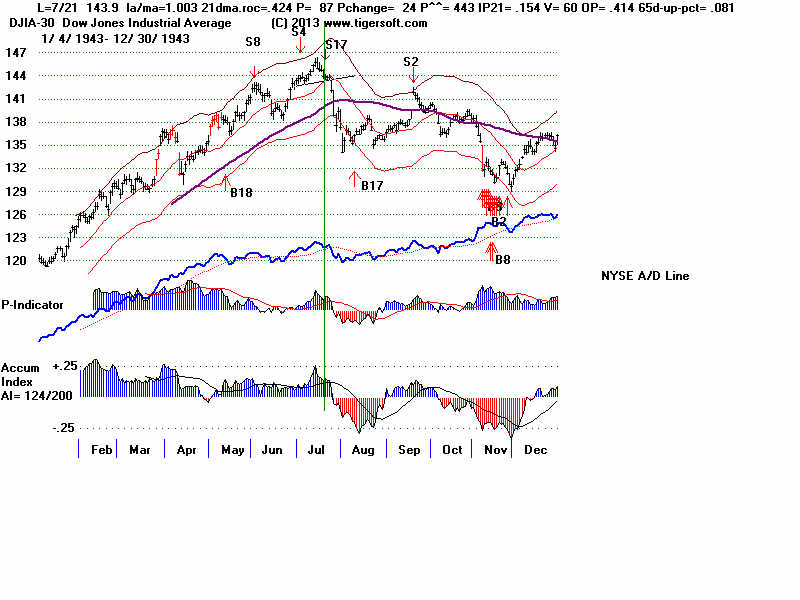
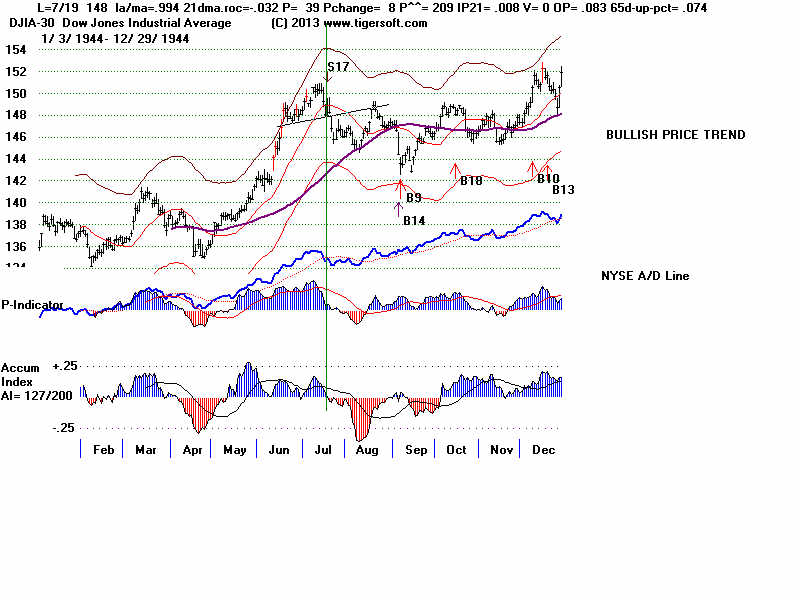
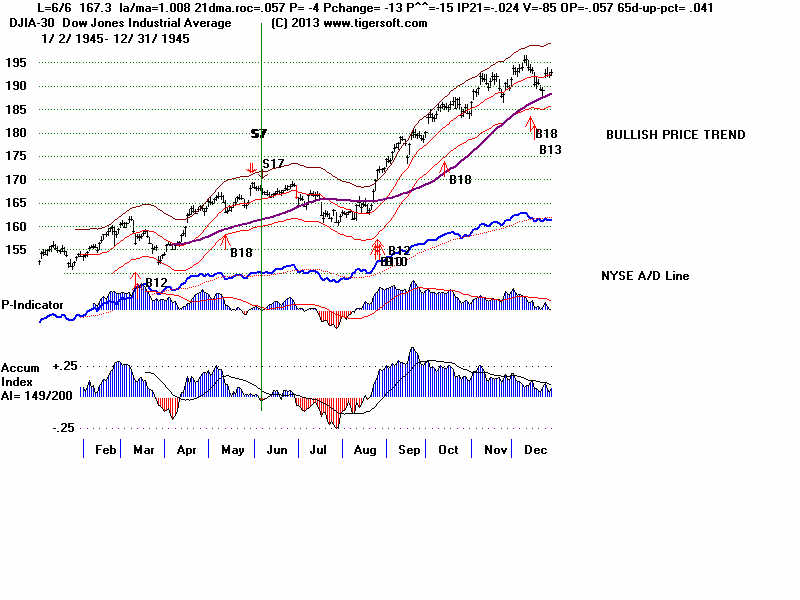
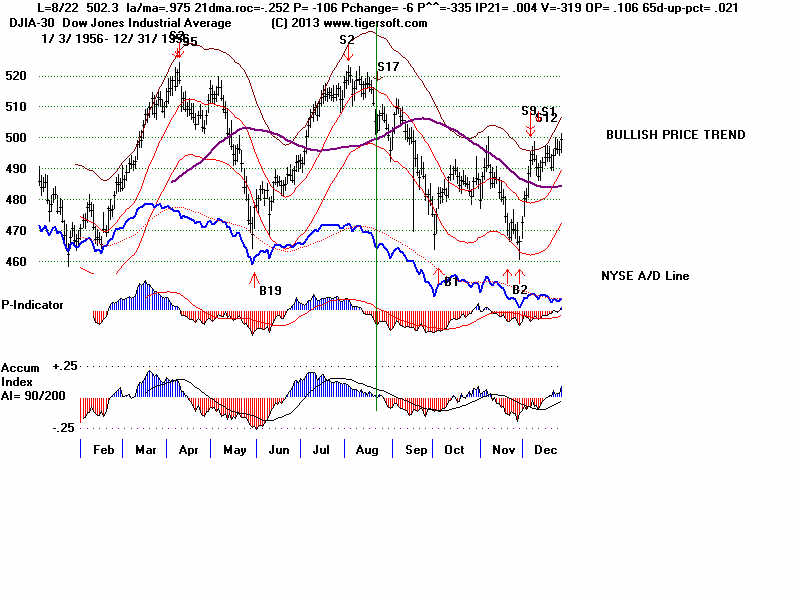
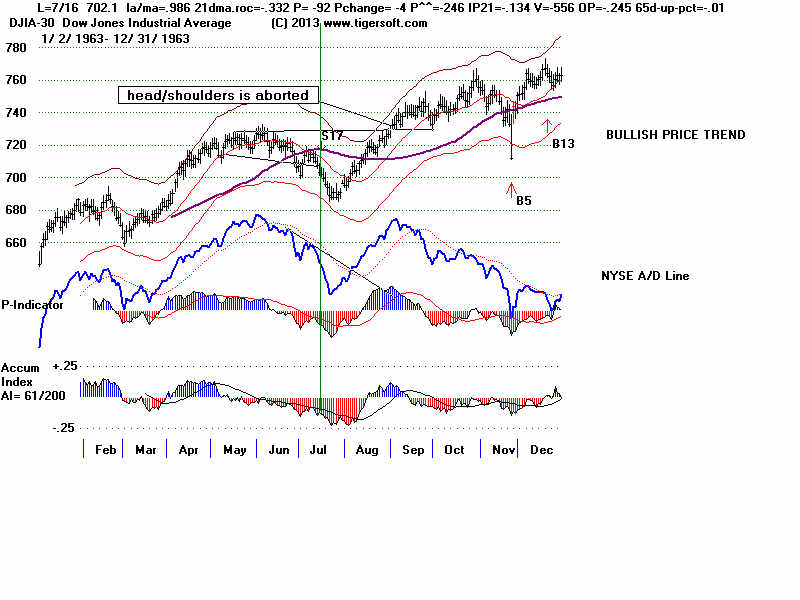
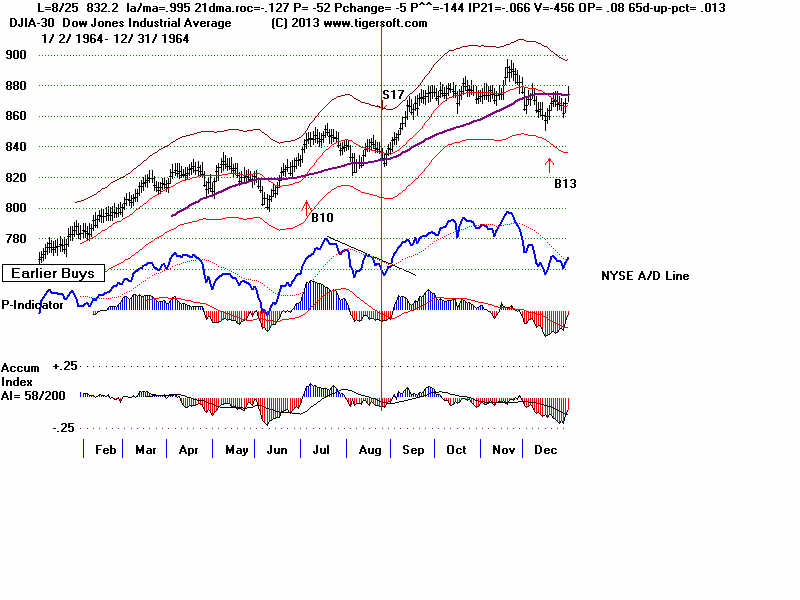
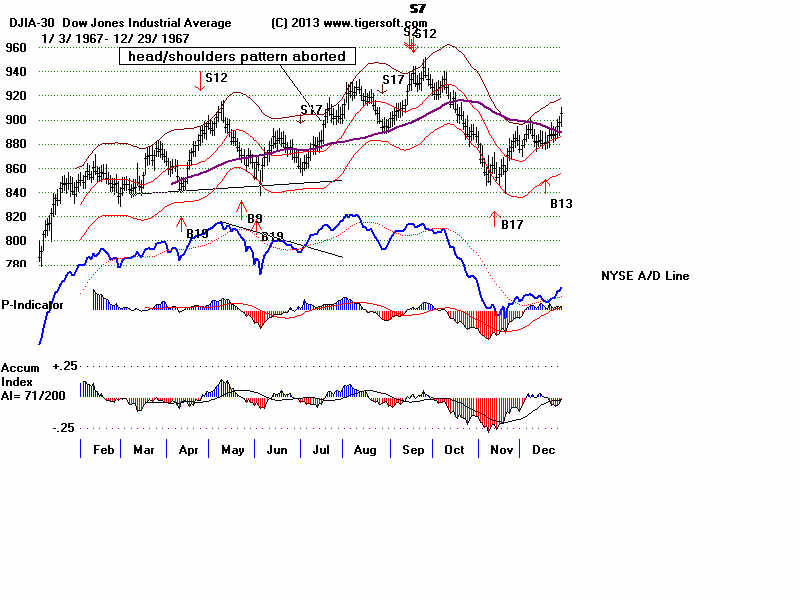
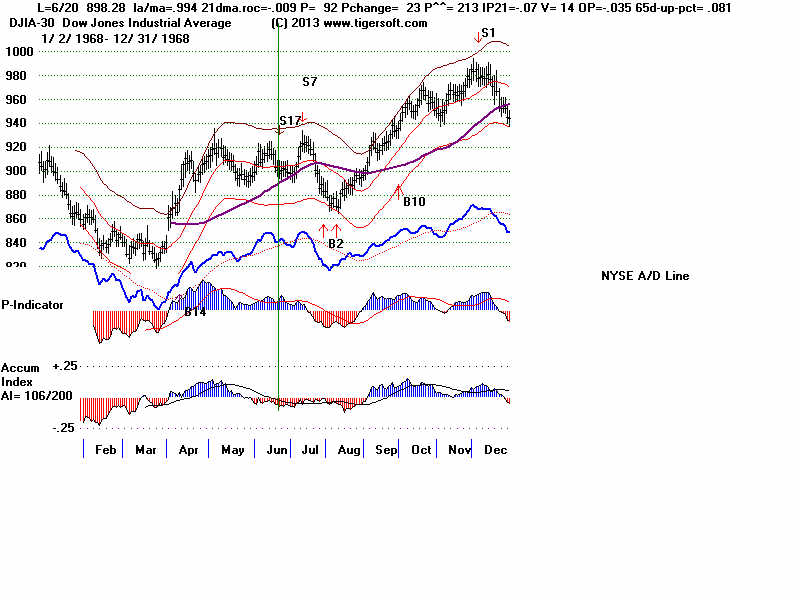
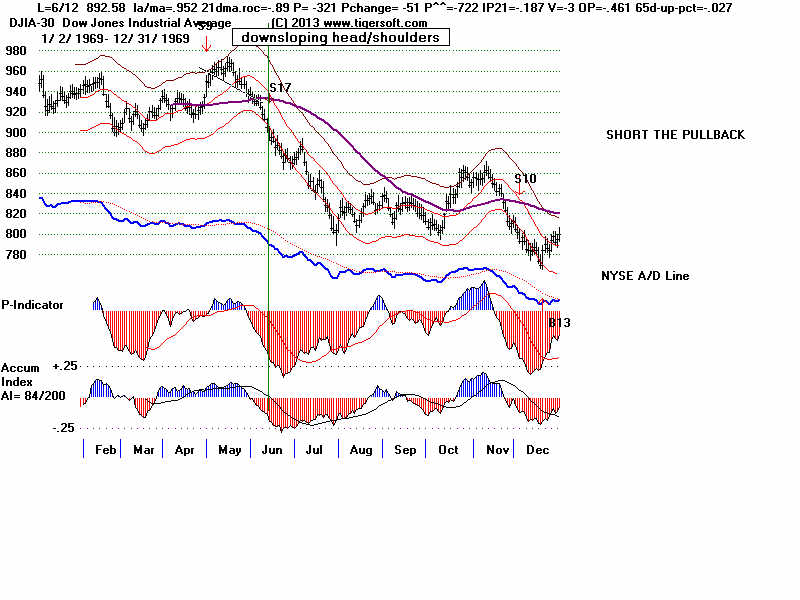
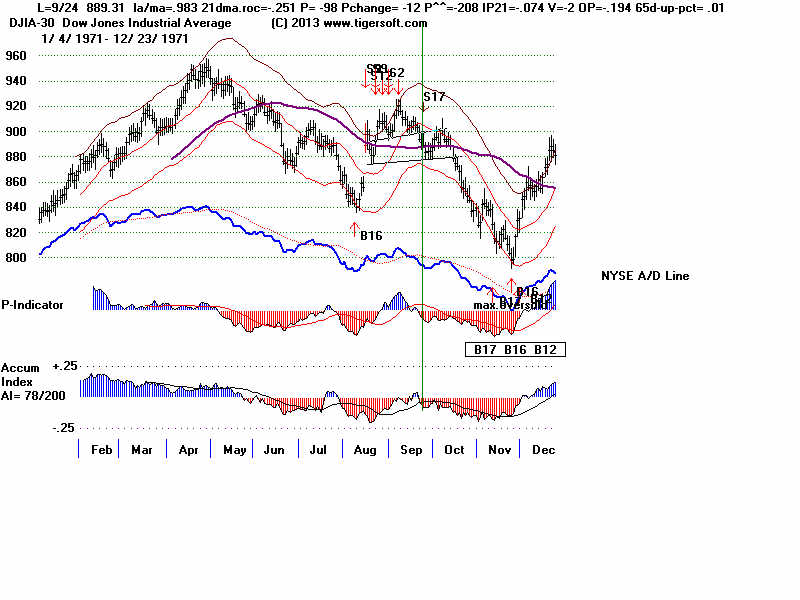
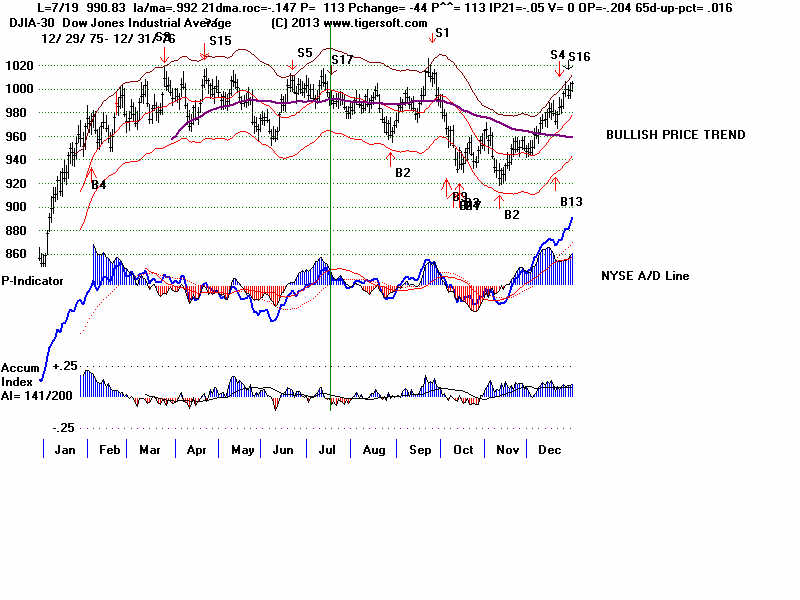
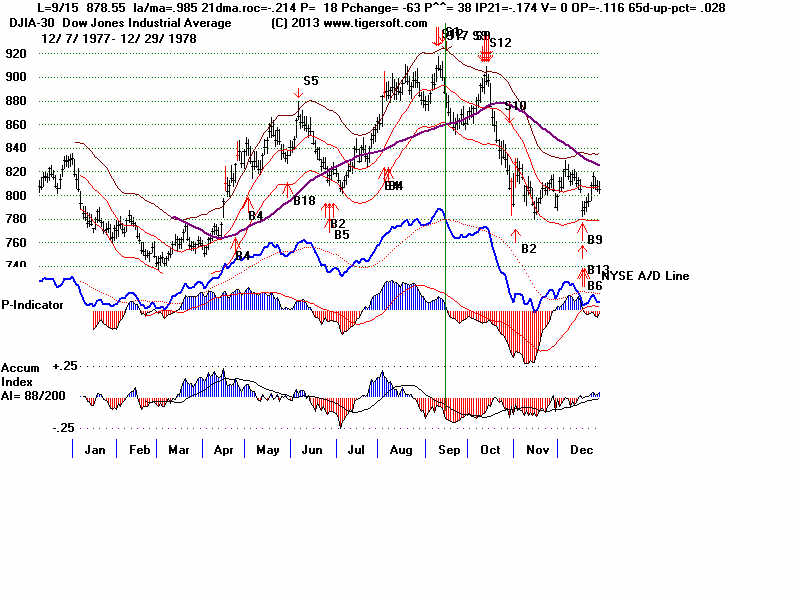
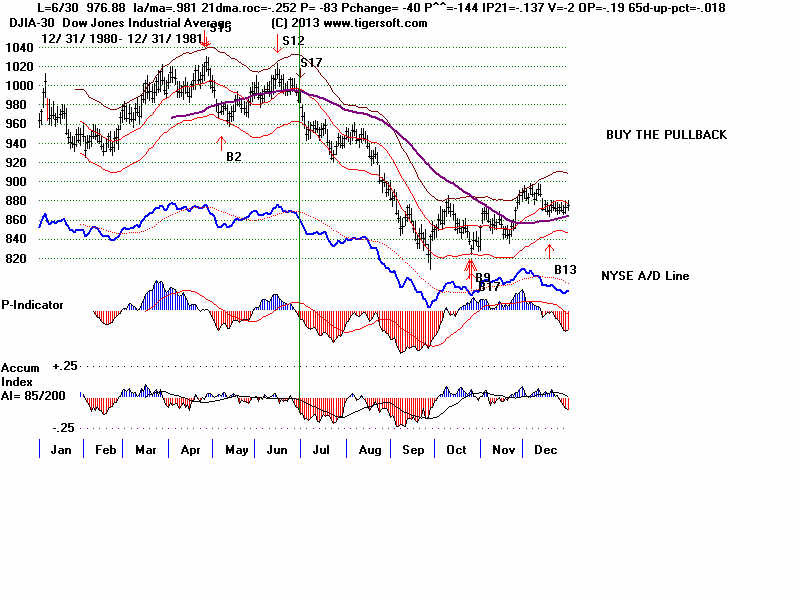
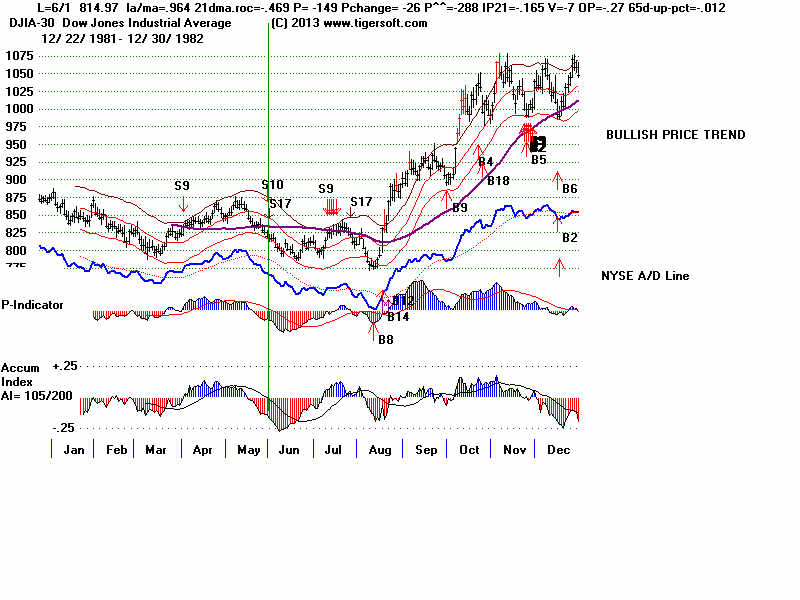
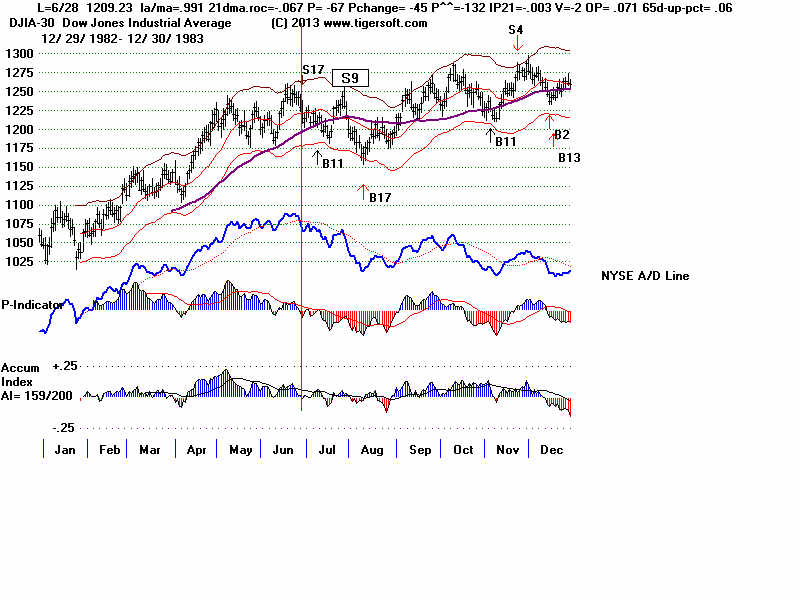
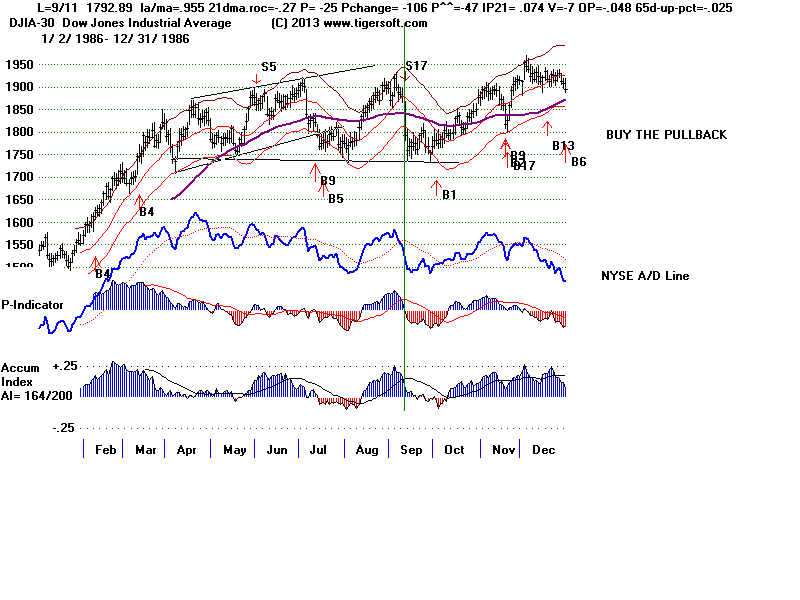
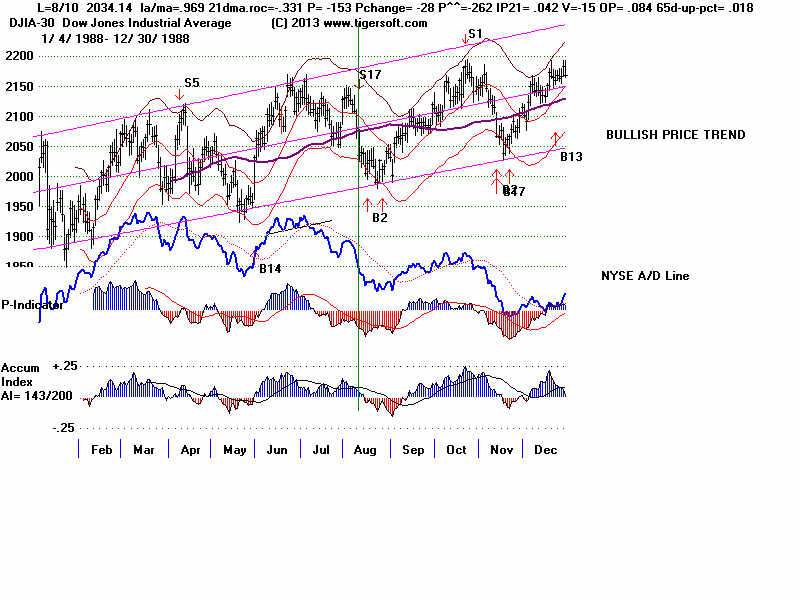
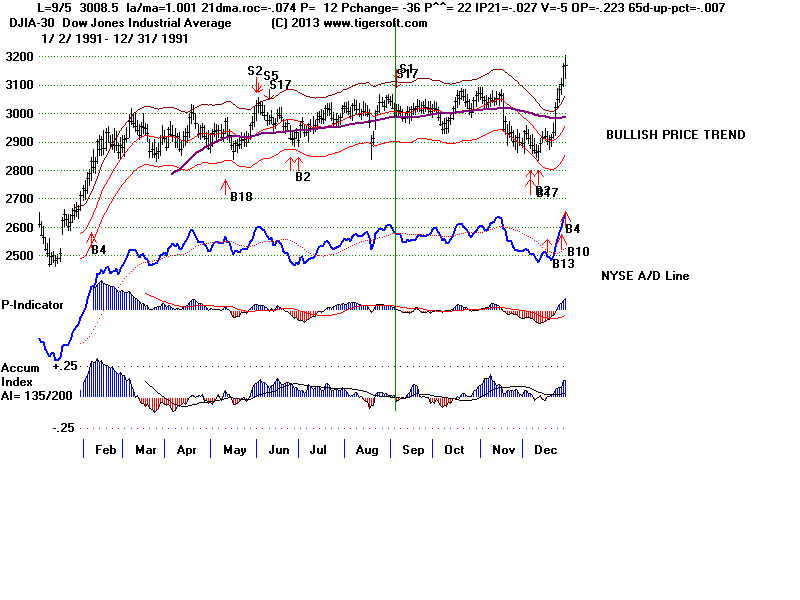
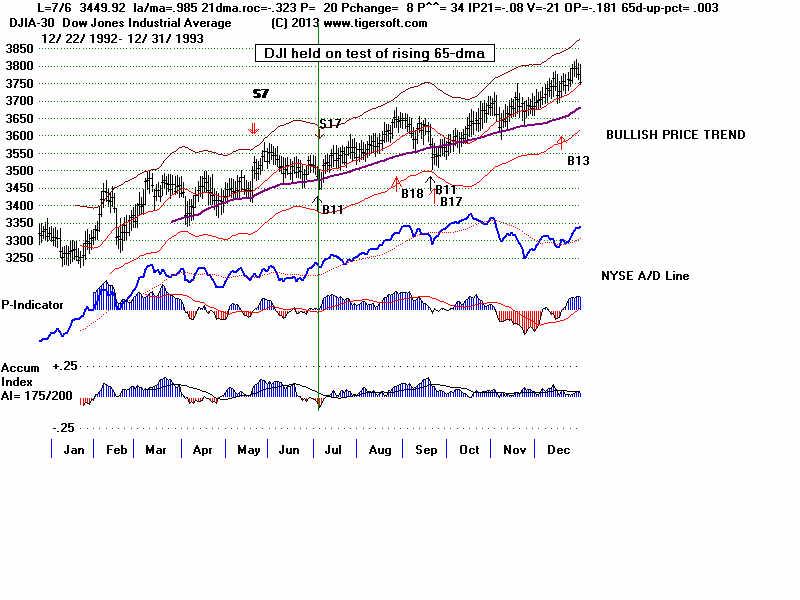
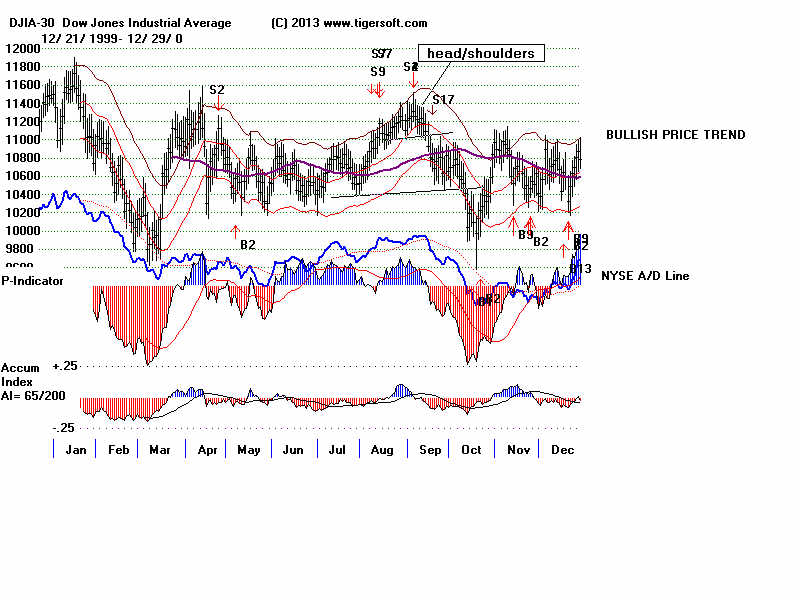
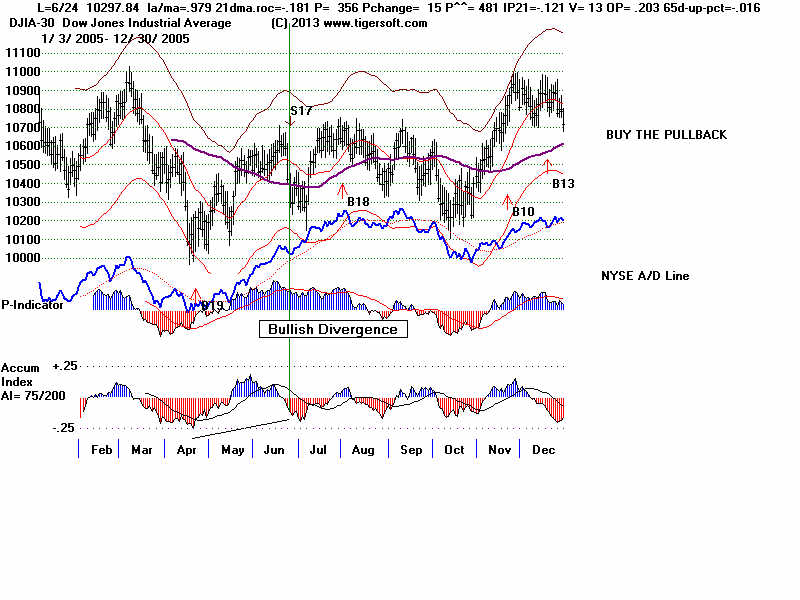
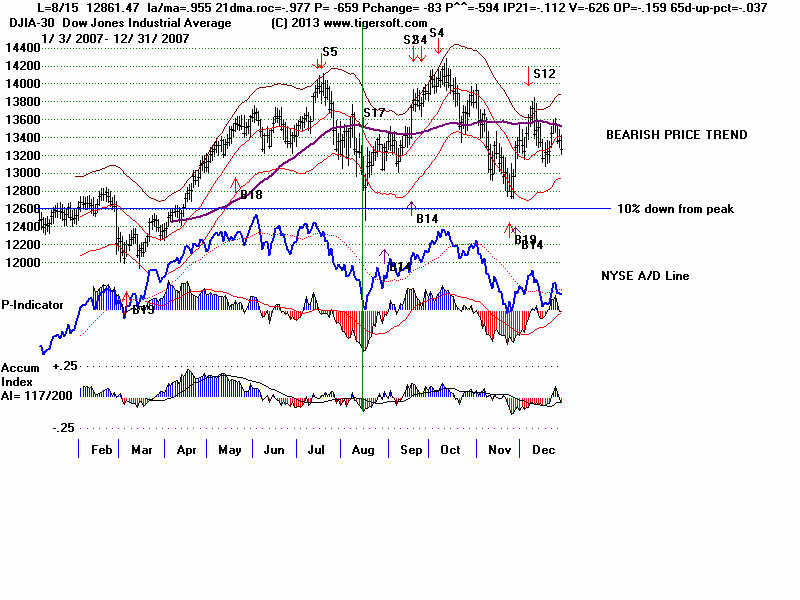
| NEW Advisory Sell S17. EDITED 8/24/2013 Rules: 1) 5 straight DJI down-days 2) June - September 3) DJI within 10% of 12 mo high. This was a powerful and reliable signal before 1948 and mostly before 1990. But it has lost much of its special potency in more recent cases. It seems that five or 6 consecutive down-days NOW sets up an oversold condition which computerized traders cannot resist playing for a short-term bounce. First see how well the signal worked before computerized trading became dominant: September 1929 9/25/1929 Completed H/S Extreme bear market followed. , August 1937 8/20/1937 Extreme bear market followed. , August 1941 8/4/1941 Completed H/S. Bear market followed. , June 1946 6/6/1946 Almost perfect. 22% decline followed. July 1948 6/22/1948 August 1957, July 1981, September 1987 and August 1990. The same idea - 5 straight DJI down days - should also be watched for early in the year. Mostly this leads to big declines 1/16/1948 2/8/1949 - weak rebound for a month and then down for two months 1/14/1960 1/10/1962 1/19/1973 1/30/1990 - DJI was already down 9.5%. This was an intermediate-term bottom. There were multiple Buy signals here. 1/25/2000 1/18/2008 This was intermediate-term bottom DJI was down 15% from high. This Advisory Sell S17 has caused too many whipsaws since 2000 to trust as a Sell Signal. If one studies these cases closely, it is sometimes helpful to suppress a Buy B2 in its aftermath (15 trading days) because that signal produces only a limited rally when there has been an Advisory S17. That is not true when there is an additional Buy signal. Here are the relevant cases to study: 8/12/1938 This was also a B2/B7/B17 and DJI quickly rallies to upper band. 6/22/1948 Head/Shoulders followed. 5-month decline See how the later Buy B2s might usefully be cancelled by this signal. 6/22/1951 Only Gained +2.1% as Buy B17 given on 6.19/1951 6/5/1959 Failed DJI fell 2% and rallied 10%. This shows how hard it is too stop a market with powerful momentum behind it. 9/8/1987 DJI rose from 2541.12 to 2640 on 10/5/1987 and then crashed. This was a case of a simultaneous Buy B17 with this S17. 1929-2013: 44 older cases: 20 declines of 5% or more 8 declines of 2% to 4.9% 6 declines of 0.1% to 1.9% 10 losses Since 2000: 4 of 11 cases brought declines of more than 5%. 4 of 11 cases brought modest losses. 9/25/1929 Completed H/S Extreme bear market followed. 8/20/1937 Extreme bear market followed. 8/12/1938 This was also a B2/B7/B17 and DJI quickly rallies to upper band. 8/4/1941 Completed H/S. Bear market followed. 7/21/1943 About to complete H/S. 3 1/2 month shallow decline followed. 7/19/1944 About to be H/S. New reversing Sell. DJI declined 2.4% when reversed on 9/6/1944. 6/6/1945 DJI declined slowly for 2 months only to LB. 6/6/1946 Almost perfect. 22% decline followed. 6/22/1948 Head/Shoulders followed. 5-month decline But see how the Buy B2s might usefully be cancelled by this signal. 6/22/1951 Gain +2.1% as Buy B17 given on 6.19/1951 9/20/1951 Gain +5.0% upon B17 reversal on 10/29/1951 8/18/1952 DJI fell for 2 months from 274.3 to 263.1 This would be a fresh reversal and should probably disallow B11 signalis immediate;y afterwards. 8/22/1956 Completed H/S. Gain +4.0% DJI fell from 502.3 to 468.7 on 10/1/1966 6/24/1957 Gain +13.1% Paper loss = (520.2 -497.1)/497.1 8/14/1957 Big Gain DJI collapsed. 6/5/1959 Failed DJI fell 2% and rallied 10%. Best way to have seen that the rally would be bigger than expected was to see how the DJI aborted its head/shoulders pattern by going above 640 on its way to 680. The NYSED A/D Line downtrend was also broken at this time. 8/10/1959 Gain +2.5% 7/16/1963 Bad but 65-day-up-pct (-.01) was too close to 0. This is a whipsaw-prone value. The breaking of NYSE A/D Line downtrend and the aborting of the H/D pattern would have limited loss here. 8/25/1964 Bad. DJI broke out and rose from 832.2 to 890 in mid November. Best way to have seen that the rally would be bigger than expected was to see how the DJI aborted its head/shoulders pattern by going above 850 on its way to 890. The NYSED A/D Line downtrend was also broken at this time. 6/30/1967 Bad. DJI rose from 860.26 to 943.08 before declining. Best way to have seen that the rally would be bigger than expected was to see how the DJI aborted its head/shoulders pattern by going above 890 on its way to 940. 8/25/1967 Gain +3.8% DJI first rose from 894.07 to 943.00 and then fell to 852.4 6/20/1968 Gain +1.7% 6/12/1969 Gain +12.2% Head/Shoulders Bear market followed. 9/24/1971 Gain +7.1% Head/Shoulders 6/9/1972 Gain +1.9% 9/11/1972 Gain +3.5% 7/22/1975 DJI fell from 846.76 to 784.16 on 10/1/1975. A simultaneous Buy B11. 7/19/1976 Gain +3.1% 9/15/1978 Gain +5.8% DJI fell from 878.55 to 785.26 on 11/14/1978 6/30/1981 Gain +14.2% Bear market followed immediately. 6/1/1982 Gain +4.6% 6/28/1983 Gain +0.3% DJI fell from 1209.23 to 1168.27 on 8/9/1983 9/11/1986 Gain +0.7% 9/8/1987 DJI rose from 2541.12 to 2640 on 10/5/1987 and then crashed. A simultaneous Buy B17. 8/10/1988 Gain +0.6% This would have been a reversing Sell signal. 8/6/1990 Gain +9.7% Head/Shoulders Sell S9. This makes selling 8.6% beloiw the top OK. 9/5/1991 Gain +4.0% 7/6/1993 Loss. A simultaneous reversing Buy B11. Rising 65-dma held and DJI rallied. " 8/21/1995 Loss -4.1% Rising 65-dma holds. 6/141996 Gain +2.5% 9/19/2000 Gain +5.1% 6/24/2005 Loss -3.2% A warning here: the DJI was down 1.6% from 65-days earlier. This sets up a whip-saw around the 21-dma. 8/15/2007 Loss -3.3% This was late. The DJI recovered on the first test of its 10% down position. 8/16/2010 Gain +0.3% 6/7/2011 Gain +0.2% DJI immediately rallied form 12072 to 17241 and then fell to 10809 on 10/4/2011 7/28/2011 Gain +7.9% DJI immediately fell from 12240.11 to to 10809 on 10/4/2011 |