-------------------------------------------------------------------------------------------------------------------
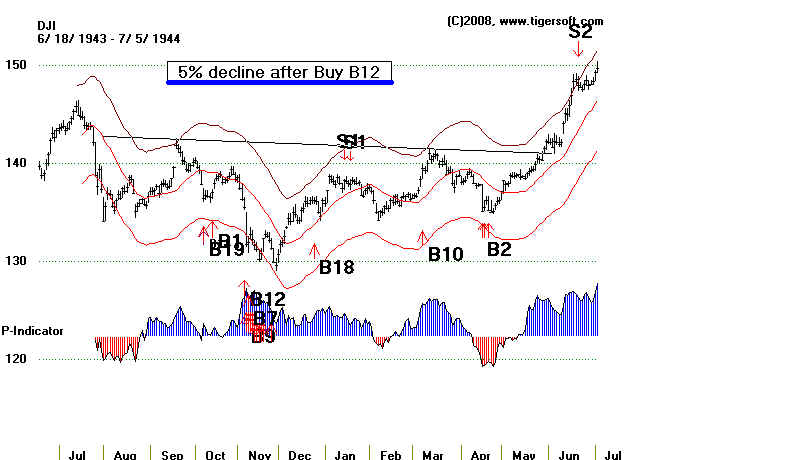
BUY B12s: 1928-201319320725 B12 49.8 .53
1.125 .809 56 15 401 .083 78 .144 -.197
--------------------------------------------------------------
19330315 B12 62.1 .646
1.112 .641 -33 38 -239 .131 -103 .357 .056
--------------------------------------------------------------
19330419 B12 68.3 .496
1.159 1.709 24 29 177 .119 155 .069 .094
--------------------------------------------------------------
19380622 B12 123.9 .166
1.095 1.056 43 34 231 .08 61 .235 .029
--------------------------------------------------------------
19390905 B12 148.1 .041
1.08 .557 -123 50 -564 .182 -78 .263 .083
--------------------------------------------------------------
19410612 B12 122.9 .041
1.044 .578 50 12 267 .106 22 .444 -.044
--------------------------------------------------------------
?19450312 B12 157.9 .039
.995 .165 191 12 867 .129 252 .343 .062
--------------------------------------------------------------
19450827 B12 171.9 .159
1.048 .618 148 9 672 .159 97 .376 .036
--------------------------------------------------------------
?19461014 B12 169.9 .081
1.00 -.245 3 -5 11 .023 -66 -.058 .168
--------------------------------------------------------------
?19470523 B12 167 .107
.988 -.225 -78 22 -324 -.053 -142 -.066 -.076
--------------------------------------------------------------
19480322 B12 173.7 .112
1.035 .412 41 25 177 -.052 20 .151 -.032
--------------------------------------------------------------
19500721 B12 207.7 .247
.998 .843 -17 10 -59 -.045 -325 -.176 -.035
--------------------------------------------------------------
19501109 B12 227.2 .14
.996 -.146 74 59 270 .028 20 .197 .052
-------------------------------------------------------------
19501205 B12 225.4 .15
.985 -.099 201 2 729 .131 270 .242 .038
-------------------------------------------------------------
19530803 B12 276.1 .081
19540106      B12            284           .051
19580106      B12            442.6         .455
19711130      B12            831.34        .154
19741014      B12            673.5        -.028
19750128      B12            694.77        .245
19760106 B12 890.82 .133
19790105 B12 830.73 .066
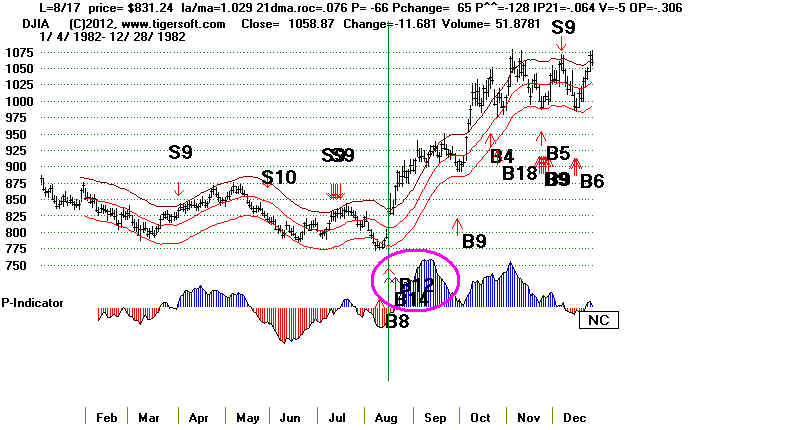
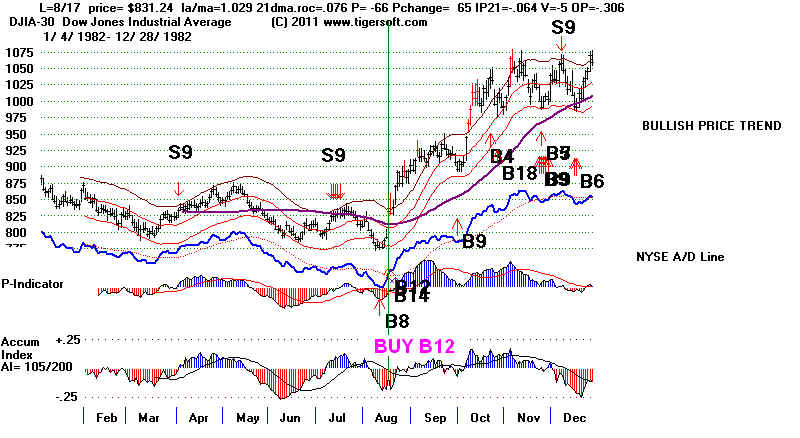
19820817 B12 831.24 .272
19910117 B12 2623.51 .154
20090403 B12 8017.59 .05
--------------------------------------------------------------------
no.=25 .189 redo
16 4 3 1 Presi. El.Year 3 .258 PE + 1 6 .243 PE + 2 9 .170 PE + 3 6 .128 January 6 .184 February -- ---- March 3 .266 April 1 .496 May 1 .107 June 2 .104 July 2 .389 August 3 .171 September 1 .041 October 2 .027 November 2 .147 December 1 .150 Days of Month 1-10 8 .140 11-20 8 .213 21-31 8 .215 |
- edited 1/18/2013 ----------------------------------------------------------------------------------------------
Buy B12s are often like a powerful vitamin booster
for the stock market. They
can end a
bear market and bring a market blast-off and a buying stampede.
8 of the 34
Buy B12s brought huge rallies, where the the DJI did not get a reversing
Peerless
Sell signal until it was up at least 18.5%. After a bear market, the average
gain
following a Buy B12 is 20% in 16 cases. When they occur in an on-going bull
market, the
average gain is a much more modest 8%.
The Buy B12 is primarily based on a
great surge of very positive breadth.
It can also
occur if the DJI advances 8% in one day and closes either above
its 21-day
ma, thereby clearing the way for more of a run, or it closes 20% below
the 21-day
ma and still has more upside potential. There are only a few cases
of Buy B12s
arising out of a one-day advance, all in the 1930s.
The very
positive breadth-based Buy B12 grew out of the experience in August 1982.
After a
long and dreary market, on August 13th in that year, the market exploded
upwards.
A string of very good breadth days suddenly occurred.
It would
easy to have missed the turn if only at the daily numbers. In producing
the Buy
B12, Peerless considers the suddeness of days with ratios of advances to
declines of
nearly 3:1.
What
started the buying spree here that began the Great Bull Market of the
1980s
was word that the Volcker era of very high interest rates was ending.
It
had brought a recession in the US. Mexico was on the verge of financial
collapse, one which would shake the foundations of the US banks. In
addition, Reagan realized that his popularity was disappearing very rapidly.
Articles of impeachment of Fed Chairman Volcker were threatened by leading
Reppublicans and Democrats. So, without a public announcement, Volcker
finally gave in to the pressures sound him. Without doubt, the Fed Governors
told
their banking and brokerage associates of the Fed Chairman's change
of
thinking and a buying panic began. Peerless, of course, was not privy to
such
discussions. But, we recognized early-on the change from the suddenly
very
fine breadth statistics, that produce a Buy B12
Sources:
http://www.thefreelibrary.com/Lessons+from+the+great+inflation%3A+Paul+Volcker+and+Ronald+Reagan%27s...-a0191010863
Data NY Advances
NY declines
-----------------------------------------------------------
776.9 (low) 8/12/1982
643
759 poor
788. 1 8/13/1982
946
473 good
792.4 8/16/1982
1146
411 very good
831.2 8/17/1982
1564
155 exceptiomally strong
Buy B12 on this day.
829.4 8/18/1982
1247
484 very good
838.6 8/19/1982
793
705 consolidation after 6% gain in a week.
869.3 8/20/1982
1384
280 exceptionally strong
891.2 8/23/1982
1352
349 exceptionally strong
874.9 8/24/1982
960
696 OK
884.9 8/25/1982
1268
402 very good
892.4 8/26/1982
1189
460 good
(1) 7/25/1932 +49.2%
bull market starts
(2) 4/10/1933 +65.4%
bull market starts
(3) 10/14/1946 +18.5%..
bull market followed
(4) 11/9/1950 +18.8%.
.028 +.186 bull market rally followed
(5)
1/6/1958 +41.0&
bull market followed
(6) 1/28/1975 +20.2%
.102 .574 bull
market starts
(7) 1/6/1975 +31.1%..
bull market followed
(8) 8/17/1982 +27.2%.
bull
market eventually followed
There
have been 34 closed out Buy B12s since 1928. Only 5 produced losses and the
average
gain was 14%. They register a highly unusual series of very positive
breadth
days (daily NYSE advances-declines) and a very high ratio of NYHSE advancing
stocks'
volume to declining stocks' volume. This
means that the Buy B12s before 1965
must be
considered a mite suspect because up and down volume had to be estimated
by the
ratio of advances to declines times NYSE volume. They are reinforcing Buy
signals
nearly always.
They are most often bear market killers. Two Buy B12s were needed to end the
bear
markets of 1946, 1973-1974 and then launch new bull markets. The first B12s
were
premature. More tests of the lows were needed to prove the bottom was at hand
and bring
the necessary confidence for a bull market to start. 17 of the Buy B12s
occurred at
the end of a bear market. Only in 2 or 3 cases (if you count January 2009)
did the DJI
not soon end the bear market.
B12s in Bear Markets
Date Gain
IP21 OPct
Result
Paper Loss
6/24/1931 +0.7%.. .087
+.001 bear market continued
1/12/1932 -0.8%
-.047
-.076 bear market continued
1%
7/25/1932 +49.2%
.083 .132 bull market starts
4/10/1933 +65.4%
.03 .367 bull market starts
6/22/1938 +13..4% .08 .216
bull market starts
10/14/1946 +18.5%.. .023 .054
bull market followed
3%
1/6/1958 +41.0%
-.081
.051 bull market followed
2%
6/1/1970 -0.8%
-.081
.051 bull market eventually followed
11/30/1971 +13..4% -.047
.021 bull market followed
10/10/1974 +1.0% -.049
.196 bull market followed
1/6/1975 +31.1%..
-.004 +.355 bull market
followed
1/28/1975 +20.2% .102
.574 bull market starts
1/5/1979 +7.6%.. .005 +.15
bull market rally followed
3%
8/17/1982 +27.2%.
-.064 -.306 bull market eventually followed
1/17/1991 +27.8%..
.006 +.155 bull market rally followed
(1/5/2009 +0.7% -.01 -.104 bear market continued. - No longer counted.)
3/12/2009 +9.3%.. -.113
-.214 bull market
followed
----------------------------------------------------------------------------------------------------------
N=16 Avg = + 20.3%
7 of the 16 brought gains of more than 20%
+13.7%
where OPct was below +.10
+13.1% where IP21<0.
4 paper losses, all 3% or under.
Buy B12s are only about half as powerful when they occur in
established
bull markets. Buy B12s do not usually occur in extended
bull markets. The
1944 and 1945 Buy B12s are the exceptions. They were all profitable. The
level
of the IP21 was not a good predictor of how powerful a B12 would be in an extended
bulli market.. Buy B12s in the third year of the 4-year Presidential cycle were
reliably bullish until 2011: 1943 +9.0%, 1947 10.4%, 1953 +8.5%, 1991 +27.8%.
In 2011, there were two mediocre
B12s. Perhaps, the takeover by computerized trading
is compressing too much activity into a very short time.
Rising Market Buy B12s
Date Gain
IP21 OPct
Result
Paper Loss
9/30/1938 +11.3%.. .077 +.048 bull market rally followed
1/3/1940 -
5.2%.. .072 +.069
War in Western Europe brought big decline. 5%
6/12/1941 +4.8%.. .106 +.396
Small rally and then Pearl Harbor.
Bad Data? 11/4/1943 +9.0%..
-.179
-.135
5%
1/3/1945 +6.3%.. .245
+.408 Small rally..
2%
3/9/1945 +3.9%..
.133 +.29 Small rally..
3%
8/7/1945 +15.9%.. .159 +.349
bull market rally followed
5/23/1947 +10.4%.. 11/5/1948
+1.6%.. .161 +.188 Small rally..
4%
3/22/1948 +11.2%.. -.052
+.142 bull market rally followed
This was a reversing Buy.
11/5/1948
+1.6%.. .161 +.188 Small rally..
4%
7/21/1950 +11.5 .. .-.045
-.188 bull market rally followed
11/9/1950
+18.8% .028 +.186 bull market rally
followed
1%
This was a reversing Buy.
12/5/1950 +16.5%.. .131 +.176
bull market rally followed
8/3/1953 +8.5%.. .101
+.234 bull market rally followed
7%
1/6/1954 +5.5%.. .079 -.287 bull market rally
followed
1/6/1976 +13.3%.. .169 +.441 bull
market rally followed
4/3/2009 +9.3%..
.157 +.286 bull market rally followed
7/1/2001 .. -.01
-.031
.077 bull market rally
followed
8/11/2011 +3.7% -.131
-.216
4%
----------------------------------------------------------------------------------------------------------
N=20 Avg = + 8%
8 of 20 brought gains of more than 10%
6 of them showed paper losses between 3% and 7%.
January
B12s usually start off a very good year.
Paper
losses were usually minor, under 4%. About one third of the time, the DJI had
to
retest the
lower band before starting a very good rally. Counting on such a decline
to the
lower band would not have been advisable in 1975, 1976, 1982 and 1991 when
the Buy B12
launched the best bull markets of the last 35 years.
Watching
for head and shoulders patterns soon after a Buy B12 was advisable.
This would
have let profits be locked in nicely in 1941, 1946, 1947 and 1951.
Buy B12s
that occur right at well-tested resistance after a bear market may not
produce the
power to make a breakout over that resistance. The October 1974
Buy B12
failed to produce a price breakout, while the January 1975 did. And this
allowed the
market to advance.
Bear market B12s are the most bullish of all Peerless signals. They have launched
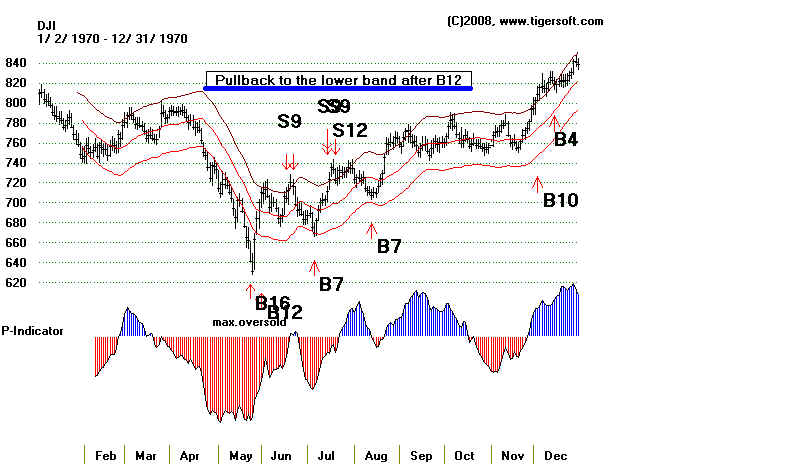
many a new bull market, as in 1947, 1950, 1953, 1958, 1970, 1971, 1975, 1976, 1982, 1991.
There have been 25 closed out Buy B12 trades. The average gain on the at the time of the
next Peerless Sell was +16% in the 27 cases originally counted. Only two saw a loss.
B12's can start a bullish stampede into stocks. In 12 cases, or 48% of the time,
very powerful rallies immediately followed. They are not perfect, of course. In 4 of
the 25 cases the DJI declined more than 4.4% from the Buy B12, always to eventually
recover and move much higher. Declines back to the lower band occurred in a
handful more cases.
Some January B12s can be very bullish. In 6 of 9 cases, a January Buy B9
brought an immediate, straight-up, advance. The average gain for these
January Buy B12s was +23.4%. You can see the cases: 1945, 1954, 1958, 1971,
1974, 1975 (twice), 1976 and 1991. Note that special rules have been employed
to drop the two cases of losses in January 1979 and January 2009.
As bullish as B12 signals are, they do not always bring a breakout when more
basing is needed. Fortunately, paper losses were small in all but two cases. It should
be said that buying at the lower 3.5% band after a Buy B12 always proved profitable,
with the exception of November 1948 (when Truman surprised Dewey,) If the NYSE
A/D Line breaks its uptrend before a decisive breakout, look for more basing.
When the IP21 is below -.10 or the Opct is below below -.053 when there is a
B12 look for a decline ot the lower band before a rally. See the cases of
11/5/43, 3/12/45, 10/14/46, 6/1/70, 10/10/74.
Buy B12s with negative IP21 readings did very well. This suggests that breadth
surges trump red distribution. 9 of the 14 B12s with negative IP21 gained more
than 10%.
Buy B12s after 1942 with Negative IP21s
IP21 Gain
11/5/43 -.201 +2.0%
5/23/47 -.053 +10.4%
3/22/48 -.053 +11.2%
1/7/49 -.004 +18.8%
7/21/50 -.045 +29.9%
1/8/58 -.081 +41.0%
6/1/70 -.026 -0.8%
11/30/71 -.047 +13.4%
10/10/74 -.049 +1.0%
1/6/75 -.004 +31.1%
8/7/82 -.064 +27.2%
3/12/09 -.113 +22.0%
7/1/11 -.031 -0.1%
8/11/11 -.131 -3.1%
-------------------------------
Avg = 17.2%
After a B12 fails to bring a breakout above price resistance in the form of the upper
band or a flat top, the lower band usually must be tested This is because
B12s often occur late in a bear market as a bottom is being formed. Since
"V" bottoms such as seen in 1971 are quite rare, B12s that occur early in the
bottoming process are premature, rather than being false starts.
Usually it is profitable to buy on the next decline to the lower band in the month
following a Buy B12. These occurences usually bring Buy B7s, a unique Peerless
Buy signal.
Sometimes it takes more than one Buy B12 to launch a rally. That typically is because
the B12 takes place late in the bottoming process is. Clearly a third Buy B12
in an 8 month period is very bullish.
Sets of Multiple Buy B12s
Dates Gain Produced by Last Buy B12 in series.
----------------------------------------------- ---------------------------------------------------------------
Jan 1945 - Aug 1945 3 cases. +15.9%
Oct 1946 - May 1947 3 cases +10.4%
Nov 1948 - Jan 1949 2 cases +18.8%
Nov 1949 - Jan 1950 2 cases +29.9%
July 1950 - Dec 1950 3 cases +16.5%
Aug 1953 - Jan 1954 2 cases +44.3%
Oct 1974 - Jan 1975 3 cases +20.2%
No Buy B12s are permitted in September or on a day when the DJI has already
risen by more than 7% from what it was 50 trading days earlier. The signal takes
place when the ratio of advances to declines, using a short period of time, is
quite high. The exact parameters are proprietary.
In the statistics here, we count only the first Buy B12 in ten trading days. Note
that it disallows most Sell signals for 10 trading days.
A Buy B12 Launched The Great Bull Market of 1982-2000.
Buy B12
Date DJI Gain
------------- ----------- --------
(1)
6/24/1931 151.60 (-6.5% if normal mode subsequent
Sell used) Gain= + 0.7% if extreme bearish mode used.
CL/MA ROC PI AI (IP21) V OP21 No Paper Loss
1.129 (too high) 1.65 15 (34) .087 74 .001
Volume was 100% above its 21-dma.
---------------------------------------------------------------------------
(2)
1/13/1932 84.40 -2.6% if normal mode used.
but Loss = - 0.8% if extreme bearish mode used.
CL/MA ROC PI AI (IP21) V OP21 1% Paper Loss
1.091 .741 7 (+35) .044 -82 .027
Volume equal to its 21-dma.
---------------------------------------------------------------------------
(3)
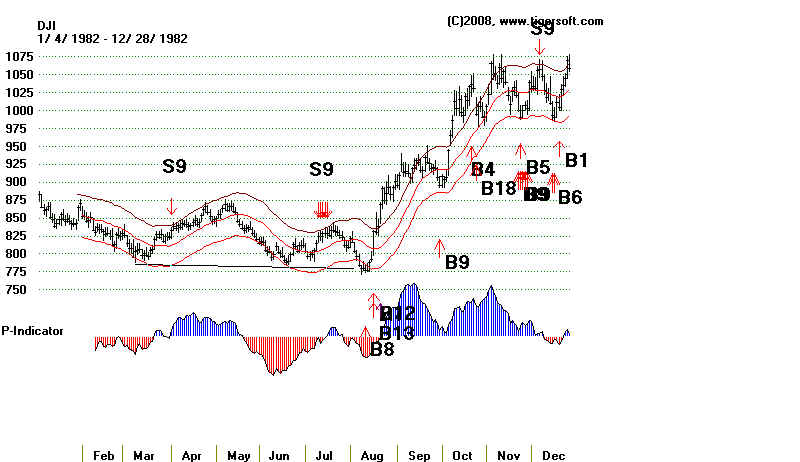
7/25/1932 49.80 Gain= + .492 No Paper Loss
CL/MA ROC PI AI (IP21) V OP21
1.125 .809 56(15) .083 78 .132
Volume was 80% above its 21-dma.
---------------------------------------------------------------------------
(4)
4/10/1933 62.10 Gain= + .654 No Paper Loss
CL/MA ROC PI AI (IP21) V OP21
1.074 1.992 15(13) -.03 90 .367
Volume was 30% above its 21-dma.
---------------------------------------------------------------------------
(5) 1st of 3 day Buy B12 series
6/22/1938 129.90 Gain= + 16.6% No Paper Loss
(Also 6/23/1938 127.40 and 6/24/1938 129.1 )
CL/MA ROC PI AI (IP21) V OP21 +0.7% if exetreme bearish mode used.
1.095 1.056 43((34) .08 61 .216
B12s also on the next two days.
Volume was 100% above its 21-dma.
---------------------------------------------------------------------------
(6) 1st of 3 day Buy B12 series
9/30/1938 141.50 Gain= +11.3% No Paper Loss
B12s also on the next two days.
CL/MA ROC PI AI (IP21) V OP21 +0.7% if exetreme bearish mode used.
1.032 .191 0((34) .077 -50 .048
Volume was 20% above its 21-dma.
---------------------------------------------------------------------------
X The very beginning of January B12s may be doubted, as this
is a time when tax considerations distort trading. This was
will be eliminated in 12/2011 Peerless software.
1/3/1940 152.80 Loss=-.052 5% Paper Loss
CL/MA ROC PI AI (IP21) V OP21 +0.7% if exetreme bearish mode used.
1.026 .505 68((17) .072 54 .069
Volume was 10% above its 21-dma.
---------------------------------------------------------------------------
(7)
6/12/1941 122.90 Gain= + .048 No Paper Loss
CL/MA ROC PI AI (IP21) V OP21 +0.7% if exetreme bearish mode used.
1.044 .578 50((12) .106 22 .396
A head and shoulders pattern was formed in August-September.
The neckline of this pattern was broken on 10/7/1941 with the
DJI at 124.40. Prices then declined for 6 months.
Volume was 25% above its ma.
---------------------------------------------------------------------------
X - This case should be eliminated. The DJI was down the day that there
was superb breadth 11/4/1943 and 11/5/1943. That makes the data here
suspect. A new line of code has been added to eliminate such cases.
The data we have shows the DJI fellon 11/3/1943 from 138.5 to 137.4
but that there were 996 up on NYSE and 99 decliners.
And that on 11/4 the DJI fell from 137.4 to 136.3 but that there
were 966 stocks rising and only 89 declining. The B12 signa;s
here look like they are based on bad data. They are not counted.
2 of 3 day Buy B12
11/4/1943 136.3 Gain= + .090 1/14/44 S1 5% Paper Loss
also 11/5/1943 - 135.3
CL/MA ROC PI AI (IP21) V OP21
.988 (unusual) -.285 121 (54) -.179 62 -.135
very low
DJI fell to 129.60 on 11/30 and then recovered to up per band, declined
again and took off. Very low IP21 here.
Volume was 60% above its ma.
--------------------------------------------------------------------------------
X The very beginning of January B12 may be doubted, as this
is a time when tax considerations distort trading.
1/3/1945 154.3 Gain= + .063 5/15/45 S9 2% Paper Loss
CL/MA ROC PI AI (IP21) V OP21
1.024 .554 94 (+22) .245 105 .408
DJI formed minor head and shoulders pattern on next minor rally and
fell to 151 before rallying.
Volume was 30% above its ma.
--------------------------------------------------------------------------------
(8) 1st of 3 day Buy B12
3/9/1945 157.9 Gain= +.039 5/15/45 S9 3% Paper Loss
CL/MA ROC PI AI (IP21) V OP21
.985 .06 179 (+28) .133 242 .29
DJI formed head and shoulders pattern on next minor rally and
had to play out the minimum downside point-count from this pattern.
It fell to 152.30 and multiple Buy signals. It then rallied to 200
in Jan. 1946
Volume was 30% above its ma.
--------------------------------------------------------------------------------
(9)
8/27/1945 171.9 Gain= +.159 1/18/46 S9 199.20
CL/MA ROC PI AI (IP21) V OP21
1.048 .618 148 (+9) .159 97 .349
DJI advanced upwards steadily, reaching 200 in Jan. 1946.
Loe volume snd Rally until S9. Steep A/D Line violation led to only a shallow pullback.
Volume was 30% above its ma.
--------------------------------------------------------------------------------
(10)
10/14/1946 169.9 Gain= +8.5% 10/22/1947 S4 184.4
CL/MA ROC PI AI (IP21) V OP21 3% Paper Loss
1.00 -.245 3 (+3) .023 -66 .054
DJI rose to upper band and then retested lower band twice in 6 weeks
and then rallied to 184 in Feb 1947 before needing to retreat again to 164
in May 1947. Finally on 10/22/1947, the DJI reached 184.40.
B12 did not bring an immediate breakout in bottom formation.
Volume was 10% below its ma.
--------------------------------------------------------------------------------
(11)
5/23/1947 167 Gain= +10.4% 10/22/1947 S4 184.4
CL/MA ROC PI AI (IP21) V OP21 No Paper Loss
.988 -.225 -78 (+22) -.053 -142 -.198
DJI immediately rallied to 186 in July 1947.
STRAIGHT UP.
Volume was 10% above its ma.
---------------------------------------------------------------------------------
(12)
3/22/1948 173.7 Gain= +11.2% 6/16/48 S1
CL/MA ROC PI AI (IP21) V OP21 No Paper Loss
1.035 .412 41 (+25) -.052 20 .142
DJI immediately rallied to 192 in July 1948
STRAIGHT UP.
Volume was 100% above its ma.
--------------------------------------------------------------------------------
X The Buy B12 here seems to occur because of bad data.
On 11/5/1848, our data shows the DJI declined from 184.5 to 178.4,
yet there were 779 advancing stocks and only 84 decliners. This
appears to be incorrect. The Buy on this data is considered false.
11/5/1948 178.4 Gain= +1.6% 4/14/50 S9 215.3
CL/MA ROC PI AI (IP21) V OP21 4% PAPER LOSS
.962 -.18 149 (+43) .161 222 .143
low
Volume was 100% above its ma.
----------------------------------------------------------------------------
(13)
7/21/1950 207.7 Gain= + 11.5% 8/9/50 S9 216.9 REVERSING BUY
CL/MA ROC PI AI (IP21) V OP21 4% PAPER LOSS
.998 -.843 -17 (-10) -.045 -325 -.188
weak low low
Volume was 25% above its ma.
----------------------------------------------------------------------------
(14)
11/9/1950 227.2 Gain= + 18.8% 8/30/1951 S4 269.90
CL/MA ROC PI AI (IP21) V OP21 1% PAPER LOSS
.996 -.146 74 IP21= .028 20 .188 Pch=59
DJI needed to retest the lower band twice more in next 6 weeks,
but A/D Line was rising sharply.
Volume was 10% above its ma.
-------------------------------------------------------------------------------
(15)
12/5/1950 225.4 Gain= + 16.5% 8/30/1951 S4 269.90
CL/MA ROC PI AI (IP21) V OP21 No Paper Loss
Also B9 .985 -.099 201 (+2) .131 270 .178
DJI needed to retest the lower band once more in next 2 weeks,
but A/D Line was rising sharply.
Volume was 5% below its ma.
-------------------------------------------------------------------------------
(16)
8/3/1953 276.1 Gain = 8.5% 3/91954 S15 299.5
CL/MA ROC PI AI (IP21) V OP21 7% PAPER LOSS
1.02 .247 51 (+4) .101 -3 .234
Steep A/D Line violation brings decline to the lower band.
Sell to 255.5 before rallying strongly.
Buying on next pullback to lower band or when NYSE A/D Line downtrend occurs
would have been an excellent Buy.
Volume was 20% above its ma.
-------------------------------------------------------------------------------
(17)
1/6/1954 284 Gain= +5.5 2/1/1955 S9 409.7 No Paper Loss
CL/MA ROC PI AI (IP21) V OP21
1.009 .03 -12 (+4) .079 -134 -.287
DJI immediately rose steeply.
STRAIGHT UP. A/D Line uptrend reamins intact and it does not fall below its ma.
Volume was 20% above its ma.
----------------------------------------------------------------------------
(18)
1/6/1958 442.6 Gain= +.41 2% PAPER LOSS
CL/MA ROC PI AI (IP21) V OP21
1.015 -.172 -19 (-7) -.081 -223 .051 Pch=-7
DJI rose steeply after a month's backing and filling.
Steep A/D Line uptrend violation brings 3-week shallow retreat.
Buying again when A/D Line down-trend is violated produces a good rally.
Volume was 10% above its ma.
-----------------------------------------------------------------------------
(19)
6/1/1970 710.36 Gain= -.008 6/1/1970 S9
CL/MA ROC PI AI (IP21) V OP21 No paper loss
1.028 -.40 -237 -3 -.026 -3 .125
DJI rose to upper band and had to retest the lower band before rallying.
Steep A/D Line uptrend violation brings retreat to the lower band.
Buying again on next decline to lower band or when A/D Line down-trend is violated
produces excellent results.
----------------------------------------------------------------------------
(20)
11/30/1971 831.34 Gain= + .134 3/9/1972 S4 942.81
CL/MA ROC PI AI (IP21) V OP21 No paper loss
1.011 -.111 -95 (12) -.047 -2 .021
STRAIGHT UP. Steep A/D Line uptrend violation brings only brief retreat. Here it
was Better to wait for the NYSE A/D Line to fall below its 21-day ma. "V" bottoms
are rare.
-----------------------------------------------------------------------------
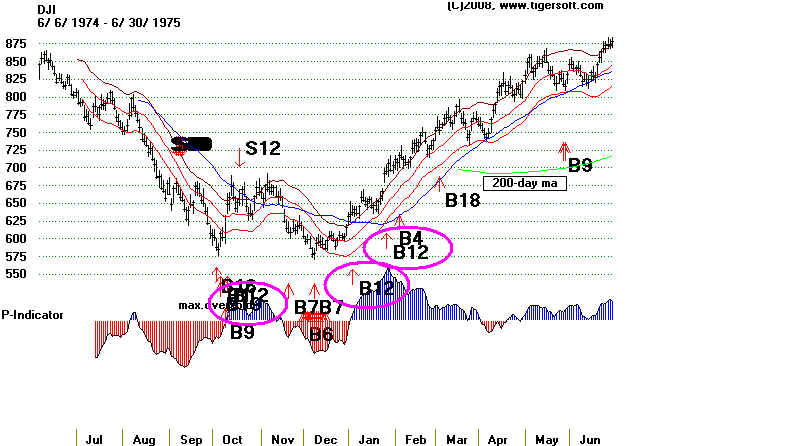
(21)
10/10/1974 648.08 Loss= - .005 10/18/1974 S12 654.88
CL/MA ROC PI AI (IP21) V OP21 Paper loss = 1%
1.027 -.125 47 -.049 -2 .196
DJI rallied to the upper 7% band and then re-tested the lows and
then rallied. The first B12 showed power. The second, the next B12
showed power and immediacy.
A/D Line uptrend violation brings re-test of lows. That tends to be true in deepest
declines.
-----------------------------------------------------------------------------
(22)
1/6/1975 637.2 Gain= + .311 8/29/1975 S12 835.34
CL/MA ROC PI AI (IP21) V OP21 No paper loss
1.059 .765 49 -.004 -1 .355
DJI immediately rose steeply.
STRAIGHT UP. Steep A/D Line uptrend violation brings little decline. Better to
have waited for the A/Line to break a shallower uptrendline.
(This case has been eliminated.)
----------------------------------------------------------------------------
(23)
1/28/1975 694.77 Gain= + .202 8/29/1975 S12 835.34
CL/MA ROC PI AI (IP21) V OP21 No paper loss
1.072 1.712 450 (+28) .102 3 .574 Pch=28
DJI immediately rose steeply.
STRAIGHT UP. Price breakout. Steep A/D Line uptrend violation brings little decline.
Better to have waited for the A/Line to break a shallower uptrendline.
----------------------------------------------------------------------------
(24)
1/6/1976 890.82 Gain= + .133 3/24/1976 S9 1009.21
CL/MA ROC PI AI (IP21) V OP21 No paper loss
1.053 .871 251 (+50) .169 1 .441
DJI immediately rose steeply.
STRAIGHT UP. Price breakout. Steep A/D Line uptrend violation brings little decline.
Better to have waited for the A/Line to break a shallower uptrendline.
----------------------------------------------------------------------------
(25)
1/5/1979 830.73 Gain= + .076 9/21/79 S9 893.94
CL/MA ROC PI AI (IP21) V OP21
1.026 .15 24 (4) .005 -1 .15 3% Paper Loss
DJI needed to retest the lower band twice more in next five months.
Rallies only to previous broken support. Steep A/D Line uptrend violation brings
little decline to lower band.
----------------------------------------------------------------------------
(26)
8/17/1982 831.24 Gain= + .272 12/7/1982 S9 1056.94
CL/MA ROC PI AI (IP21) V OP21 No paper loss
1.029 .076 -66 (+65) -.064 5 -.306
DJI immediately rose very steeply.
STRAIGHT UP. Breakout. Steep A/D Line uptrend violation brings quick decline
to lower band and B9.
----------------------------------------------------------------------------
(27)
1/17/1991 2623.51 Gain= + .278 4/15/1992 S9 3353.76
CL/MA ROC PI AI (IP21) V OP21 No paper loss
1.02 .14 -29 (+86) .006 -8 .155
DJI immediately rose steeply.
STRAIGHT UP. Breakout. Steep A/D Line uptrend violation shallow decline only to
the 21-day ma
----------------------------------------------------------------------------
  This Buy B12 is eliminated by requiring IP21 and OP21 to be very high in the
   normally bearish January after a Presidential Election.
  1/5/2009     8952.89                Gain = 0.7%
      CL/MA   ROC    PI                  AI (IP21)   V     OP21
       1.033  .497  406 (0)     -.01   31   -.104
      Steep A/D Line uptrend violation shallow decline that makes a new low by 15%.
----------------------------------------------------------------------------
  (28)   2 of 3 day Buy B12
  This Buy B12 is based on 2 days of three where the ratio of advances to declines is more
   than 10:1.  This signal will be allowed in Extreme Bearish Mode, pending tests for the 1930s.
 3/12/2009       7170.06  Gain = .093 No Paper Loss.
    CL/MA   ROC    PI                     AI (IP21)   V     OP21
     .998  -1.186 -496 (+227)  -.113   -317   -.214
----------------------------------------------------------------------------
  (29)
 4/3/2009       8017.59  Gain = .093   NoPaper Loss.
    CL/MA   ROC    PI                     AI (IP21)   V     OP21
    1.079    2.302   704(+180)   .157    278    .286
==========================================================================
  (30)
 7/1/2011       12582.77  Loss= -0.1% Paper Loss less than 1%.
       CL/MA   ROC    PI                     AI (IP21)   V    OP21
       1.04   .329   181 (+103)  -.031   -63   .076

================================================================
  X  This will be eliminated in 2013 update.  Cases where
  the IP21 (current AI) is below -.139 produce paper losses
  that should be avoided.  See also 11/4/43
 8/11/2011      11143.31  Gain = .037      3% Paper Loss
      CL/MA    ROC    PI                     AI (IP21)   V     OP21
      .928    -1.329  -532 (+73)  -.131   -361  - .216
        low      weak     weak           weak     weak      very weak
 DJI fell to 10855 and then rallied to sell at the upper band

====================================================================
  (32)
 11/30/2011    12045.68  Gain = ?
      CL/MA    ROC    PI                     AI (IP21)   V     OP21
      1.02     .091   -70 (202)   .056    -93  - .136
                 weak     weak                   weak       weak
=======================================================================

=======================================================================
Number of closed out trades =  34      Avg. Gain=  14%
decline, the B12 may be premature, in the sense that the lower band may
have to be re-tested. That was also true in 1974, for example. But it was not
true in 1971.
DJI Declined back to Lower Band after Buy B12 in 1970.