20080502 S11 13058.2 .128 1.028 S4
20100416 S11 11018.66 .086 1.009 S3
---------------------------------------------------------------------------
No. = 3 Avg.= 15.9%
 ===============================================================
Sell S11
December 2013 Peerless (C) 2013 William Schmidt, Ph.D.
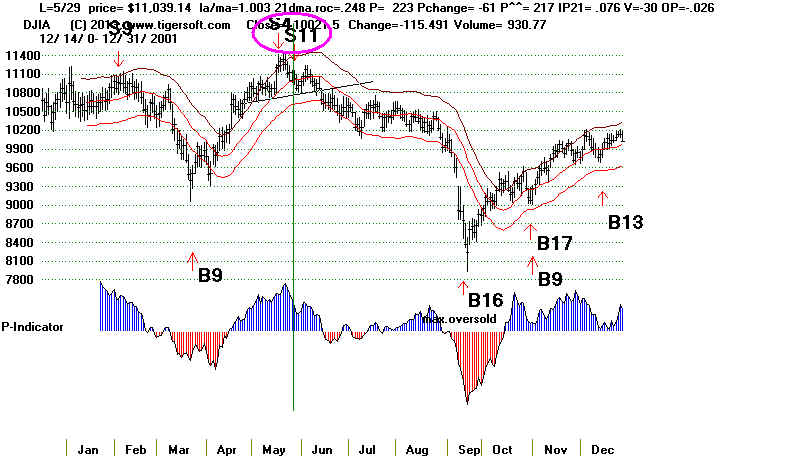
20010605
S11
11175.84
.263
1.012 S4
20080502
S11
13058.2
.128
1.028 S4
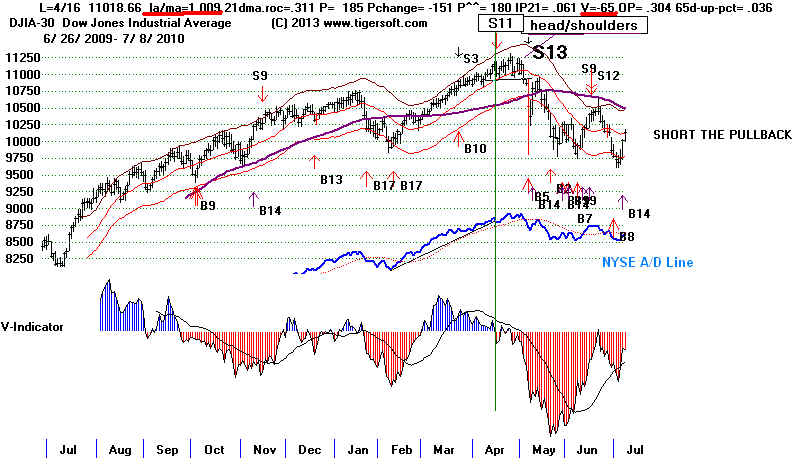
20100416
S11
11018.66
.086
1.009 S3
---------------------------------------------------------------------------
No.
= 3 Avg.= 15.9%
===============================================================
Created 2/25/2013
A Sell S11 signal results from a 10% rally from a 4 month
low with the
V-Indicator still negative. The DJI cannot be more than 3.8% above the
21-dma and must be at least 0.5% over the 21-dma. Sell S11s can only
take place between March and August. In addition, Sell S11s should also
occur when the DJI is up more than 9% from 65 days with the
P-Indicator above +170. Momentum and positive breadth then outweigh
the negative V-Indicator. (This was true in February 2004 and 2013.
Those signals are not allowed in the 3/13/2013 version of Peerless.)
The
failure of the February 2013 Sell S11 reinforces the general rule
that
Janaury take-offs nearly always rally until March, at least.
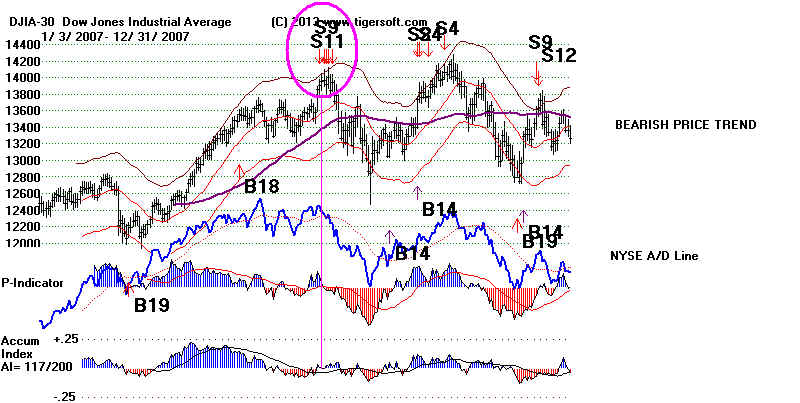
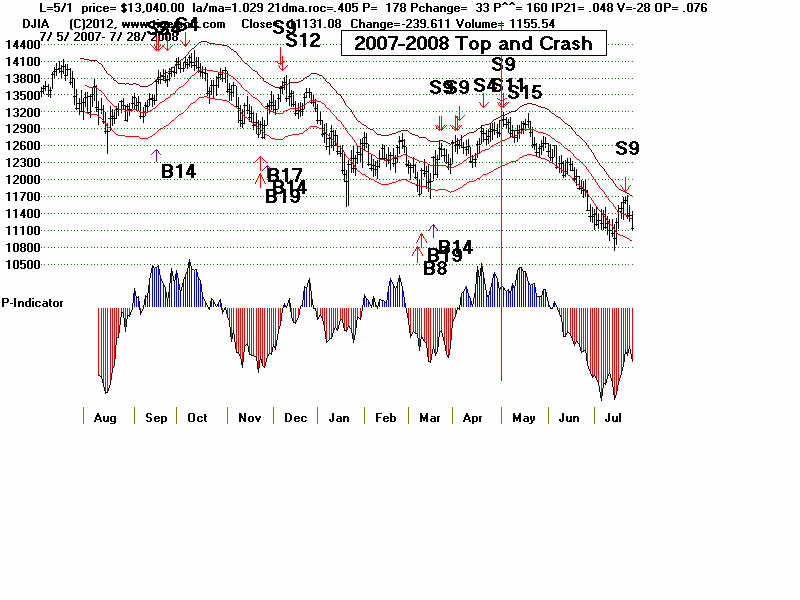
Sell S11 and S9 joined together to stop the
2003-2007 Bull Market. See how the V-Indicator
was negative after a 12%+ rally in the DJI.
7/13/2007 13907.25 LA/MA=1.026 21-dma-roc=.374 P=
+192 IP21= +.005 V= --15 Opct=.085
The Sell S11 occurs when the DJI is up 11% to 20% from its 65-day low
but shows a negative V-Indicator even though the DJI is 0.5% or more
above the 21-day ma. They can only occur between February 20th and
August 31st but they also are not allowed between June 20th and July
5th. This is in keeping with Arhtur Merrill's research on when the
"Summer Rally" usually starts. Note that the DJI must be above its
65-dma. It probably should be required to be above its 200-day ma.
The 1929-1933 data shows that a Sell S11 at this time is more profitable
but also runs a much higher risk of reaching a 5% stop loss, which
we would nornally want to use with Peerless Sells.
Usually by itself this is not a powerful signal, but it is
reliable and produces
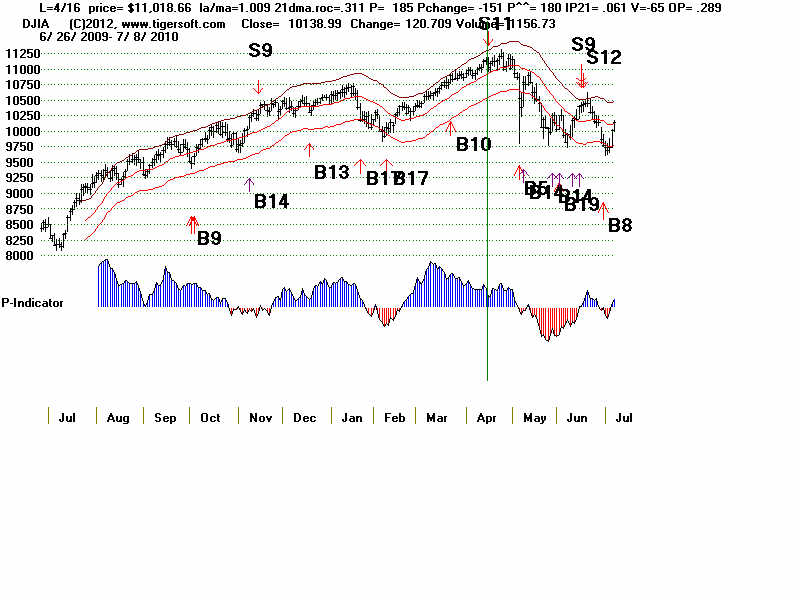
only small paper losses. It also gives Peerless a way to call tops
like the one in May 2010, when Peerless gave no other Sell signal.
The typical gain is 6.7%. We only have
accurate data to create the
V-Indicator for the period from mid 1965 onwards.
Sell S11s: 1965-2013
S11
Other Gain When
Biggest Paper
Signals Reversed
Loss
-------------------------------------- ----------------------------------------------
1 3/2/1992
2.0%
none
2
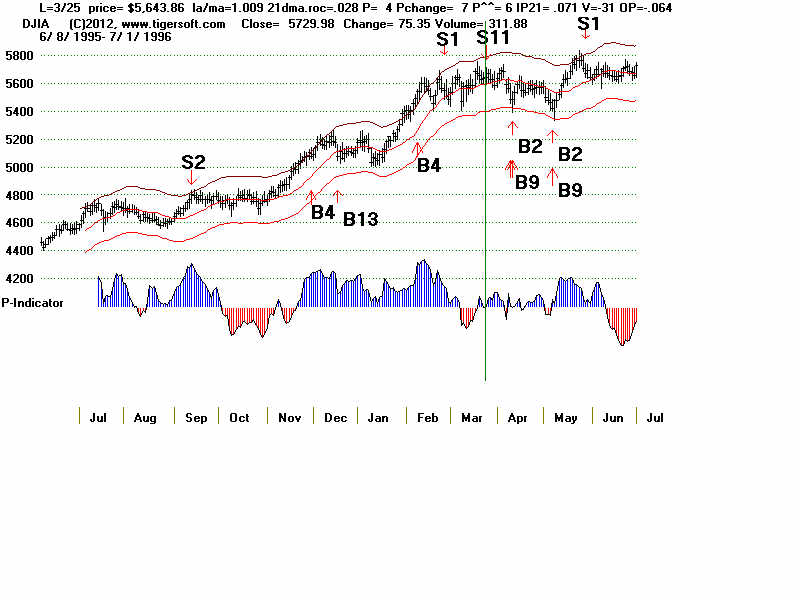
3/25/1996
2.8%
0.8%
3
4/23/1998
also S15
16.5%
2.1% biggest paper loss
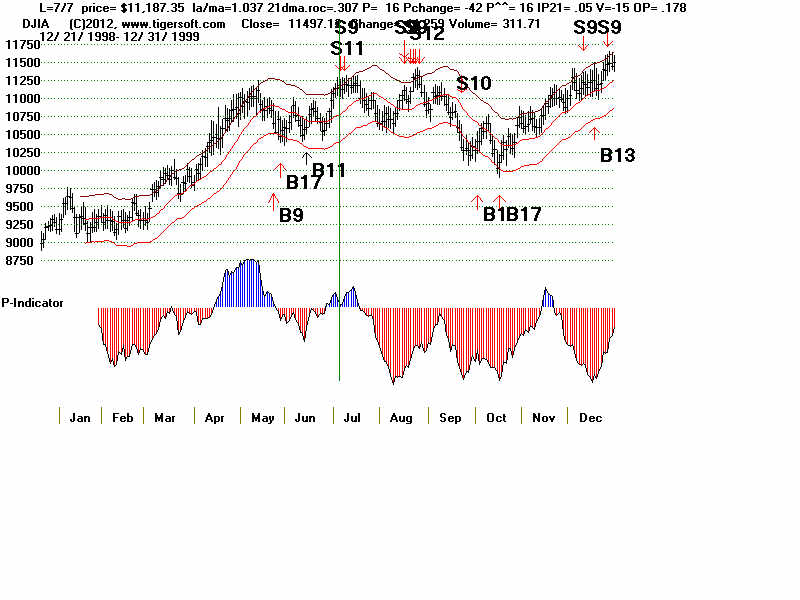
4 7/7/1999
also S9 7.0%
1.2%
5 5/25/2001
also S4
17.8%
1.2%
6
7/13/2007 also S9
4.4%
0.7%
7 5/2/2008
also S9 12.8%
none
8 4/16/2010
4.5%
1.7%
9 3/14/2012
also S15
3.6%
0.3%
---------------------------------------------------------------------
Number of S11s = 9
Acg. Gain = 7.93%
Paper Loss = 0.88%
February and Perhaps March Sell S11s Are of Limited Value
Very small gains have accrued to Sell S11s in February and March:
+2.3%, +2.8%, 5.6% and 3.6%
Their paper losses were very small, too:
0. 0.8%, 1.2%, .0.3%.
A paper loss for the 2/22/2013 above 2.2% is not consistent with these
Sell S10s. February and March Sell S11s are probably not worth applying.
Date
Gain Paper Loss
La/Ma Ann.roc
P-I IP21
V-I
OPct 65-day
Pct Change
--------------------------------------------------------------------------------------------------------------------------------------
X February Sell S11s generate gains that are too small. Markets this
strong usually
move up until March, at least.
2/26/1992 2.3%
0
1.009
.156 -16
.021 -12 -.035 .107
DJI declined to 3208.63
on 3/12/1992 and Buy B11..
-------------------------------------------------------------------------------------------------------------------------------------
1 3/2/1992
2.0% 0
1.006
.111 +1 .017 -102
-.118
.100
DJI declined to 3208.63
on 3/12/1992 and Buy B11.
2 3/25/1996
2.8% 0.8%
1.009 .028
4 .071
-31
-.064
.103
DJI declined to 5487.07 on
4/11/1996 and Buy B2/B9.
3 4/23/1998
16.5% 2.1%
1.016 .316
-71 .037
-26 -.039 .138
also S15
biggest paper loss
DJI declined to 8665.29 on
6/16/1998 and B9 at 7632.53 on 10/1/98.
4 7/7/1999
7.0% 1.2%
1.037 .307
16 .05 -15
.178 .105
also S9
DJI declined to 10019.71 on
10/15/1999 and B1/B17.
5 5/25/2001 17.8% 1.2%
1.015
.013 -25 -.034
-43 -.093
.054
also S4
DJI declined far below low band because of 9/11.
There had just been a Sell S4 and a head/shoulders pattern
was forming.
--------------------------------------------------------------------------------------------------------------------------------------
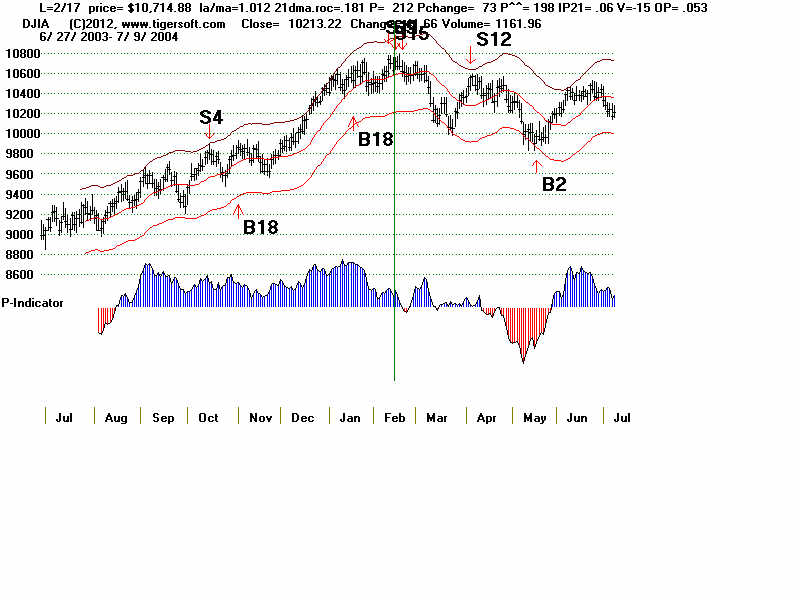
X February Sell S11s generate gains that are too small. Markets this
strong usually
move up until March, at least.
2/17/2004 5.6%
1.2%
1.012 .181
+212
.06
-15 .053 .091
also S9
high
high
--------------------------------------------------------------------------------------------------------------------------------------
6 7/13/2007 4.4% 0.7% 1.008
.341 -55
.043 -75
.221
.102
also S9
7 5/2/2008
12.8% 0
1.028 . 406
+173 .036
-29
.077 .047
also S9
8 4/16/2010
4.5% 1.7%
1.009
.311 +185 .061 -65
.290 .035
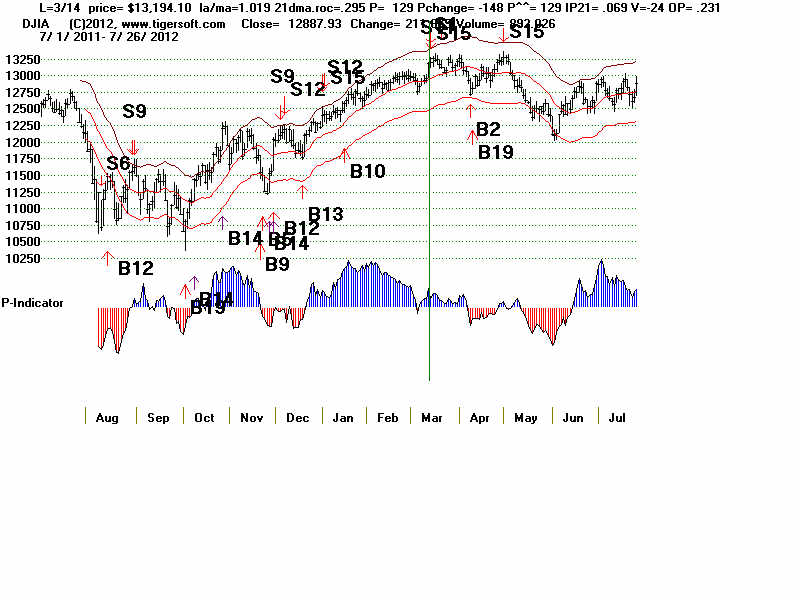
9 3/14/2012
3.6% 0.3%
1.019
.295 +129 .069
-24
.231
.090
also S15
--------------------------------------------------------------------------------------------------------------------------------------
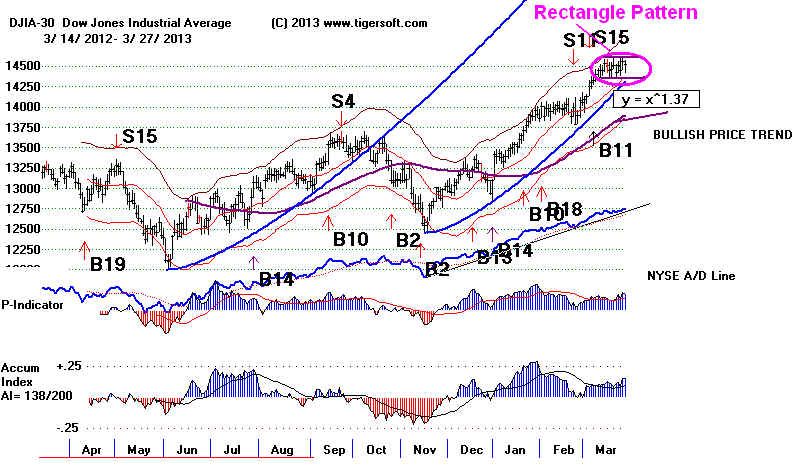
X February Sell S11s generate gains that are too small. Markets this
strong usually
move up until March, at least.
2/22/2013 ?
?
1.004
.189 +174
.061 -34
.043 .101
high
high
--------------------------------------------------------------------------------------------------------------------------------------
The
V-Indicator can only be estimated for the period before 1965
because Barrons did not keep NYSE Up and Down Stocks' Volume from the
NYSE
Advances and Declines data. The software does not allow S11s between
1928
and 1965.
Sell S11s: 1929-1965
X 2/27/1929 3.6%
No paper loss
X
6/25/1929 33.4 but 2.3% stop loss
reached. first
A very bullish period and trading range took this speculative market
up 25% by September.
X
2/27/1930 2.3% paper loss reached
Below 200-day ma
X
4/16/1930 Right at peak before
collapse. No paper loss
DJI had reversed from falling 200-day ma.
X 8/18/1931 25.1%
No paper loss
DJI was below 200-day ma
(Using exttreme Brearish Mode B16 to cover)
X
3/23/1933 - 2.3% paper loss reached
DJI was below 200-day ma
X
3/3/1936 3.3% 2.3% paper loss reached 3 % paper loss
X
8/10/1936 7.5% No paper loss.
X 7/13/1939 Dropped
below lower band. but no good buy signal
X 5/29/1945
Dropped to lower band but no automatic Buy.
X 6/5/1948
2.8% No Paper Loss
X 7/7/1954
1.7% No paper loss.
X
4/3/1961 -2.0% DJI rose
until May. 3.5% Paper Loss