Santa Claus Buy B13
Peerless 2013
(C) Dec. 20, 2015 William Schmidt, Ph.D.
There have been 73
Buy B13s. The average B13 gain was 9.7%.
The biggest average gain (+18.0%) was seen in the year of
Mid-Term Elections. It was only 7.0% in the years of Presidential
Election Years.
Size of Gains:
Number of Cases
Returns by Size
of Gain
-----------------------
No. Pct.of Total
=>.10
25 .342
=>.05 - <.10 14
.192
=>.02 - <.05 25
.342
=>0 - <.02
6 .082
<0
3 .041
--------------------------------------
Total
73 1.0 (100%)
BREAKDOWN of BUY B13 TRADES: 1929-2013
=====================================
No. Date of Buy Peerless DJI Pct Paper
Signal Gain Loss
=============================================================================
1 19281218 B13 275.4 .135 None
---------------------------------------------------------------------
2 19321219 B13 60.1 .047 .061
----------------------------------------------------------------------
3 19331218 B13 97.2 .139 .019
----------------------------------------------------------------------
4 19341217 B13 100.9 .031 .013
----------------------------------------------------------------------
5 19351217 B13 140.6 .111 .012
----------------------------------------------------------------------
6 19361217 B13 180.8 .048 .027
---------------------------------------------------------------------
7 19371217 B13 124.9 .032 .05
----------------------------------------------------------------------
8 19381219 B13 150.4 .027 .005
----------------------------------------------------------------------
9 19391218 B13 149.2 .024 .004
----------------------------------------------------------------------
10 19401217 B13 130.5 .011 .016
----------------------------------------------------------------------
11 19441219 B13 151.6 .082 .019
----------------------------------------------------------------------
12 19451217 B13 190.4 .046 .006
----------------------------------------------------------------------
13 19471217 B13 179.8 -.013 .013
----------------------------------------------------------------------
14 19481217 B13 175.9 .024 .005
----------------------------------------------------------------------
15 19491220 B13 197.2 .119 .004
----------------------------------------------------------------------
16 19501218 B13 231.0 .122 .005
----------------------------------------------------------------------
17 19511217 B13 265.8 .032 .006
----------------------------------------------------------------------
18 19521217 B13 285.7 .022 .001
----------------------------------------------------------------------
19 19531217 B13 282.7 .056 .015
----------------------------------------------------------------------
20 19541222 B13 397.1 .18 .022
----------------------------------------------------------------------
21 19551219 B13 481.8 .077 .041 No SC rally..Judged S10 1/10/1956
----------------------------------------------------------------------
22 19571217 B13 425.7 .527 None
----------------------------------------------------------------------
23 19581223 B13 566.4 .148 None
----------------------------------------------------------------------
24 19591221 B13 675.9 .005 .009
----------------------------------------------------------------------
25 19601219 B13 615.6 .139 .008
----------------------------------------------------------------------
26 19611218 B13 727.7 .005 .01
----------------------------------------------------------------------
27 19621217 B13 645.5 .455 .008
----------------------------------------------------------------------
28 19631219 B13 763.9 .229 .009
----------------------------------------------------------------------
29 19641217 B13 863.6 .087 .001
----------------------------------------------------------------------
30 19651217 B13 957.9 .029 .005
----------------------------------------------------------------------
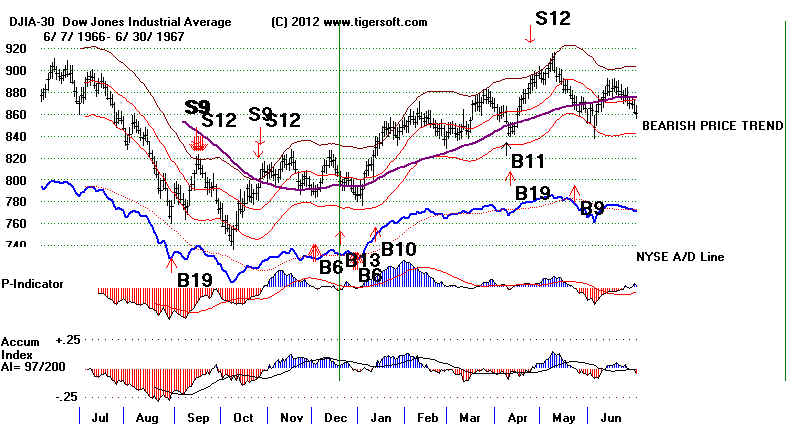
31 19661219 B13 798.99 .111 .016
----------------------------------------------------------------------
32 19671218 B13 881.65 .031 None
----------------------------------------------------------------------
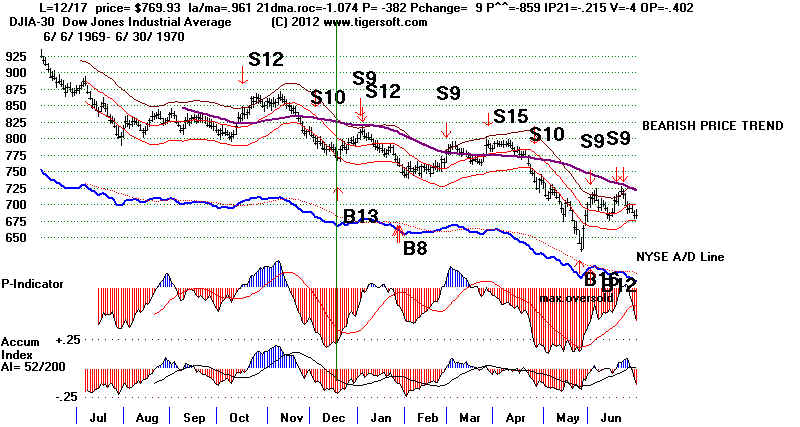
33 19691218 B13 783.79 .033 None
----------------------------------------------------------------------
34 19701223 B13 823.11 .139 None
----------------------------------------------------------------------
35 19721218 B13 1013.25 .034 .013
----------------------------------------------------------------------
36 19731217 B13 811.12 .045 None
----------------------------------------------------------------------
37 19741217 B13 597.54 .447 .013
----------------------------------------------------------------------
38 19751217 B13 846.27 .193 .009
----------------------------------------------------------------------
39 19761220 B13 972.41 .012 None
----------------------------------------------------------------------
40 19771219 B13 807.95 -.018 .002
----------------------------------------------------------------------
41 19781218 B13 787.51 .125 None
----------------------------------------------------------------------
42 19791218 B13 838.65 .032 .041 0.8% over 21-dma. Fell to 1.8% LB on 1/3
----------------------------------------------------------------------
43 19801217 B13 928.5 .048 None
----------------------------------------------------------------------
44 19811217 B13 870.53 .001 .002
----------------------------------------------------------------------
45 19831219 B13 1244.61 .03 None
----------------------------------------------------------------------
46 19841217 B13 1176.79 .096 None
----------------------------------------------------------------------
47 19851224 B13 1519.15 .202 .011
----------------------------------------------------------------------
48 19861217 B13 1918.31 .254 .011
----------------------------------------------------------------------
49 19881222 B13 2160.36 .075 .007
----------------------------------------------------------------------
50 19891218 B13 2697.53 .042 .003
----------------------------------------------------------------------
51 19901217 B13 2593.32 .167 .049 0.9% over 21-dma. Fell to 4.9% LB on 1/9
----------------------------------------------------------------------
52 19911217 B13 2902.28 .156 None
----------------------------------------------------------------------
53 19921217 B13 3269.23 .071 None
----------------------------------------------------------------------
54 19931217 B13 3751.57 .058 None
----------------------------------------------------------------------
55 19941219 B13 3790.7 .464 .011
----------------------------------------------------------------------
56 19951218 B13 5075.21 .093 .008
----------------------------------------------------------------------
57 19961217 B13 6308.33 .087 None
----------------------------------------------------------------------
58 19971217 B13 7957.41 .153 None
----------------------------------------------------------------------
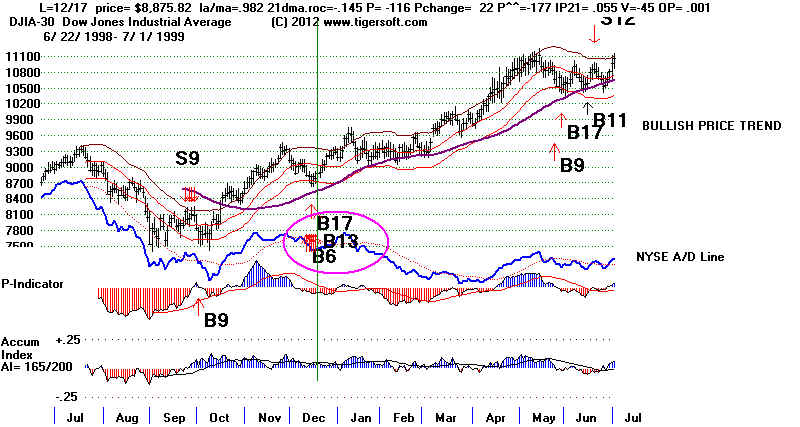
59 19981217 B13 8875.82 .255 None
----------------------------------------------------------------------
60 19991217 B13 11257.43 .019 .010
----------------------------------------------------------------------
61 20001218 B13 10645.42 .025 .031
----------------------------------------------------------------------
62 20011217 B13 9891.96 .023 None
----------------------------------------------------------------------
63 20021217 B13 8535.39 .028 .027
----------------------------------------------------------------------
64 20041217 B13 10649.92 .025 .027
----------------------------------------------------------------------
65 20051219 B13 10836.53 .068 .011
-----------------------------------------------------------------------
66 20061218 B13 12441.27 -.003 .016
----------------------------------------------------------------------
67 20081218 B13 8604.99 .04 .021
----------------------------------------------------------------------
68 20091217 B13 10308.26 .069 .039 0.5% over 21-dma. Fell to 2.6% LB on 12/20
----------------------------------------------------------------------
69 20101217 B13 11491.91 .114 None
----------------------------------------------------------------------
70 20111219 B13 11766.26 .054 .025
----------------------------------------------------------------------
71 20121217 B13 13235.39 .147 .022
----------------------------------------------------------------------
72 20131217 B13 15875.26 .04 None
----------------------------------------------------------------------
73 20131217 B13 15356.87 .055 None
----------------------------------------------------------------------
Total N0.= 73 .097
        Returns by Year
        ---------------
                             No.           Avg.Gain     Pct.of Total
Pres. Election Years         20            .062          .274
Year after Pres.El.Yr.       20            .083          .277
Mid-Term Election Yr.        17            .18           .233
Year before Pres.El.Yr.      16            .07           .219
----------------------------------------------------------------------
              Total          73            .097         1.0  (100%)
   Returns by Day of Month
   -----------------------
               No.         Avg.Gain    Pct.of Total
-------------------------------------------------------
1-10           0             0             0
11-20          67            .094          .918
21-31          6             .124          .082
-------------------------------------------------------
Total          77            .098         1.0  (100%)
|
======================================================
(C) 2012 www.tigersoft.com
Last updated 12/23/2012
The odds of the DJI rising in the 10 trading days after December
17th are
89% and the average gain is more than 2% in the period 1965 to
2011. The
regularity of a Santa Claus rally is important. It shows
being well-known
as a bullish period does not prevent it from workign over and
over again.
Perhaps, it shows how self-fulfilling such expectations are.
Perhaps,
it shows what a positive and generous mood can do for stocks.
Too bad,
this mood cannot last the whole year.
As defined here and shown in blue, are the 69 Buy
B13s ebtween 1928 and 2011.
They may only occur when the DJI closes between below the
2% upper band between
December 17th and December 24th. There are no internal
strength or Presidential
Election cycle limitations.
The Buy B13 is not to be trusted if there has been a Peerless
Sell Sell S9 or Sell S12 signal
within the last ten days, or after December 7th. All
pre-December 17th December Sell S4s
prevent a Buy B13 from being shown. See December
1968. These disallowed
"Buy B13s" are shown in red here.
In Green you can see that such a signal would usually
work out well if the DJI closed above the 2% upper band.
In red, you can see the
cases where there was an earlier Sell after December 7th.
Very few Buy B13s are reversing signals. So, the average
gains are sometimes
very big. In 20 cases they were more than 10%.
The signals allow a buyer to
get ready for what often is a January take-off in prices.
Buy B13s work both
in on-going bull markets and at bottoms of bear markets.
Even in a severe
bear market, like 1929 to 1932, you can see from the red
notations below that
in severe bear markets, like in December 1970 and 1973, Buy
B13s brought
very tradeable rallies.
Paper Losses.
But they are not perfect. Below are the cases where a paper
loss would have
been more than 3%. ^ of the 69 Buy B13s brought a paper
loss of more than 4%.
Date
la/ma
21-dmaroc
P-I
IP21
VI
OPct Gain
Paper Loss
====================================================================================
12/19/32
1.002
-.554
-62 -.096
-160
-.097
3.7%
5%
In a bear market.
-------------------------------------------------------------------------------------------------------------------------------------------------------
12/17/37  1.014   -.251     -567   -.131   -238     .085     3.2%   5%
In a bear market.
-----------------------------------------------------------------------------
12/19/38  1.009   -.191     -330   -.118   -116     .088    -0.7%   9.3%
       DJI did rally to 2.4% band on 1/4/39
------------------------------------------------------------------------------
12/19/55  .997   -.086       65   -.148    -113    -.035     7.6%   6.3%
--------------------------------- ---------------------------------------------
12/17/81   .994   .277      -50     .03     -1      .252    -4.3%   7.7%
In a bear market.
------------------------------------------------------------------------------
12/17/09  .991   -.148      130    .015    -120    -.049     1.0%   4%
-----------------------------------------------------------------------------------
------------------- BUY B13s since 1928 ------------------------
Remember B13 cannot follow An S9/612 on 12/7/2007
To be trusted as normal they ust occur when the DJI close is
between .965 and 1.02 of the 21-day ma.
Date
la/ma
21-dmaroc
P-I
IP21
VI
OPct
Gain
Paper Loss
====================================================================================
12/18/28 .98 -.055
13.5% none
-------------------------------------------------------------------------------
(1929 - S12 on 12/5 DJI falls to 6.7% below 21-dma on 12/20
and
then rallies strongly)
-----------------------------------------------------------------------------
12/17/30 .926 -.988 -622
.034 -599 -.246
3.8% NONE
-----------------------------------------------------------------------------
12/17/31 .833 -4.28 -1367
-.285 -936 -.543 6%
3%
If one does not allow S6 in the Sanata Claus period.
12% 3%
-----------------------------------------------------------------------------
12/19/32
1.002
-.554 -62
-.096
-160
-.097
3.7%
5%
-----------------------------------------------------------------------------
12/18/33
.974 -.215
-42
-301
-.226
-.107
12.0%
2%
-----------------------------------------------------------------------------
12/17/34
.993
.141
159
-.029
.202
3.6
1%
------------------------------------------------- ----------------------------
12/17/35
.980
-.472
-280 -.214
-303
-.01
9.1%
1%
-------------------------------------------------------------------------------------------------------------------------------------------
12/17/36
.997
-.269
-237 -.143
-264
-.202
4.8%
3%
-------------------------------------------------------------------------------------------------------------------------------------------
12/17/37
1.014
-.251
-567 -.131
-238
.085
3.2%
5%
--------------------------------------------------------------------------------------------------------------------------------------------
12/19/38
1.009
-.191
-330
-.118 -116
.088
-0.7%
9.3%
Rallies to 2.4% bandon 1/4/39 150.4
to 136.40
-------------------------------------------------------------------------------------------------------------------------------------------
12/18/39
1.005 -.16
-253
-.10
-71
-.252
-2.9%
3%
Reversing Buy Rallied to 2.6% upper band 1/3/1940 top
--------------------------------------------------------------------------------------------------------------------------------------------
12/17/40
.993 -.461
-287 -.129
-95
-.158
2.4%
2%
-------------------------------------------------------------------------------------------------------------------------------------------
12/17/41
.960
-.709
-403
.004 -234
-.393
4.1%
3%
------------------------------------------------------------------------------
12/17/42 1.029 Perfect Buy
------------------------------------------------------------------------------
12/17/43 1.02 excellent Buy
------------------------------------------------------------------------------
12/19/44
1.018
.464
703
.209
132
.489
8.2%
2%
-------------------------------------------------------------------------------------------------------------------------------------------
12/17/45
.991 -.043
116
.071
-34
.109
4.6%
1%
-------------------------------------------------------------------------------------------------------------------------------------------
(12/17/46 1.026 .336
-162
.155 -57
.255 5%
174.50-184.40 )
------------------------------------------------------------------------------
12/17/47  1.00   -.04       -148         .072    -96    .088    -1.3%  -1.3%
------------------------------------------------------------------------------
12/17/48  1.004  -.014      -267        -.102    -137  -.021     3.1%  0%
-------------------------------------------------------------------------------
12/20/49  1.013   .233       208         .216     14    .113     9.2%  1%
-------------------------------------------------------------------------------
12/18/50  1.01    .109       392         .027    114    .156 231-275    none
--------------------------------------------------------------------------------
12/17/51  1.013   .222       67          .055    -41    .104      6.5%  1%
--------------------------------------------------------------------------------
12/17/52  1.01    .472       484         .174    120    .359      2.2%  none
--------------------------------------------------------------------------------
12/17/53  1.01    .375       151        .164     -18    .096      5.9%  1%
--------------------------------------------------------------------------------
12/22/54  1.017   .538       378        .078     116    .268 397 -486   3%
--------------------------------------------------------------------------------
12/19/55  .997   -.086       65        -.148    -113    -.035     7.6%  6.3%
------------------------------------------------------------------------------
December 12 Sell S1 and Sell S12 on 12/6/56
12/17/56  1.027   .337     -121        -.002    -230     .142           8.9%
----------------------------------------------------------------------------
12/17/57  .972   -.369      -85        -.047    -200    -.026     34.5%   none
-------------------------------------- -------------------------------------------
12/23/58  1.01    .144      -24        -.025    -247     .168     14.8%   none
----------------------------------------------------------------------------------
12/21/59  1.017   .585       49        -.016    -177     .411     1.4%    1%
----------------------------------------------------------------------------------
12/19/61  1.018   .264      146         .074     -72     .1296   15.6    none
----------------------------------------------------------------------------------
12/17/62  1.001   .303      224         .095     127     .293  645.50- 740.30          1%
---------------------------------------------------------------------------------
12/19/63  1.016   .46       -82         .015    -439     .325 763.90-938.90 1%
---------------------------------------------------------------------------------
12/17/64   .989   -.297    -328        -.138    -761     -.138   8.7%    none
---------------------------------------------------------------------------------
12/17/65  1.008   .016      50         -.002     6       .019    2.9%    1%
------------------------------------------------------------------------------
12/19/66   .995  -.252     -62          .027     1      -.108    11.1%   2%
------------------------------------------------------------------------------
12/18/67  1.002   .297      75          .002     3       .231    3.0%    none
------------------------------------------------------------------------------
Sell S4 on December 5
12/17/68   .997   .082     173          .047     12      .028    -3.6%   17%
-----------------------------------------------------------------------------
---------------------------------------------------------------------------------
12/28/69    .982  .982    -767        -.189     -3      -.374    3.3%    none
       Reversing
----------------------------------------------------------------------------------
12/23/70  1.016   ,820     511          .155     1       .557    13.9%  none
----------------------------------------------------------------------------------
1971 1.039  powerful advance.
----------------------------------------------------------------------------------
12/18/72  .991    .111     -20           .065    0       .192     3.4%   1%
----------------------------------------------------------------------------------
12/17/73   .978  -.907    -634          -.099    -5      -.243    5.4%   none
---------------------------------------------------------------------------------
12/17/74   .992  -.986    -488          -.182    -3      -.098   597.54 to 877.42  none
---------------------------------------------------------------------------------
12/17/75  1.007  -.147    -210          -.027    -3       .074   19.3%   1%
---------------------------------------------------------------------------------"
12/20/76  1.011   .276     426           .052    2        .187   1.2%   none
---------------------------------------------------------------------------------
12/19/77   .981  -.345     -60          -.063   -2       -.032   -1.8%  -1.8%
---------------------------------------------------------------------------------
12/18/78   .975  -.098     17           -.007   -2        .038 787.51 to 893.94 none
also a Buy B9
-----------------------------------------------------------------------------
12/18/79   1.013  .33      309           .012    3        .138    3.2%  2%
---------------------------------------------------------------------------------
12/17/80   .968  -.715    -525          -.066    -8      -.061    4.8%  none
---------------------------------------------------------------------------------
12/17/81   .994   .277    -50            .03     -1       .252   -4.3%   67/870
Already in a bear market
---------------------------------------------------------------------------------
1982  Sell S9 on 12/7  A buy B13 would have brought a quick gain from
 1011.5o to 1070.92.  Key support held and there was a Buy B6 also at this time.
---------------------------------------------------------------------------------
12/19/83  .985   -.063     -150          -.051   -7       -.158   3.4%   none
---------------------------------------------------------------------------------
12/17/84  .991   -.294     -121          -.073   -5       -.099 1176.79 to 1825.89 none
----------------------------------------------------------------------------------
12/24/85  1.011   .435      137           .022   7        .06     20.2%    1%
----------------------------------------------------------------------------------
12/17/86  1.004  -.361     -189           .184   -8        .107    25.4%  1%
----------------------------------------------------------------------------------
12/17/87  1.02   .014      -95            .085   -12       .197    1.0%   nobe
  This slightly misses being an autimatic Buy,
----------------------------------------------------------------------------------
12/22/88  1.016  .529       50            .124    9        .098  2160.36-2771 1%
----------------------------------------------------------------------------------
12/18/89   .995  .272       -62           .073    -9       .096    4.2%   none
----------------------------------------------------------------------------------
12/17/90  1.009  .224      222            .117    4        .093  2593-2470 -3306
----------------------------------------------------------------------------------
12/17/91  .998   -.167     -271           .014    -23      .182    13.9%  none
----------------------------------------------------------------------------------
12/17/92  .998    .276      235           .064     =7      .136 3268-3968        1%
------------------------------------------------------------------------------------
12/17/93 1.011    .152        0           .05      -13     .348     5.8%  none
------------------------------------------------------------------------------------
12/19/94 1.015   -.119     -206           .067     -3      -.082 3791-4802  none
------------------------------------------------------------------------------------
12/18/95  .993    .247      103           .072     -11      .182   9.3%    1%
------------------------------------------------------------------------------------
12/17/96  .982   -.074      -91           .051     -37      .042   8.3%  none
------------------------------------------------------------------------------------
12/17/97 1.005    .39        92           .019     -37      .019   15.4% 4.7%
            7957 -7580
----------------------------------------------------------------------------------
12/17/98  .982   -.145     -177           .055     -45      .001   22.3% none
----------------------------------------------------------------------------------
12/17/99 1.024    .402     -463          -.041    -108      .107   1.9%  none
----------------------------------------------------------------------------------
12/18/00  .985   -.306        1          -.075    -140     -.076   1.9%
Note on 2/5/2001  2.5% upper band reached and VI= -3.  Should be an S9V
 10645.42 to 10965.85
----------------------------------------------------------------------------------
12/17/01  .999    .024       54           .062     -97     -.061   2.3%  3%
----------------------------------------------------------------------------------
12/17/02  .985    -.06       119         -.024     -96     -.184   2.8%  3%
----------------------------------------------------------------------------------
not a signal
12/17/03 1.028     .525      375          .048      9       .286 would be 5.8%  none
------------------------------------------------------------------------------------
12/17/04 1.009     .113      206          .102      -17     .212   1.9%  none
------------------------------------------------------------------------------------
12/19/05  .999     .128      232         -.103      -16     -.08   6.8%    2%
------------------------------------------------------------------------------------
12/18/06 1.012     .131      216          ,039      -9       .168  -0.3%   1%
------------------------------------------------------------------------------------
2007  S9/S12 on 12/6/2007
------------------------------------------------------------------------------------
12/18/08 1.011     .252      161          .066       18      .15    4.8%   2%
------------------------------------------------------------------------------------
12/17/09  .991     -.148     130          .015       -120   -.049   1.0%   4%
This doe snot take into account H/S Sell S5
-----------------------------------------------------------------------------------
12/17/10 1.018     .511      208          .147       113     .009  11.4%  NONE
-----------------------------------------------------------------------------------
12/19/11 .995     -.004     -166         -.128       -93     -.096 FINISH
There was a Sell S9 on December 5, 2011.
-----------------------------------------------------------------------------------
12/17/12 1.017     .636      481          .144        76      .246 OPEN
------------------------------------------------------------------------------------


=================================================================================


       Santa Claus Buy B13  (Earlier Documentation)

                               In the earlier version, shown below,   B13s occur on the first DJI close
                               below the 21-day ma after December 16th and before
                               December 25th.

                               Only 3 of the 41 cases brought a paper loss of more than 4%.


                   Buy B13s: 1929-2011

Date             Gain              Paper Loss                     Internals
                                                                               la/ma   ma-roc        P-I            IP21            V-I             OPct
12/17/28      15.7%           none                          .961     .034    -38    -.027     -518      .044
12/18/29        1.3%             5.7%                          .999      .875     42     .116        -47      .034
12/17/30         3.8%           none                         .926     -.988  -125    .034   -599       -.246
12/17/31         5.8%           3.5%                          .833   -4.28   -242   -.285   -936      -.543
12/20/32         6.0%          3.7%                          .984   -.814    -75    -.090   -186      -.143

12/18/33      12.0%           1.95%                       .974   -.215    -42    -.226   -158      -.107
12/17/34        4.9%/3.6%   1.3%                     .993     .141    28    -.029
12/17/35        9.1%          none                           .980     .472   -51    -.214    -303       -.01
12/17/36      13.0%/4.8%              2.7%            .997  -.269    -54    -.143    -264      -.234
none in 1937 - 1940
12/17/41        2.4%/4.1%              1.6%           .993  -.461   -58     -.129      -95      -.112
none in 1942 - 1945

12/17/45        4.6%          0.7%
none in 1947 - 1952
12/22/53        7.0%           0.6%
none in 1954 - 1952
12/19/55        7.6%            4.0%
none in 1956
12/17/57       Big Gain         none
none in 1958-1960
2/18/61        -1.8%            1.8%

2/18/62          9.6%        none
none in 1964-1965
12/19/66      11.1%             1.7%
none in 1967-1968
12/17/69 5.2% none
none in 1970-1971
12/18/72 3.4%
1.3%
12/17/73 5.4% none
12/17/74 Big Gain none
12/22/75 20.3% none
none in 1976
12/19/77 -1.8%
1.8%
none in 1978-1979
12/17/80 4.8% none
12/17/81 -4.3% 8.6%
B13 could not reversed a Sell in a Bear Market.
none in 1982
12/19/83 3.4% none
12/17/84 big gain
none in 1985
12/18/86 25.8% 0.8%
none in 1987 -1988
12/18/89 4.2% none
none in 1990
12/17/91 13.9% none
12/17/92 big gain 0.5%
none in 1993-1994
12/17/95 9.3% 0.8%
12/17/96 8.3% none
12/18/97 17.1% 2.5%
12/17/98 22.3% none
none in 1999
12/19/00 6.3% 2.5%
12/17/01 2.3% 2.8%
12/17/02 2.8% 2.3%
none in 2003-2004
12/19/05 6.8% 1.6%
none in 2006-2007
12/22/08 5.8% none
*12/17/09 1.0%
4.8%
(*There has been an S9 on 11/13/2009 )
none in 2010-2011
------------------------------------------------------------------------------------------------------------------------------------------
B13s Eliminated
by Allowing for Sell S9s.
Date LA/MA
Gain Reversing Signal
12/17/40 .993 2.4%
1/10/41 S12
12/17/47 .999 -1.3%
1/14/48 S10 Bear
market