Very Steep Decline from a Bull Market Peak.
Extraordinarily Weak Downward Momentum.
Sell S13s have averaged declines of 15.1%
Size of Declines after Sell S13
to next Buy Signal since 1928
>10% 7
5%-9.99% 6
2%-4.99% 0
0%-1.99% 1
losses 2
SELL S13s:
1928-2013 19291024 S13 299.5 .3
19300616 S13 230.1 .253
19301006 S13 202.8 .153
19310915 S13 120.8 .177
19320407 S13 66.2 .285
19330223 S13 51.9 .010
19370910 S13 157.9 .252
19370917 S13 162.2 .272
19400514 S13 128.3 .093
19460909 S13 172.0 .052
19550926 S13 455.6 -.006
19740823 S13 686.8 .094
19871103 S13 1963.53 .077
20010918 S13 8903.4 .075
20020719 S13 8019.26 -.021
20080929 S13 10365.45 .094
------------------------------------------------
No = 16 .151
7 6 0 1 2 PE 3 .157 PE +1 5 .182 PE +2 5 .107 PE +3 3 .083 Jan 0 Feb 1 .010 Mar 0 Apr 1 .285 May 1 .093 Jun 1 .253 Jul 1 -.021 Aug 1 .094 Sept 7 .131 Oct 2 .227 Nov 1 .077 Dec 0 1-10 3 .160 11-20 2 .175 21-31 6 .228 |
--------------------------------------------------------------------------------------------------------------------------------
Last edited
8/21/2011 (C) 2011 www.tigersoft.com
The
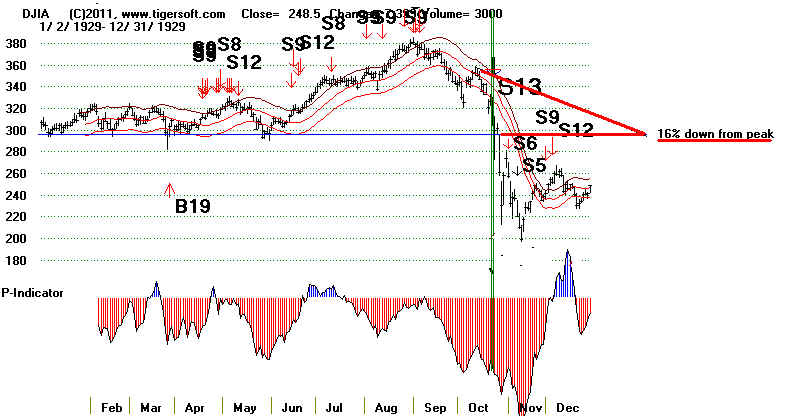
1929 Sell S13E was also an S13
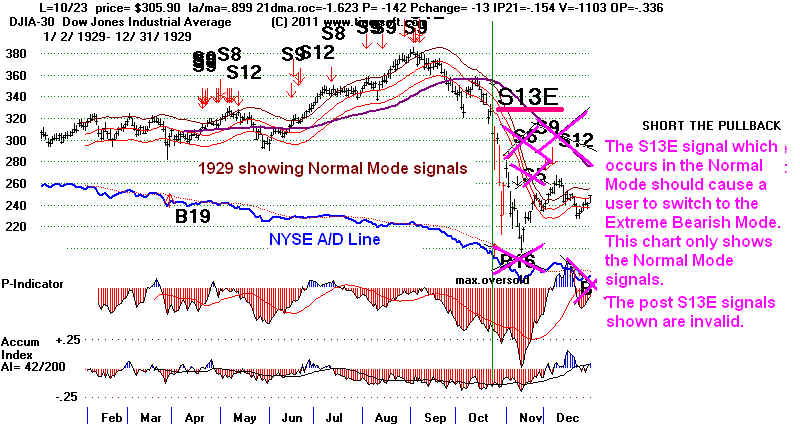
There are two variations of
this. The first Sell S13.
is based on the DJI falling more than 16% in 20 or fewer trading Days.
It is not required that we switch to Extreme Bearish mode after
a Sell S13.
The second Sell S13E shows momentum in extremely negative.
There are only two cases:
1) -- The first occurs where the DJI is down 19.4% in 36
days and has
a V-Indicator is below -700, IP21 is below -.154 and OPct is below -.33.
This is the 1929 case.
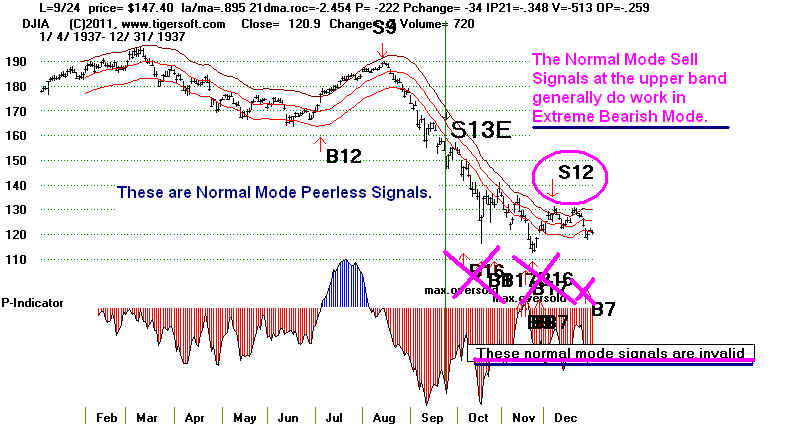
2) --- The DJI is down more than 19.4% in 28 trading days
and the
Accumulation Index is below -.197 with V-Indicator below -396
and OPct below -.107 (1937 case.)
The big difference between the S13 and the S13E is that with the S13E,
users should switch to the Extreme Bearish Mode and no longer
use the normal mode signals until the DJI gets up above the falling
200-dma or the 65-dma is penetrated as occured in 2009 following
a 50% correction of the previous long-term trend. (See discussion
about the end of the 2007-2009 bear market.)
Examples:
. The first chart for 1937 shows the Normal Mode
Peerless signals. As soon as the S13E occurs, we must use the
Extreme Bearish Mode and use its signals. These are shown in
the second chart 1937 chart shown firther below.
1937 Normal Mode Chart.
The S13E Should get use to switch to the Extreme Bearish Mode.
The first S13 here would not have called for a change of mode.
Continue to use the normal mode after a Sell S13.
Sell S13E
The LA/MA ranges from .874 ro .900
The 21DMA-ROC ranges from -1.163 to -2.845.
The IP21 ranges from -.154 to -.348
The OPct ranges from -.259 to -.484
1)
10/23/1929 305.9 +25.6%
Next Buy, B3, in Extreme Bearish Mode on 11/18/29 at 227.6
CL/MA 21-DMA-ROC P-I Ch. IP21 V-I OPct
.899 -1.623 -142 -13 -.154 -1103 -.361
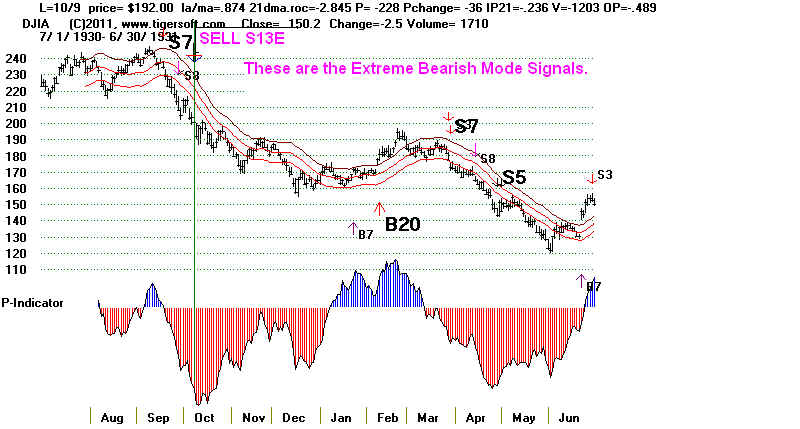
2)
10/9/1930 192 +10.5%
Next Buy, B7, in Extreme Bearish Mode on 1/23/31 at 171.8
CL/MA 21-DMA-ROC P-I Ch. IP21 V-I OPct
.874 -2.845 -220 -36 -.236 -1203 -.484
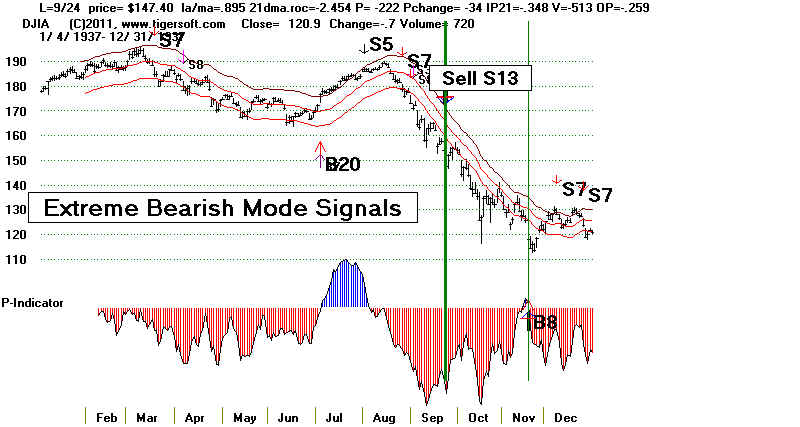
3)
9/24/1937 147.4 +22.5%
CL/MA 21-DMA-ROC P-I Ch. IP21 V-I OPct
.895 -2.454 -222 -34 -.348 -513 -.259
No S13E in 1940, 1946, 1987, 1990, 1996