Peerless version - 12/23/2013 (C) William Schmidt. Ph.D.
The average gain for the 52 Buy B18s since 1928 was 11.6%.
There were 2 losses. The biggest average B18 gains came in the Mid-Term
Election Year (15.2% ) as well as in August (19.1%) and October ( 14.0%).
The year after the Presidential Election saw the lowest average gain (7.6%)
       Size of Gains

       >10%            20    38.5%
       5%-9.99%        14    26.9%
       2%-4.99%        14    26.9%
       0 - 1.99%        2     3.8%
       losses           2     3.8%
| BUY B18s since 1928
19420805 B18 105.6 .348
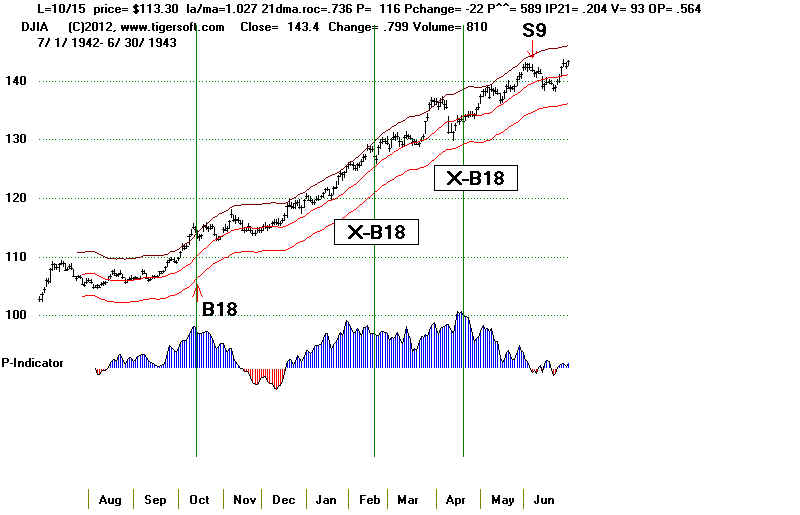
19421015 B18 113.3 .257
19430219 B18 126.7 .124 v = +106
19430420 B18 133.1 .07
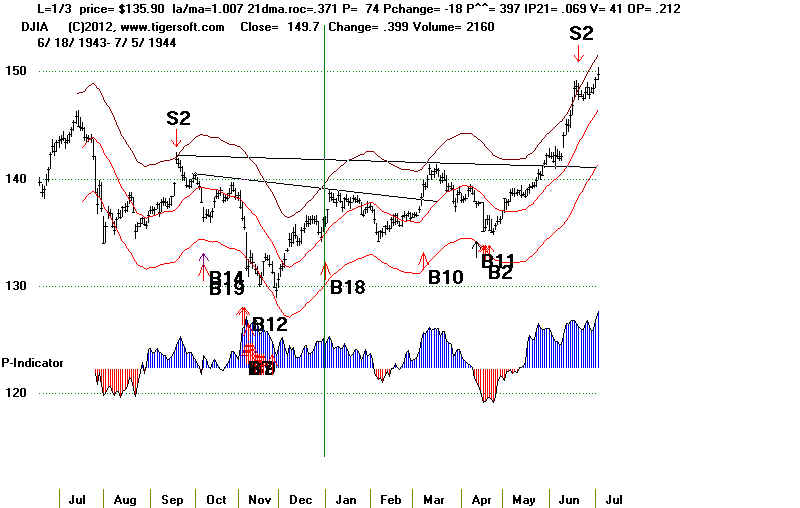
19440103 B18 135.9 .207
19441016 B18 148.1 .107
19450205 B18 155.4 .055 v = +148
19450406 B18 155.9 .052
19451011 B18 185.7 .073
19451213 B18 193.5 .029
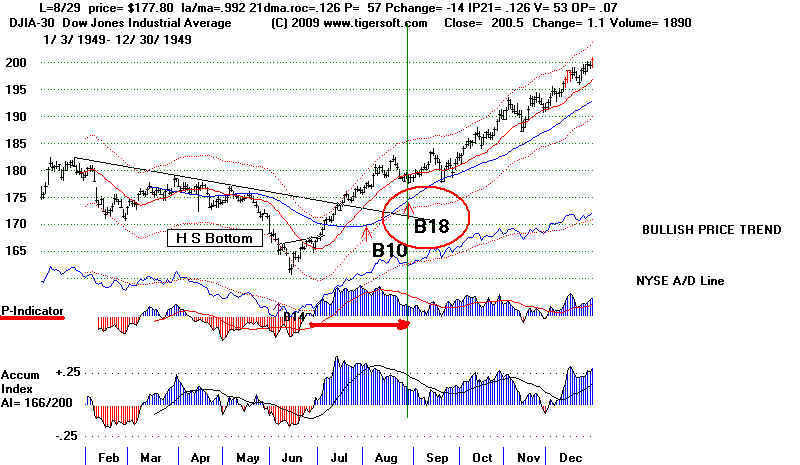
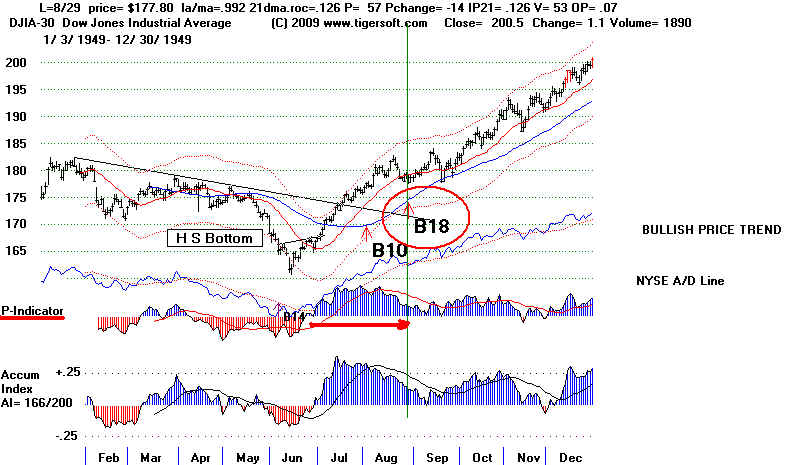
19490829 B18 177.8 .241 v = +53
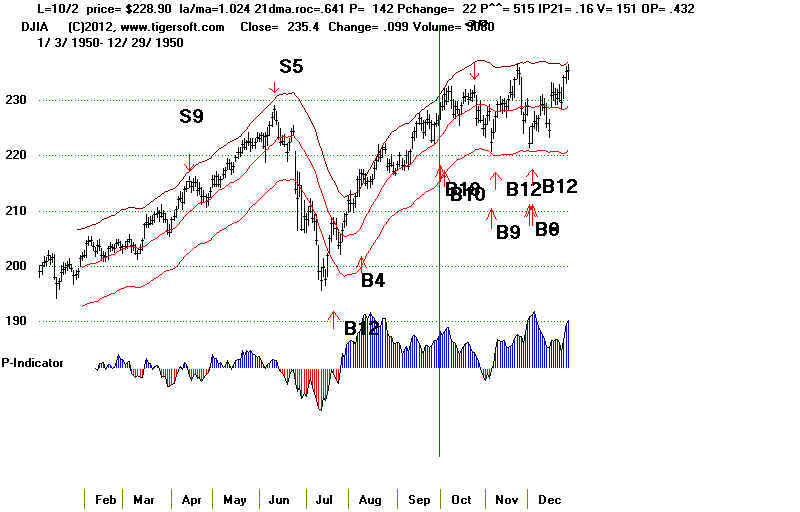
19501013 B18 228.5 .134
19510110 B18 240.4 .078
19540318 B18 300.1 .561
19540802 B18 349.6 .34
19580801 B18 505.4 .274
19581003 B18 533.7 .206
19581203 B18 558.8 .152
19610201 B18 649.3 .08 v = 377
19650315 B18 899.9 .043
19670303 B18 846.6 .048
19710128 B18 865.14 .084
19710329 B18 903.48 .038
19750305 B18 752.82 .149
19780530 B18 834.2 .039
19821201 B18 1031.09 .025
19830308 B18 1119.78 .111
19851220 B18 1543 .183
19860303 B18 1696.67 .076
19870310 B18 2280.09 .055
19910326 B18 2914.85 .039
X19930201 B18 3332.18 .05 v 3
X 19930826 B18 3648.17 .088 v - 11
19950303 B18 3989.61 .391
19950525 B18 4412.23 .258
19950801 B18 4700.37 .181
19961009 B18 5930.62 .156
X19970801 B18 8194.04 -.033 V = 35
19980317 B18 8749.99 .05
20020103 B18 10172.14 -.006 V = 10 ???
20030514 B18 8647.82 .134
20031217 B18 10145.26 .047
20041221 B18 10759.43 .014
X20050801 B18 10623.15 .09 V = 37
20060111 B18 11043.44 .048
20060315 B18 11209.77 .033
20061005 B18 11866.69 .045
20061204 B18 12283.85 .009
20070518 B18 13556.53 .029
X20110217 B18 12318.14 .04 v = 32
20130201 B18 14009.79 .083 v = 37
20130502 B18 14831.58 .023
--------------------------------------------------------------------
No.=52 Avg. =.116
(Since 1945 No.=46 Avg. =.106
PE          4   .121
PE +1      14   .076
PE +2      17   .152
PE +3      17   .110
January 5 .082 February 6 .072 March 12 .133 April 2 .061 May 5 .097 June 0 ---- July 0 ---- August 8 .191 September 0 ---- October 7 .140 November 0 ---- December 7 .066 1-10 25 .124 11-20 17 .108 21-31 10 .105 |
================================================================================
(C) 2013 William Schmidt, Ph.D. All rights reserved.
www.tigersoft.com 2/5/2013
The B18 occurs when the P-Indicator has
been positive for 41 straight days.
The OBV-Pct must be at least .152.
The V-Indicator should be above +7.
There are times in th four year cycle
when buying on strength is too risky
and so these signals are not allowed in
Junes, Julys and Septembers. Momentum
strength cannot be trusted in Deceember
after the 23rd. During a Presidential
Election Year, no B18s are allowed except
in January, November and December.
Though allowed, be careful about using
the B18 when Peerless is already on a
Buy and the DJI is more than 2.4% over
the 21-dma.
New research shows that Peerless Buys are apt
to be unproductive in the first
year after a Presidential Election if a
Republican is in the White House
and quite profitable if a Democrat is in the
White House. There
were 5 profitable B18s in the post-Presidential
Election Year. A Democrat
was in the White House in all cases.
Year after Presidential Election Year
Party in
Date B18 Gain B18 Paper
Comments
White House
Loss
LA/MA
--------------------------------------------------------------------------------------------------------------
Dem
2/5/45 +5.5% <2%
only 1.008
Dem
4/25/45 +.0.1%
<1%
1.032 (high)
Dem
12/11/45 +6.8% 3.6%
1.025
Dem
2/1/61 +10.2% <2%
1.021
Dem
8/26/93 +8.8% 3.0%
1.017
A Democrat is the White House produced much smaller gains
on Peerless Buys in the second year after a Presidential Election
than Republicans. This was clearly the case for B18s.
Two Years after Presidential Election Year
Rep
3/18/54 +58.3% 1.5%
1.013 Reversing B18.
Rep
8/2/54 +34.9%
3.9%
1.022
Rep
8/1/58 +28.7%
<.5%
1.032 (high)
Rep
12/3/58 +16.4% 0
1.003
Rep
10/26/82 +5.1% 1.4%
1.031 (high)
Rep
3/3/86
+7.6% 0%
1.028
(Dem
3/17/98 +3.8% 0
1.025)
Rep
1/3/02 -0.6%
4.2%
1.017
Rep
1/27/06 +6.1% 1.5%
1.005
Rep
4/4/06 +3.3% 1.2%
1.003
Rep
10/5/06 +4.5% 0
1.024
(Dem
4/21/10 -6.4%
0
1.014)
Buy B18s have become weaker since 2000.
Chasing momentum has become
less effective. As such, the
signals are mainly used now to show that breadth
has been persistently positive and, in
case Peerless was somehow still
on a Sell, that we would switch to a Buy.
There have been 43 Buy B18s since 1928. As a group, B18s averaged
+10.5% gain per trade. 17 of the gains were more than 10%, 12 were between
5% and 10%. In 11 cases, the gains were less than 5%. There were 3
losses,
all occurring since 2000. The biggest loss was 6.4%. This occurred in April
2010
and could easily have been avoided by heeding the dangers inherent in a completed
head/shpulders pattern.
The average B18 gain was only +2.3% in the 12 cases since 2000. There has
not been a 10% gain among B18s since 1996. In additon, the two biggest paper
losses occurred in 2010 (11.8%) and 2011 (5.7%)
8 of the 43 Buy B18s brought a paper loss of 3% or more. The best way to
avoid a bigger paper loss with these signals is to not chase and to wait for
a dip when they occurred more than 1.7% over the 21-day ma, unless they serve to
reverse a Peerless Sell signal, which is rare. 25 of 43 B19s occurred with
DJI more than 1.7% over the 21-day ma, 8 of these brought paper losses
of more than 2%.
Nearly all the B18s were are not reversing Buys. Rather, they usually reinforce
an already operative Peerless Buy. They usually are a sign of a healthy bull
market.
It is significant that there were no cases in the bear market years from 1929 to 1941.
There were 2 cases where they reversed an existing Peerless Sell. They
were important to employ, because the market in each case went significantly
higher.
3/18/1954
300.1 +58.3%
Paper
Loss = 1.5%
LA/MA
ROC
P-I
P-ch IP21
V-I
OPct
1.013 .423
84 42
.207 39 .253
Fell back to 295.40 and the
21-dma and rallied powerfully to 475.
===> This was a reversing Buy.
----------------------------------------------------------------------------------------------------------------------------------------------------
33) 11/3/2003
9858.46 +8.9% Paper loss =
- 2.3%
LA/MA
ROC
P-I
P-ch
IP21
V-I
OPct
1.015 .351 317
11 .103 2
.228
Fell back to 9629 and then rallied.
===> This was a reversing Buy signal.
-----------------------------------------------------------------------------------------------------------------------------------------
Buy B18s in a Presidential Election year were rare and less bullish.
10/16/1944 +10.7%
10/18/1996 +12.1%
1/2/2004 +3.1%
12/1/2004 +2.5%
Avg = 7.7%
B18s in the year after a second year of a Presidential cycle (1942, 1946...)
produced
an average gain of +13.7% in the 14 cases. There was only one loss. These are
generally
the strongest Buy B18s, provided the V-Indicator is above +7.
Bull markets often have seen these Buy signals at an early stage.
Sustained
very good breadth is very bullish. Examples at the start of the
best bull markets: 1942-1944, 1949, 1954, 1958, 1985, 1995-1996
and 2003. Very often there is more than one B18 signal in an
upswing. The first brings the highest gains.
If we include the cases where the V-Indicator was 0-7, there
in 36 of the 61 cases there was an immediate rally after the Buy B18.
In 25 cases there would have been a paper loss after the Buy B18.
There were only 3 instances of paper losses of more than 5%. Continued
good breadth is the best safeguard against a "bad Buy B18" if the
DJI is already up more than 10% from its 4 month lows. Given the
average gain of 10% and the 36/61 probability of there being very little
or no paper loss, in most cases, these should be treated as automatic
Buys. But be careful if the V-Indicator is below 10 and/or if a bearish
head and shoulders or hands above the head price pattern develops.
Also, as a working hypothesis, the key Peerless indicators (P-Indicator, IP21and OP)
should be higher than say 12, .10 and .06, respectively.
Buy B18s in a Presidential Election year were sometimes problematic
if they were allowed. if allowed, they would have meant chasing a rally and
buying at the upper band on
10/16/1944 148.10
3/4/1988 2057.86 -1.1%
and were not needed when the market was exceptionally strong in
a Presidential Election Year, as Peerless was already on a Buy.
2/4/1972 +4.0% if allowed
3/3/1976 +3.1% if allowed
8/1/1980 +3.3% if allowed
2/15/96 0 gain if allowed.
1/2/2004 +3.1% if allowed
It is probably best for the overall system if users discard B18s from February through
September in a Presidential Election Year.
V-Indicator Needs to be above +7.
Readings by the V-Indicator of +7 are lower tend to bring smaller gains.
In these 17 cases, the average gain was only 3.6%. There was one other
case were a B18 reached +7: this did gain 36.8% on 3/3/95, but this was clearly
not a good point to sell, given the classic flat topped breakout into all-time
high territory. The Peerless program has been adjusted to disallow Buy B18s
when the V-Indicator is 7 or lower. You can see further below the cases of B18s that
are eliminated because the V-Indicator was not positive enough. They are
indented
and marked with an "X"
3 Bad Buy B18s.
The March 2013 version of Peerless eliminated each of these
by changing the P-I and OPct requirements.
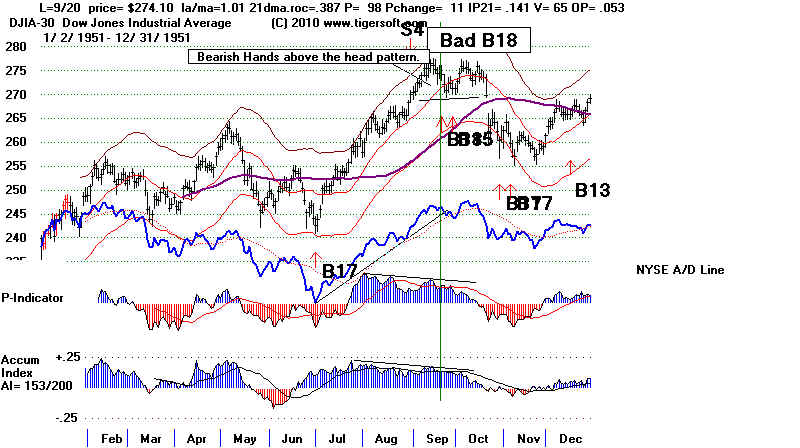
1)
9/ 20/ 1951
274.1 Gain= 0
la/ma=1.01 ma.roc= .387 98 P= 11 (LOW) IP21=.141 V= .65 OP=.053 (LOW)
Note development of bearish hands above the head price pattern in chart for this period
just below.
Paper loss of 7%. DJI
fell to 256 in November and then rallied back.
2) 3 / 7 / 1997
7000.89 -.024
la/ma=1.009 ma.roc= .437 P= 11
(LOW) 137 IP21= .114 V=11 OP= .137 (LOW)
Fell to 6386 (8%) before strongly rallying
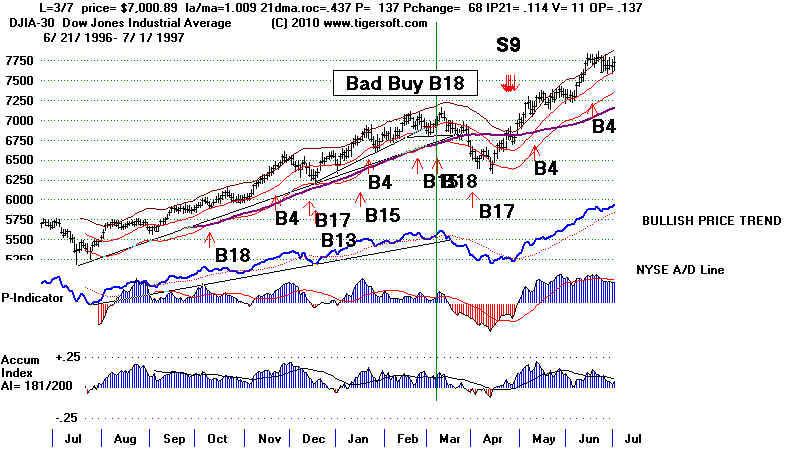
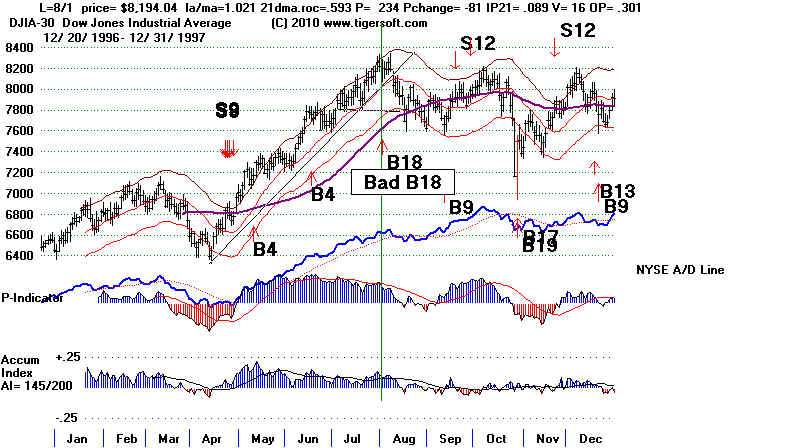
3) 8 / 1 / 1997
8194.04 -.002
la/ma=1.021 ma.roc= .593 P=234 IP21= .089 (low)
V=16 OP= .301
The DJI was already up more than 20% from 4 month low.
Fell to 7600 (6% paper loss) before rallying back to the upper band.
The Requirements:
Peerless P-Indicator has been positive 42 straight
days and the V-Indicator is above
+7 with the DJI not more than
3.9% over the 21-day ma. The signal is not allowed in June or July
and is not allowed in Januaries the year before a Presidential Election.
             ---Buy B18 Cases, Key Values and Outcomes--

1928-1941  no cases


1942-2009
Date of B18 DJI Gain
--------------------------------------------------------------------------------------------------------------------------------[-----------------------
1) 10 /15 /1942 113.3 +25.2% No Paper Loss
LA/MA ROC P-I P-ch IP21 V-I OPct
1.027 .736 116 -22 .204 93 .532
high
Up strongly immediately. There had already been numerous Sells.
--------------------------------------------------------------------------------------------------------------------------------------------------------
2) 2/19/1943 126.7 +11.9% No Paper Loss
LA/MA ROC P-I P-ch IP21 V-I OPct
1.008 .579 110 -5 .215 106 .358
at 21-day ma
Up strongly immediately.
--------------------------------------------------------------------------------------------------------------------------------[-----------------------
3) 4/20/1943 133.1 +6.5% No Paper Loss
LA/MA ROC P-I P-ch IP21 V-I OPct
.993 .329 174 -18 .081 246 .247
at 21-day ms
Up immediately.
 --------------------------------------------------------------------------------------------------------------------------------[-----------------------
4) 1/3/1944 135.9 +8.8% Paper Loss = 1%
LA/MA ROC P-I P-ch P^^ IP21 V-I OPct
1.007 .371 74 -18 +397 .069 41 .212
Up immediately.
--------------------------------------------------------------------------------------------------------------------------------[-----------------------
4) 1/3/1944 135.9 +8.8% Paper Loss = 1%
LA/MA ROC P-I P-ch P^^ IP21 V-I OPct
1.007 .371 74 -18 +397 .069 41 .212
Up immediately.
 --------------------------------------------------------------------------------------------------------------------------------[-----------------------
5) 10 / 16 / 1944 148.1 +10.7% Paper Loss = 1.6%
LA/MA ROC P-I P-ch IP21 V-I OPct
1.008 .422 112 7 .124 68 .236
DJI hesitated for 1 month. Fell back to 145.66 before rallying.
--------------------------------------------------------------------------------------------------------------------------------[-----------------------
6) 2/5/1945 155.4 + 5.5% Paper Loss = 1.7%
LA/MA ROC P-I P-ch IP21 V-I OPct
1.009 .108 73 16 .14 27 .188
DJI hesitated for 1 month. Fell back to 152.8 before rallying.
Note the false head and shouders pattern in February and March 1945.
The fact that the P-Indicator and Accum. Index were very positive
was the alert that it might fail. Surpassing the right shoulder's apex
launches prices here.
-------------------------------------------------------------------------------------------------------------------------------------------------------------
7) 4 / 25 / 1945 163.90 +0.1% Paper Loss <1%
LA/MA ROC P-I P-ch IP21 V-I OPct
1.032 .873 173 30 .193 188 .526
high
Rallied immediately to a sell at upper band in two months.
The DJI is already 3.2% above the21-day ma here. A retreat
has to be considered a better buy.
-------------------------------------------------------------------------------------------------------------------------------------------------------------
8) 12/11/1945 195.8 +6.8% Paper Loss = 3.6%
LA/MA ROC P-I P-ch IP21 V-I OPct
1.025 .441 138 -11 .237 148 -.001
too high
DJI fell immediately to 185.80 and then rallied.
DJI was already up a long ways when B18 occurred. It was best to wait
for a decline at least to the 21-day ma.
------------------------------------------------------------------------------------------------------------------------------------------------------
9) 10 / 2 / 1950 228.9 +1.1% Paper Loss < 1%
LA/MA ROC P-I P-ch IP21 V-I OPct
1.024 .253 87 4 .08 53 .181
too high
--------------------------------------------------------------------------------------------------------------------------------[-----------------------
5) 10 / 16 / 1944 148.1 +10.7% Paper Loss = 1.6%
LA/MA ROC P-I P-ch IP21 V-I OPct
1.008 .422 112 7 .124 68 .236
DJI hesitated for 1 month. Fell back to 145.66 before rallying.
--------------------------------------------------------------------------------------------------------------------------------[-----------------------
6) 2/5/1945 155.4 + 5.5% Paper Loss = 1.7%
LA/MA ROC P-I P-ch IP21 V-I OPct
1.009 .108 73 16 .14 27 .188
DJI hesitated for 1 month. Fell back to 152.8 before rallying.
Note the false head and shouders pattern in February and March 1945.
The fact that the P-Indicator and Accum. Index were very positive
was the alert that it might fail. Surpassing the right shoulder's apex
launches prices here.
-------------------------------------------------------------------------------------------------------------------------------------------------------------
7) 4 / 25 / 1945 163.90 +0.1% Paper Loss <1%
LA/MA ROC P-I P-ch IP21 V-I OPct
1.032 .873 173 30 .193 188 .526
high
Rallied immediately to a sell at upper band in two months.
The DJI is already 3.2% above the21-day ma here. A retreat
has to be considered a better buy.
-------------------------------------------------------------------------------------------------------------------------------------------------------------
8) 12/11/1945 195.8 +6.8% Paper Loss = 3.6%
LA/MA ROC P-I P-ch IP21 V-I OPct
1.025 .441 138 -11 .237 148 -.001
too high
DJI fell immediately to 185.80 and then rallied.
DJI was already up a long ways when B18 occurred. It was best to wait
for a decline at least to the 21-day ma.
------------------------------------------------------------------------------------------------------------------------------------------------------
9) 10 / 2 / 1950 228.9 +1.1% Paper Loss < 1%
LA/MA ROC P-I P-ch IP21 V-I OPct
1.024 .253 87 4 .08 53 .181
too high
 ----------------------------------------------------------------------------------------------------------------------------------------------------
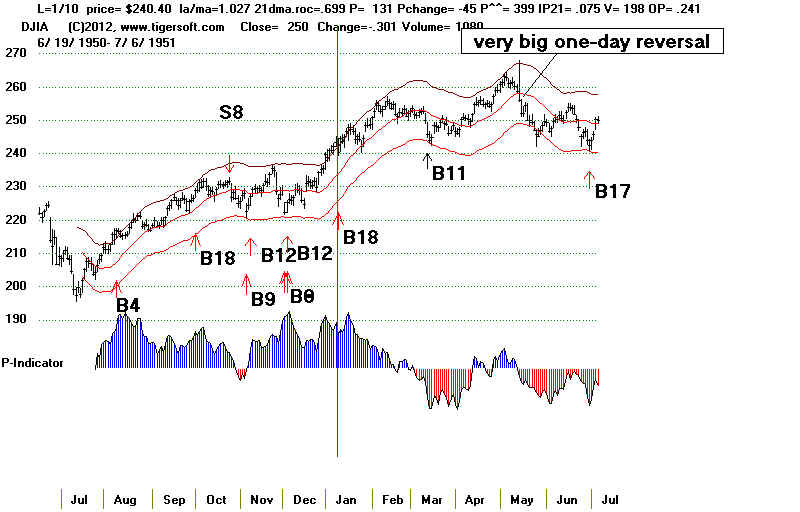
10) 1/10/1951 240.4 +14.4% No Paper Loss
LA/MA ROC P-I P-ch IP21 V-I OPct
1.027 .699 131 -45 .075 198 .212
high
Up 10% over next 4 months.
----------------------------------------------------------------------------------------------------------------------------------------------------
10) 1/10/1951 240.4 +14.4% No Paper Loss
LA/MA ROC P-I P-ch IP21 V-I OPct
1.027 .699 131 -45 .075 198 .212
high
Up 10% over next 4 months.
 ----------------------------------------------------------------------------------------------------------------------------------------------------
11) 3/18/1954 300.1 +58.3% Paper Loss = 1.5%
LA/MA ROC P-I P-ch IP21 V-I OPct
1.013 .423 84 42 .207 39 .253
Fell back to 295.40 and the 21-dma and rallied powerfully to 475.
===> This was a reversing Buy.
----------------------------------------------------------------------------------------------------------------------------------------------------
12) 8 / 2 / 1954 349.6 +35.9% Paper Loss = 3.9%
LA/MA ROC P-I P-ch IP21 V-I OPct
1.022 .541 173 8 .207 229 .304
high
Up strongly after test of 65-dma and 335.8
----------------------------------------------------------------------------------------------------------------------------------------------------
13) 8 / 1 / 1958 505.4 +28.7% Paper Loss = 0.53%
LA/MA ROC P-I P-ch IP21 V-I OPct
1.032 .614 111 13 .209 141 .43
high
Up strongly after re-testing rising 21-day ma at 502.70 on 8/18/1958.
----------------------------------------------------------------------------------------------------------------------------------------------------
14) 10 / 3 / 1958 533.70 +21.8% No Paper Loss
LA/MA ROC P-I P-ch IP21 V-I OPct
1.017 .462 79 21 .064 15 .25
Up strongly.
----------------------------------------------------------------------------------------------------------------------------------------------------
15 ) 12 / 3 / 1958 558.8 +16.4% No Paper Loss
LA/MA ROC P-I P-ch IP21 V-I OPct
1.003 .334 82 -1 .085 5 .337
Up strongly.
----------------------------------------------------------------------------------------------------------------------------------------------------
16 ) 2/1/1961 649.3 +10.2% Paper Loss = 1.9%
LA/MA ROC P-I P-ch IP21 V-I OPct
1.024 .736 197 13 .13 377 .324
high
10 day decline to 637 at 21-dma and then rally to 705 in 3 months.
-------------------------------------------------------------------------------------------------------------------------------------------------
17 ) 1/28 /1971 865.14 +9.4% No Paper Loss
LA/MA ROC P-I P-ch IP21 V-I OPct
1.021 .326 243 -24 .096 1 .464
high
DJI rallied immediately, then fell to 21-dma and then rallied to new highs.
----------------------------------------------------------------------------------------------------------------------------------------------------
18 ) 3/5/1975 752.82 +16.6% Paper Loss = 1.2%
LA/MA ROC P-I P-ch IP21 V-I OPct
1.032 .677 89 -50 .093 1 .175
very high
DJI fell to just above the lower band and then rallied strongly.
----------------------------------------------------------------------------------------------------------------------------------------------------
19 ) 5/12/1978 840.7 +3.1% No Paper Loss
LA/MA ROC P-I P-ch IP21 V-I OPct
1.02 .949 182 -6 - .001 7 .324
DJI rallied to upper band sell.
----------------------------------------------------------------------------------------------------------------------------------------------------
20) 10/26/1982 1006.07 +5.1% Paper Loss = 1.4%
LA/MA ROC P-I P-ch IP21 V-I OPct
1.031 1.043 237 -10 .118 13 .174
very high
DJI fell to 21-dma and rallied to upper band sell.
----------------------------------------------------------------------------------------------------------------------------------------------------
21) 3/8/1983 1119.78 +11.1% Insignificant Paper Loss
LA/MA ROC P-I P-ch IP21 V-I OPct
1.013 .452 188 -59 .017 7 .174
DJI fell to 1113.49 and rallied past upper band.
---------------------------------------------------------------------------------------------------------------------------------------------------
22) 12/20/1985 1543 +18.3% Paper Loss = 2.6%
LA/MA ROC P-I P-ch IP21 V-I OPct
1.031 .828 179 27 .065 13 .185
very high
DJI retested 1502 needed for a month. Then rally resumes.
--------------------------------------------------------------------------------------------------------------------------------------------------
23) 3/3/1986 1696.67 +7.6% Insignificant Paper Loss
LA/MA ROC P-I P-ch IP21 V-I OPct
1.028 1.046 295 -10 .27 19 .305
very high
DJI fell to 1686.66 and rallied past the upper band.
--------------------------------------------------------------------------------------------------------------------------------------------------
24) 3/10/1987 2280.09 + 5.5% Paper Loss = 1.4%
LA/MA ROC P-I P-ch IP21 V-I OPct
1.025 .50 35 17 .102 +4 .257
high
DJI fell to 2248.44 and rallied to upper band.
--------------------------------------------------------------------------------------------------------------------------------------------------
25) 4/18/1991 2999.26 +10.2% Paper Loss = 4.5%
LA/MA ROC P-I P-ch IP21 V-I OPct
1.029 .538 183 22 .02 11 .232
very high
DJI fell to 2865.38 and rallied to upper band.
--------------------------------------------------------------------------------------------------------------------------------------------------
26) 2/1/1993 3332.18 +19.1% Insignificant Paper Loss
LA/MA ROC P-I P-ch IP21 V-I OPct
1.016 .113 154 4 .023 3 .202
DJI fell to 3312.19 and rallied steadily or 10 months.
--------------------------------------------------------------------------------------------------------------------------------------------------
27) 8/26/1993 3648.17 +8.8% Paper Loss = 3.0%
LA/MA ROC P-I P-ch IP21 V-I OPct
1.017 .315 161 7 .089 11 .334
Fell to 3537 at rising 65-dma and then rallied for 4 months.
-----------------------------------------------------------------------------------------------------------------------------------------
28) 3/3/1995 3989.61 36.8% Paper Loss = 0.7%
LA/MA ROC P-I P-ch IP21 V-I OPct
1.007 .427 149 -26 .104 6 .333
Fell to 3962.63 at rising 65-dma and then rallied for 4 months.
-----------------------------------------------------------------------------------------------------------------------------------------
29) 5/25/1995 4412.23 +23.7% Paper Loss = 1.0%
LA/MA ROC P-I P-ch IP21 V-I OPct
1.007 .306 133 -10 .127 v=10 .299
Fell to 4369.00 at rising 21-dma and then rallied.
-----------------------------------------------------------------------------------------------------------------------------------------
30). 10/18/1996 6094.23 +12.1% Paper Loss = 1.4%
LA/MA ROC P-I P-ch IP21 V-I OPct
1.025 .454 157 20 .104 13 .227
high
Fell to 6007.02 at rising 21-dma and then rallied.
-----------------------------------------------------------------------------------------------------------------------------------------
31) 3/17/1998 8749.99 +3.8% No paper loss
LA/MA ROC P-I P-ch IP21 V-I OPct
1.025 .531 204 4 .153 24 .238
high
Immediately rallied, which lasted 6 weeks.
-----------------------------------------------------------------------------------------------------------------------------------------
32) 1/3/2002 10172.14 loss = 0.6% Paper loss = 4.2%
LA/MA ROC P-I P-ch IP21 V-I OPct
1.017 .487 288 78 .059 10 .256
high
Fell to 9744.24 and then rallied to upper band and Sell S9.
-----------------------------------------------------------------------------------------------------------------------------------------
33) 11/3/2003 9858.46 +8.9% Paper loss - 2.3%
LA/MA ROC P-I P-ch IP21 V-I OPct
1.015 .351 317 11 .103 2 .228
Fell back to 9629 and then rallied.
===> This was a reversing Buy signal.
-----------------------------------------------------------------------------------------------------------------------------------------
34) 1/2/2004 10409.95 +3.1% No Paper Loss
LA/MA ROC P-I P-ch IP21 V-I OPct
1.024 .653 425 13 .107 44 .341
high
Immediately rallied.
-----------------------------------------------------------------------------------------------------------------------------------------
35) 12/1/2004 10590.22 +2.5% No Paper Loss
LA/MA ROC P-I P-ch IP21 V-I OPct
1.015 .613 518 33 .067 145 .309
Immediately rallied.
----------------------------------------------------------------------------------------------------------------------------
36) 8/1/2005 10623.15 -3.2% Paper Loss = 3.8%
LA/MA ROC P-I P-ch IP21 V-I OPct
1.007 .394 385 25 .057 37 .237
Fell back to 10200 (4% paper loss) and then rallied strongly.
----------------------------------------------------------------------------------------------------------------------------
37) 1/27/2006 10907/21 +6.1% Paper Loss = 1.5%
LA/MA ROC P-I P-ch IP21 V-I OPct
1.005 .142 487 108 .079 83 .196
Fell back to 10750 and then rallied strongly for 4 months.
----------------------------------------------------------------------------------------------------------------------------
38) 4/4/2006 11203.85 +3.3% Paper Loss = 1.2%
LA/MA ROC P-I P-ch IP21 V-I OPct
1.003 .262 204 88 -.02 4 .172
Fell back to 11073 and then rallied to Sell S9 at the upper band.
----------------------------------------------------------------------------------------------------------------------------
39) 10/5/2006 11866.69 +4.5% No paper loss
LA/MA ROC P-I P-ch IP21 V-I OPct
1.024 .474 326 149 .115 24 .289
Rallied immediately.
----------------------------------------------------------------------------------------------------------------------------
40) 12/4/2006 12283.85 +0.9% No paper loss
LA/MA ROC P-I P-ch IP21 V-I OPct
1.006 .259 53` 101 .113 90 . 336
Rallied immediately.
----------------------------------------------------------------------------------------------------------------------------
41) 5/18/2007 13556.53 + .031 Paper loss = 2.2%
LA/MA ROC P-I P-ch IP21 V-I OPct
1.025 .675 157 82 .143 44 .514
Fell back to 13263 and then rallied for a month to Sell.
----------------------------------------------------------------------------------------------------------------------------
42) 4/21/2010 11124.92 Loss = -6.4% Paper loss = 11.8%
LA/MA ROC P-I P-ch IP21 V-I OPct
1.014 .368 317 -27 .095 4 (LOW) .439
Fell back to 9816.49 and then rallied to upper band.
Note that prices had reached rising resistance line.
This was far from being a reversing Buy. And a head/shoulderspattern appeared.
----------------------------------------------------------------------------------------------------------------------------
43) 2/17/ 2011 12318.14 +4.0% Paper loss = 5.7%
LA/MA ROC P-I P-ch IP21 V-I OPct
1.019 .486 398 115 .218 32 .385
At top of price channel. A pullback was expected.
DJI fell back to 11613.30 and then rallied to upper band.
-------------------------------------------------------------------------------------------------------------------------------
44) 2/1/ 2013 14009.79 Not closed out yet. +?% Paper loss =
LA/MA ROC P-I P-ch IP21 V-I OPct
1.027 .522 454 -43 .198 37 .316
At top of price channel. and challenging 2007 high.
==========================================================
Avg. Gain about 9%
Not yet cl
----------------------------------------------------------------------------------------------------------------------------------------------------
11) 3/18/1954 300.1 +58.3% Paper Loss = 1.5%
LA/MA ROC P-I P-ch IP21 V-I OPct
1.013 .423 84 42 .207 39 .253
Fell back to 295.40 and the 21-dma and rallied powerfully to 475.
===> This was a reversing Buy.
----------------------------------------------------------------------------------------------------------------------------------------------------
12) 8 / 2 / 1954 349.6 +35.9% Paper Loss = 3.9%
LA/MA ROC P-I P-ch IP21 V-I OPct
1.022 .541 173 8 .207 229 .304
high
Up strongly after test of 65-dma and 335.8
----------------------------------------------------------------------------------------------------------------------------------------------------
13) 8 / 1 / 1958 505.4 +28.7% Paper Loss = 0.53%
LA/MA ROC P-I P-ch IP21 V-I OPct
1.032 .614 111 13 .209 141 .43
high
Up strongly after re-testing rising 21-day ma at 502.70 on 8/18/1958.
----------------------------------------------------------------------------------------------------------------------------------------------------
14) 10 / 3 / 1958 533.70 +21.8% No Paper Loss
LA/MA ROC P-I P-ch IP21 V-I OPct
1.017 .462 79 21 .064 15 .25
Up strongly.
----------------------------------------------------------------------------------------------------------------------------------------------------
15 ) 12 / 3 / 1958 558.8 +16.4% No Paper Loss
LA/MA ROC P-I P-ch IP21 V-I OPct
1.003 .334 82 -1 .085 5 .337
Up strongly.
----------------------------------------------------------------------------------------------------------------------------------------------------
16 ) 2/1/1961 649.3 +10.2% Paper Loss = 1.9%
LA/MA ROC P-I P-ch IP21 V-I OPct
1.024 .736 197 13 .13 377 .324
high
10 day decline to 637 at 21-dma and then rally to 705 in 3 months.
-------------------------------------------------------------------------------------------------------------------------------------------------
17 ) 1/28 /1971 865.14 +9.4% No Paper Loss
LA/MA ROC P-I P-ch IP21 V-I OPct
1.021 .326 243 -24 .096 1 .464
high
DJI rallied immediately, then fell to 21-dma and then rallied to new highs.
----------------------------------------------------------------------------------------------------------------------------------------------------
18 ) 3/5/1975 752.82 +16.6% Paper Loss = 1.2%
LA/MA ROC P-I P-ch IP21 V-I OPct
1.032 .677 89 -50 .093 1 .175
very high
DJI fell to just above the lower band and then rallied strongly.
----------------------------------------------------------------------------------------------------------------------------------------------------
19 ) 5/12/1978 840.7 +3.1% No Paper Loss
LA/MA ROC P-I P-ch IP21 V-I OPct
1.02 .949 182 -6 - .001 7 .324
DJI rallied to upper band sell.
----------------------------------------------------------------------------------------------------------------------------------------------------
20) 10/26/1982 1006.07 +5.1% Paper Loss = 1.4%
LA/MA ROC P-I P-ch IP21 V-I OPct
1.031 1.043 237 -10 .118 13 .174
very high
DJI fell to 21-dma and rallied to upper band sell.
----------------------------------------------------------------------------------------------------------------------------------------------------
21) 3/8/1983 1119.78 +11.1% Insignificant Paper Loss
LA/MA ROC P-I P-ch IP21 V-I OPct
1.013 .452 188 -59 .017 7 .174
DJI fell to 1113.49 and rallied past upper band.
---------------------------------------------------------------------------------------------------------------------------------------------------
22) 12/20/1985 1543 +18.3% Paper Loss = 2.6%
LA/MA ROC P-I P-ch IP21 V-I OPct
1.031 .828 179 27 .065 13 .185
very high
DJI retested 1502 needed for a month. Then rally resumes.
--------------------------------------------------------------------------------------------------------------------------------------------------
23) 3/3/1986 1696.67 +7.6% Insignificant Paper Loss
LA/MA ROC P-I P-ch IP21 V-I OPct
1.028 1.046 295 -10 .27 19 .305
very high
DJI fell to 1686.66 and rallied past the upper band.
--------------------------------------------------------------------------------------------------------------------------------------------------
24) 3/10/1987 2280.09 + 5.5% Paper Loss = 1.4%
LA/MA ROC P-I P-ch IP21 V-I OPct
1.025 .50 35 17 .102 +4 .257
high
DJI fell to 2248.44 and rallied to upper band.
--------------------------------------------------------------------------------------------------------------------------------------------------
25) 4/18/1991 2999.26 +10.2% Paper Loss = 4.5%
LA/MA ROC P-I P-ch IP21 V-I OPct
1.029 .538 183 22 .02 11 .232
very high
DJI fell to 2865.38 and rallied to upper band.
--------------------------------------------------------------------------------------------------------------------------------------------------
26) 2/1/1993 3332.18 +19.1% Insignificant Paper Loss
LA/MA ROC P-I P-ch IP21 V-I OPct
1.016 .113 154 4 .023 3 .202
DJI fell to 3312.19 and rallied steadily or 10 months.
--------------------------------------------------------------------------------------------------------------------------------------------------
27) 8/26/1993 3648.17 +8.8% Paper Loss = 3.0%
LA/MA ROC P-I P-ch IP21 V-I OPct
1.017 .315 161 7 .089 11 .334
Fell to 3537 at rising 65-dma and then rallied for 4 months.
-----------------------------------------------------------------------------------------------------------------------------------------
28) 3/3/1995 3989.61 36.8% Paper Loss = 0.7%
LA/MA ROC P-I P-ch IP21 V-I OPct
1.007 .427 149 -26 .104 6 .333
Fell to 3962.63 at rising 65-dma and then rallied for 4 months.
-----------------------------------------------------------------------------------------------------------------------------------------
29) 5/25/1995 4412.23 +23.7% Paper Loss = 1.0%
LA/MA ROC P-I P-ch IP21 V-I OPct
1.007 .306 133 -10 .127 v=10 .299
Fell to 4369.00 at rising 21-dma and then rallied.
-----------------------------------------------------------------------------------------------------------------------------------------
30). 10/18/1996 6094.23 +12.1% Paper Loss = 1.4%
LA/MA ROC P-I P-ch IP21 V-I OPct
1.025 .454 157 20 .104 13 .227
high
Fell to 6007.02 at rising 21-dma and then rallied.
-----------------------------------------------------------------------------------------------------------------------------------------
31) 3/17/1998 8749.99 +3.8% No paper loss
LA/MA ROC P-I P-ch IP21 V-I OPct
1.025 .531 204 4 .153 24 .238
high
Immediately rallied, which lasted 6 weeks.
-----------------------------------------------------------------------------------------------------------------------------------------
32) 1/3/2002 10172.14 loss = 0.6% Paper loss = 4.2%
LA/MA ROC P-I P-ch IP21 V-I OPct
1.017 .487 288 78 .059 10 .256
high
Fell to 9744.24 and then rallied to upper band and Sell S9.
-----------------------------------------------------------------------------------------------------------------------------------------
33) 11/3/2003 9858.46 +8.9% Paper loss - 2.3%
LA/MA ROC P-I P-ch IP21 V-I OPct
1.015 .351 317 11 .103 2 .228
Fell back to 9629 and then rallied.
===> This was a reversing Buy signal.
-----------------------------------------------------------------------------------------------------------------------------------------
34) 1/2/2004 10409.95 +3.1% No Paper Loss
LA/MA ROC P-I P-ch IP21 V-I OPct
1.024 .653 425 13 .107 44 .341
high
Immediately rallied.
-----------------------------------------------------------------------------------------------------------------------------------------
35) 12/1/2004 10590.22 +2.5% No Paper Loss
LA/MA ROC P-I P-ch IP21 V-I OPct
1.015 .613 518 33 .067 145 .309
Immediately rallied.
----------------------------------------------------------------------------------------------------------------------------
36) 8/1/2005 10623.15 -3.2% Paper Loss = 3.8%
LA/MA ROC P-I P-ch IP21 V-I OPct
1.007 .394 385 25 .057 37 .237
Fell back to 10200 (4% paper loss) and then rallied strongly.
----------------------------------------------------------------------------------------------------------------------------
37) 1/27/2006 10907/21 +6.1% Paper Loss = 1.5%
LA/MA ROC P-I P-ch IP21 V-I OPct
1.005 .142 487 108 .079 83 .196
Fell back to 10750 and then rallied strongly for 4 months.
----------------------------------------------------------------------------------------------------------------------------
38) 4/4/2006 11203.85 +3.3% Paper Loss = 1.2%
LA/MA ROC P-I P-ch IP21 V-I OPct
1.003 .262 204 88 -.02 4 .172
Fell back to 11073 and then rallied to Sell S9 at the upper band.
----------------------------------------------------------------------------------------------------------------------------
39) 10/5/2006 11866.69 +4.5% No paper loss
LA/MA ROC P-I P-ch IP21 V-I OPct
1.024 .474 326 149 .115 24 .289
Rallied immediately.
----------------------------------------------------------------------------------------------------------------------------
40) 12/4/2006 12283.85 +0.9% No paper loss
LA/MA ROC P-I P-ch IP21 V-I OPct
1.006 .259 53` 101 .113 90 . 336
Rallied immediately.
----------------------------------------------------------------------------------------------------------------------------
41) 5/18/2007 13556.53 + .031 Paper loss = 2.2%
LA/MA ROC P-I P-ch IP21 V-I OPct
1.025 .675 157 82 .143 44 .514
Fell back to 13263 and then rallied for a month to Sell.
----------------------------------------------------------------------------------------------------------------------------
42) 4/21/2010 11124.92 Loss = -6.4% Paper loss = 11.8%
LA/MA ROC P-I P-ch IP21 V-I OPct
1.014 .368 317 -27 .095 4 (LOW) .439
Fell back to 9816.49 and then rallied to upper band.
Note that prices had reached rising resistance line.
This was far from being a reversing Buy. And a head/shoulderspattern appeared.
----------------------------------------------------------------------------------------------------------------------------
43) 2/17/ 2011 12318.14 +4.0% Paper loss = 5.7%
LA/MA ROC P-I P-ch IP21 V-I OPct
1.019 .486 398 115 .218 32 .385
At top of price channel. A pullback was expected.
DJI fell back to 11613.30 and then rallied to upper band.
-------------------------------------------------------------------------------------------------------------------------------
44) 2/1/ 2013 14009.79 Not closed out yet. +?% Paper loss =
LA/MA ROC P-I P-ch IP21 V-I OPct
1.027 .522 454 -43 .198 37 .316
At top of price channel. and challenging 2007 high.
==========================================================
Avg. Gain about 9%
Not yet cl