===================================================================
Buy B1s Presidential Election Years
1928...1932...2012
===================================================================
10/26/1944 145.8 +12.5% Sell S9 5/15/1945
la/ma 21dma ROC P-I P-ch P^^ IP21 V-I OP
.988 .056 13 -20 72 .13 -28 0
No paper loss.
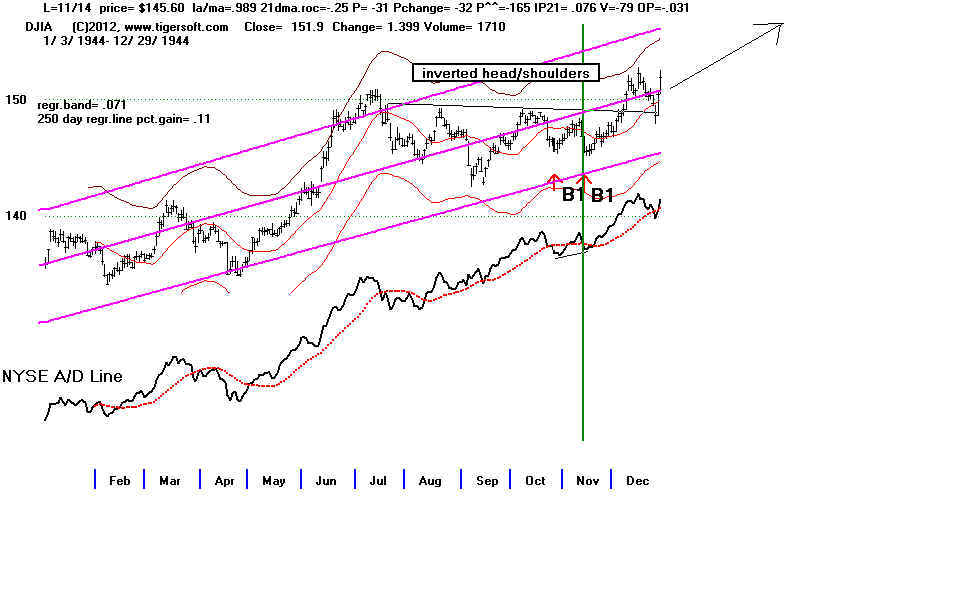 ---------------------[---------------------------------------
11/14/1944 145.6 +12.6% Sell S9 5/15/1945
la/ma 21dma ROC P-I P-ch P^^ IP21 V-I OP
.989 -.25 13 -32 -165 .076 -79 -.031
No paper loss.
-------------------------------------------------------------
11/5/1948 178.4 +1.6% Sell S12 1/7/1949
la/ma 21dma ROC P-I P-ch P^^ IP21 V-I OP
.962 -.18 149 43 -165 .161 222 .146
Paper loss = 4.0%
The New B1 Buys here were already designated as Buy B9s.
---------------------[---------------------------------------
11/14/1944 145.6 +12.6% Sell S9 5/15/1945
la/ma 21dma ROC P-I P-ch P^^ IP21 V-I OP
.989 -.25 13 -32 -165 .076 -79 -.031
No paper loss.
-------------------------------------------------------------
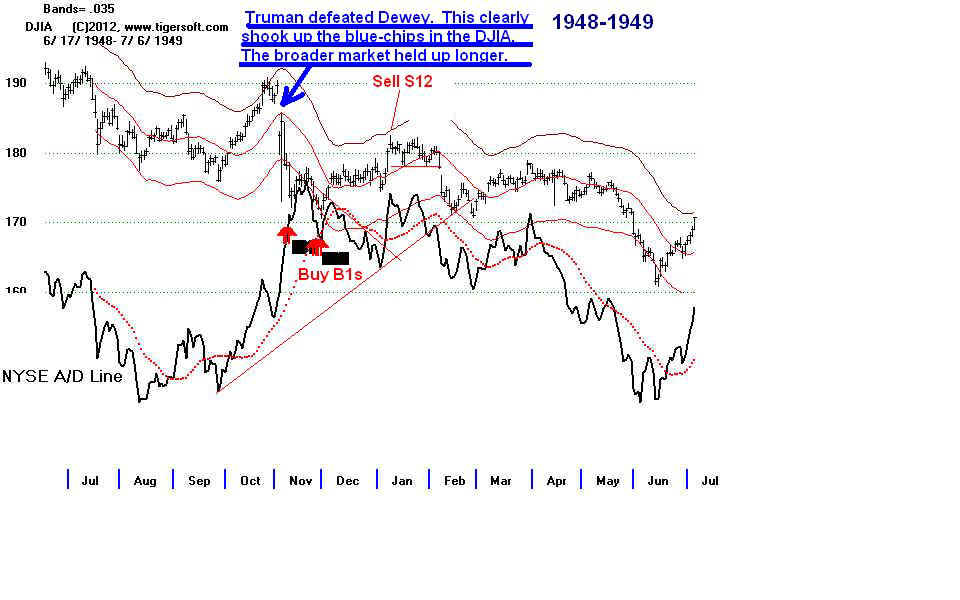
11/5/1948 178.4 +1.6% Sell S12 1/7/1949
la/ma 21dma ROC P-I P-ch P^^ IP21 V-I OP
.962 -.18 149 43 -165 .161 222 .146
Paper loss = 4.0%
The New B1 Buys here were already designated as Buy B9s.
 -------------------------------------------------------------
11/24/1948 173.4 +4.6% Sell S12 1/7/1949
la/ma 21dma ROC P-I P-ch P^^ IP21 V-I OP
.961 -1.078 78 -55 335 -.029 152 -.268
Paper loss = 1.3%
-------------------------------------------------------------
10/4/1976 977.98 +0.7% Sell S4 12/22/76
la/ma 21dma ROC P-I P-ch P^^ IP21 V-I OP
.984 -.082 32 -8 60 .038 -1 -.174
Paper loss = 5.5%
The first Buy B9 has already been treated as a Buy B9
The second cluster is not now a Buy signal.
-------------------------------------------------------------
11/24/1948 173.4 +4.6% Sell S12 1/7/1949
la/ma 21dma ROC P-I P-ch P^^ IP21 V-I OP
.961 -1.078 78 -55 335 -.029 152 -.268
Paper loss = 1.3%
-------------------------------------------------------------
10/4/1976 977.98 +0.7% Sell S4 12/22/76
la/ma 21dma ROC P-I P-ch P^^ IP21 V-I OP
.984 -.082 32 -8 60 .038 -1 -.174
Paper loss = 5.5%
The first Buy B9 has already been treated as a Buy B9
The second cluster is not now a Buy signal.
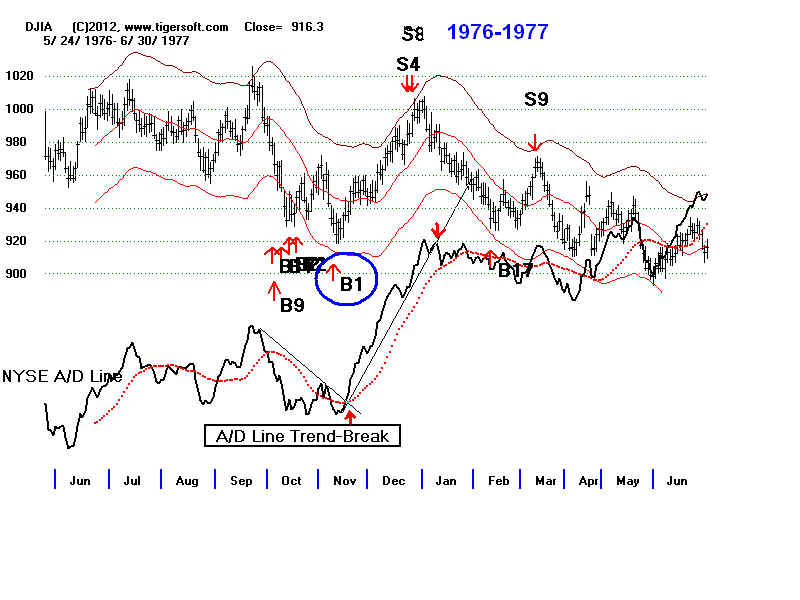 -------------------------------------------------------------
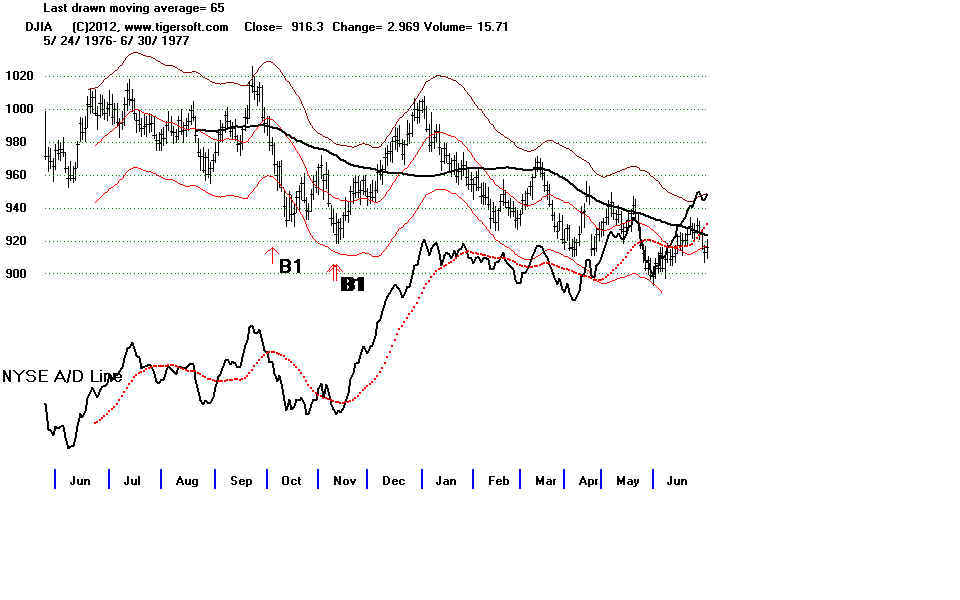
11/9/1976 930.77 +5.8% Sell S4 12/22/76
la/ma 21dma ROC P-I P-ch P^^ IP21 V-I OP
.983 -.271 -71 8 -131 .069 -3 -.047
Paper Loss = +.6%
-------------------------------------------------------------
11/9/1976 930.77 +5.8% Sell S4 12/22/76
la/ma 21dma ROC P-I P-ch P^^ IP21 V-I OP
.983 -.271 -71 8 -131 .069 -3 -.047
Paper Loss = +.6%
 -------------------------------------------------------------
10/2/1984 1191.36 +53.3% Sell S9 4/29/1986
la/ma 21dma ROC P-I P-ch P^^ IP21 V-I OP
.983 -.324 -34 -28 -60 -.14 -4 -.094
Paper loss = 1.4%
-------------------------------------------------------------
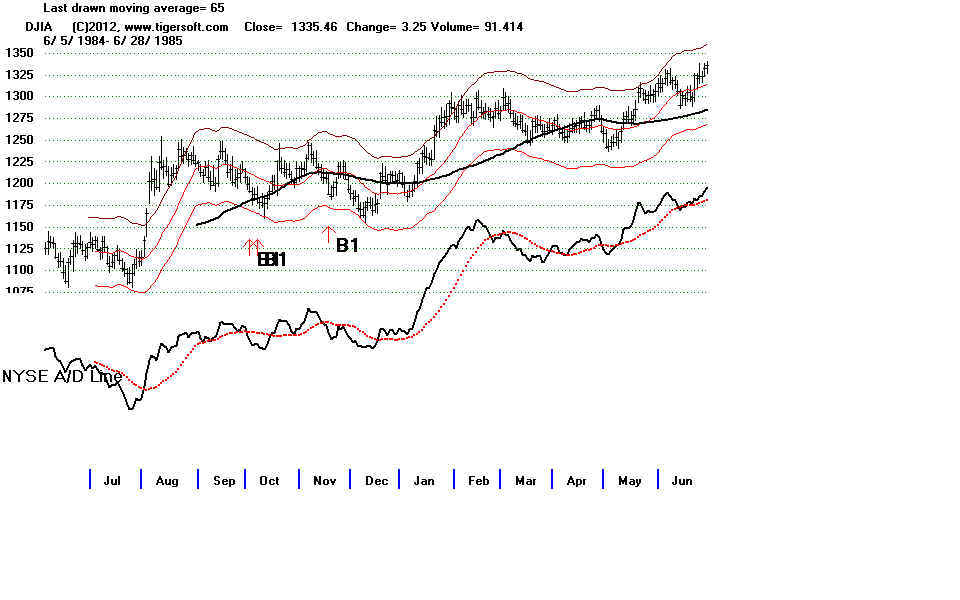
11/16/1984 1187.94 +53.6% Sell S9 4/29/1986
la/ma 21dma ROC P-I P-ch P^^ IP21 V-I OP
.983 -.324 -34 -28 -60 -.14 -4 -.094
Paper loss = 1.3%
These Buy B1s would be helpful additions.
-------------------------------------------------------------
10/2/1984 1191.36 +53.3% Sell S9 4/29/1986
la/ma 21dma ROC P-I P-ch P^^ IP21 V-I OP
.983 -.324 -34 -28 -60 -.14 -4 -.094
Paper loss = 1.4%
-------------------------------------------------------------
11/16/1984 1187.94 +53.6% Sell S9 4/29/1986
la/ma 21dma ROC P-I P-ch P^^ IP21 V-I OP
.983 -.324 -34 -28 -60 -.14 -4 -.094
Paper loss = 1.3%
These Buy B1s would be helpful additions.
-------------------------------------------------------------
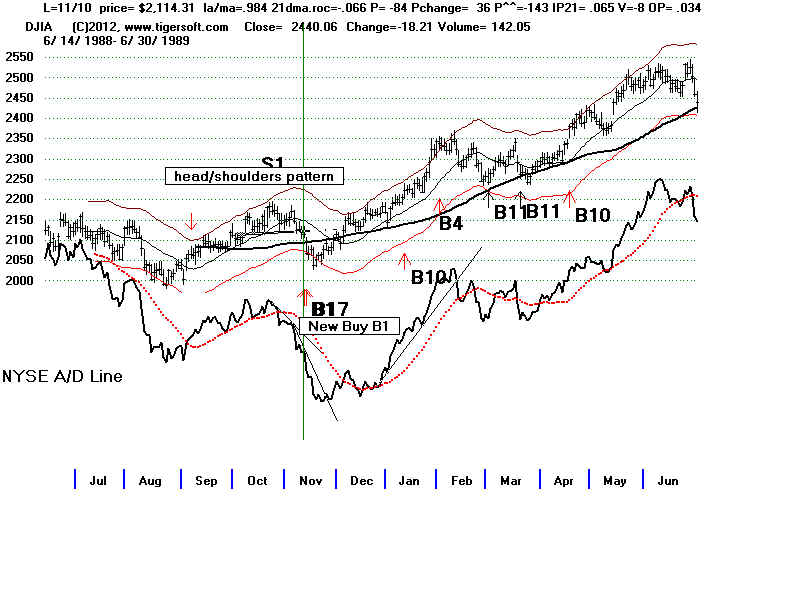
11/10/1988 2114.31 +31.1% Sell S9 10/4/1989
la/ma 21dma ROC P-I P-ch P^^ IP21 V-I OP
.984 -.066 -84 36 -143 .065 -8 .034
Paper loss = 3.6%
The Buy B1 here is also a Buy B17 on exisiting software.
The NASDAQ was underperforming the DJI at this time.
It fell from 378.40 to a low of 365.07 on 11/21/1984 before turning up.
 -------------------------------------------------------------
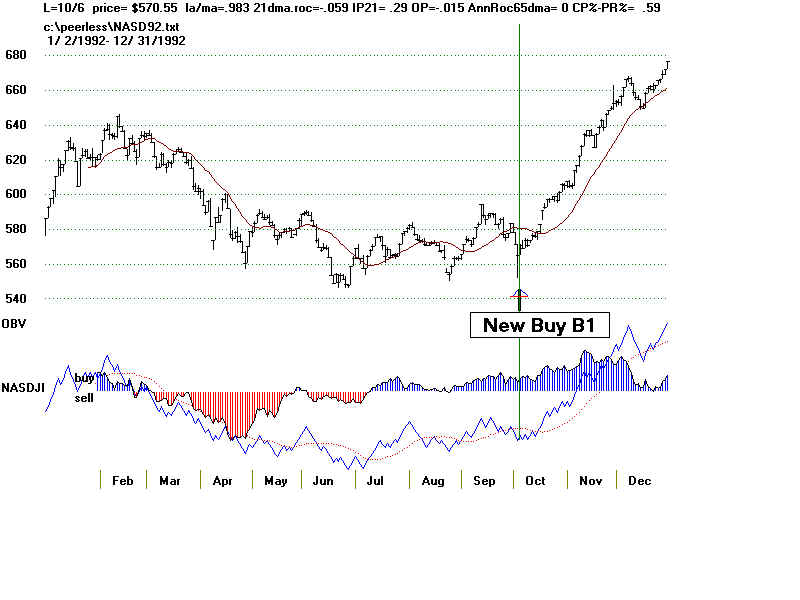
10/6/1992 3178.19 +24.8% Sell S4 2/3/1994
la/ma 21dma ROC P-I P-ch P^^ IP21 V-I OP
.984 -.066 -84 36 -143 .065 -8 .034
Paper loss = 1.3%
The Buy B1 here is also a Buy B17 on exisiting software.
-------------------------------------------------------------
10/6/1992 3178.19 +24.8% Sell S4 2/3/1994
la/ma 21dma ROC P-I P-ch P^^ IP21 V-I OP
.984 -.066 -84 36 -143 .065 -8 .034
Paper loss = 1.3%
The Buy B1 here is also a Buy B17 on exisiting software.

 -------------------------------------------------------------
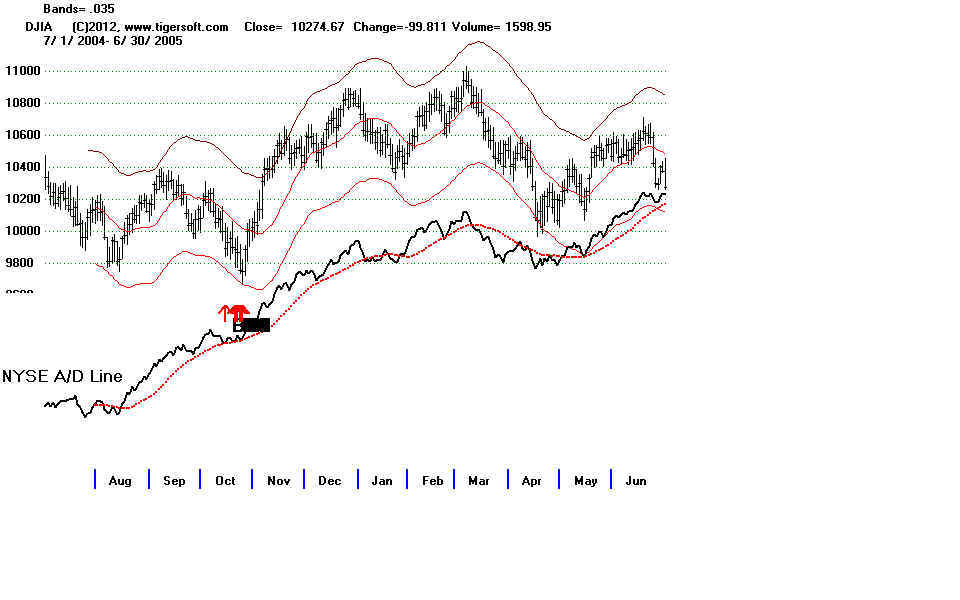
10/14/2004 9894.45 +9.7% Sell S8 12/28/2004
la/ma 21dma ROC P-I P-ch P^^ IP21 V-I OP
.984 -.066 -84 36 -143 .065 -8 .034
Paper loss = 0.1%
On the NASDAQ chart, the NASDJI was very positive.
-------------------------------------------------------------
10/14/2004  9894.45 +9.7%    Sell S8  12/28/2004
  la/ma      21dma ROC     P-I   P-ch    P^^    IP21     V-I    OP
 .984      -.066     -84   36   -143  .065    -8   .034
 Paper loss = 0.1%
 On the NASDAQ chart, the NASDJI was very positive.
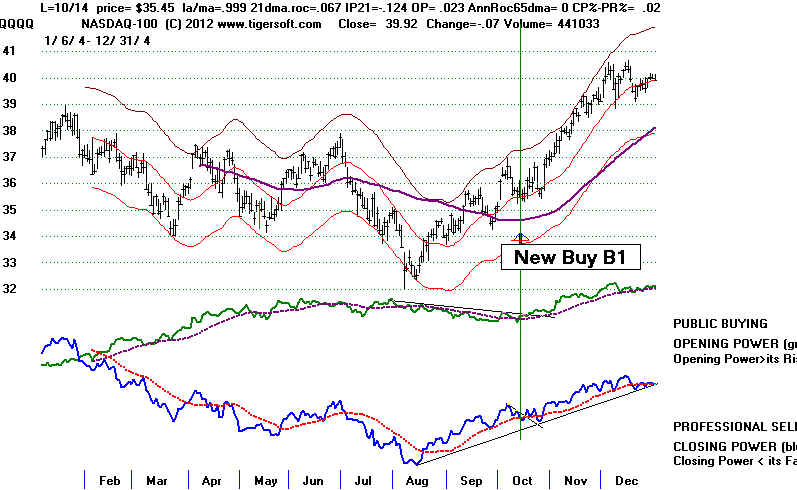 -------------------------------------------------------------
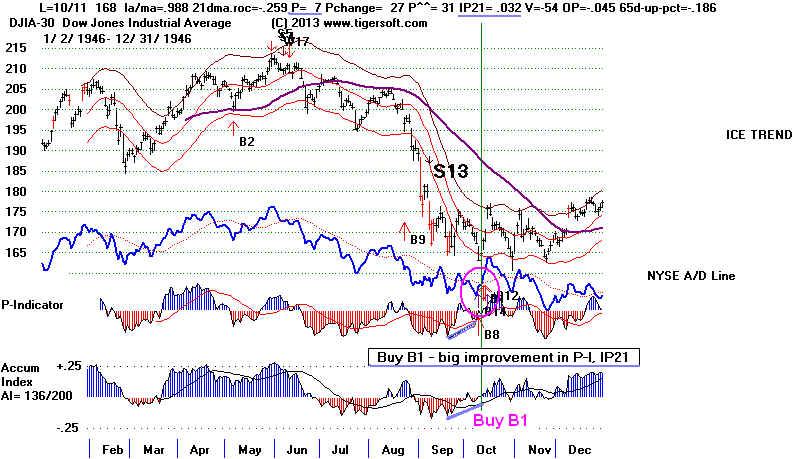
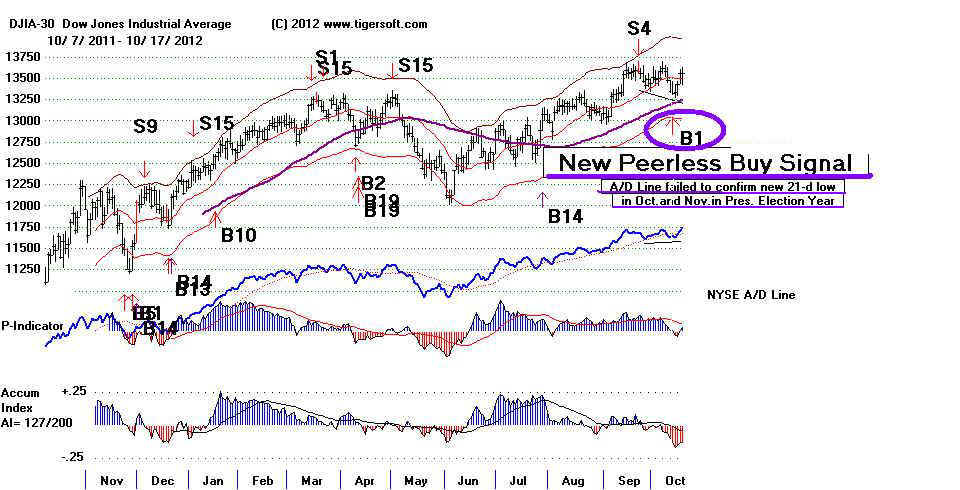
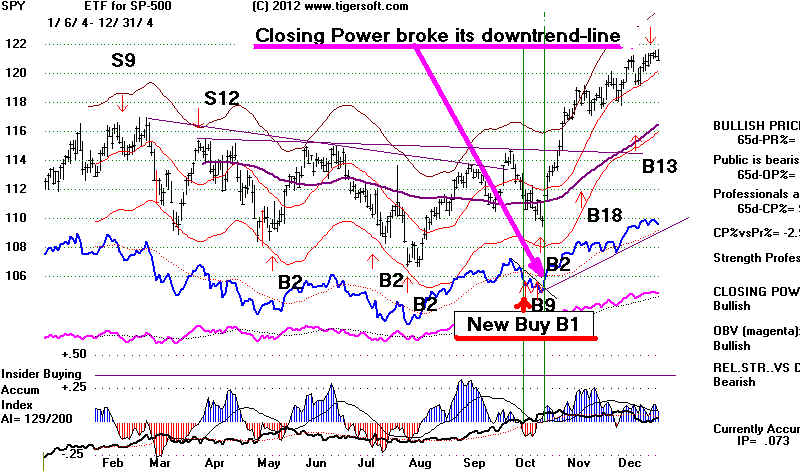
10/11/2012 13326.39
la/ma 21dma ROC P-I P-ch P^^ IP21 V-I OP
.986 -.006 32 2 32 -.119 -65 -.086
Paper loss = open
-------------------------------------------------------------
10/11/2012 13326.39
  la/ma      21dma ROC     P-I   P-ch    P^^    IP21     V-I    OP
 .986      -.006      32   2     32  -.119    -65  -.086
 Paper loss = open
-------------------------------------------------------------
Number = 11 Avg = 19.1%
===================================================================
   New Buy B1s The Year after a Presidential Election Year
1929...1933...2009
===================================================================
10/11/1977  832.3  -4.7%     Sell S10 1/7/1978
10/17/1997 7847.03 +17.0% Sell S15 4/21/1998
10/28/1997 7498.32 +22.5% Sell S15 4/21/1998
10/21/2005 10215.22 +13.3% Sell S9 5/5/2006
Number = 4 Avg = 12.0%
===================================================================
   New Buy B1s in The Second Year after a Presidential Election Year
1930...1934...2010
===================================================================
11/6/1950   222.5   +23.6%   Sell S4  9/7/1951 275.1
 la/ma      21dma ROC     P-I   P-ch    P^^    IP21     V-I    OP
 .986      -.006      32   2    32  -.119    -65  -.086
 No Paper loss
-------------------------------------------------------------
10/4/1962   582.4   +20.4%   Sell S10  7/1/1963
 la/ma      21dma ROC     P-I   P-ch    P^^     IP21     V-I    OP
 .982      .335     -114   35  -317  -.082   -595  -.017
   6% Paper loss ...DJI declined to 558.00 before rallying.
-------------------------------------------------------------
11/30/1966  791.59  +12.1%   Sell S12  4/25/1967
 la/ma      21dma ROC     P-I   P-ch    P^^     IP21     V-I    OP
 .981     -.241      16   -15   41    .078    3  -.082
  0.8% Paper loss ...DJI declined to 875.69 before rallying.
-------------------------------------------------------------
 10/7/1994   3979.43 +3.3%    Sell S9   10/17/1994
 la/ma      21dma ROC     P-I   P-ch    P^^       IP21     V-I    OP
 .984      .342     -323  -9    -511   -.043   -50  -.188
  No Paper loss
-------------------------------------------------------------
10/1/2002 7938.79 +10.5% Sell S12 1/6/2003
11/30/2010 11006.02 +16.4% Sell S9 5/2/2011
Number = 6 Avg = 14.4%
===================================================================
  New Buy B1s in The Third Year after a Presidential Election Year
1930...1934...2010
===================================================================
11/4/1943 136.3 +8.5% Sell S2 6/21/1944
10/29/1951 260.4 +5.3% Sell S1 1/28/1952
10/14/1971 878.36 +9.2% Sell S1 4/6/1972
10/22/1971 852.37 +12.6% Sell S1 4/6/1972
10/11/1979 844.62 -3.5% Sell S10 10/19/1979
10/4/1991  2961.76   +11.6%    Sell S15  4/14/1992
            96 point paper loss. 3+%
11/15/1991 2943.20 +12.3% Sell S15 4/14/1992
10/19/2007  13522.02 +0.7%    Sell S12  12/6/2007
            DJI fell to 12743 before rallying. Paper Loss = 6%
Number = 8 Avg = 7.1%
|