SELL S3 Peerless Software - December 13, 2013
Sell at
The Upper Band in February, March
April and May as long as Momentum and Breadth
Are Not above Moderately High Limits
There were no losses in any of the 11 Sell S3s. The
average DJI decline was 8.5%
at the time of the next Buy signal.
None took place in the Presidential Election year.
Size of Subsequent Declines
>10%
3
5%-9.99%
2
2%-4.99%
4
0%-1.99%
2
rallies
0 (number of losses if shorted.)
Sell S3s: 1928-2031
19350219      S3             105.9         .055
19390309      S3             151.3         .18
19470210      S3             183.6         .035
19510503      S3             263.1         .078
19670427      S3             894.82        .027
19690506 S3 962.06 .185
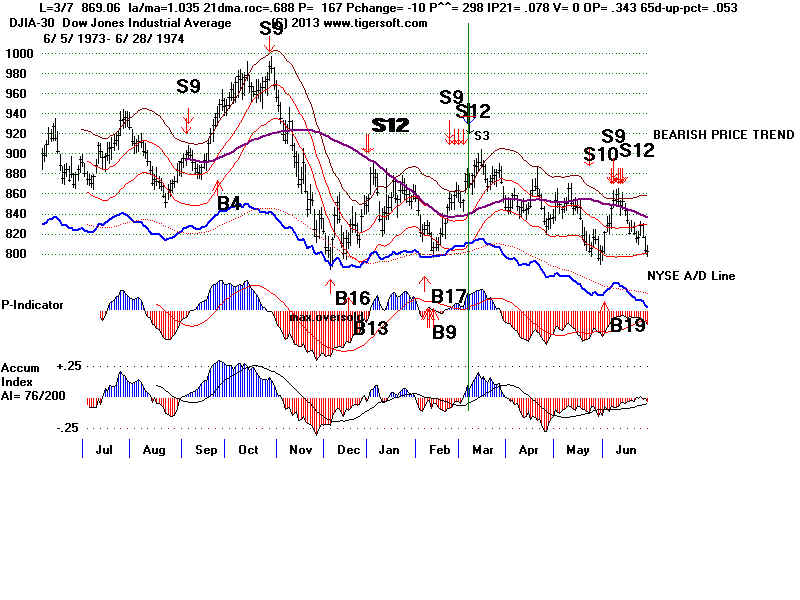
19740307 S3 869.06 .284
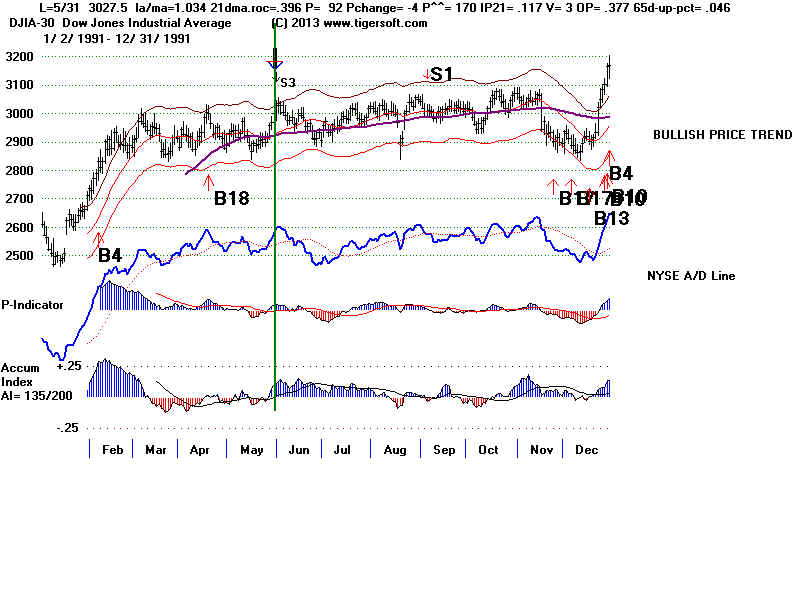
19910531 S3 3027.5 .038
20090511 S3 8418.77 .011
-------------------------------------------------
no. = 9 Avg. = Needs correction
PE      0   ----
PE +1   3   .071
PE +2   1   .284
PE +3   7   .063
January   0   ----
February  2   .045
March     2   .232
April     2   .028
May       5   .066
June      0   ----
July      0   ----
August    0   ----
September 0   ====
October   0   ----
November  0   ----
December  0   ----
1-10      4  .182
11-20     4  .023
21-31     3  .031
----------------------------------------------------------------------------------
Included in Peerless Software after April 5, 2013
(C) 2013 William Schmidt, Ph.D.
www.tigersoft.com
The 10 S3s since 1929 produce an average 4.9% DJI decline at the
next signal Except for
the April 1929, case they were all profitable and the biggest
paper loss was only 2.6%.
In a trading range, covering on a re-test of support is suggested
from the 1929 experience.
I like these signals because they validate the importance of the
upper 3.5% band over many
years. They also show seasonality. Aprils tend not to
produce market tops. So, not
allowing S3s until the end of the month seems appropriate.
The standards for Sell S3s have been refined as follows.
Sell S3s can only occur in February,
March and from April 26th to May 31st. The 65 day percent
change must not be below 2.2%.
We want a rally that can be reversed. The DJI must be
between 3.1% and 3.65% above the
21-day ma. The annualized rate of change of the
21-day ma must not be above 74% (.74).
The DJI must not be up more than 2% from the previous day. The
OPct is not allowed to be above +.58.
You can see below the an "X"
the cases this eliminates.
More effort could be done here. We have not yet tested
these standards on June, July,
August or September. I doubt that they would work well in
the last quarter when the market
is very often turning up from its typical May to October decline
or hesitation.
Date
Gain Paper
LA/MA
AnnRoc P-I
P-I
Adj.P-I
IP21 V-I
Opct
65 Day
Loss
Change
Pct
Change
------------------------------------------------------------------------
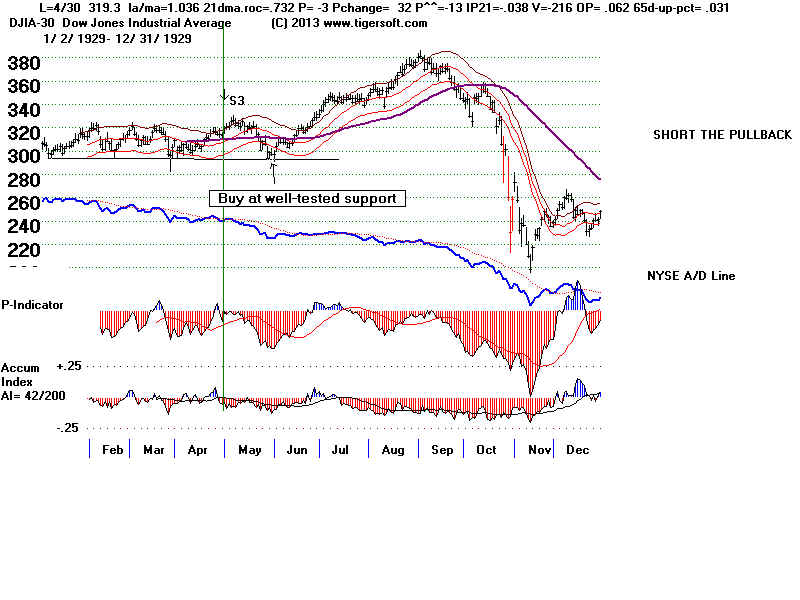
4/30/1929 -6.6% -6.6% 1.036 .732 -3 32 -13
-.038 -216 .062 .031
Late April is acceptable for a Sell S3.
The DJI did initially fall 3.5%. But there were not Buy signals.
One might have decided to cover this at support or a new closing low in May, which is a
month that bottoms are 4x more likely to be made than not.
May as Bottom and May as a Month for A Decline to Continue
Recoveries from
May bottoms (24)
1929, 1930, 1931, 1934, 1936, 1937, 1940, 1941
1944, 1947, 1951, 1952, 1955, 1956, 1960, 1966,
1967, 1970, 1972, 1974, 1976, 1977, 1981, 1983,
Failures To Rally in May (9)
1932, 1953, 1962, 1965, 1971, 1973, 1979, 1982, 2984,
In a flat trading range, prices often quickly bounce back and forth from resistance to
support and then resistance. Ignoring this would have
been costly. In that event, the trading range breakout should have been cause for
cutting short sale losses.
------------------------------------------------------------------------
(1)
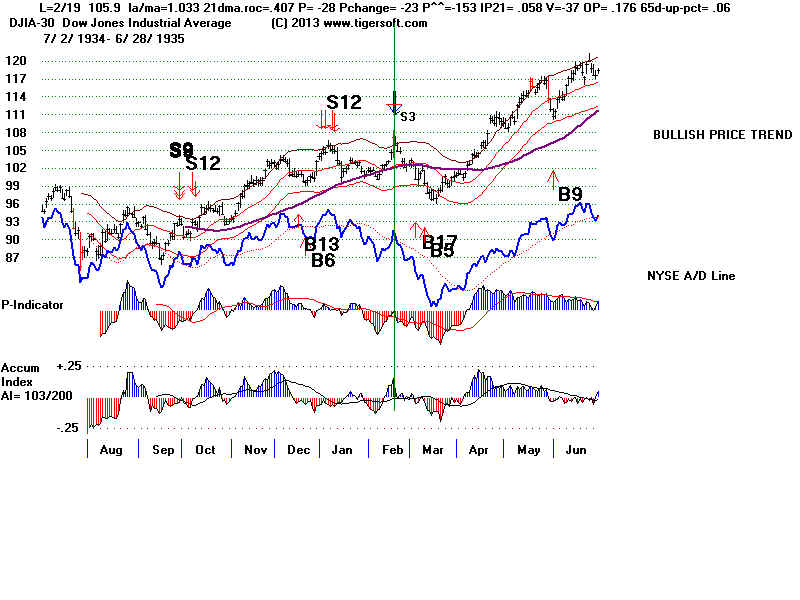
2/19/1935 +5.5% 0 1.033 .407 -28 -23
-153 .058
-37-.052 .06
------------------------------------------------------------------------
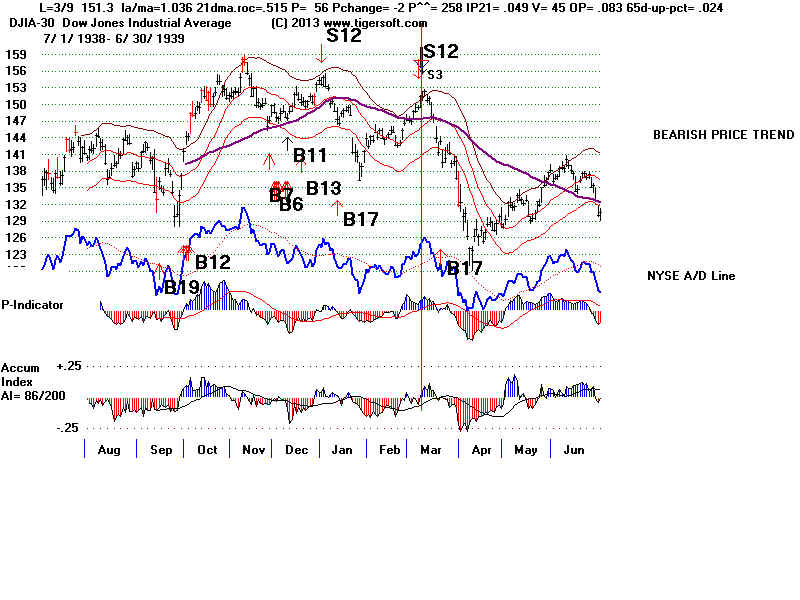
(2)
3/9/1939 Also an earlier S12
+5.2% 0 1.036
.515 56 -2 258
.049 45 .083 .024
------------------------------------------------------------------------
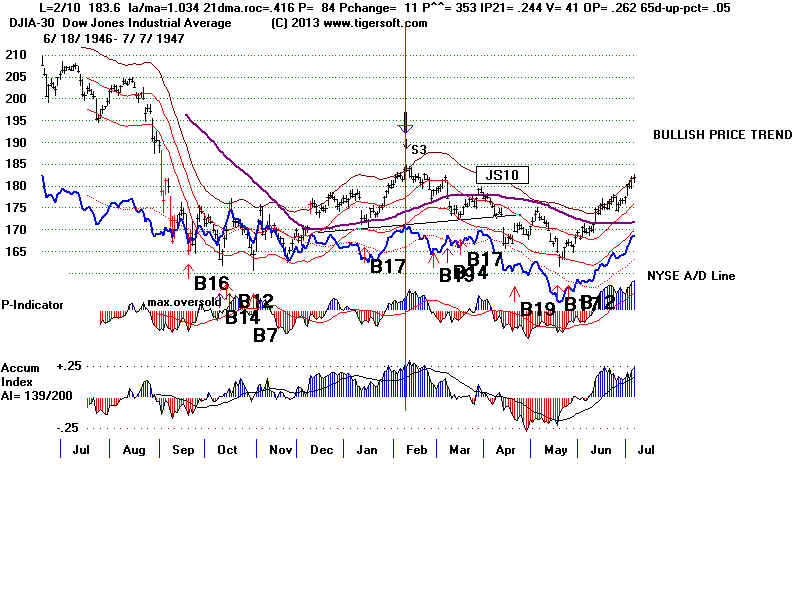
(3)
2/10/1947 +2.6% 0 1.034 .416 84 11
353 .244 41 .262 .05
------------------------------------------------------------------------
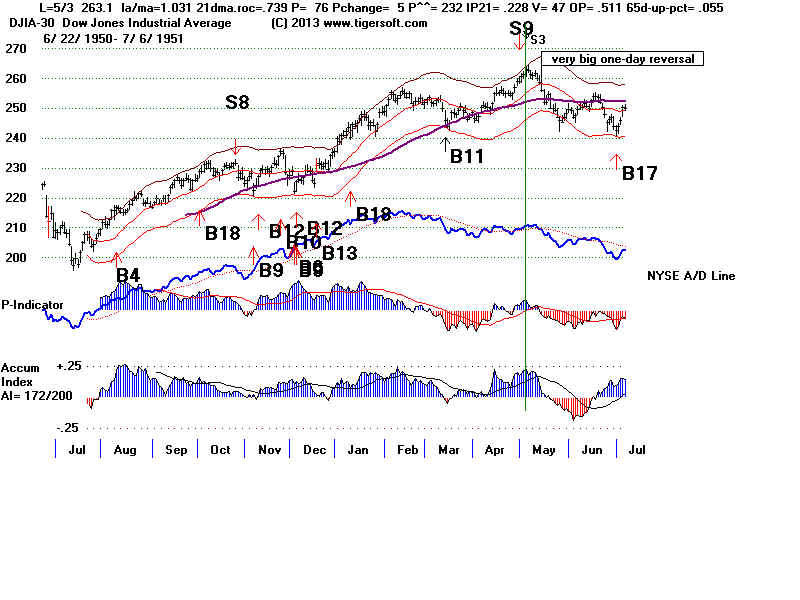
(4)
5/3/1951 +7.8% 0 1.031 .739 76
5 232 .228 47 .512 .055
------------------------------------------------------------------------
(5)
4/8/1963 X 1.035
.588 91 6 245 .092
97 .420 .062
Early April S3s are screened out. This rally did not peak until early June.
------------------------------------------------------------------------|
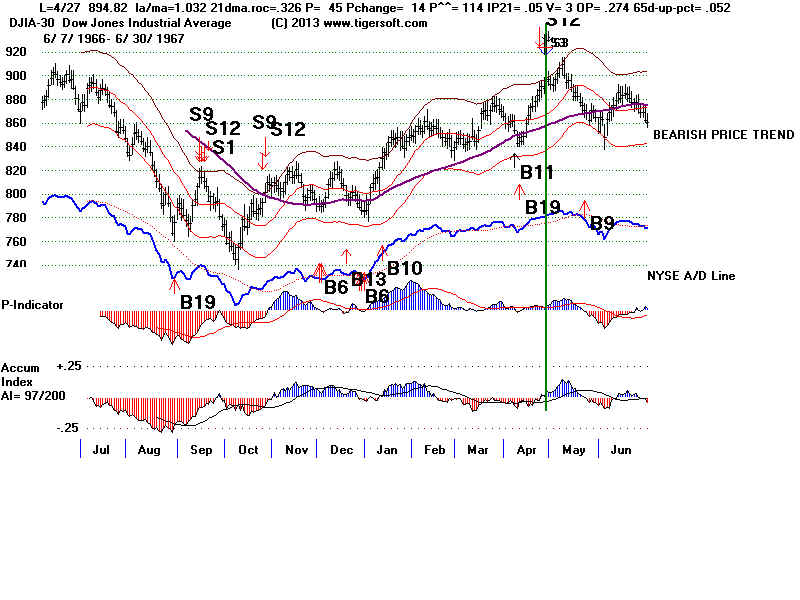
(6)
4/27/1967 +2.7% 1.6% 1.032 .326 45 14 114
.05 3 .273 .052
Late April is acceptable for a Sell S3.
------------------------------------------------------------------------
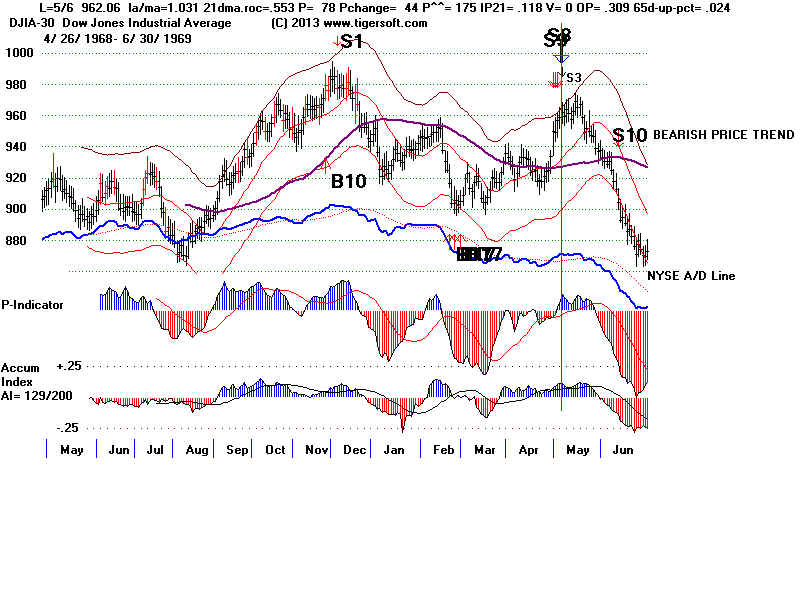
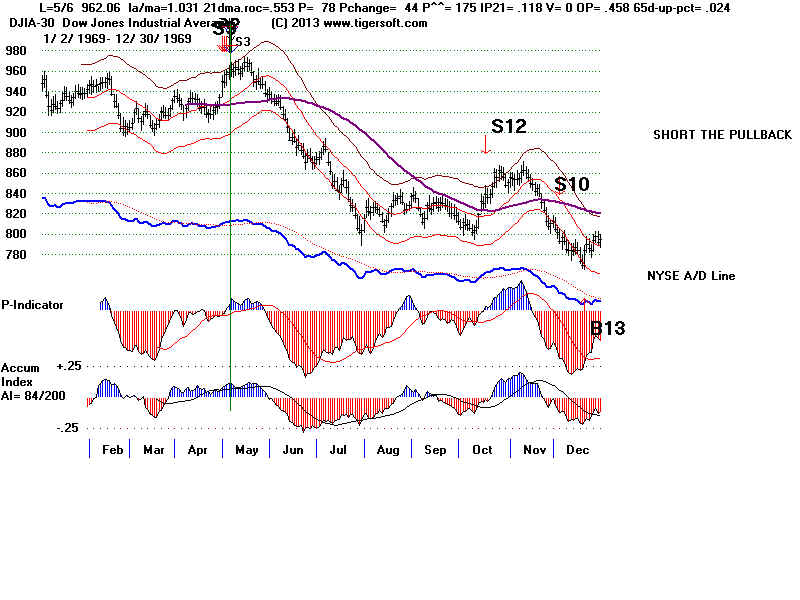
(7)
5/6/1969 +18.5% 0.7% 1.031 .553 78 44 175 .118
0 .309 .024
------------------------------------------------------------------------
(8)
3/7/1974 +5.5% 2.6% 1.035 .688 167 -10
298 .078 0 .343 .053
------------------------------------------------------------------------
5/11/1990 X Simulutaneous B14 - Too big a jump on
day of signal.
1.034 .316 -16 46 -31 .085
3 .31 .058
Jumps by more than 2.2% are not allowed.
------------------------------------------------------------------------
(9)
5/31/1991 +4.1% 0 1.034 .396 92 -4 170 .117 3 .38
.046
--------------------------------------------------------------------------
4/16/1992 X
1.032 .410 -66
-11 -128 .072 -11 .336 .032
Early April S3s are screened out. This rally did not peak until early June.
------------------------------------------------------------------------
(10)
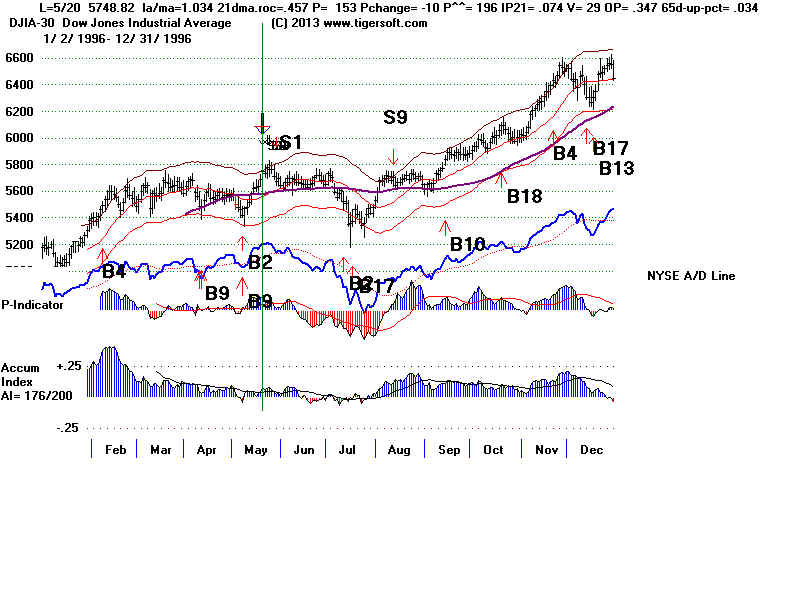
5/20/1996 +4.0% 0.5% 1.034 .457 153 -10
196 .074 29 .349 .034
------------------------------------------------------------------------
4/20/2007 X
1.032 .489
239 -16 216
.171 95 .683 .043
too high
Mid April S3s are screened out. This rally did not peak until
July.
---------------------------------------------------------------------------
4/26/2007 X
1.035 .668
321 48 289 .182 47 .592 .03
too high
----------------------------------------------------------------------------
5/11/2009 X
1.032 .49 501 -176 467 .032 107 .058 .041
too high too
high
--------------------------------------------------------------------------
3/23/2010 X
Premature 1.031 .571 590 67 573 .166
90 .436 .041
The high P-I cancels this as a Sell S3
too high
-----------------------------------------------------------------------------------
Avg Gain = +4.9%
|
|
|
|
|
|
|
|
|
|
====================================================================================
OLDER 2011 SELL S3 BELOW IS DISCONTINUED
====================================================================================
Negative Non-Confirmation of DJI Advance
by P-Indicator and V-Indicator with A Seemingly
High Accumulation Index.
Created 12/11/2010
Very Positive DJIA Accumulation Versus Bearishly Negative
P-Indicator and V-Indicator Readings.
Today's
Peerless internals show a very respectable +.13 reading from the Accumulation Index,
but negative Peerless P-I
(-14) and V-I (-8) numbers. The OPct is also negative, -.141. How bearish
is this? To test it, I
created tonight a new Peerless Sell signal based on the DJI being 1.4%
(CL/MA=1.014) over the 21-day
ma with a P-Indicator below -5, the V-I being 0 or less and the
OPct not being over +.35.
The results in the 81 year period from 1929 to 2010 are impressive,
I think. We should
consider putting a new Sell S3 into new Peerless software. Below are tits trading
results for the 14 cases that
resemble most the market now. More thought has to be given how
this affects the results of
the entire Peerless system, given the existing Buys and Sells.
With internal strength
readings like those now, the DJI fell to the lower band in 7 cases. Three
of these were in December.
In 4 cases (1930, 1933, 1935 and 1973), the DJI fell below the lower
band. If we accept this evidence to be sufficient to incorporate
the Sell S3 into our Peerless
arsenal, we would expect a
decline to the lower band in the next 6 weeks.
|
PEERLESS SELL S3 TRADING RESULTS:
1929-2010 |
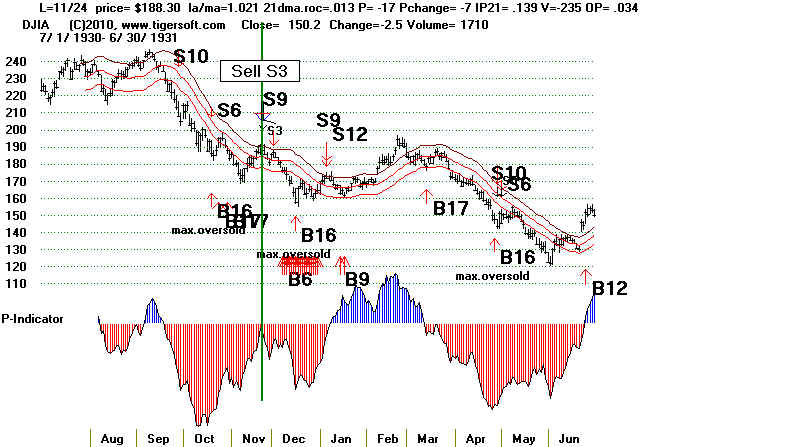
#1
11/24/1930 DJI fell below lower band in 3 weeks.
+6.5% (regular Peerless mode)
CL/MA ROC P-I IP21 V-I Opct
1.021 .013 -17 +.139 -235 .13
8/7/1996 DJI fell half way to lower band and then rose sharply after
breakout into all-time high territory.
-2.1%
There was a breakout past well-tested resistance into all-time
high territory. At all-time, be prepared to quickly reverse the Sell S3.
CL/MA ROC P-I IP21 V-I Opct
1.041 .297 -31 +.134 -30 .281
|
Supplemental Materials
Bearish P-Indicator versus Bullish Accumulation Index.
The worsening breadth since early
November has only seen a limited decline in
Tiger's Current Accumulation Index
(IP21). It is a seeminlgy bullish +.113 despite the
P-Indicator being -97. The
recent IP21 drop is probably enough to give a Sell S9 if the DJI should
tag the upper 3.5% band or close more
than 2.5% above the 21-day ma. But even without a
major Sell, we should probably expect
only a retreat from the 11400 resistance to the 11100 support.
This would almost certainly cause
declines in the "Bearish" MINCP stocks. The "Bullish" MAXCP
stocks would need to consolidate their
recent very good gains.
Positive Current AI (IP21) and Much Weaker P-Indicator
I have studied many cases where there is
no Sell S9, but the P-Indicator is significantly
weaker than the Accumulation Index, as is
true now. In 10 if 12 cases, they brought declines
to at least the lower band, though
Decembers are a somewhat special case, because of the
seasonal bullihness. Here are the
cases that I could find.
12/8/2010 P and V-I are now lagging A/I badly
CL/MA ROC P-I
IP21 V-I
Opct
1.014 -.306 -97 +.113 -56 - .138
1. June 7, 1943 141.80 DJI
dropped to Lower Band.
CL/MA ROC
P-I IP21
V-I Opct
1.016 .248 -11 +.012 -113 .054
2. June 12, 1950 228.40 DJI dropped below Lower
Band.
CL/MA ROC P-I
IP21 V-I
Opct
1.027 .52 + 33 + .176
-50 .414
3. August 1, 1952 279.80 DJI dropped to
Lower Band.
CL/MA ROC P-I
IP21
V-I
Opct
1.013 .211 +23 + .086
-41 .409
4. July 26, 1955 468.40
DJI dropped to Lower Band.
CL/MA ROC P-I
IP21
V-I
Opct
1.02
.507 +10
+.057 -159
.385
5. Aptil 21, 1959 629.20
DJI dropped only half way to Lower Band from MA.
CL/MA ROC P-I
IP21
V-I
Opct
1.031 .367 -16 +.03
-251
.257
6.
November 8, 1962
DJI
rallied.
CL/MA ROC P-I
IP21
V-I
Opct
1.038 .445 -21 +.03 -340
.051
7.
April 20, 1971
DJI dropped below first tagging of Lower Band.
CL/MA ROC P-I
IP21
V-I
Opct
1.03 .41
+15 +
.057 0
.499
8
October 11, 1983
DJI dropped to Lower
Band.
CL/MA ROC P-I
IP21 V-I
Opct
1.015 .345
+ 39
+ .127 2
.12
9
uly 1, 1986
DJI dropped below Lower Band.
CL/MA ROC P-I
IP21 V-I
Opct
1.018
.265 +
3 +.109
2
.173
10 August 16, 2002
DJI dropped below Lower Band.
CL/MA ROC P-I
IP21
V-I
Opct
1.042 .522
+ 2
+ .134
-180
-.067
11 October 21, 2002
DJI dropped below Lower Band.
CL/MA ROC P-I
IP21
V-I
Opct
1.09
.842 -141
+ .064
-157 .058
 --------------------------------------------------------------------
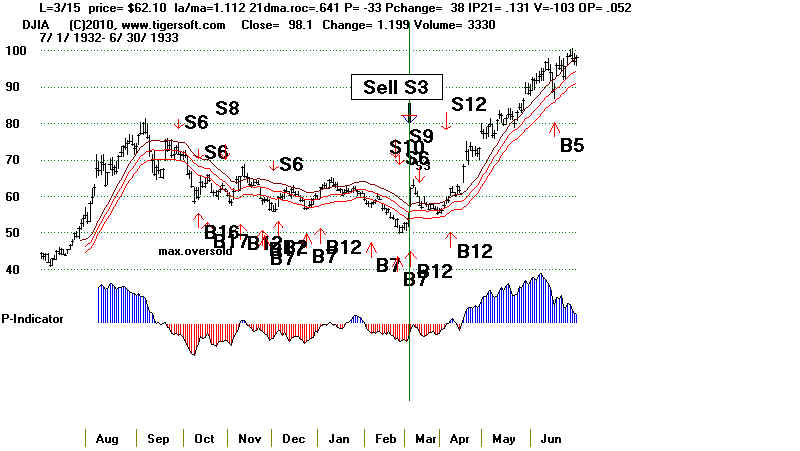
#2
3/15/1933 DJI fell to lower band and then took off.
-7.2% (regular Peerless mode)
CL/MA ROC P-I IP21 V-I Opct
1.112 .641 -33 +.131 -103 .145
--------------------------------------------------------------------
#2
3/15/1933 DJI fell to lower band and then took off.
-7.2% (regular Peerless mode)
CL/MA ROC P-I IP21 V-I Opct
1.112 .641 -33 +.131 -103 .145
 --------------------------------------------------------------------
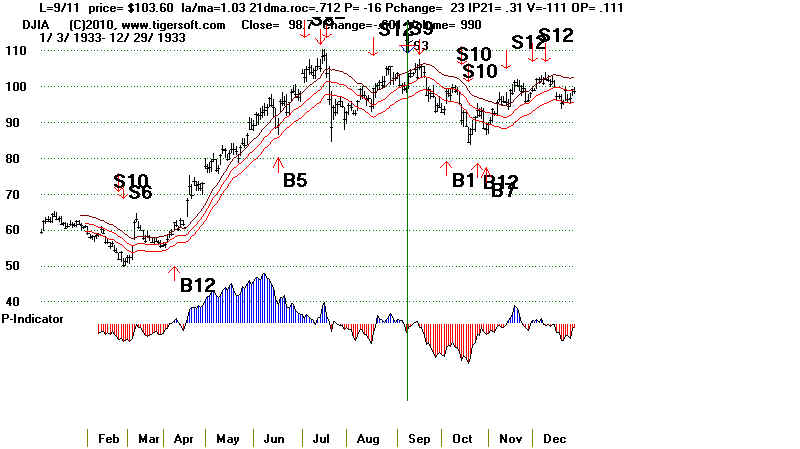
#3
9/11/1933 DJI fell below lower band in 3 weeks.
+4.8%
CL/MA ROC P-I IP21 V-I Opct
1.03 .712 -16 +.31 -111 .15
--------------------------------------------------------------------
#3
9/11/1933 DJI fell below lower band in 3 weeks.
+4.8%
CL/MA ROC P-I IP21 V-I Opct
1.03 .712 -16 +.31 -111 .15
 --------------------------------------------------------------------
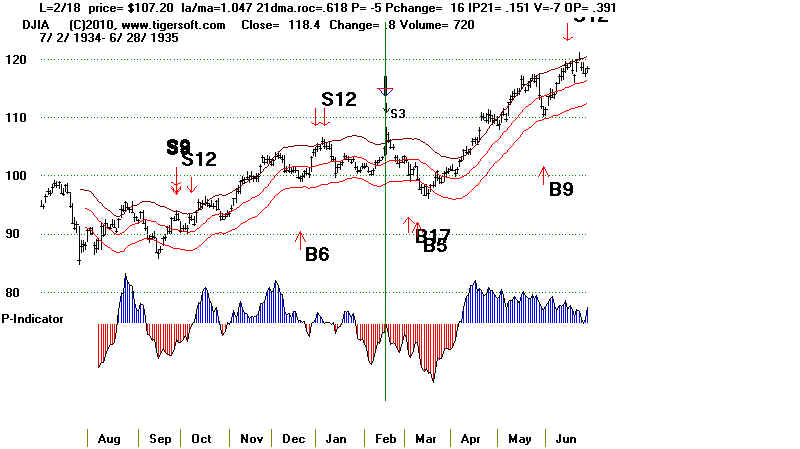
#4
2/18/1935 DJI fell below lower band
+6.6%
CL/MA ROC P-I IP21 V-I Opct
1.047 .618 -6 +.151 -7 .32
-----
--------------------------------------------------------------------
#4
2/18/1935 DJI fell below lower band
+6.6%
CL/MA ROC P-I IP21 V-I Opct
1.047 .618 -6 +.151 -7 .32
-----
 --------------------------------------------------------------------
X Exclude this
9/6/1939 DJI rose to 155 from 148 and then fell to lower band.
It was up 8% on the day before S3, This should disqualify it.
CL/MA ROC P-I IP21 V-I Opct
1.076 .625 -111 +.135 -92 .062
--------------------------------------------------------------------
#5
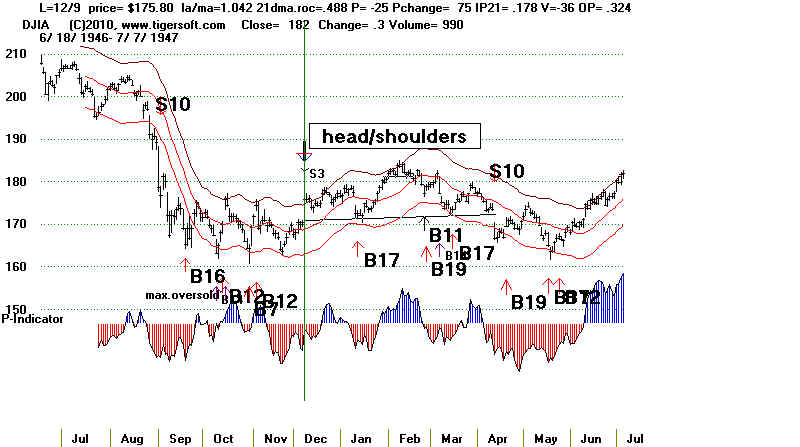
12/9/1946 175.80. DJI reached 177.50 and tagged tagged 3% lower band
and a month later. The DJI jumped 2.5% on day of Sell S3 here.
+1.8%
CL/MA ROC P-I IP21 V-I Opct
1.042 .488 -25 +.178 -36 .279
--------------------------------------------------------------------
X Exclude this
9/6/1939 DJI rose to 155 from 148 and then fell to lower band.
It was up 8% on the day before S3, This should disqualify it.
CL/MA ROC P-I IP21 V-I Opct
1.076 .625 -111 +.135 -92 .062
--------------------------------------------------------------------
#5
12/9/1946 175.80. DJI reached 177.50 and tagged tagged 3% lower band
and a month later. The DJI jumped 2.5% on day of Sell S3 here.
+1.8%
CL/MA ROC P-I IP21 V-I Opct
1.042 .488 -25 +.178 -36 .279
 --------------------------------------------------------------------
X Exclude this
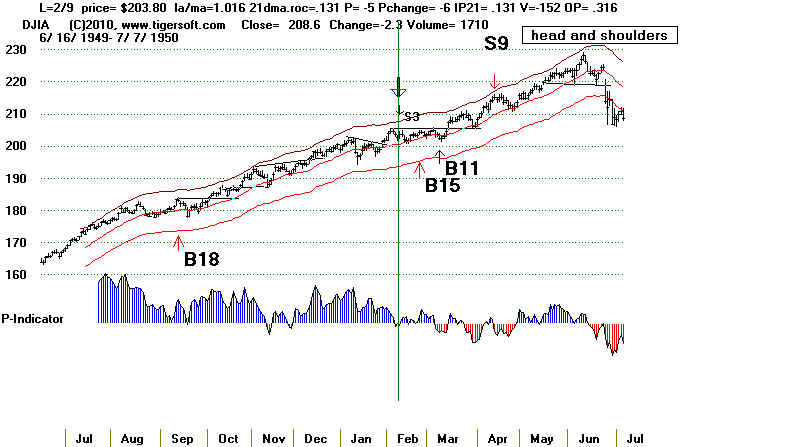
2/9/1950 203.80 LOSS DJI hesitated for a month and then broke out
and ran up.
-0.2%
CL/MA ROC P-I IP21 V-I Opct
1.016 .131 -5 +.131 - 152 .317
====
--------------------------------------------------------------------
X Exclude this
2/9/1950 203.80 LOSS DJI hesitated for a month and then broke out
and ran up.
-0.2%
CL/MA ROC P-I IP21 V-I Opct
1.016 .131 -5 +.131 - 152 .317
====
 --------------------------------------------------------------------
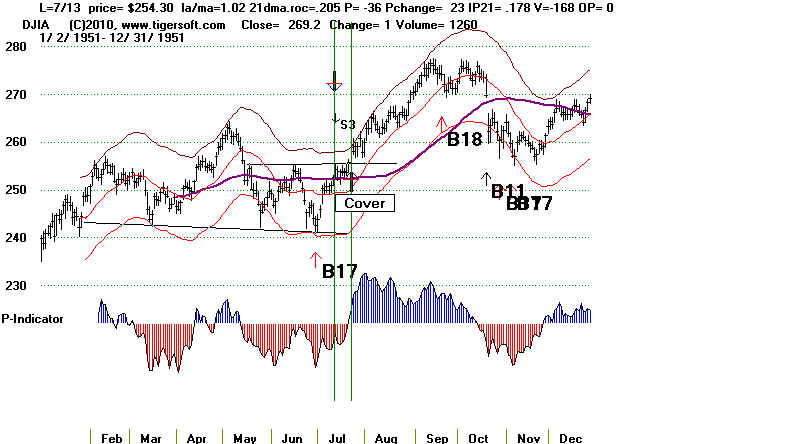
#6
7/13/1951 DJI rallied from 254.30 to 275.
On 7/24/1951 (258.90), the DJI surpassed it right shoulder apex
for a trading Buy. This would have meant a 1.5% LOSS.
CL/MA ROC P-I IP21 V-I Opct
1.02 .205 -36 + .178 -168 0
--------------------------------------------------------------------
#6
7/13/1951 DJI rallied from 254.30 to 275.
On 7/24/1951 (258.90), the DJI surpassed it right shoulder apex
for a trading Buy. This would have meant a 1.5% LOSS.
CL/MA ROC P-I IP21 V-I Opct
1.02 .205 -36 + .178 -168 0
 --------------------------------------------------------------------
X Exclude this
5/3/1954 BAD DJI rallied up from 319.40 to 400 over next 7 months.
CL/MA ROC P-I IP21 V-I Opct
1.025 .502 -3 +.134 -129 .422
==== ====
--------------------------------------------------------------------
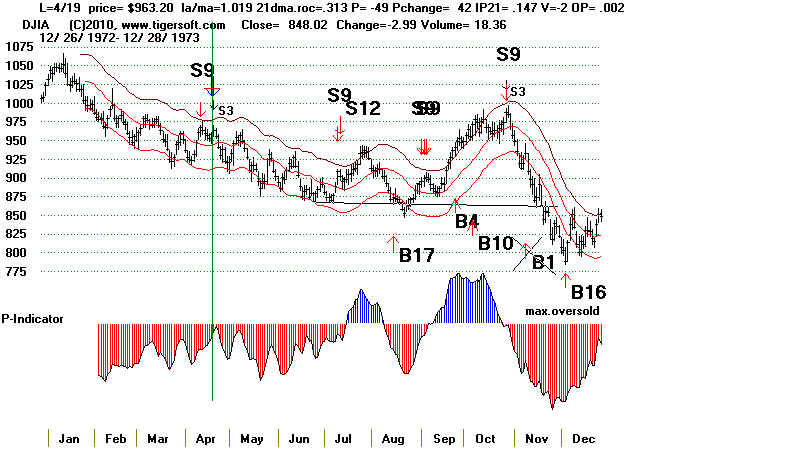
#7
4/19/1973 DJI quickly fell to lower band.
+9.2%
CL/MA ROC P-I IP21 V-I Opct
1.019 .313 -49 +.147 -2 .003
--------------------------------------------------------------------
X Exclude this
5/3/1954 BAD DJI rallied up from 319.40 to 400 over next 7 months.
CL/MA ROC P-I IP21 V-I Opct
1.025 .502 -3 +.134 -129 .422
==== ====
--------------------------------------------------------------------
#7
4/19/1973 DJI quickly fell to lower band.
+9.2%
CL/MA ROC P-I IP21 V-I Opct
1.019 .313 -49 +.147 -2 .003
 --------------------------------------------------------------------
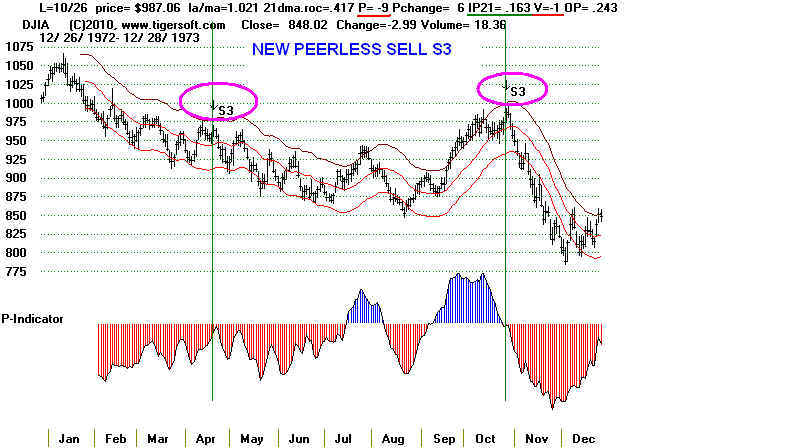
#8
10/26/1973 DJI fell below lower band
CL/MA ROC P-I IP21 V-I Opct
1.021 .417 -9 +.163 -1 .243
--------------------------------------------------------------------
#8
10/26/1973 DJI fell below lower band
CL/MA ROC P-I IP21 V-I Opct
1.021 .417 -9 +.163 -1 .243
 --------------------------------------------------------------------
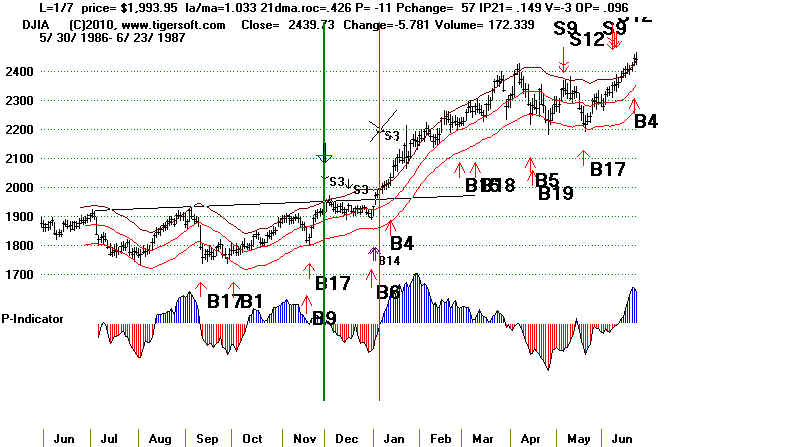
#9
12/1/1986 DJI reached upper band then fell slightly below lower band
then took off. Still a gain of +0.9%
+0.9%
CL/MA ROC P-I IP21 V-I Opct
1.015 .216 -19 +.213 -3 .043
The second S3 in December 1987 is considered a continuation of
the 12/1/1986.
--------------------------------------------------------------------
X
1/7/1987 DJI zoomed upwards afterwards. Loss of 2.1%
This immediately followed flat topped breakout into all-time
high territory. This should be noted and void the Buy signal.
CL/MA ROC P-I IP21 V-I Opct
1.033 .426 -11 +.149 -3 .096
--------------------------------------------------------------------
#9
12/1/1986 DJI reached upper band then fell slightly below lower band
then took off. Still a gain of +0.9%
+0.9%
CL/MA ROC P-I IP21 V-I Opct
1.015 .216 -19 +.213 -3 .043
The second S3 in December 1987 is considered a continuation of
the 12/1/1986.
--------------------------------------------------------------------
X
1/7/1987 DJI zoomed upwards afterwards. Loss of 2.1%
This immediately followed flat topped breakout into all-time
high territory. This should be noted and void the Buy signal.
CL/MA ROC P-I IP21 V-I Opct
1.033 .426 -11 +.149 -3 .096
 --------------------------------------------------------------------
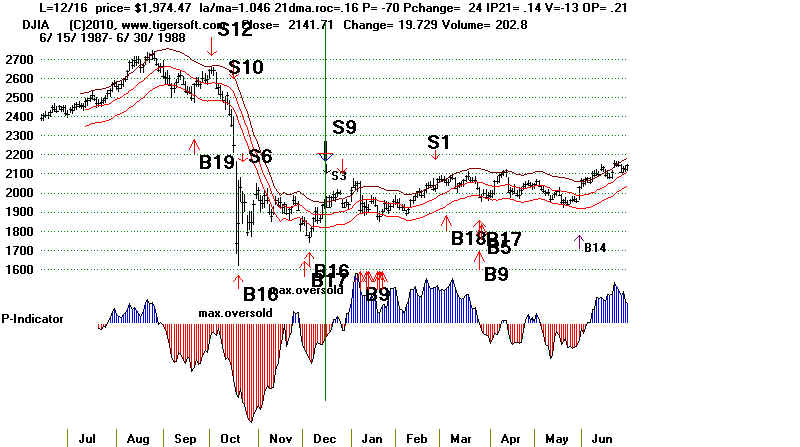
#10
12/16/1987 DJI rose from 1974 to 2050 and then fell to LB,1900,
a month later.
+3.2%
CL/MA ROC P-I IP21 V-I Opct
1.046 .16 -70 +.14 -13 .21
--------------------------------------------------------------------
#10
12/16/1987 DJI rose from 1974 to 2050 and then fell to LB,1900,
a month later.
+3.2%
CL/MA ROC P-I IP21 V-I Opct
1.046 .16 -70 +.14 -13 .21
 --------------------------------------------------------------------
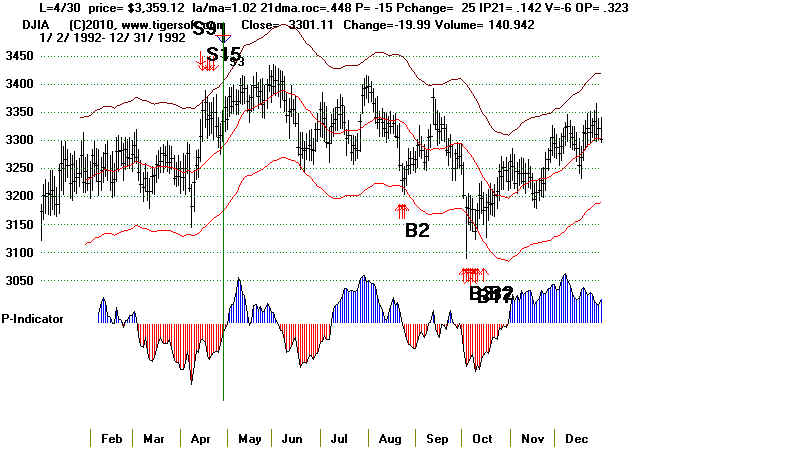
#11
4/30/1992 DJI rose 1% and then fell to lower band 6 weeks later.
+3.1%
CL/MA ROC P-I IP21 V-I Opct
1.02 .448 -15 + .142 -6 .323
--------------------------------------------------------------------
#11
4/30/1992 DJI rose 1% and then fell to lower band 6 weeks later.
+3.1%
CL/MA ROC P-I IP21 V-I Opct
1.02 .448 -15 + .142 -6 .323
 --------------------------------------------------------------------
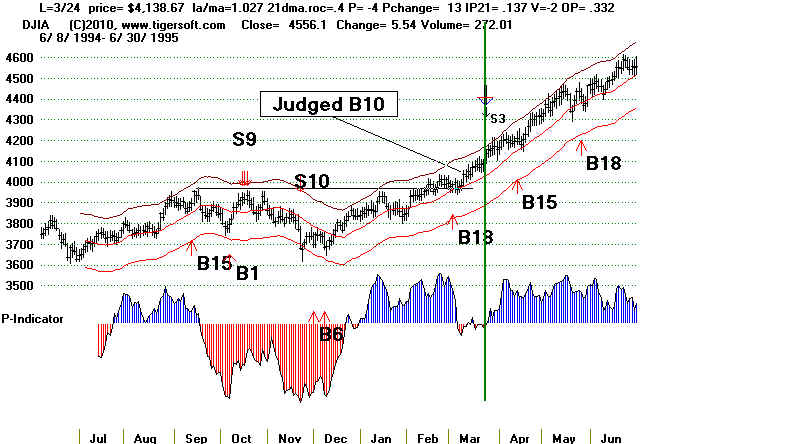
X Exclude this
3/24/1995 DJI kept rising. This is just after a Buy B10 into all-time
high territory. -1.7%
CL/MA ROC P-I IP21 V-I Opct
1.027 .40 -4 +.137 -2 .333
====
--------------------------------------------------------------------
X Exclude this
3/24/1995 DJI kept rising. This is just after a Buy B10 into all-time
high territory. -1.7%
CL/MA ROC P-I IP21 V-I Opct
1.027 .40 -4 +.137 -2 .333
====
 --------------------------------------------------------------------
#12
3/18/1996 DJI fell to lower band.
+3.5%
There was a breakout past well-tested resistance into all-time
high territory. At all-time, be prepared to quickly reverse the Sell S3.
CL/MA ROC P-I IP21 V-I Opct
1.021 .283 -25 +.139 -19 .048
See chart below.
--------------------------------------------------------------------
#13
--------------------------------------------------------------------
#12
3/18/1996 DJI fell to lower band.
+3.5%
There was a breakout past well-tested resistance into all-time
high territory. At all-time, be prepared to quickly reverse the Sell S3.
CL/MA ROC P-I IP21 V-I Opct
1.021 .283 -25 +.139 -19 .048
See chart below.
--------------------------------------------------------------------
#13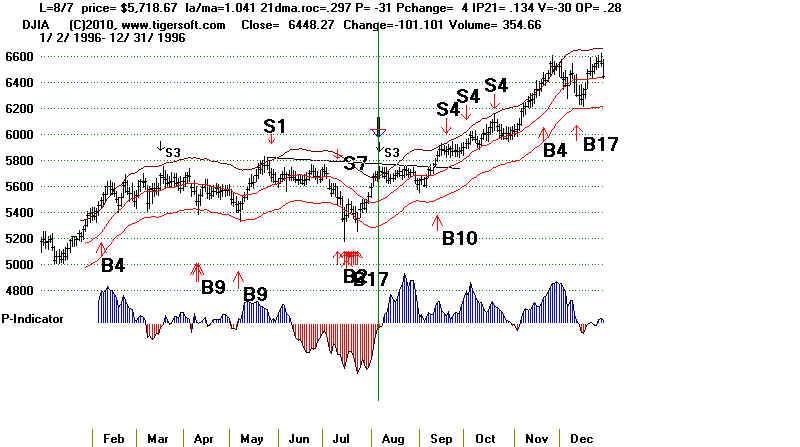 ---------------------------------------------------------------------------
#14
12/9/2010 OPEN
CL/MA ROC P-I IP21 V-I Opct
1.014 .025 -14 +.13 -8 -.134
---------------------------------------------------------------------------
#14
12/9/2010 OPEN
CL/MA ROC P-I IP21 V-I Opct
1.014 .025 -14 +.13 -8 -.134