DJI new high clearly unconfirmed by P-Indicator
at upper band from May to July in any year.
19300402 S5 285.3 .398
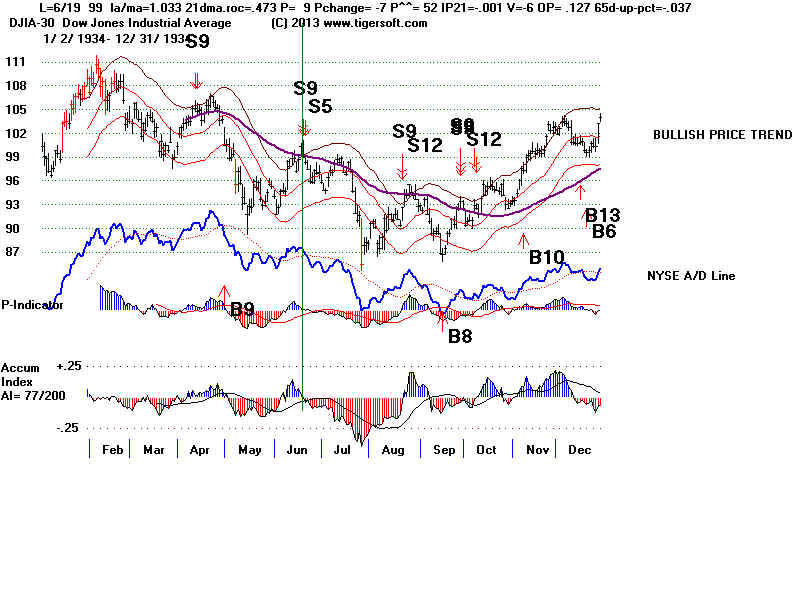
19340619 S5 99 .124
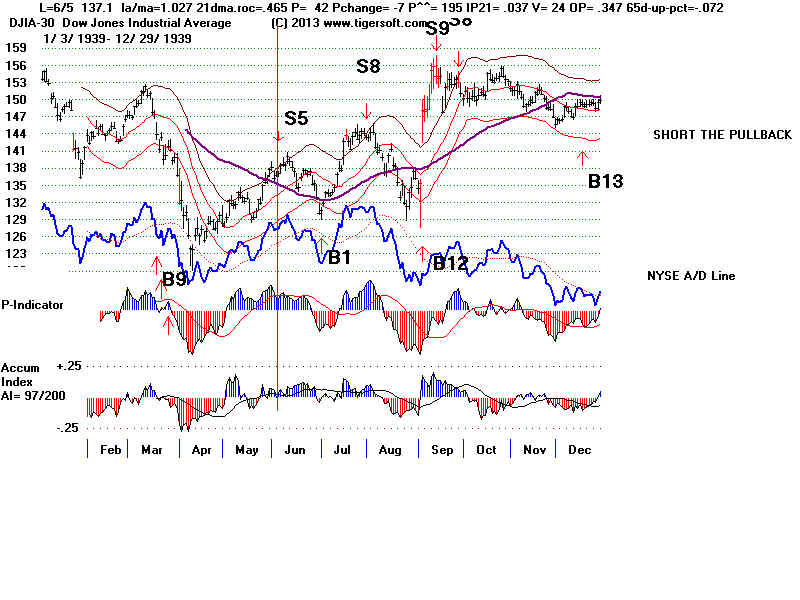
19390605 S5 137.1 .031
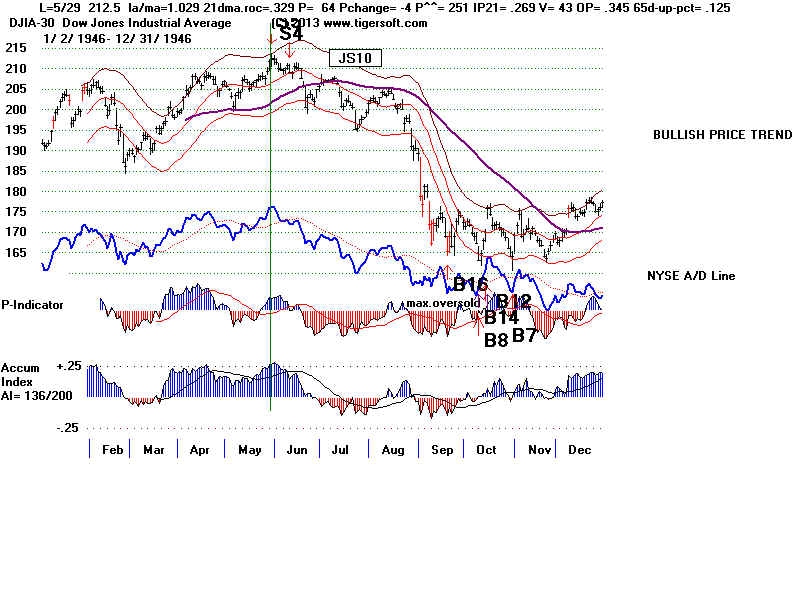
19460529 S5 212.5 .232
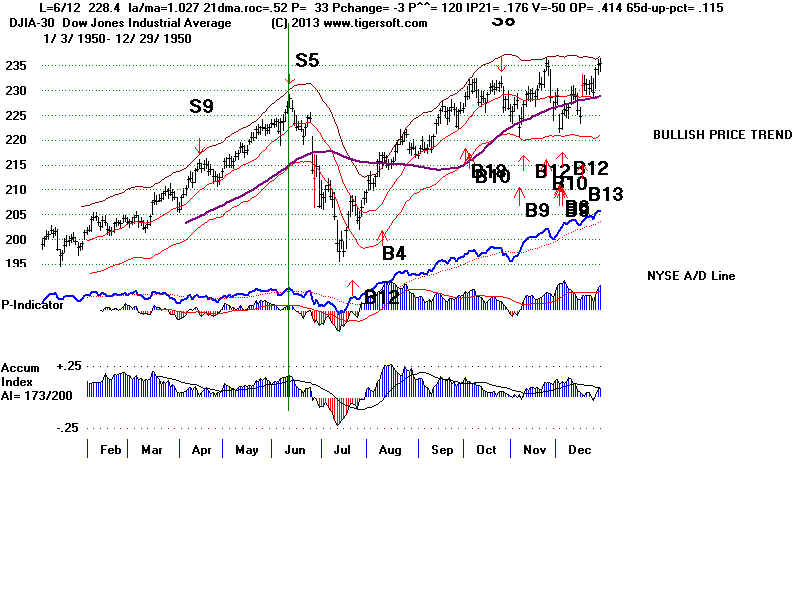
19500612 S5 228.4 .091
19560404 S5 518.7 .079
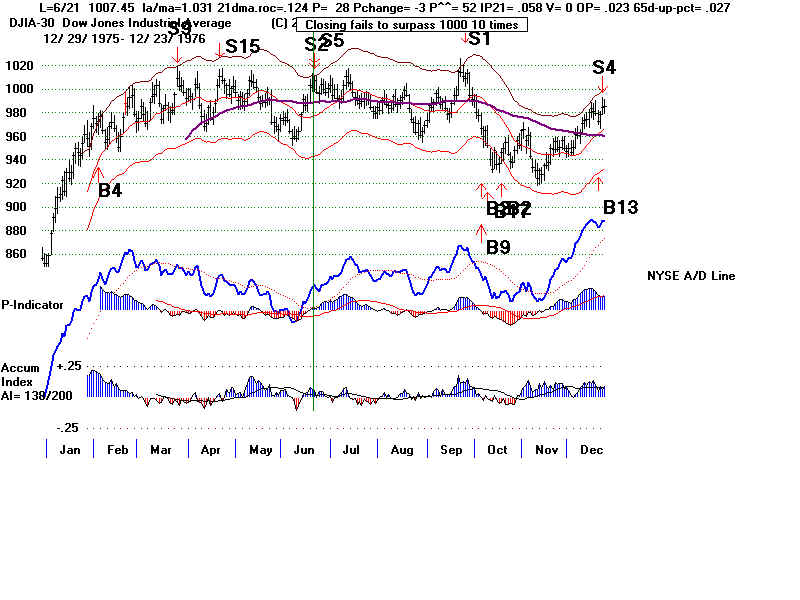
19760621 S5 1007.45 .047
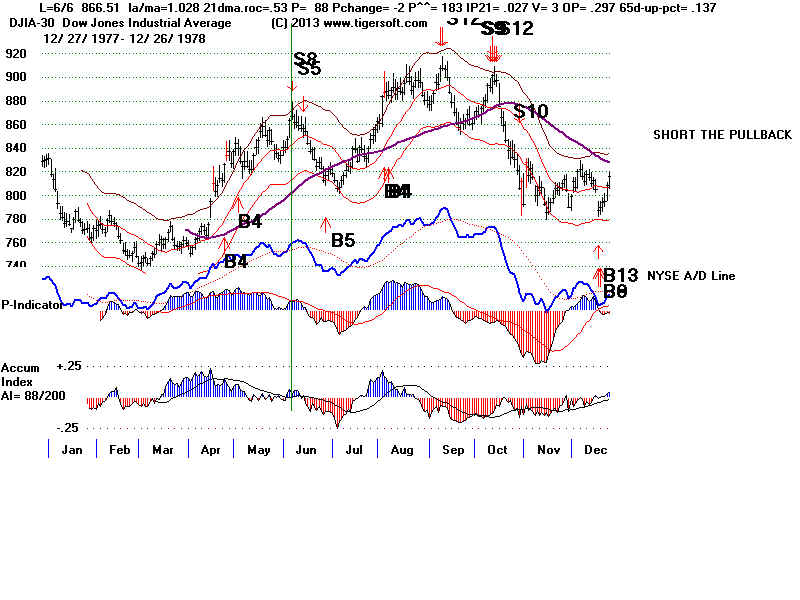
19780606 S5 866.51 .05
19840501 S5 1182.89 .081
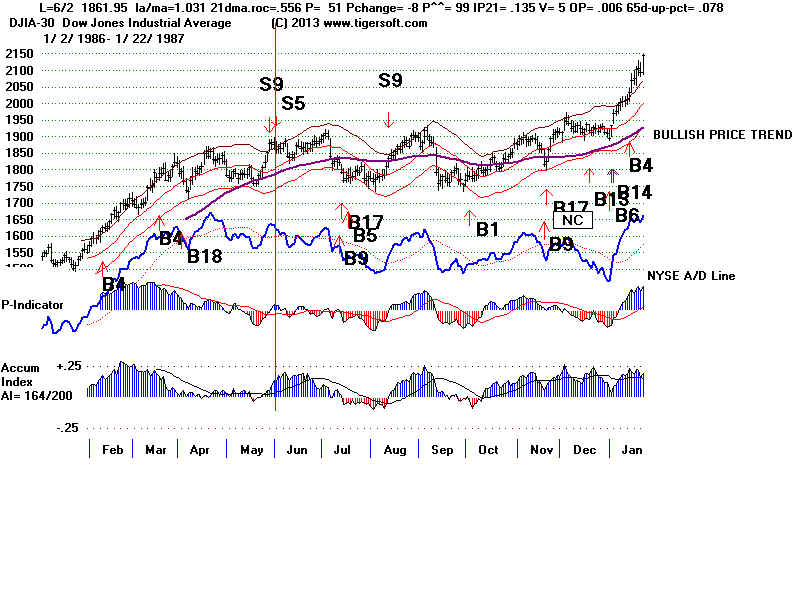
19860602 S5 1861.95 .022
19880408 S5 2090.19 .028
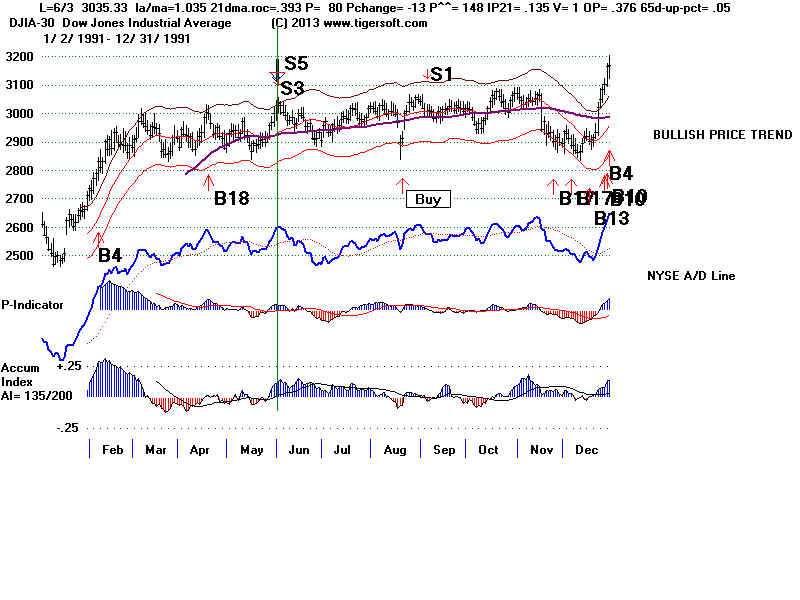
19910603 S5 3035.33 .04
19920421 S5 3348.61 .028
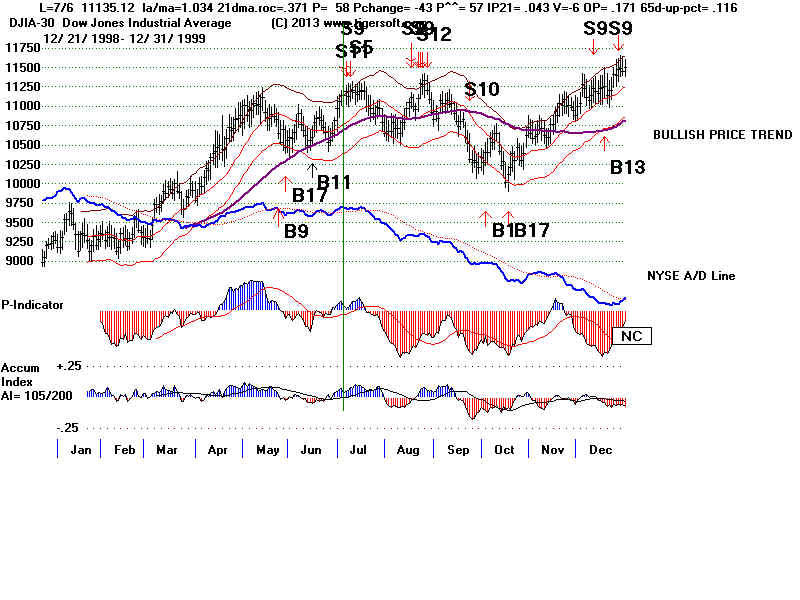
19990706 S5 11135.12 .091
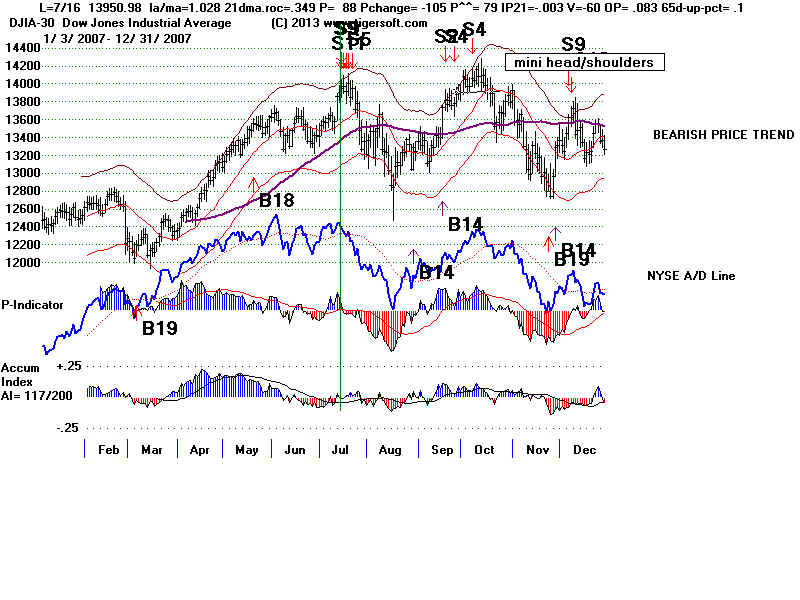
20070716 S5 13950.98 .047
20110503 S5 12807.51 .051
20130715 S5 15484.26 .038
-------------------------------------------------
no. = 17 Avg. = .087
3 6 8 0 0 PE 5 .053 PE +1 1 .038 PE +2 6 .153 PE +3 5 .052 January 0 - February 0 - March 0 - April 4 .133 May 3 .051 June 7 .036 July 7 .058 August 0 ---- September 0 ---- October 0 ---- November 0 ---- December 0 ---- 1-10 10 .087 11-20 4 .075 21-31 3 .102 |
=====================================================
DJI new high clearly unconfirmed by P-Indicator
at upper band from May to July in any year.
4/7/2013 (C) 2013 William Schmidt, Ph.D. www.tigersoft.com
Sell S5's occur on new highs near the
upper band that are seriously unconfirmed
by the P-Indicator. Look at the charts for these signals below. You will see
that the
P-Indicator was less than half the levels of their 45 day highs. Note also that
they can only occur from May to July 20th. This rule is caused by the fact that
there
were two potential Sells S5s after the 21st of July which failed badly.
As refined here, they have been profitable, reliable and without large paper losses.
The biggest paper loss was only 2.5%. 7 of the 12 had no paper losses. A number
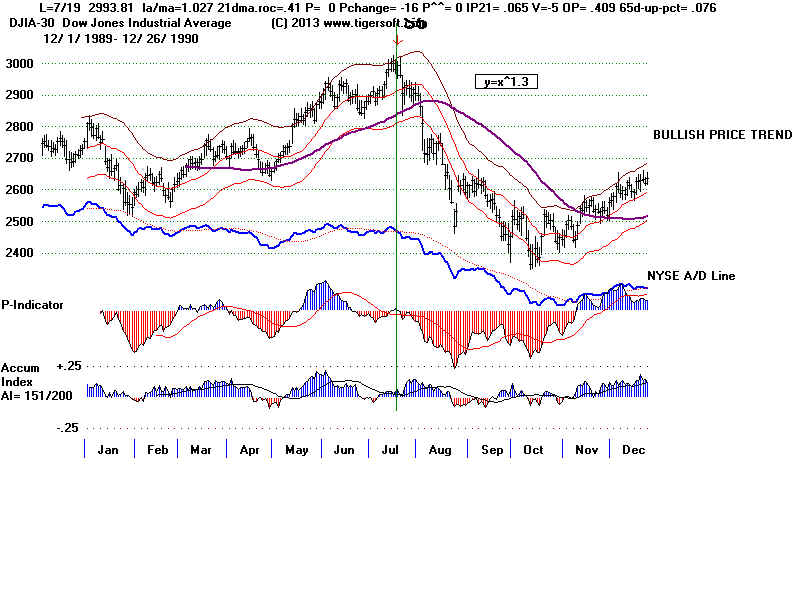
of them occurred at important tops, May 1946, June 1950, July 1990, July 2007,
and May 2011.
In all cases, the P-Indicator declined from its readings the day before on the day of the
signal.
The annualized momentum of the 21-day ma must not be over +.57. The highest
V-I
Indicator since 1965, when this indicator could first be calculated, was only +5.
I would not trust a Sell S5 with a V-Indicator above, say, +40 now.
The highest time-adjusted P-I among the Sell S5s was +251. If a Sell S5 should
occur
with the adjusted P-I above +260, I would discard the signal. While the IP21, OPct
and
65-day Pct Change indicators have a wide range when all years are considered, the
program
puts limits on them in the third year after the Presidential Election because of the
possibility
that the market may be extraordinarily strong into mid-Summer, at least, as in 1935,
1943, 1955, 1959, 1963, 1971, 1975, 1983, 1987, 1995, 2003 and 2011. July
Sell S5s in a Presidential Election year should not be allowed because of this
possibility unless the V -Indicator was negative, which was true in July 1999
and July 2007. 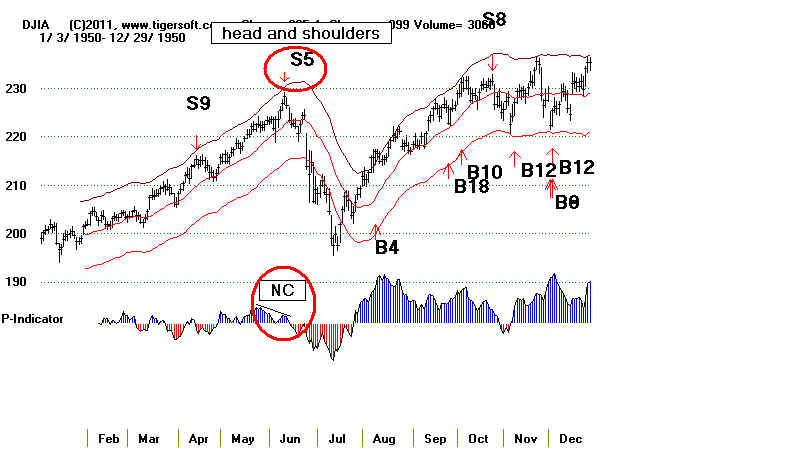
Sell S5s: 1929-2013
(1)
6 /19/1934 Also an S9.
12.4% none
1.033 .473
9 -7 52
-.001
-6
.128 -.037
--------------------------------------------------------------------------------------------------------------------------------------------------------------------------------------
6 /5/1939 3rd Year of Presidential cycle.
3.8% 2.2%
1.027 .465
42 -7 195
.037
24
.347 -.072
There should be a new Buy B? at
lower band at end of June. This is often a reversal time upwards.
------------------------------------------------------------------------------------------------------------------------------------------------------------------------------------
(2)
5/29/1946 An S4 occurred two weeks later. Remarkably, right at top!
23.2% none
1.029 .329
64 -4
251
.269
43
.345
.125
highest highest highest
--------------------------------------------------------------------------------------------------------------------------
(3)
6/12/1950 228.4 5.0% gain. 1% paper loss. Not a reversing signal
Remarkably, right at top!
9.1%
none 1.027
.52
33 -3
120
.176
-50
.43?
.115
--------------------------------------------------------------------------------------------------------------------------
(4)
6/21/1976 1007.45 Also an S2. DJI declined to lower band.
4.0% 0.7% 1.031
.124
28 -3 52
.058
0
.023
.027
--------------------------------------------------------------------------------------------------------------------------
(5)
6/6/1978 866.51
An S8 followed a week later. DJI declined to lower band. Remarkably, right at top!
5.7%
none
1.028 .53
88 -2 183
.027
3
.297
.137
--------------------------------------------------------------------------------------------------------------------------
(6)
6/2/1986 1861.95 An S9 occurred a few days
earlier. DJI fell below lower band to support.
2.2%
2.5%
1.031 .556
51 -8
99 .135
5
.006
.078
highest
highest
--------------------------------------------------------------------------------------------------------------------------
(7)
7/19/90 2993.81 Also an S9.
DJI declined below lower band. Remarkably, right at top!
18.1%
none 1.027
.41
0 -16 0
.065
-5
.406 .076
--------------------------------------------------------------------------------------------------------------------------
(8)
6/3/91 3035.33
3rd Year of Presidential
cycle.
4.4%
none 1.035
.393
80 -13
148 .135
1
.376
.05
As for reversing this signal,
compare this with the 7/22/1975 case where buying at lower band
was premature. Buying late in
August would be consistent with expecting a rally going into Labor Day.
--------------------------------------------------------------------------------------------------------------------------------------------------------------------------------------------
(9)
7/6/99 11135.12 An S9
and a S11 also occurred here. 3rd
Year of Presidential cycle.
7.1% 0.6%
1.034 .371
58 -43 57
.043
-6
.171 .116
negative
--------------------------------------------------------------------------------------------------------------------------------------------------------------------------------------------
(10)
7/16/07 13950.98
3rd Year of
Presidential cycle.
Remarkably, right at top!
4.7% 0.4%
1.028
.349 88
-105 79
- .003 -60 .086
.10
negative
--------------------------------------------------------------------------------------------------------------------------------------------------------------------------------------------
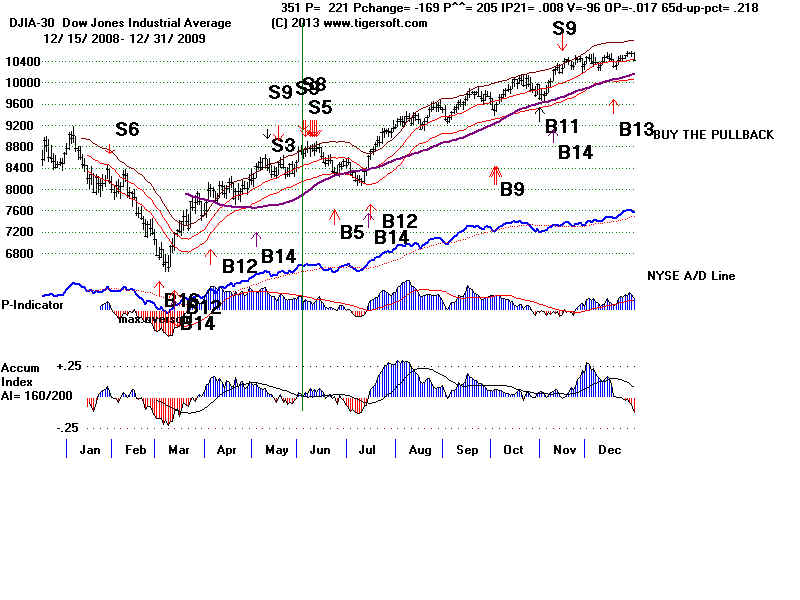
(11)
6/3/2009
There were also S9 and an S5 and S8.
4.1%
1.1%
1.027
.351 221 -169 205
.008 -96
-.018
.218
--------------------------------------------------------------------------------------------------------------------------------------------------------------------------------------------
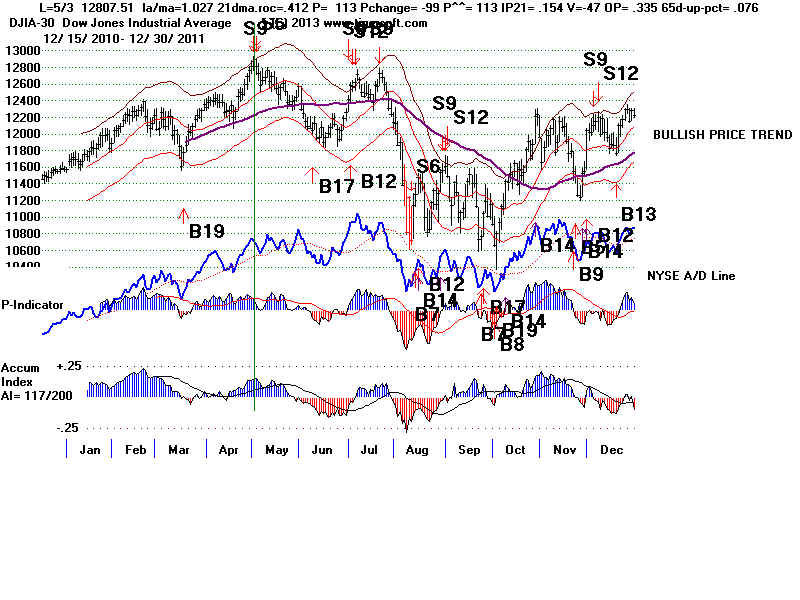
(12) 23807.51 Also Sell S9.
3rd Year of
Presidential cycle.
Remarkably, right at top!
5/3/2011
4.4% gain. 1% paper loss. This was a reversing signal. DJI declined below lower band.
5.9%
none
1.027
.412 113 -99 113 .154
-47
.336
.076
--------------------------------------------------------------------------------------------------------------------------------------------------------------------------------------------
N=12
AVG.
Below are some near Sell S5s. These were
eliminated, each for the
combination
of reasons given:
X 1 6/17/1935 year before election
P = 34 or P**|= 194 (too
high)
65 day pct up was .184 (too
high)
X 2 7/24/1935 year before election
P= 34 or P**= 193 (too high)
65-day up pcr was up .115 (too high)
X 3 6/29/1954 (a bad time to sell, right before July 4th!)
P= 37 or P^^= 125
65-day up pct = .112 (high)
X 4 6/7/1955 year before election
P = 40 or P^^= 116
65-day upp pct = .034
la/ma = 1.028 not close enough to upper band in bullish year before Presidential
election and
the DJI up over 65 days. If it were down over 65 days, the dangerous bullishness
would not be
there and the DJI could be a little further below the upper band, as in the case in 1938.
X 5 7/22/1958 (late July is a problem
-- too close to Labor Day rally. )
P= 63
or P**= 63
65-day up pct = .092
 |
 |
 |
 |
 |
 |
 |
 |
 |
 |
 |
 |
 |
Sample Peerless Program Code.
Earlier 2011 Code for Normal Mode Code:Sell S5
For i = 66 To rn ' starts at day 66 and goes to end of year's data file.
If (yr(i) + 1) / 4 = Int((yr(i) + 1) / 4) Then 19992 ' Eliminates year after Presidential Election.
If mo(i) < 5 Then 19992 Eliminates all but May, June and July
If mo(i) > 7 Then 19992
If opma(i) > .46 Then 19992 ' Eliminates those cases where there is a buying stampede.
If (la(i) / ma(i)) < 1.0265 Or (la(i) / ma(i)) > 1.035 Then 19992 ' Eliminates those cases not just below upper band.
If p(i) < 0 Then 19992 'Peerless S9s will pick this up
If p(i) > 93 Then 19992 'P-Indicator cannot be too positive.
If p(i) > p(i - 1) Then 19992 'If P-Indicator is rising from previus say, eliminate the case.
If aroc(i) > .6 Then 19992 ' 'If Annualized Rate of Change of 21-dma is too strong, eliminate the case.
'Find highest level of P-Indicator in last 45 days.
maxp = -999999
For j = i - 45 To i - 1
If p(j) > maxp Then maxp = p(j)
Next j
If p(i) > .5 * maxp Then 19992 'Current P-Indicator value must be below 1/2 of its 45 day high.
s9(i) = 5: ms(i) = 5: : pi = i: : psells5arrows (pi): i = i + 5 ' Runs routine to place Sell S5 arrows on screen
' Skips 5 days ahead.
19992 Next i: