There are two different Sell S7s. One is for Extreme Bear Markets like those
seen between 1929 and 1932. We could also apply them profitably in the deep bear
markets of 1937-1938 and 2008-2009. The second type of Sell S7s, which is
presented further below, occurs in more normal market environments. This
is the Sell S7 we would normally expect to encounter. It is easy to distinguish
from the first because it occurs on apparent strength.
The Two Different Sell S7s
#1 The DJI closes back below the 42-dma with negative internal readings
from the IP21 and the OPct is below -.10.
#2 The P-I and the current Accumulation index (IP21 widely fail to confirm a DJI
new high between April and September.
Extreme Bear Market Sell S7s: 1930-1932
S7 = DJI falls below 42-dma with IP21<10 and OPct<-.10
19300428 S7 276.9 .38
19300818 S7 227.8 .246
19300918 S7 234.2 .266
19310327 S7 177.3 .44
19320122 S7 78.8 .003
----------------------------------------------------------------
No. = 5 Avg. - .267
Deep Bear Market Sell S7s: 1937-1938
S7 = DJI falls below 42-dma with IP21<10 and OPct<-.10
(Using these Sell S7s and Normal Mode Buy signals)
19371209 S7 128.2 .026
19380316 S7 122.9 .195
19380419 S7 116.3 .053
19380524 S7 112.4 .016
-----------------------------------------------------------------------
No. = 4 .073
Deep Bear Market Sell S7s: 2008-2009
S7 = DJI falls below 42-dma with IP21<10 and OPct<-.10
(Using these Sell S7s and Normal Mode Buy signals)
20090112 S7 8764.05 .222
Sell S7s on False Strength:
The DJI's New High Is Widely Unconfirmed
by P-Indicator at Certain Times between
April and September.
More Exactly:
The DJI makes a 70 day new high.
The DJI must close above the 1.65% upper band and below the 3.0% upper band.
The P-Indicator is less than 20% of its 70 day high.
The Annualized 21-dma ROC must be below +.60.
The OPct must be below +.40.
The DJI must be up at least 3.7% over the last 65 trading days.
There have been 21 "normal" Sell S7s. The average DJI decline at the time
of the next Peerless Buy is .097
Trading results if one had shorted the DJI on these normal Sell S7s.
>10% 4
5%-9.99% 9
2%-4.99% 7
0%-1.99% 0
Losses 1
Sell S7s on False
Strength: 1928-201319290813 S7 354 .408
19370810 S7 186.9 .368
19450528 S7 168.2 .023
19550901 S7 469.6 .024
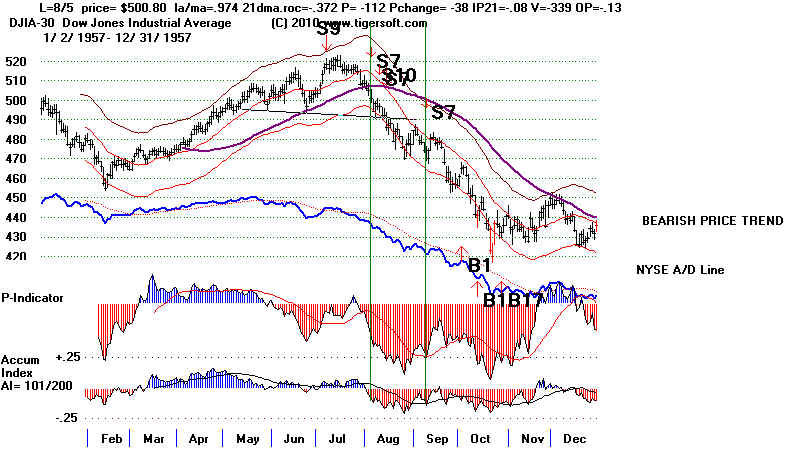
19570705 S7 516.9 .164
19570712 S7 520.8 .17
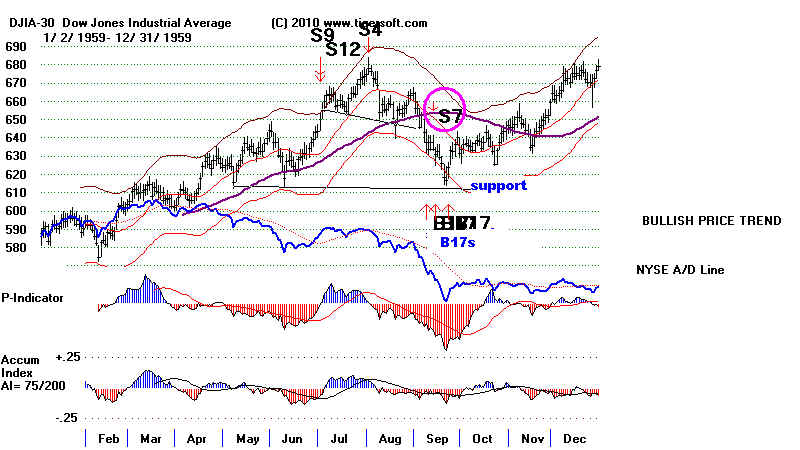
19590529 S7 643.8 .041
19650513 S7 938.9 .075
19670914 S7 929.44 .075
19680711 S7 922.82 .043
19720418 S7 968.92 .035
19720525 S7 969.07 .054
19760421 S7 1011.02 .05
19790920 S7 893.69 .095
19790921 S7 893.94 .096
19810424 S7 1020.35 .046
19930519 S7 3500.03 -.011
20000808 S7 10976.89 .067
20000811 S7 11027.8 .072
20060505 S7 11577.74 .049
20120501 S7 13279.32 .089
-------------------------------------------------
no. = 21 Avg. = .097
PE        7    .059
PE +1     8    .155
PE +2     1    .049
PE +3     5    .066
January 0 --- February 0 --- March 0 --- April 3 .044 May 7 .046 June 0 - July 3 .126 August 4 .229 September 9 .137 October 0 --- November 0 --- December 0 ---- 1-10 5 .078 11-20 3 .112 21-31 7 .058 |
Peerless S7 - last edited mid-2013.
DJI new highs above the 1.7% band with a widely
unconfirming P-Indicator,
reliably provide profitable points to sell at certain times in the the
4 year Presidential cycle. The results are improved even more
by eliminating cases of the basic Sell S7 that have extreme Peerless
key values. Below are the basic Sell S7s. They are arranged by the
Presidential Election year seasonality. An X marks those whose
parameters were unusually high or low and probably should therefore
be eliminated as being too unusual.
Presidential Election Year: From 4/18 to
8/11 (7/7 were good)
(1)
4/18/1972
+3.5% no paper loss Also Sell S9 and S15
968.92
1.019 .327 -20 4 -43 .054 -1
.149 .064
---------------------------------------------------------------------------------------------------------
(2)
4/21/1976 +4.4% -0.4% paper loss Also S15
1011.02 1.019
.345 -1 15 -2 .038 -1
.069 .067
--------------------------------------------------------------------------------------------------------
(3)
5/4/1992 +4.0% 1.0% paper loss
Earlier S9 and S15
3378.13
1.022 .52 48 51 94 .132
1 .33 .039
high
lowest allowed
--------------------------------------------------------------------------------------------------------
(4)
5/25/1972 +5.9% +0.2% paper
loss Also Sell S9 and S15
969.07
1.025 .279 -10 14 -20 .004 -1 .222
.059
--------------------------------------------------------------------------------------------------------
(5)
7/11/1968
+4.8% No paper loss No other signal at this time
922.82
1.017 .081 36 -18 83 -.052 5 -.008
.089
-------------------------------------------------------------------------------------------------------
8/9/2000 profitable but a 3% paper loss Sell S9 a week later was
better.
X 10976.89 1.024
.367 -1 -1 -1 -.019 -56 .333 .036
too low
-------------------------------------------------------------------------------------------------------
(6)
8/11/2000
+3% 2.6% paper loss Sell S9 a week later was better.
11027.8
1.026 .265 14 55 14 -.023 -62
.227 .06
-------------------------------------------------------------------------------------------------------
(7)
One Year after Presidential Election Year: From 4/24 to 7/10 (5/6 were good)
4/24/1981 +17.4% no paper loss ...
also a Sell S15
1020.35 1.018
.061 1 -11 3
-.012 -1 .11 .073
------------------------------------------------------------------------------------------------------------
5/2/1969 good also Sell S9 and
Sell S8.
X 957.17 1.03 .337 14
36 32 .109
0 .194 .02
high
low
------------------------------------------------------------------------------------------------------------
(8) 5/13/1965
+4.8% paper loss =
0.1% No other
signal at this time
938.9
1.018 .339 24
3 68 .11
-262 . 254 .04
------------------------------------------------------------------------------------------------------------
(9)
5/19/1993 +0.2% paper loss =
1.6% No other signal at this
time
3500.03
1.017 .196 -8 46 -13 .069 -1 -.076 .055
low
Bad B10 follows.
-------------------------------------------------------------------------------------------------------------
(10)
5/28/1945 +2.1%
paper loss = 0.5% Earlier S9
168.2
1.018 .31
9 6 41
.031 -68 .156 .055
------------------------------------------------------------------------------------------------------------
(11) 7/5/1957
+10%
paper loss = 0.8% Also
an S9.
516.9
1.02 .348 -32 23
-100 .056 -198 .305 .076
------------------------------------------------------------------------------------------------------------
Second Year after Presidential Election Year: No
Pattern: 5 good and 7 bad
Third Year after Presidential Election Year: May as delimited and
September worked well, 2 of 2, before the 21st..
------------------------------------------------------------------------------------------------------------
X
5/2/1975 good
(+3.7% gain and paper loss = 1.3%)
848.48
1.06
1.441 95 42 181 .126
2 .396 .171
too high too high
------------------------------------------------------------------------------------------------------------
(12) 5/14/1959 +2.4% paper
loss = 1.1% No other signal at this time
637
1.018 .467
-54 2 -159 .047 -417 .279
.085
------------------------------------------------------------------------------------------------------------
X 5/15/2007
13383.84 1.019 .603
45 -112 40 .132 -35 .598 .06
too high
too high
------------------------------------------------------------------------------------------------------------
(13) 5/29/59 +3.4%
no paper loss
No other signal at this time
643.8
1.021 .378 -46
5 -135 .006 -370
.216 .065
------------------------------------------------------------------------------------------------------------
X
7/16/2007 +4.7%
paper loss = 0.4% Also S4, S9 and S11.
13950.98 1.028 .349 88 -105
79 -.003 -60 .083
.10
July S7s in
the 3rd year of the Presidential cycle can fail.
Examples 7/15/1987 and 7/28/1987.
-------------------------------------------------------------------------------------------------------------
(14) 9/14/1967 +7.5%
paper loss = 1.5% also Sell
S12
929.44
1.024 .135 12
-1 32
-.009 2 .20
.046
------------------------------------------------------------------------------------------------------------
(14) 9/20/1979 +10.9% paper loss = 0.4%
also S9
893.69 1.017 ..104
-74 16 -141 .063
-1 .037 .061
lowest
----------------------------------------------------------------------------------------------------------------------------
OLDER, NO LONGER USED SELL S7
----------------------------------------------------------------------------------------------------------------------------
- Used briefly from 2010 to 2011 -
On 3/3/2011 this
Sell S7 was left out of Peerless
NYSE A/D Line and Accumulation Index
Make New Lows Ahead of DJIA
Usually a bearish divergence by
the NYSE A/D from a series of DJIA tops
is a reliable warning that
the DJI itself will soon enter a bear market and decline
15% or 20% or more. The Sell
S7 is one other way to help predict when the DJI
would follow a much weaker
NYSE A/D Line to substantially lower prices.
There have been 13 cases since 1929. Though the average gain when betting
on a Sell S7 is 11%, only 3
of the 13 instances brought a decline of more than
5%. In 7 cases, the
decline 4.1% or under. This suggests that in most cases
a weak A.D Line does not
guarantee the DJI will break its major support. In three
cases we find important
breakdowns of support with a weak A/D Line leading the way
in the year after a
Presidential Election. These three cases averaged 27.8%. In the table
below I have made red these
post Presidential Election Year Sell S7s.
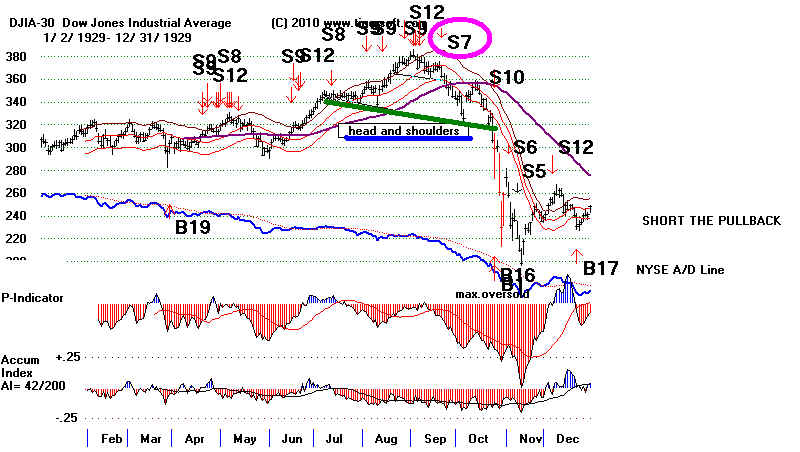
Sell S7s: 1929-2010
#1 45.1%
9/20/29
Post Presidential Election year.
#2 15.6%
1/22/40
The Sell S7 warned of coming German attack on W. Europe.
#3, 4.1%
9/19/56
Pres, Election Year
#4 7.1%
8/5/1957
Post Presidential Election year.
#5 0.5%
9/14/59
#6 22.6%
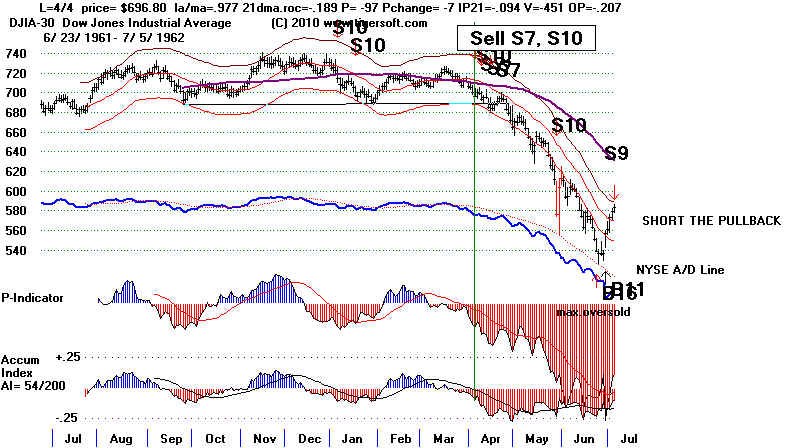
4/4/62
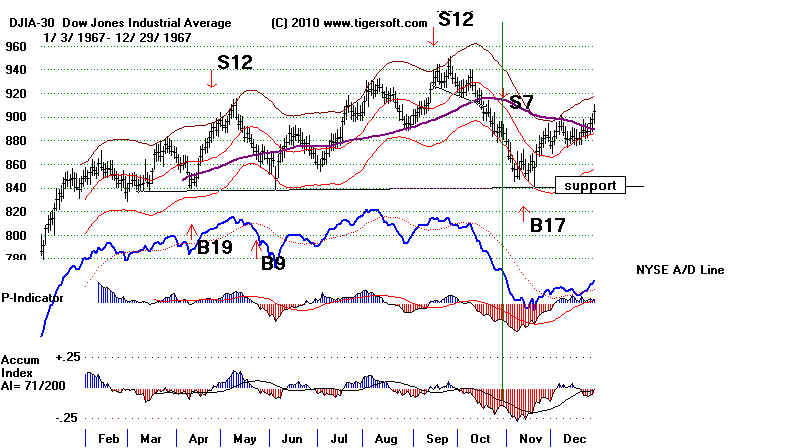
#7 3.0%
0/30/67
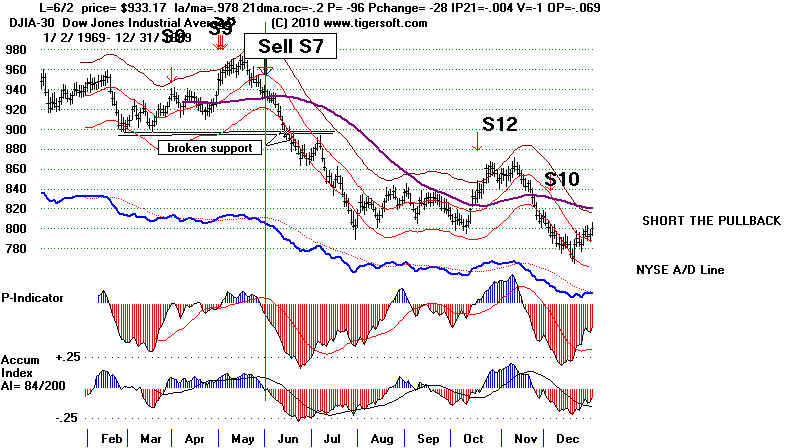
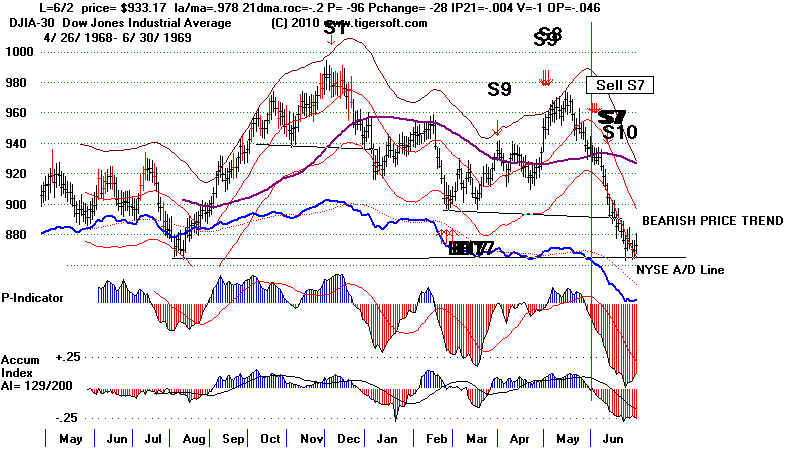
#8 31.3%
6/2/69
Post Presidential Election year.
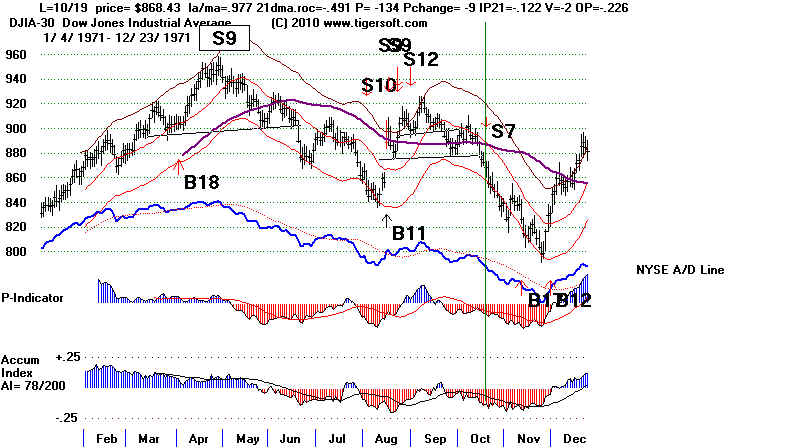
#9 4.9%
10/19/71
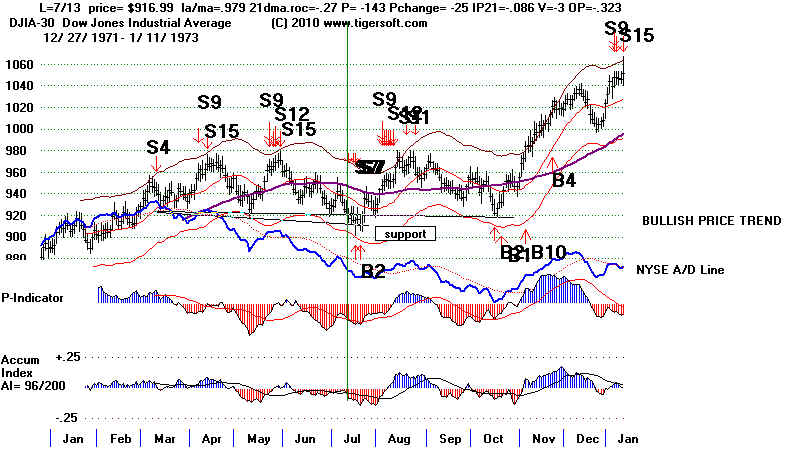
#10 0.6%
7/13/72
Pres, Election Year
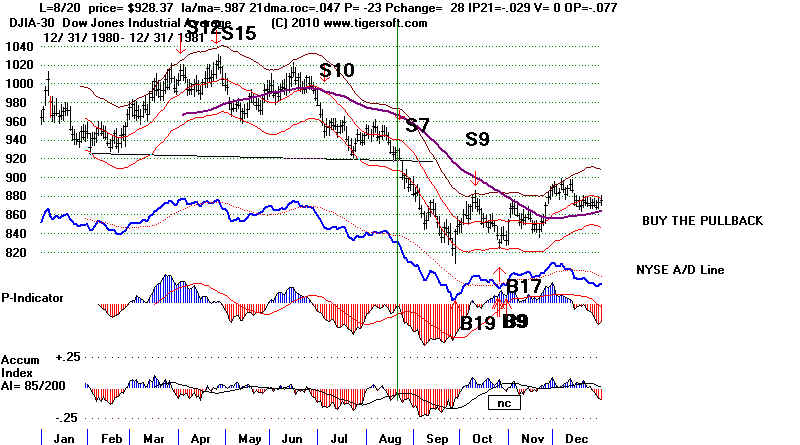
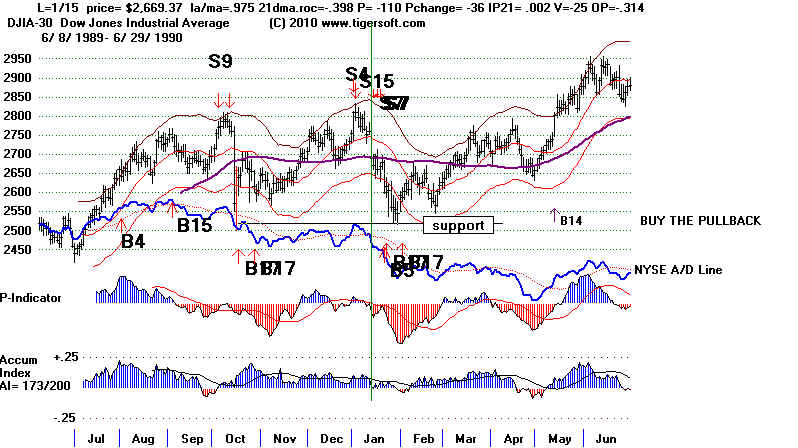
#11 2.6%
1/15/90
#12 2.9%
8/6/99
#13 3.7%
9/15/99
--------------------------------------------------
Avg, +11.9%
1962 Sell S7
before Massive Head/Shoulders Pattern
Gave Way

Sell S7s Are Reliably Bearish
All 11 of the Sell S7s were profitable and their average gain was
113% on S7 short sales
of DJIA which were then covered at the time of the next Buy.
Only 2 of the 17 S7s
showed a paper loss: 1940 - 4% paper loss and 1999 -5%
paper loss.
They are most helpful as reinforcing Sell signals. They
show that an earlier Sell S9 is
probably going to produce a deep DJI decline. Sell S9 -
Sell S7s combinations
occurred in:
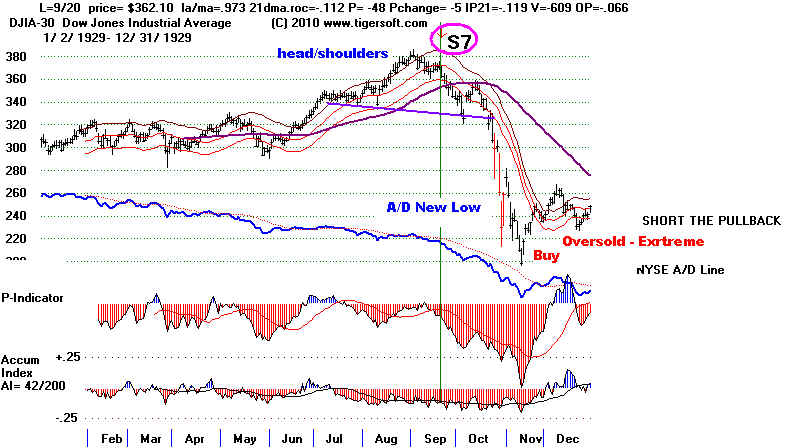
9/20/29 362.1
Gain = + 45.1%
8/5/57
500.80 Gain = + 7.1%
6/2/69
933.17
Gain = +31.3%
10/19/71 868.43
Gain = +4.9%
In a
Presidential Election Year, even with an S9, they are not likely to bring
a breaking of well-tested support unless a war is
coming.
7/13/72 916.99
Gain = +0.6%
The
presence of a head shoulders price pattern adds to their bearishness. See
the examples of
9/20/29 362.1
Gain = + 45.1%
9/19/56 488.7
Gain = + 4.1%
10/19/71
868.43 Gain = +4.9%
1/15/90 2669.37
Gain = +2.6%
Only rwice was an Sell S7 a reversing signal:
1/22/40 145.1
Gain = + 15.6% 4% paper loaa
9/19/56 488.70
Gain = + 4.1% no paper loss.
. Sell S7s do not always bring break below well-tested support.
See these cases. See how each of these cases took
place just before a Presidential
Election year.
9/14/59
633.80 Gain = + 0.5%
10/30/67 886.62
Gain = +3.0%
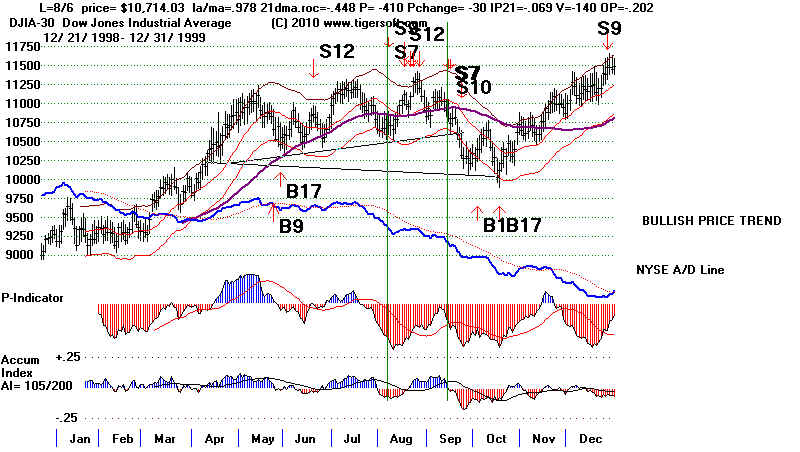
8/6/99
10714.03 Gain = +2.9%
When they do
bring a break in well-tested support, a serious decline is likely
to start. The rupture of the 860 support in 1969 led
quickly to much lower
prices after July 1969. See the chart below:
Seasonality and Sell S7s
Sell S7s are generally much more potent if they occur in
the first 6 months of the
year. They average 11.5% declines while those in the
second half of the year
showed only 1 of their 8 instances brought a decline by
more than 8.5%. The
weaker results for October S7s bear out the notion that
Octobers are more likely
to be the end of a bear market than the beginning because
of the selling climaxes
then. .
Distribution of Gains by Month
Cases
Avg.,
Jan
15.6% 2.6%
+9.0%
Feb
Mar
Apr
22.6%
+ 22.6%
May
June 31.3%
+31.3%
July
0.6%
+0.6%
Aug
7.1% 2.9%
+5.0%
Sept 45.1%
4.1% 0.5% 3.7% +13.4%
Oct
3.0% 4.9%
+3.95%
Nov
Dec
Requirements of a Sell S12
> A/D Line New 21 day low
> P-Indicator makes 21-day low
> Accum. Index makes 21-day low
> DJI's close is not down
more 8% in last 130 trading days
> DJI's close is below
21-day ma by more than 2.5% but less than 2.85%
Exclusions:
> Exclude cases
where Annualized ROC is below -.50 and IP21 is not below -.10,
> where
Annualized ROC is below -.72,
> where OPCT is greater than +.05,
> when there is a simultaneous Buy B17 (which should be counted),
> when there
was a Buy B17 in the two previous days and
> Nov cases (Odds of a December rally are too high)
> DJI should not already be down more than 7.5% from highs.
====================================================================================
The Instances of
Sell S7s
#1
9/20/29 362.1
.973 Gain = + 45.1%
No paper loss. Collapsed to 200 after a right shoulder
pattern.
(LA/MA AnnROC P-I
P-Ch. IP21
V-I
Opct.)
.973 -.112 -48 -5
-.119 -609
-.066
1929 Sell S7
S9/S12 at Top and Head/Shoulders
======================================================================
( X DJI was
already down more than 7.5%.)
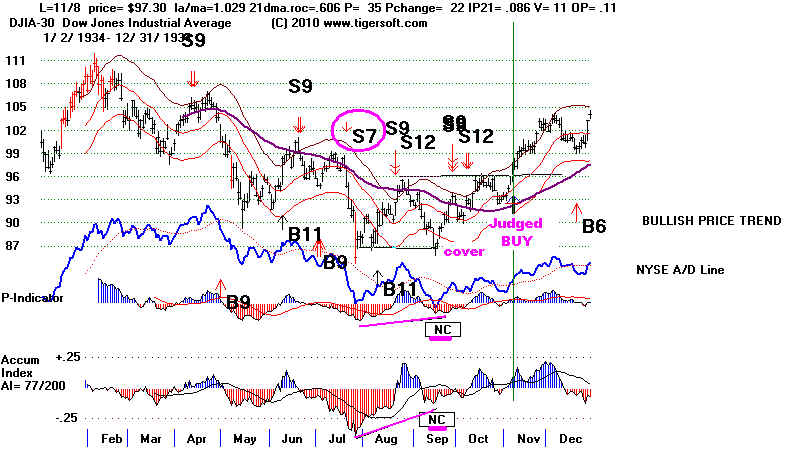
7/20/34 94.70
.977 Gain = + 3.6%
This was a reversing Sell.
No paper loss.
DJIA broke to new lows to 85.50 and rallied
.977 -.442 -83
-.18 -.245 -132
-.266
-=================================================================================
( X DJI was already down more than 7.5%.)
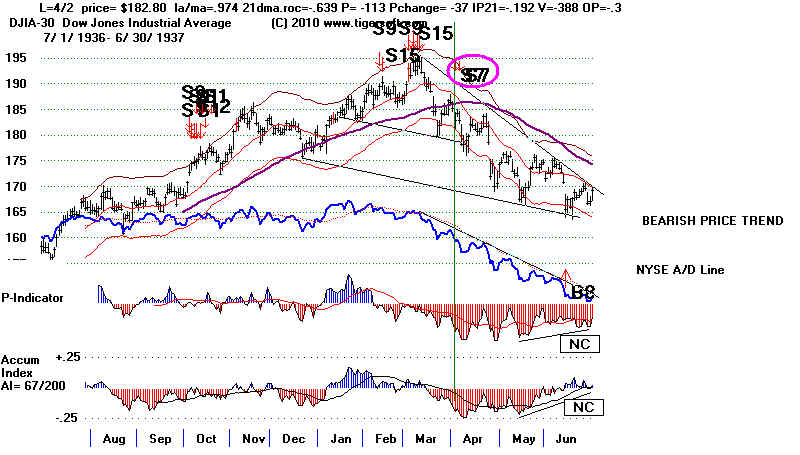
4/2/37 182.8
.974 ...
Gain
= + 9.5%
DJIA broke to new lows at 166.
No paper loss.
.974 -.639 -113
-37 -.192
-388 -.261
4/6/37 182.9
.979 ...
Gain
= + 9.5%
broke to new lows at 166.
.979 - .712 -122
-26 -.205 -400
-.291
--------------------------------------------------------------------------------------------------------------------------------------------------------
#2
1/22/40 145.1
.976
...
Gain = + 15.6%
This was a reversing Sell.
DJIA rallied to 151.30 before collapsing. 5% Paper Loss.
.976 -.32
-33 -13 -.119
-88 -.144
=====================================================================
Already down more than 7.5%
from highs
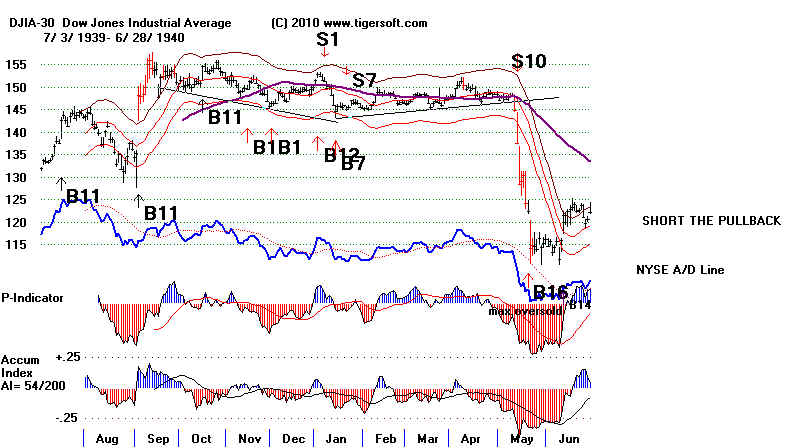
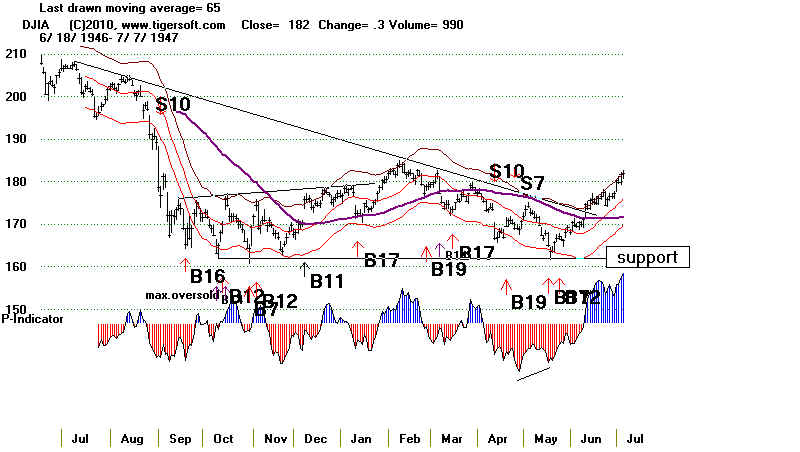
4/25/47 168.90
.979 ...
Gain = + 2.3%
Fell only to 163.60 and then rallied...3% paper loss.
This was a Sell S7 after the mini-bear market 1946.
.975 -.565 -133
-40 -.207 -204
-.159
=====================================================================
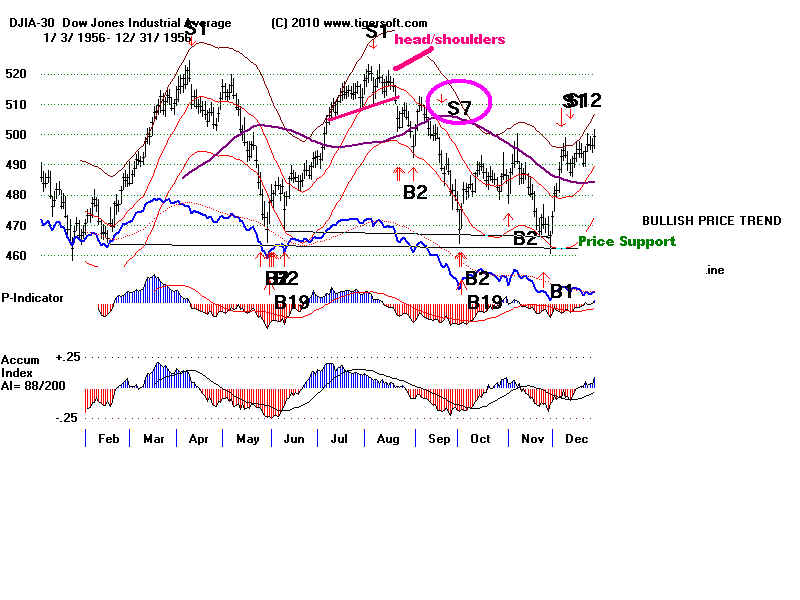
#3
9/19/56 488.70
.972 ...
Gain = + 4.1%
This was a reversing Sell.
Note head and shoulders top in July-August
and well tested support at 465.
DJIA fell immediately, but only to 470 support from the previous low.
No Paper Loss
.972 -.532 -152 0 -.189
-401 -.416
This was in a Presidential Election Year so we look for trading ranges.
====================================================================
#4
8/5/1957 500.80 .974
... Gain = + 7.1%
Declined immediately. Note "two/thirds a head/shoulders" pattern.
No paper loss.
.974 -.372 -112 -38 -.08 -339 -.13
8/9/1957 496.80 .994
... Gain = + 6.4%
This second S7 was already down more than 7.5%
declined immediately
.994 -.136 5 -.092 -365 -.212
===================================================================
#5
9/14/1959 633.80 ... Gain = +
0.5%
Nearby B17s are warning that decline is nearly over.
DJI fell only to 615. No paper loss.
This was a week from the bottom.
Notice flat support where it reversed.
.973 -.394 -140 -16 -.051 -460 -.17
==================================================================================
#6
4/4/1962 696.8 Gain= +22.6%
Immediate decline as head and shoulders pattern gave way, No Paper
loss.
.977 -.189 -97
-7 -.094
-451 -.207
4/9/1962 692.9 Gain = +22.2%
.974 -.359 -132 -41
-.148 -536 -.299
4/13/1962 687.9 .216
+21.6%
.975 -.599 -172 -3 -.226 -638 -.501
==================================================================================
#7
10/30/67 886.62 +3.0%
Declined only to 855. No paper loss.
.976 -.523 -187 -13 -.148 -12 -.324
=================================================================================
#8
6/2/69 933.17
Gain = 31.3%
Start of 1969-1970 bear market.
No paper loss.
Bottom was at 641.36 finally on 5/25/1970
.978 -.20 -96 -28 -.004 -1 -.046
There had previously been a Sell S9.
6/2/69 930.70
Start of 1969-1970 bear market.
Bottom was at 641.36 on 5/25/1970
.978 -.20 -96 -28 -.004 -1 -.046
There had previously been a Sell S9.
=====================================================================
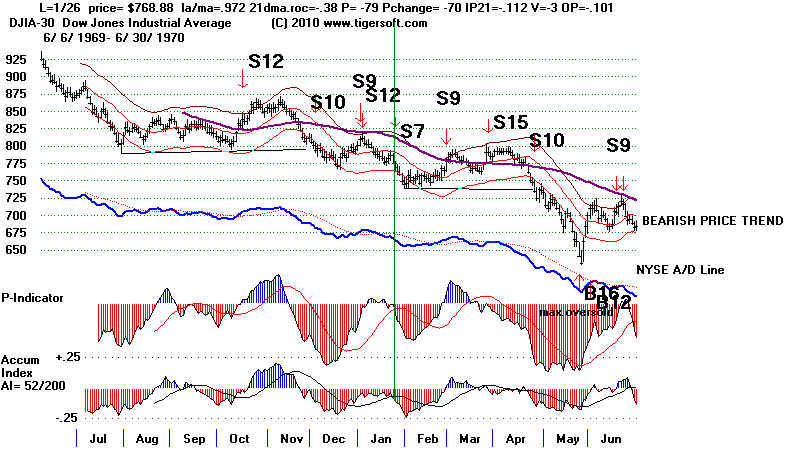
DJI already
down more than 7.5%.
1/26/70 768.88
Gain = +16.6%
.972 -.38 -79 -70 -.112 -3 -.101
This was in an on-going bear market.
5% paper loss.
DJI immediately fell to 745, then rallied to 790 and then fell to 641 bottom.
========================================================================
#9
10/19/71 868.43 Gain = +4.9%
No paper loss.
.977 -.491 -134 -9 -.122 -2 -.226
========================================================================
#10
7/13/72 916.99
Gain = +0.6%
This was in a Presidential Election year.
The DJI was already at well-tested support.
No paper loss.
.979 -.27 -143 -25 -.086 -3 -.323
7/17/1972 914.96 Gain = +.4%
This was in a Presidential Election year.
This was at well-tested support.
.979 -.395 -171 -18 -.102 -3 -.334
=========================================================================
The DJI was already down 7.5%
8/21/81
920.57 Gain = +8.5%
No paper loss
.979 -.101 -37 -15 -.068 -1 -16
========================================================================
#11
1/15/90 2669.37 Gain = +2.6%
No paper loss.
.975 -.398 -110 -36 .002 -25 -.314
1/17/90 2659.13 Gain = +2.2%
.975 -.398 -110 -36 .002 -25 -.314
1/18/90 2669.38 Gain = +2.5%
.976 -.136 -50 29 .06 -13 -.093
========================================================================
#12
8/6/99 10714.03 Gain = +2.9%
Paper Loss = 5% as DJI first rallied to 11300
.978 -.448 -410 -30 -.069 -140 -.202
==========================================================================
#13
9/15/99 10801.42
Gain = +3.7%
No paper loss.
.978 -.264 -214 -21 -.007 -95 -.132
See chart above.
=================================================================
Number of trades = 13
Avg. Gain= +10.3%
Red key variables are outside the acceptable range.
Date DJI Gain LA/MA
------------- ----------- -------- ----------
EXCLUDED
5/20/29 312.7 .979 tested lows and rallied to new highs.
.979 -.078 -66 -13 -.075 -561 .16
===
EXCLUDED
8/9/29 338. .977 ... rallied to 382 and then collapsed
.977 -.172 -82 -26 -.14 654 .128
====
EXCLUDED
6/17/37 167.7 .975 ...This was bottom
.975 -.152 -70 -10 .058 -117 .068
====
EXCLUDE
11/29/39 146.9 .977 ... fell to 144.70 and rallied to 151.30
.977 -.522 -106 -12 -.063 -171 -.283
EXCLUDE
11/30/39 145.7 .972 ... fell to 144.70 and rallied to 151.30
.972 -.594 -123 -18 -.079 -192 -.295
EXCLUDE
11/29/56 499.50 .972 ,,,This was bottom.
.972 -.502 -116 -25 -.125 -381 -.339
November lows in a Presidential Election Year often bring
excellent recoveries.
EXCLUDED
8/19/1959 646.50 .973 ... fell to 615
rallied back to 21-dma and declined below lower band.
.973 -.268 -84 -41 -.054 -403 .06
EXCLUDE
2/5/1960 626.80 ...... fell to 600 Only +1.3% drop to 2/11/60 Buy B17
.973 -.937 -154 -3 -.22 -575 -.33
fell to 600 before rallying.
This was in a Presidential Election year.
EXCLUDED
4/16/1962 684 .212
La/ma=.972 21-dma-roc= -.646 P= -180 Pch= -9 IP21 = -.235 V= -659 OP= -.501
Fourth in series are voided normally.
EXCLUDED
11/15/67 855.18 This was a bottom, 10% down from previous high.
There had been a series of tests of 840-860. (Good example of support).
There had been a Buy B17 on 11/13/67.
Notice improving P-Indicator
.976 -.722 -234 26 -.211 -19 -.51
EXCLUDED
2/8/68 gain - +1.5%
.976, -.731, -171, -48, -.199, -15, -.532
EXCLUDED
3/5/68 loss - 4.1% (Better to also use A/D Line)
.979, -.483, -222, -25, -133, -21, -.158
There had been a Buy B17 on 2/14/68
This was in a Presidential Election Year.
Notice P-Indicator was rising.
A/D Line trend break occurred on 3/27/68 with DJI at 836.57.
Using A/D Line the loss would have been 1.2%
This was a March Sell S7. These are bad for S7s.
EXCLUDED
2/20/69 916.65 (Signal cancelled by B17)
.974 -.167 -139 -31 .076 -2 .115
Sumulataneous B17. Cannot be counted. B17 should be counted.
EXCLUDED
3/3/69 908.63 (Signal should be cancelled by B17 on 2/28/69
.976 -.376 -266 -2 .008 -3 .086
There had been a B17 on previous day
March S7s do not work well.
EXCLUDE
7/28/71 872.01 -1.9%
.979 -.015 -49 -23 -.001 -2 .056
EXCLUDE
7/18/1972 911.72 +3.9%
We should skip at least a day between S7s.
This was in a Presidential Election year.
This was at well-tested support.
.978 -.425 -179 -9 -.094 -3 -.342
EXCLUDE
9/16/74 795.13
.974 -.444 -160 -50 -.133 03 -.232
This was at well-tested support.
Sumulataneous B17. Cannot be counted. B17 should be counted.
EXCLUDE
11/7/74 796.67
,972 -.882 -275 34 -.101 9 -.574
Sumultaneous B17. Cannot be counted. B17 should be counted.
EXCLUDE
3/12/82 797.37
.975 -.571 -108 -46 -.118 -8 -.279
At support and after long bear market,
P-Indicator NC
Subsequent trend-break in A/D Line is a Buy.
March S7s do not work well.
EXCLUDE
11/21/88 2065.97
.975 -.659 -251 -21 -.084 -.101
There had been a Buy B17 on 11/11/88
At well tested diagonal support.
Novembers do not produce good results.
EXCLUDE
4/18/94 3620.42 LOSS
.973 -.781 -439 -55 -.043 -62 -.182
This was bottom.
This was third of 3600 and 10% from high.
EXCLUDE
4/19/94 3619.82 LOSS
.977 -.883 -474 -35 -.082 -65 -.302
This was bottom.
This was third of 3600 and 10% from high.
EXCLUDE
4/20/94 3598.71 LOSS
.974 -.855 -456 17 -.082 -66 -316
This was bottom.
This was third of 3600 and 10% from high.
EXCLUDE
7/11/96 5520.54 (+2.9%)
.977 -.312 -225 -67 -.013 -47 -.134
Sumulataneous B17. Cannot be counted. B17 should be counted.
EXCLUDE
3/6/00 10170.50 -4.1%
.977 -.96 -400 -86 -.176 -140 -113.
Great weakness in price shown by 21-dayroc of -.96
Down 12% from highs - AVOID - this is likely to be support.
March S7s don't work.
5/23/00 10422.27 -1.1%
.976 -.538 -113 9 -.033 -68 -.159
IP21 of -.033 is too high for the great weakness in price shown by 21-dayroc of -.538
Surrounded by Buy B2s.
Down 12% from highs - AVOID - this is likely to be support.
5/25/00 10323.92
.972 -.695 -186 -7 -.04 -92 -.154
IP21 of -.04 is too high for the great weakness in price shown by 21-dayroc of -.695
Surrounded by Buy B2s.
Down 12% from highs - AVOID - this is likely to be support.