(C) 2010 www.tigersoft.com
The S9/S12 signals in combination can be very bearish. They occurred right at the top in
September 1929 and October 1987. For there to be this much bearishness potential, we
think that there has to be a lengthy period of a comparably weak NYSE A/D Line and
multiple earlier Peerless Sell Signals.
S9/S12s in bull markets are more reliably bearish than S9/S12s in on-going
bear markets. As a whole, they usually only promise a decline to the lower band
or well-tested support. Only 3 of the 15 bull market S9/S12s brought a decline
of greater than 6.5% when reversed by the next Peerless Buy signal. 4 of the 12
bear market S9/S12s brought this sized decline. However, 5 of the 12 bear market
S9/S12s resulted in losses. The S9/S12s are least reliable at a bear market bottom
that forms quickly.
BULL MARKETS S9/S12s
Number of closed out trades = 15
Gains = 14 Losses = 1
Average Gain per trade = +11.4%
There were 3 Gains of more than 30%.
Leaving these trades off, the avg. gain was 5.1%
BEAR MARKETS S9/S12s
Number of trades = 11 Losses = 5
Average Gain per trade = +4.6%
There were 2 Gains of more than 20%.
There were 3 Losses of more than 5%
CLINCHED SELL S9s
These signals occur on strength. It takes some resolve and faith in Peerless to use
them. To be surer of an S9/S12 when the DJI is at or near an all-time high, when
resistance is reduced, wait for NYSE declines to exceed advances by 50 or more
on any day at the close after the Sell S9 or on the day of the Sell S9 for the signal
to be "clinched" . This would have avoided two S9 losses, one in 1987 and one in
1999.
1929 CRASH
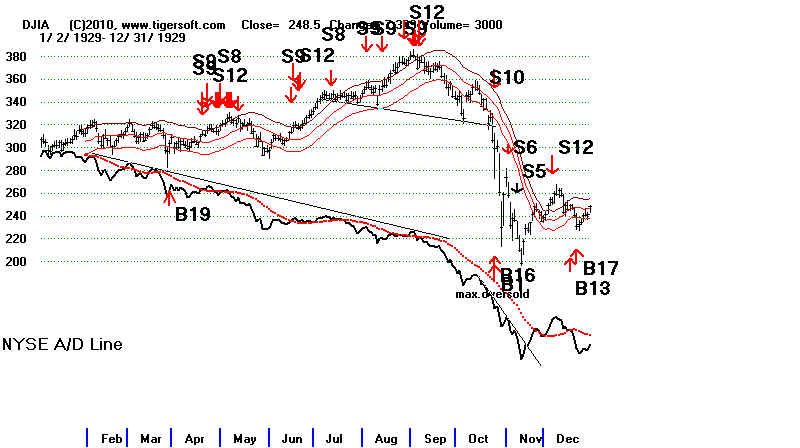
The more S9s and S12s on the chart, the more bearish is the eventual breaking
of support.
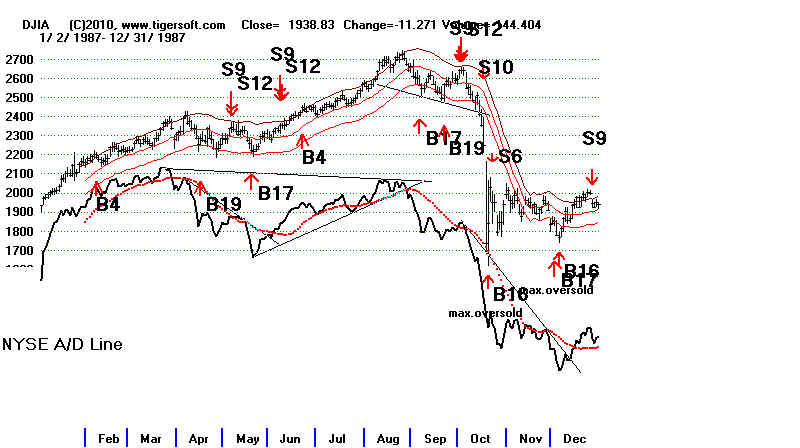
The Third S9/S12 Set Brought The Crash of October 1987
EFFECTIVE SUPPORT IN LIMITED DECLINES
FOLLOWING A SELL S9/S12
The lower band sometimes represents how far down a decline will go following
an S9/S12. Below that, an S9/S12 often can be reversed at a line drawn through
at least 3 low points or closings, especially when they are 8.5% to 12% below the
previous peak.
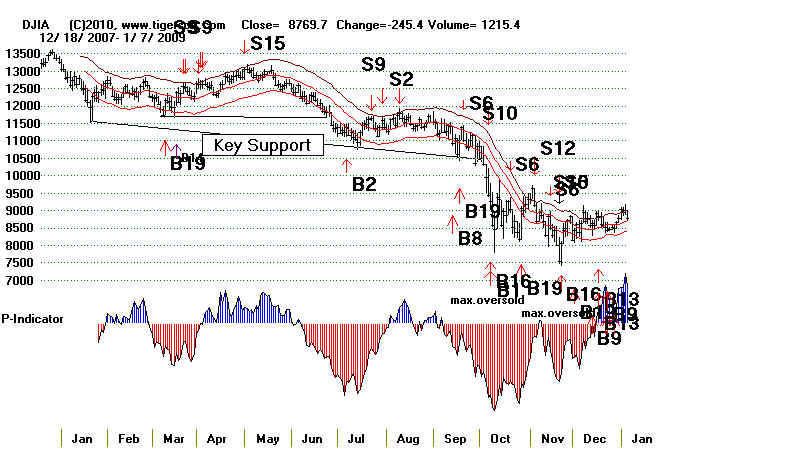
In a Presidential Election Year, it is more likely that the lower band and well-tested
support will hold. See this in the case of 1972 below here. But this rule is not
absolute. 2008 was a clear exception. From this it may be inferred that when support
IS broken in a Presidential Election Year, a much steeper decline is likely. The Sell S9s
in 2008 had their bearish effect merely postponed when the P-Indicator turned positive
for more than 3 days.
2007 - DJIA
In the tables below, we only consider the simultaneous S9s and S12s, when they
occur on the same day.
POSTPONED DECLINES AFTER
P-INDICATOR AND ACCUM. INDEX TURN BRIEFLY POSITIVE
When the P-Indicator and Accumulation Index turn positive for 3 or more days
after a Sell S9/Sell S12, there is commonly an extension of the rally for a brief period
before the bearishness of the signals' first experience is borne out. A 3% to 5%
additional DJI rally is typical that lasts 3 to 6 weeks. The 1959 example shows
this. About half the S9/S12s have the key internal strength indicators turn positive.
Sell S9/S12
It is helpful to study these combined S9/S12
signals when they occurred in bull markets,
before there has been a
12% sell-off. Since 1928, there have been 15 combined Sell S9-S12
signals in such a bull
market environment. Assuming one shorted the DJIA on these
S9/S12s, 14 of the 15
were closed out profitably at the time of the next Buy. Leaving
the three biggest
gainers off, the average drop would still have been +5.1% on short
sales taken with these
signals. In 9 of the 15 cases, there was no paper loss. In one
case, there was a paper
loss of more than 15%. In all the others, the paper loss was less
than 3%.
The one loss, in
1987, would have been avoided if we also required that the NYSE
declines exceed
advances at the close either on the day of the signal or on a subsequent
day before there is a
Peerless Buy. Today there were 555 more down than up at the
close. So, the S9
is now "clinched".
In 40% of these
S9/S12 cases, the market rallied 3% or more before falling to at
least the lower band.
What typically distingushes these cases is that the P-Indicator went
positive for more than
3 consecutive days. In these cases, the decline to the lower
band is usually just
being postponed for 3-6 weeks.
              Bull Market S9/S12s
                     ===================

        4-Year Cycle

         Presidential Election Year (PYE)
           1962 + 1.2%

         PYE + 1 (1929, 1933, 1937, 1941...)
           1929  +3.6%
           1929   +5.0%
           1929   +40.0%
           1981  +3.5%

         PYE + 2 (1930, 1934, 1938, 1942...)
           1978  +11.7%
           2010  ?
         PYE + 3 (1931, 1935, 1939, 1943...)
           1959 +1.9%
            1975 +4.8%
            1987 +5.2%
            1987 +5.2%
            1987  -4.0%
            1987 +30.3%
            1999 +6.4%
Simultaneous Peerless Sell S12s/S9s: 1928-2009
Date DJI Gain
------------- ----------- --------
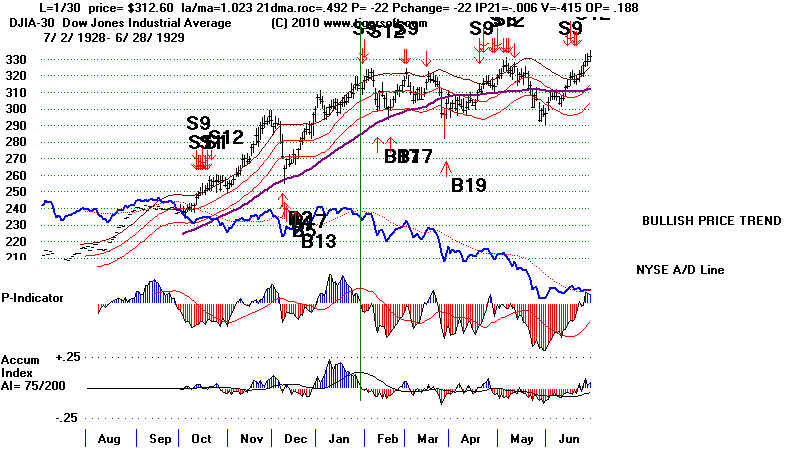
#1
...S9...S12 1/ 30/ 1929 312.6 +3.6%
1.023 .492 P=-22 -22 -.006 -415 .189
(la/ma ann.roc P-Ind P-change IP21 V-I Opct)
Bull Market variety.
Fell to lower band after 3% advance and paper loss.
P-Indicator and Accum.Index stayed negative until DJI fall.
Sell S9/S12
 -----------------------------------------------------------------------
#2
...S9...S12 4/ 22/ 1929 315.3 +5.0%
1.036 .027 P=-39 17 .038 -576 -.016
Bull Market variety.
Fell to below the lower band and support after 3% advance and paper loss.
P-Indicator and Accum.Index turned positive for 2 days until DJI fell
to support at 300.
Sell S9/S12
Sell
-----------------------------------------------------------------------
#2
...S9...S12 4/ 22/ 1929 315.3 +5.0%
1.036 .027 P=-39 17 .038 -576 -.016
Bull Market variety.
Fell to below the lower band and support after 3% advance and paper loss.
P-Indicator and Accum.Index turned positive for 2 days until DJI fell
to support at 300.
Sell S9/S12
Sell 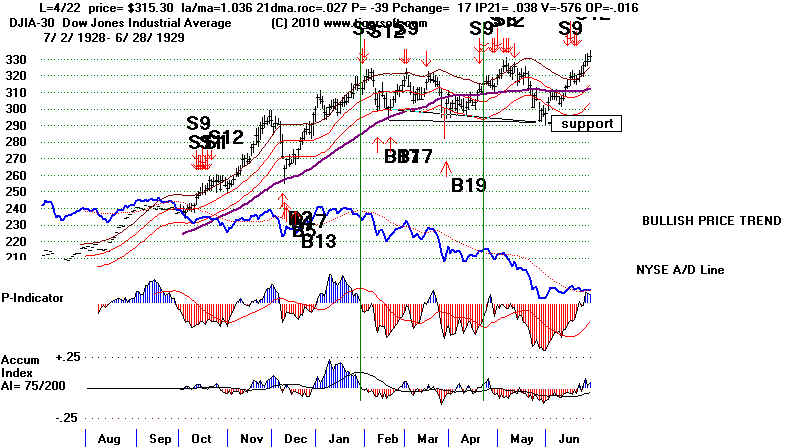 The chart above shows that the full daily data, where a daily high
ans low were kept, did not start until October 1928. This data
is needed to produce a Sell S12. This makes the October 1928 S12
unreliable. It is not counted here.
-----------------------------------------------------------------------
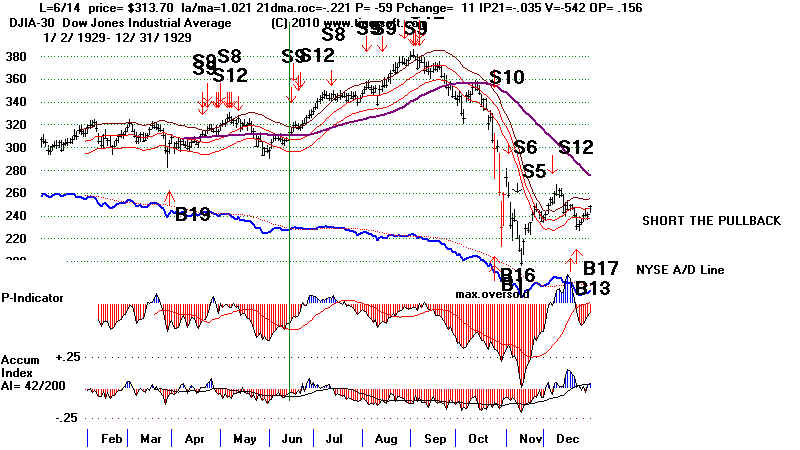
#3
...S9...S12 6/ 14/ 1929 313.7 +40%
1.021 -.221 P=-59 11 -.035 -542 .162
Bull Market variety. 16% paper loss.
P-Indicator turned positive for more than 3 days with the
DJI at 331.70 and then saw the DJI rally to 381.20 three
months later before crashing back to 198.70 on 11/13/1929.
The speculative bubble was so great then that even when
the internal strength indicators did turn negative again,
the DJI continued to rally for two more months. The falseness
of this rally is clear from hindsight. At the time, it would
have seemed that the indicators were wrong and were not
predictive of a decline.
Sell S9/S12
The chart above shows that the full daily data, where a daily high
ans low were kept, did not start until October 1928. This data
is needed to produce a Sell S12. This makes the October 1928 S12
unreliable. It is not counted here.
-----------------------------------------------------------------------
#3
...S9...S12 6/ 14/ 1929 313.7 +40%
1.021 -.221 P=-59 11 -.035 -542 .162
Bull Market variety. 16% paper loss.
P-Indicator turned positive for more than 3 days with the
DJI at 331.70 and then saw the DJI rally to 381.20 three
months later before crashing back to 198.70 on 11/13/1929.
The speculative bubble was so great then that even when
the internal strength indicators did turn negative again,
the DJI continued to rally for two more months. The falseness
of this rally is clear from hindsight. At the time, it would
have seemed that the indicators were wrong and were not
predictive of a decline.
Sell S9/S12
 -----------------------------------------------------------------------
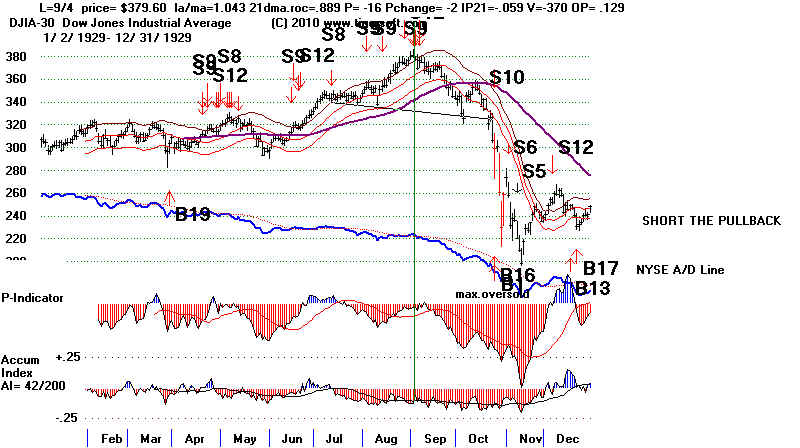
#4
...S9...S12 9/ 4/ 1929 379.6 181/380 or +47%
1.043 .889 P=-16 -2 -.059 -370 .133
Bull Market variety.
P-Indicator and Accum. Index stayed negative. DJI broke support at 320
and then crashed to 198.70 on 11/13/1929. No paper loss.
See how the support at 325 appeared at first to hold. But the
rally that followed was weak. The internal strength indicators
kept falling and the rally stalled exactly at the resistance of
the 65-day ma. The rally proved to be a right shoulder in a 4-month
long head and shoulders pattern.
Sell S9/S12
-----------------------------------------------------------------------
#4
...S9...S12 9/ 4/ 1929 379.6 181/380 or +47%
1.043 .889 P=-16 -2 -.059 -370 .133
Bull Market variety.
P-Indicator and Accum. Index stayed negative. DJI broke support at 320
and then crashed to 198.70 on 11/13/1929. No paper loss.
See how the support at 325 appeared at first to hold. But the
rally that followed was weak. The internal strength indicators
kept falling and the rally stalled exactly at the resistance of
the 65-day ma. The rally proved to be a right shoulder in a 4-month
long head and shoulders pattern.
Sell S9/S12
 --------------------------------------------------------------------
#5
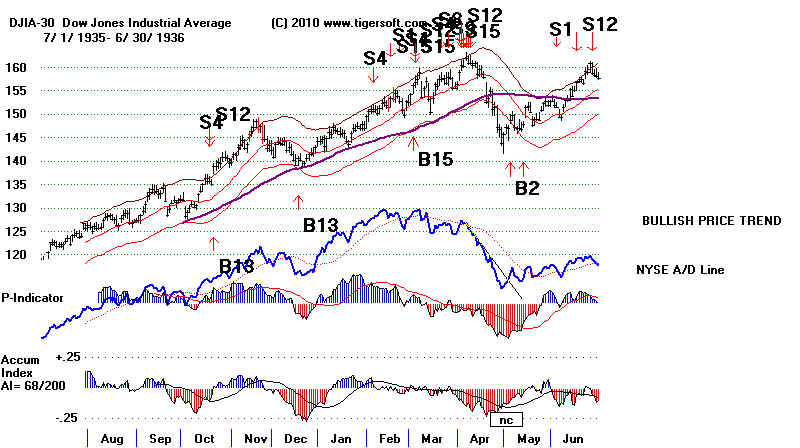
...S9...S12 4/ 2/ 1936 160.4 +7.4%
1.026 .282 P=-27 12 -.089 -231 .201
Bull Market variety. No paper loss.
The P-Indicator and Accum. Index never turned positive
before the DJI caved in, breaking the lower band and the
three times-tested 150 support. It fell to the 12% level
below its previous peak.
(...S9...S12 4/ 6/ 1936 161.9 +8.2%
1.034 .236 -37 -1 -.152 -249 .085)
Sell S9/S12
--------------------------------------------------------------------
#5
...S9...S12 4/ 2/ 1936 160.4 +7.4%
1.026 .282 P=-27 12 -.089 -231 .201
Bull Market variety. No paper loss.
The P-Indicator and Accum. Index never turned positive
before the DJI caved in, breaking the lower band and the
three times-tested 150 support. It fell to the 12% level
below its previous peak.
(...S9...S12 4/ 6/ 1936 161.9 +8.2%
1.034 .236 -37 -1 -.152 -249 .085)
Sell S9/S12
 -------------------------------------------------------------------
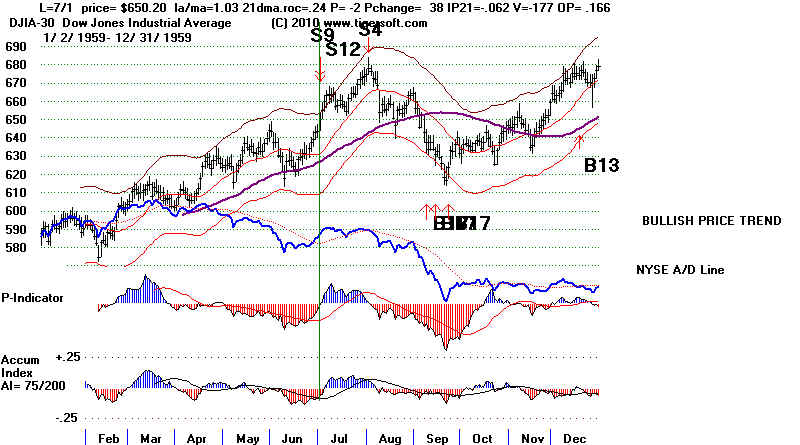
#6
...S9...S12 7/ 1/ 1959 650.2 +1.9%
1.03 .24 P=-2 38 -.062 -177 .166
Bull Market variety. 4% advance and paper loss.
The P-Indicator and AI turned positive for more than a few days.
This typically brings 2%-5% rally for a month to six weeks and
then a decline to at least the lower band. This is what happened.
The DJI peaked at 678. Its decline took it 9% down from its peak
to the earlier 615-620 support.
Sell S9/S12
-------------------------------------------------------------------
#6
...S9...S12 7/ 1/ 1959 650.2 +1.9%
1.03 .24 P=-2 38 -.062 -177 .166
Bull Market variety. 4% advance and paper loss.
The P-Indicator and AI turned positive for more than a few days.
This typically brings 2%-5% rally for a month to six weeks and
then a decline to at least the lower band. This is what happened.
The DJI peaked at 678. Its decline took it 9% down from its peak
to the earlier 615-620 support.
Sell S9/S12
 ----------------------------------------------------------------------
#7
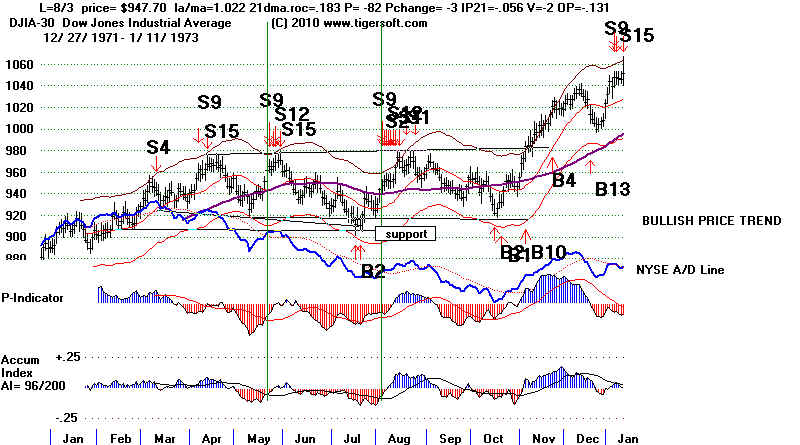
...S9...S12 5/ 22/ 1972 965.31 +5.6%
1.023 .019 P=-89 12 -.031 -2 .127
Bull Market Sell S9/S12 variety. No paper loss.
Declined directly only to lower band. A limited decline
to the lower band or well-tested support is more likely after a
Sell S9/S12 in a Presidential Election year.
----------------------------------------------------------------------
#8
...S9...S12 8/ 3/ 1972 947.7 +2.7%
1.022 .103 P=-82 -3 -.056 -2 -.131
Bull Market Sell S9/S12 variety.3% advance and paper loss.
Declined half way to lower band from 21-day ma. In this case,
the decline was postponed by a month when the internal
strength indicators turned positive more than 3 days.
S9/S12 S9/S12
----------------------------------------------------------------------
#7
...S9...S12 5/ 22/ 1972 965.31 +5.6%
1.023 .019 P=-89 12 -.031 -2 .127
Bull Market Sell S9/S12 variety. No paper loss.
Declined directly only to lower band. A limited decline
to the lower band or well-tested support is more likely after a
Sell S9/S12 in a Presidential Election year.
----------------------------------------------------------------------
#8
...S9...S12 8/ 3/ 1972 947.7 +2.7%
1.022 .103 P=-82 -3 -.056 -2 -.131
Bull Market Sell S9/S12 variety.3% advance and paper loss.
Declined half way to lower band from 21-day ma. In this case,
the decline was postponed by a month when the internal
strength indicators turned positive more than 3 days.
S9/S12 S9/S12
 ----------------------------------------------------------------------
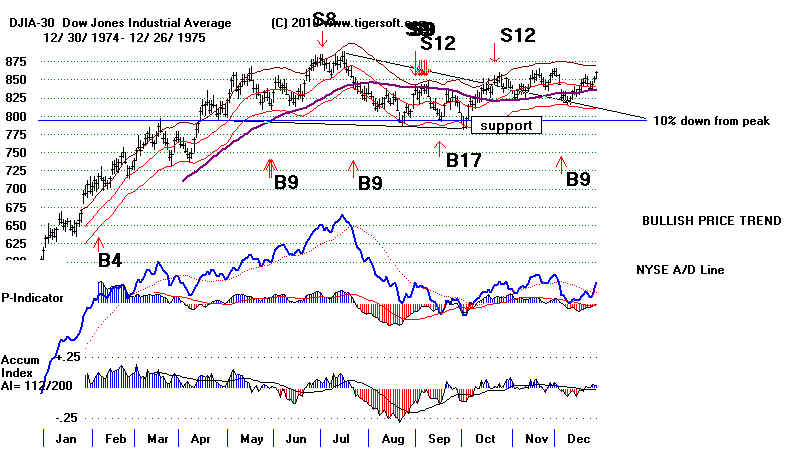
#9
...S9...S12 8/ 29/ 1975 835.34 +4.8%
1.024 .055 P=-139 23 -.102 -3 .008
Bull Market Sell S9/S12 variety. No paper loss.
DJI Fell directly to the lower band and well-tested support 11%
below the previous peak. The internal strength indicators
did not turn positive.
Sell S9/S12
----------------------------------------------------------------------
#9
...S9...S12 8/ 29/ 1975 835.34 +4.8%
1.024 .055 P=-139 23 -.102 -3 .008
Bull Market Sell S9/S12 variety. No paper loss.
DJI Fell directly to the lower band and well-tested support 11%
below the previous peak. The internal strength indicators
did not turn positive.
Sell S9/S12
 -----------------------------------------------------------------------
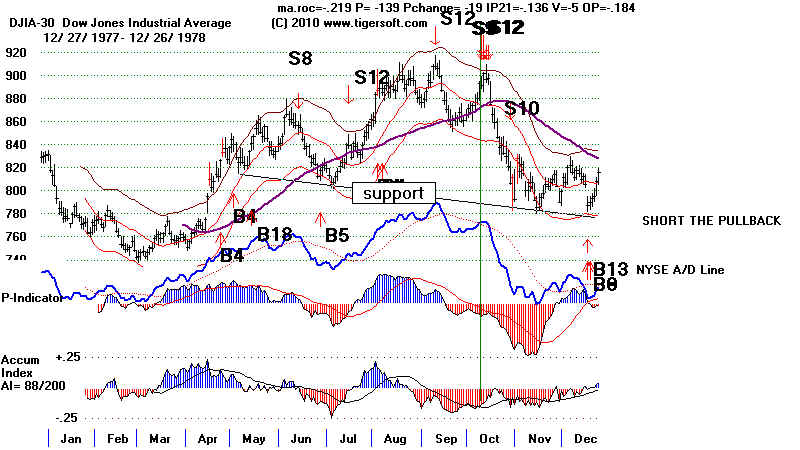
#10
...S9...S12 10/ 10/ 1978 891.63 +11.7%
1.02 -.219 P=-139 -19 -.136 -5 -184
Bull Market Sell S9/S12 variety. No paper loss.
Fell directly below the lower band to well-tested support.
(...S9...S12 10/ 11/ 1978 901.42 +12.6%)
-----------------------------------------------------------------------
#10
...S9...S12 10/ 10/ 1978 891.63 +11.7%
1.02 -.219 P=-139 -19 -.136 -5 -184
Bull Market Sell S9/S12 variety. No paper loss.
Fell directly below the lower band to well-tested support.
(...S9...S12 10/ 11/ 1978 901.42 +12.6%)
 -----------------------------------------------------------------------
#11
...S9...S12 1/ 2/ 1981 972.78 +3.5%
1.029 -.264 P=-71 30 -.04 -5 -.017
Bull Market Sell S9/S12 variety. No paper loss.
Fell directly to the lower band.
-----------------------------------------------------------------------
#12
...S9...S12 5/ 6/ 1987 2342.19 +5.2%
1.021 -.328 P=-185 -9 -.079 -15 -.15
Bull Market Sell S9/S12 variety. No paper loss.
Fell directly to the lower band.
-----------------------------------------------------------------------
#13
...S9...S12 6/ 8/ 1987 2351.64 -4.0% LOSS
1.026 -.088 P=-32 23 -.045 -4 -.18
Bull Market Sell S9/S12 variety. 4% advance and paper loss.
This signal was never clinched as P-Indicator turned positive.
-----------------------------------------------------------------------
#14
...S9...S12 10/ 2/ 1987 2640.99 +30.3%
1.026 .18 P=-56 41 -.017 -7 .068
Bull Market Sell S9/S12 variety. No paper loss.
This signal produced a decline below support that dropped extraordinarily.
----------------------------------------------------------------------
#15
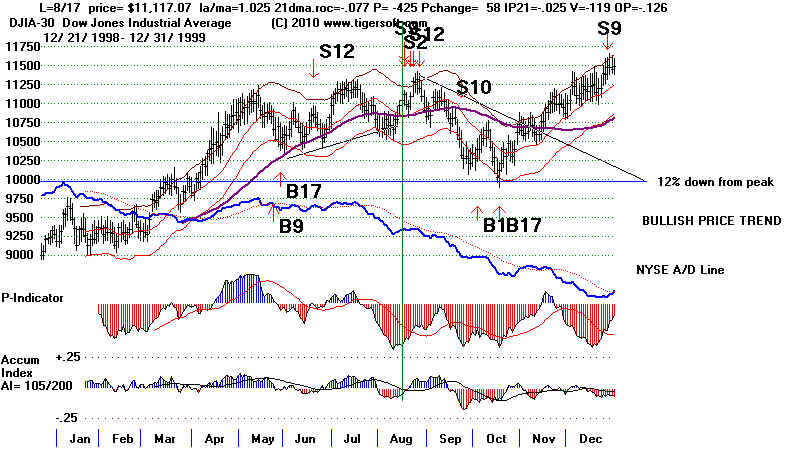
...S9...S12 8/ 17/ 1999 11117.07 +6.4%
1.025 -.077 P=-425 58 -.025 -119 -.126
Bull Market Sell S9/S12 variety. No paper loss.
This signal produced a direct 12% decline below peak.
-----------------------------------------------------------------------
#11
...S9...S12 1/ 2/ 1981 972.78 +3.5%
1.029 -.264 P=-71 30 -.04 -5 -.017
Bull Market Sell S9/S12 variety. No paper loss.
Fell directly to the lower band.
-----------------------------------------------------------------------
#12
...S9...S12 5/ 6/ 1987 2342.19 +5.2%
1.021 -.328 P=-185 -9 -.079 -15 -.15
Bull Market Sell S9/S12 variety. No paper loss.
Fell directly to the lower band.
-----------------------------------------------------------------------
#13
...S9...S12 6/ 8/ 1987 2351.64 -4.0% LOSS
1.026 -.088 P=-32 23 -.045 -4 -.18
Bull Market Sell S9/S12 variety. 4% advance and paper loss.
This signal was never clinched as P-Indicator turned positive.
-----------------------------------------------------------------------
#14
...S9...S12 10/ 2/ 1987 2640.99 +30.3%
1.026 .18 P=-56 41 -.017 -7 .068
Bull Market Sell S9/S12 variety. No paper loss.
This signal produced a decline below support that dropped extraordinarily.
----------------------------------------------------------------------
#15
...S9...S12 8/ 17/ 1999 11117.07 +6.4%
1.025 -.077 P=-425 58 -.025 -119 -.126
Bull Market Sell S9/S12 variety. No paper loss.
This signal produced a direct 12% decline below peak.
 ----------------------------------------------------------------------
#16
...S9...S12 6/16/2010 OPEN
1.025 -.253 P=12 2 -.018 -136 -.206
Bull Market Sell S9/S12 variety.
P-Indicator turned slightly positive.
A/D Line haa already broke above well-tesed downtrendline.
----------------------------------------------------------------------
#16
...S9...S12 6/16/2010 OPEN
1.025 -.253 P=12 2 -.018 -136 -.206
Bull Market Sell S9/S12 variety.
P-Indicator turned slightly positive.
A/D Line haa already broke above well-tesed downtrendline.
==========================================================
  Summation:
          Bull Market S9/S12s
         Number of closed out trades =  15
         Gains = 14 Losses = 1
         Average Gain per trade = +11.4%
         There were 3 Gains of more than 30%.
         Leaving these trades off, the avg. gain was 5.1%
BEAR MARKET S9/S12s
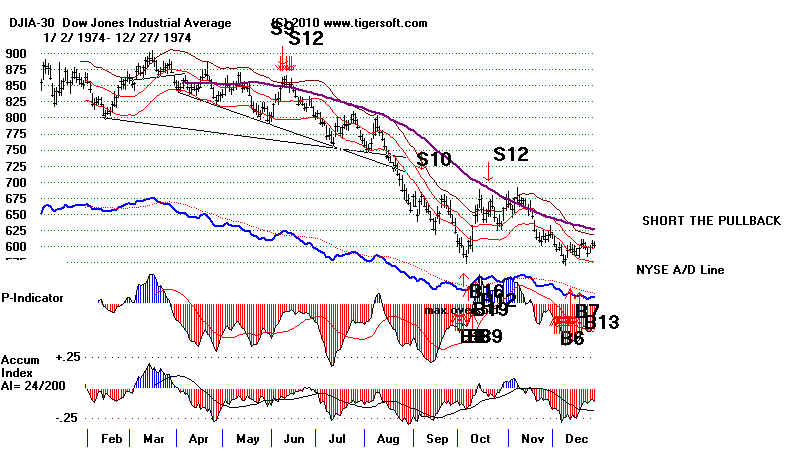
Bear market S9/S12s were generally not as powerfully bearish as bull market S9/S12s.
The average gain is only 4.6% and shorting the DJIA on these signals were
unprofitable in 5 of the 12 cases. Look for other signs of weakness to distinguish
the most bearish situations. In 1974, you can see steadily (red) negative readings
from the P-Indicator and the Accumulation Index, a head and shoulders pattern
in March 2002 and lower and lower price highs and lows in mid 1974 before the
breakdown in August.
The 1936 examples show how S9/S12s lose their potency as a decline unfolds.
Breaks in the well-tested downtrendlines of price and the A/D Line should be
considered judged Buys. Originally, they were B6/B7s, back in the 1981 version
of Peerless.
Presidential Election Year (PYE)
1936 +7.4%
PYE + 1 (1929, 1933, 1937, 1941...)
2001 -5.1%
PYE + 2 (1930, 1934, 1938, 1942...)
1934 7.0%
1934 -8.0%
1942 -5.2%
1958 -2.4%
1962 +1.2%
1966 +6.9%
1970 +0.6%
1974 +27.3%
1974 +27.1%
2002 -0.2%
PYE + 3 (1931, 1935, 1939, 1943...)
Table S12-D     Simultaneous Peerless Sell S12s/S9s: 1928-2009
                Date          DJI           Gain
-------------                 -----------   --------
#1 ...S9...S12 8/ 22/ 1934 94.3 +7.1% 1.047 .437 72 41 .062 -8 .117 Bear Market variety. P-Indicator was positive. This signal properly cancels errant B12 three days later even though P-Indicator is positive. DJI fell below the lower band to 3x tested support. -------------------------------------------------------------------- #2 ...S9...S12 9/ 27/ 1934 93.4 -8.0% Big Loss. 1.029 -.105 -40 20 -.036 -80 -.19 Bear Market variety. There is a A/D flat-topped price breakout at 97.60 on 11/7/1934 which should have been used to cover any short sales. Loss then would be 4.5% See how price channel and downtrending A/D Line trends are broken just before advance. This shows how S9/S12s lose their potency.----------------------------------------------------------------------- #3 ...S9...S12 5/ 11/ 1942 99.2 -5.2% LOSS 1.027 -.062 -42 9 -.162 -53 -.028 Bear Market variety Sell S9/S12. Break in A/D Line downtrend on 5/22/2010 at 99.20 -- No loss.
---------------------------------------------------------------------- #4 ...S9...S12 1/ 7/ 1958 447.8 -2.4% LOSS 1.027 -.049 -3 15 -.051 -192 .054 Bear Market variety Sell S9/S12. A/D Line makes a new recovery high on 1/16/1958 with DJI at 445.20 P-Indicator turns positive a few days later, which typically brings 2%-3$ rally and then decline. This is what happened. ---------------------------------------------------------------------- #5 ...S9...S12 7/ 10/ 1962 586 +1.2% 1.034 -.327 -451 -103 -.113 -139 -.147 Bear Market variety Sell S9/S12. P-Indicator turns positive a few days later, which typically brings 2%-3$ rally and then decline. This is what happened. ---------------------------------------------------------------------- #6 ...S9...S12 9/ 15/ 1966 814.3 +6.9% 1.029 -.143 -174 50 -.078 -13 -.146 Bear Market variety Sell S9/S12. Immediate decline slightly below lower band. ---------------------------------------------------------------------- #7 ...S9...S12 7/ 15/ 1970 711.66 +0.6% 1.023 .416 -87 16 -.016 -2 .193 Bear Market variety Sell S9/S12. P-Indicator turns positive a few days later, which typically brings 2%-3$ rally and then decline. This is what happened. ---------------------------------------------------------------------- #8 ...S9...S12 2/ 22/ 1974 855.99 +27.3% Reversed at 621.95 on 9/27/1974 by B8 1.027 -.214 21 7 -.083 -2 -.08 Bear Market variety Sell S9/S12. P-Indicator did turn positive and DJI rallied to 890 before zig-zagging lower.
-----------------------------------------------------------------------
#9
...S9...S12 6/ 7/ 1974 853.72 +27.1%
1.033 .039 -77 39 -.074 -2 .03
Bear Market variety Sell S9/S12.
Btoke down far below lower band after two failed rallies.
-----------------------------------------------------------------------
#10
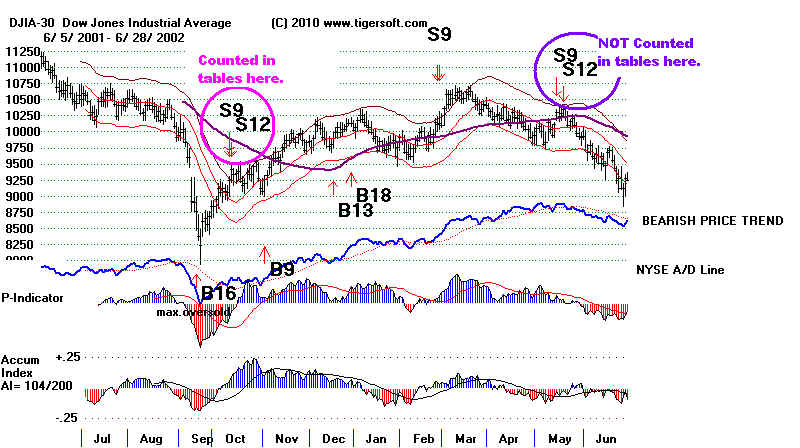
...S9...S12 4/ 10/ 2002 10102.74 -5.1% LOSS
1.031 -.128 -121 134 .053 -174 .095
===
Bear Market Sell S9/S12 variety.
P-Indicator turned positive. A/D Line broke above well-tesed resistance
on 4/18/2010 at 10615.83
----------------------------------------------------------------------
#11
...S9...S12 10/ 10/ 2001 9240.86 -0.2% LOSS
1.032 -1.049 -212 96 .053 -245 -.258
Bear Market Sell S9/S12 variety.
P-Indicator turned positive.
A/D Line had already broke above well-tesed downtrendline.
 -----------------------------------------------------------------------
==========================================================
         Number of trades =  11  Losses = 5
              Average Gain per trade = +4.6%
              There were 2 Gains of more than 20%.
              There were 3 Losses of more than 5%