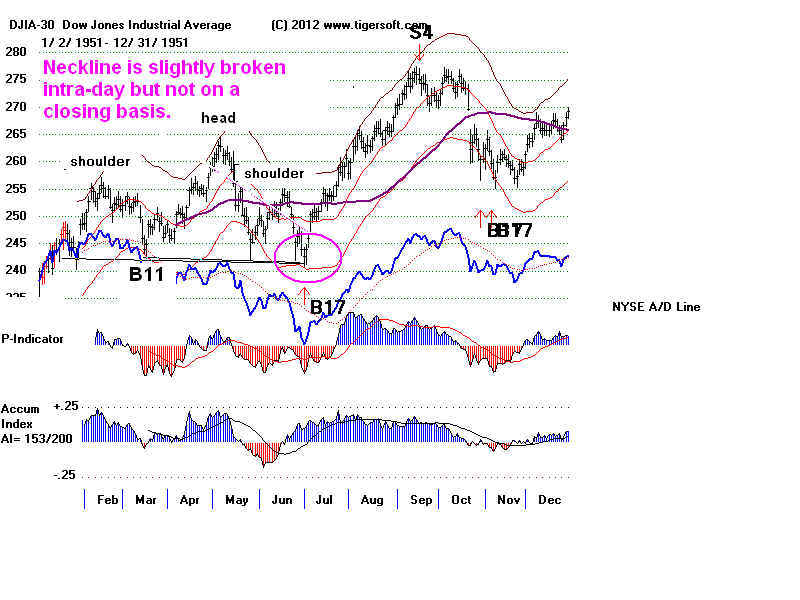
DJI closed below well-tested neckline support
in a Head and Shoulders Pattern
..... updated 4/24/2012
Nearly all the completed Head/Shoulders Sell S10s reinforce an earlier Peerless Sell.
But they should be recognized, first because they add significantly to the bearishness
of a market environment and, secondly, because they have the potential independently
to drop the stock market.
A completed head/shoulders pattern should be judged a Peerless Sell S10 when
the formation takes 30 says or longer and a Tiger Sell S5 when the pattern develops
in less time. It is not always possible for the computer to spot these patterns, mostly
because the necklines are not flat or are a little too irregular. The patterns are still
very important to watch for because of their reliabiliy as warnings of an impending decline.
The good news for readers here is that completed head and shoulders are rare
when Peerless is not already on a sell. In the 84 years between 1928 and 2012, there
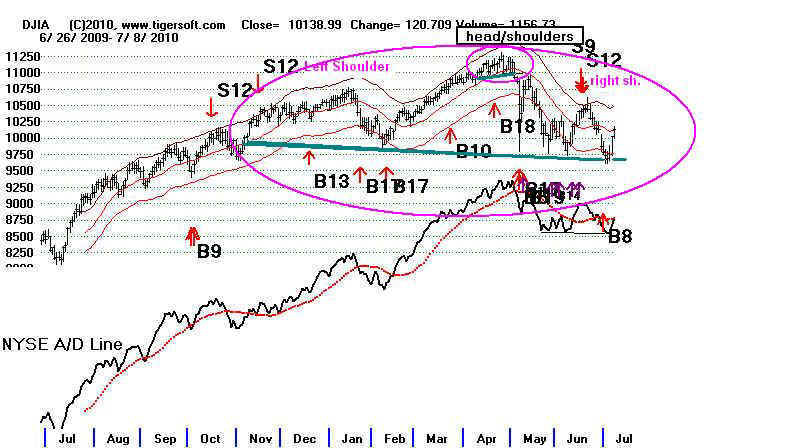
have been only one case, April 2010, in all these years when a completed
head/shoulders in a bull market brought a subsequent decline below the neckline by more
than 5%. See all the cases of reversing head/shoulders' patterns at the bottom of this page,
These show that the pattern's bearishness cannot be said to be unleashed UNTIL the
neckline of the pattern is decisively violated,
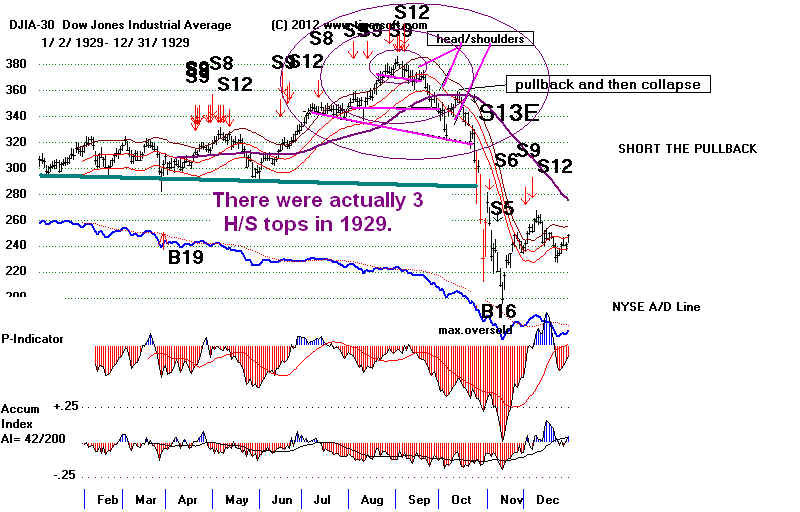
HEAD AND SHOULDERS ARE IMPORTANT
The more of these patterns that appear in the same chart or even in the same larger pattern,
the more dangerous the market must be cosidered.
There were actually 3 head/shoulders tops in 1929.
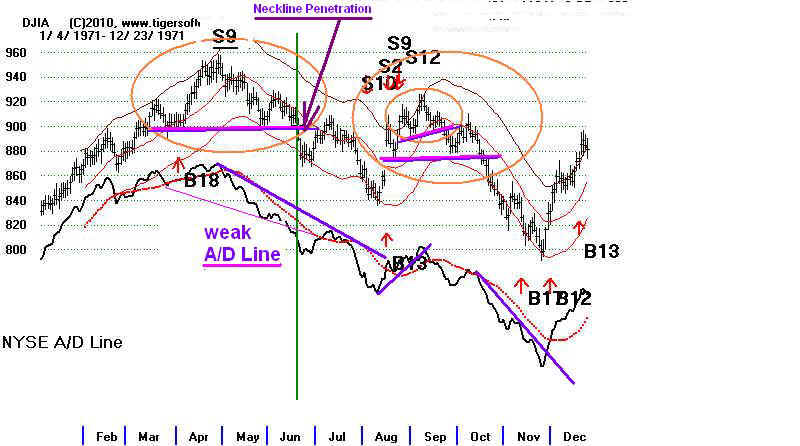
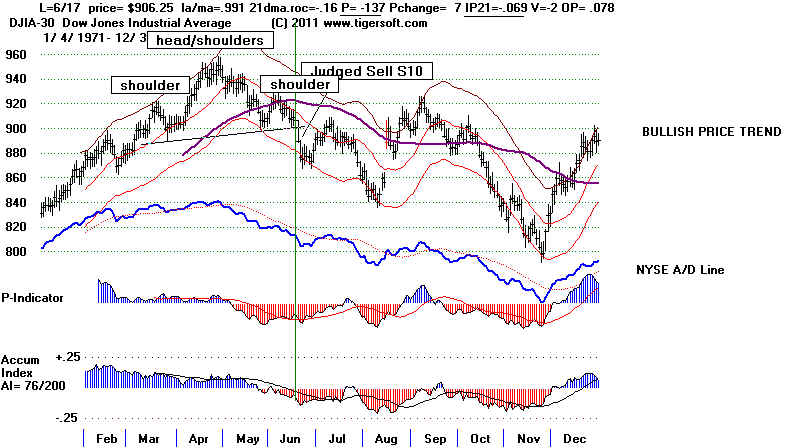
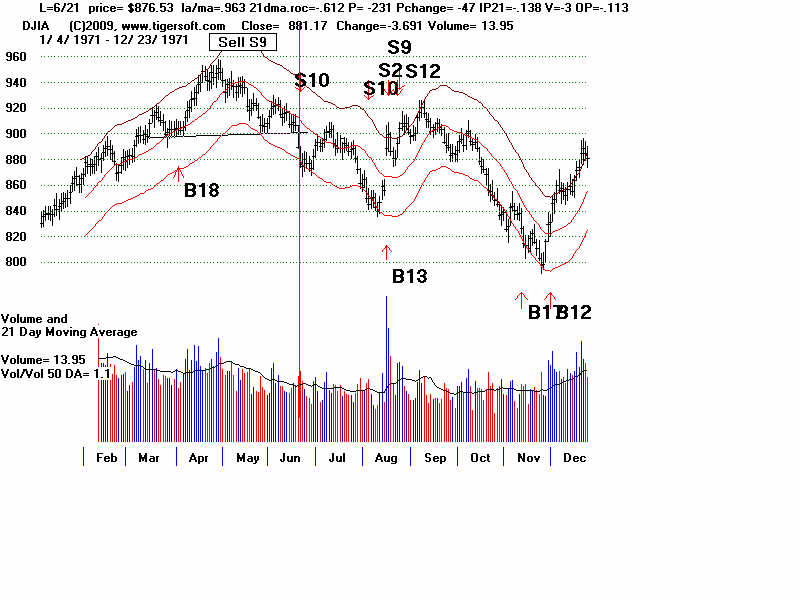
1971 produced several different head/shoulders patterns.
head/shoulders
head/shoulders
Head/Shoulders
patterns have been considered important warnings by technicians
for many years.
For example, such patterns appeared before the big declines
of 1896, 1904,
1914, 1929 and 1930. The pattern's definition is just inexact enough to make
the count of
these patterns change depending on who is doing the counting. Still,
the most
important ones should be recognized on sight.
WHAT TO LOOK FOR
In these
patterns, you will see a left shoulder, which sometimes has several humps.
Then there is a head, as prices run to new highs. But they stop suddenly and fall back
to a point near
the previous lows. This is further down than a steep price-uptrend
should normally
allow. There then follows a light volume rally. But it fails to make
a new high.
This forms a right shoulder, which also may have several humps but
usually is about
the size of, and shows the same duration as, the left shoulder.
Often we can
estimate about where the apex of the left shoulder will be by drawing
a line parallel
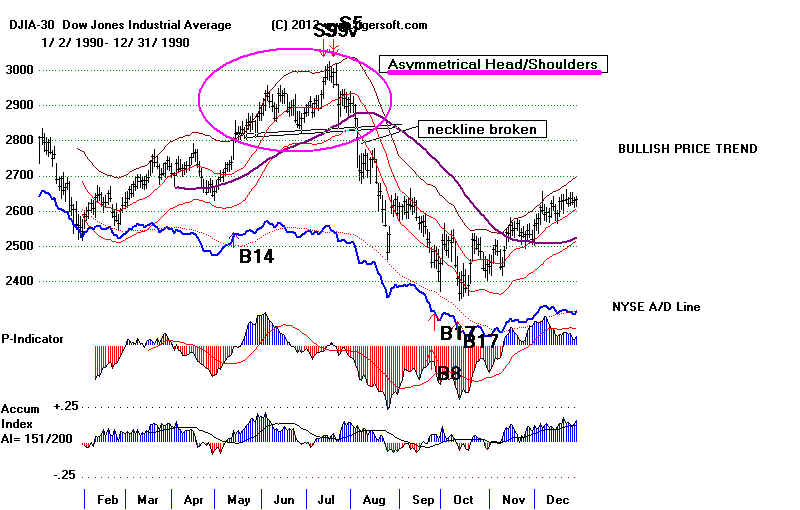
to the neckline from the apex of the right shoulder. But perfect symmetry
is probably the
exception. For example, the right shoulder was only half the size of
the left shoulder
in the 1990 H/S case shown below.
1990 Head and Shoulders Was Assymetrical
Prices must
close below the neckline to complete the head and shoulders top.
The safest
way to draw the neckline is by using the lowest hypothetical DJI lows,
but you
will see from the examples here that one can sometimes draw very
effective
lines that are nearly flat through the lowest closing prices. Note that
about a
third of all the head/shoulders formations that start are NOT completed
by a plunge
below the pattern's support line. These H/S patterns are aborted.
If the
neckline is not broken below and prices instead rise and surpass the apex
of the
right shoulder, short sellers usually cover and a good rally then ensues.
Here is a
recent study of the cases where the DJI rallies above the apex of the
right
shoulder. Link to study in
4/18/2011 Hotline.
After the
neckline is broken, expect a quick sell-off. About half of the time,
there is
then a low volume pullback towards the
neckline or the 65-day ma.
This
recovers about one half to two thirds of the amount lost from the right shoulder
apex to the
first lows made after the neckline is broken. This can be a very good
point to go
short, especially if the Accumulation Index is negative and/or the
NYSE A/D
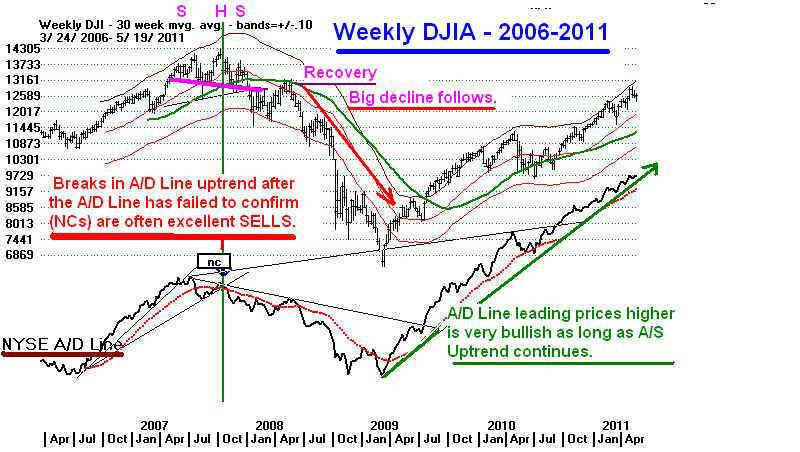
Line is lagging. In such cases, only after the minor pullback fails, do prices
then
decline most precipitously. Weekly DJI charts show this, too. The 2007 peak
showed a
H/S top if one used the weekly closing prices to form the neckline.
------------------------------------------------------------------------------------------------------------------------------------------------------
WARNING:
DO NOT DEPEND ONLY ON H/S PATTERNS TO KNOW WHEN TO SELL.
IMPORTANT:
These H/S patterns occur just often enough to give the some
chartists the
sense that all they have to do is wait for a head and shoulders pattern
to know when to
sell. This is not correct. More tops are not formed
this way.
Readers should
use all our Peerless Sell Signals and know that when there is
afterwards also a
major price-support failure, a substantial decline and/or a bear market
will follow.
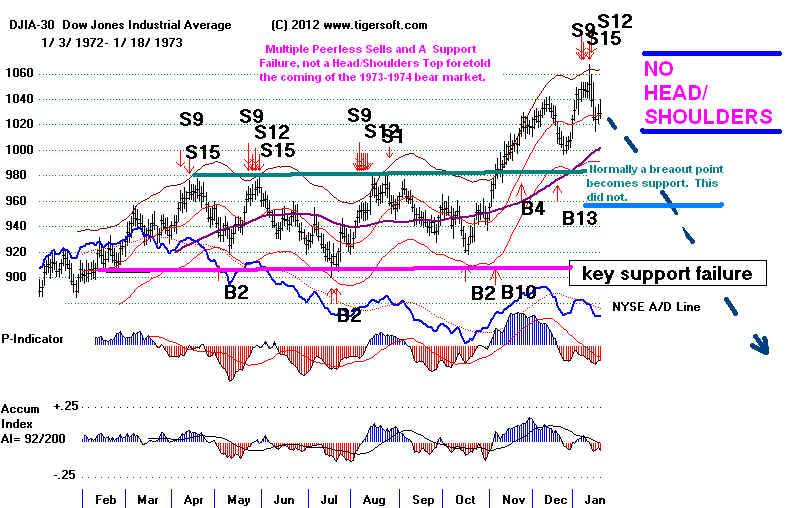
For example, there was no H/S top before the long 1973-1974 bear market.
To see how many
other types of market tops there are, other than H/S tops, look
at the
charts at http://alphaim.net/research/Pres_Cycle/index.html
------------------------------------------------------------------------------------------------------------------------------------------------------
HEAD AND SHOULDERS ARE IMPORTANT
The duration of
H/S patterns varies enormously. Day traders spot these patterns, too.
Our 5-year charts
of the DJI show plenty of them. They will be circled in red at
this site.
http://tigersoftware.com/TigerBlogs/May15,2011/index.html
Most can be
readily seen on a year's chart of daily data and last 10-75 trading days.
Lots of
examples are shown below.
The height
of the pattern, from the apex in the "head" to the neckline-support,
should be
measured. Subtract this amount from the point of breakdown below
the
neckline and get a minimum downside objective. Most times, a much bigger
decline
follows.
These H/S
patterns are very important to traders and investors. They are, I contend, the
market's way of
coping with suddenly bearish news that it does not expect. Most often,
when the DJI is
completing a head/shoulders pattern, the A/D Line will be weaker
than the DJI.
The P-Indicator and the Accumulation Index will usually be negative on the
right shoulder.
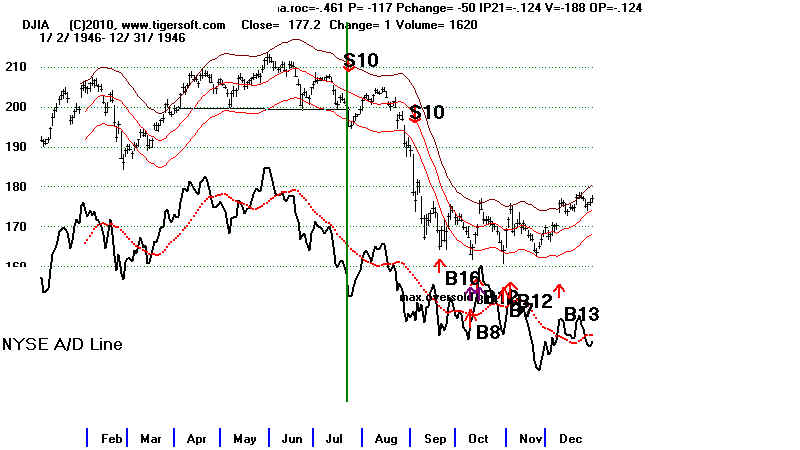
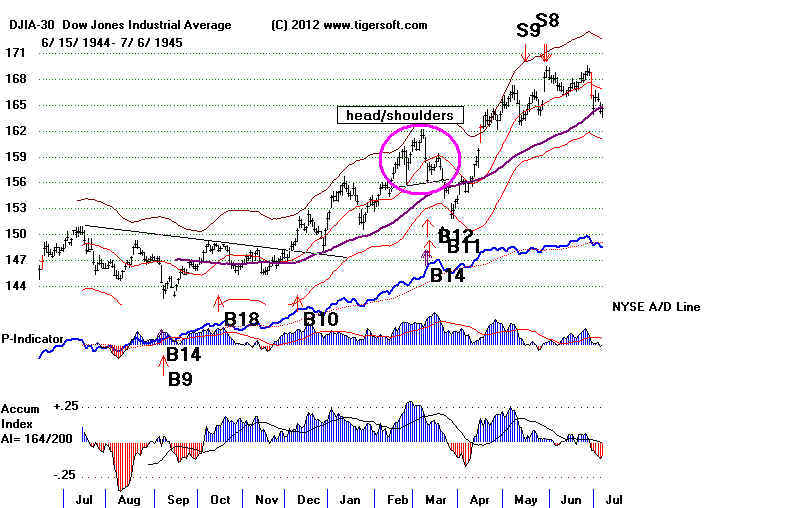
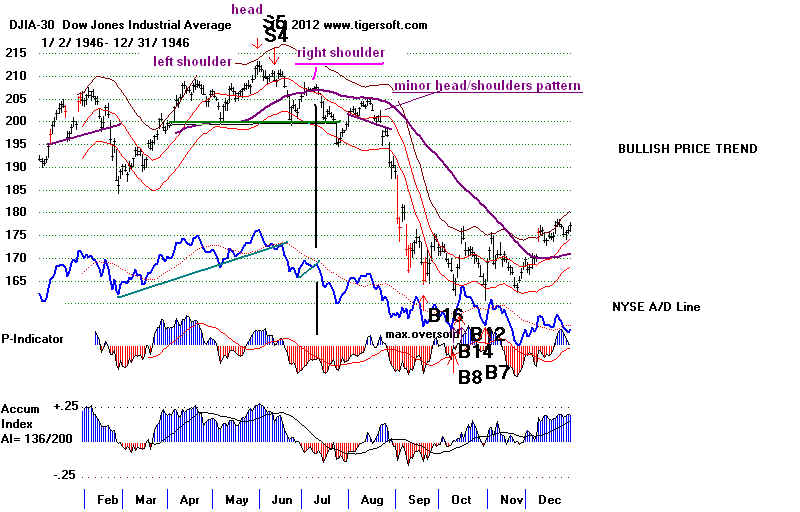
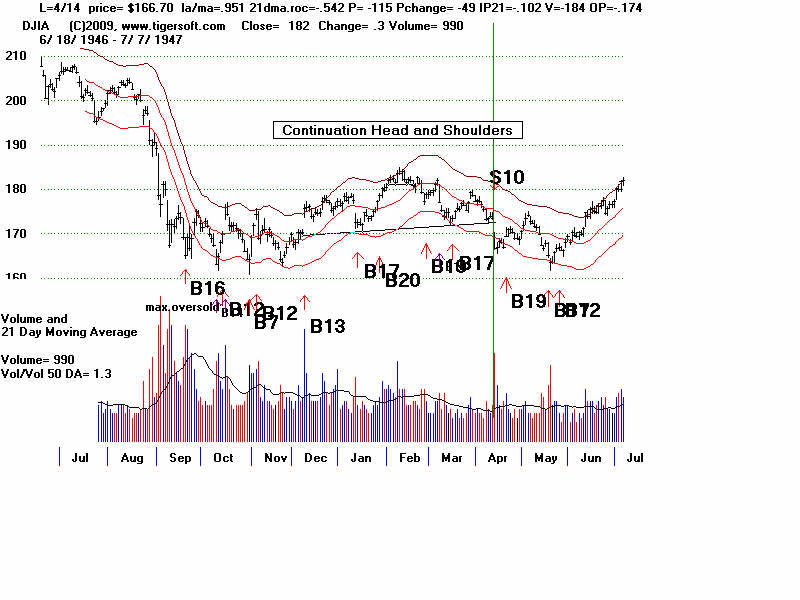
In the next
chart, see how the DJI broke below the neckline in July 1946. That
should have been
taken as a reinforcing Sell S10. ("Reinforcing", because the
DJI was already
on a Sell). Almost immediately, the DJI recovered back to the
resistance of the
65-day ma and formed a much smaller H/S pattern. The breakdown
in this second
pattern's neckline produced a dramatic, nearly vertical decline.
This decline was
so quick, there was even a Congressional investigation shortly
afterwards into
who was manipulating the stock market then.

Head and Shoulders Predict Bad News for Stocks
Some would say
that the pattern's well-known bearishness makes them self-fulfilling.
But there is more
to them than this. They often occur before very significant news, which
may take Wall
Street by surprise: invasions, attacks on US (Pearl Harbor) or allies
(Iraq invasion of
oil rich Kuwait in 1990), the Cuban Missile Crisis in 1990, going off
Gold Standard in
1990, World Trade Center bombing 2001, Presidential heart attacks
and assasinations
(JFK in 1963), as well as BP's massive oil spill in the Gulf in 2010..
Labor unrest can
cause a head/shoulders. 1946 saw more labor strikes than in any year in
American history. Corporate
profits and Wall Street felt threatened. Union membership
doubled, from 7.2
million in 1940 to 14.5 million at the end of World War II. There had
been a no strike
pledge during the war. After the war, pent-up grievances found
expression in
strikes. A wave of strikes spread seeeminly everywhere and from oil
workers to
railroad workers and coal miners. Then in September 1946, longshoremen
shut down most of
the entire West coast and a general strike was called in Oakland
in December
1946.
So, H/S patterns
give you advance warnings when the stock market is weakening
and news will
soon hit that is likely to drop the stock market. What we spot is
Big Money takes
profits over a period of time, so much so that significant new highs
can no longer be
made. Stocks are being distributed to the less informed in the process
of the
head/shoulders pattern. What the Public thinks is a pause before another advance
is actually a
lull before a storm. When the price neckline is broken, the market can no
longer be held
up. Patient big money distribution turns to hasty big money dumping
and then
institutional and public panic. Volume picks up dramatically.
Learn to spot the
insider and professional, big money selling:
1.
Initially, heavy big money selling causes the stock or the market to fall below the last
high.
Normally in a bull market, the most recent point of breakout acts as support
if the uptrend is
likely to continue,
2. Then, there is
a rally, but the recovery is quickly over-powered by the selling
on strength.
As a result, the DJI falls back and closes near its dailly lows. This causes
of Accumulation
Index to register negative, Red
Distribution on the right
shoulder.
3. If we look at
the ETF for the DIA, the Blue Closing Power will be declining. Professionals
are selling after
the opening, making prices drop far below openings. You can also see
the heavy
professional selling in Tiger candlesticks charts, as red trading days instead of
blue days.
A HISTORY OF
DJI HEAD AND SHOULDER PATTERNS
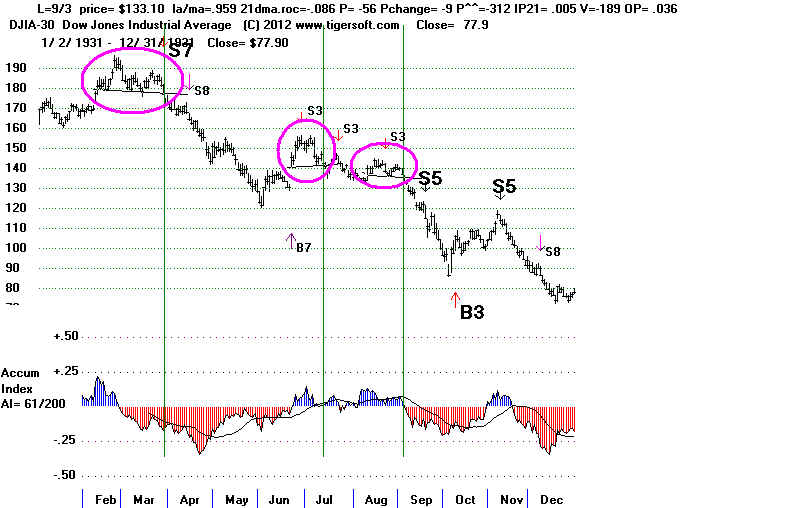
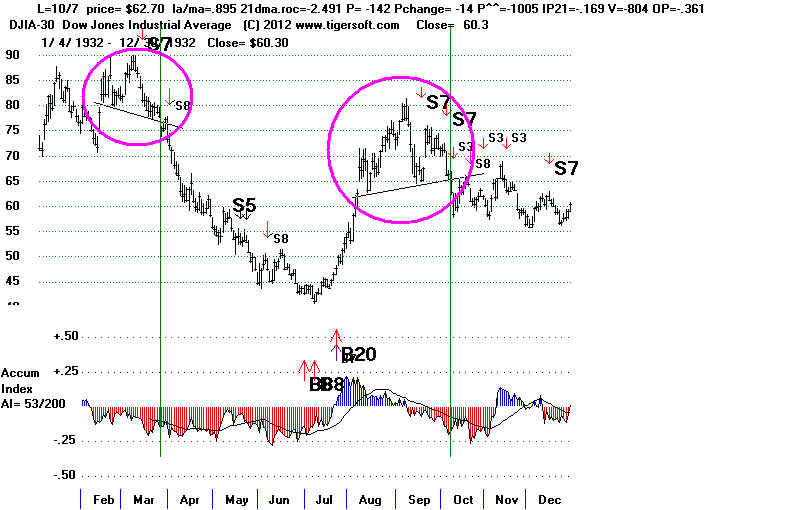
Date cl/ma roc P Pch IP21 V Opct 1. 9/19/1929 .993 .07 -44 -2 -.114 -581 -.065 3/26/1931 .987 -.581 -46 -1 -.144 -379 -.242 3/23/1932 .948 -.244 -61 7 -.098 -251 .038 10/5/1932 .926 -1.185 -105 -20 -.145 -676 -.342 10/6/1941 .99 -.131 -14 -4 -.179 -62 -.192 7/22/1946 .982 0 -67 21 .001 -116 .023 breakdown fails short-term 8/21/1946 .994 .284 47 30 .122 2 .201 2/11/1952 .989 -.079 9 -16 .04 -97 .097 4/14/1952 .995 -.004 -52 -26 .013 -15 -.018 7/26/1957 1.00 .32 0 -9 .072 -134 .274 (minor pattern) 8/17/1959 .989 .023 -31 4 -.034 280 .155 breakdown failed. 9/4/1959 .994 -.359 -93 10 -.056 -387 -.097 4/11/1962 .98 -.362 -132 -3 .181 -533 -.398 big decline 6/26/1963 .984 -.153 -51 -23 -.093 -498 -.052 11/14/1963 .994 -.076 -36 -11 -.027 -539 +.11 (limited decline, 6/17/1971 .991 -.16 -137 7 -.069 -2 .073 10/13/1971 .993 -.171 -57 20 -.07 -1 -.05 3/26/1997 .993 -.27 -183 -8 -.008 -46 -.166 10/23/1997 .98 -.088 -10 -87 .057 -32 .012 only brief decline. 7/31/1998 .976 -.216 -351 -124 -.026 -96 -.149 6/12/2001 .989 .137 156 19 .103 -63 .269 3mo before 9/11. 9/16/2002 .970 -.602 109 -53 .061 -103 -.123 11/29/2010 .987 -.065 40 -26 .154 -83 .118 NO Breakdown. Rally followed. 11/15/2007 .98 -.449 -286 -163 .05 -252 -.237 12/28/2007 .997 .068 -13 -114 .003 -77 .319 5/28/2008 .996 .003 190 -26 .027 -39 .047 7/6/2009 .975 -.592 -101 -108 -.096 -161 -.221 No breakdown. Rally. 6/24/2011 .984 -.451 -77 -87 -.143 -184 -.063 |
 Internal Strength Readings The Day before A Head/Shoulders Pattern
Is Completed by a CLose below the Neckline: 1929-2011
Internal Strength Readings The Day before A Head/Shoulders Pattern
Is Completed by a CLose below the Neckline: 1929-2011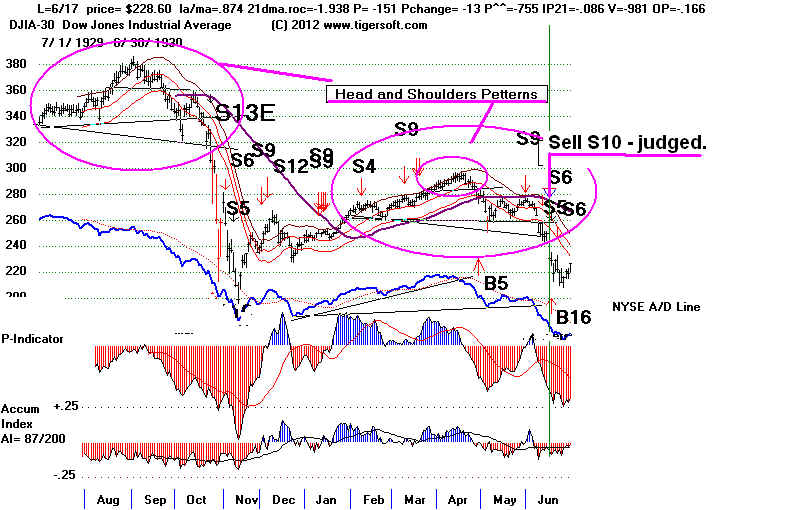 Continuation Head/Shoulders
Date DJI cl/ma roc P Pch IP21 V Opct
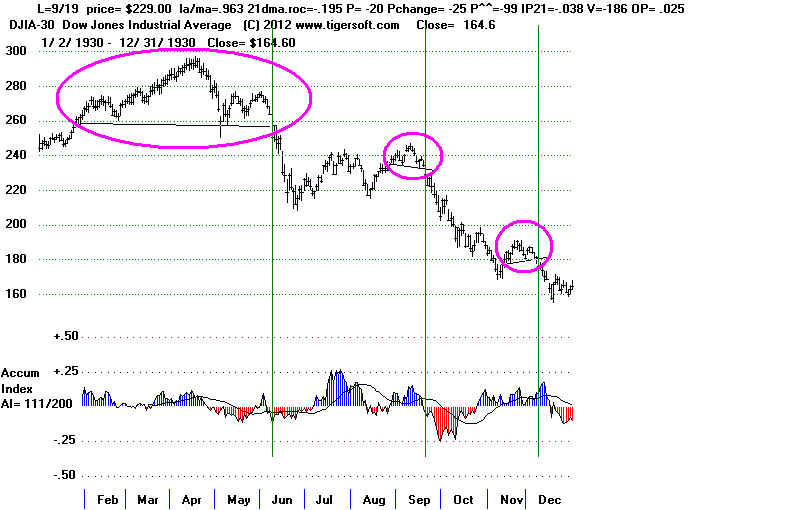
3 9/19/1930 229 .963 -.195 -20 -25 -.038 -186 .025
Continuation Head/Shoulders
Date DJI cl/ma roc P Pch IP21 V Opct
4 12/9/1930 176.50 .969 -.137 -36 18 -.146 -230 .085
Continuation Head/Shoulders
Date DJI cl/ma roc P Pch IP21 V Opct
3 9/19/1930 229 .963 -.195 -20 -25 -.038 -186 .025
Continuation Head/Shoulders
Date DJI cl/ma roc P Pch IP21 V Opct
4 12/9/1930 176.50 .969 -.137 -36 18 -.146 -230 .085
 8/27/1937 175.90 .95 -.456 -124 -17 -.131 -177 .004
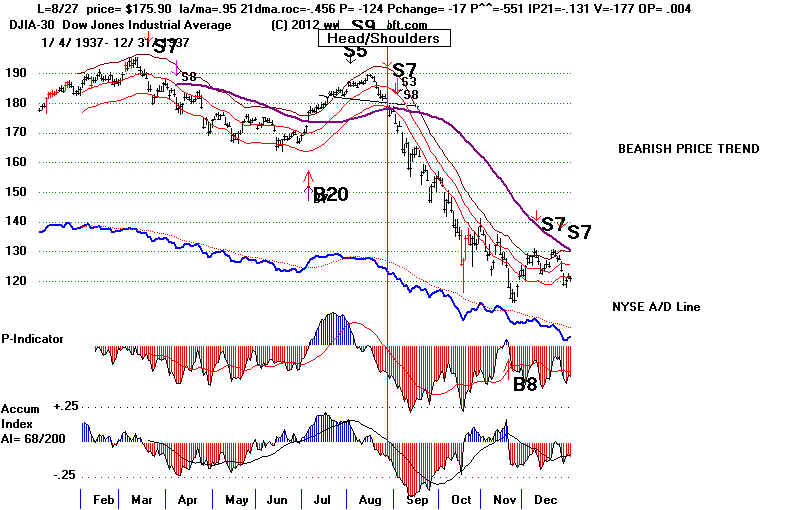 3/29/1939 .958 -.611 -26 -9 -.046 -108 -.15
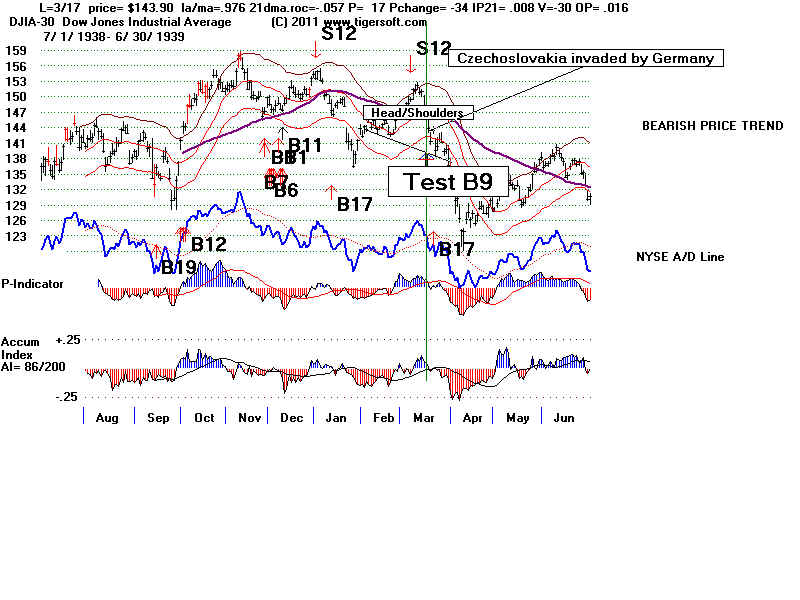 6/27/1939 .987 -.061 -24 -8 .094 -41 .198
10/22/1929 .953 -1.125 -129 28 -.132 -986 -.321
6/11/1939 .93 -.934 -84 -25 -.054 -606 .113
6/27/1939 .987 -.061 -24 -8 .094 -41 .198
10/22/1929 .953 -1.125 -129 28 -.132 -986 -.321
6/11/1939 .93 -.934 -84 -25 -.054 -606 .113
How serious is the Sell S10? There were 15 earlier cases of Sell S10 when there was a
head and shoulders pattern and the DJI was not down more than 10%. In 14 of 15 the DJI fell
more than 5%. In 8 of the 16 cases the DJI fell more than 10% in the following 6 months.
Will there be much of a rebound?
In 10 of 15 cases there is a rebound before the big decline develops. But waiting for a rebound
is risky. In the five cases there was no rebound, prices swooned badly. When down-day volume
does not pick up on the break of the neckline by much, there is more likely to be a rebound.
Only in two cases, 1946 and 1971, was the a recovery rally of about 5% from where the Sell S10
occurred.
The absence of a previous S9 or S12 does not preclude a serious decline. Look at the cases of 1946
and 1962 for example. No previous sell signal occurred, yet big declines followed the completion
of these head and shoulers patterns.
In all but 1 of the 15 earlier S10 head and shoulders SELLs the NYSE A/D Line made at least
a 6 week new low at the time of the signal. In the one exeption, the decline was a relatively
small 6.7%.
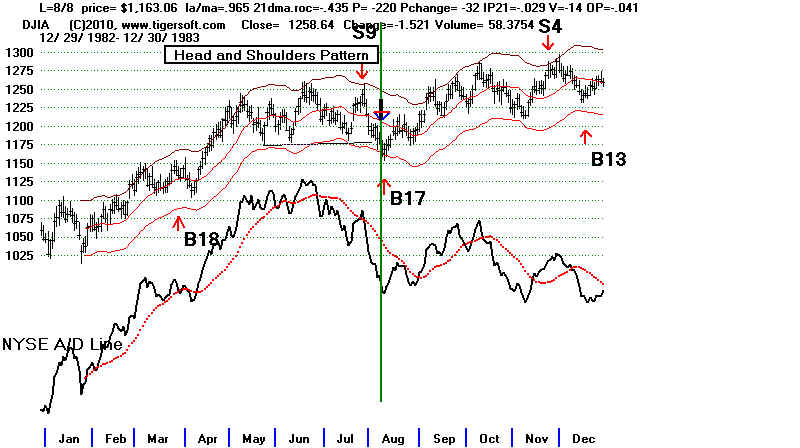
A new Buy B17 Signal (as in 1983) in the bullish month of July coupled with a rise back above
the neckline is your alert to the fact that the head and shoulders pattern has dailed and
a rally will quickly force shorts to cover.
Here are the cases gain of the 15 earlier cases. Click on the links to see their charts.
This should help you see what the market is up against.
Charts Rebound Rally? Ealier Sell?
1. 9/26/1930 213.30 DJI fell to 157.5 on 12/16/30 No S9/S12
LA/MA=.90 21-dma= -1.242 P=-58 IP21= -.148 V=-550 OPct=-.259
A/D Line simultaneously made a 9 month low.
(There were two Head and Shoulder patterns in previous three months)
Decline was more than 10%
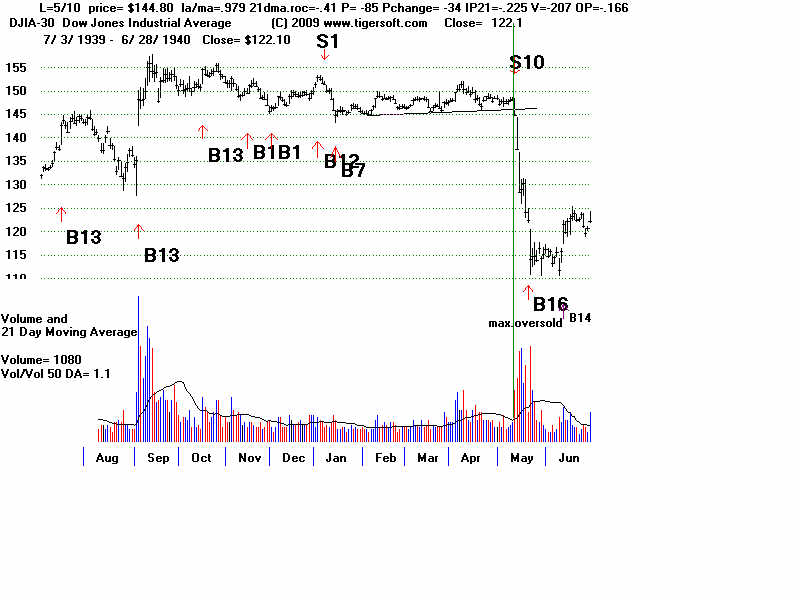
2 5/10/1940 144.80 DJI fell to 111.80 in a month... No None
LA/MA= .979 21-dma= -0.41 P=-85 IP21= -.225 V=-207 OPct= +.069
A/D Line simultaneously made a 10 week low.
(Head and Shoulders Pattern.)
Decline is more than 10%
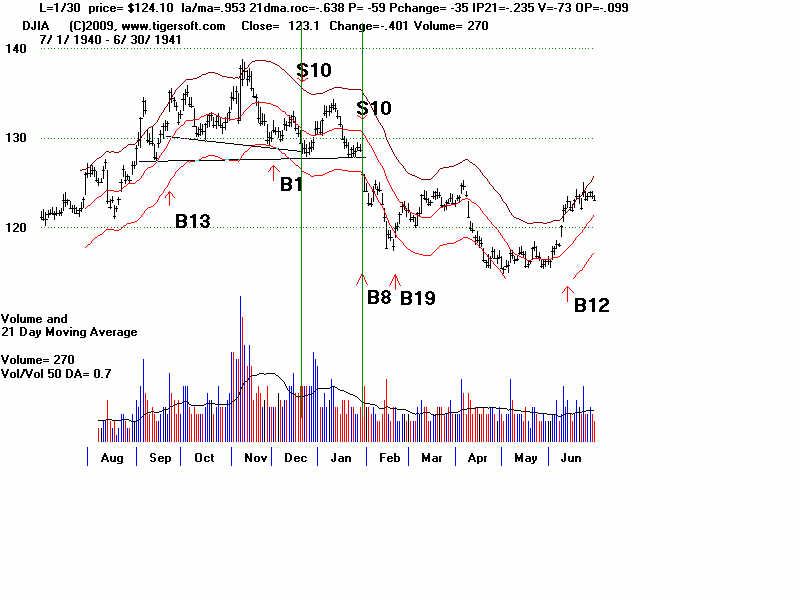
3. 1/29/1941 126.00 DJI fell to 115.50 on 4/20/40 Yes - rally to 124.60 Earlier Sell S10
LA/MA= .965 21-dma= -0.455 P=-24 IP21= -.182 V= -39 OPct= +.056
A/D Line simultaneously made a 10 week low.
(Head and Shoulders Pattern.)
Decline was more than 10%
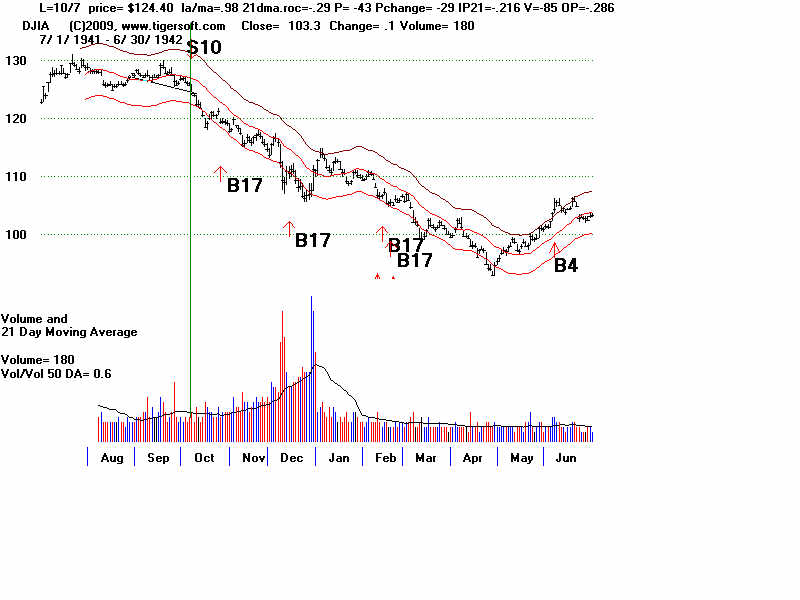
4. 10/7/1941 124.40 DJI fell to 93.90 on 4/27/42 No None
LA/MA= .98 21-dma= -0.29 P=-43 IP21= -.216 V= -85 OPct= -.323
A/D Line simultaneously made a 5 week low.
(Head and Shoulders Pattern.)
Decline is more than 10%
5 7/23/1946 195.20 DJI fell to 163.10 on 10/19/1946 Yes - rally to 204.00 None
LA/MA= .958 21-dma= -0.461 P= -117 IP21= -.124 V= -188 OPct= -.111
A/D Line simultaneously made a 4 month low.
(Head and Shoulders Pattern.)
Decline is more than 10%
6. 4/11/1947 173.40 DJI fell to 163.60 on 5/20/1947 Yes - rally to 174.20 None
LA/MA= .951 21-dma= -0.951 P= -115 IP21= -.102 V= -184 OPct= -.174
A/D Line simultaneously made a 10 week low.
(Head and Shoulders Pattern.)
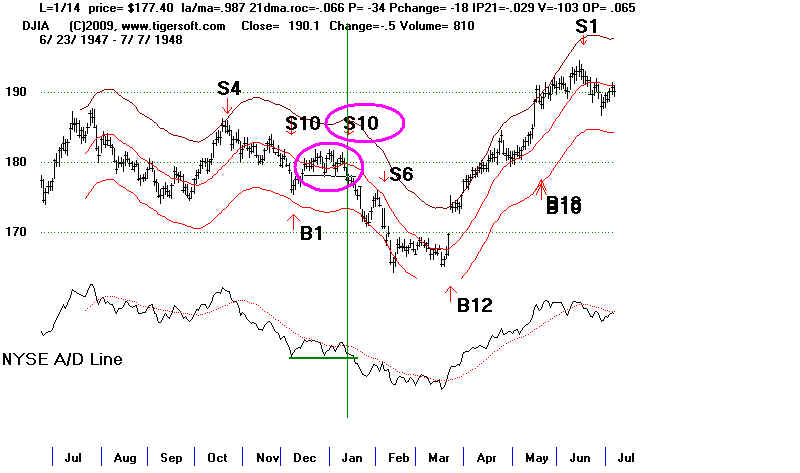
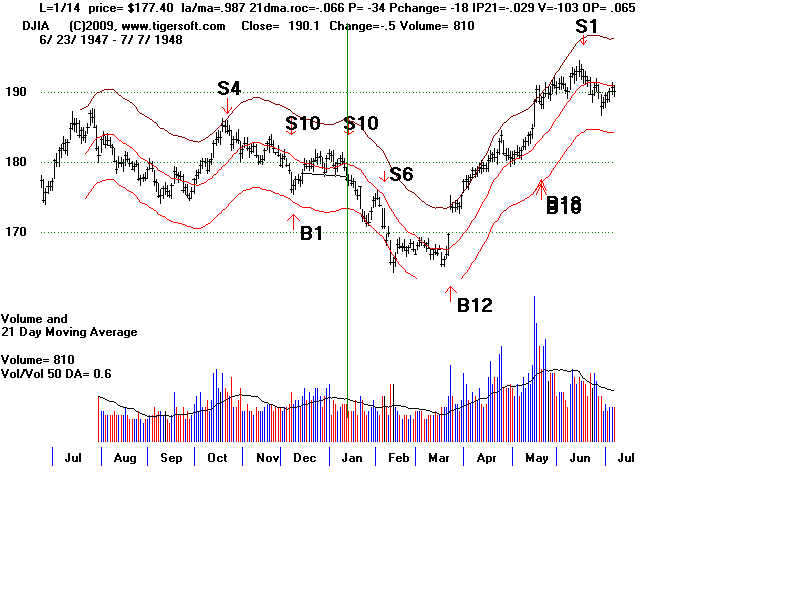
7. 1/14/1948 177.40 DJI fell to 165.40 on 3/16/1948 Yes...rally to 173.90 Earlier S10
LA/MA= .987 21-dma= -0.066 P= -34 IP21= -.029 V= -103 OPct= +..065
A/D Line DID NOT simultaneously made a 6 week low.
(Head and Shoulders Pattern.) 6.7% decline to February 1948 low at 165.
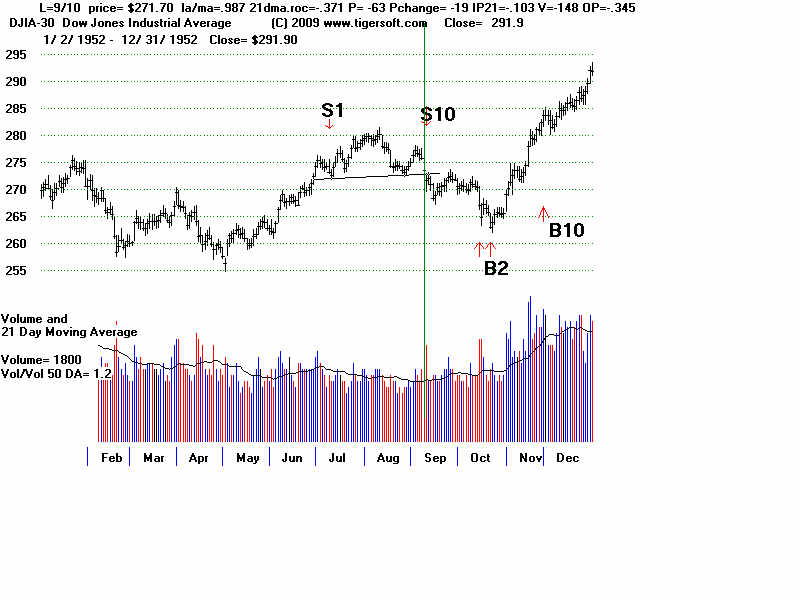
8. 9/10/1952 271.70 DJI fell to 263.10 on 10/22/1950 Yes .. rally to 272.40 Earlier S1
LA/MA= .987 21-dma= -0.371 P= -63 IP21= -.103 V= -148 OPct= -..345
A/D Line simultaneously made a 10 week low
(Head and Shoulders Pattern.) Closed out with a 1.7% gain.
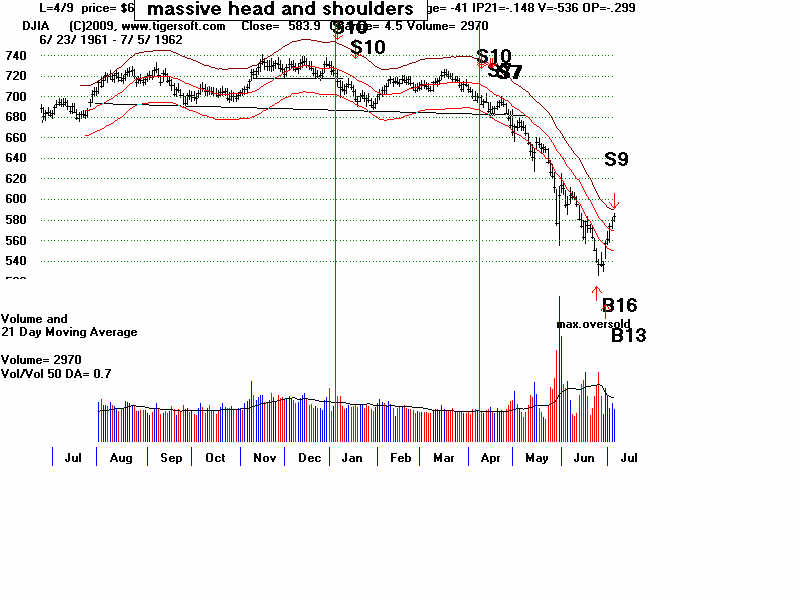
9. 1/5/1962 714.80 DJI fell to 535.70 on 6/26/62 Yes ... rally to 722.30 None
(Also S10 1/17/61 at 697.40)
LA/MA= .983 21-dma= -0271 P= -100 IP21= -.104 V= -591 OPct= -.045
A/D Line simultaneously made a 7 week low
(Head and Shoulders pattern.)
Decline is more than 10%
10. 4/9/1962 692.90 DJI fell to to 535.70 on 6/26/62 Yes ... rally to 694.60 None
LA/MA= .974 21-dma= -359 P= -100 IP21= -.148 V= -536 OPct= -.299
A/D Line simultaneously made a 10 month low
(Head and Shoulders pattern.)
Decline is more than 10%
11. 6/21/1971 876.53 DJI fell to 797.97 on 11/23/71 Yes...rally to 920.93 Earlier S9
LA/MA= .963 21-dma= -.912 P= -47 IP21= -.138 V= -3 OPct= -.133
A/D Line simultaneously made a 4.5 month low
(A clear head and shoulders pattern.)
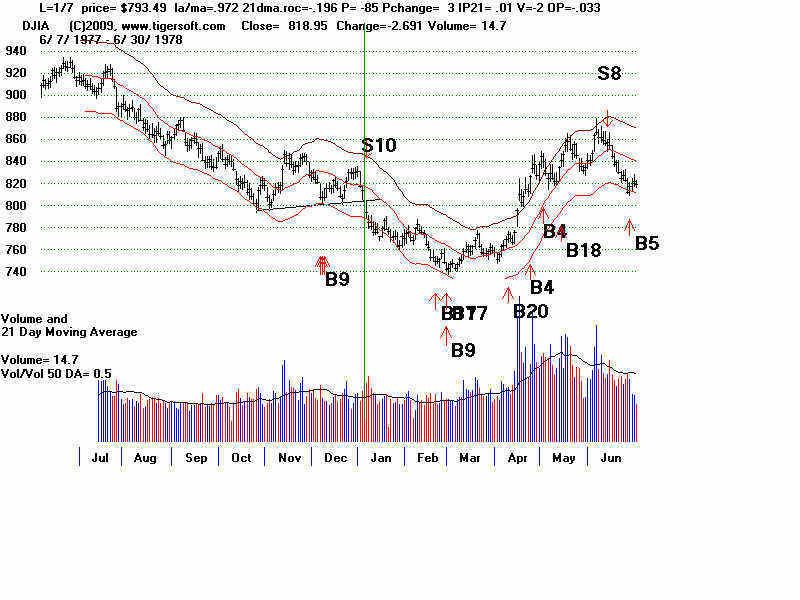
12 1/7/1977 793.49 DJI fell to743.33 on 3/1/1978 None None
LA/MA= .972 21-dma= -.196 P= +3 IP21= .01 V= -2 OPct= -.033
A/D Line simultaneously made a 6 week low
(Continuation Head and shoulders Pattern.)
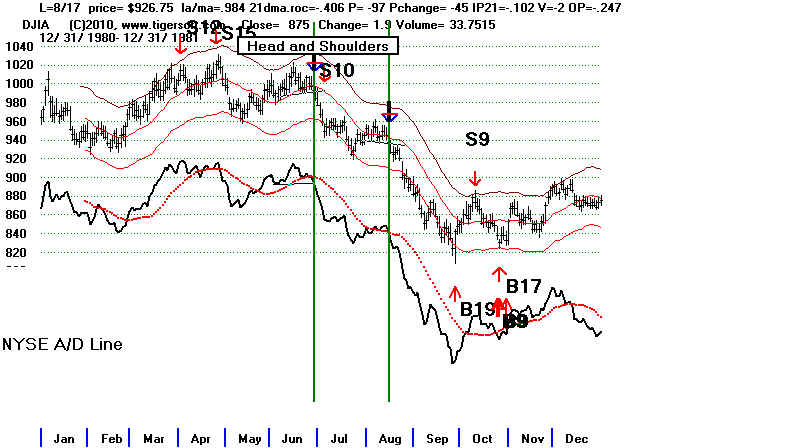
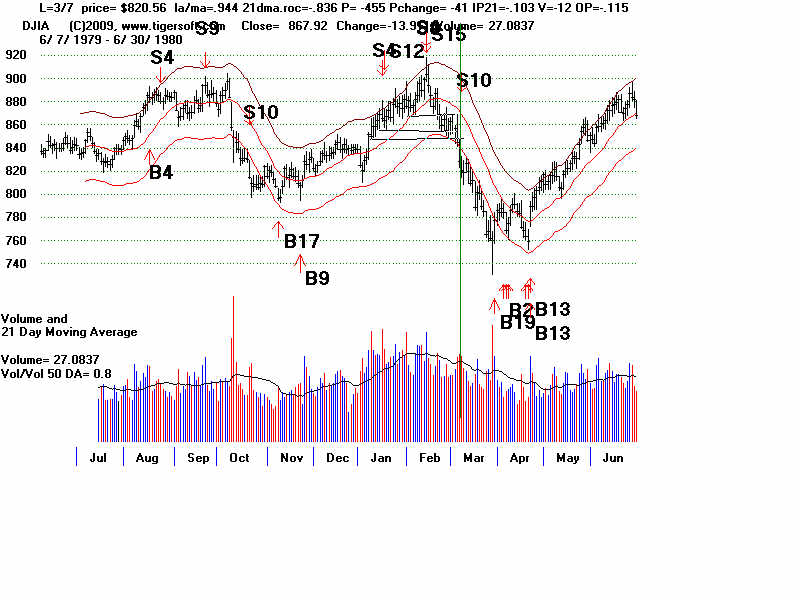
13 3/7/1980 820.56 DJI fell to 759.13 on 4/21/79 None Earlier S9/S12/S15
LA/MA= .944 21-dma= -.836 P= -455 IP21= -.103 V= -12 OPct= -.155
A/D Line simultaneously made a 8 month low
(A Head and Shoulders Pattern).
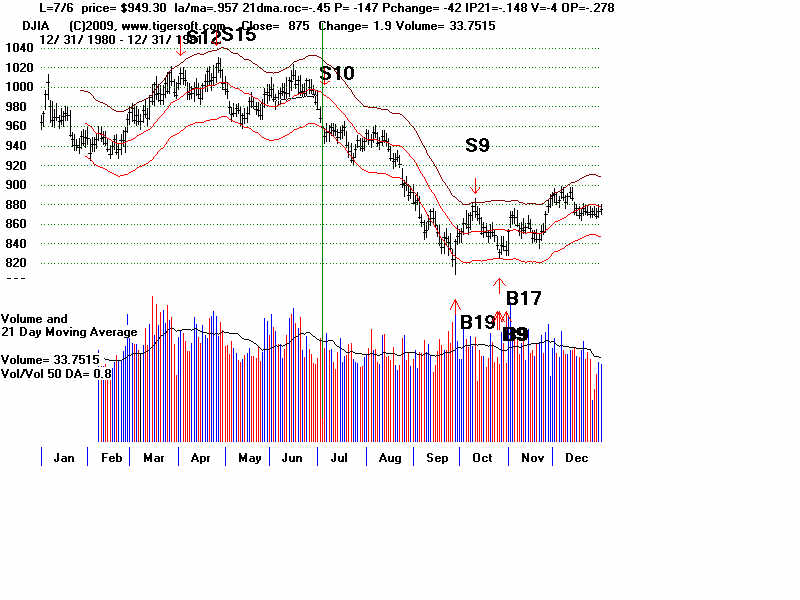
14. 7/6/1981 949.30 DJI fell to 824.01 on 9/25/81 Yes...rally to 952.91 Earlier S12/S15
LA/MA= .957 21-dma= -.45 P= -147 IP21= -.148 V= -4 OPct= -.278
A/D Line simultaneously made a 14 week low
(Head and Shoulders Pattern).
Decline is more than 10%
1983 - False Breakdown even when A/D Line confirms breakdown.
The Buy B17, the fact that it was Summer and the failire of the breakdown were the key bullish elements here.
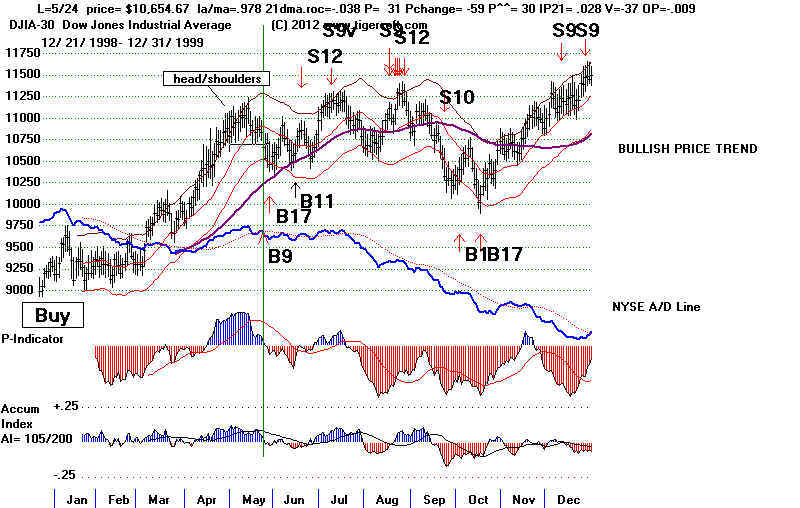
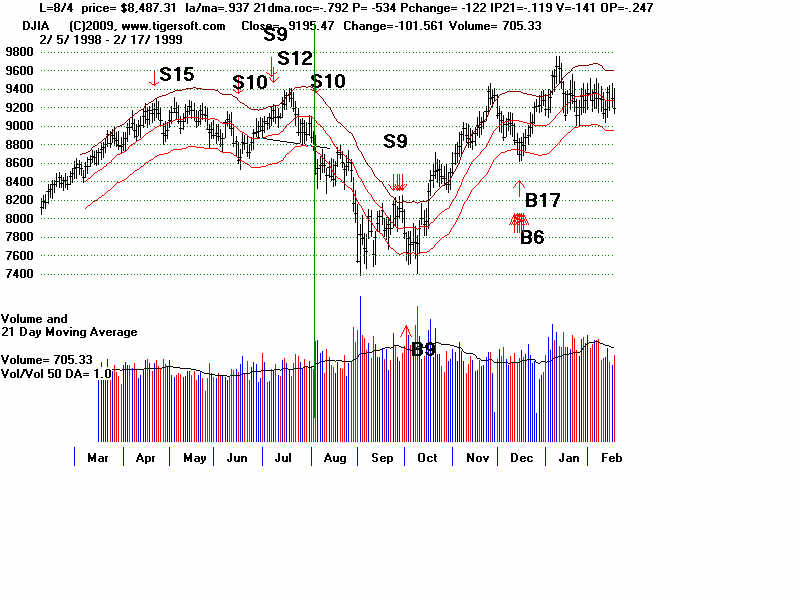
15. 8/4/1998 9195.47 DJI fell to 7539.07 on 8/31/98. Yes .. rally to 8714.65 Earlier S9/S12
LA/MA= .937 21-dma= -.792 P= -534 IP21= -.119 V= -141 OPct= -.247
A/D Line simultaneously made a 6 month low
(Head and Shoulders Pattern).
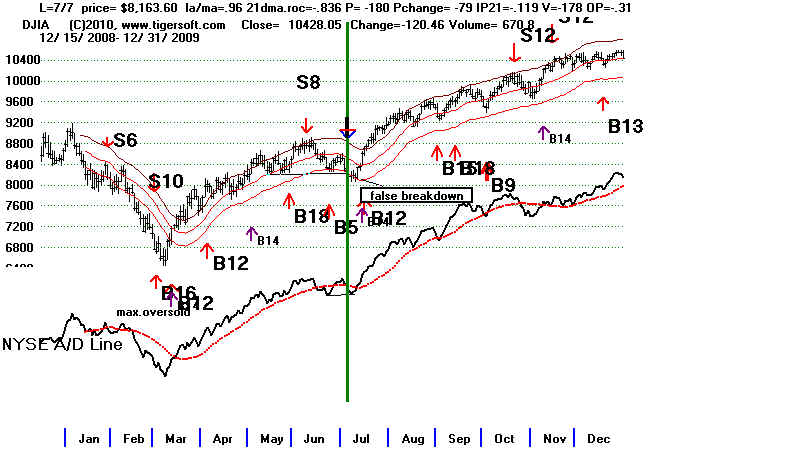
Decline is more than 10%
16. 7/7/2009 8163.60 DJI rose quickly when neckline exceeded.
LA/MA= .96 21-dma= -.836 P= -180 IP21= -.119 V= -178 OPct= -.306
A/D Line DID NOT simultaneously made a 6 week low.
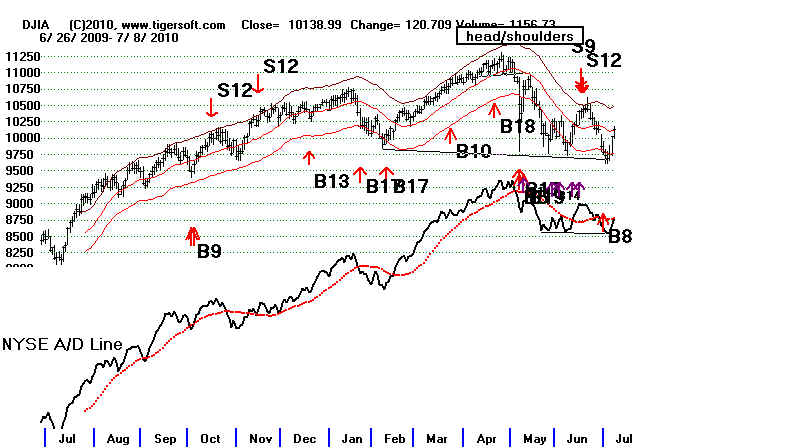
16. 7/1/2010 9732.53
LA/MA= .96 21-dma= -.605 P= -140 IP21= -.106 V= -231 OPct= -.195
The DJI was down more than 13% from its high.
DJI did not break below neckline decisively and clearly.
A/D Line DID NOT simultaneously made a 6 week low.
INDEPENDENT HEAD/SHOULDER TOPS THAT MIGHT BE CONSIDERED AS REVERSING A PEERLESS BUY.
|

There are other Sell S10s. Some of
them have Head and Shoulders tops and some do not.
Here are those not covered by the
first set of parameters shown above. S10s are to be
cancelled if there is a Buy B16 a
few days before the S10, as in April 1931..
1. 1/24/1929
No
Warlier S8/S9
LA/MA= .937 21-dma= -.792 P= -534 IP21= -.119 V= -141 OPct= -.247
A/D Line simultaneously made a 6 month low
(Head
and Shoulders Pattern).
Decline is more than 10%
2 9/14/1931 121.30
LA/MA= .891 21-dma= -1.642 P= -125 IP21= -.008 V= -443 OPct= -.273
A/D Line simultaneously made a 6 month low
(This
was NOT a Head and Shoulders Pattern).
Decline is more than 10%
3. 11/25/1931 94.20
LA/MA= .896 21-dma= -1.375 P= -81 IP21= -.133 V= -314 OPct= -.105
A/D Line simultaneously made a 6 month low
(This
was NOT a Head and Shoulders Pattern).
Decline is more than 10%
4. 4/1/1932 72.29
LA/MA= .894 21-dma= -2.062 P= -121 IP21= -.223 V= -422 OPct= -.359
A/D Line simultaneously made a 6 month low
(This was NOT a Head and Shoulders Pattern).
Decline is more than 10%
http://alphaim.net/research/Pres_Cycle/Year_4/4_DJI_Stacked.html
http://alphaim.net/research/Pres_Cycle/index.html