The Upper Band and Accumulation Index Is
Still Negative.
(C) December 21 2013 William Schmidt, Ph.D.
There have been 82 Sell S9s since 1928. The average decline on a Sell S9
was 8.6% at the time of the next Peerless Buy signal. Janauary saw the
most Sell S12s ( 22 ). An average decline in this month was 9.0%. There
were 9 January S12s in the year after the Presidential Election and 6 in
the Second year of the Presidential Election cycle. They gained 10.7%
and 8.7%, respectively. These Sell S12s, thus, help us watch out for a
pivoting down by the market in these years.
The 2nd Year in the Presidential 4-year cycle saw the most Sell S12s of any
of these four years. December Sell S9s were generally the weakest.
Their declines averaged only 3.8% in 7 instances.
Size of profits if one shorted on
a Sell S12 and covered on the next Buy signal
-----------------------------------------------------------------------
>10% 22 26.8%
>5%-9.99% 32 39.0%
>2%-4.99% 15 18.3%
0% - 1.99% 6 7.3%
losses 7 8.5% 1 was loss was 4%.
-----------------------------
82
19290130 S12 312.6 .039
19290430 S12 319.3 .081
19290617 S12 319.3 -.029
19290828 S12 372.1 .436
19320909 S12 76.2 .083
19330106 S12 62.9 .183
19330117 S12 61.8 .168
19330705 S12 102.2 .058
19330719 S12 103.6 .07
19330817 S12 99.4 -.008
19331117 S12 98.1 .009
19331206 S12 101.3 .04
19340205 S12 110.7 .171
19340821 S12 92.6 .064
19340925 S12 92.7 -.028
19341005 S12 92.9 -.026
19350104 S12 104.7 .044
19360304 S12 156.7 .045
19371207 S12 128.3 .027
19380106 S12 128.9 .044
19380114 S12 131.8 .065
19380221 S12 129.5 .236
19380419 S12 116.3 .053
19380805 S12 144.5 .055
19380907 S12 143.1 .048
19381110 S12 157.5 .066
19390307 S12 149.4 .17
19410103 S12 132 .092
19410110 S12 133.6 .103
19410918 S12 128.14 .137
19490106 S12 180.2 .083
19490124 S12 180.8 .086
19561206 S12 492.7 .046
19590701 S12 650.2 .019
19591209 S12 671.2 -.007
19620710 S12 586 .012
19660106 S12 985.46 .213
19660914 S12 806.23 .06
19661025 S12 793.09 .004
19670424 S12 887.53 .019
19680108 S12 908.92 .086
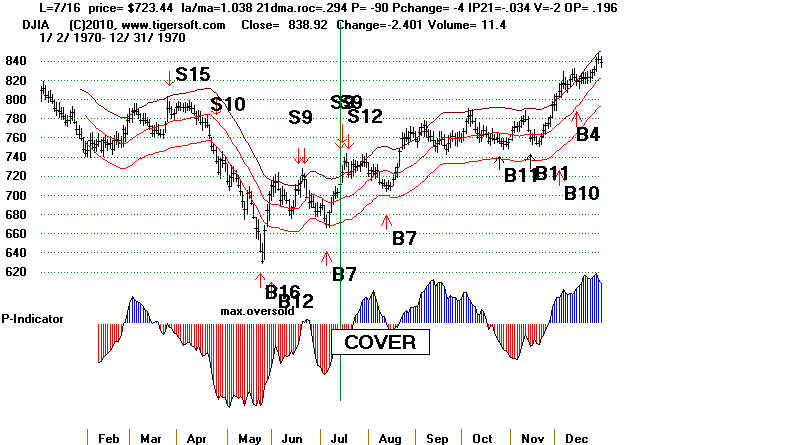
19691016 S12 838.77 .066
19700102 S12 809.7 .056
19700616 S12 706.26 .052
19700720 S12 733.91 .036
19710816 S12 888.95 .071
19710823 S12 892.38 .074
19710831 S12 898.07 .08
19720804 S12 951.76 .032
19730111 S12 1051.7 .118
19731228 S12 848.02 .028
19740102 S12 855.32 .036
19740222 S12 855.99 .273
19740607 S12 853.72 .271
19740807 S12 797.56 .22
19741018 S12 654.88 .054
19750829 S12 835.34 .048
19780908 S12 907.74 .127
19810615 S12 1011.99 .172
19820129 S12 871.1 .073
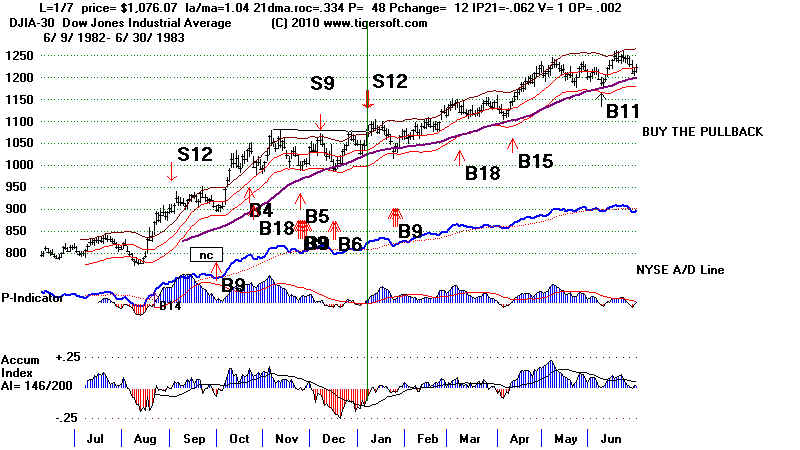
19830106 S12 1070.92 .038
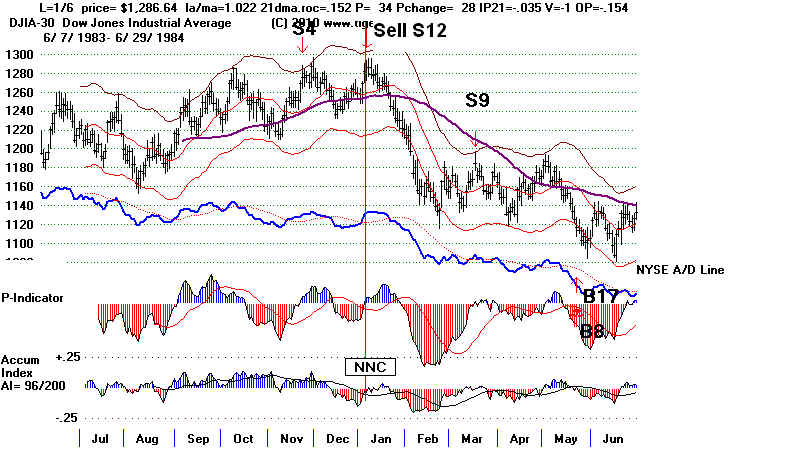
19840105 S12 1282.24 .108
19870506 S12 2342.19 .052
19870608 S12 2351.64 -.04
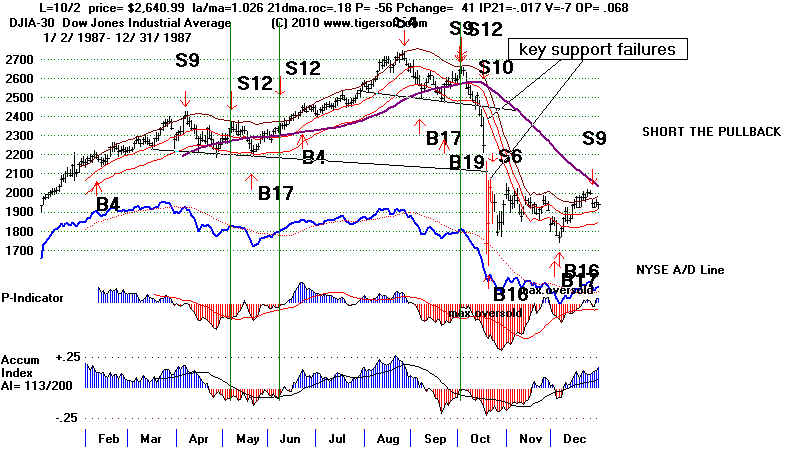
19871002 S12 2640.99 .342
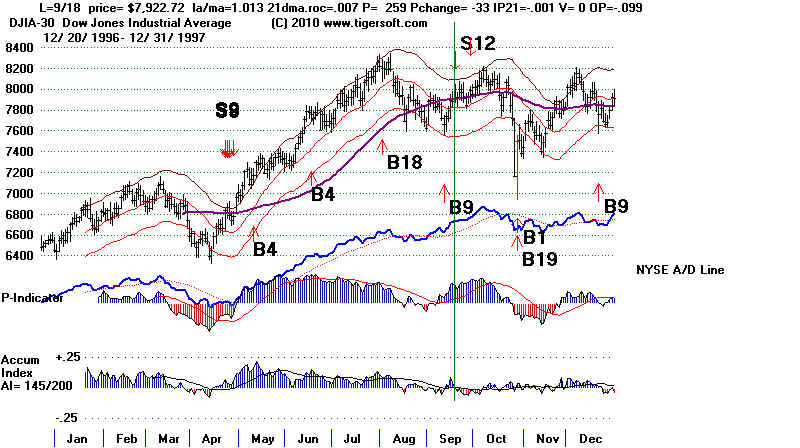
19970918 S12 7922.72 .054
19970929 S12 7991.43 .062
19980708 S12 9174.97 .168
19990817 S12 11117.07 .099
20000111 S12 11511.08 .13
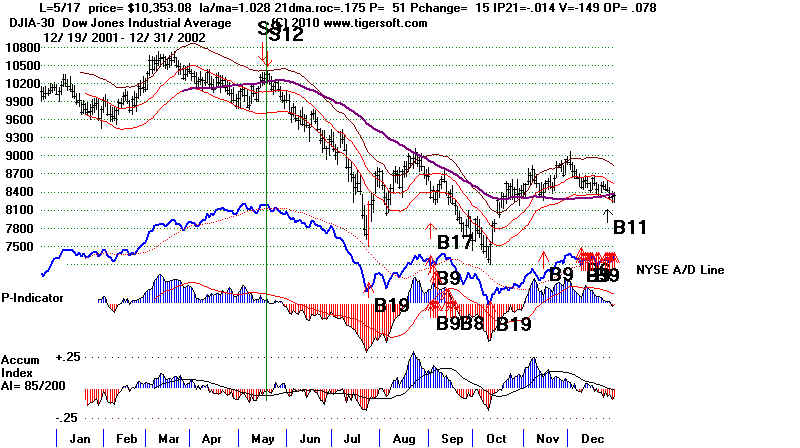
20020517 S12 10353.08 .209
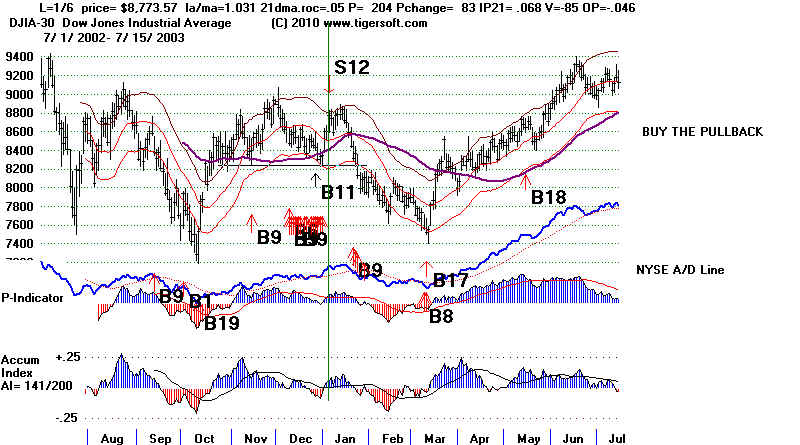
20030106 S12 8773.57 .137
20040405 S12 10558.37 .056
20071206 S12 13619.89 .099
20081105 S12 9139.27 .174
20090106 S12 9015.1 .087
20100616 S12 10409.46 .061
20110630 S12 12414.34 .075
20110830 S12 11559.95 .078
20111207 S12 12196.37 .035
20120103 S12 12397.38 -.015
20130910 S12 15191.06 .013
END
------------------------------------------------
No.= 82 .086
 PE     10   .075
 PE+1   25   .087
 PE+2   28   .095
 PE+3   19   .075
Jan 22 .090
4 in PE .077
9 in PE+1 .107
6 in PE+2 .081
3 in PE+3 .073
Feb 3 .227
Mar 2 .108
Apr 4 .052
May 2 .131
Jun 7 .080
Jul 6 .061
Aug 12 .104
Sep 9 .062
Oct 5 .088
Nov 3 .083
Dec 7 .038
1-10 39 .089 11-20 24 .075 21-31 19 .093 |
================================================================================
Revised:
2/14/2013
Sell
S12s occur when the DJI approaches the upper band and the
Accumulation Index is
negative, or nearly so. The P-Indicator cannot be too
positive. Seasonality is an important factor, too, with the period from
August through
February generally producing the most and the most
powerful Sell
S12s.
92 cases since 1929.
Avg. Decline at time of next Peerless Buy is 7%.
90% are profitable.
The average paper loss is 2%.
TigerSoft considers deeply
negative, red Accumulation Index (IP21) readings
as a sign that
"Big Money" and "Insiders" are selling. This is especially true
when
we see negative
readings when the DJI moves close to the upper band. Normally,
if the stock
market, were healthy, the Accumulation Index would turn very positive
on such a
rally.
Sell S12s are important because there are a number
of cases where
market tops do not show
a nearby Sell S9 or a head and shoulders top.
Look at the tops in
January 1966 and September 1998 for examples.
Sometimes, these
independent Sell S12s are seen with a simultanous
non-confirmation of a
new closing high by the NYSE A/D Line. That makes
the Sell S12 more
bearish, as does a subsequent breakdown by the NYSE A/D
Line of its
uptrend.
As of 2/14/2013, there
have been 91 Sell S12s since 1928. At the the time
of the next Peerless
Buy signal, the DJI was done an average 7.4%.
Since 1965, there have
been 44 Sell S12s,. Their average decline was 8.11%.
There were 16 Sell S12s
(17.6% of all cases) where the gains by going short the
DJI would have been
more than 10%. In 50 (or 54.9% of all cases) the gain
would have been more
than 5%. Sell S12s are generally made the most deadly if the V-Indicator
is negative or if there
is a simultaneous Sell S9 or Sell S15. In both these case,
the average S12 decline
jumps to 10.6%.
Count the Number of Recent Sell Signal Clusters
By my calculation, the DJI falls below the lower
3.5% band in 40%
Sell S12s since
1928. The more sets of major Sells, especially S9s and S12s,
in the
previous year without a decline of more than 7%, the more likely there will
be a big break.
This concept connects the vulnerability of the market
to the amount of red
Distribution over the last 7 months. This pattern of
multiple Peerless
Sell S9s and Sell S12s is most apparent in the Peerless
charts for 1929,
1938-1939, 1968-1969, 1972-1973, 1987, 1999-2000 and 2007-2008.
Their occurrence set the stage for the market's sharpest and deepest declines.
Not surprisingly then, we see that 40 of the Sell
S12s occurred between 1929 and
1941, a generally
bearish period. But only two took place between 1942 and 1956 when
the DJI
quintupled. There were also no Sell S12s between 1988 and and 1997, also period
during which the
DJI quintupled.
Typical Sell S12s
Besides
occuring on new highs and near the upper band when the Accumulation Index
is badly
lagging and often negative, what else can we say about Sell S12s?
What are
the accompanying key Peerless indicator readings to a typical Sell S12?
We can get a good
idea about when Sell S12s are most reliable simply by
studying the
average for each of the key values for these S12s. The highs and lows
for these key
values show the widest range possible. Many of the extremes come
from the pre-WWII
period. Advanced students of Peerless will want to study in more
detail the cases
where the key values reached extremes. For example, see how
7/10/1962
represented an extreme both for the P-I and the V-I. This was also a case
with a large
paper loss. Readers may want to be more suspicious of cases where
the key values'
maximum and minimum parameters are approached.
All Cases: 1928-2013
Avg.
High
Low
la/ma =
1.029 +1.074
(7/5/1933) 1.013 (9/18/1997)
ann.roc. = .218
+1.352
(7/5/1933)
-.721 (1/8/1932)
P =
-2.81
+347 (1/4/2001) -451 (7/10/1962)
IP21 = -.053
+.042 (1/3/1939) -.168
(12/11/1933)
VI =
-108
+108.3 (9/5/1932) -1390 (7/10/1962)
OPct = .053
+.58 (7/19/1933) -.31 (8/17/1933)
.
Sell S12s are reliable. Only 9 of the 91
Sell S12s since 1929 were reversed
by a Peerless Buy
Signal with the DJI higher than where it was when the Sell occurred.
There was only
instance of a closed out loss of more than 4.75%. This was the 6.5%
loss for the Sell
S12 on 4/19/1938. The DJI gain resulted from the decision by
Britain and
France not to go to war with Nazi Germany for
invading Czechoslovakia.
Since 1945, there
have been only a handful and they were small. Each had some warning signs.
Sell S12s since 1945.
Sell S12 Loss Considerations
---------------------------------------------------------------------------------------------------------------------------------
12 /9/1959 -0.7% - Right before December 17th and the Santa
Claus Buy
6/8/1987 -4.0% - Breakout into all time high
territory
6/30/2011 -1.4% - This was right before the mormally bullish July
4th holiday.
1/3/ 2012 -1.5% - Small loss... Reversing was
profitable.
63 of the 91 Sell S12s were closed out without a paper loss as much
as 2.5%.
Except in
one case, 7/10/1962, all the paper losses after 1938 were under 4.5%.
The 1962
exception saw a paper loss of 6%. A 5% stop loss is
suggested here with Sell S12s.
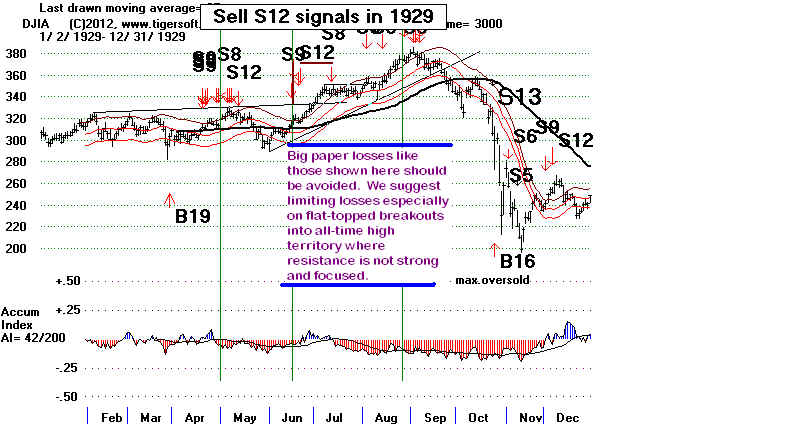
In 1929,
hyper-speculation drove prices up in a frenzy and there were two big paper
losses of
14% and 18% following a mid-year trading range breakout. These cases
shows the need to
work with stop losses after trading range breakout, especially ones
that take prices
into all-time high territory, where offerings become scarce for a while.
In addition the
coming of World War II caused violent market swings up and down.
There was a 9% paper
loss in the Sell S12 of 10/16/1935 and a 6.5% paper loss
after
4/19/1938. Study these cases below to see what went wrong.
The 16 biggest declines after a Sell S12 and their profits at the
time of the next Buy signal. :
19.9% 8/27/1929
42.8% 9/4/1929
42,3% 9/6/1929
22.3 3/20/1931
29.8% 2/15/1932
22.0% 1/6/1966
27.3% 2/ 22/ 1974
27.1% 6/7/1974
10.0% 10/21/1974
13.2% 9/8/1978
12.5% 1/5/1984
30.3% 10/2/1987
16.0% 7/8/1998
12.9% 1/4/2001
20.9% 5/17/2002
12.6% 12/6/2007
Somewhat surprisingly, given the general bullishness
of the year, the biggest declines
tended to
occur on Sell S12s in the year before a Presidential Election. The year after
the
Presidential Election produced Sell S12s that had 25% less downside power, on average.
Number
of Cases Avg. Decline
Presidential
Election Year (PEY)
13
+ 7.5%
PEY. + 1
1929,1933,1937....
26
+ 5.8%
PEY + 2
1930, 1934, 1938...
24
+ 7.9%
PEY + 3
1931, 1935, 1939...
28
+
8.9%
----------------------------------------------------------------------------------------------------
91
+7.3%
The biggest paper losses came in
1929 and on April 19, 1938 with a paper loss of 6.5%.
The heavy red
distribution in 1929 did not stop the DJI from breaking out in the Summer
and running
upward until early September. The ultimate 1929 crash was made worse by
this action.
I suggest not letting a paper loss from a Sell S12 getting more than 5%.
Just as the biggest paper loss after 1945 came in 1962 on a Sell S12 after the market
had crashed and
had started to recover, the biggest losses on closed out Sell S12 short
sale trades came
at the end of bear markets or intermediate-term declines.
In these cases,
we have to watch for a reversing breakout past resistance.
Biggest Closed Out Losses on Sell S12s
9/27/1934 -4.2%
10/5/1934 -4.7%
4/19/1938 -6.5%
Clinching Sell S12s
My back-testing suggests that traders will do best over the long run
requiring tat a Sell S12 be "clinched", especially if the DJI is making
new highs into all-time high territory. The clinching of a Sell S12 occurs
when the NYSE A/D Line breaks its uptrendline. This additional rule
would have prevented two losing Sell S12s, one in June 1987 and
one in early 1999. In the case of 1997, shown below, it would have
served to keep us long for an additonal 3% rise past the first Sell S12
in early September.
Sell S12s by Month
of The Year
If seasonality is
bullish, as in late November, the DJI may only drop
to the next good
support, which is usually the lower band or the rising
65-day ma.
Limited declines are also seen when the Accumulation Index
quickly turns
positive.
Closer inspection of the S12 shows strong
monthly seasonality.
29.7% of all S12s occur in January, mostly
before the 14th. January
is a month when the market often pivots down
after the bullish Santa
Claus rally. Considering the number of
big January advances, Peerless
is important in keeping the number of S12 losses in
that month to
just one.
The end of Summer also brings many Sell S12
reversals down.
24.2% of the Sell S12s occur in August and
September. September
is the month of the year that has the lowest
probability of bringing
a DJI gain while Octobers are famous for often
bring a selling climax
in a bear market. Look at the big Autumn
sell-offs after Sell S12s in
1929, 1932, 1974 and 1987. In each case
there was also a Sell S9.
---------------------------------------
Sell S12 by Month ----------------------------------------------------
Month
Number of Avg.
Cases of note
Trades Gain
---------------------------------------------------------------------------------------------------------------
January
27
6.4%
February
3
20.5% 1932,1937, 1974,
March
2
13.2%
1939,
1976
April
5
2.3% 1929(2), 1936(2), 1967
May
2
13.1% 1972,
1987, 2002 (+20%)
June
5
6.5%
'29, '34,'74 (+27.1%),99,'06,'07, '10
July
6
5.4%
'33 (2),'59, '62,'70,'98
(+16%)
August
10
7.9% 1929 (3) + 15.%, +20%,
+21%
September
12 12,3%
'32,,'41,'66,'67,'97(2)
October
9
5.8%
'31,
'36,'66,'69,'74,'78,'87(+30.3%)
November 2
6.8%
2008
December 8
4.0%
'29,'33 (2),'37,'56,'59,'00,'07
---------------------------------------------------------------------------------------
91
7.3%
7
Sell S12 signals at the end of June and in early July often led to
paper losses. Users should note this and delay acting on them.
Sell S9s should probably be treated very carefully, too, at this
time. .
.
Paper Loss
Result of this change
6/17/1929
18%
Elimination would be very helpful.
7/11/1929
12%
very helpful.
7/5/1933
5%
A much better Sell S19 occurred on
7/19/1933.
7/1/1959
4%
A much better Sell S4 occurred on
8/3/1933.
7/10/1962
6%
DJI did decline to 21-dma. No better sell later on.
7/8/1998
2%
Premature but no better other Sell for big decline..
6/30/2006
Here the Sell S12 would have worked well.
.
6/30/2011
1.4%
Not having a Sell S12 would have avoided
a small whipsaw loss.
It is important that traders notice that the
Sell S12 losses in November
since 1929 can be avoided by strictly
forbidding a Sell S12 after
Novermber 11th. This makes sense in that
it has often been noted that
the period from the third week of November to
April of the next year is
a seasonally bullish period. So, selling
just before that bullish period
begins is bound to create problems. Users
will want to take this into
account, just as the software does
automatically from December 17th
to the end of the year, because of the Santa
Claus effect.
November S12s
.
X ...S12
11/ 14/ 1933
-6.7% Big Loss
OK
S12
11/10/1938
+5.7%
X
..S12 11/ 20/ 1997
-1.7%
OK .S12
11/ 5/ 2008
+12.0%
X ..
.S12 11/ 13/ 2009
-0.4%
Summer Rally versus Sell S12
Another seasonal phenomenon should
be noted. Aprils, Mays, June and
Julys
produce a much higher proportion of failed Sell S12s than the
other
months. This is because they have to face the Summer Rally
seasonality
tends to bring a DJI gain from the last week of June to
the first
week of September. What is also interesting is how much more
frequently
the S12s fail if they occur in the period after the 8th of June.
The average
gain is only 1.3% on an Sell 12 in this period that leads
up to the
typical start of the Summer Rally. The Peerless software has
tightened
conditions in June, so that the failed 1936 Sell S12s are
eliminated.
Note the "X" in the left column below. These no dates
no longer produce Sell S12s.
June S12s
...S9...S12 6/ 17/ 1929
+4.5%
X..S12
6/ 12/
1936
-4.6%
.X..S12
6/
25/ 1936
-1.4%
OK ...S12
6/7/ 1974
+27.1%
(Nixon Resignation)
OK
...S9...S12 6/ 8/ 1987
-4.0%
...S12
6/18/ 1999
+2.9%
...S12
6/30/ 2006
+3.1%
...S12
6/6/2010
+6.1%
...S12
6/30/2010
-1.3%
The presence of a negative V-Indicator with an Sell S12 is associated
with deeper subsequent
declines. Table S12-B shows independent Sell S12
occurring on strength.
The V-Indicator Is only available after late 1965.
Importance of Negative Internals
and Pct over 21-day ma
Number of S12s Avg S12
Decline
---------------------------------------------------------------------------------------------------
with V-I negatve
73
10.6%
reinforced by Sell S9/S15, falling market since 1945 8
10.6%
over 4.0% upper band
12
10.3%
reinforced by Sell S9/S15, rising market since 1945 11 8.6%
with P-I, V-I and IP21 negative 47
8.22%
1965-2013 48-91
44
8.22%
over 3.5% upper band
19
8.19%
with IP21 and V-I negative
36
8.11
with P-I and V-I negative
49
8.08%
with P-I negative
50
8.05%
over 3.3% upper band
21
8.04%
1945-2013
50
7.7%
with IP21<0
84
7.61%
All S12 Cases
91
7.4%
over 2.6% upper band
49
7.36%
1928-1944
41
7.26%
with OPct negative
32
7.03%
over 2.3% upper band
66
6.93%
over 2.8% upper band
38
6.82%
between 2.6% and 3% upper band 30
6.45%
between 3% and 3.5% upper band 12
6.43%
upper band >2.09% <2.61% 25
6.20%
with Opct, IP21, P-I and V-I negative 20
6.15%
over 5% upper band
5
4.42%
Sell S12s are somewhat
more bearish when they occur with a simultaneous
Sell S9. (Table
S12-D)
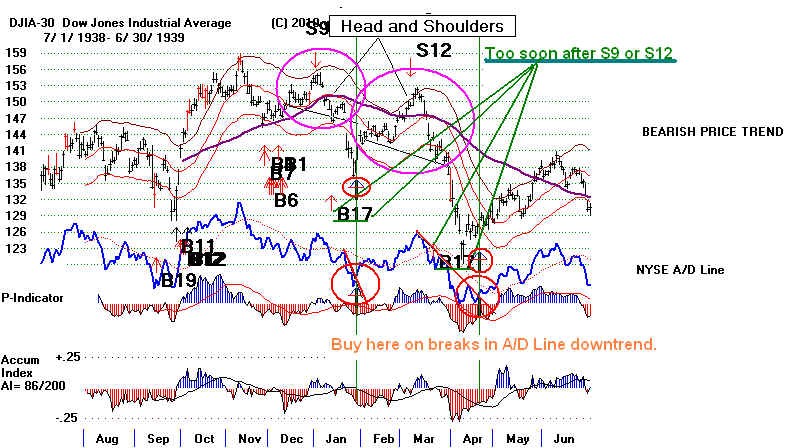
As with S9s, it is best
to let a Sell S12 play itself out and not buy for at least
15 trading days even if
there is a Buy signal. In these cases, wait for the A/D Line
downtrend to be
broken. This is even more true if a head and shoulders
pattern develops...
Reinforced Sell S12 Signals since 1945
in A Rising Market
...S9...S12 7/1/1959 650.2
+1.9% Paper loss = 4%
...S9...S12 8/4/1972
947.7
+3.2%
Paper loss = 3.0%
...S9...S12...S15
8/29/1975 835.34 + 4.8% No paper loss
...S9...S12
10/11/1978 901.42
+7.2% No paper loss
...S9...S12
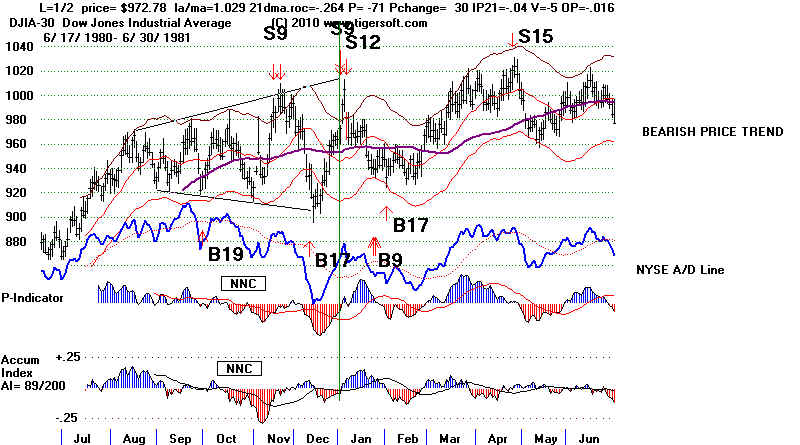
1/2/1981 972.78
+3.5% No paper loss
..S9...S12
5/6/1987 2342.19
+5.2% No Paper loss
...S9...S12
10/2/1987 2640.99 +30.3% No Paper loss
...S9...S12 7/8/1998
9174.97 +16.0% Paper loss = 2.0%
...S9...S12
8/17/1999 11117.07
+6.4% Paper loss = 2.0%
...S15...S1
1/7/2000 11522.56
+4.8% Paper
loss = 2.0%
..S9...S12 12/6/2007
13619.89 +12.6% Paper loss = 1.0%
-----------------------------------------------------------------------------------------------------------------
N=11
Avg = 8.6% Rising Market Variety
Reinforced Sell S12 Signals since 1945 in A
Falling Market
..S9...S12
7/10/1962 586
+0.6%
Paper loss = 6% Bear Market Variety
...S9...S12
9/15/1966 814.3
+1.4% No paper loss.
Bear Market Variety
...S9...S12
10/26/1966 814.3
+1.4% Paper loss = 2.5% Bear Market Variety
...S9...S12 7/16/1970 723.44
+2.2% Paper loss = 1.4% Bear Market Variety
...S9...S12 2/22/1974 855.99
+27.3% Paper loss = 4.0% Bear Market Variety
...S9...S12
6/7/1974 853.72
+27.1% No
paper loss Bear Market Variety
...S9...S12
1/29/1982 871.10
+5.4% No paper loss Bear Market Variety
...S9...S12
5/17/2002 10353.08 +20.9% No Paper loss
Bear Market Variety
-----------------------------------------------------------------------------------------------------------------
N = 8
Avg = 10.6% Bear
Market Variety
Sell S12s should cause B12 signals to be suppressed or cancelled
for 10 days. Example August 1934
Table S12-A Peerless Sell S12s: 1929-2013
(Editing has started 1/20/2013 using new, not yet released, February 2013 Peerless)
#42 ...S12 1/24/1949 180.8 +8.6%
1.009 .226 +47 IP21= -.009 -29 .094
Note the quickly formed head/shoulders pattern.
Soon after the DJI dropped below the lower band.
It was significant that there were no Sell S12s
between early 1949 and 1956, This was a periof when
Accummulation not Distribution was dominant, as
the DJI tripled in value.
#43 ...S12 12/6/1956 492.7 +4.6% Paper loss = 2%
1.029 -.067 P= -83 IP21= -.078 -316 -.143
#44 ...S9...S12 7/1/1959 650.2 +1.9% Paper loss = 4%
1.03 .24 P= -2 IP21= -.062 -177 .166
Selling just before the Fourth of July, which is usually
a bullish weekend, is not normally recommended.
#45 ...S12 12/9/1959 671.2 -0.7% Paper Loss = 1%
1.028 .371 P= 5 IP21=-.055 -216 .326
#46 ...S15...S12 1/5/1959 685.50 +9.8% No Paper Loss
1.018 .40 P= 4 IP21= -.038 -170 .095
#47 ...S9...S12 7/10/1962 586 +0.6% 6% Paper Loss
1.034 -.327 P= -451 IP21= -.113 -113 -.147
This S12 took place at what was to be near
the end of a bear market. It is probably worth
distibuishing S12s in rising markets from those
that do not.
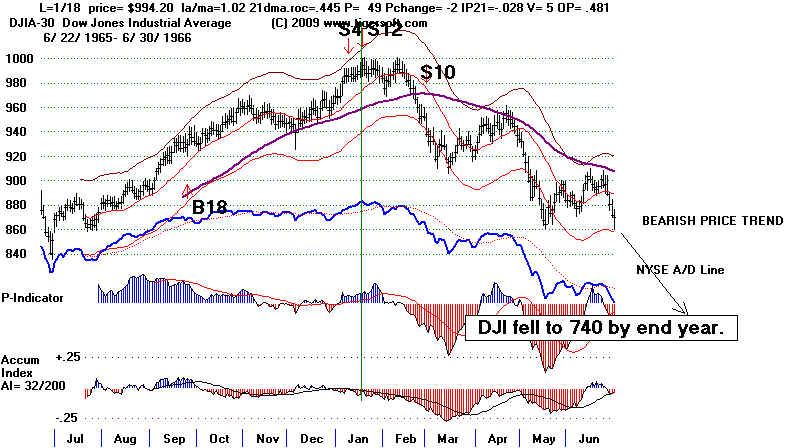
#48 ...S12 1/6/1966 994.2 +22.0% 1% Paper Loss
1.02 .445 P= 49 IP21= -.028 5 .481
This signal was finally reversed at 775.72 on 8/30/66 by B19
#49 ...S9...S12 9/15/1966 814.3 +1.4% no paper loss.
1.029 .143 P= -174 IP21= -.078 -13 -.146
The DJI fell below the lower band to the bear market low.
#50 ...S9...S12 10/26/1966 814.3 +1.4% Paper Losss = 2.5%.
1.036 .108 P= -61 IP21= -.059 -9 .05
The DJI fell only to the lower 2.0% band.
From this low a bull market began.
#51 ...S12 4/24/1967 883.18 +1.4% Paper Losss = 1%
1.026 .15 P= 33 IP21= -.02 1 .183
#52 ...S12 9/14/1967 929.44 +7.5% Paper Losss 1%
1.024 .135 P= 12 IP21= -.009 2 .199
#53 ...S12 1/8/1968 908.92 +8.6% No paper loss.
1.02 .222 P=68 IP21= -.019 6 .163
This was important, because it was a typical January reversal downward,
|
 #28...S12...S1 10/5/1936 2.8 Loss=-4.6% Reversed by B13 12/17/1936 180.8
1.026 .468 P- 2 IP21= -.03 -70 .183
also 10/7/1936
Important note:
A flat topped breakout just as the October S12 occurred.
The bullishness of this breakout overwhelmed the S12. Be careful
about acting on S12s right after a breakout above a series of tops
lined up this way.
#28...S12...S1 10/5/1936 2.8 Loss=-4.6% Reversed by B13 12/17/1936 180.8
1.026 .468 P- 2 IP21= -.03 -70 .183
also 10/7/1936
Important note:
A flat topped breakout just as the October S12 occurred.
The bullishness of this breakout overwhelmed the S12. Be careful
about acting on S12s right after a breakout above a series of tops
lined up this way.
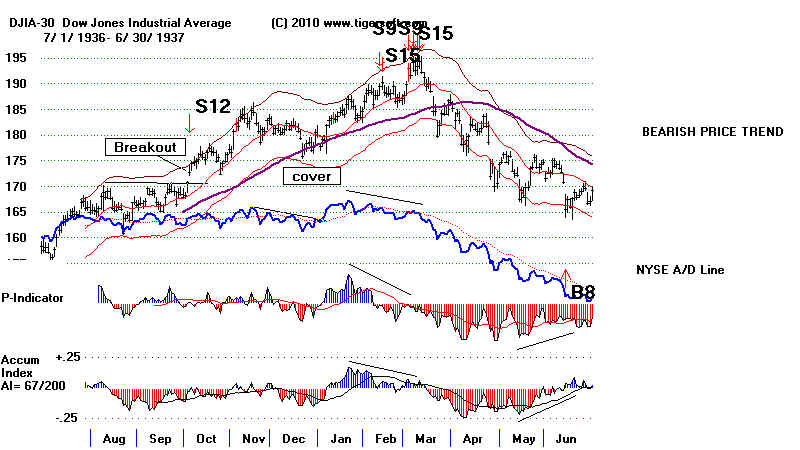 #29 ...S12 12/7/1937 2.7% Reversed by B13 on 12/17/1937 124.9
No paper loss.
1.026 .468 P= 2 IP21= -.03 -70 .183
Note that in an extrene bear market, the Buy B13 should not be used.
Far better to cover short sale at the lower band at this time of year.
==============================================================================
X 1/6/1938 Gain = 4% Paper Loss = 4%
1.027 0 P- -51 IP21= -.086 -192 -.016
This Sell S12 is cancelled by the simultaneous Buy B12
=======================================================================
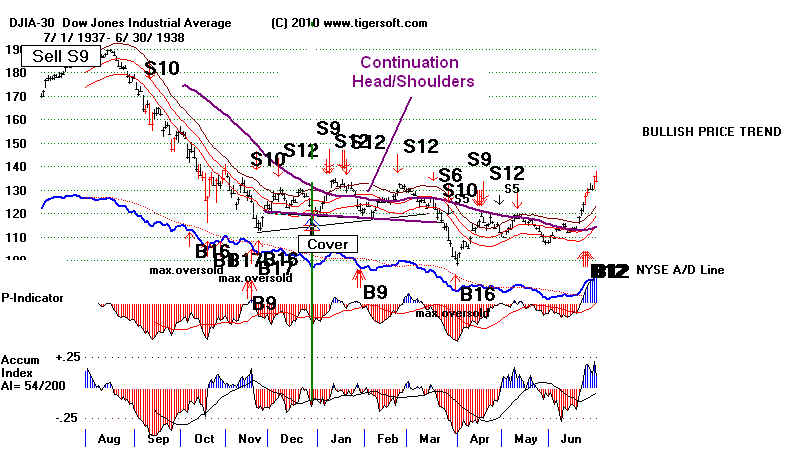
#30 ...S12 1/14/1938 132.5 +6.5% Zero Paper loss
1.039 .564 P= 13 IP21= -.015 -89 .029
Also ...S12 1/18/1938 131.5 +6.3%
1.033 .225 P= -21 IP21= -.049 -136 .011
Note that in an extrene bear market, the Buy B9 would
normally not be used, but covering on a test of the
earlier low would be reasonable. So we will use the
Buy B9 of 1/16/1938 with DJI at 123.20 to cover this short.
Far better to cover short sale at the lower band or on a test of
the earlier lows. That would have meant covering at 119.
---------------------------------------------------------------------------
#31 ...S12 2/21/1938 129.5 Gain = 4.3%
1.041 -.115 -49 IP21=-.074 -126 -.172
This set up the final decline in the 1937-1938 bear market.
It called right shoulder apex before the continuation head
and shoulders pattern was completed. A Buy B16 using normal
mode called the bottom.
-------------------------------------------------------------------------
#32 ...S12 4/19/1938 118.9 -6.5% Big Loss
1.055 -.226 -91 17 IP21= -.236 -229 -.121
Important comment:
DJI fell below lower band to 107.90 without giving a buy signal.
If one had covered when the A/D Line broke its downtrend,
one would have covered at 100.9 and made 12.7%. Clearly
when a short sale gain gets this big late in a bear market
one should lock in profits using this approach when the
A/D Line downtrend is broken.
#29 ...S12 12/7/1937 2.7% Reversed by B13 on 12/17/1937 124.9
No paper loss.
1.026 .468 P= 2 IP21= -.03 -70 .183
Note that in an extrene bear market, the Buy B13 should not be used.
Far better to cover short sale at the lower band at this time of year.
==============================================================================
X 1/6/1938 Gain = 4% Paper Loss = 4%
1.027 0 P- -51 IP21= -.086 -192 -.016
This Sell S12 is cancelled by the simultaneous Buy B12
=======================================================================
#30 ...S12 1/14/1938 132.5 +6.5% Zero Paper loss
1.039 .564 P= 13 IP21= -.015 -89 .029
Also ...S12 1/18/1938 131.5 +6.3%
1.033 .225 P= -21 IP21= -.049 -136 .011
Note that in an extrene bear market, the Buy B9 would
normally not be used, but covering on a test of the
earlier low would be reasonable. So we will use the
Buy B9 of 1/16/1938 with DJI at 123.20 to cover this short.
Far better to cover short sale at the lower band or on a test of
the earlier lows. That would have meant covering at 119.
---------------------------------------------------------------------------
#31 ...S12 2/21/1938 129.5 Gain = 4.3%
1.041 -.115 -49 IP21=-.074 -126 -.172
This set up the final decline in the 1937-1938 bear market.
It called right shoulder apex before the continuation head
and shoulders pattern was completed. A Buy B16 using normal
mode called the bottom.
-------------------------------------------------------------------------
#32 ...S12 4/19/1938 118.9 -6.5% Big Loss
1.055 -.226 -91 17 IP21= -.236 -229 -.121
Important comment:
DJI fell below lower band to 107.90 without giving a buy signal.
If one had covered when the A/D Line broke its downtrend,
one would have covered at 100.9 and made 12.7%. Clearly
when a short sale gain gets this big late in a bear market
one should lock in profits using this approach when the
A/D Line downtrend is broken.
 #33 ...S12 8/5/1938 144.5 +5.5%
1.029 .595 40 IP21= -.024 28 .028
Typical decline to the lower band. No paper loss.
#34 ...S12 9/7/1938 143.1 +4.8%
1.019 .102 -39 IP21= -.079 -102 -.024
Decline slightly below the lower band. No paper loss.
#35 ...S12 11/10/1938 157.50 +5.7%
1.032 .618 63 IP21= .032 44 .124
Decline to the lower band. No paper loss.
The chart's Accumulation Index shows how the Accumulation
Index weakened on this and the Aug-Sept rallies to the upper
band, thereby forestalling a decline to the lower band.
#36 ...S12 1/3/1939 153.60 +4.1%
1.022 .397 -9 IP21= .042 -8 .244
Decline to the lower band. No paper loss.
The chart's Accumulation Index and the P-Indicator stayed
low despite the Santa Claus raly to the upper band. The
combination of distribution and poor breadth is more
likely to bring a breaking of the lower band. Even more
bearish, This was the fourth major Sell in 4 months.
A decline below the lower band should have been expected.
The decline that followed fulfilled the downside projections
based on the height of the pattern before the breakdown.
The Buy B17 was very premature.
#37 ...S12 3/7/1939 149.40 +4.0% 2% paper loss
1.028 .418 32 IP21= -.051 18 .212
This was the fifth major Sell in 6 months.
A decline below the lower band should have been expected.
The decline that followed fulfilled the downside projections
based on the height of the pattern before the breakdown.
The Buy B17 was very premature. Users should count the number
of recent automatic Sell signals.
Research note: The IPA Indicator, which is the cumulative
equivalent of the Accumulation index was steadily declining
and made new lows far ahead of prices in the seven months
before the NAZIs attacked Western Europe in April 1940.
12 month IPA lows while prices are more than 50% up
from their 100-day lows to their 100s is probably a reliable
Sell signal, but it will have to be researched.
#38 ...S12 1/3/1941 132.00 +4.5% 1% paper loss.
1.012 .11 -1 IP21= -.049 -44 .237
#39 ...S12 1/10/1941 133.60 +5.7%
1.02 .20 +45 IP21= -.068 +7 .46
also S12 on 1/11/1940 Gain = +5.5%
#40 ...S12 9/18/1941 128.8 +8.2% .
1.012 .30 +67 IP21=.002 +24 .094
The DJI dropped below the lower band. Wall Street insiders
were probably anticipating an undeclared war with Japan
because of its bellicosity and the resulting US oil embargo
on it. It should be noted that head/shoulders patterns
do sometimes occur before there is an attack on the US
or some other dire event
There were no S12s between 1941 and 1949.
The 3/29/1948 S12 using DATA48 appears because
the computer cannot take into account the earlier data
of the March 1948 take-off. The DATA4748 chart correctly
shows no S12 on 3/29/1948.
#41 ...S12 1/6/1949 180.2 +8.3%
1.02 .263 P= -6 IP21=.-.016 -101 .0
#33 ...S12 8/5/1938 144.5 +5.5%
1.029 .595 40 IP21= -.024 28 .028
Typical decline to the lower band. No paper loss.
#34 ...S12 9/7/1938 143.1 +4.8%
1.019 .102 -39 IP21= -.079 -102 -.024
Decline slightly below the lower band. No paper loss.
#35 ...S12 11/10/1938 157.50 +5.7%
1.032 .618 63 IP21= .032 44 .124
Decline to the lower band. No paper loss.
The chart's Accumulation Index shows how the Accumulation
Index weakened on this and the Aug-Sept rallies to the upper
band, thereby forestalling a decline to the lower band.
#36 ...S12 1/3/1939 153.60 +4.1%
1.022 .397 -9 IP21= .042 -8 .244
Decline to the lower band. No paper loss.
The chart's Accumulation Index and the P-Indicator stayed
low despite the Santa Claus raly to the upper band. The
combination of distribution and poor breadth is more
likely to bring a breaking of the lower band. Even more
bearish, This was the fourth major Sell in 4 months.
A decline below the lower band should have been expected.
The decline that followed fulfilled the downside projections
based on the height of the pattern before the breakdown.
The Buy B17 was very premature.
#37 ...S12 3/7/1939 149.40 +4.0% 2% paper loss
1.028 .418 32 IP21= -.051 18 .212
This was the fifth major Sell in 6 months.
A decline below the lower band should have been expected.
The decline that followed fulfilled the downside projections
based on the height of the pattern before the breakdown.
The Buy B17 was very premature. Users should count the number
of recent automatic Sell signals.
Research note: The IPA Indicator, which is the cumulative
equivalent of the Accumulation index was steadily declining
and made new lows far ahead of prices in the seven months
before the NAZIs attacked Western Europe in April 1940.
12 month IPA lows while prices are more than 50% up
from their 100-day lows to their 100s is probably a reliable
Sell signal, but it will have to be researched.
#38 ...S12 1/3/1941 132.00 +4.5% 1% paper loss.
1.012 .11 -1 IP21= -.049 -44 .237
#39 ...S12 1/10/1941 133.60 +5.7%
1.02 .20 +45 IP21= -.068 +7 .46
also S12 on 1/11/1940 Gain = +5.5%
#40 ...S12 9/18/1941 128.8 +8.2% .
1.012 .30 +67 IP21=.002 +24 .094
The DJI dropped below the lower band. Wall Street insiders
were probably anticipating an undeclared war with Japan
because of its bellicosity and the resulting US oil embargo
on it. It should be noted that head/shoulders patterns
do sometimes occur before there is an attack on the US
or some other dire event
There were no S12s between 1941 and 1949.
The 3/29/1948 S12 using DATA48 appears because
the computer cannot take into account the earlier data
of the March 1948 take-off. The DATA4748 chart correctly
shows no S12 on 3/29/1948.
#41 ...S12 1/6/1949 180.2 +8.3%
1.02 .263 P= -6 IP21=.-.016 -101 .0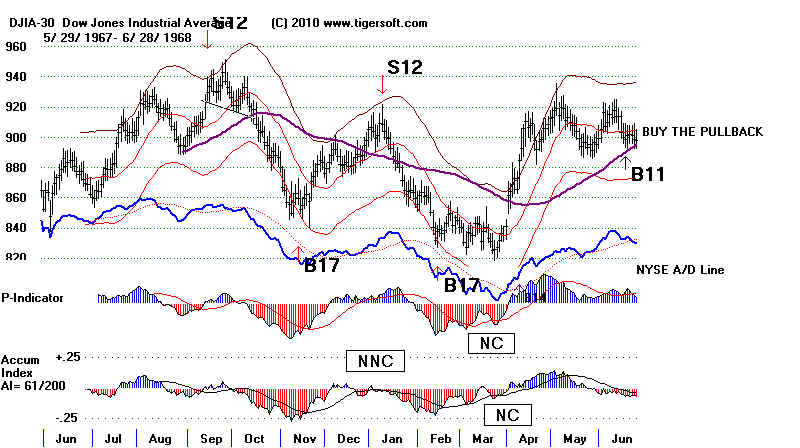 #54...S12 10/16/1969 838.77 +6.6% 3% Paper Loss
1.025 .178 P= -24 IP21 = -.012 0 -.047
Here we have a bear market Sell S12.
#55...S12 1/2/1970 809.7 +5.6% No paper loss
1.026 .126 P= -98 IP21 = -.053 -2 -.001
#54...S12 10/16/1969 838.77 +6.6% 3% Paper Loss
1.025 .178 P= -24 IP21 = -.012 0 -.047
Here we have a bear market Sell S12.
#55...S12 1/2/1970 809.7 +5.6% No paper loss
1.026 .126 P= -98 IP21 = -.053 -2 -.001
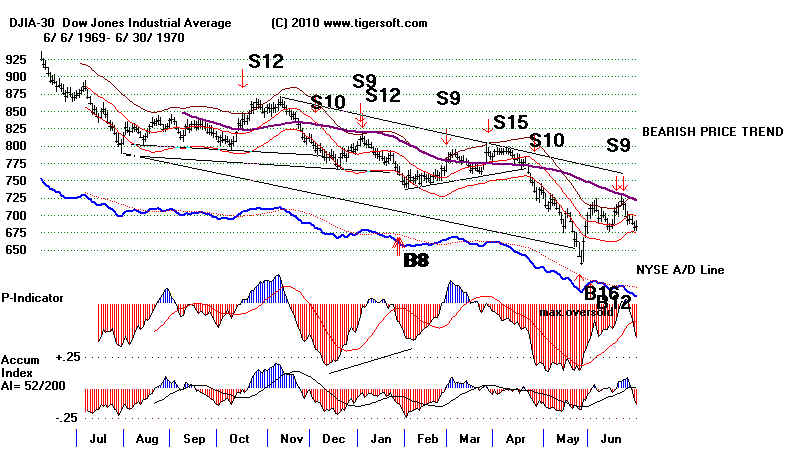 #56 ...S9...S12 7/16/1970 723.44 +2.2% Paper Loss = 1.4%
1.038 .294 P= -90 IP21 = -.034 -2 .196
At end of bear market.
#56 ...S9...S12 7/16/1970 723.44 +2.2% Paper Loss = 1.4%
1.038 .294 P= -90 IP21 = -.034 -2 .196
At end of bear market.
 #57 ...S12 8/23/1971 892.38 +7.4% Paper Loss =4%
1.03 .063 P- -99 IP21- -.165 -2 .058
#58 ...S12 8/31/1971 898.07 +8.0% Paper Loss =2%
1.025 .451 P- 37 IP21- -.093 -1 .195
#59 ...S9...S12 8/4/1972 947.7 +3.2% 3% Paper Loss
1.026 .124 P- -95 IP21- -.025 -2 .144
#60 ...S12 1/11/1973 1039.36 +8.2% 1% Paper Loss
1.011 .036 P- -126 IP21=-.037 -3 -.043
See that this was the fourth major Sell in the past 7 months.
The subsequent break ot the 840 or even 900 support was a warning
of a bear market's onset.
Short-term reversal at 874.17 on 8/15/73 by B17
#61 ...S12 12/28/1973 848.02 +2.8% 3.8% Paper Loss
1.032 .117 P- +75 IP21= -.027 -1 .143
also
...S12 1/2/1974 855.32 +3.6% 2% Paper Loss
1.038 .292 P- -86 IP21= -.008 -2 -.074
This was a techinical rebound after a big decline.
#62 ...S9...S12 2/22/1974 855.99 +27.3% 4% Paper Loss
1.027 .214 P- 21 IP21= -.083 -2 -.07
Reversed at 621.95 on 9/27/1974 by B8
#63 ...S9...S12 6/7/1974 853.72 +27.1% no paper loss
1.033 .039 P= -27 IP21=-.074 -2 .004
#64 ...S9 8/7/1974 797.56 +22.0% no paper loss
1.023 .387 P= +32 IP21=-.043 -1 .03
#65 ...S12 10/21/1974 669.02 +10.0% no paper loss
1.057 -.018 P= 95 IP21=-.043 1 -.054
#66 ...S9...S12...S15 8/29/1975 835.34 +4.8% no paper loss
1.024 .055 P= -139 IP21=-.102 -3 .008
#67 ...S12 9/8/1978 907.74 +13.2% no paper loss
1.019 .216 P= 109 IP21=-.062 -3 .078
The DJI fell to the lower band, where there no Buy signal.
It recovered back to near the upper band and then collapsed.
#68 ...S9...S12 10/11/1978 901.42 +7.2% no paper loss
1.032 -.068 P=-126 IP21= -.124 -4 -.101
#69 ...S9...S12 1/2/1981 972.78 +3.5% no paper loss
1.029 -.264 P= -71 IP21=-.04 -5 -.016
#57 ...S12 8/23/1971 892.38 +7.4% Paper Loss =4%
1.03 .063 P- -99 IP21- -.165 -2 .058
#58 ...S12 8/31/1971 898.07 +8.0% Paper Loss =2%
1.025 .451 P- 37 IP21- -.093 -1 .195
#59 ...S9...S12 8/4/1972 947.7 +3.2% 3% Paper Loss
1.026 .124 P- -95 IP21- -.025 -2 .144
#60 ...S12 1/11/1973 1039.36 +8.2% 1% Paper Loss
1.011 .036 P- -126 IP21=-.037 -3 -.043
See that this was the fourth major Sell in the past 7 months.
The subsequent break ot the 840 or even 900 support was a warning
of a bear market's onset.
Short-term reversal at 874.17 on 8/15/73 by B17
#61 ...S12 12/28/1973 848.02 +2.8% 3.8% Paper Loss
1.032 .117 P- +75 IP21= -.027 -1 .143
also
...S12 1/2/1974 855.32 +3.6% 2% Paper Loss
1.038 .292 P- -86 IP21= -.008 -2 -.074
This was a techinical rebound after a big decline.
#62 ...S9...S12 2/22/1974 855.99 +27.3% 4% Paper Loss
1.027 .214 P- 21 IP21= -.083 -2 -.07
Reversed at 621.95 on 9/27/1974 by B8
#63 ...S9...S12 6/7/1974 853.72 +27.1% no paper loss
1.033 .039 P= -27 IP21=-.074 -2 .004
#64 ...S9 8/7/1974 797.56 +22.0% no paper loss
1.023 .387 P= +32 IP21=-.043 -1 .03
#65 ...S12 10/21/1974 669.02 +10.0% no paper loss
1.057 -.018 P= 95 IP21=-.043 1 -.054
#66 ...S9...S12...S15 8/29/1975 835.34 +4.8% no paper loss
1.024 .055 P= -139 IP21=-.102 -3 .008
#67 ...S12 9/8/1978 907.74 +13.2% no paper loss
1.019 .216 P= 109 IP21=-.062 -3 .078
The DJI fell to the lower band, where there no Buy signal.
It recovered back to near the upper band and then collapsed.
#68 ...S9...S12 10/11/1978 901.42 +7.2% no paper loss
1.032 -.068 P=-126 IP21= -.124 -4 -.101
#69 ...S9...S12 1/2/1981 972.78 +3.5% no paper loss
1.029 -.264 P= -71 IP21=-.04 -5 -.016
 #70 ...S9...S12 1/29/1982 871.10 +5.4% no paper loss
1.02 -.028 P= -87 IP21=- +.005 -5 +.018
This was at right shoulder apex in continuation head/shoulders.
==========================================================================
Note that there is no S12 in August 1982 due to earlier Buys.
The DATA1982 charts show this properly.
#70 ...S9...S12 1/29/1982 871.10 +5.4% no paper loss
1.02 -.028 P= -87 IP21=- +.005 -5 +.018
This was at right shoulder apex in continuation head/shoulders.
==========================================================================
Note that there is no S12 in August 1982 due to earlier Buys.
The DATA1982 charts show this properly.
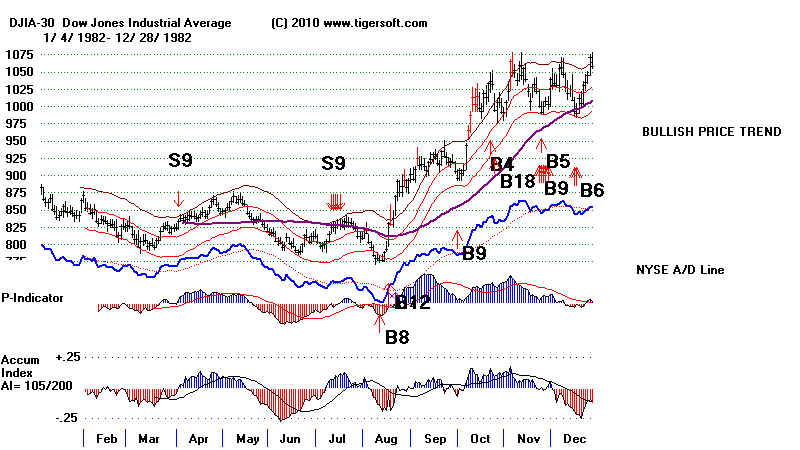 =========================================================================
#71...S12 1/6/1983 1070.92 +3.8% 1% paper loss
1.036 .161 P= 36 IP21= -.092 0 -.134
very over-bought
also 1/7/1983 1076.07 +4.3% 1% paper loss
1.04 .334 P= 48 IP21= -.062 1 -.002
=========================================================================
#71...S12 1/6/1983 1070.92 +3.8% 1% paper loss
1.036 .161 P= 36 IP21= -.092 0 -.134
very over-bought
also 1/7/1983 1076.07 +4.3% 1% paper loss
1.04 .334 P= 48 IP21= -.062 1 -.002
 #72...S12 1/5/1984 1282.24 +10.8% less than 1/2% paper loss
1.022 .152 P= 34 IP21 = -.035 -1 -.154
also ...S12 1/6/1984 1286.64 +1.1%
1.022 .152 P= 34 IP21 = -.035 -1 -.154
#72...S12 1/5/1984 1282.24 +10.8% less than 1/2% paper loss
1.022 .152 P= 34 IP21 = -.035 -1 -.154
also ...S12 1/6/1984 1286.64 +1.1%
1.022 .152 P= 34 IP21 = -.035 -1 -.154
 #73 ...S9...S12 5/6/1987 2342.19 +5.2% No Paper loss
1.021 -.328 P= -185 IP21= -.079 -15 -.147
#74 ...S12 6/8/1987 2351.64 -4.0% Paper Loss = -4%
1.026 .088 P= -32 IP21= -.045 -4 -.176
If one had waited for decliners to outnumber advancers, there
would have been no clinching of this Sell S12.
#75 ...S9...S12 10/2/1987 2640.99 +30.3%
1.026 .18 P= -56 IP21= -.017 -7 .068
This was 4th S9/S12 in 7 months. The fifth set of major Sells.
This shows high vulnerability in the stock market.
#73 ...S9...S12 5/6/1987 2342.19 +5.2% No Paper loss
1.021 -.328 P= -185 IP21= -.079 -15 -.147
#74 ...S12 6/8/1987 2351.64 -4.0% Paper Loss = -4%
1.026 .088 P= -32 IP21= -.045 -4 -.176
If one had waited for decliners to outnumber advancers, there
would have been no clinching of this Sell S12.
#75 ...S9...S12 10/2/1987 2640.99 +30.3%
1.026 .18 P= -56 IP21= -.017 -7 .068
This was 4th S9/S12 in 7 months. The fifth set of major Sells.
This shows high vulnerability in the stock market.
 Resume editing here.
#76...S12 9/18/1997 7922.72 +5.4% 4.5% Paper Loss
1.013 .007 P=259 IP21= -.001 0 -.009
low
DJI rallied to 8178 peak on 10/7/1997 before declining
below the lower band. A rally closer to the upper band
might have been expected.
#77 ...S12 9/29/1997 7991.43 +6.2%
1.018 .451 P=335 IP21= -.017 19 -.06
Resume editing here.
#76...S12 9/18/1997 7922.72 +5.4% 4.5% Paper Loss
1.013 .007 P=259 IP21= -.001 0 -.009
low
DJI rallied to 8178 peak on 10/7/1997 before declining
below the lower band. A rally closer to the upper band
might have been expected.
#77 ...S12 9/29/1997 7991.43 +6.2%
1.018 .451 P=335 IP21= -.017 19 -.06
 #78 ...S9...S12 7/8/1998 9174.97 +16.0% Paper Loss=2%
1.02 .053 P= -5 IP21= -.039 -24 .05
#78 ...S9...S12 7/8/1998 9174.97 +16.0% Paper Loss=2%
1.02 .053 P= -5 IP21= -.039 -24 .05
 On 5/12/99 the IP21 closed below its 21-day ma fo rthe first
time in more than a month. The DJI was up 20% in the last
3 months. This was a day before the DJI fell back to the
support of the rising 65-dma. There was no Peerless
Sell. But perhaps, such conditions deserve one.
1.021 .671 312 .057 29 .33
Possibly the Sell S4 rules should be changed.
editors note: 2/8/2013...
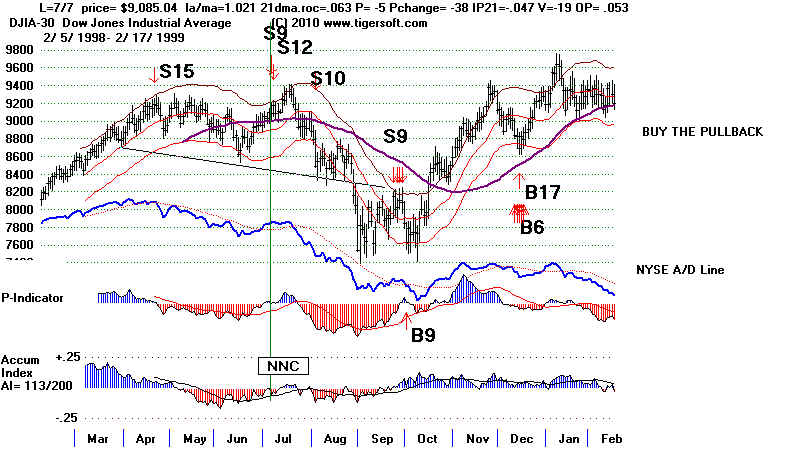
#79 ...S9...S12 8/17/1999 11117.07 +6.4% Paper Loss=2%
1.025 -.077 P= -425 IP21= -.025 -119 -.126
DJI rallied to 3.9% band and 11326.03 before falling
below the lower band. See how it reversed right at the
rising resistance line. Its failure there added to the
bearishness given the long bull market run from 1982.
The DJI was up more than 10000 points in 17 years.
#80 ...S15...S12 1/7/2000 11522.56 +13.1% Paper Loss=2%
1.021 .48 P= -23 IP21= -.028 -59 .341
DJI peaked a week later on 1/14/2000 at 11722.98.
#81 ...S12 1/4/2001 10912.41 No Paper Loss
1.02 .392 P= +347 IP21= -.007 -36 .091
An early January pivot down.
#82 ...S9...S12 5/17/2002 10353.08 +20.9% No Paper Loss
1.028 .175 P= 48 IP21= -.018 -148 .079
On 5/12/99 the IP21 closed below its 21-day ma fo rthe first
time in more than a month. The DJI was up 20% in the last
3 months. This was a day before the DJI fell back to the
support of the rising 65-dma. There was no Peerless
Sell. But perhaps, such conditions deserve one.
1.021 .671 312 .057 29 .33
Possibly the Sell S4 rules should be changed.
editors note: 2/8/2013...
#79 ...S9...S12 8/17/1999 11117.07 +6.4% Paper Loss=2%
1.025 -.077 P= -425 IP21= -.025 -119 -.126
DJI rallied to 3.9% band and 11326.03 before falling
below the lower band. See how it reversed right at the
rising resistance line. Its failure there added to the
bearishness given the long bull market run from 1982.
The DJI was up more than 10000 points in 17 years.
#80 ...S15...S12 1/7/2000 11522.56 +13.1% Paper Loss=2%
1.021 .48 P= -23 IP21= -.028 -59 .341
DJI peaked a week later on 1/14/2000 at 11722.98.
#81 ...S12 1/4/2001 10912.41 No Paper Loss
1.02 .392 P= +347 IP21= -.007 -36 .091
An early January pivot down.
#82 ...S9...S12 5/17/2002 10353.08 +20.9% No Paper Loss
1.028 .175 P= 48 IP21= -.018 -148 .079
 #83 ...S12 1/6/2003 8773.57 +5.2% Paper loss under 1/2%
1.031 .05 P= 184 IP21= .034 -67 -.06
#83 ...S12 1/6/2003 8773.57 +5.2% Paper loss under 1/2%
1.031 .05 P= 184 IP21= .034 -67 -.06
 #84 ...S12 4/5/2004 10558.37 +4.4% No Paper loss
1.027 -.043 P= 24 IP21 = -.069 -145 -.144
This was a rebound failure rally. It did not reverse a Buy.
---------------------------------------------------------------------
X ..S12 6/30/2006 11150.22 +3.1%
1.015 -.119 P = -151 IP21= -.078 -250 -.215
too low.
Back-testing shows that a rally only 1.5% above
the 21-day ma is often wrong. But it is not often
that all the internal strength indicators are negative
on even such a rally. The period before July 4th is
usually bullish. Ordinarily, we would wait for an
additional rise.
---------------------------------------------------------------------
#85 ..S12...S9 12/6/2007 13619.89 +12.6% 1% Paper Loss.
1.035 -.037 P= -146 IP21= -.075 -173 -.122
These were very negative internals for a DJI 3.5%
over the 21-day ma. And given the earlier Sells,
considerability vulnerability was suggested.
#86 ...S12 11/5/2008 9139.27 +7.9% No Paper loss
1.02 -.408 P= -137 IP21 -.051 -247 -.255
#87 ...S12 1/6/2009 9815.1 +8.7% No Paper loss
1.037 .878 P= 562 IP21= .028 97 -.066
#88 ...S12 6/16/2010 10409.46 +6.1% Paper Loss - under 1/2%
1.025 -.253 P= 12 IP21= -.013 150 -.196
#89 ...S12 6/30/2011 12414/34 Loss=-1.4% Paper Loss = 1.4%
1.027 .122 P= 78 IP21= -.067 -116 .012
Sell S12s right before the 4th of July tend to be premature.
That was true here.
#90 ...S12 9/1/2011 12493.57 +6.3% No paper loss
1.022 -.426 P- 43 IP21= -.036 -182 .151
Sell S12s right before the 4th of July tend to be premature.
That was true here.
#91 ...S12 12/7/2011 12196.37 +3.5% No paper loss
1.029 .129 P- -35 IP21= -.27 -68 .098
#92 ...S12 1/3/2012 12397.38 -1.5% Paper Loss = 1.5%
1.025 +.372 P- 246 IP21= -.09 +1 .01
Sell S12s right before the 4th of July tend to be premature.
That was true here.
==========================================================
Number of trades = 92
Avg. Gain= 7.52%
#84 ...S12 4/5/2004 10558.37 +4.4% No Paper loss
1.027 -.043 P= 24 IP21 = -.069 -145 -.144
This was a rebound failure rally. It did not reverse a Buy.
---------------------------------------------------------------------
X ..S12 6/30/2006 11150.22 +3.1%
1.015 -.119 P = -151 IP21= -.078 -250 -.215
too low.
Back-testing shows that a rally only 1.5% above
the 21-day ma is often wrong. But it is not often
that all the internal strength indicators are negative
on even such a rally. The period before July 4th is
usually bullish. Ordinarily, we would wait for an
additional rise.
---------------------------------------------------------------------
#85 ..S12...S9 12/6/2007 13619.89 +12.6% 1% Paper Loss.
1.035 -.037 P= -146 IP21= -.075 -173 -.122
These were very negative internals for a DJI 3.5%
over the 21-day ma. And given the earlier Sells,
considerability vulnerability was suggested.
#86 ...S12 11/5/2008 9139.27 +7.9% No Paper loss
1.02 -.408 P= -137 IP21 -.051 -247 -.255
#87 ...S12 1/6/2009 9815.1 +8.7% No Paper loss
1.037 .878 P= 562 IP21= .028 97 -.066
#88 ...S12 6/16/2010 10409.46 +6.1% Paper Loss - under 1/2%
1.025 -.253 P= 12 IP21= -.013 150 -.196
#89 ...S12 6/30/2011 12414/34 Loss=-1.4% Paper Loss = 1.4%
1.027 .122 P= 78 IP21= -.067 -116 .012
Sell S12s right before the 4th of July tend to be premature.
That was true here.
#90 ...S12 9/1/2011 12493.57 +6.3% No paper loss
1.022 -.426 P- 43 IP21= -.036 -182 .151
Sell S12s right before the 4th of July tend to be premature.
That was true here.
#91 ...S12 12/7/2011 12196.37 +3.5% No paper loss
1.029 .129 P- -35 IP21= -.27 -68 .098
#92 ...S12 1/3/2012 12397.38 -1.5% Paper Loss = 1.5%
1.025 +.372 P- 246 IP21= -.09 +1 .01
Sell S12s right before the 4th of July tend to be premature.
That was true here.
==========================================================
Number of trades = 92
Avg. Gain= 7.52%
SELL S12s in Rising Markets:(above 65-dma) and no Nearby S4,S6, S9s
------------------------------------------------------------------------------------
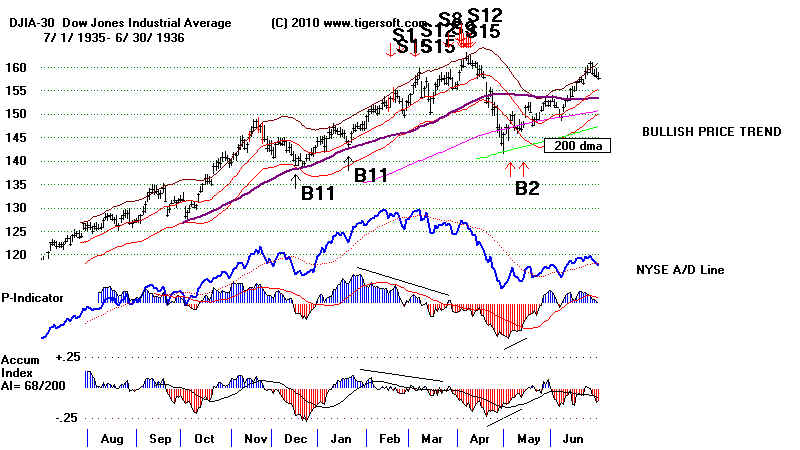
6/12/35 117.1 Reversal loss -8.7% OP= +.072 Avoided using A/D Line trend-break clinching.
CL/MA = 1.02
21-dayma ROC = .301
P=41 (very high for the number of NYSE stocks traded.)
IP21= -.032
V= -44
OPCT = .114
6/24/35 120. Reversal loss -6.1% OP= +.067 Avoided using A/D Line trend-break clinching.
CL/MA = 1.035
21-dayma ROC = .329
P = 29 (very high for the number of NYSE stocks traded.
IP21= -.024
V - -76
OPCT = .03
7/27/38 140.20 fell directly to 136.90 and lower band. OP= +.014
CL/MA = 1.014
21-dayma ROC = .838
P = 88 (very high for the number of NYSE stocks traded.
IP21= -.009
V = 131
OPCT = - .051
8/5/38 144.50 fell directly to 136.90 and lower band. OP= +.028
. 8/24/38 143.50 Fell immediately, reaching 129.90 below lower band a month later. OP= -.174
-----------------------
3/16/1967 868.49 fell directly to 842.43 .025 lower band in 3 weeks. OP= +.017
4/21/1967 883.18 Rallied to 899.89 and fell slightly below lower band in a month, 899.89. OP= +.179
---------------------------
9/14/1967 929.44 Rallied to 937.18 and fell below lower band in 6 weeks to 850. OP= +.109
-------------------
1/9/1968 908.29 Rallied to 900.24 and fell below lower band in 19 weeks to 825. OP= +.158
-----------------------
. 7/11/1968 922.82 Fell immediately, reaching 870.37 and lower band 3 weeks later. OP= -.008
10/21/1975 846.82 Rallied to 860.67 and then fell slightly below lower band, 793.80, on 9/30/75 .OP= +.125
---------------------------------
7/17/1978 839.05 Fell only to 21-dma immedately and then rallied OP= +.051
(9/11/1978 907.74 Declined to lower band at 857.16 in 7 trading days and rallied OP= +.187
and one months later fell below the lower band without a new Buy.
---------------------- )
4/1/1981 1014.14 Rose to 1024.05 and fell to the lower band in a month, 963.33 -.052
and two months later fell below the lower band without a new Buy.
----------------------
1/6/1983 1070.92 Rose to 1083.79 and fell to the lower band in 3 weeks, 1030.17 -.134
1/6/1984 1286.64 Immediately declined below lower band to 1134.63 on 2/23/1984 OP= -.154
--------------------
10/7/1997 8178.31 Immediately declined below lower band to 7161.15 on 10/27/1997 OP= +.118
-----------------------
6/18/1999 10855.55 DJI rallied to 11300 in 2 months before falling to 10019.71 on 10/15/1999 OP= +.046
The DJI fell below the lower band four months later and there was no intervening Buy.
CL/MA = 1.016
21-dayma ROC = -.035
P = 20 (very high for the number of NYSE stocks traded.
IP21= -.034
V - 49
OPCT = .046
----------------------------
7/17/2000 10804.27 Fell immediately to 10511.17 on 7/28/2000, then rallied to 11259.87 on 9/7/2000 and
then fell to 9975.02 on 10/18/2000 OP= +.193 and OP= +.12 on 2nd S12 two days later.
. 12/8/2000 10712.91 Fell immediately to lower band, 10487.29, on 12/21/2000
and then far below lower band to 9389.48, on 3/22/2000 OP= -.156
------------------------
10/15/2009 10062.94 (Dial Data corrected data) OP= -.07
CL/MA = 1.03
21-dayma ROC = .331
P = 149
IP21= .019
V = - 98
OPCT = -.07
10/21/2009 9949.36 (Dial Data uncorrected data)
CL/MA = 1.014
21-dayma ROC = .145
P = 62
IP21= .004
V = - 164
OPCT = -.207
11/131/2009 10279.47 (Dial Data uncorrected data)
CL/MA = 1.027
21-dayma ROC = .247
P = -110
IP21= -.007
V = - 216
OPCT = .08
Table S12-C
Peerless
Sell S12s with Negative V-Indicator Readings: 1966-2010Peerless Sell S12s: 1928-2009 Date DJI Gain
------------- ----------- --------
...S12 1/ 18/ 1966 994.2 +22.0%
Reversed at 775.72 on 8/30/66 by B19
1/18/1966 994.2 la/ma=1.02 21dma.roc=.445
la/65dma=1.036 65dma.roc=.227
P= 49 Pchange=-2 IP21= -.028 V= 5 OP= .495
------------------------------------------------------------------------------------
...S9...S12 9/ 15/ 1966 814.3 +6.9%
9/15/1966 814.3 la/ma=1.029 21dma.roc=-.143
la/65dma=.964 65dma.roc=-.405
P=-174 Pchange= 50 IP21= -.078 V=-13 OP= -.155
------------------------------------------------------------------------------------
...S12 10/ 26/ 1966 801.11 +1.4%
10/26/1966 801.11 la/ma=1.036 21dma.roc=.108
la/65dma=1.003 65dma.roc=-.246
P=-61 Pchange= 21 IP21= -.059 V=-9 OP= .054
------------------------------------------------------------------------------------
...S12 3/ 16/ 1967 868.49 -0.9%
3/16/1967 868.49 la/ma=1.025 21dma.roc=.163
la/65dma=1.041 65dma.roc=.221
P=-5 Pchange= 1 IP21= -.042 V= 6 OP= .017
------------------------------------------------------------------------------------
...S12 4/ 21/ 1967 883.18 +1.4%
4/21/1967 883.18 la/ma=1.022 21dma.roc=.174
la/65dma=1.032 65dma.roc=.16
P= 50 Pchange=-1 IP21= -.02 V= 2 OP= .186
------------------------------------------------------------------------------------
...S12 9/ 14/ 1967 929.44 +7.5%
9/14/1967 929.44 la/ma=1.024 21dma.roc=.135
la/65dma=1.035 65dma.roc=.185
P= 12 Pchange=-1 IP21= -.009 V= 2 OP= .211
------------------------------------------------------------------------------------
...S12 1/ 9/ 1968 908.29 +7.8%
1/9/1968 908.29 la/ma=1.018 21dma.roc=.215
la/65dma=1.023 65dma.roc=-.057
P= 72 Pchange= 4 IP21= -.025 V= 5 OP= .158
------------------------------------------------------------------------------------
...S12 7/ 11/ 1968 922.82 +4.8%
7/11/1968 922.82 la/ma=1.017 21dma.roc=.081
la/65dma=1.022 65dma.roc=.35
P= 36 Pchange=-18 IP21= -.052 V= 5 OP= -.008
------------------------------------------------------------------------------------
...S12 10/ 16/ 1969 838.77 +8.2%
10/16/1969 838.77 la/ma=1.025 21dma.roc=.178
la/65dma=1.018 65dma.roc=-.012
P= 24 Pchange= 31 IP21= -.012 V= 0 OP= -.099
------------------------------------------------------------------------------------
...S12 1/ 2/ 1970 809.7 +5.6%
1/2/1970 809.7 la/ma=1.026 21dma.roc=.126
la/65dma=.987 65dma.roc=-.016
P=-87 Pchange= 67 IP21= -.053 V=-2 OP= -.001
------------------------------------------------------------------------------------
...S9...S12 7/ 15/ 1970 711.66 +0.6%
7/15/1970 711.66 la/ma=1.023 21dma.roc=.416
la/65dma=1.007 65dma.roc=-.375
P=-87 Pchange= 16 IP21= -.016 V=-2 OP=.204
------------------------------------------------------------------------------------
...S12 8/ 24/ 1971 904.13 +8.6%
8/24/1971 904.13 la/ma=1.043 21dma.roc=.21
la/65dma=1.017 65dma.roc=-.077
P=-56 Pchange= 42 IP21= -.133 V=-1 OP= .09
------------------------------------------------------------------------------------
...S9...S12 5/ 22/ 1972 965.31 +5.6%
5/22/1972 965.31 la/ma=1.023 21dma.roc=.019
la/65dma= 65dma.roc=
P=-89 Pchange=13 IP21= -.031 V=-2 OP= .127
---------------------------------------------------------------------------
...S9...S12 8/ 3/ 1972 947.7 +2.7%
8/3/1972 947.7 la/ma=1.022 21dma.roc=.183
la/65dma=1.008 65dma.roc=.051
P=-82 Pchange=-3 IP21= -.056 V=-2 OP= -.138
-----------------------------------------------------------------------------
...S12 1/ 12/ 1973 1039.36 +15.9%
Reversed at 874.17 on 8/15/73 by B17
1/12/1973 1039.36 la/ma=1.011 21dma.roc=.036
la/65dma=1.042 65dma.roc=.362
P=-126 Pchange=-30 IP21= -.037 V=-3 OP= -.045
------------------------------------------------------------------------------------
...S12 7/ 12/ 1973 901.94 +3.1%
7/12/1973 901.94 la/ma=1.019 21dma.roc=-.336
la/65dma=.986 65dma.roc=-.192
P=-77 Pchange=-18 IP21= -.052 V=-2 OP= .014
------------------------------------------------------------------------------------
...S12 1/ 2/ 1974 855.32 +3.6%
1/2/1974 855.32 la/ma=1.038 21dma.roc=.292
la/65dma=.956 65dma.roc=-.421
P=-86 Pchange= 38 IP21= -.008 V=-2 OP= -.076
------------------------------------------------------------------------------------
...S9...S12 2/ 22/ 1974 855.99 +27.3%
Reversed at 621.95 on 9/27/1974 by B8
2/22/1974 855.99 la/ma=1.027 21dma.roc=-.214
la/65dma=1.022 65dma.roc=-.163
P= 21 Pchange= 7 IP21= -.083 V=-2 OP= -.084
------------------------------------------------------------------------------------
...S9...S12 6/ 7/ 1974 853.72 +27.1%
6/7/1974 853.72 la/ma=1.033 21dma.roc=.039
la/65dma=1.006 65dma.roc=-.119
P=-77 Pchange= 39 IP21= -.074 V=-2 OP= .032
------------------------------------------------------------------------------------
...S12 10/ 18/ 1974 654.88 +6.9%
10/18/1974 654.88 la/ma=1.033 21dma.roc=-.359
la/65dma=.947 65dma.roc=-.746
P= 100 Pchange=-28 IP21= -.071 V=-1 OP= -.153
------------------------------------------------------------------------------------
...S9...S12 8/ 29/ 1975 835.34 +4.8%
8/25/1975 812.34 la/ma=.994 21dma.roc=-.316
la/65dma=.967 65dma.roc=-.031
P=-238 Pchange= 49 IP21= -.193 V=-4 OP= -.207
------------------------------------------------------------------------------------
...S12 10/ 21/ 1975 846.82 +2.5%
10/21/1975 846.82 la/ma=1.031 21dma.roc=.383
la/65dma=1.031 65dma.roc=-.038
P= 91 Pchange= 34 IP21= .012 V= 0 OP= .133
------------------------------------------------------------------------------------
...S12 3/ 25/ 1976 1002.13 +3.5%
3/25/1976 1002.13 la/ma=1.017 21dma.roc=.091
la/65dma=1.053 65dma.roc=.662
P=-75 Pchange=-11 IP21= -.063 V=-1 OP= .201
------------------------------------------------------------------------------------
...S12 7/ 17/ 1978 839.05 -5.7%
7/17/1978 839.05 la/ma=1.02 21dma.roc=-.075
la/65dma=1.007 65dma.roc=.295
P=-90 Pchange= 52 IP21= -.014 V=-2 OP= .053
------------------------------------------------------------------------------------
...S12 9/ 11/ 1978 907.74 +13.2%
9/11/1978 907.74 la/ma=1.018 21dma.roc=.298
la/65dma=1.057 65dma.roc=.204
P= 138 Pchange= 29 IP21= -.068 V= 4 OP= .141
------------------------------------------------------------------------------------
...S9...S12 10/ 10/ 1978 891.63 +11.7%
10/10/1978 891.63 la/ma=1.02 21dma.roc=-.219
la/65dma=1.021 65dma.roc=.33
P=-139 Pchange=-19 IP21= -.136 V=-5 OP= -.19
------------------------------------------------------------------------------------
...S9...S12 10/ 11/ 1978 901.42 +12.6%
11/13/1978 792.01 la/ma=.961 21dma.roc=-1.508
la/65dma=.916 65dma.roc=-.439
P=-541 Pchange=-30 IP21=.144 V=-13 OP= -.382
------------------------------------------------------------------------------------
...S12 1/ 17/ 1980 863.57 +9.9%
1/17/1980 863.57 la/ma=1.022 21dma.roc=.267
la/65dma=1.042 65dma.roc=.151
P= 48 Pchange=-19 IP21= -.025 V= 1 OP= -.08
------------------------------------------------------------------------------------
...S9...S12 1/ 2/ 1981 972.78 +3.5%
1/2/1981 972.78 la/ma=1.029 21dma.roc=-.264
la/65dma=1.02 65dma.roc=.067
P=-71 Pchange= 30 IP21= -.04 V=-5 OP= -.017
------------------------------------------------------------------------------------
...S12 4/ 1/ 1981 1014.14 +16.9%
4/1/1981 1014.14 la/ma=1.024 21dma.roc=.58 la/65dma=1.049
65dma.roc=.203 P= 203 Pchange= 26
IP21= -.041 V= 5 OP= -.008
------------------------------------------------------------------------------------
...S12 1/ 6/ 1983 1070.92 +3.8%
1/6/1983 1070.92 la/ma=1.036 21dma.roc=.161 la/65dma=1.046
65dma.roc=.616 P= 36 Pchange= 36
IP21= -.092 V= 0 OP= -.139
------------------------------------------------------------------------------------
...S12 1/ 7/ 1983 1076.07 +4.3%
1/7/1983 1076.07 la/ma=1.04 21dma.roc=.334 la/65dma=1.049
65dma.roc=.495 P= 48 Pchange= 12
IP21= -.062 V= 1 OP= .002
------------------------------------------------------------------------------------
...S12 1/ 6/ 1984 1286.64 +12.5%
1/6/1984 1286.64 la/ma=1.022 21dma.roc=.152 la/65dma=1.025
65dma.roc=.169 P= 34 Pchange= 28
IP21= -.035 V=-1 OP= -.162
------------------------------------------------------------------------------------
...S9...S12 5/ 6/ 1987 2342.19 +5.2%
5/6/1987 2342.19 la/ma=1.021 21dma.roc=-.328 la/65dma=1.03
65dma.roc=.275 P=-185 Pchange=-9
IP21= -.079 V=-15 OP= -.155
------------------------------------------------------------------------------------
...S9...S12 6/ 8/ 1987 2351.64 -4.0%
6/8/1987 2351.64 la/ma=1.026 21dma.roc=.088 la/65dma=1.022
65dma.roc=.125 P=-32 Pchange= 23
IP21= -.045 V=-4 OP= -.187
------------------------------------------------------------------------------------
...S9...S12 10/ 2/ 1987 2640.99 +30.3%
10/2/1987 2640.99 la/ma=1.026 21dma.roc=.18 la/65dma=1.026
65dma.roc=.346 P=-56 Pchange= 41
IP21= -.017 V=-7 OP= .072
------------------------------------------------------------------------------------
...S12 9/ 12/ 1988 2072.37 +0.3%
9/12/1988 2072.37 la/ma=1.02 21dma.roc=.194 la/65dma=.994
65dma.roc=-.039 P= 3 Pchange=-1
IP21= -.022 V= 2 OP= .073
------------------------------------------------------------------------------------
...S12 10/ 7/ 1997 8178.31 +8.3%
10/7/1997 8178.31 la/ma=1.033 21dma.roc=.517 la/65dma=1.028
65dma.roc=.154 P= 349 Pchange=-17
IP21= .017 V= 25 OP= .123
------------------------------------------------------------------------------------
...S12 11/ 20/ 1997 7826.61 -1.7%
11/20/1997 7826.61 la/ma=1.031 21dma.roc=-.326 la/65dma=1.002
65dma.roc=-.096 P=-106 Pchange= 74
IP21= -.014 V=-42 OP= .173
------------------------------------------------------------------------------------
...S12 7/ 7/ 1998 9085.04 +16.0%
7/7/1998 9085.04 la/ma=1.021 21dma.roc=.063 la/65dma=1.009
65dma.roc=.042 P=-5 Pchange=-38
IP21= -.047 V=-19 OP= .056
------------------------------------------------------------------------------------
...S9...S12 4/ 7/ 1999 10085.3 -5.6% Big Loss!
4/7/1999 10085.3 la/ma=1.021 21dma.roc=.432 la/65dma=1.059
65dma.roc=.365 P=-117 Pchange= 2
IP21= -.011 V=-41 OP= -.144
------------------------------------------------------------------------------------
...S12 6/ 18/ 1999 10855.55 +4.2%
6/18/1999 10855.55 la/ma=1.016 21dma.roc=-.035 la/65dma=1.03
65dma.roc=.356 P=-20 Pchange=-16
IP21= -.034 V=-49 OP= .048
------------------------------------------------------------------------------------
...S9...S12 8/ 17/ 1999 11117.07 +6.4%
8/17/1999 11117.07 la/ma=1.025 21dma.roc=-.077 la/65dma=1.025
65dma.roc=.072 P=-425 Pchange= 58
IP21= -.025 V=-119 OP= -.132
------------------------------------------------------------------------------------
( ...S12 12/ 17/ 1999 11257.43 Reversed at 10963.8 on 2/4/2000 by B17
not allowed because of likelihood Santa Claus Rally)
12/17/1999 11257.43 la/ma=1.014 21dma.roc=.402 la/65dma=1.052
65dma.roc=.187 P=-465 Pchange= 50
IP21= -.041 V=-108 OP= .111
------------------------------------------------------------------------------------
...S12 7/ 17/ 2000 10804.27 +0.3%
7/17/0 10804.27 la/ma=1.023 21dma.roc=.101 la/65dma=1.016
65dma.roc=-.117 P= 104 Pchange=-8
IP21= -.046 V=-61 OP= .202
------------------------------------------------------------------------------------
...S12 7/ 19/ 2000 10696.08 -0.7%
7/19/0 10696.08 la/ma=1.01 21dma.roc=.156 la/65dma=1.005
65dma.roc=.14 P= 72 Pchange=-22
IP21= -.033 V=-63 OP= .126
------------------------------------------------------------------------------------
...S12 12/ 8/ 2000 10712.91 +11.3%
12/8/0 10712.91 la/ma=1.012 21dma.roc=-.218 la/65dma=1.006
65dma.roc=-.198 P=-3 Pchange= 68
IP21= -.023 V=-121 OP= -.163
------------------------------------------------------------------------------------
...S12 4/ 10/ 2001 10102.74 -5.1% Big Loss
4/10/2001 10102.74 la/ma=1.031 21dma.roc=-.128
la/65dma=.971 65dma.roc=-.207
P=-121 Pchange= 134 IP21= .053 V=-174 OP= .099
------------------------------------------------------------------------------------
...S9...S12 10/ 10/ 2001 9240.86 -0.2%
10/10/2001 9240.86 la/ma=1.032 21dma.roc=-1.049 la/65dma=.933
65dma.roc=-.516 P=-212 Pchange= 96
IP21= .053 V=-245 OP= -.269
------------------------------------------------------------------------------------
...S12 5/ 14/ 2002 10298.14 +20.5%
5/14/2002 10298.14 la/ma=1.024 21dma.roc=.242
la/65dma=1.008 65dma.roc=.208
P= 107 Pchange= 75 IP21= -.024 V=-110 OP= -.004
------------------------------------------------------------------------------------
...S12 8/ 8/ 2002 8712.02 +4.3%
8/8/2002 8712.02 la/ma=1.039 21dma.roc=-.144
la/65dma=.941 65dma.roc=-.467
P=-271 Pchange= 132 IP21= .063 V=-327 OP= -.262
------------------------------------------------------------------------------------
...S12 1/ 6/ 2003 8773.57 +5.2%
1/6/2003 8773.57 la/ma=1.031 21dma.roc=.05
la/65dma=1.042 65dma.roc=.466
P= 204 Pchange= 83 IP21= .068 V=-85 OP= -.05
------------------------------------------------------------------------------------
...S12 4/ 5/ 2004 10558.37 +5.6%
4/5/2004 10558.37 la/ma=1.027 21dma.roc=-.043
la/65dma=1.007 65dma.roc=.038
P= 24 Pchange=-70 IP21= -.069 V=-145 OP= -.152
----------------------------------------------------------------------------------
...S12 6/ 30/ 2006 11150.22 +3.1%
6/30/2006 11150.22 la/ma=1.015 21dma.roc=-.119
la/65dma=.996 65dma.roc=-.023
P=-151 Pchange=-29 IP21=.078 V=-250 OP= -.224
------------------------------------------------------------------------------------
...S12 12/ 6/ 2007 13619.89 +3.3%
12/6/2007 13619.89 la/ma=1.035 21dma.roc=-.037
la/65dma=1.004 65dma.roc=.089
P=-146 Pchange= 47 IP21= -.075 V=-173 OP= -.095
------------------------------------------------------------------------------------
...S12 11/ 5/ 2008 9139.27 +12.0%
11/5/2008 9139.27 la/ma=1.02 21dma.roc=-.408
la/65dma=.873 65dma.roc=-.907
P=-137 Pchange= 26 IP21= -.051 V=-247 OP= -.27
------------------------------------------------------------------------------------
...S12 10/ 15/ 2009 10062.94 -3.6%
10/15/2009 10062.94 la/ma=1.03 21dma.roc=.331
la/65dma=1.064 65dma.roc=.589 P= 149 Pchange=-97
IP21= .019 V=-98 OP= -.074
------------------------------------------------------------------------------------
...S12 11/ 13/ 2009 10270.47 -0.4%
11/13/2009 10270.47 la/ma=1.027 21dma.roc=.247
la/65dma=1.054 65dma.roc=.345
P=-110 Pchange= 66 IP21= -.007 V=-216 OP= .085
------------------------------------------------------------------------------------
==========================================================
Number of trades = 104 Losses = 29 Gains = 75
Avg. Gain= ?
S9
|
Table S12-D Simultaneous Peerless Sell S12s/S9s: 1928-2009
                Date          DJI           Gain
-------------                 -----------   --------
...S9...S12    10/ 16/ 1928   249.4               -8.7% Big Loss
...S9...S12    1/ 30/ 1929    312.6          +3.6%
...S9...S12    4/ 22/ 1929    315.3          +5.0%
...S9...S12    6/ 14/ 1929    313.7          +4.5%
...S9...S12    9/ 4/ 1929     379.6         +21.1%
...S9...S12    1/ 10/ 1930    250           +31.2%  Reversed on 1/23/31  B7 171.8
...S9...S12    6/ 20/ 1934     98.3          +7.1%
...S9...S12    9/ 27/ 1934     93.4                -8.0% Big Loss.
...S9...S12    4/ 2/ 1936     160.4          +7.4%
...S9...S12    4/ 6/ 1936     161.9          +8.2%
...S9...S12    5/ 11/ 1942     99.2                -5.2%
...S9...S12    1/ 7/ 1958     447.8                -2.4%
...S9...S12    7/ 1/ 1959     650.2          +1.9%
...S9...S12    7/ 10/ 1962    586            +1.2%
...S9...S12    9/ 15/ 1966    814.3          +6.9%
...S9...S12    7/ 15/ 1970    711.66         +0.6%
...S9...S12    5/ 22/ 1972    965.31         +5.6%
...S9...S12    8/ 3/ 1972     947.7          +2.7%
...S9...S12    2/ 22/ 1974    855.99        +27.3%
                                   Reversed at 621.95 on 9/27/1974 by B8
...S9...S12    6/ 7/ 1974     853.72        +27.1%
...S9...S12    8/ 29/ 1975    835.34         +4.8%
...S9...S12    10/ 10/ 1978   891.63        +11.7%
...S9...S12    10/ 11/ 1978   901.42        +12.6%
...S9...S12    1/ 2/ 1981     972.78         +3.5%
...S9...S12    5/ 6/ 1987    2342.19         +5.2%
...S9...S12    6/ 8/ 1987    2351.64                -4.0%
...S9...S12    10/ 2/ 1987   2640.99        +30.3%
...S9...S12    4/ 7/ 1999    10085.3                -5.6% Big Loss!
...S9...S12   8/ 17/ 1999   11117.07        +6.4%
...S9...S12    10/ 10/ 2001  9240.86               -0.2%
==========================================================
         Number of trades =  30  Losses = 7
         Average Gain per trade = +6.7%
         There were 5 Gains of more than 20%.
         There were 4 Losses of more than 5%