---------------------------------------------------------------------------------------------------------------------------------------------------
P-Indicator is Positive of Nearly So
When DJI Falls below 1.9% Lower Band
There have been 58 standard Buy B9s since 1928 that have been closed out.
They averaged a gain of 10.8%. Only 2 produced a loss if one sold the DJI
at the next Peerless Sell. The biggest gains were in the 3rd year of Presidential
Election years, +14.5% and in Novembers, +15.7%. Presidential Election year
Buy B9s gained only 6.6%.
11 of the 58 Buy B9s would have have required a trader of the DJI to sustain
a paper loss 1% to 3.7%. In 27 cases, they called the bottom perfectly and there
was no paper loss. The other 20 would have brought a maximum paper loss of 1%.
Size of Gains
of Standard Buy B9s
>10% 26 44.8%
>5%-9.99% 16 27.6%
>2%-4.99% 11 19.0%
0%-1.999% 2 3.4%
losses 3 5.2%
-----------------------------------------
58
The "standard Buy B9s" are produced when the DJI falls below the 1.9% lower
band with the P-Indicator positive or nearly so. The lowest allowed P-Indicator
was -29 in 2006. Adjusted for the number of shares traded on the NYSE, the
in 1929, this would have meant a P-Indicator reading of -3. Our program does
adjust the P-Indicator over time.
The standard Sell S9 also does not allow August Sells. Trading losses would have
been very big in the Augusts of 1937, 1946 and 2001. Buy B9s. Buy B9s are also
not allowed from February to May in the first year after a Presidential Election year.
There is a much bigger probability of a decline in the first half of the Year after a
Presidential Election when a Republcan sits in the White House. This was the case
in 1929, 1953, 1957, 1969, 1973, 1981 and, 2001 (7 cases). It was not true in 1985,
1989 and 2005 (3 cases). It also took place in 1977, when a Democrat was in the
White House. Importantly, 1977 was a time when the DJI fell even while the
P-Indicator showed positive readings as the DJI fell near to the lower band.
Buy B9s are also denied in the immediate aftermath of a Sell S4, Sell S12,
Sell S15, Sell S16 or Sell S18. The Sell S16 has the effect of cancelling Buy B9s that
would otherwise have occurred in the Januaries of 1940, 1962, 1970 and 1981.
Proximate Sell S12s prevented B9s in February 1933, February 1934, February 1984
and August 1990. They can quickly follow a Sell S9. Such was true in January 1988.
For example, the case below is not allowed because of the
Sell S18 of 6/23/1975.
S17 --> X19750722 B9 846.76 -.013 rising Paper loss 6.5%
Another element here: do not be surprised if the DJI continues to fall a little longer
than normally, i.e. below the first tagging of the lower band after a head/shoulders
DJI price pattern is completed or after a Sell S10.
Other key values are sometimes considered in a minor way when determining
if a standard Buy B9 is given. Fpr example, back-testing shows that Mays often
start a decline. Accordingly, we do not allow a Buy B9 in May if the P-Indicator
is below 5 and the IP21 is negative. This eliminates the following loss.
LA/MA P-I IP21
X19820519 B9 835.90 -.02 .978 2 -.025 -1 .005
low negative
It is always recommended that Peerless users consider the other key values
when a Buy B9 approaches and compare past Buy B9s' key values with the
current levels for the IP21, V-I and ObvPct. See these other key values in the second
table below.
There are a few non-standard( ^^) Buy B9s. These occur when the DJI falls
below the 4.7% lower band and the key values are showing support.
19460225 B9^^ 187.20 .135 .930 -91 .008 -270 -.083
19800421 B9^^ 759.13 .299 .978 -60 -.050 -5 -.198
20010323 B9^^ 9504.78 .183 .929 -181 -.007 -231 -.098
20020918 B9 8172.45 .074 .953 -58 -.010 -210 -.242
Peerless users will find that this December 2013 version of Peerless no longer allows
Buy B9s above the 1.9% lower band or when P-Indicator is below -30. This leaves out the
case below: :
X 20091002 B9 LA/MA=.983 9487.67 P= + 403 IP21 = .067 >5% paper loss
Research Still To Do
If I were to add a new variation of Buy B9s, it would be a provision for allowing a slightly
higher lower band in a very strong and steady bull markets. Research would show, I think,
that is a sign of a strong market when the DJI is above a quickly rising 65-dma and the DJI refuses
to retreat even to the 1.9% lower band, all the while the P-Indicator and IP21 remain quite positive.
|
Buy B9s: 1928-2013 Positive or Nearly Positive P-I NCs at Lower Band Pct.Gain Up/Down/Sidewise Paper Loss 19350531 B9 110.64 .198 up none
19400112 B9 145.9 -.008 sidewise <1%
19431108 B9 131.7 .245 down 1.6%
19431117 B9 130.2 .26 down <1%
19431126 B9 131.3 .249 down none
19440907 B9 143.6 .142 flat <1%
19440914 B9 142.9 .142 flat none
19480920 B9 177.4 .07 falling <1%
19481122 B9 176.3 .022 falling 2.9%
19481129 B9 172 .048 falling <1%
19481201 B9 173.2 .040 falling none
19501106 B9 222.5 .164 rising none
19501204 B9 225.4 .166 rising none
19550117 B9 388.2 .207 rising none
19581125 B9 540.5 .191 rising none
19661201 B9 789.75 .124 falling <1%
19670412 B9 844.65 .051 rising none
19670519 B9 874.55 .064 rising 3.1%
X 19750528 B9 871.05 .058 rising <1%
19751203 B9 825.49 .223 rising <1%
19761005 B9 966.76 .018 falling 3.7%
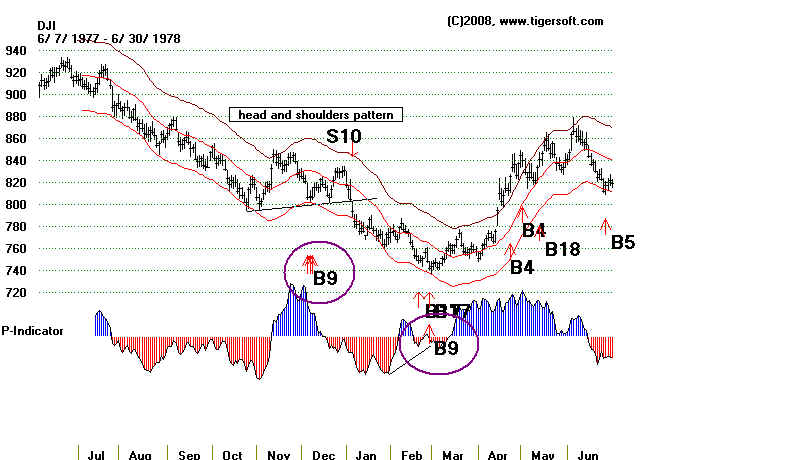
19771206 B9 806.91 -.017 falling 1.7%
19780223 B9 750.95 .154 falling <1%
(19780228 B9 742.12 .168 falling none)
19781218 B9 787.51 .125 falling none
19790206 B9 822.85 .077 rising 1.7%
19801028 B9 759.13 .058 falling none
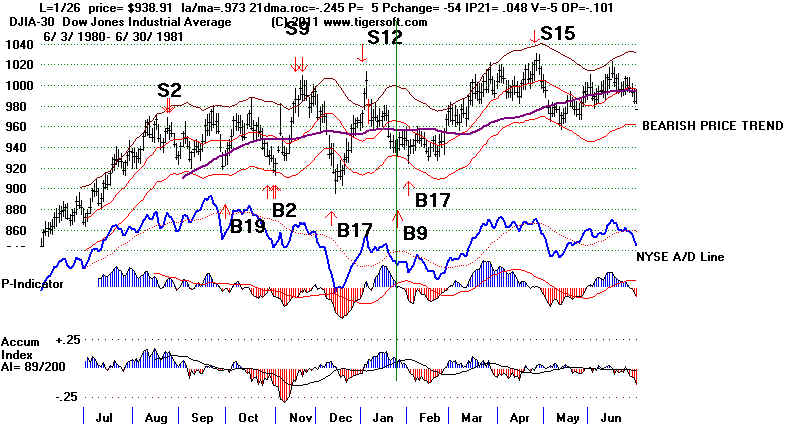
X19810126 B9 938.91 .071 falling <1%
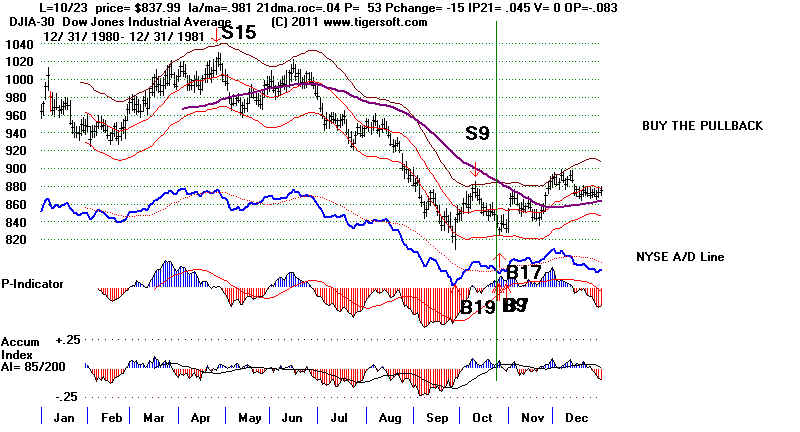
19811023 B9 837.99 .04 falling <1%
X19820519 B9 835.90 -.02 flat 2.0%
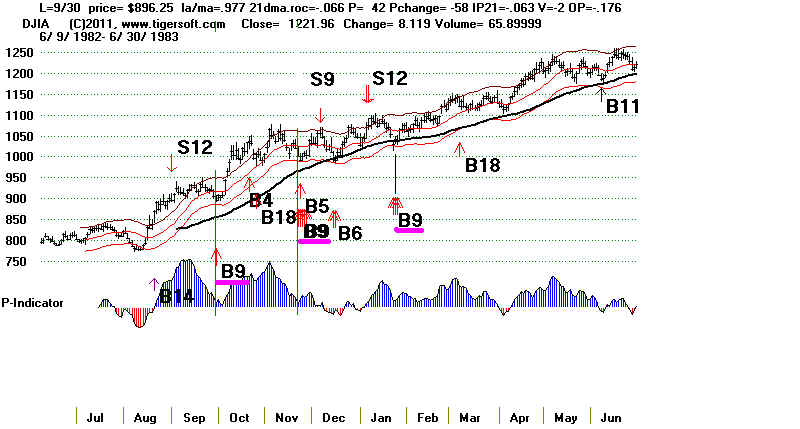
19820930 B9 896.25 .179 rising none
19821123 B9 990.99 .067 rising none
19830124 B9 1030.17 .207 rising <1%
19860122 B9 1502.29 .215 rising <1%
19860407 B9 1735.51 .052 rising <1%
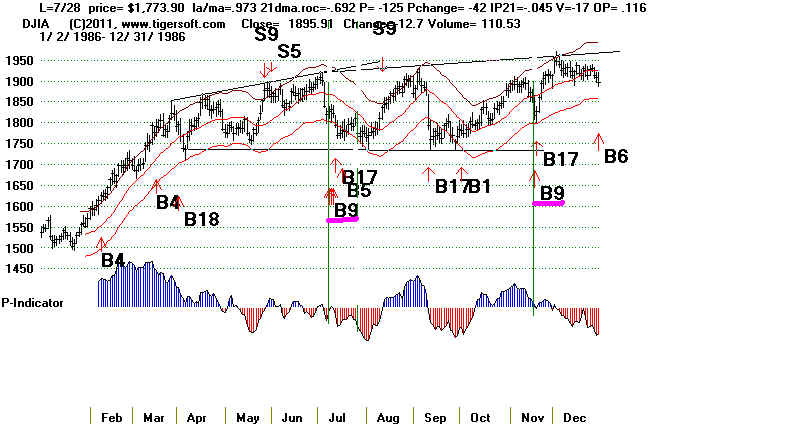
19860507 B9 1775.30 .049 rising <1%
19860709 B9 1826.07 .005 rising 3.4%
19861118 B9 1817.21 .324 rising none
19880108 B9 1911.31 .059 rising 1.7%
19880122 B9 1903.51 .063 rising none
19880325 B9 1978.95 .056 rising none
19910321 B9 2855.45 .060 rising none
19960110 B9 5032.94 .103 rising none
19960410 B9 5485.98 .048 rising <1%
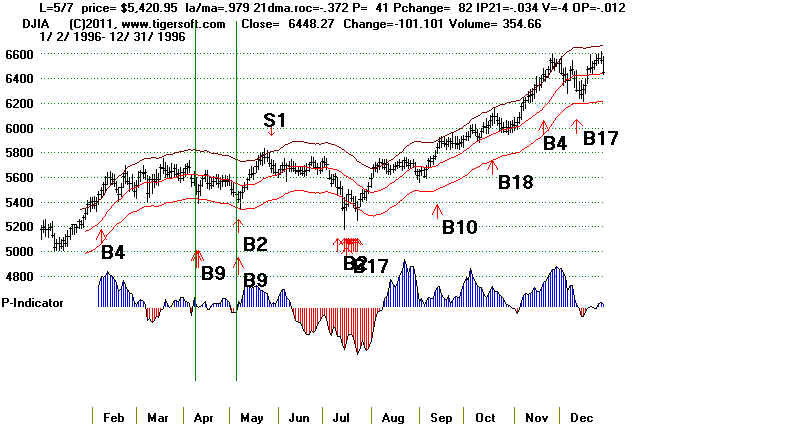
19960507 B9 5420.95 .06 rising none
19961213 B9 6304.87 .087 rising <1%
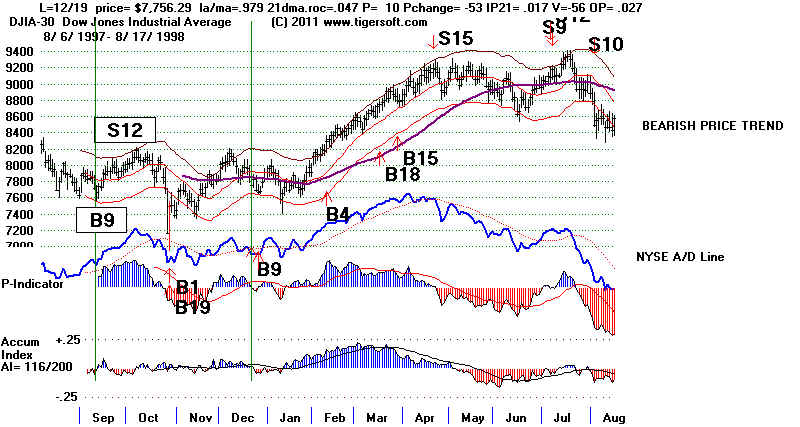
19970911 B9 7660.98 .034 rising none
19971219 B9 7756.29 .184 rising <1%
19981001 B9 7632.53 .459 falling none
19990524 B9 10654.67 .045 rising <1%
20001124 B9 10470.23 .042 falling none
20001220 B9 10318.93 .058 flat none
20021209 B9 8473.41 .035 rising 2.0%
20021219 B9 8364.8 .049 rising <1%
20041014 B9 9894.45 .103 falling 1.5%
20041025 B9 9749.99 .119 falling none
20050624 B9 10297.84 .124 falling <1%
20060718 B9 10799.23 .148 falling none
20081223 B9 8419.93 .055 falling none
20131007 B9 14996.48 .105 rising none
---------------------------------------------------------------------
No.= 58 .110
(Since 1945, no. = 51 Avg.Gain = .101)
PE        21    .066  low
PE + 1     6    .073
                       Jan (1) .071
                       none from
                       Jun (1) .124
                       Sep (1) .034
                       Oct (1) .04
                       Dec (2) .084
PE + 2    19    .140
PE + 3    12    .157
Jan        8    .115
Feb        3    .133
Mar        2    .058
Apr        3    .050
May        6    .066
June       1    .124
Jul        2    .077
Aug        0    ----
Sep        5    .113
Oct        6    .133
Nov       10    .161 high
Dec       12    .094
1-10 17 .112 11-20 17 .112 21-30 24 .107 |
|
Buy B9s, Gains and Key Values: 1928-2013 Date Signal DJI Pct.Gain LA/MA P-I IP21 V-I OPct 19350531 B9 110.64 .198 .973 32 -.026 -32 .215
19400112 B9 145.9 -.008 .975 4 -.125 -31 .098
19431108 B9 131.7 .245 .958 158 -.261 126 -.225
19431117 B9 130.2 .26 .958 104 -.252 84 -.216
19431126 B9 131.3 .249 .979 84 -.251 72 -.250
19440907 B9 143.6 .142 .978 81 .044 70 -.033
19440914 B9 142.9 .142 .977 22 -.079 1 -.171
19480920 B9 177.4 .07 .975 13 -.017 -34 .024
19481122 B9 176.3 .022 .971 150 .031 245 -.097
19481129 B9 172 .048 .962 79 -.063 154 -.269
19481201 B9 173.2 .040 .978 125 -.029 204 -.051
19501106 B9 222.5 .164 .974 -4 .025 -105 .110
19501204 B9 225.4 .166 .971 198 .103 264 .215
19550117 B9 388.2 .207 .974 6 -.011 -274 -.025
19581125 B9 540.5 .191 .977 25 .039 -173 .255
19661201 B9 789.75 .124 .980 11 .049 2 -.102
19670412 B9 844.65 .051 .980 2 -.027 -1 -.014
19670519 B9 874.55 .064 .981 9 .008 5 .084
19750528 B9 817.04 .058 .978 69 -.002 0 .181
X19750722 B9 (follows S18) 846.76 -.013 .975 52 .009 0 -.04
19751203 B9 825.49 .223 .976 -8 -.028 -2 .008
19761005 B9 966.76 .018 .974 -13 -.001 -1 -.285
19771206 B9 806.91 -.017 .971 163 .044 1 .114
19780223 B9 750.95 .154 .979 -18 -.045 -2 -.102
19780228 B0 742.12 .168 .971 -14 -.055 -2 -.307
19781218 B9 787.51 .125 .975 8 -.007 -2 .04
19790206 B9 822.85 .077 .980 22 -.013 0 -.001
19801028 B9 759.13 .058 .980 4 -.053 -1 .136
19810126 B9 938.91 .071 .973 5 .048 -5 -.105
19811023 B9 837.99 .04 .981 53 .045 -.087
X19820519 B9 835.90 -.02 .978 2 -.025 -1 .005
low negative
19820930 B9 896.25 .179 .977 42 -.063 -2 -.182
19821123 B9 990.99 .067 .967 81 .009 -1 .067
19830124 B9 1030.17 .207 .968 56 -.027 1 -.063
19860122 B9 1502.29 .215 .981 4 .056 -9 -.287
19860407 B9 1735.51 .052 .980 25 .032 -2 .058
19860507 B9 1775.30 .049 .979 7 .028 -4 .038
19860709 B9 1826.07 .005 .978 -13 .050 -3 .093
19861118 B9 1817.21 .324 .975 18 .061 0 .022
19880108 B9 1911.31 .059 .975 185 .118 14 .318
19880122 B9 1903.51 .063 .974 102 .008 0 .113
19880325 B9 1978.95 .056 .963 3 .071 -3 .002
19910321 B9 2855.45 .060 .979 49 -.117 1 -.280
19960110 B9 5032.94 .103 .980 26 -.065 -43 -.055
19960410 B9 5485.98 .048 .976 6 .042 -15 -.081
19960507 B9 5420.95 .06 .979 41 -.034 -4 -.102
19961213 B9 6304.87 .087 .981 -5 .074 -23 .103
19970911 B9 7660.98 .034 .979 83 -.013 -32 -.127
19971219 B9 7756.29 .184 .979 10 .017 -57 .028
19981001 B9 7632.53 .459 ,966 9 .017 -81 -.075
19990524 B9 10654.67 .045 .978 31 .028 -37 -.009
20001124 B9 10470.23 .042 .979 55 .042 -77 -.131
20001220 B9 10318.93 .058 .975 51 -.077 -126 -.021
20021209 B9 8473.41 .035 .981 89 -.034 -92 -.086
20041014 B9 9894.45 .103 .978 114 -.054 -142 -.049
20041025 B9 9749.99 .119 .973 119 -.032 -141 -.260
20050624 B9 10297.84 .124 .979 356 -.121 13 .215
20060718 B9 10799.23 .148 .980 -28 -.124 -200 0
20081223 B9 8419.93 .055 .979 352 .055 85 .071
20091007 B9 14936.24 open .977 133 -.057 -63 -.150
|
======================================================
Being revised 7/16/2011
(C) 2011 www.tigersoft.com and William Schmidt, Ph.D.
Number of completed trades = 47
Avg. Gain = 10.4%
The Buy B9 is usually very benign. It averaged a gain of 10,7% at the time of
the next
Peerless Sell in 47 cases since 1929.
Most of the biggest losses were before 1943..
. 42 of the 47 (89.3% of all cases) B9s would
have been closed out profitably.
17 (36.2%) produced a gain of more than
10% and 11 (23.4%) registered gains of more
than 17.7%.
There were, however, 6 (12.8%) B9 trades
that would have shown a paper loss of between
7% and 13%. Only two of these took
place after 1942. Ten ( 21.2% ) had paper losses of more
than 3%.
The Buy B9 occurs when the DJI's hypothetical low
approaches the lower band with the P-Indicator
positive or nearly so. The
Accumulation Index is usally nearly positive or much improved from the
previous lows. The exact
parameters are proprietary. However, the key values are shown on all
the B9s. This was one of our
original Peerless Buy signals. Besdies the 21-day P-Indicator we also
use the 18 day ma of NYSE advances
minus declines.
REVERSING BUY B9s
Buy B9
2/27/1934
103.7 1.4%
Sell S9 4/11/1934
105.2 4.5%
Buy B9
4/30/1934
100.5 -1.5%
Sell S9/S5 6/19/1934 99.0
12.4%
Buy B9/B17 3/21/1939
143.4 -0.1%
Sell S8 7/31/1939
143.3 4.2%
Buy B9
2/10/1942
106.8 -7.1% Sell
S9 5/11/1942 99.2
-5.2%
Buy B9
11/3/48 182.5
-0.7 Sell
S12 1/7/1949
181.3 8.9%
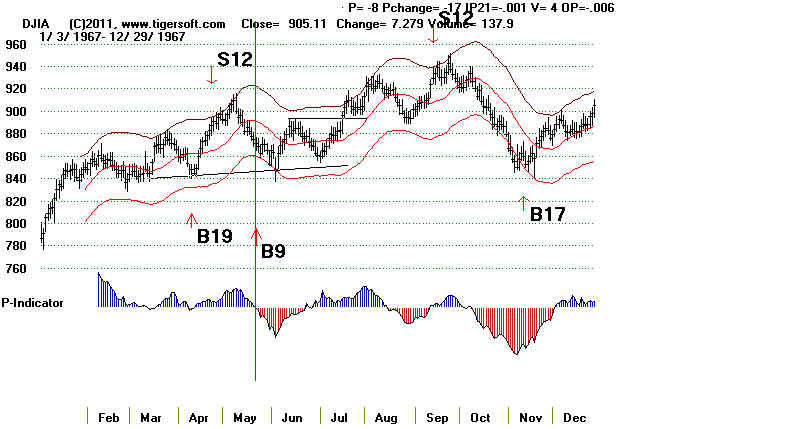
Buy B9 5/22/67
871.05
6.7 Sell
S12 9/14/67 929.44
7.5
Buy B9
12/6/77
806.91 -1.7
Sell S10 1/7/78 793.49
5.1
Buy B9
12/18/78
787.51 13.5 Sell
S9 9/21/79 893.94
10.9
Buy B9
1/26/81 938.91
8.7 Sell
S15 4/24/81 1020.35
17.4
Buy B9
10/23/81
837.99 -0.6
Sell S9
4/1/82 833.24
6.7
Buy B9
1/24/83
1030.17 20.7
Sell S9 7/26/83
1243.69 6.1
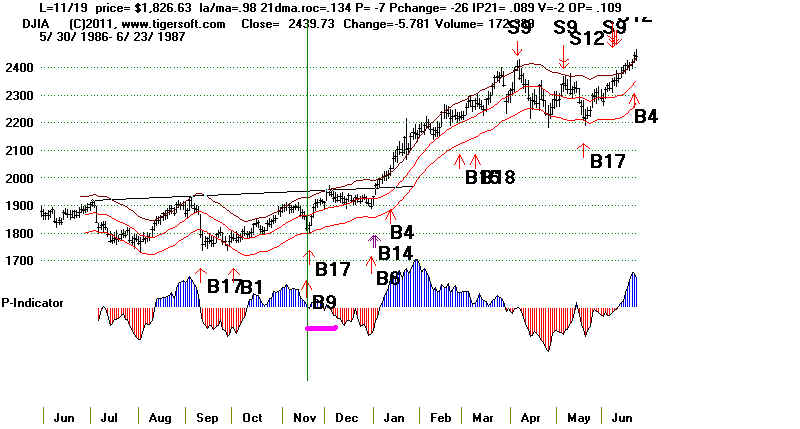
Buy B9
7/9/86
1826.07 0.5
Sell S9
8/12/86
1835.49 2.3
Buy B9
1/8/88
1911.31 6.3
Sell
S1 2/26/88
2023.21 2.2
Buy B9
3/25/88
1978.95 4.4
Sell
S2 9/6/88
2065.26 -0.1
Buy B9
4/10/96 5485.98
3.4 Sell
S1 5/29/96
5673.03 2.7
Buy B9
10/1/98 7632.53
42.2 Sell
S12 6/18/99
10855.55 4.2
Buy B9
3/23/01
9504.78 18.3
Sell
S4 5/17/01
11428.58 22.1
Buy B9
11/13/02 8398.49
4.5 Sell
S12 1/6/03
8773.57 5.2
Buy B9
1/22/03 8318.73
17.8 Sell
S4 10/15/03
9803.05 -0.6
Buy B9
10/14/04 9894.45
9.7 Sell
S8 12/28/04
10854.54 5.9
Buy B9
7/18/2006 10799.23 14.8
Sell S9
1/5/2007 12398.01
2.3
================================================================
N=21
Avg.= +7.7%
Avg.= +5.9%
We want to consider the performance of Buy B9s as it related to
month of the year
and type of market conditions that
prevail (bear market, trading range and bullmarket).
This will be done here soon.
Buy B9s don't always bring an
immediate reversal upwards. Look at the cluster of Buy B9s
in January 1988 after the
Crash of the previous October.
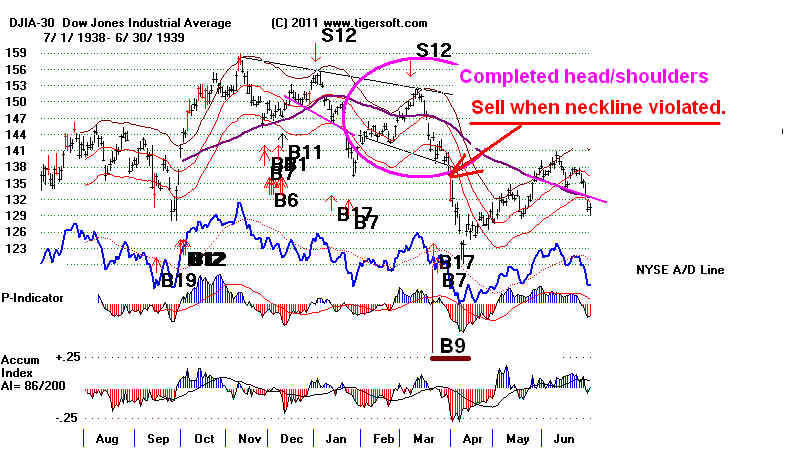
Using a completed head.shoulders
pattern to sell when the neckline was violated
would have avoided the big losses
in 1938 and 2002.
It is helpful to discount or
discard B9s in the year after the Presidential Election from March
27th through the end of
September. Below are the cases that would have taken place in this period.
THIS BUY
SIGNAL SHOULD BE VOIDED BECAUSE OF THE PATTERN OF
WEAK MARKETS AT THIS TIME IN THE YEAR AFTER A PRESIDENTIAL
ELECTION.
3 / 28 / 1977
926.11
5 / 25 / 1977
903.24 -.016 Falsafe S10
.971 -.158 47
.006 0 .108 Pch=-26
5 / 26 / 1977
908.07 -.022
.977
-.201 7
.012 0 .103
The DJI fell more than 12% below the previous,
October 1976, high
and should have been sold. You should also note the breakdown
below well-tested declining support as the DJI fell below 880.
That should have been treated as a Sell S10. (The 12% down-line
in the chart below is from the January peak.)
In
additon, it best to treat with care Buy B9s in July generally. Only one of five led
to
a big gain and three were unprofitable. This is due
to the tendency of the market to be
weak from May to October. The software does not allow
Buys in Julys in the third
year of the 4-year Presidential cycle. This
eliminates those of July 1943 and 1975, both
of
which would have lost money.
(1)
 7/2/1934              94.80            -.023         8/21/1934  S12
         .978          .369       -8    1            -.059  -20  .019
 also B9 on 7/3/1934.
 Continuation head and shoulders pattern was completed and DJI fell to
 85.50 and then rallied to the upper band and S9/S12.
(2)
 7 / 29 / 1943               139.4        -.009            1/14/44  S1
            A.)973   B) -.266    C)-11   D) -.039  E) -107 F).03
  DJI fell gradually to 140 in mid November and then rallied.
  The NYSE A/D Line rose steadily.
(3)
 7 / 22 / 1975               846.76       -.013    8/29/1975  S12
               .975       -.119      52    .009     0     .032   Pch = -66
  The DJI fell to 791 on 8/21/1975 and then rallied to the upper band.
(4)
 7 / 9 / 1986              1826.07       .005     8/12/11986  S9  1835.48
                  .978      -.09         -13    .05    -3     .088   Pch77
 7 / 10 / 1986               1831.83       .002
                  .981      -.034         5     .068    1     .178   Pch = 17
 7 / 11 / 1986               1821.43       .008
                  .976      -.157         -5            -11   .037   {ch = -11
 (5)
 7 / 18 / 2006               10799.23      .148      1/5/2007  S9  12398


      Finally, is very risky to expect a B9 to reverse a steep downtrend
   where the ANNROC is less than -.70.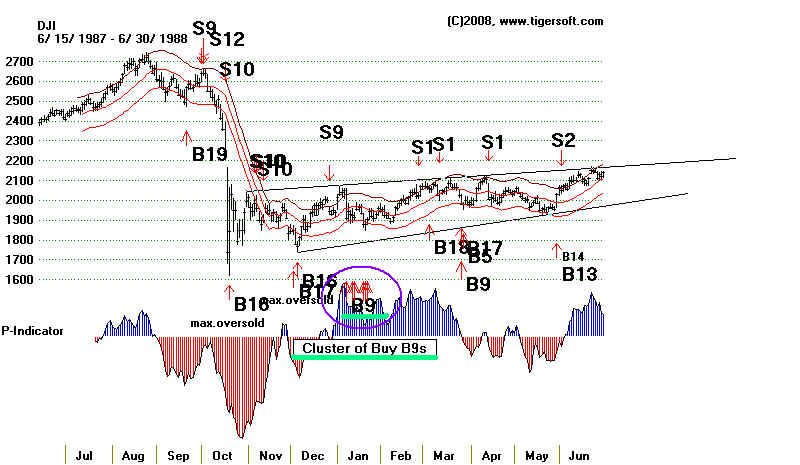
Buy B9s : 1928-2011
We consider the first signal in a set to be the significant signal.
Note the key values that are used to produce a Buy B9.
A Close/21-dma
B Annualized Rate of Change of 21-fma
C P-Indicator value
D Current Accum.Index value ("IP21")
E V-21 Value
F On-Bal.Vol. Pct.
Date DJI Gain Reversing Signal.
------------- ----------- -------- ----------
Note Regular mode Buy B9s should not have taken between 1929 and 1932,
because of how the Extreme Bearish Mode should have been applied.
The X shows extreme bearish mode would not have allowed these Buys.
X Extreme Bear Market rules should have applied.
8/8/1930 222.8 Gain= .037 8/27/30 S12/S9
LA/MA 21-dmaroc P IP21 V OPct
.949 -.233 -22 (-39) .015 -172 .087 .
DJI fell 217 4 days later and rallied to upper band and Sell
X Extreme Bear Market rules should have applied.
9/19/1930 229 Loss=. 091 9/29/30 S10
LA/MA 21-dmaroc P IP21 V OPct
.963 -.195 -20 (-25) .038 -186 -.064
X Extreme Bear Market rules should have applied.
1/15/1031 162.80 DJI rose to 194 on 2/24
LA/MA 21-dmaroc P IP21 V OPct
.979 -.036 31 (1) -.108 -58 .155
DJI rallied to 194. First EBM-S1 was on 2/2 at 168.70
Steep A/D Line uptrendline broken on 2/27 at 190.30.
Head and shoulders pattern developed.
Second EBM-S1 was on 3/13/1931 at 178.90
X Extreme Bear Market rules should have applied.
1/27/1932 77.80 .104 2/9/1932 S4
LA/MA 21-dmaroc P IP21 V OPct
.978 .60 69 (+6) .014 146 .192
There were follow-up B9s from 1/18-2/4/1932
DJI fell to 71.80 on 2/10 and rallied in 6 days to sell above upper band.
The top also saw a reversal day. There was an EBM-S1 at 82.10 on 2/26/1932
============================================================================
(1) Reversing Buy
2/27/1934 103.7 Gain= +1.4% 4/11/1934 S9 105.2 Paper Loss= 5%
LA/MA 21-dmaroc P IP21 V OPct
.965 -.354 52 (18) -.083 47 .075
DJI fell to 98.80 on 3/27/1934 and then rallied to upper band and S9.
----------------------------------------------------------------------------
(2) Reversing Buy
4/30/1934 100.5 Loss= 1.2% 6/19/1934 S9 99.0 Paper Loss= 8%
LA/MA 21-dmaroc P IP21 V OPct
.964 .023 21 (-48) .006 -23 .245
DJI fell to 91.80 on 5/14/1934 and rallied to upper band and sell.
The B9 fellowed three S9s from 4/11 to 4/13 on a lower high.
---------------------------------------------------------------------------
(3) 5/31/1935 110.64 Gain= +5.8% 6/12/1935 S12 No Paper loss
LA/MA 21-dmaroc P IP21 V OPct
.973 .203 32 (-11) -.026 -32 .247
DJI reversed with B9 and rallied to upper band and Sell. Market continued
higher, P-Indicator stayed positive for 5.5 months.
-------------------------------------------------------------------------
X Extreme Bear Market rules should have applied.
11/16/1937 127.9 Loss= 10.7% 11/29/1937 S10 Paper Loss= 11%
LA/MA 21-dmaroc P IP21 V OPct
.973 -.725 (too steep) 7 (+21) .103 .235
DJI fell to 115.80 and then rallied to the upper band and Sell.
X Extreme Bear Market rules should have applied.
1/26/1938 123.2 Gain = .036 2/17/1938 S12 Paper Loss= 4%
LA/MA 21-dmaroc P IP21 V OPct
.961 .40 11 (-2) .044 -36 .096
DJI fell to 118.50 and then raqllied ot the upper band and S12.
-----------------------------------------------------------------------
(4) Reversing Buy
3/21/1939 143.40 Loss= 10.7% 1/14/44 S1 Paper Loss= 12%
This was also a Buy B17
LA/MA 21-dmaroc P IP21 V OPct
.975 -.121 11 (+21) .001 -41 -.006
DJI fell to 125.40 on 4/18/39 and then rallied.
Note the completed head and shoulders pattern. Selling on the close below the neckline
of the DJI's price pattern would have limited the loss to 7.7%
 -------------------------------------------------------------------------------------------------------------------------------------------
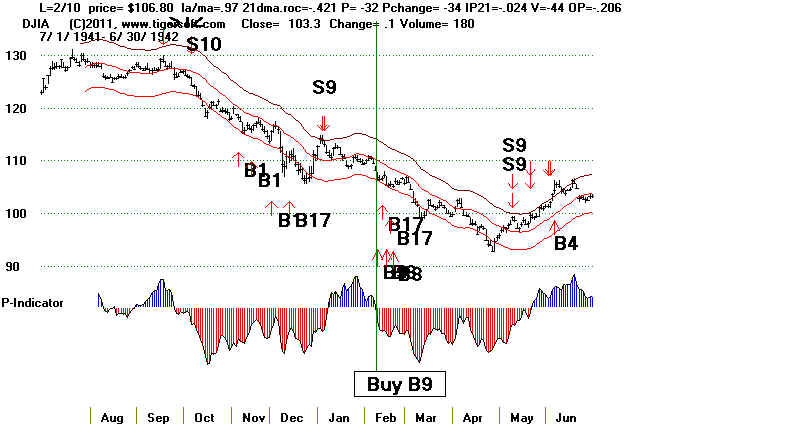
(5) Reversing Buy
2/10/1942 106.80 Loss= 7.1% 5/11/42 S9 Paper Loss= 14%
LA/MA 21-dmaroc P IP21 V OPct
.97 -.421 -32 (-34) -.024 -44 -.009
DJI fell to 92.90 on 4/20/42 and then rallied.
Only when the battles of World War II started to be won by the Allies
did the market turn upwards.A simple price-trendline would have worked
better in this case.
-------------------------------------------------------------------------------------------------------------------------------------------
(5) Reversing Buy
2/10/1942 106.80 Loss= 7.1% 5/11/42 S9 Paper Loss= 14%
LA/MA 21-dmaroc P IP21 V OPct
.97 -.421 -32 (-34) -.024 -44 -.009
DJI fell to 92.90 on 4/20/42 and then rallied.
Only when the battles of World War II started to be won by the Allies
did the market turn upwards.A simple price-trendline would have worked
better in this case.
 --------------------------------------------------------------------------------------------------------------------------------------------
(6)
11/8/1943 131.7 Gain = +12.3% 1/14/44 S1 Paper Loss= 2%
LA/MA 21-dmaroc P IP21 V OPct
.958 -.527 158 (+32) -.261 126 -.214
DJI fell to 130 on 11/17/43 and then rallied until early January.
A series of additional B9s follow from 11/10/1943 to 11/26/1943.
-------------------------------------------------------------------------
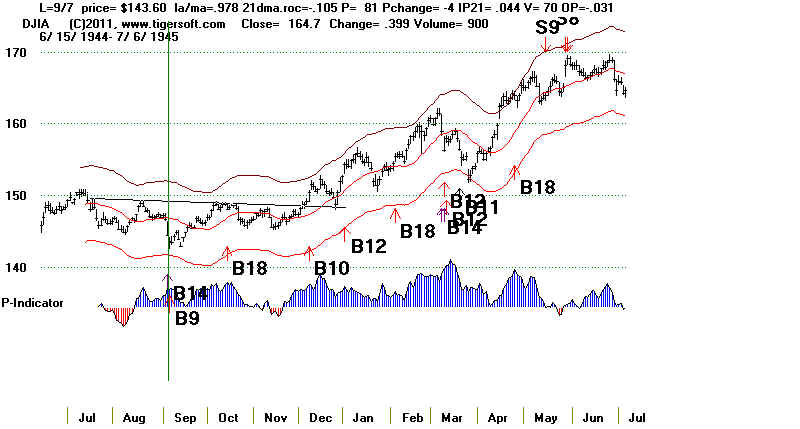
(7)
9/7/1944 143.6 Gain= +14.2% 5/15/45 S9 No Paper Loss
LA/MA 21-dmaroc P IP21 V OPct
.978 -.105 81(-4) .044 70 -.026
This was at low in an inverted head and shoulders pattern.
--------------------------------------------------------------------------------------------------------------------------------------------
(6)
11/8/1943 131.7 Gain = +12.3% 1/14/44 S1 Paper Loss= 2%
LA/MA 21-dmaroc P IP21 V OPct
.958 -.527 158 (+32) -.261 126 -.214
DJI fell to 130 on 11/17/43 and then rallied until early January.
A series of additional B9s follow from 11/10/1943 to 11/26/1943.
-------------------------------------------------------------------------
(7)
9/7/1944 143.6 Gain= +14.2% 5/15/45 S9 No Paper Loss
LA/MA 21-dmaroc P IP21 V OPct
.978 -.105 81(-4) .044 70 -.026
This was at low in an inverted head and shoulders pattern.
 ---------------------------------------------------------------------------
(8)
2/25/1946 187.2 Gain= +14.2% 5/15/45 S9 No Paper Loss
Another B9 followed on 2/26/1945
LA/MA 21-dmaroc P IP21 V OPct
.930 -.684 -91(-64) .008 270 -.154
DJI fell the next day to 186.00 and then rallied past the upper band.
---------------------------------------------------------------------------
(9)
9/20/1948 177.4 Gain= +7.0% 10/22/48 S1 189.8 Paper Loss= 1%
LA/MA 21-dmaroc P IP21 V OPct
.975 -.34 13 (-37) -.017 -34 .006
The DJI fell to 1765 a few days later and then rose to resistance
in Presidential Election year trading range.
=============================================================================
(10))Reversing Buy
11/3/1948 182.5 Loss - 1.7% 181.30 1/7/1949 S12 Paper Loss= 7%
Additional Buy B9s follow from the next day to Decemeber 1, 1949
LA/MA 21-dmaroc P IP21 V OPct
.984 .167 92 (-3) .24 118 .212
The DJI fell rapidly from the upper band to below the lower band;
Wall Street was surprised when Truman beat Dewey for President..
The DJI fell to 171 on 11/30/1948 and rallied to 181 on 1/7/1949.
=================================================================================
(11)
12/4/1950 222.3 Gain = +23.8% 275.1 9/17/1951 S4 No Paper Loss
Another Buy B9s followed the next day.
LA/MA 21-dmaroc P IP21 V OPct
.971 -.177 198(+17) .103 262 .203
This was bottom. DJI moved up steadily afterwards.
---------------------------------------------------------------------------
(8)
2/25/1946 187.2 Gain= +14.2% 5/15/45 S9 No Paper Loss
Another B9 followed on 2/26/1945
LA/MA 21-dmaroc P IP21 V OPct
.930 -.684 -91(-64) .008 270 -.154
DJI fell the next day to 186.00 and then rallied past the upper band.
---------------------------------------------------------------------------
(9)
9/20/1948 177.4 Gain= +7.0% 10/22/48 S1 189.8 Paper Loss= 1%
LA/MA 21-dmaroc P IP21 V OPct
.975 -.34 13 (-37) -.017 -34 .006
The DJI fell to 1765 a few days later and then rose to resistance
in Presidential Election year trading range.
=============================================================================
(10))Reversing Buy
11/3/1948 182.5 Loss - 1.7% 181.30 1/7/1949 S12 Paper Loss= 7%
Additional Buy B9s follow from the next day to Decemeber 1, 1949
LA/MA 21-dmaroc P IP21 V OPct
.984 .167 92 (-3) .24 118 .212
The DJI fell rapidly from the upper band to below the lower band;
Wall Street was surprised when Truman beat Dewey for President..
The DJI fell to 171 on 11/30/1948 and rallied to 181 on 1/7/1949.
=================================================================================
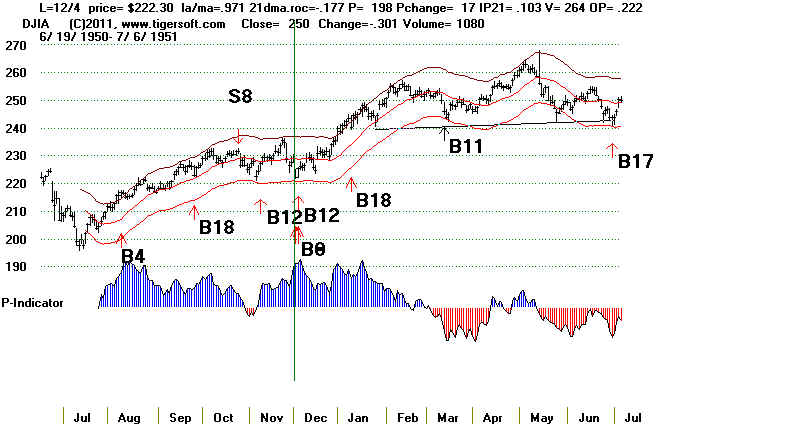
(11)
12/4/1950 222.3 Gain = +23.8% 275.1 9/17/1951 S4 No Paper Loss
Another Buy B9s followed the next day.
LA/MA 21-dmaroc P IP21 V OPct
.971 -.177 198(+17) .103 262 .203
This was bottom. DJI moved up steadily afterwards.
 ============================================================================
(12)
1/17/1955 388.2 Gain = +25.2% 9/22/1955 S4 486. No Paper Loss
LA/MA 21-dmaroc P IP21 V OPct
.974 .146 6 (-62) -.011 -274 -.056
This was bottom. Quick rally to upper band.
============================================================================
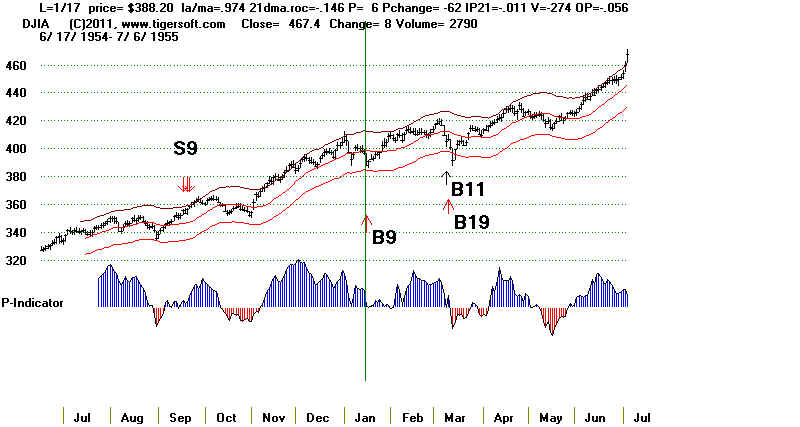
(12)
1/17/1955 388.2 Gain = +25.2% 9/22/1955 S4 486. No Paper Loss
LA/MA 21-dmaroc P IP21 V OPct
.974 .146 6 (-62) -.011 -274 -.056
This was bottom. Quick rally to upper band.
 ============================================================================
(13) Reversing Buy
5/22/1967 871.05 Gain = +6.7% 9/14/1967 S12 Paper loss = 4%
LA/MA 21-dmaroc P IP21 V OPct
.978 .162 -8 (-17) -.001 4 -.007
DJI fell to 842 on 6/5/1967 and then rallied.
============================================================================
(13) Reversing Buy
5/22/1967 871.05 Gain = +6.7% 9/14/1967 S12 Paper loss = 4%
LA/MA 21-dmaroc P IP21 V OPct
.978 .162 -8 (-17) -.001 4 -.007
DJI fell to 842 on 6/5/1967 and then rallied.
 ================================================================================
(14)
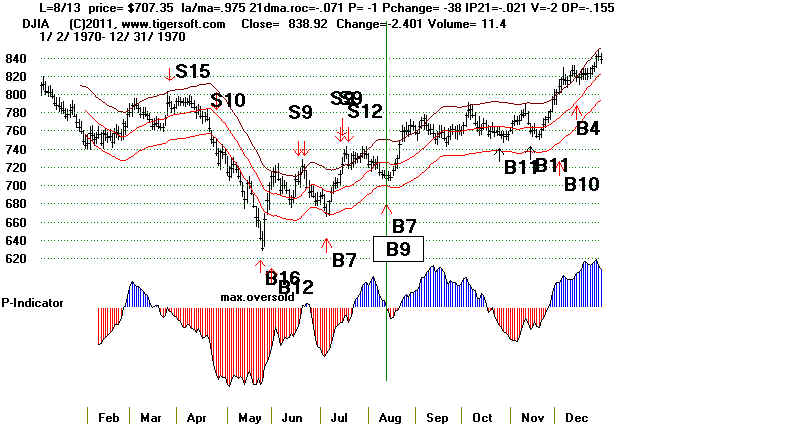
8/13/1970 707.35 Gain = +32.5% 5/6/1971 S9 937.39 No Paper Loss
LA/MA 21-dmaroc P IP21 V OPct
.975 -.071 -1 (-38) -.021 -2 -.155
The B9 does not show up because of simultaneous the B7.
This was the low.
================================================================================
(14)
8/13/1970 707.35 Gain = +32.5% 5/6/1971 S9 937.39 No Paper Loss
LA/MA 21-dmaroc P IP21 V OPct
.975 -.071 -1 (-38) -.021 -2 -.155
The B9 does not show up because of simultaneous the B7.
This was the low.
 ================================================================================
(15)
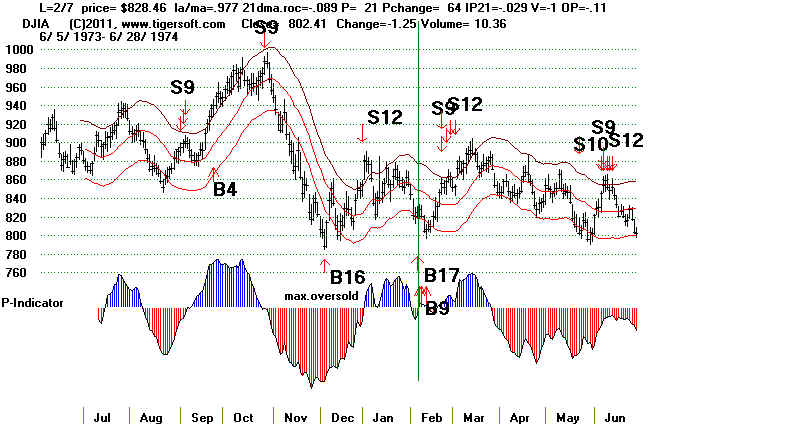
2/7/1974 828.46 Gain = +3.3% 2/22/1974 S12 855.99 Paper loss = 3%
There were also B9s on 2/8/1974 and 2/12/1974
LA/MA 21-dmaroc P IP21 V OPct
.977 -.089 21 (-64) -.029 -1 -.11
The DJI fell to 806 on 2/12 and then rallied to the upper band.
================================================================================
(15)
2/7/1974 828.46 Gain = +3.3% 2/22/1974 S12 855.99 Paper loss = 3%
There were also B9s on 2/8/1974 and 2/12/1974
LA/MA 21-dmaroc P IP21 V OPct
.977 -.089 21 (-64) -.029 -1 -.11
The DJI fell to 806 on 2/12 and then rallied to the upper band.
 ===============================================================================
(16)
10/9/1974 631.02 Gain = +6.1% 10/21/1974 S12 669.82 No Paper loss
LA/MA 21-dmaroc P IP21 V OPct
.999 -.511 -27 (+72) -.064 -2 -.327
The DJI had turned up from the bottom and rallied past the upper band.
===============================================================================
(17)
5/28/1975 817.04 Gain = +7.4% 7/1/1975 S8 877.42 No Paper loss
There was also a Buy B9 on the next day.
LA/MA 21-dmaroc P IP21 V OPct
.978 .10 69 (-7) -.002 0 .174
The DJI turned up immediately and rallied to the upper band.
===============================================================================
(16)
10/9/1974 631.02 Gain = +6.1% 10/21/1974 S12 669.82 No Paper loss
LA/MA 21-dmaroc P IP21 V OPct
.999 -.511 -27 (+72) -.064 -2 -.327
The DJI had turned up from the bottom and rallied past the upper band.
===============================================================================
(17)
5/28/1975 817.04 Gain = +7.4% 7/1/1975 S8 877.42 No Paper loss
There was also a Buy B9 on the next day.
LA/MA 21-dmaroc P IP21 V OPct
.978 .10 69 (-7) -.002 0 .174
The DJI turned up immediately and rallied to the upper band.
 ===============================================================================
(18)
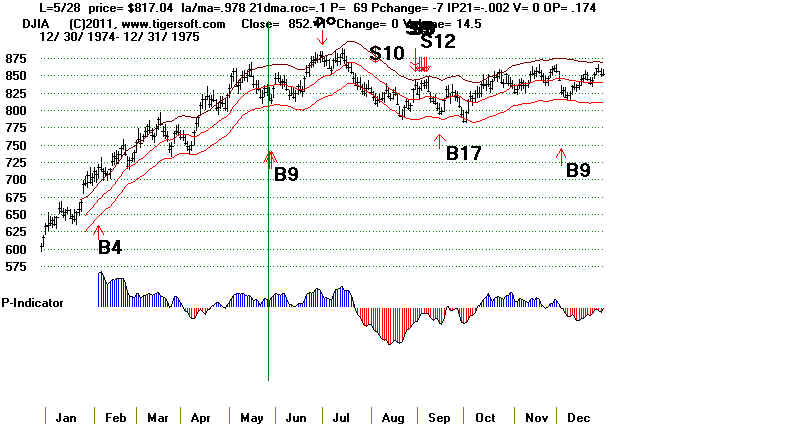
12/3/1975 825.49 Gain = +22.3% 3/24/76 1009.21 Paper loss = 1%
LA/MA 21-dmaroc P IP21 V OPct
.976 -.003 -8 (+37) -.028 -2 .008
The DJI fell to 818.8 on 12/9/1975 and then rallied past the upper band.
===============================================================================
(19)
10/5/1976 966.76 Gain = +1.8% 12/22/76 984.54 Paper loss = 4%
LA/MA 21-dmaroc P IP21 V OPct
.974 -.268 -13 (-46) -.001 -1 -.265
The DJI fell to 925 on 11/10/1975 and then rallied to the upper band.
It is usually a better idea to sell in the week after Christmas
than the week before it. Selling on 12/22/76 does not take into
account the 90% probability of a Santa Claus rally.
==============================================================================
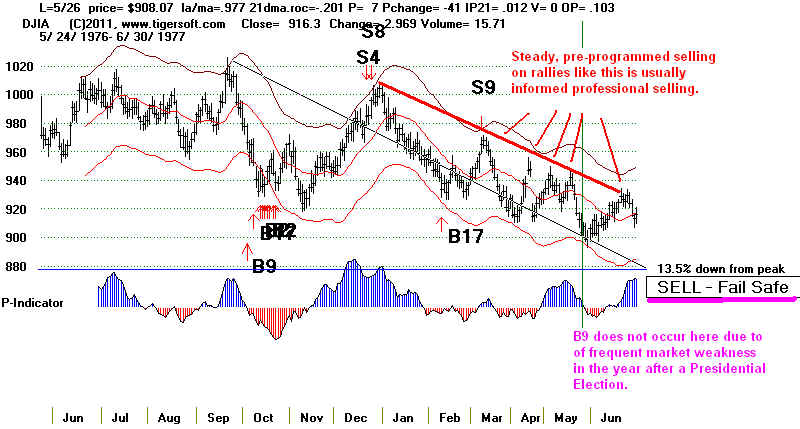
X
The May 1977 Buy B9 is not allowed by the software, even though the lower band
of the DJI is approached witht the P-Indicator still positive. This is because of strong tendency
for markets to be weak in the first 9 months of the year after a Presidential Election.
5/26/1977 908.07
LA/MA 21-dmaroc P IP21 V OPct
.977 -.201 7 (-41) .012 0 .103
The DJI fell more than 12% below the previous, October 1976, high
and should have been sold. You should also note the breakdown
below well-tested declining support as the DJI fell below 880.
That should have been treated as a Sell S10. If one had taken this
Buy signal, it should have been exited when the DJI fall more than
13.5% below its September peak. That line crossed about 880. See the
chart below.
===============================================================================
(18)
12/3/1975 825.49 Gain = +22.3% 3/24/76 1009.21 Paper loss = 1%
LA/MA 21-dmaroc P IP21 V OPct
.976 -.003 -8 (+37) -.028 -2 .008
The DJI fell to 818.8 on 12/9/1975 and then rallied past the upper band.
===============================================================================
(19)
10/5/1976 966.76 Gain = +1.8% 12/22/76 984.54 Paper loss = 4%
LA/MA 21-dmaroc P IP21 V OPct
.974 -.268 -13 (-46) -.001 -1 -.265
The DJI fell to 925 on 11/10/1975 and then rallied to the upper band.
It is usually a better idea to sell in the week after Christmas
than the week before it. Selling on 12/22/76 does not take into
account the 90% probability of a Santa Claus rally.
==============================================================================
X
The May 1977 Buy B9 is not allowed by the software, even though the lower band
of the DJI is approached witht the P-Indicator still positive. This is because of strong tendency
for markets to be weak in the first 9 months of the year after a Presidential Election.
5/26/1977 908.07
LA/MA 21-dmaroc P IP21 V OPct
.977 -.201 7 (-41) .012 0 .103
The DJI fell more than 12% below the previous, October 1976, high
and should have been sold. You should also note the breakdown
below well-tested declining support as the DJI fell below 880.
That should have been treated as a Sell S10. If one had taken this
Buy signal, it should have been exited when the DJI fall more than
13.5% below its September peak. That line crossed about 880. See the
chart below.
 -------------------------------------------------------------------------------
(20) Reversing Buy
12/6/1977 806.91 Loss = +1.7% 1/7/78 S10 793.49 Paper loss = 2%
There were also B9s on the next two days.
LA/MA 21-dmaroc P IP21 V OPct
.971 -.043 163 (-89) .044 1 .109
This was reversed at a 1.7% loss by the support failure and Sell S10.
There was a continuation head and shoulders pattern to warn you
==============================================================================
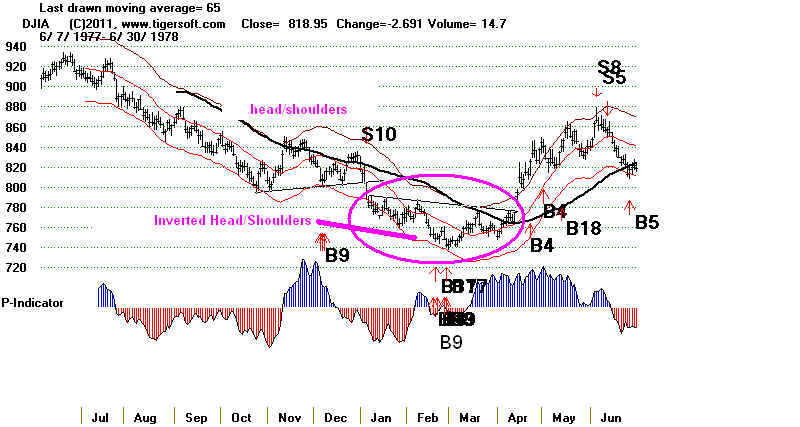
(21)
2/28/1978 742.12 Gain= +16.8% 7/17/78 S12 No Paper Loss
LA/MA 21-dmaroc P IP21 V OPct
.971 -.342 -14 (-24) -.055 -2 -.291
This signal exactly called the bottom of the 1977-1978 bear market.
-------------------------------------------------------------------------------
(20) Reversing Buy
12/6/1977 806.91 Loss = +1.7% 1/7/78 S10 793.49 Paper loss = 2%
There were also B9s on the next two days.
LA/MA 21-dmaroc P IP21 V OPct
.971 -.043 163 (-89) .044 1 .109
This was reversed at a 1.7% loss by the support failure and Sell S10.
There was a continuation head and shoulders pattern to warn you
==============================================================================
(21)
2/28/1978 742.12 Gain= +16.8% 7/17/78 S12 No Paper Loss
LA/MA 21-dmaroc P IP21 V OPct
.971 -.342 -14 (-24) -.055 -2 -.291
This signal exactly called the bottom of the 1977-1978 bear market.
 ==============================================================================
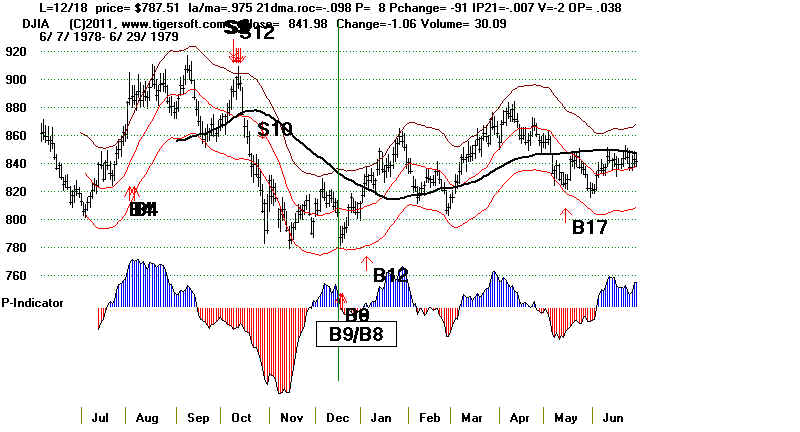
(22) Reversing Buy
12/18/1978 787.51 Gain= +13.5% 9/21/79 S4 893.94 No Paper Loss
also B8
LA/MA 21-dmaroc P IP21 V OPct
.975 -.098 9 (-91) -.007 -2 .038
DJI rallied immediately and rose in zig-zag fashion until the next Fall. sign
==============================================================================
(22) Reversing Buy
12/18/1978 787.51 Gain= +13.5% 9/21/79 S4 893.94 No Paper Loss
also B8
LA/MA 21-dmaroc P IP21 V OPct
.975 -.098 9 (-91) -.007 -2 .038
DJI rallied immediately and rose in zig-zag fashion until the next Fall. sign
 ============================================================================
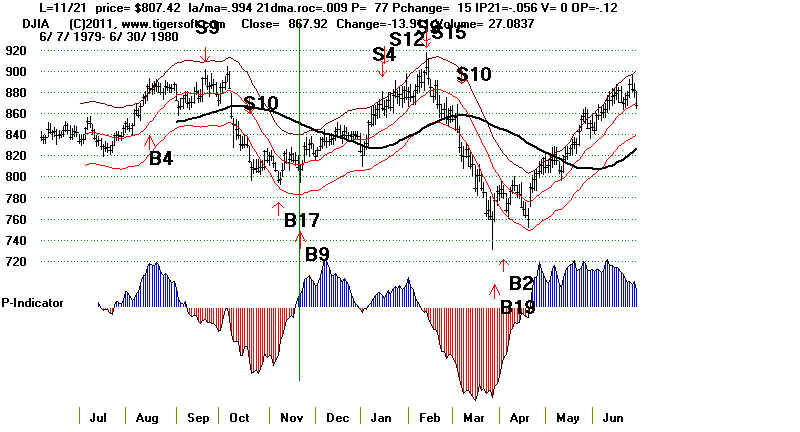
(23)
11/21/1979 807.42 Gain= +7.2% 1/16/80 S4 865.19 No Paper Loss
LA/MA 21-dmaroc P IP21 V OPct
.994 .009 77 (-15) -.056 0 -.121
DJI immediately rallied to the upper band.
============================================================================
(23)
11/21/1979 807.42 Gain= +7.2% 1/16/80 S4 865.19 No Paper Loss
LA/MA 21-dmaroc P IP21 V OPct
.994 .009 77 (-15) -.056 0 -.121
DJI immediately rallied to the upper band.
 ==============================================================================
(24)
1/26/1981 938.91 Gain= +8.7% 4/24/81 S15 1028.35 No Paper Loss
LA/MA 21-dmaroc P IP21 V OPct
.973 -.245 5 (-54) .048 -5 -.101
DJI immediately rallied to the upper band.
==============================================================================
(24)
1/26/1981 938.91 Gain= +8.7% 4/24/81 S15 1028.35 No Paper Loss
LA/MA 21-dmaroc P IP21 V OPct
.973 -.245 5 (-54) .048 -5 -.101
DJI immediately rallied to the upper band.
 ==============================================================================
(25) Reversing Buy
10/23/1981 837.99 Loss = 0.6% 4/1/02 S9 833.24 No Paper Loss
Two more Buy B9s followed on 10/26/81 and 10/29/81
LA/MA 21-dmaroc P IP21 V OPct
.997 .074 43 (+1) .04 -1 -.102
DJI immediately rallied to the upper band, but there was no
automatic Sell signal there. It then fell to 795.47 (5% Paper Loss)
and rallied again to the upper band.
==============================================================================
(25) Reversing Buy
10/23/1981 837.99 Loss = 0.6% 4/1/02 S9 833.24 No Paper Loss
Two more Buy B9s followed on 10/26/81 and 10/29/81
LA/MA 21-dmaroc P IP21 V OPct
.997 .074 43 (+1) .04 -1 -.102
DJI immediately rallied to the upper band, but there was no
automatic Sell signal there. It then fell to 795.47 (5% Paper Loss)
and rallied again to the upper band.
 ==============================================================================
(26))
9/30/1982 896.25 Gain=+17.9% 12/7/1982 S9 1056.94 Paper loss = 1%
LA/MA 21-dmaroc P IP21 V OPct
.977 -.066 42 (+58) -.063 -2 -.176
DJI rallied past the upper band.
==============================================================================
(26))
9/30/1982 896.25 Gain=+17.9% 12/7/1982 S9 1056.94 Paper loss = 1%
LA/MA 21-dmaroc P IP21 V OPct
.977 -.066 42 (+58) -.063 -2 -.176
DJI rallied past the upper band.
 ===============================================================================
(27)
11/22/1982 1000 Gain= 5.7% 12/7/1982 S9 1056.9 No paper loss
Two more B9s followed on 11/25/1982 and 11/29/1982.
LA/MA 21-dmaroc P IP21 V OPct
.975 -.365 38(-53) -.006 -3 .055
DJI fell to 990 and then rallied to the upper band.
See chart above.
===================================================================================
(28) Reversing Buy
1/24/1983 1030.17 Gain = +20.7% 7/26/1983 S9 1243.69 No Paper Loss
Two more B9s followed on 11/25/1982 and 11/29/1982.
LA/MA 21-dmaroc P IP21 V OPct
.968 -.167 56 (-86) -.027 -1 -.061
DJI rallied immediately.
See chart above.
==================================================================================
(29) Reversing Buy
7/9/1986 1826.07 Gain =+0.5% 8/12/11986 S9 1835.48 Paper loss = 3%
Two more B9s followed on 7/10/1986 and 7/11/1986.
LA/MA 21-dmaroc P IP21 V OPct
.978 -.09 -13 (+77) .05 -3 .088
DJI fell to 1774 two weeks later and then rallied to top of trading range.
===============================================================================
(27)
11/22/1982 1000 Gain= 5.7% 12/7/1982 S9 1056.9 No paper loss
Two more B9s followed on 11/25/1982 and 11/29/1982.
LA/MA 21-dmaroc P IP21 V OPct
.975 -.365 38(-53) -.006 -3 .055
DJI fell to 990 and then rallied to the upper band.
See chart above.
===================================================================================
(28) Reversing Buy
1/24/1983 1030.17 Gain = +20.7% 7/26/1983 S9 1243.69 No Paper Loss
Two more B9s followed on 11/25/1982 and 11/29/1982.
LA/MA 21-dmaroc P IP21 V OPct
.968 -.167 56 (-86) -.027 -1 -.061
DJI rallied immediately.
See chart above.
==================================================================================
(29) Reversing Buy
7/9/1986 1826.07 Gain =+0.5% 8/12/11986 S9 1835.48 Paper loss = 3%
Two more B9s followed on 7/10/1986 and 7/11/1986.
LA/MA 21-dmaroc P IP21 V OPct
.978 -.09 -13 (+77) .05 -3 .088
DJI fell to 1774 two weeks later and then rallied to top of trading range.
 ==================================================================================
(30)
11/18/1986 1817.21 Gain = +32.1% 4/6/1987 S9 2405.54 No Paper Loss
LA/MA 21-dmaroc P IP21 V OPct
.975 .04 18 (-22) .061 0 .021
DJI rallied immediately past the upper band.
==================================================================================
(30)
11/18/1986 1817.21 Gain = +32.1% 4/6/1987 S9 2405.54 No Paper Loss
LA/MA 21-dmaroc P IP21 V OPct
.975 .04 18 (-22) .061 0 .021
DJI rallied immediately past the upper band.
 ==================================================================================
(31) Reversing Buy
1/8/1988 1911.31 Gain = +5.9% 2/26/88 S1 2023.21 Paper loss = 2%
There were 5 more Buy B9s between 1/13/1988 and 1/22/1988
LA/MA 21-dmaroc P IP21 V OPct
.975 .261 185 (-95) .118 13 .303
DJI fell to 1879 and then rallied a little past the upper band to
the rising resistance line.
==================================================================================
(31) Reversing Buy
1/8/1988 1911.31 Gain = +5.9% 2/26/88 S1 2023.21 Paper loss = 2%
There were 5 more Buy B9s between 1/13/1988 and 1/22/1988
LA/MA 21-dmaroc P IP21 V OPct
.975 .261 185 (-95) .118 13 .303
DJI fell to 1879 and then rallied a little past the upper band to
the rising resistance line.
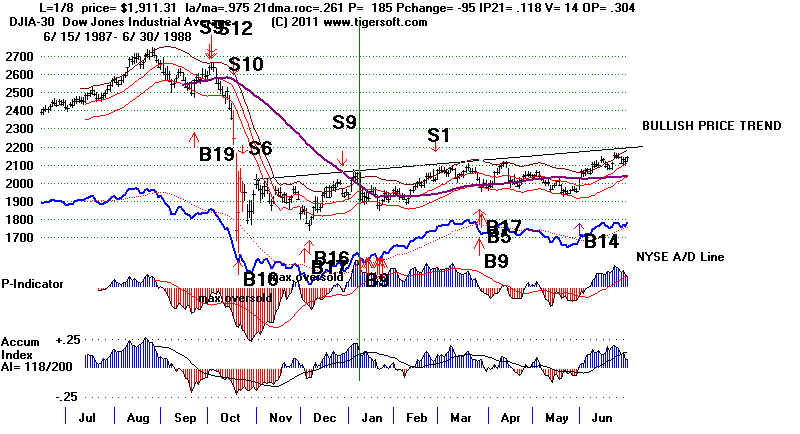 ==================================================================================
(32) Reversing Buy
3/25/1988 1978.95 Gain = +4.4% 9/6/1988 S2 2065.79 Paper loss = 1%
There was also a Buy B17 and B5 on the day of the B9.
LA/MA 21-dmaroc P IP21 V OPct
.963 -.223 3 (-32) .071 -3 .002
DJI rose immediately to the upper band. But there was no sell and
it declined to 1958.72 and then rallied to the upper band. Selling
at well tested resistance would have meant selling at 2159
See the chart above.
==================================================================================
(33) Reversing Buy
4/10/1996 5485.98 Gain = 3.4% 5/29/1996 S1 5673.83 Paper loss = 1%
There was also a Buy B9 on the next day
LA/MA 21-dmaroc P IP21 V OPct
.976 -.201 6 (-68) .042 -15 -.077
DJI turned slipped down to 5420.95 and then rallied to upper band Sell.
See the next chart.
====================================================================================
(34)
5/7/1996 5420.95 Gain = 4.7% 5/29/1996 S1 5673.83 No Paper Loss
LA/MA 21-dmaroc P IP21 V OPct
.979 -.372 41(+82) -.034 -4 -.012 Pch = 82
DJI immediately turned up and then rallied to upper band Sell.
==================================================================================
(32) Reversing Buy
3/25/1988 1978.95 Gain = +4.4% 9/6/1988 S2 2065.79 Paper loss = 1%
There was also a Buy B17 and B5 on the day of the B9.
LA/MA 21-dmaroc P IP21 V OPct
.963 -.223 3 (-32) .071 -3 .002
DJI rose immediately to the upper band. But there was no sell and
it declined to 1958.72 and then rallied to the upper band. Selling
at well tested resistance would have meant selling at 2159
See the chart above.
==================================================================================
(33) Reversing Buy
4/10/1996 5485.98 Gain = 3.4% 5/29/1996 S1 5673.83 Paper loss = 1%
There was also a Buy B9 on the next day
LA/MA 21-dmaroc P IP21 V OPct
.976 -.201 6 (-68) .042 -15 -.077
DJI turned slipped down to 5420.95 and then rallied to upper band Sell.
See the next chart.
====================================================================================
(34)
5/7/1996 5420.95 Gain = 4.7% 5/29/1996 S1 5673.83 No Paper Loss
LA/MA 21-dmaroc P IP21 V OPct
.979 -.372 41(+82) -.034 -4 -.012 Pch = 82
DJI immediately turned up and then rallied to upper band Sell.
 ====================================================================================
(35)
9/11/1997 7660.98 Gain =+3.4% 9/18/1997 S12 7922.72 No Paper Loss
LA/MA 21-dmaroc P IP21 V OPct
.979 -.455 83 (-10) -.013 -32 -.122
DJI turned up immediately and rallied to upper band and an automatic Sell.
====================================================================================
(36)
12/19/1997 7756.29 Gain = +18.4% 7/7/1998 S12 8178.31 No Paper Loss
There was also a Buy B9 on 12/24/1999.
LA/MA 21-dmaroc P IP21 V OPct
.979 .407 10 (+53) -.017 -57 .027
DJI fell to 7580.42 and then rallied past the upper band.
====================================================================================
(35)
9/11/1997 7660.98 Gain =+3.4% 9/18/1997 S12 7922.72 No Paper Loss
LA/MA 21-dmaroc P IP21 V OPct
.979 -.455 83 (-10) -.013 -32 -.122
DJI turned up immediately and rallied to upper band and an automatic Sell.
====================================================================================
(36)
12/19/1997 7756.29 Gain = +18.4% 7/7/1998 S12 8178.31 No Paper Loss
There was also a Buy B9 on 12/24/1999.
LA/MA 21-dmaroc P IP21 V OPct
.979 .407 10 (+53) -.017 -57 .027
DJI fell to 7580.42 and then rallied past the upper band.
 ===================================================================================
(37) Reversing Buy
10/1/1998 7632.53 Gain = +42.2% 6/18/99 S12 10855.55 No Paper Loss
LA/MA 21-dmaroc P IP21 V OPct
.966 -.293 9 (-115).017 -81 -.072
DJI bottomed here over next week. Note A/D Line continued to
fall, but Accumulation Index stayed positive.
===================================================================================
 (38)
 5/24/1999 10654.67  Gain = +1.9%  6/18/1999  S12 10866.55 Paper loss = 1%
      LA/MA        21-dmaroc     P                    IP21             V        OPct
      .978   -.038   31 (-59) .028   -37  -.009
  DJI fell to 10560 and then rallied to an upper band Sell.
========================================================================================
 (39)
 11/13/2000  10517.25 Gain= +1.9% 12/8/2000 S12 10712.91  Paper loss = 2%
      LA/MA        21-dmaroc           P                    IP21             V          OPct
     .996     -.367    -50 (-50) .08   -78   -.034
  DJI fell to 10300 and then rallied to an upper band Sell.
====================================================================================
  (40)  Reversing
  3/23/2001  9504.78 Gain= +18.2% 5/17/2001 S4 11248.58 No Paper Loss
      LA/MA        21-dmaroc           P                       IP21                 V              OPct
     .929    -1.183    -181 (+80) -.007   -231   -.094
  DJI fell to 10300 and then rallied above the upper band.
  Here the DJI was very oversold but the Accumulation Index was nearly
  positive and the daily change of the P-Indicator was a big +80.
====================================================================================
  (41)
 11/1/2001  9263.9 Gain= +9.2%  2/26/2002 S9 10115.26 No Paper Loss
      LA/MA        21-dmaroc           P                   IP21             V          OPct
      1.001     .18     83 (+9) .192    -94  .045
 DJI rallied immediately and above the upper band.
====================================================================================
 (42)
 9/3/2002   8308.05   Gain = +5.6%   1/6/2003   S12  8773.57 Paper loss = 13%
  7 more Buy B9s between 9/4/2002 and 9/17/2002
      LA/MA        21-dmaroc           P                     IP21             V          OPct
      .956    -.007    189 (-16) .122   -29   .025
 DJI fell to 7286 and then long rally from deeply oversold to resistance
 of earlier peak.
====================================================================================
 (43)  Reversing Buy.
 11/13/2002 8398.49   Gain= +4.5%   1/6/2003   S12 8773.57 Paper loss = 1%
      LA/MA        21-dmaroc      P                    IP21             V           OPct
     .996   .202     -99 (-83) .089    -73  .232
 DJI fell to 8341.63 and then rallied to the upper band and a Sell.
=====================================================================================
  (44)
 12/9/2002 8473.41   Gain= +3.5%   1/6/2003   S12 8773.57 Paper loss = 2%
 Five more Buy B9s from 12/`0/2002 to 12/16/2002 followed.
     LA/MA        21-dmaroc      P                     IP21             V           OPct
     .981   .155    122 (-22) -.004   -110  -.069
 DJI fell to 8332 and then rallied to the upper band.
============================================================================
 (45)  Reversing Buy
 1/22/2003  8318.73   Gain = 17.8%   10/15/03  S4  903.05 Paper loss = 9%
 Three more Buy B9s from 1/23/2003 to 1/29/2003 followed.
     LA/MA        21-dmaroc      P                    IP21             V          OPct
     .97    -.064   121 (-30) .012   -78   -.07
 DJI fell to 7552.07 six weeks later and then turned up.  The DJI
 needed to complete a classicly price-proportioned inverted head
 and shoulders pattern. I rallied above the upper band and neckline.
======================================================================================
 (46)
 10/14/2004  9894.45   Gain = +9.7% 12/28/2004  S8  10854.54 Paper loss = 1%
  Four more Buy B9s from 10/18/2004 to 10/26/2004 followed.
     LA/MA        21-dmaroc      P                     IP21               V             OPct
     .978   -.396   114 (-1)  -.054   -142  -.046
 DJI fell to 9749.99 and then rallied above the upper band.
===========================================================================
 (47) Reversing Buy
 7/18/2006 10799.23     Gain=+14.8%  1/5/2007  S9  12398   No Paper Loss
     LA/MA        21-dmaroc       P                        IP21             V          OPct
    .98     -.232    -28 (+55) -.124  -200    0
 DJI rallied immediately above the upper band.
======================================================================================
 (X) With DJI having dropped more than 40% in 10 months and below
 its 65-dma, the Extreme Bearish Mode should have been used.
 12/12/2008  8629.68     Gain = 4.5%   1/6/2009 S12 9015.1 Paper loss = 3%
 Three more Buy B9s from 12/22/2008 to 12/29/2008 followed.
     LA/MA        21-dmaroc     P          IP21             V          OPct
     1.019  -.489    10  .089   -1    .239
 DJI fell to 8419.49 before rallying to a Sell at the upper band.
=============================================================================
======================================================================================

    Number of completed trades = 47
        Avg. Gain = 10.4%
     5 losses: the two biggest were 7.1% and 10.7%, the 3 others were under 2%
          9 paper losses were greater than 4%.
          4 paper losses were greater than 8%, only one of which was after 1940