Flagrant V-Indicator Non-Cofirmations of A DJI New High
Sell S15s can only occur if the Annualized Rate of Change of the
21-dma is under +.60. They are not allowed in Year before a Presidential
Election and aftter May.
There have been only 17 Sell S15s since 1928. Used to go short the DJI, the average gain
would have been 10.1%. 8 of the 14 (58.8 %) would have produced gains of more than 10%.
Gains if DJI sold short of S15
and covered on next Peerless Buy
>10% 10
5%-9.99% 2
2%-4.99% 4
0%-1.99% 0
Losses 1
Sell S15s since
1928 19360303 S15 156.2 .042
1.026 .525 38 13 170 .014 -109 .023 .089
19360401 S15 158.9 .058
1.018 .206 -40 4 -174 -.097 -265 .213 .111
19370210 S15 189.4 .126
1.022 .468 -11 -1 -46 .055 -203 .233 .047
19370305 S15 194.1 .147
1.028 .373 -15 5 -65 .037 -231 .094 .059
X19540308 S15 298.6 -.005
1.017 .187 48 -30 163 .083 -29 .066 .062
19600105 S15 685.5 .107
1.018 .40 4 6 13 -.038 -170 .099 .085
19700401 S15 792.04 .19
1.018 .181 -58 -3 -123 -.014 -1 .034 -.088
19720406 S15 959.44 .025
19730105 S15 1047.49 .114
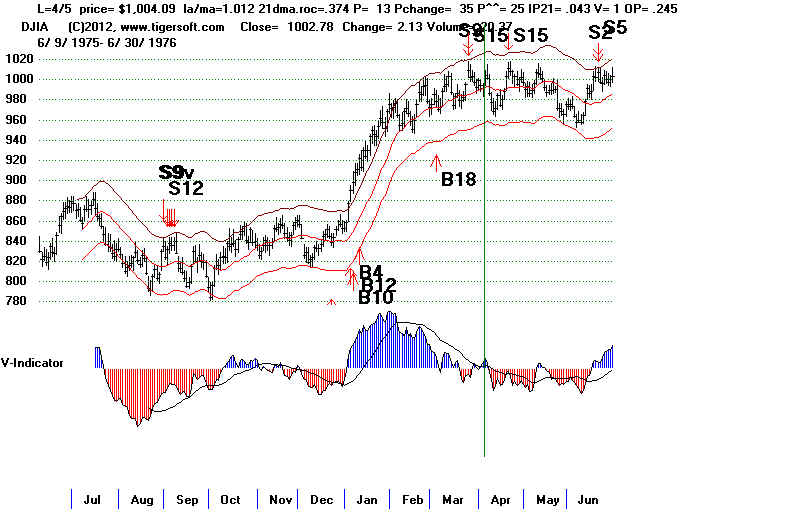
19760324 S15 1009.21 .048
1.024 .192 -64 10 -64 -.033 -1 .315
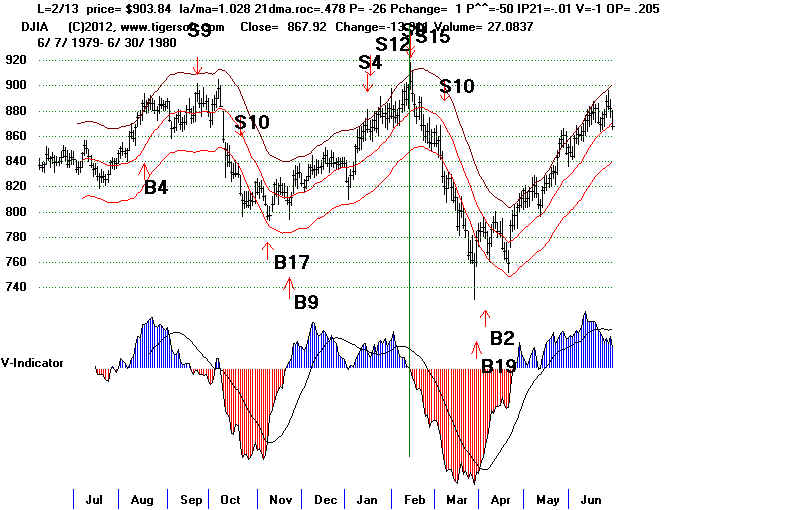
19800213 S15 903.84 .14
19900103 S15 2809.73 .074
19940518 S15 3732.89 .026
19980421 S15 9184.94 .169
20000107 S15 11522.56 .131
20020226 S15 10115.26 .19
20080501 S15 13040 .127
--------------------------------------------------------------------
No.=17 .101
PE       8      .085
PE +1    3      .129
PE +2    6      .107
PE +3    0      ----
Jan 4 .017 Feb 3 .152 Mar 4 .058 Apr 4 .111 May 2 .077 June 0 ---- Jul 0 ---- Aug 0 ---- Sep 0 ---- Oct 0 ---- Nov 0 ---- Dec 0 ---- 1-10 11 .092 11-20 3 .097 21-31 3 .136 |
March 2013 edition - Sell S15s
S15s are based on the V-Indicator
flagrantly not confirming a new high with the
Annualized Rate of Change of the 21-dma being under +.60.
Sell S15s can
occur only in the Presidential Election year and the first and
second years after it.
Sell S15s also can only take place in the first five months of
these years.
More exactly, the DJI makes a 50-day high with the V-Indicator negative and the
current Accumulation Index value (IP21) not more than
.10. The signal of March 2013)
should probably be eliminated, because the P-I is over 200
and the DJI is up more than 8.8%
over the last 65 trading days.
Because NYSE Up and DOwn Volume could only be estimated before mid 1966,
the Sell S15s before 1965 are ultimately uncertain.
All the paper losses after 1965 are
under 3.3%. So, I would work with a stop loss at 3.4%.
There have been 23 (or 25) completed Sell S15s since 1929. The average decline
for the DJI on these S15 trades was 8.4% at the time of the next major
Peerless Buy. None of these signals as now refined showed a loss.
After 1965, the biggest paper loss was 3.3% in March 1992. The average
paper loss in all cases was 0.9%.
A
cluster of major Sells, including S9s and S12s makes the Sell S15 more
bearish especially after two or more previous clusters of major Sells.
Reversing S15s in a Presidential Election year averaged only gains of
3.3%.
There were 6 cases. All occurred between January and April 14th.
|
Sell S15s, Gains, Paper Losses and Key Values Date DJI %Gain %-Paper LA/MA A-ROC P-I IP21 V-I Opct 65-day Pct Change Loss PI^^ (Adjusted P-I) Pct Change 2/18/36 153.4 + 3.1 6.8 1.029 . 608 57 .016 -28 .18 .064 PI^^ = 255 -------------------------------------------------------------------------------------------------------------------------------------------- 3/4/36 156.7 +5.2 4.6 1.028 .477 28 -.016 -139 .033 .092 --------------------------------------------------------------------------------------------------------------------------------------------- 4/1/36 158.9 +6.5 1.4 1.018 .206 -40 -.097 -265 .207 .101 --------------------------------------------------------------------------------------------------------------------------------------------- 2/10/37 189.4 +12.6 2.6 1.019 .391 -10 .034 -202 .055 .037 ---------------------------------------------------------------------------------------------------------------------------------------------- 3/5/37 194.1 +14.7 0.1 1.028 .373 -15 .037 -231 .092 .056 ------------------------------------------------------------------------------------------------------------------------------------------------- 1/5/60 685.5 +9.8 0 1.018 .40 4 -.038 -170 .095 .079 ----------------------------------------------------------------------------------------------------------------------------------------------- 3/26/70 791.05 +18.9 0 1.019 .35 -24 -.017 -1 .055 .006 -------------------------------------------------------------------------------------------------------------------------------------------------- 4/6/72 959.44 +5.0 1 1.020 .159 -70 .036 -1 .086 .045 -------------------------------------------------------------------------------------------------------------------------- 5/25/72 969.07 +5.9 2.2 1.025 .279 -10 .004 -1 .225 .059 -------------------------------------------------------------------------------------------------------------------------------------------------- 1/5/1973 1047.49 +8.9 0.4 1.023 .238 -77 .039 -2 .053 .09 --------------------------------------------------------------------------------------------------------------------------------------------------- 3/24/76 1009.21 +4.2 0 1.024 .192 -64 -.033 -1 .293 .165 ---------------------------------------------------------------------------------------------------------------------------------------------------- 4/21/76 1011.02 + 4.4 0 1.019 .345 -1 .038 -1 .07 .067 ----------------------------------------------------------------------------------------------------------------------------------------------------- 2/13/80 903.84 +14.0 0 1.028 .478 -26 -.01 -1 .206 .108 ----------------------------------------------------------------------------------------------------------------------------------------------------- 4/24/81 1020.35 +17.4 0 1.018 .061 1 -.012 -1 .11 .073 biggest ------------------------------------------------------------------------------------------------------------------------------------------------------ 1/2/90 2810.15 +7.5 0 1.028 .453 36 .08 -4 .093 .04 ----------------------------------------------------------------------------------------------------------------------------------------------------- 4/14/92 3306.13 +1.6 3.2 1.017 .256 -59 .033 -10 .231 .036 biggest ------------------------------------------------------------------------------------------------------------------------------------------------------- 4/21/98 9184.94 +16.9 1.7 1.024 .37 13 .045 -7 .056 .056 -------------------------------------------------------------------------------------------------------------------------------------------------------- 1/7/2000 11522.56 +4.8 1.7 1.021 .48 -23 -.028 -59 .341 .083 highest AROC highest OPct -------------------------------------------------------------------------------------------------------------------------------------------------------- 2/11/2004 10737.70 +7.2 0 1.017 .285 +246 .093 -6 .136 .082 --------------------------------------------------------------------------------------------------------------------------------------------------------- 3/4/2005 10940.85 +6.6 0 1.017 .381 +251 .093 -15 .14 .047 highest P-I ------------------------------------------------------------------------------------------------------------------------------------------------------- 5/1/2008 13040 +12.7 0 1.029 .405 +178 .047 -28 .076 .043 -------------------------------------------------------------------------------------------------------------------------------------------------------- X - Dubious because P-I >+200 and 65 Pct change is over .085 (8.5%) 1/4/2012 12418.42 -1.3 1.3 1.025 .393 +211 -.045 -4 .10 .121 high highest ---------------------------------------------------------------------------------------------------------------------------------------------------------- 3/14/2012 13194.10 +3.6 0.5 1.019 .295 +129 .069 -24 .231 .09 --------------------------------------------------------------------------------------------------------------------------------------------------------- 5/1/2012 13279.32 +2.9 0 1.018 .061 +78 -.003 -87 .036 .046 -------------------------------------------------------------------------------------------------------------------------------------------------------- X - Dubious because P-I > +200 and 65 Pct change is over .085 (8.5%) 3/5/2013 14254.77 1.019 .208 +229 .083 -32 .116 .089 high high ======================================================================================= N= 23 Avg Gain = 8.35% Avg Paper Loss = 0.88% |
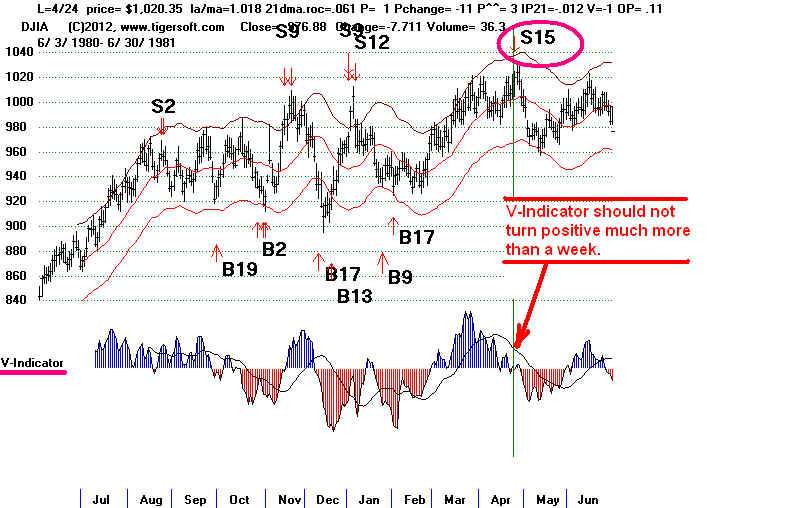
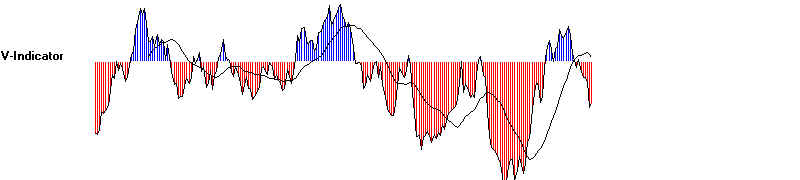
The V-Indicator Should Not Turn Positive
for More Than A Few Days
Usually after an S15, the V-Indicator stays and falls more deeply negative
after the Sell S15. See the tables and charts at the bottom of this page. The V-Indicator
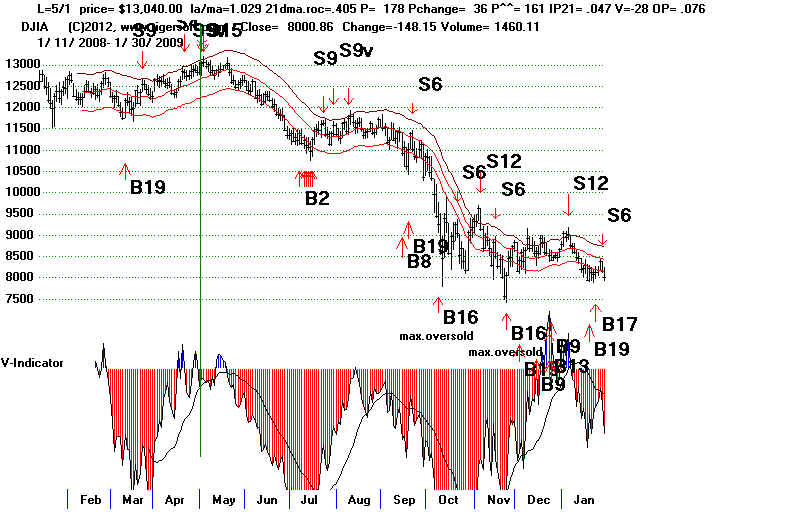
can sometimes turn positive for a few days. When it turns positive for a week,
as in 1992 and 2008, if there is no Peerless Buy signal, consider the DJI decline delayed
and about to start in earnest as soon as the V-Indicator turns negative again. On the
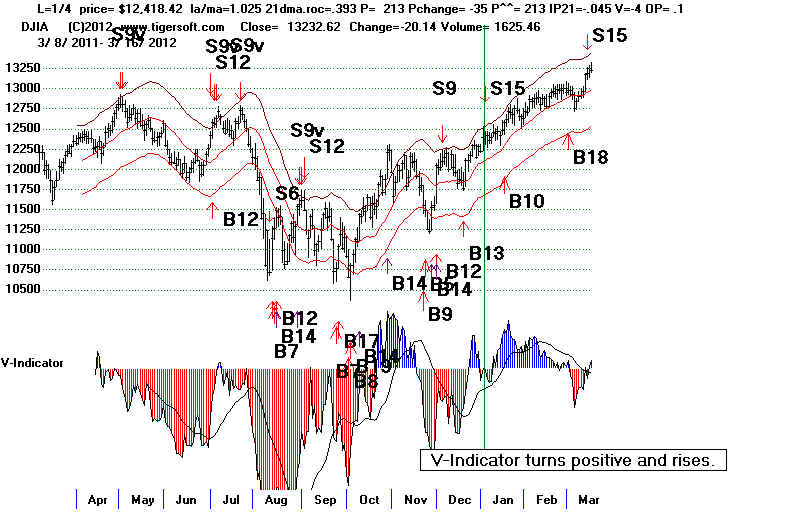
other hand, if it turns positive and keeps rising for more than a week, I would suggest
doubting Sell S15 and waiting for new signal. This occurred in January 2012 and
may be occurring again in March 2012.
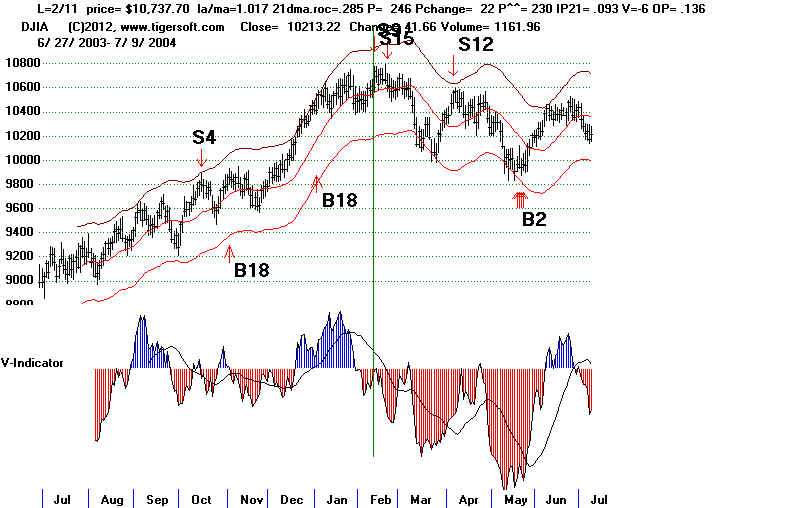
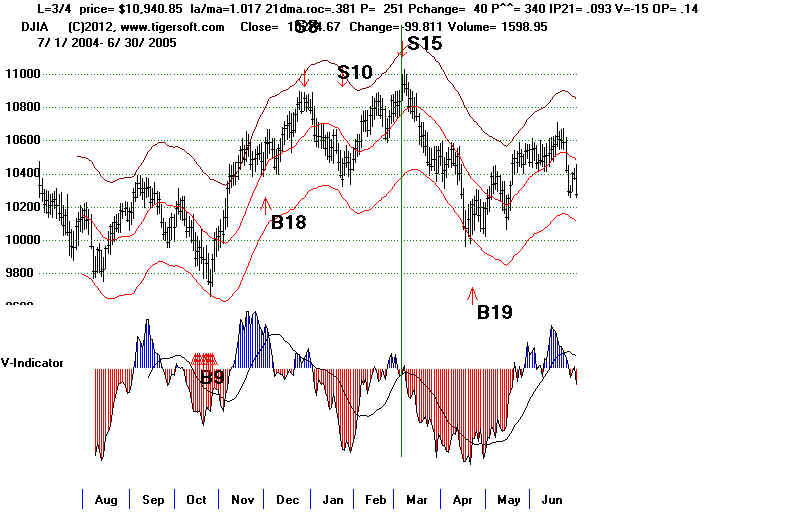
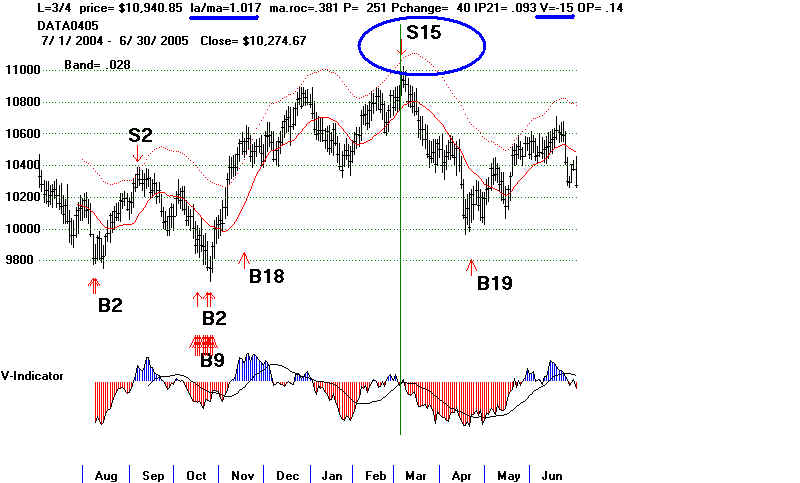
You can see below in the case of 2004 that the DJI may be as low as 1.7%
over the 21-day ma with the P-Indicator as high as +251 and
the A/D Line still making
new highs. The key here and in the second case,
2/11/2004, was that there had been a
substantial rally and the V-Indicator was negative.
In addition, the P-Indicator
and Accumulation Index did not confirm the DJI's new high
by making highs of
their own. It should be noted in these cases that the
V-Indicator quickly turned
negative. l
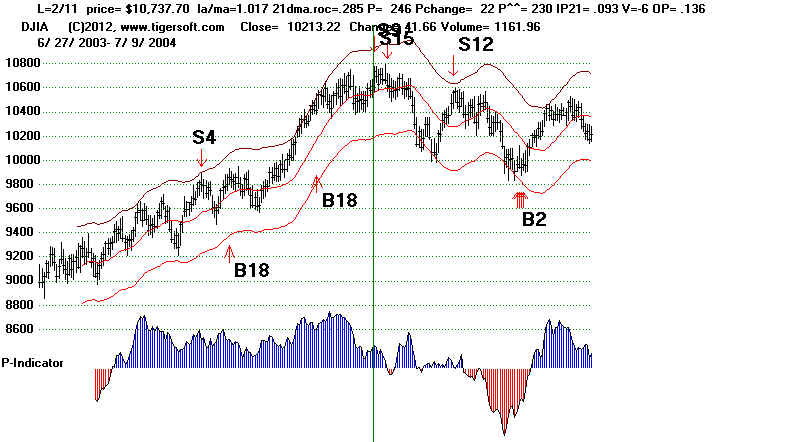
Here are two examples.
3/4/2004 S15
2/11/2004 S15
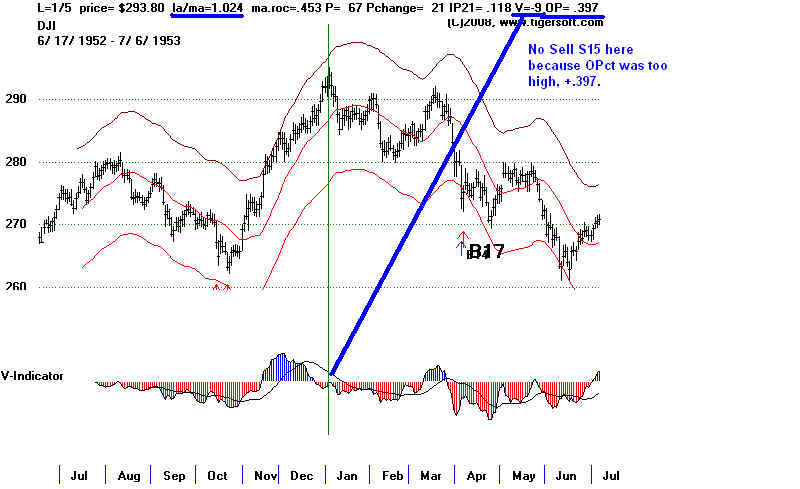
In the next example, there was no S15. This is because the Opct was too
high. Still, the run upwards to recovery highs saw a complete non-confirmation
by the V-Indicator. This shows the need to be vigilant, even when there
is no Sell S15. The reason for not allowing the S15 here is based on findings
that show a Sell S15 that allowed such high OPct readings would suffer
more losses, as prices tend to rise in these cases.
S15s in Year of The Presidential Election Years Next Reversing Sell Signal
date dji la/ma ann roc. P-I P ch AI V-I OPct Date DJI Gain Signal
^2/18/36 153.4 1.029 .608 57 17 .016 -28 .18 5/5/36 148.6 +3.1.% B2
4/1/36 158.9 1.018 .206 -40 4 -.097 -265 .207 5/5/36 148.6 +6.5.% B2
1/15/60 685.5 1.018 .40 4 6 -.038 -186 .089 2/11/60 618.60 +9.8% B17
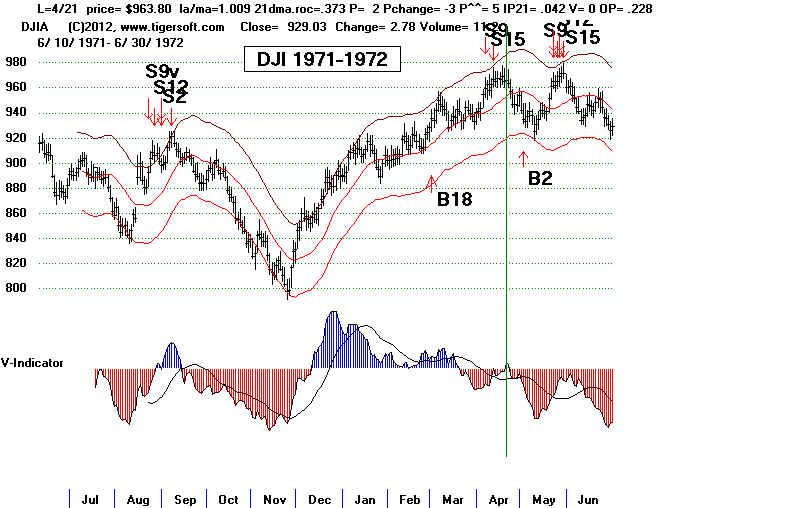
^4/6/72 959.44 1.02 .159 -70 15 .036 -1 .086 7/18/72 911.72 +5.0% B2
5/25/72 969.07 1.025 .279 -10 14 .004 -1 .225 7/18/72 911.72 +5.9% B2
^3/24/76 1009.21 1.024 .192 -64 10 -.033 -1 .293 10/5/76 966.76 +4.2% B2
4/21/76 1011.02 1.019 .345 -1 15 .038 -1 .07 10/5/76 966.76 +4.4% B2
2/13/80 903.84 1.028 .478 -26 1 -.01 -1 .206 3/28/80 966.76 +14.% B19
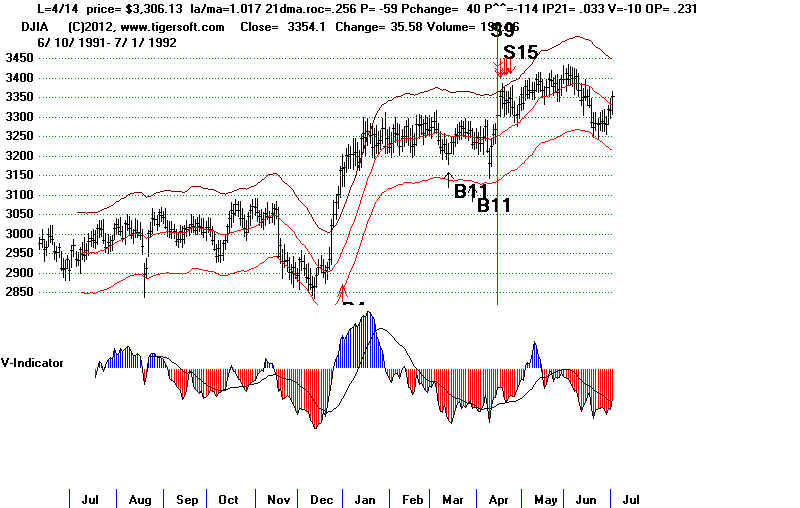
^4/14/92 3306.13 1.017 .256 -59 40 .033 -10 .231 8/21/92 3254.10 +1.6% B2
1/7/2000 11522.56 1.021 .48 -23 103 -.028 -59 .341 2/4/2000 3254.10 +4.8% B17
^2/11/2004 10737.70 1.017 .285 246 22 .093 -6 .136 5/18/04 9968.51 +7.2% B2
5/1/2008 13040 1.029 .405 174 34 .047 -28 .076 7/8/08 11384.21 +12.7% B2
^1/4/2012 12418 1.025 .393 213 -35 .045 -4 .10 7/8/08 11384.21 -1.3% B10
^3/14/2012 13194 1.019 .295 129 -148 .069 -24 .23 open...
N=11 AVG. = +7.0%
Reversing S15s in a Presidential Election Year gained only +3.3% on average.
========================================================================
S15s in First Year after The Presidential Election Years Next Reversing Sell Signal
date dji la/ma ann roc. P-I P ch AI V OPct Date DJI Gain Signal
2/10/37 189.4 1.019 .391 -10 12 .034 -202 .116 2/10/37 189.4 +12.6% B8
1/5/1973 1047.49 1.023 .238 -77 -7 .039 -2 .053 2/26/73 953.79 + 8.9% B16
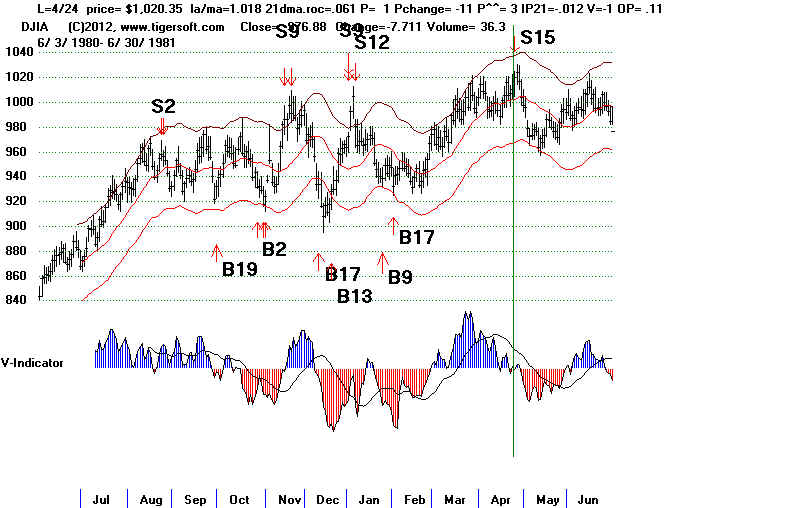
4/24/81 1020.35 1.018 .061 1 -11 -.012 -1 11 9/28/81 842.56 +17.4% B19
3/4/2005 10940.85 1.017 .381 251 40 .093 -15 .14 4/21/05 10218.6 +6.6% B19
N=4 AVG. = +11.4%
========================================================================
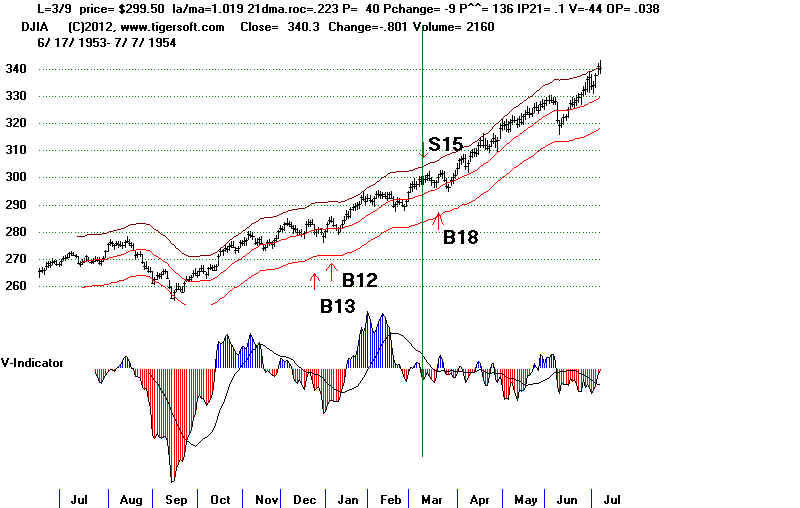
S15s in Second Year Just after The Presidential Election Years Next Reversing Sell Signal
date dji la/ma ann roc. P-I P ch AI V OPct Date DJI Gain Signal
3/9/54 299.50 1.019 .223 40 -9 .10 -44 .038 3/18/54 300.10 -0.2% B18
3/26/70 791.05 1.019 .35 -24 -22 -.017 -1 .055 5/25/70 641.36 +18.9% B16
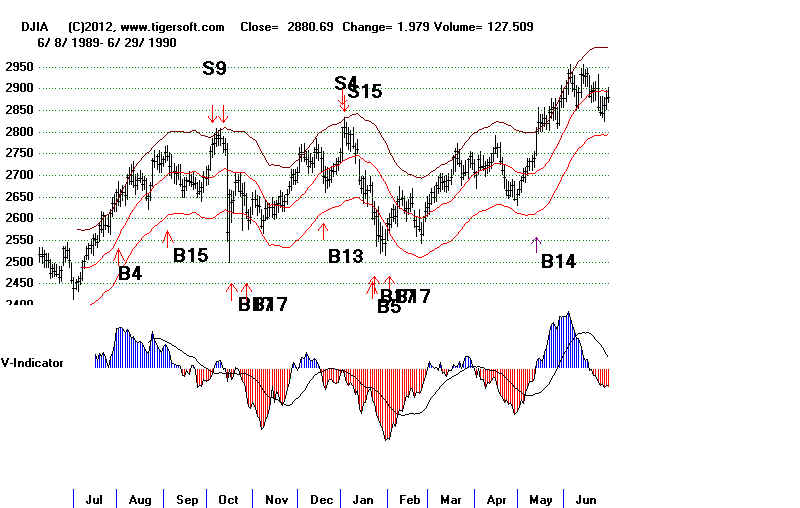
1/2/90 2810.15 1.028 .453 50 30 .108 -1 .02 1/22/90 2600.45 +7.5% B5
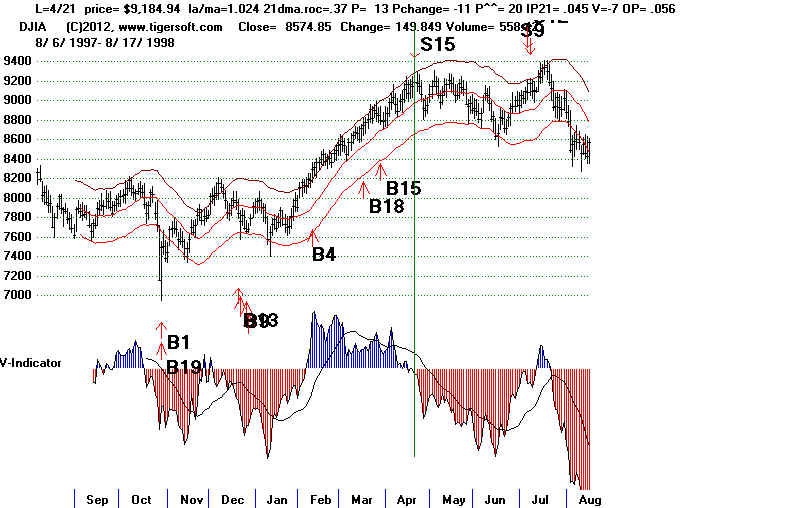
4/21/98 9184.94 1.024 .37 13 -11 .045 -7 .056 1/22/90 7632.53 +16.9% B9 N=4 AVG. = +10.8%
 .
.