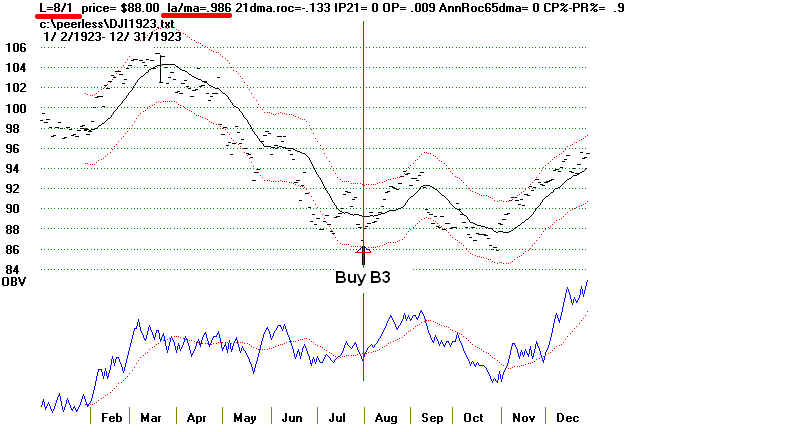
Buy B3
Version 10/14/2014 (C) 2013 William
Schmidt, Ph.D.
==================================================================================
Buy B3s occur when the DJI closes between the 3.5% and 4% lower bands
and the 20-day Stochastic Pct-D does not confirm the new
low.
They are only allowed from May to November, excepting
September.
There presently are no limits on how low the Pct-D may be.
But it should
be noted that in the 3 cases where the Pct-D was 9 or
less on the day of
the Buy B3, the average gain was only 6.3%,
There were no cases between
1928 and 2013 whewre the Pct-D was ever below 7,0
when a B3 was
given. Perhaps, the most recent case with a
Pct-D value of only 6.0
should not be allowed.
There
have been 25 B3s since 1929. The average gain was +16.1%.
The average paper loss was 1.3%, but one of the paper
losses was 11.8%.
This occurred near the bottom of a long bear market.
13 of the 25 Buy B3s occurred in just two months, October
and November.
They averaged quite high gains, around 20.0%.
Octobers:
Gains Paper
Losses
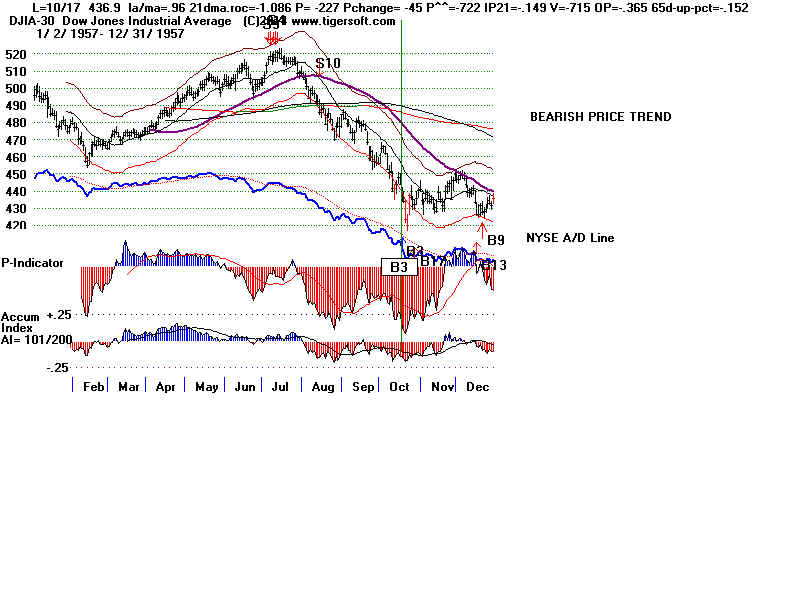
19571017 B3 436.9 .488
.032
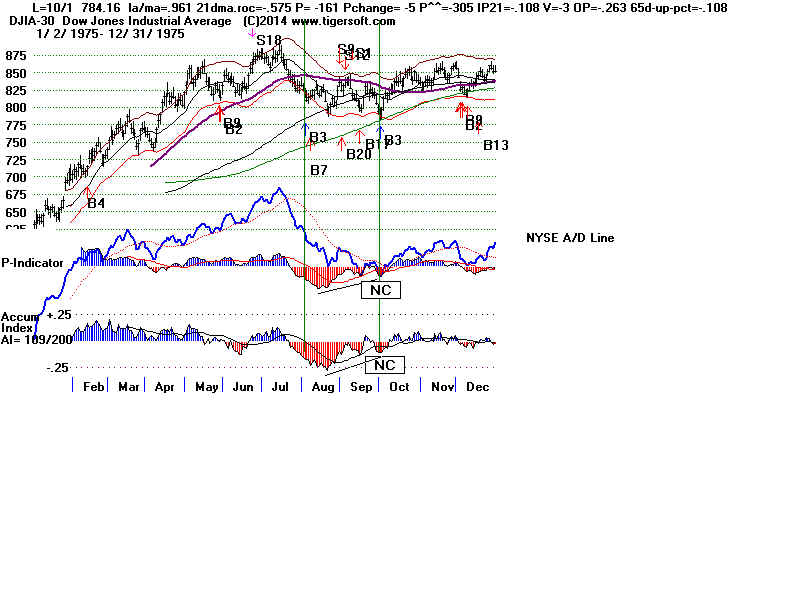
19751001 B3 784.16
.281 none
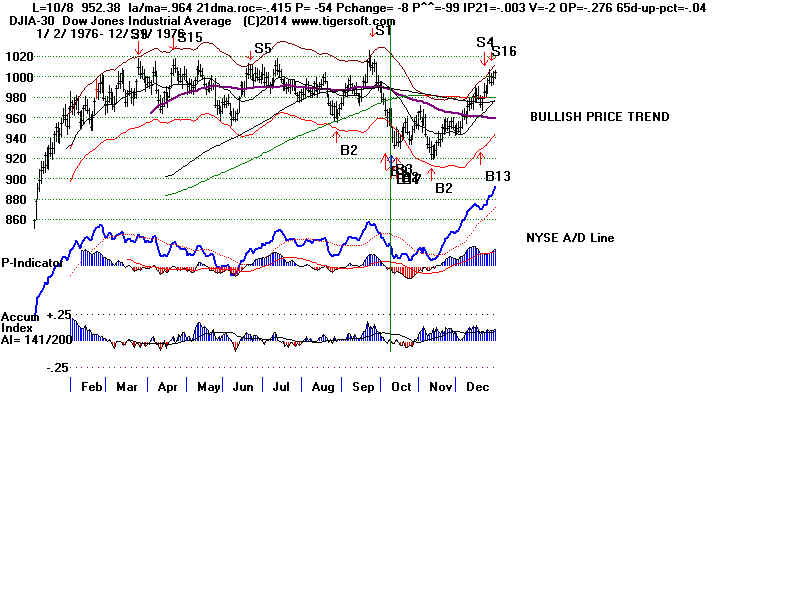
19761008 B3 952.38 .034
.022
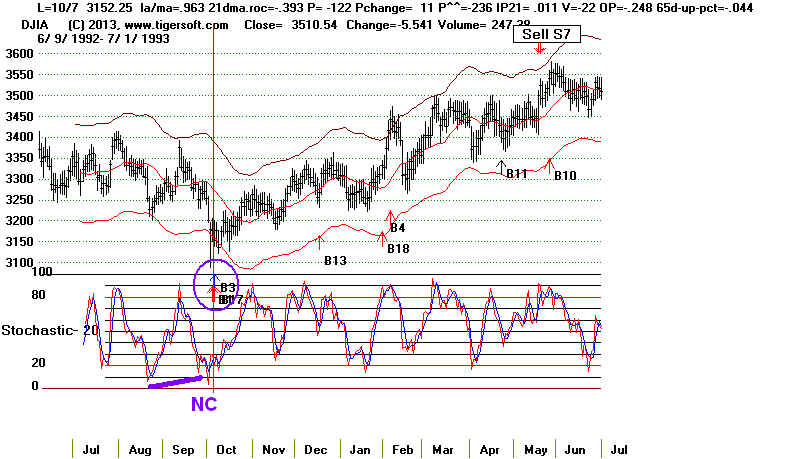
19921007 B3 3152.25 .110 .005
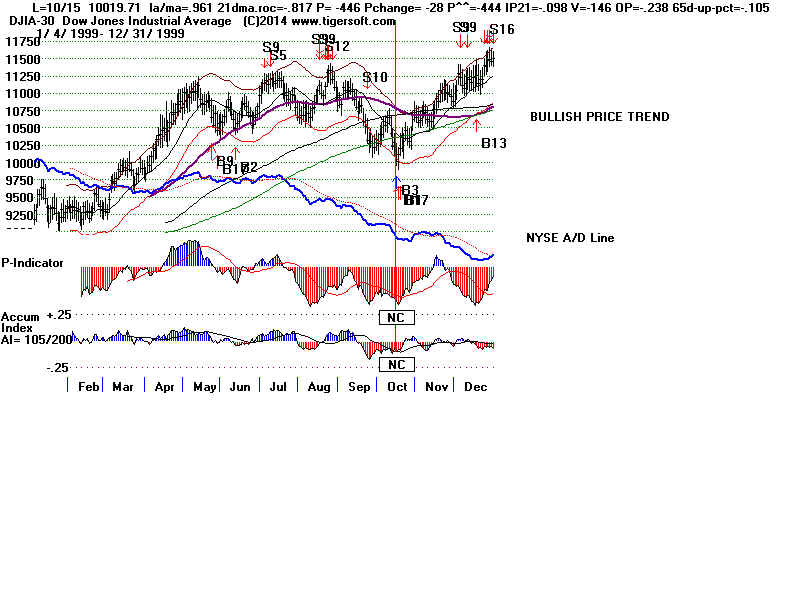
19991015 B3 10019.71 .120 none
------------------------------------
.255 .012
BUY B3s: 1928-2014 By Month in 4-Year Presidential Cycle
| |
Jan |
Feb |
Mar |
April |
May |
June |
July |
Aug |
Sept |
Oct |
Nov |
Dec |
|
PresElec
Year |
|
|
|
|
|
20120604 |
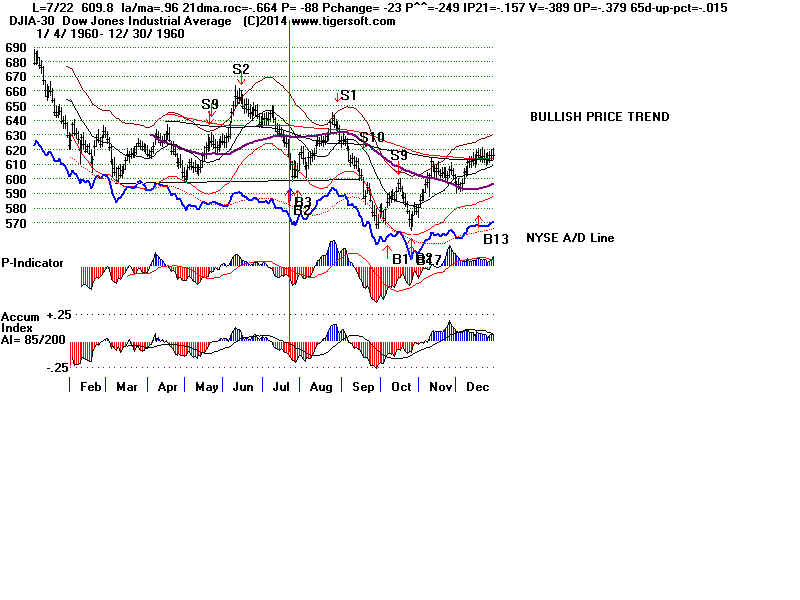
19600722
19960723 |
|
|
19761008 |
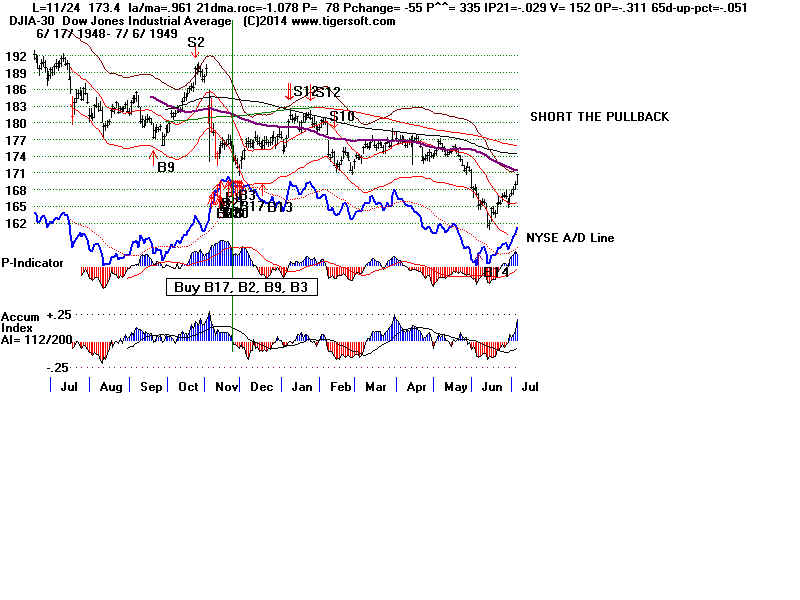
19481124 |
|
5 |
| PE+1 |
|
|
|
|
|
19370614
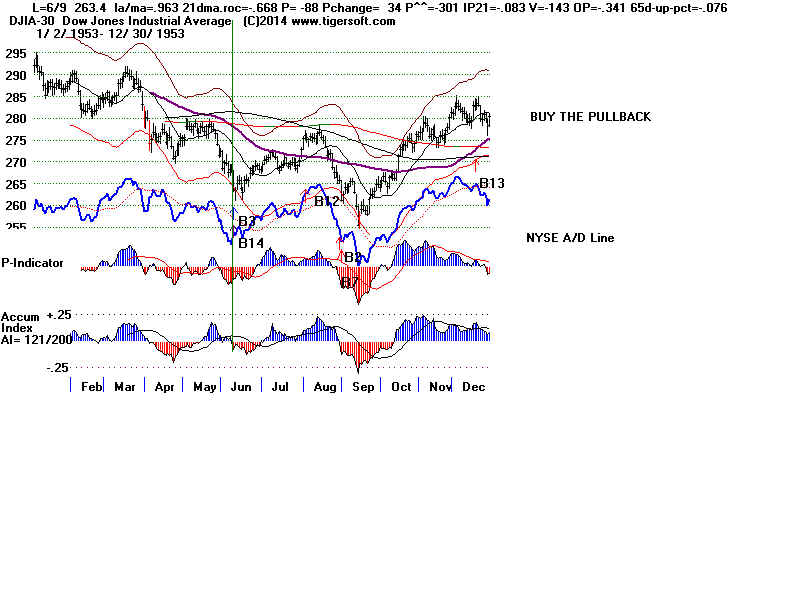
19530609 |
|
|
|
19571017 |
|
|
3 |
| PE+2 |
|
|
|
|
|
19820607 |
19740520 |
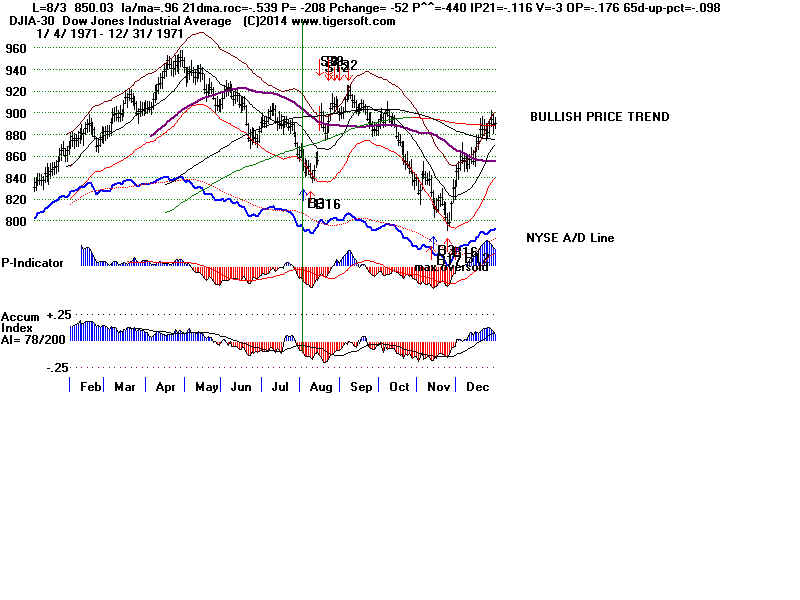
19710803 |
|
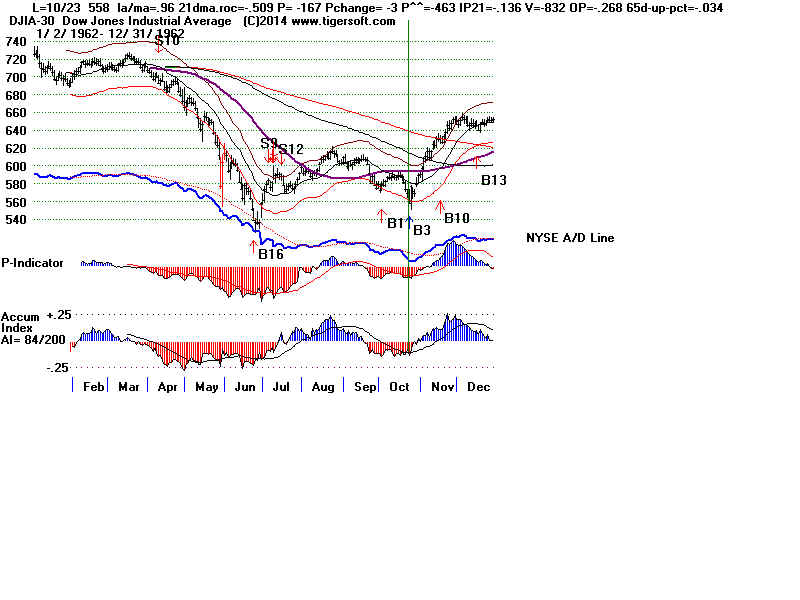
19621023
19921007 |
19781113
19941123 |
|
7 |
| PE+3 |
|
|
|
|
19470519
19740524 |
|
|
19750804
20070814 |
|
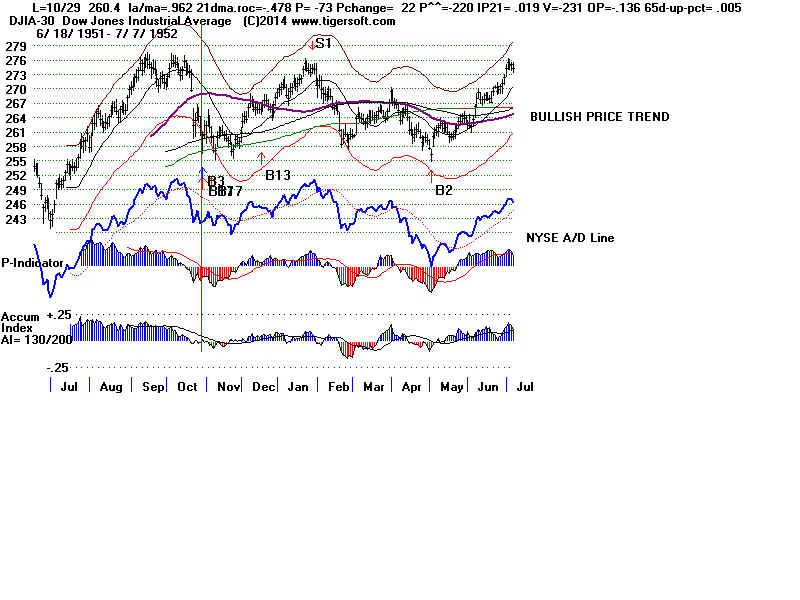
19511029
19751001
19991015
20071119 |
19431115
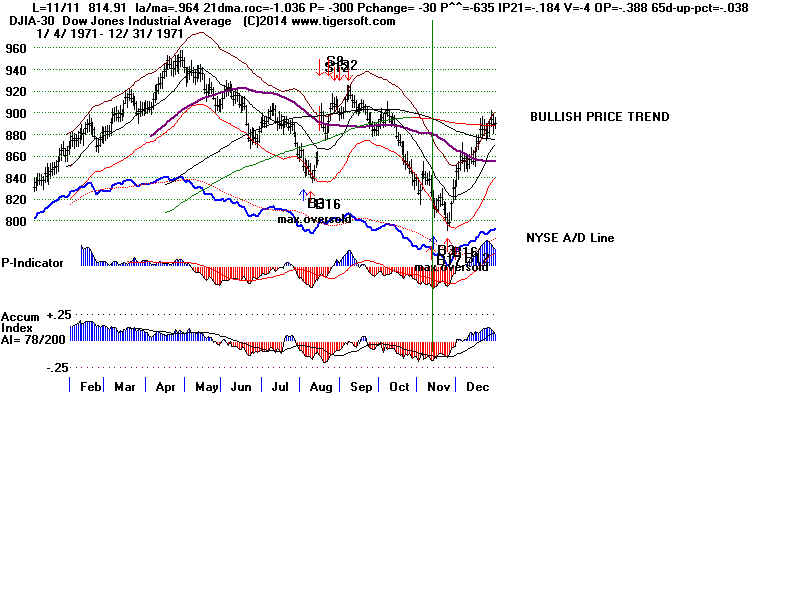
19711111 |
|
10 |
The 25 Peerless Buy B3s since 1928 gained on average 16.1%. Only one
occurred before 1943. By far the biggest gains
occurred in the second Year of the
4-year Presidential cycle.
B3s in 2nd Year of 4-Year
P.E.Cycle
19621023 B3 558.00
.682
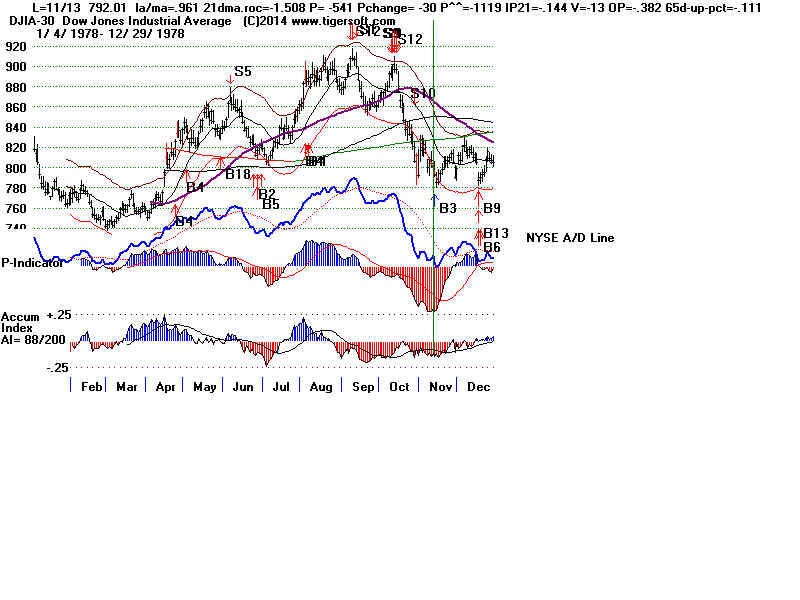
19781113 B3 792.01
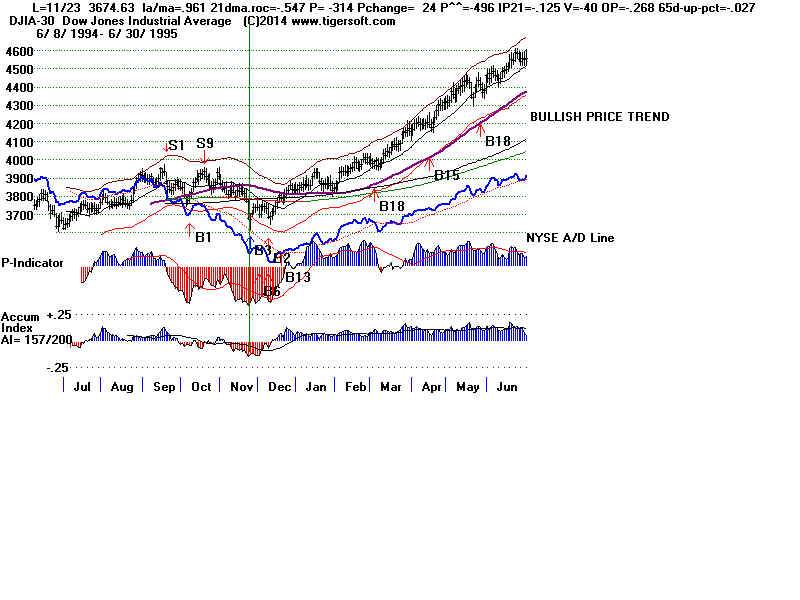
.118
19941123 B3 3674.63
.510
Buy B3s taking place in the Presidential Election year
gained only 6.9%
in six cases.
Note that mid-Summer Buy B3s are sensitive to the year of
the 4-year
Presidential cycle that they would occur in. None
occur in the year after
the Presidential Election Year. The gains averaged a
modest +6.4%.
Mid-Summer Buy B3s
19600722 B3 609.8
.04
19710803 B3 850.03
.046
19750804 B3 818.05
.021
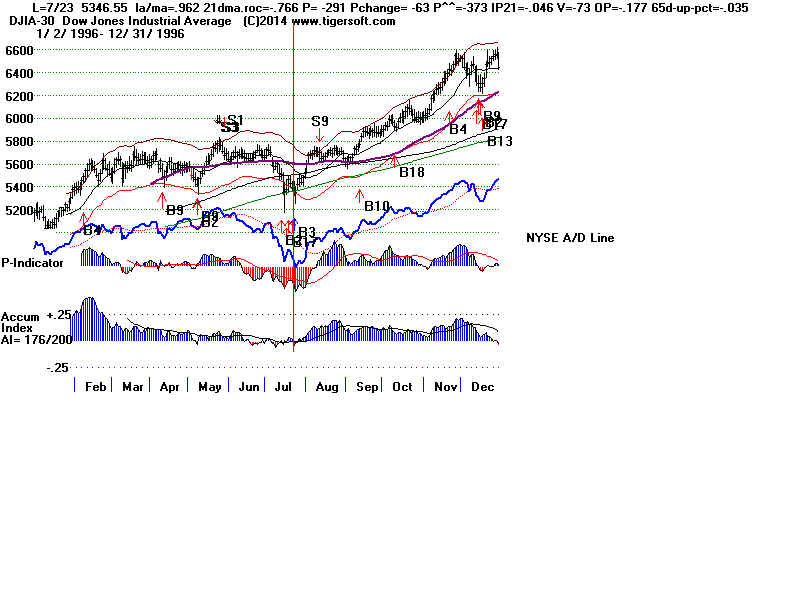
19960723
B3 5346.55 .067
20070814 B3 13028.92
.060
20120604 B3 12101.46
.122
-----------------------------------------------
No. = 6 Avg. = 6.4%
When the
P-Indicator and Accumulation Index was confirming the
low made at the
time of the Buy B13, the gains were somewhat
smaller and the
paper losses somewhat higher.
Gains Paper
Losses
.04 .013
.046 .012
.177 .021
.021 .030
.118 .009
.026 .118
.510 .000
.060 .013
.122 .000
----------------
.124 .024
Buy B3s: 1928-2013
Pct Paper Loss
19370614 B3
165.6
.123 none
PI NC, AI-NC
Pct-D - 39.6
19431115 B3
131.6
.246 .015
A/D
NC
Pct-D - 15.4
19470519 B3
163.6
.127 none
PI NC, AI-NC
Pct-D - 14.0
19481124 B3
173.4
.039 .013
PI and AI - both PMC
Pct-D - 17.0
19511029 B3
265.8
.053 .013
AI - PNC
Pct-D - 20.4
19530609 B3
263.4
.778 .022
PI -
minor NC
Pct-D - 9.8
19571017 B3
436.9
.488 .032
AI - minor NC
Pct-D = 19.8
19600722 B3
609.8
.04 .013
all confirmed.
Pct-D - 8.9
19621023 B3
558.00
.683 none
AI - minor NC
Pct-D = 12.2
19710803 B3
850.03
.046
.012 all confirmed.
Pct-D = 10.8
19711111 B3
814.91
.177 .021 all confirmed
Pct-D = 17.0
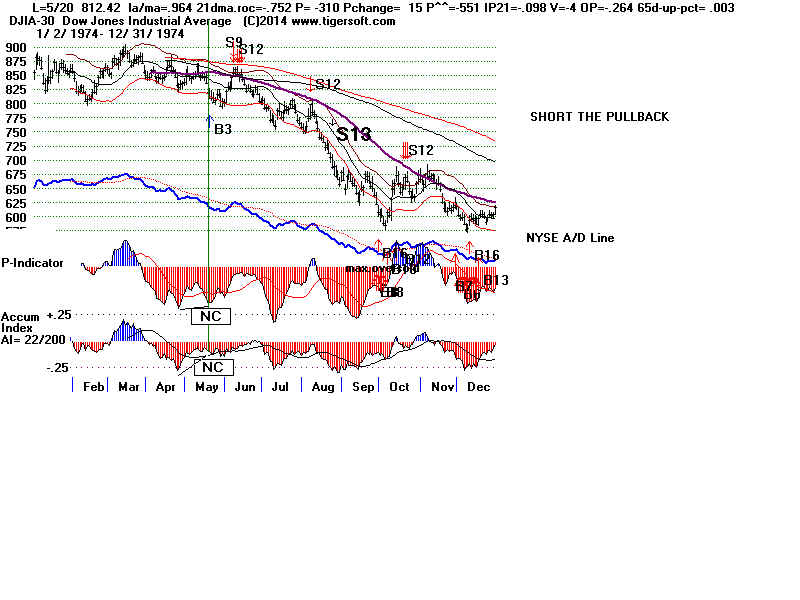
19740520 B3
812.42 .
051 .021
PI NC, AI-NC
Pct-D = 11.3
19750804 B3
818.05
.021 .030
all confirmed.
Pct-D = 11.3
19751001 B3
784.16
.281 none
PI NC, AI-NC
Pct-D = 11.3
19761008 B3
952.38
.034 .022
AI - PNC
Pct-D = 12.1
19781113 B3
792.01
.118 .009
all confirmed.
Pct-D = 17.6
19820607 B3
804.03
.026 .118
all confirmed.
Pct-D = 7.0
19921007 B3
3152.25
.11 .005 AI - PNC
Pct-D = 27.1
19941123 B3
3674.63
.510 none all confirmed.
Pct-D = 9.8
19960723 B3
5346.55
.067 none
AI - PNC
Pct-D = 36.3
19991015 B3
10019.71
.120 none
PI NC, AI-NC
Pct-D = 17.6
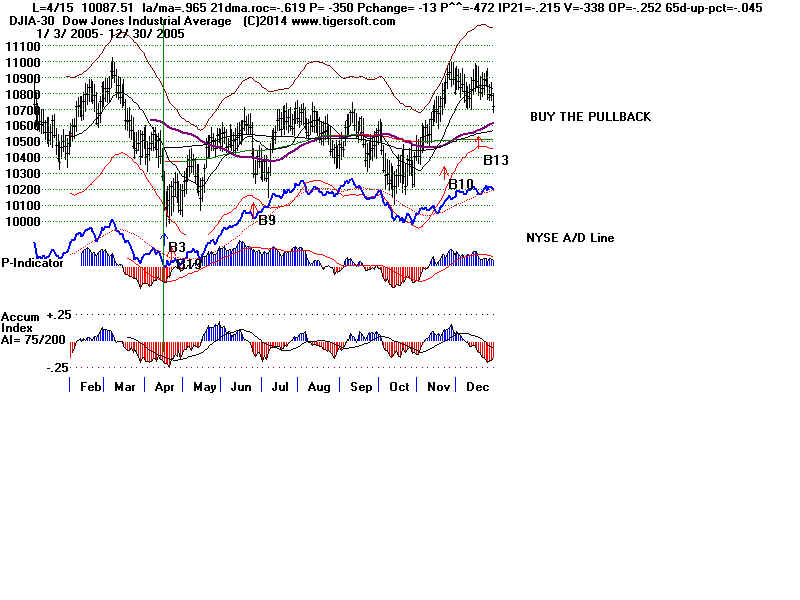
20050415 B3
10087.51
.148 none
PI NC
Pct-D = 9.9
20070814 B3
13028.92
.060 .013 all confirmed.
Pct-D = 18.1
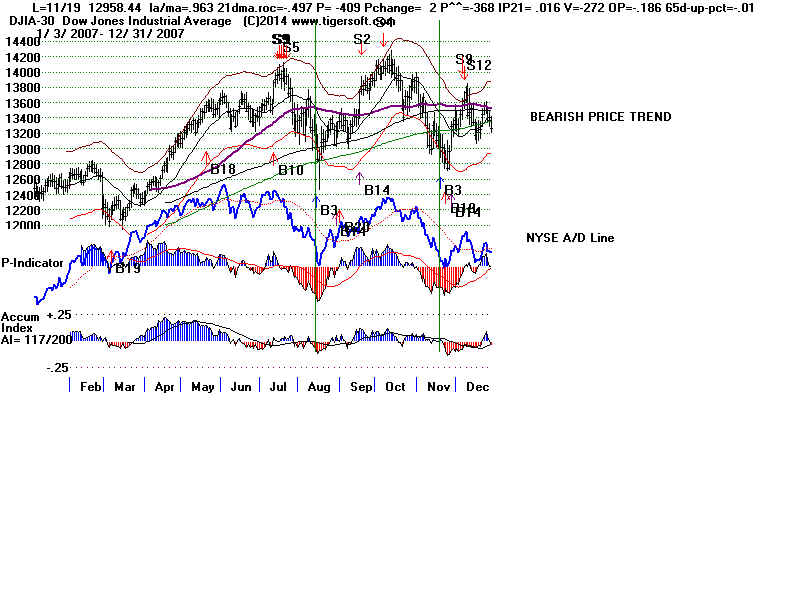
20071119 B3
12958.44
.051 .017
PI NC, AI-NC
Pct-D = 16.9
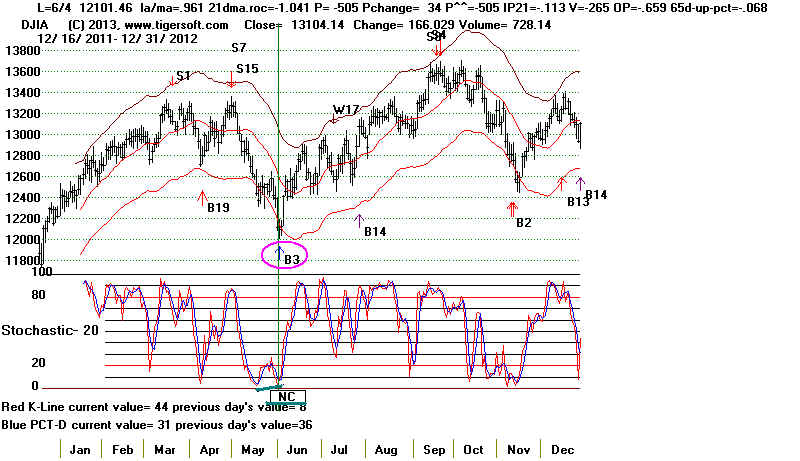
20120604 B3
12101.46
.122 none
all
confirmed.
Pct-D = 7.4
-----------------------------------------------------------------------------
n=25 .161 .013
New
2014 B3
16315.19
Pct-D = 6.0
|
Waiting
for the CLosing Power to hook up and confirm the
Buy B3 caused a much less favorable Buy point in all the
cases since 1994. We must start there because Closing
Power
data only becomes available with SPY in 1994.
19941123 B3
3674.63
.510 none all confirmed.
SPY 45.25 vs CP trend-break = 45.60
19960723 B3
5346.55
.067 none
AI - PNC
SPY 62.68 vs CP trendbreak = 63.62
19991015 B3
10019.71
.120 none
PI NC, AI-NC
SPY 124.87 vs CP trendbreak =
128.25
20050415 B3
10087.51
.148 none
PI NC
SPY 114.15 vs CP trendbreak =
115.27
20070814 B3
13028.92
.060 .013 all confirmed.
SPY 145.23 vs CP trendbreak = 146.65
20071119 B3
12958.44
.051 .017
PI NC, AI-NC
SPY 143.76 vs CP trendbreak =
147.13
20120604 B3
12101.46
.122 none
all
confirmed.
SPY 128.10 vs CP trendbreak = 129.07
=================================================================================
2012-Early 2013 Peerless Buy
B3s
BUY at the 3.6%-4.0% LOWER BAND
when the Blue 20-day Stochastic PctD
fails to confirm
the DJI new low.
April-July and Oct.-Nov.
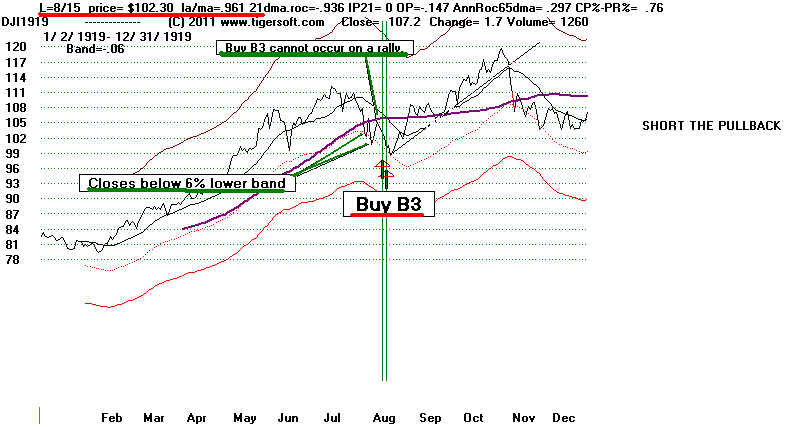
Note that the B3 can only occur
when the DJI closes 3.6% to 4.0% below the 21-day ma.
This signal is not allowed to follow Sell S9s or Sell S12s by 30
trading days or
less. Sometimes such a Buy signal would still have worked well, but too
many times
it would have failed badly. Look at some of the cases where it failed
badly below
and keep this in mind: 6/6/2008, 6/4/2002, 9/21/1999, 10/12/1987 and
6/11/1969.
The signal is restricted to
only 4 months of the year. Either there were insufficient
cases to trust the B3 in these months (February and March) or there
were a number
of failures in the month (September).
The Buy B3 is not allowed where the DJI jumps up 3% or more in a few
days
back to the lower 4% band. Example 8/17/1971.
The Buy B3 is not allowed in June when the V-Indicator is very
negative, below
-300. There are no other internal strength requirements.
The improving Srochastic
Pct-D is the key element here.
Some of the gains were very good. Usually they occurred with
other Peerless
nearby Buy signals. These Buy signals in October and November
have
led to some very big advances:
2013 version of Peerless - This list is not complete.
Sell B3s: 1928-2013
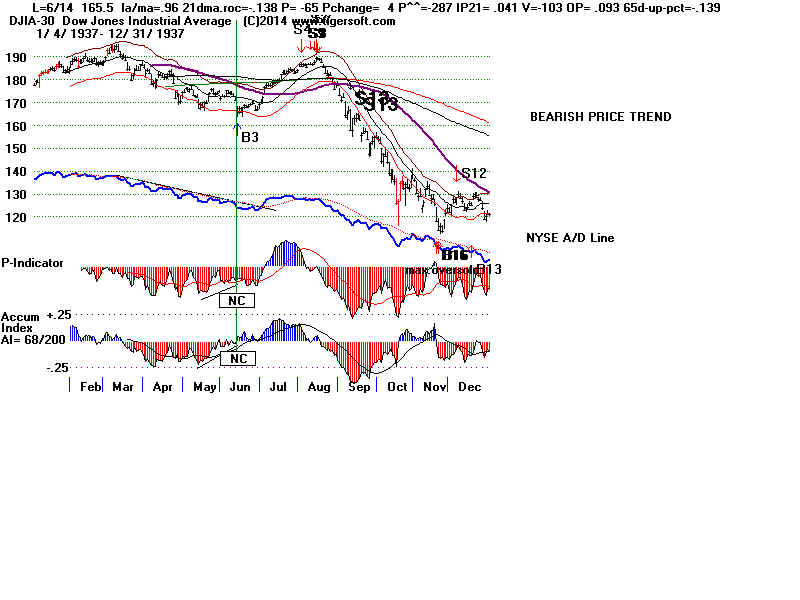
#1 6/14/1937 +12.3% no Paper loss
165.5 .96 -.138 -65 4 -287 .041 -103 .093 -.139
---------------------------------------------------------------------------
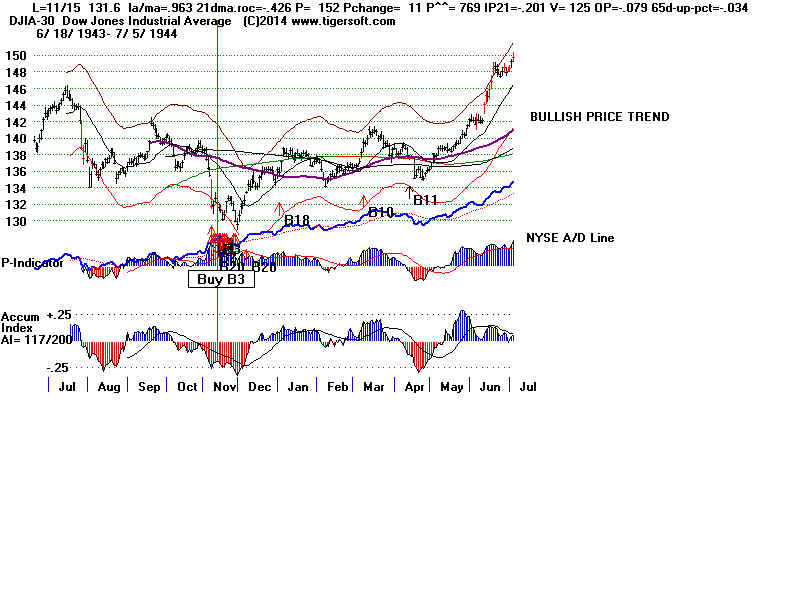
#2 11/15/1943 +24.6% on 5/14/1944 1.6% paper loss
131.6 .963 -.426 152 11 769 -.201 125 -.079 -.034
---------------------------------------------------------------------------
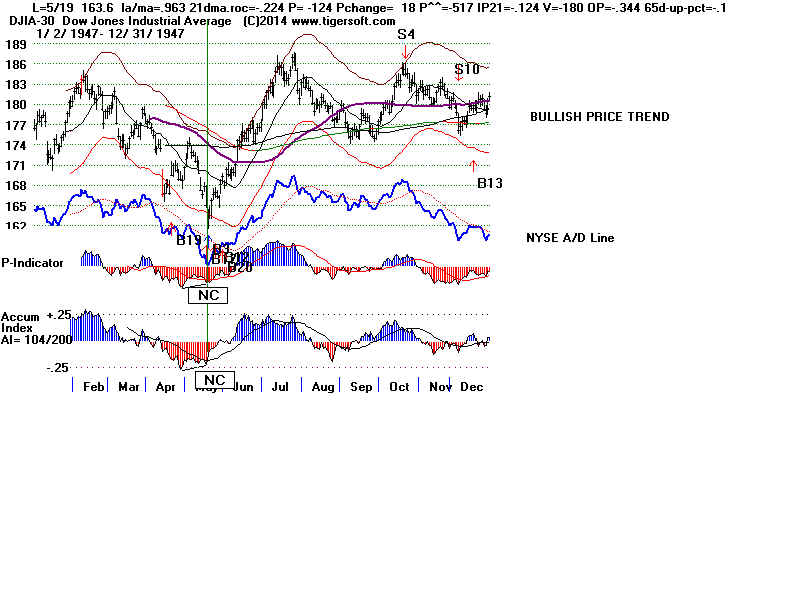
#3 5/19/1947 +12.7% no Paper loss
163.6 .963 -.224 -124 18 -517 -.124 -180 -.344 -.10
---------------------------------------------------------------------------
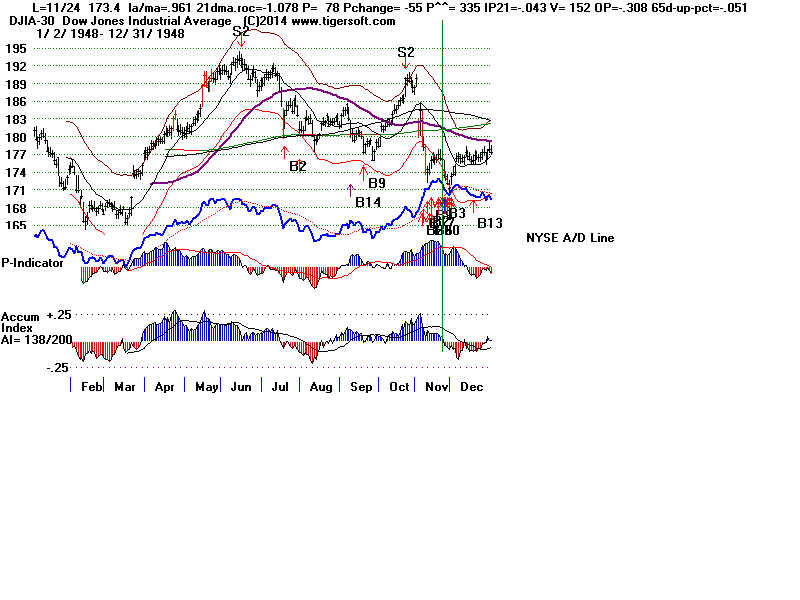
#4 11/24/1948 +3.9% 1.3% paper loss
173.4 .961 -1.078 78 -55 335 -.043 152 -.237 -.051
----------------------------------------------------------------------------
#5 10/29//1951 +5.3% 2.4% paper loss
260.4 .962 -.478 -73 22 -220 .019 -231 -.167 .005
----------------------------------------------------------------------------
#6 6/9/1953 +79.9% on 7/27/1955. 1.9% paper loss
263.4 .963 -.668 -88 34 -301 -.083 -143 -.452 -.076
----------------------------------------------------------------------------
#7 10/23/1962 +68.1% on 5/13/1965 no Paper loss
558 .960 -.509 -167 -3 -463 -.136 -832 -.285 -.034
----------------------------------------------------------------------------
#8 11/11/1971 +17.7% 2.1% paper loss
814.91 .964 -1.036 -300 -30 -635 -.184 -4 -.388 -.038
----------------------------------------------------------------------------
#9 5/20/1974 +6.5% 2.1% paper loss
812.42 .964 -.752 -310 15 -310 -.098 -4 -.264 .003
----------------------------------------------------------------------------
#10 10/1/1976 +3.4% 3.0% paper loss
952.38 .964 -.415 -54 -8 -54 -.003 -2 -.276 -.04
---------------------------------------------------------------------------
#11 11/13/1978 +11,8% on 8/22/1979. 0.6% paper loss
792.01 .961 -1.508 -541 -30 -1119 -.144 -13 -.382 -.111
--------------------------------------------------------------------------
#12 6/7/1982 +2.6% DJI rose from 804.03 to ???
2.6% paper loss
804.03 .961 -.839 -266 -46 -512 -.235 -11 -.504 .005
--------------------------------------------------------------------------
#13 10/7/1992 +11.0% DJI fell from 3152.25 to 3136.58 and then rallied.
3152.25 .963 -.393 -122 11 -236 .011 -22 -.248 -.044
--------------------------------------------------------------------------
#14 11/23/1994 No Paper loss. DJI rallied from 3674.63 to 5549.21 on 2/27/94
This signal cancelled Sell S10 on same day.
3674.64 .961 -.547 -314 24 -496 -.125 -40 -.268 -.027
--------------------------------------------------------------------------
#15 4/15/2005 excellent DJI fell from 10087.51 to 10127.41 and then rallied
to 11577/74 on 5/5/2006.
10087.51 .965 -.619 -350 -13 -472 -.215 -338 -.252 -.045
--------------------------------------------------------------------------
#16 11/19/2007 +5.1% DJI fell from 12958.44 to 12743.44 and then
rallied.
12958.44 .963 -.493 -490 2 -368 .016 -272 -.186 -.01
--------------------------------------------------------------------------
#17 6/4/2012 +12.2% No paper los.
12101.46 .961 -1.041 -505 34 -505 -.113 -265 -.659 -.068
-------------------------------------------------------------------------
The older B3 has been added to an expanded Buy B3
Last updated - November 8, 2011
Buy B3s only can occur in August. The DJI must
be between 3.1% (la/ma=.969)
and 6.0% (la/ma=.94) below the 21-dma. The current Accumulation Index (IP21) must
not be below -.102.
The Buy B3 can only occur in the year before a Presidential Election. It is not
allowed in other years, for good reason. Big paper losses would have occurred in
8 of 18 cases if the B3 were applied to years other than those just before a Presidential
Election year. Clearly the Buy B3 depends on the predictable efforts by an incumbent
administration to boost the economy in time for a Presidential Election Year. This
is
more of a factor than a Labor Day bounce in early September.
Since 1929, there have been 9 Buy B3s, counting only the
first such signal in a cluster.
The average gain at the time of the next Peerless Sell is 9.5%. All were
profitable.
In only one case, just before World War II, was there a paper loss as large as 3%.
Bigger gains tend to occur around the 20th of August. When the Buy B2 reverses
a Sell signal, the average gain is a more modest +6.8%.
Buy B3
Gain
Paper Loss
8/5/1931
+5.7%
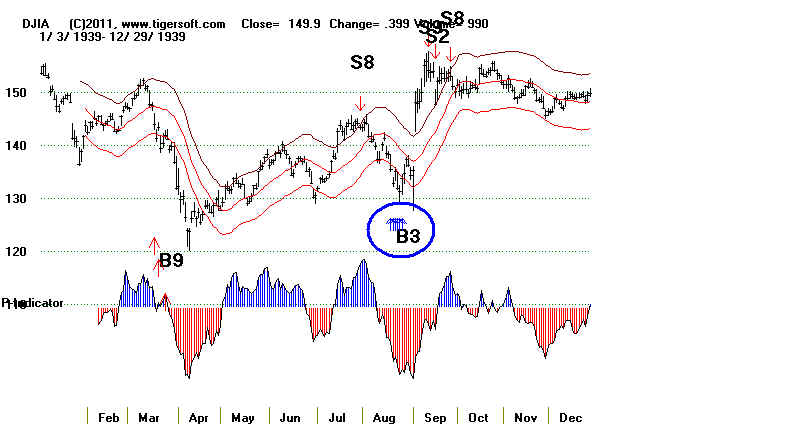
8/18/1939
+13.7%
3%
Reversing Buy Signal +13.7%
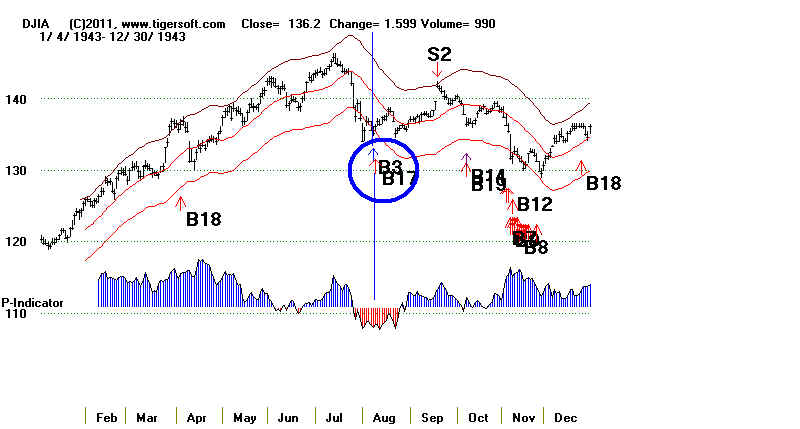
8/9/1943
+4.9%
Reversing Buy Signal
+4.9%
8/9/1971 +6.8% 1/2%
Reversing Buy Signal +6.8%
8/20/1975 +5.3%
Reversing Buy Signal
+5.3%
8/8/1983 +7.0%
Reversing Buy Signal +7.0%
8/19/1991 +14.1%
less than 1/2%
8/2/1999
+4.4%
Reversing Buy Signal +4.4%
8/14/2007 +5.5% 1%
Reversing Buy Signal +5.5%
--------------------------------------------------------------------------------------------------------------
Avg. Gain = 9.5%
Avg. Gain = 6.8%
Buy B3 Buy at Lower Band in August in a year before Election
#1 8/5/31 134.10 +5.7% no Paper Loss
la/ma maroc P-I P ch. IP21 V-I OBVPct
.953 -0.995 -35 +7 .065 -222 -.073
DJI rallied to upper band on 8/14/1931, 144.20
There were also B3s on 8/6 and 8/20
--------------------------------------------------------------------------
Best buying opportunity in 1935 was on 8/20/1935 at the 21-day
may at 126.30 la.ma=1.002 .208 32 -19 .001 -36 .271
--------------------------------------------------------------------------
#2 8/18/1939 135.50 +13.7% 3% Paper Loss
la/ma maroc P-I P ch. IP21 V-I OBVPct
.966 .034 -20 -49 .049 -3 .113
Reversing Signal DJI fell to 131.30.
There were also B3s on 8/21, 8/22 and 8/23, 8/24 and 8/25.
Low was 8/23/39 .942 -.957 -142 -24 -.118 -170 -.165
Note the testing of earlier support, but the neckline
was not violated of H/S. Then DJI rallied above upper band.
----------------------------------------------------------------------------
#3 8/9/43 135.2 +4.9% no Paper Loss
la/ma maroc P-I P ch. IP21 V-I OBVPct
.94 -.799 -83 -36 -.161 -204 -.144
Reversing Signal There had been a Sell S9 on 6/7/93
Note September Sell S2 at the upper band.
la/ma maroc P-I P ch. IP21 V-I OBVPct
9/20/43 1.033 .304 70 16 .10 39 .452
 -----------------------------------------------------------------------
8/9/55
la/ma maroc P-I P ch. IP21 V-I OBVPct
.974 -.397 -81 -43 -.093 -285 .051
RALLY TO UPPER BAND.
The decline did not go deep enough for a Buy B3
-----------------------------------------------------------------------
8/19/59
la/ma maroc P-I P ch. IP21 V-I OBVPct
.973 -.268 -84 -41 -.054 -403 .06
LIMITED RIGHT SHOULDER RALLY and H/S Pattern developed.
The decline did not go deep enough for a Buy B3.
-----------------------------------------------------------------------
8/28/67
la/ma maroc P-I P ch. IP21 V-I OBVPct
.979 -.089 -104 -9 -.035 -5 .017
RALLY TO UPPER BAND.
The decline did not go deep enough for a Buy B3.
-----------------------------------------------------------------------
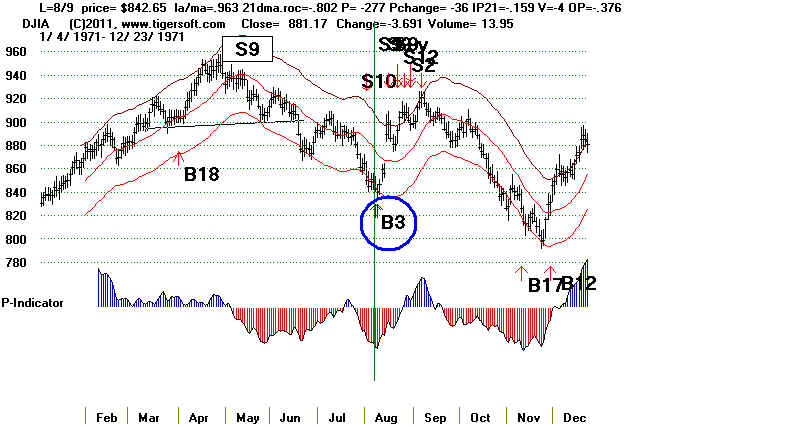
#4 8/9/71 842.65 +6.8% Paper Loss 1/2%
la/ma maroc P-I P ch. IP21 V-I OBVPct
.963 -.802 -277 -36 -.159 -4 -.376
Reversing Signal RALLY TO UPPER BAND
There was also a Buy B3 on 8/10/71
la/ma maroc P-I P ch. IP21 V-I OBVPct
.962 -.868 -288 -12 -.174 -4 .456
-----------------------------------------------------------------------
8/9/55
la/ma maroc P-I P ch. IP21 V-I OBVPct
.974 -.397 -81 -43 -.093 -285 .051
RALLY TO UPPER BAND.
The decline did not go deep enough for a Buy B3
-----------------------------------------------------------------------
8/19/59
la/ma maroc P-I P ch. IP21 V-I OBVPct
.973 -.268 -84 -41 -.054 -403 .06
LIMITED RIGHT SHOULDER RALLY and H/S Pattern developed.
The decline did not go deep enough for a Buy B3.
-----------------------------------------------------------------------
8/28/67
la/ma maroc P-I P ch. IP21 V-I OBVPct
.979 -.089 -104 -9 -.035 -5 .017
RALLY TO UPPER BAND.
The decline did not go deep enough for a Buy B3.
-----------------------------------------------------------------------
#4 8/9/71 842.65 +6.8% Paper Loss 1/2%
la/ma maroc P-I P ch. IP21 V-I OBVPct
.963 -.802 -277 -36 -.159 -4 -.376
Reversing Signal RALLY TO UPPER BAND
There was also a Buy B3 on 8/10/71
la/ma maroc P-I P ch. IP21 V-I OBVPct
.962 -.868 -288 -12 -.174 -4 .456
 ========================================================================
#5 8/20/1975 793.26 +5.3% No Paper Loss
la/ma maroc P-I P ch. IP21 V-I OBVPct
.962 -.75 -224 -47 -.172 -4 -.301
Reversing Signal RALLY TO UPPER BAND
========================================================================
#6 8/8/1983 1163.06 +7.0% No Paper Loss
la/ma maroc P-I P ch. IP21 V-I OBVPct
.965 -.435 -220 -32 -.029 -14 -.041
Reversing Signal RALLY ABOVE UPPER BAND
==========================================================================
#7 8/19/1991 2898.03 +14.1% Paper Loss less than 1/2%
la/ma maroc P-I P ch. IP21 V-I OBVPct
.968 -.469 -42 -62 -.062 -9 -.319
RALLY TO UPPER BAND
-----------------------------------------------------------------------
#8 8/2/1999 10645.96 +4.4% No Paper Loss
la/ma maroc P-I P ch. IP21 V-I OBVPct
.965 -.453 -272 -41 -.049 -108 -.223
Reversing Signal RALLY TO UPPER BAND
---------------------------------------------------------------------
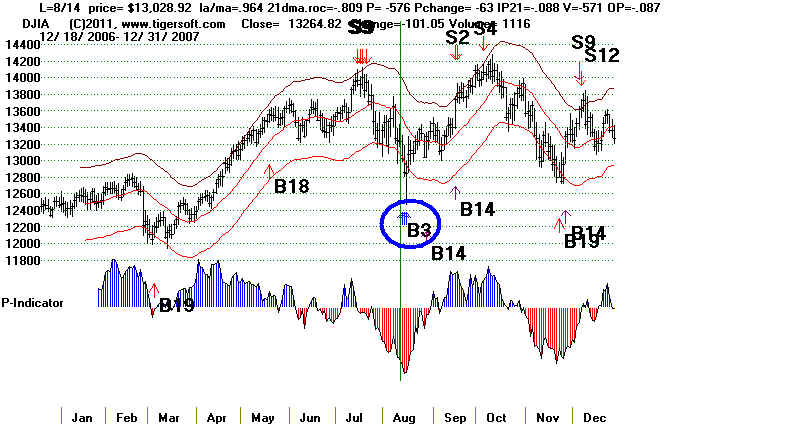
#9 8/14/2007 13028.92 +5.5% Paper Loss less - 1%
la/ma maroc P-I P ch. IP21 V-I OBVPct
.966 -.334 -429 -94 -.07 -480 .116
Reversing Signal
DECLINED TO 12845 AND THEN RALLIED ABOVE UPPER BAND.
========================================================================
#5 8/20/1975 793.26 +5.3% No Paper Loss
la/ma maroc P-I P ch. IP21 V-I OBVPct
.962 -.75 -224 -47 -.172 -4 -.301
Reversing Signal RALLY TO UPPER BAND
========================================================================
#6 8/8/1983 1163.06 +7.0% No Paper Loss
la/ma maroc P-I P ch. IP21 V-I OBVPct
.965 -.435 -220 -32 -.029 -14 -.041
Reversing Signal RALLY ABOVE UPPER BAND
==========================================================================
#7 8/19/1991 2898.03 +14.1% Paper Loss less than 1/2%
la/ma maroc P-I P ch. IP21 V-I OBVPct
.968 -.469 -42 -62 -.062 -9 -.319
RALLY TO UPPER BAND
-----------------------------------------------------------------------
#8 8/2/1999 10645.96 +4.4% No Paper Loss
la/ma maroc P-I P ch. IP21 V-I OBVPct
.965 -.453 -272 -41 -.049 -108 -.223
Reversing Signal RALLY TO UPPER BAND
---------------------------------------------------------------------
#9 8/14/2007 13028.92 +5.5% Paper Loss less - 1%
la/ma maroc P-I P ch. IP21 V-I OBVPct
.966 -.334 -429 -94 -.07 -480 .116
Reversing Signal
DECLINED TO 12845 AND THEN RALLIED ABOVE UPPER BAND.
 ----------------------------------------------------------------------
X 8/8/2011 Decline went too far below the lower band.
la/ma maroc P-I P ch. IP21 V-I OBVPct
.885 -1.787 -786 -85 -.275 -477 -.37
----------------------------------------------------------------------
X 8/8/2011 Decline went too far below the lower band.
la/ma maroc P-I P ch. IP21 V-I OBVPct
.885 -1.787 -786 -85 -.275 -477 -.37
|
1919
 |
1923
 |
Research shows the B3 does not work well in years other than those
that follow the year
before a Presidential Election year.
August Buy B3s in A Presidential Election Year.
8/21/36 +5.5% also B11/B2 no
paper loss
8/10/88 +1.5% 1% paper loss
August Buy B3s in The Year after A Presidential Election Year.
8/26/37 -17.4% (late in August)
8/31/53 +14.7% Paper loss = 3%
8/14/57 +33.7% 10% Paper loss 485.90...Rallied to Sell S12
on 7/1/59. 650.2
8/14/73 +2.8% no paper loss
8/24/81 -3.0% 8% paper loss
8/15/97 +3.0% 1% paper loss
8/30/01 +2.0% 10% paper loss.
----------------------------------------------------
3 of 7 cases showed a paper loss of 8% to 10%.
August Buy B3s in The Second Year after A Presidential Election Year.
8/8/30 +6.8% also a B9 2%
paper loss
8/12/38 +15.4% 5% paper
loss
8/27/46 -3.5% 15% paper loss
8/18/66 -0.6% 5% paper loss
8/14/74 -9.5% 22% paper loss
8/6/82 +34.8%
no paper loss
8/3/90 +17.7% 16% paper loss
8/5/02 +8.3% no paper loss
8/24/10 +27.6%
Paper loss = 1%
----------------------------------------------------
5 of 9 cases showed a paper loss of 5% to 22%.