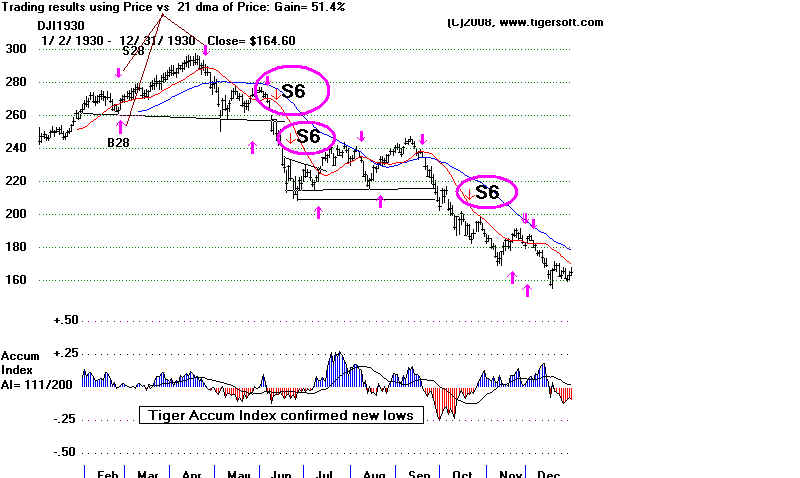
Steep 2-Day Reversal Back Down by Breadth or Price
Sell S6s signals usually are a sign of a very weak market. They most often occur because
of a dramatic (>2%) two-day price reversal. This we call "Type 2".
In the 2 1/2 years between 11/4/1929 and 5/9/1932, there were 12 Sell S6s. To get
these signals, the Tiger user must chooses "2.5% Reversals Down" under "Signals(1)" and
also post the signals using "Ectreme Bear Market Signals". In all of these Sell S6s,
one day 2%+ rallies were utterly snuffed out the next day with a 2+% decline.
They prodiuced an average 21.4% decline. These were all based on the Type 2 Sell S6s.
Extreme Bear Market Sell S6s
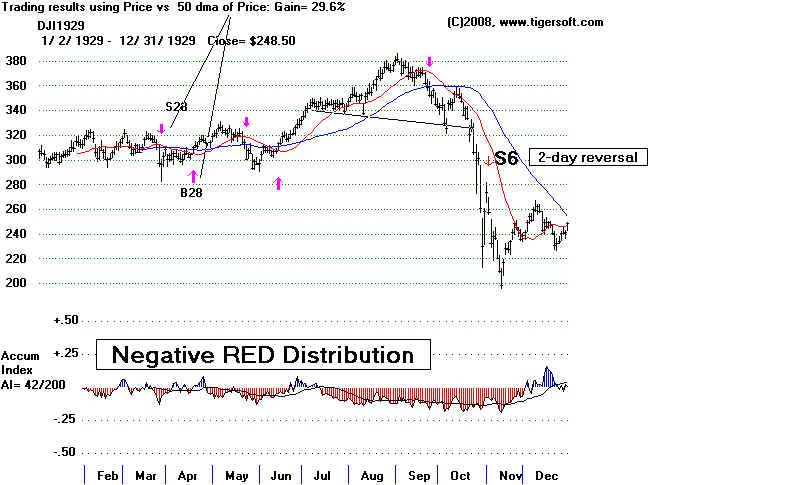
19291104 S6 257.7 .486 Type 2
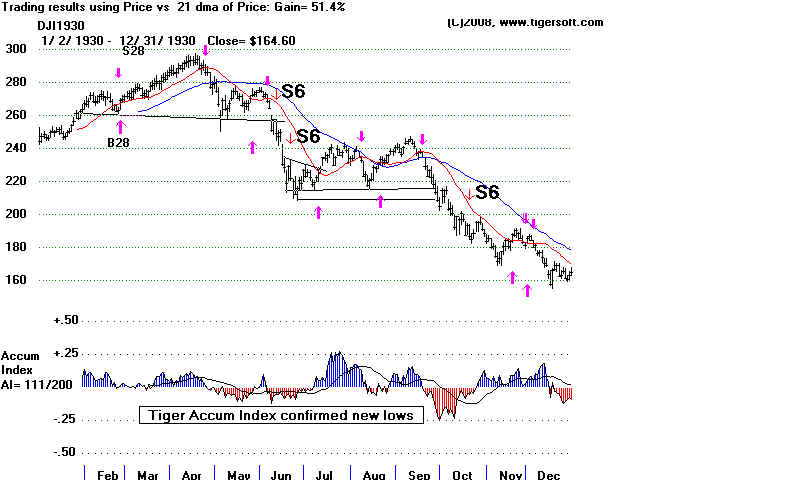
19300611 S6 249.1 .310 Type 2
19300620 S6 221.9 .226 Type 2
19301021 S6 186.4 .078 Type 2
19310501 S6 145.6 .318 Type 2
19310924 S6 107.8 .079 Type 2
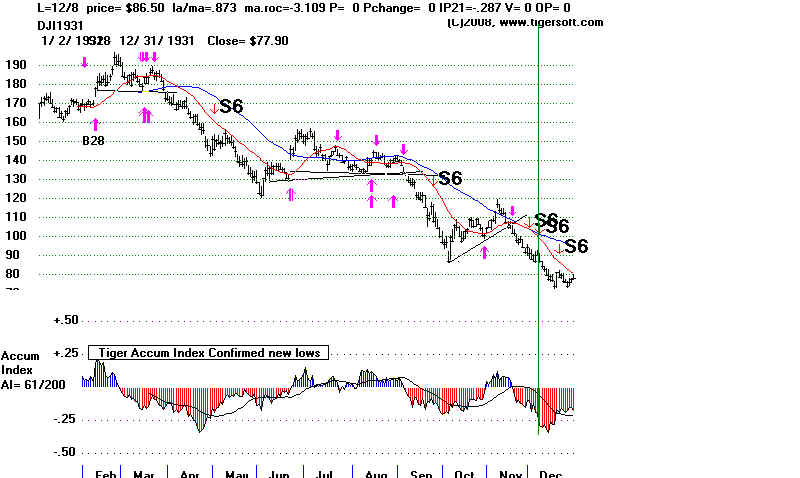
19311201 S6 91.2 .127 Type 2
19311208 S6 86.5 .08 Type 2
19311231 S6 78.1 .394 Type 2
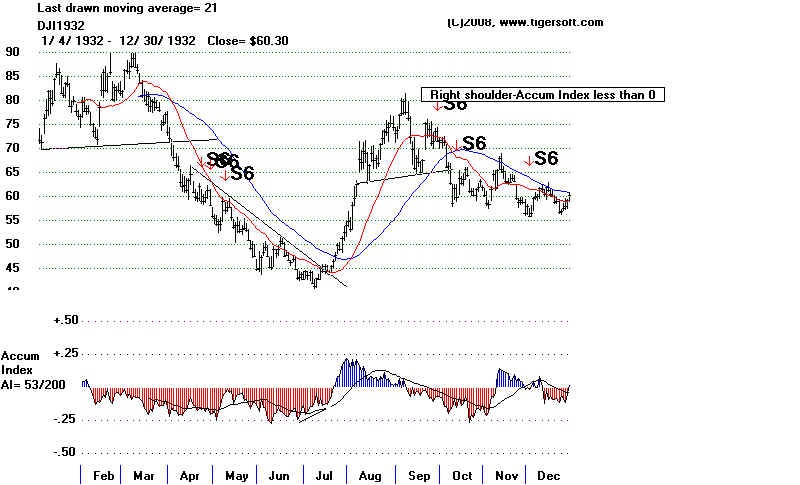
19320422 S6 58.9 .197 Type 2
19320509 S6 57.0 .170 Type 2
19320929 S6 71.5 .108 Type 2
-------------------------------------------------------------
No. = 12 .214
Fortunately, most of the time we are not dealing with an Extreme Bear Market.
Leaving out the cases above, we still see that Sell S6s nearly always denote a severely
bearish market environments, such as was seen in 1932, 1938 and 2008.. There
were 8 of these Sell S6s. They dropped the DJI 10.5% on avererage, 5 of these saw
an additional decline of more than 10%. Only one these Sell S6s would have brought
a loss to a short seller who covered on the next Peerless Buy signal. 4 of the 8 Sell S3s
were based on a dramatic reversal in breadth. They averaged a decline of 10.1%.
None of these Sell S6s took place between April and August or December. None
were seen in the Third Year of the 4-Year Presidential cycle.
Trading Results
(Selling Short on the Sell S3)
>10% 5
>5.0% - 9.99% 0
>2.0%- 4.99% 2
>0% - 1.99% 0
Loss 1
Sell S6s in
Normal Mode19320929 S6 71.5 .108 Type 2
6/2/32 Buy B16 47.3
19380316 S6 122.9 .195 Type 1 and 2
3/31/38 Buy B16 165.4
19460218 S6 201.6 .03 Type 1
2/21/46 Buy B19 195.6
19480205 S6 170.9 .032 Type 1
3/16/1948 Buy B17 165.4 .168
20080922 S6 11015.69 .177 Type 1
20081021 S6 9033.66 -.003 Type 2
10/28/08 Buy B1 9033.66 .008
20081114 S6 8497.31 .111 Type 2
20090129 S6 8149.01 .191 Type 2
3/5/09 Buy B16 6594.44
-------------------------------------------------
no. = 8 Avg. = .105
PE        5    .095
PE +1     1    .191
PE +2     2    .112
PE +3     0    ----
January 1 .191 February 2 .031 March 1 .195 April 0 - May 0 - June 0 - July 0 - August 0 - September 2 .143 October 1 -.003 November 1 111 December 0 ---- 1-10 1 .032
11-20 3 .112
21-31 4 .118
Extreme Bearish Mode - Selected 2-Day Reversal Sell S7
Type 2
----------------------------------------------
19291104 S6 257.7 .486
B16 11/12/1929 209.7
19300611 S6 249.1
19300620 S6 249.1
19301021 S6 186.4
B7 1/23/1931 171.8
19310501 S6 145.6 .318
19310924 S6 107.8 .079
B16 10/6/1931 99.3
19311201 S6 91.2 .127
19311208 S6 86.5 .08 B16 79.6
B16 12/11/1931 79.6
19311231 S6 78.1 .394
B7 2/11/1932 78.6
19320422 S6 58.9 .197
19320509 S6 57.0 .170
B16 6/2/1932 47.3
|
Type 1 - Very Sharp
Advances-Declines Reversal Down
For i = 51 To RN
If la(i) / ma(i) < .91 Then 47000
If mo(i) = 12 Then 47000
If la(i) / ma(i) < .9645 Then 47000
If adv(i - 1) / dec(i - 1) < 5 Then 47000 '5
If dec(i) / adv(i) < 4 Then 47000 '4
pi = i: ms(i) = 6: sells6arrows (pi): S9(i) = 6: : i = i + 10' change s9(i)=6
47000 Next i
Type 2 - Very Sharp Percent Change Reversal Down
For i = 23 To RN
If la(i) / ma(i) < .91 Then 16633
If mo(i) = 12 And da(i) > 17 Then 16633
If mo(i) = 1 And da(i) < 5 Then 16633
day1 = (la(i - 1) - la(i - 2)) / la(i - 2)
day2 = (la(i) - la(i - 1)) / la(i - 1)
If la(i) / ma(i) > .99 Then 16633
roc = ((ma(i) - ma(i - 1)) / ma(i - 1)) * 250
If roc > 0 Then 16633
If day1 > .0245 And day2 < -.025 Then pi = i: ms(i) = 6: sells6arrows (pi): S9(i) =
6:
16633 Next i
======================================================
2012 Peerless
very negative breadth on the next. Here are the cases.
First Type of Sell S6: Breadth Two-Day Reversal:
Date DJI LA.MA ROC P-I P-Ch IP21 V-I Opct Reversing Peerless Buy
Date DJI Signal Gain of Short Sale
2/18/46 201.60 .996 -.112 -9 -24 .123 -91 -.061 2/21/46 195.6 B19 +3.0%
2/5/48 170.90 .976 -.605 -86 -.146 -151 -.232 3/22/48 173.7 B12 -1.6%
DJI dropped immediately to 165.70 on 2/11/46
9/22/08 11015.69 .974 -.436 -177 -78 .061 -112 .176
Second Type of Sell S6: Two-Day Greater Than 2.45% Reversal:
This type of two-day reversal down is defined as occurring when:
1) The DJI falls more than 2.5% after being up more than 2.45% the day before,
2.) The DJI is more than 1% below the 21-day ma and
3.) The annualized rate of change of the 21-day ma is below 0.
4)) Do not allow this signal from 12/26 to 1/5 because of "Santa Claus rally"
and year-end jump from an ending of tax-loss selling.
Date DJI
la/ma
ann.roc
IP21 Subsequent Results
-------------------------------------------------------------------------------------------------------------------------------------
11/4/29
257.70 .818
-2.70
-.081 DJI fell to 198.70 on
11/13/29
6/11/30
249.10 .93
-0.934 -.054 DJI fell to 211.80 on
6/24/ 30
6/20/30
221.90 .869
-2.016
-.083 DJI fell to 211.80 on
6/24/ 30
10/21/30
186.40 .908
-2.445
-.057 DJI rose to 194.90 on
10/28/30, then fell to 171.60 on 11/10
5/1/31
145.60 .907
-1.855
-.506 DJI rose to 154.48 on 5/8/31. then
fell to 121.70 on 6/2/31
9/24/31
107.80 .852
-2.69
-.13 DJI fell to
86.50 on 10/5/31
12/1/31
91.20 .879
-1.086
-.104 DJI fell to 73.80
on 12/17/31
12/8/31
86.50 .873
-3.109
-.287 DJI fell to 73.80
on 12/28/31
12/21/31
78.10 .903
-3.153
-.189 DJI fell to 73.80
on 12/28/31
4/22/32
58.90 .883
-3.468
-.167 DJI fell to 44.90 on
6/1/32
4/28/32
58.20 .917
-3.514 -.208 DJI fell to
44.90 on 6/1/32
5/9/32
57.00 .963
-1.181
-.039 DJI fell to 44.90 on
6/1/32
Excluded BAD 7/18/32 44.10
.994
-1.652 -.133 right before market took off to upside.
This was a classic case of a false breakdown: a flat bottom is penetrated and then
there is a recovery above the flat bottom.
9/29/32
71.50 .988
-0.46
-.069 DJI fell to
58.50 on 10/10/32
10/13/92
59.80 .877
-1.751 -.155
DJI rallied to 65 a few days later and then fell to 58.30 on 11/3
11/9/32
61.70 1.00
-.193 -.042
DJI rose to 68 on 11/11 and then fell to 55.90 on 12/2/32
Excluded
12/2/32 55.90 .909
-.83 -.014 2 week 8% rally
and then decline to new lows.
BAD 2/27/33
50.20 .876
-2.488
-.098 right at bottom!
This was a case where the DJI held at the round number 50 and then recovered. It was
also a week before the FDR was innaugurated.
BAD 12/26/33
96.30 .977
-0.277
-.181 DJI rallied to 101 in early
Jan 34 and then re-tested lows..
This should be excluded because of
the usual Santa Claus rally.
3/16/38
122.90 .966
-0.28
-.012 This was
right before decline to 100 in two weeks.
10/22/87 1950.43
.811 -3.106
-.171 DJI fell to 1793.93 on
10/26/87
9/22/08 11015.69
.974
-.436
.061
Subseq. Buy 10/8/08
9258.10 Gain=-+16.0% B1
10/21/08
9033.66 .922
-.146
-.146
Subseq. Buy 10/28/08
9065.12 Gain- -0.3% B19
Excluded 11/5/08
9139.27 1.02
-.408
-.051
Subseq. Buy 11/21/08 8046.42 +8.0%
B16
Excluded 12/9/08
8691.33 1.027 -.355
.036
Subseq. Buy 12/12/08 8629.68 +0.7%
B9
1/29/08 8149.01
.965
-.471
.05