---------------------------------------------------------------------------------------------------------------------------------------------------
DJI Is Down Sharply but OBV-Pct or Accumulation Index
is Improving and Nearly Positive
14 Cases. Avg Gain = approx 11.0% No losses.
Buy B4s in March (+19.5%) and June (+16.4%) were
the most profitable. Buy B4s in Novembers and
Presidential were much less profitable.
              Size of Gains

                  >10%      7
                   5%-10%   3
                   2%-5%    4
Peerless Buy B5s:
1928-2013Date Signal DJI Gain
===============================================
19281218 B5 275.4 .135
19330616 B5 89.2 .146
19330720 B5 96.3 .032
19350311 B5 99.4 .333
19481115 B5 176 .024
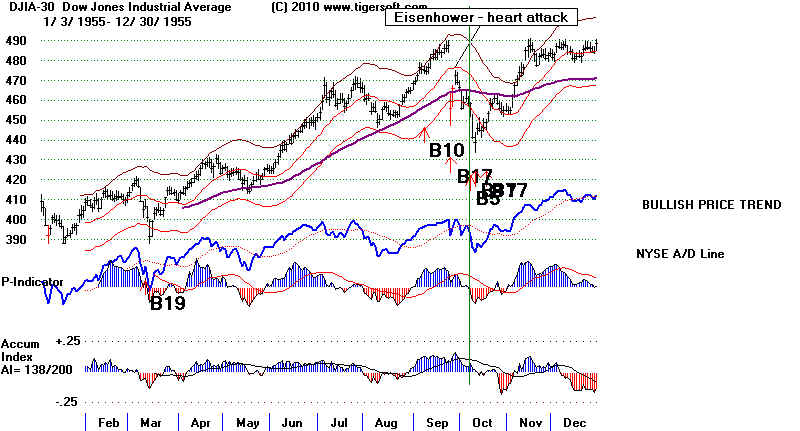
19551007 B5 458.2 .132
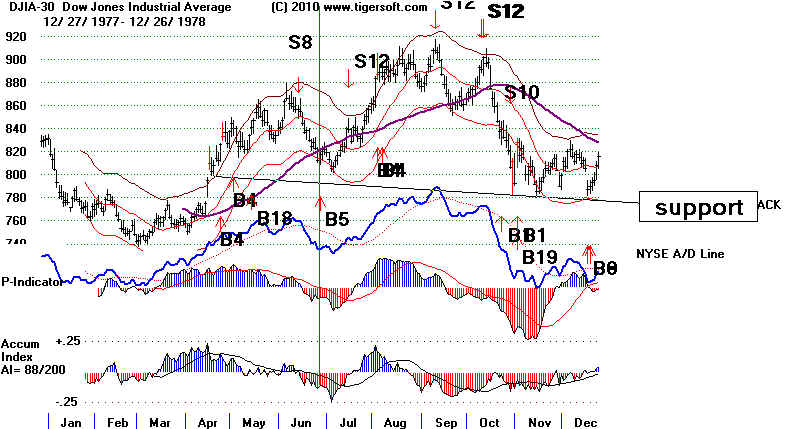
19780627 B5 817.31 .111
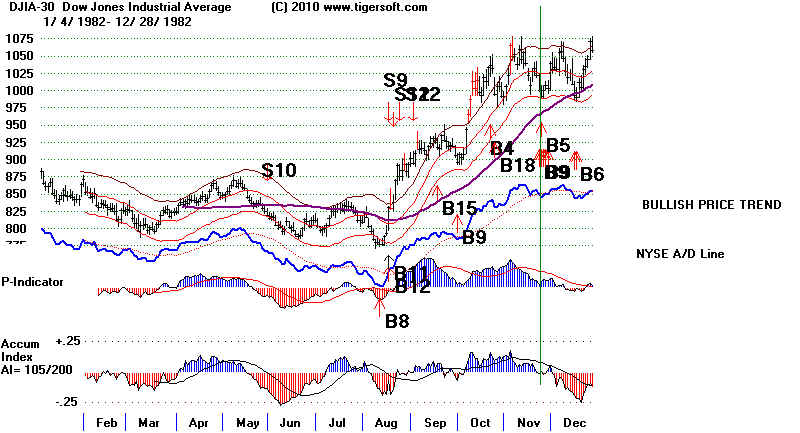
19821123 B5 990.99 .067
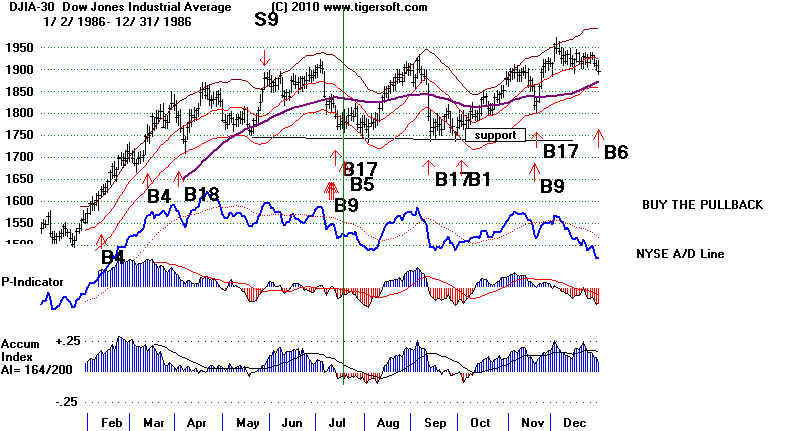
19860717 B5 1781.78 .03
19870414 B5 2253.98 .039
19880328 B5 1979.77 .056
19900122 B5 2600.45 .142
20090623 B5 8322.91 .234
20111122 B5 11493.73 .053
-----------------------------------------------
No. = 14 .110
Size of Gains
     >10%     7
     5-10%    3
     2%-5%    4
     Returns by Year
                          No.   Avg.
Pres. Election Years      3    .072
Year after Pres.El.Yr.    4    .140
Mid-Term Election Yr.     4    .088
Third Yr after Pres.E.Yr. 3    .137

      Returns by Month
                          No.   Avg.
January                   1     .142
February                  -     -
March                     2     .195
April                     1     .039
May                       -     ----
June                      3     .164
July                      2     .031
August                    -     ----
September                 -     ----
October                   1     .132
November                  3     .048
December                  1     .135
             Days of Month

         1-10      1   .132
         11-20     6   .118
         21-31     7   .099

        Code:

    For i = 80 To rn
         If mo(i) = 8 Or mo(i) = 9 Then 588 ' Be wary of September declines.
       If (yr(i) + 2) / 4 = Int((yr(i) + 2) / 4) And mo(i) = 2 Then 588  ' eliminates bad B5 in Feb 1934.
       If (yr(i) + 2) / 4 = Int((yr(i) + 2) / 4) And mo(i) = 3 And da(i) < 20 Then 588
       If mo(i) = 6 And da(i) > 20 Then 11115  ' Mkt often rallies towards end of June.

          If mo(i) = 4 Then 11115  ' Aprils are less likely to bring declines.
              For j = i - 25 To i
                If S9(j) = 9 Then 588
                If S9(j) = 12 Then 588
              Next j
       11115  highall = -999999
                For j = i - 79 To i
                     If HI(j) > highall Then highall = HI(j)
                 Next j
             highest = -999999
                For j = i - 17 To i
                   If HI(j) > highest Then highest = HI(j)
                 Next j
             dif = (highest - lo(i)) / highest

             If highest <> highall Then 588
             If roc(i) > -.6 And la(i) / ma(i) > .95 And la(i) / ma(i) < .97 And opma(i) > .005
             And dif > .073 And dif < .12 Then 8211 ' This is a Buy B4

                  If dif < .108 Then 588
                     gap = (la(i - 1) - HI(i)) / lo(i - 1)
                  If gap > .0178 Then 588
                  If roc(i) < -.75 Then 588
                  If opma(i) > .01 Then 8211
                  If newipxxx(i) < 0 Then 588

                   For j = i - 20 To i
                    If S9(j) = 4 Then 588
                   Next j

            8211       pi = i:  : S9(i) = 105: mb(i) = 5: b5arrows (pi): i = i + 10  A Buy B4,
            588 Next i
|
==============================================================================
Buy B5 - Down Sharply but OBV-Pct or Accumulation Index is at least
Nearly Positive. Last
edited 2/13/2012
Buy B5s require:
A sell-off of 6% to 11% in the last month.
Annualized Rate of Change of 21-dma > -.60
DJI must be 3% to 5% below its 21-day ma. la/ma >.95 <.97
OBVPct > -.03 or IP21 > -.03
11 earlier cases. Avg Gain = approx 10.2%
Paper Losses in 8 of 11 cases.
Paper Losses of more than 4% in 3 of 11 cases
Avg.Paper Loss = 2.2%.
The average gain after a Buy B5 is 10.5%. There were only 13 cases since
1928, but each was
profitable. The biggest gains occurred with the Buy B5s from November
to February, averaging
+14.1% in four cases. The other B5s were all much smaller. From
February to July, the B5s
only averaged 2.8%. Paper losses were under 3% in 8 of the 11 cases.
There were single paper losses
of 3%, 4% and 8%.
B5s usually take place with other Peerless Buys also occurring, especially B9s or
B17s, either at the
same time or in close proximty on a Peerless chart.
Reversing Buy B5s
Date
Gain Rev.Signal
Date
Rev.Signal Gain
--------------------------------------------------------------------------------------------------------------------------------------------
BUY B5
3/11/1935 33.9% Sell S8
9/17/1935 3.8%
Buy B5 11/22/63 32.0% Sell
S8 5/13/1965 5.1%
Buy B5 6/27/78 2.7% Sell
S12 7/17/1978 -5.7%
Buy B5 6/23/2009 19.5% Sell
S12 10/21/2009 -2.8%
---------------------------------------------------------------------------------------------------------------------
Avg Gain = +22.0%
| BUY B5s:
1929-2011 1 12/7/1928 271.10 +17.1% S12 1/31/29 317.5 la/ma ma-roc P-I P-ch IP21 V-I OPct .966 .442 -52 (-40) -.03 -652 0.223 Paper Loss = 3% Down 10% from 17-day high. Rallied above the upper band. -------------------------------------------------------------------- 2 11/15/1948 176.00 +18.3% 215.30 4/14/1950 la/ma ma-roc P-I P-ch IP21 V-I OPct .958 .504 187 (4) .085 285 .006 Paper Loss = 8% Down 8% from 17-day high. -------------------------------------------------------------------- 3 10/7/1955 458.20 +7.2% 3/6/1956 S12 la/ma ma-roc P-I P-ch IP21 V-I OPct .969 -.425 -30 .074 -343 .076 Paper Loss = 4% Down 6% from 17-day high. -------------------------------------------------------------------- 4 11/22/1963 711.50 + 32.0% Sell S8 5/13/1965 5.1% la/ma ma-roc P-I P-ch IP21 V-I OPct .953 -.557 -151 (-40) -.141 -1021 .007 No Paper Loss Down 6% from 17-day high. Jumped up strongly after JFK assassination. -------------------------------------------------------------------- 5 6/27/1978 817.31 + 2.7% 9/11/78 S12 (too early) la/ma ma-roc P-I P-ch IP21 V-I OPct .97 -.203 -114 ( 3) -.11 -1 .069 Paper Loss = 1% Down 6% from 17-day high. Hit bottom a week later and rallied above UB. -------------------------------------------------------------------- 6 11/23/1982 990.99 + 6.7% 12/7/1982 S9 la/ma ma-roc P-I P-ch IP21 V-I OPct .967 -.048 81 (42) .009 -1 .065 No Paper Loss Down 7% from 17-day high. Rallied immediately to upper band. -------------------------------------------------------------------- 7 7/17/1986 1781.78 + 3.0% 8/12/1986 S9 la/ma ma-roc P-I P-ch IP21 V-I OPct .963 -.539 -83 -.034 -11 .144 Paper Loss = 1% Down 7% from 17-day high. Went down 1% mor eover next week and rallied above the upper band. -------------------------------------------------------------------- 8 4/14/1987 2253.98 + 3.9% 5/6/1 987 S12 la/ma ma-roc P-I P-ch IP21 V-I OPct .966 .028 -203 .108 -17 .207 No Significant Paper Loss Down 6.5% from 17-day high. Rallied to the upper band from a test of the same lows two weeks later. -------------------------------------------------------------------- 9 3/28/1988 1979.77 + 1.3% 4/14/1988 S1 la/ma ma-roc P-I P-ch IP21 V-I OPct .964 -.252 -35 .08 -6 .005 No Paper Loss Down 6% from 17-day high. After a week of basing, DJI rose to upper band. -------------------------------------------------------------------- 10 1/22/1990 2600.45 + 14.2% 2969.8 7/30/1990 S9 la/ma ma-roc P-I P-ch IP21 V-I OPct .954 -.382 -69 -52 .019 -17 .018 Paper Loss = 2% Down 7% from 17-day high. Rallied above the upper band from a lower closing one weeks later. -------------------------------------------------------------------- 11. 6/23/2009 8322.91 + 19.5% 9949.36 10/21/2009 S12 la/ma ma-roc P-I P-ch IP21 V-I OPct .968 .063 36 (-14) .011 -115 .03 Paper Loss = 2.5% Down 6% from 17-day high. Rallied above the upper band from a lower closing two weeks later. ==================================================================== 12. 5/6/2010 10520.32 -1.1% 10409.46 6/16/2010 S12 la/ma ma-roc P-I P-ch IP21 V-I OPct Paper Loss = 5% .965 -.419 -137 (-131) .005 -153 .033 Down 7% from 17-day high. |
Avg.Gain= 10.2% Avg.Paper Loss = 2.2%
Buy B5's should suppress other Sells for ten trading days, about two weeks.
Buy B5s occur when the DJI
closes 2% to 4.6% below the 21-day ma with either the
Accumulation Index or OBVPct above -.03 With Buy B5s, we skip August and
September,
which is right before the weakest period in market's yearly cycle. We also
disallow the
Buy B5 under certain other conditions.
Skip if there has been a Sell S9 or S12 within the last 35 days.
Skip if nether the current Accumulation Index or OBVPCT is less than 0.
Skip if the DJI gaps down more than 1.78% from previous day.
Skip if the DJI's ROC is under -.60 in case of OBVPCT positive NCs.
Skip if the DJI's ROC is under -.75 in case of AI positive NCs.
Skip if the DJI is down less than 10.8% from high of last 79 trading days to today's low.
Buy B5s: 1928-1941
Second row shows CL/MA, ROC, P21, IP21, V21, OP21
Date DJI Gain Reversing Signal
------------- ----------- -------- ----------------
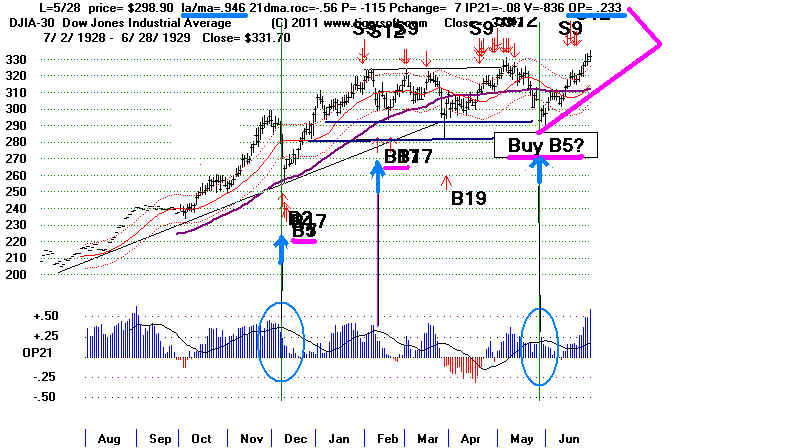
1 12/7/1928 271.10 +17.1% S12 1/31/29 317.5
.966 .442 -52 -40 -.03 -652 0.223
Also a B2 and B17. DJI fell one more day to 263.90 and rallied.
Paper Loss = 3%
Simultaneous B2/B9
--------------------------------------------------------------------
2 2/15/1929 300.4 +3.8% S9 4/19/29 311.9
.967 -.088 -91 -28 -.085 -797 -.03
Also a B17. DJI rallied but then fell to 296.5 before tallying again.
Paper Loss = 1%
Simultaneous B17
A Buy B5 might have occurred on the 5/28/1929, but it was not
allowed because the P-Indicator as -115. When the P-I is adjusted
for the relatively small number of stocks trading in 1929, it is
5x greater. The steeply falling A/D Line in 1929 would have made
a Buy B5 on 5/28/1929 very suspect and would have been only
applied to a limited number of DJIA-30 stocks.
 ---------------------------------------------------------------------
Standard Buy B5s were not allowed until 1933 bottom
because extreme bearish mode should have been applied
in October 1929. The only B5 in this period would have
lost 10.5% is taken on 4/29/1930 and not sold until S6
on 6/11/1930.
---------------------------------------------------------------------
---------------------------------------------------------------------
Standard Buy B5s were not allowed until 1933 bottom
because extreme bearish mode should have been applied
in October 1929. The only B5 in this period would have
lost 10.5% is taken on 4/29/1930 and not sold until S6
on 6/11/1930.
---------------------------------------------------------------------
Buy B5s: 1942-2008
Second row shows CL/MA, ROC, P21, IP21, V21, OP21
Date DJI Gain Reversing Signal
------------- ----------- -------- ----------------
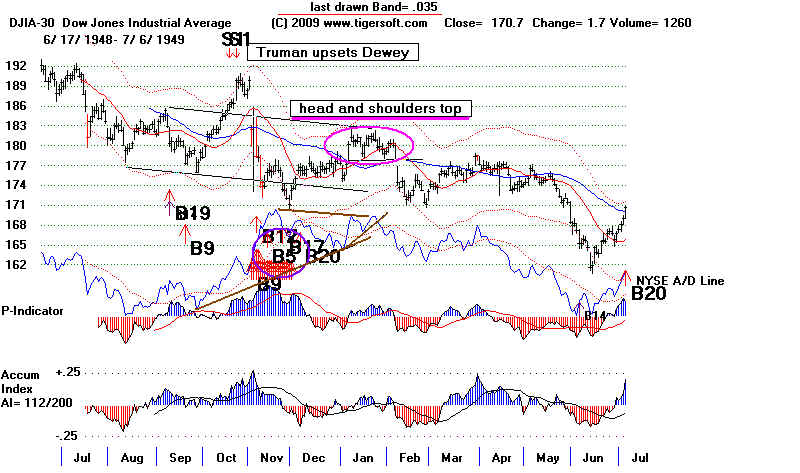
3 11/15/1948 176.00 18.3% 215.30 4/14/1950
.958 .504 187 .085 285 .006
This marked a two month bottom and the DJI rose to 182, but then
fell to 162 in June 1949. In third case selling at the apex of
a potential right shoulder in a broad head and shoulders pattern
would have helped. There was a head and shoulders top to have properly
sold on. The A/D Line did not make a new high when this appeared.
Paper Loss = 8%
Simultaneous Buy B9
When a head and shoulders pattern appears as it did in January
and February, it is best to sell when the A/D Line's uptrend is
broken when a head and shoulders pattern is present. In this case,
it would have meant selling at 177.90 on 2/4/1949. As you can see
from the chart below, this would have greatly improved trading this
year.
 -----------------------------------------------------------------------
The case below did not ooccur in 2010 and later versions of Peerless.
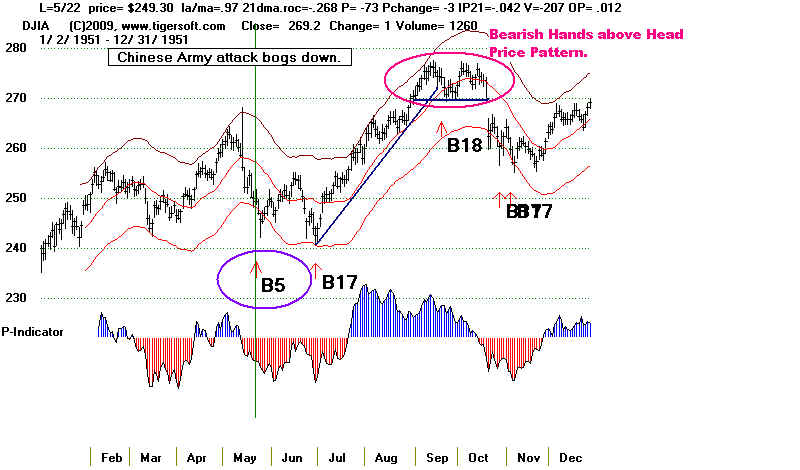
5/22/1951 249.3 5.5% 262.90 8/3/1951 S4
.97 -268 -73 -.042 -207 .007
DJI needed to form a double bottom at 242 before rallying to 276 in
September.
-----------------------------------------------------------------------
The case below did not ooccur in 2010 and later versions of Peerless.
5/22/1951 249.3 5.5% 262.90 8/3/1951 S4
.97 -268 -73 -.042 -207 .007
DJI needed to form a double bottom at 242 before rallying to 276 in
September.
 ------------------------------------------------------------------------
4 10/7/1955 458.20 7.2% 3/6/1956 S12
.969 -.425 -30 .074 -343 .076
DJI fell to 439 a week later before rallying.
Paper Loss = 4%
Buy B17 occurred a few days later.
------------------------------------------------------------------------
4 10/7/1955 458.20 7.2% 3/6/1956 S12
.969 -.425 -30 .074 -343 .076
DJI fell to 439 a week later before rallying.
Paper Loss = 4%
Buy B17 occurred a few days later.
 -----------------------------------------------------------------------
5 11/22/63 711/50 32.0% Sell S8 5/13/1965 5.1%
.953 -.557 -151 (-40) -.141 -.1021 .007
JFK assassination. DJI rose sharply
6 6/27/1978 817.31 2.7% 9/11/78 S12 (too early)
.97 -.203 -114 -.11 -1 .069
DJI fell to 807 and then rallied to 905 in September.
Paper Loss = 1%
No other signal at this bottom.
If one were automatically to disallow Sell signals for 10 trading
days after the Buy B5, the gain here would have been +11.1%
-----------------------------------------------------------------------
5 11/22/63 711/50 32.0% Sell S8 5/13/1965 5.1%
.953 -.557 -151 (-40) -.141 -.1021 .007
JFK assassination. DJI rose sharply
6 6/27/1978 817.31 2.7% 9/11/78 S12 (too early)
.97 -.203 -114 -.11 -1 .069
DJI fell to 807 and then rallied to 905 in September.
Paper Loss = 1%
No other signal at this bottom.
If one were automatically to disallow Sell signals for 10 trading
days after the Buy B5, the gain here would have been +11.1%
 -----------------------------------------------------------------------
7 11/23/1982 990.99 6.7% 12/7/1982 S9
.967 -.048 81 .009 -1 .065
This was bottom before a rally to upper band.
No Paper Loss
Buy B9 occurred simultaneously.
-----------------------------------------------------------------------
7 11/23/1982 990.99 6.7% 12/7/1982 S9
.967 -.048 81 .009 -1 .065
This was bottom before a rally to upper band.
No Paper Loss
Buy B9 occurred simultaneously.
 --------------------------------------------------------------------
8 7/17/1986 1781.78 3.0% 8/12/1986 S9
.963 -.539 -83 -.034 -11 .144
This was bottom before a rally above upper band.
Buy B9 and B17 occurred a few days earlier
No Paper Loss
--------------------------------------------------------------------
8 7/17/1986 1781.78 3.0% 8/12/1986 S9
.963 -.539 -83 -.034 -11 .144
This was bottom before a rally above upper band.
Buy B9 and B17 occurred a few days earlier
No Paper Loss
 --------------------------------------------------------------------
9 4/14/1987 2253.98 3.9% 5/6/1987 S12
.966 .028 -203 .108 -17 .207
DJI fell to 2230.54 and then rallied to the upper band.
Buy B19 occurred the next day.
Paper Loss = 1%
--------------------------------------------------------------------
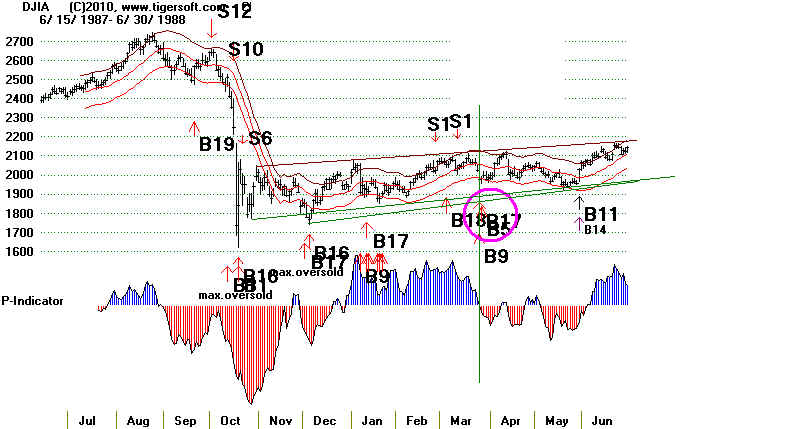
10 3/28/1988 1979.77 1.3% 4/14/1988 S1
.964 -.252 -35 .08 -6 .005
This was bottom before a rally to upper band.
Simultaneous B17.
No Paper Loss
--------------------------------------------------------------------
9 4/14/1987 2253.98 3.9% 5/6/1987 S12
.966 .028 -203 .108 -17 .207
DJI fell to 2230.54 and then rallied to the upper band.
Buy B19 occurred the next day.
Paper Loss = 1%
--------------------------------------------------------------------
10 3/28/1988 1979.77 1.3% 4/14/1988 S1
.964 -.252 -35 .08 -6 .005
This was bottom before a rally to upper band.
Simultaneous B17.
No Paper Loss
 --------------------------------------------------------------------
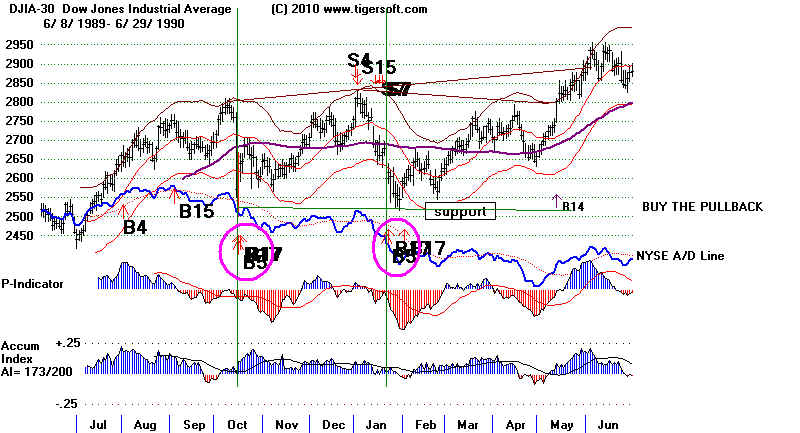
11 10/16/1989 2657.38 5.7% 1/2/1990 S15
.98 -.075 -75 .109 -1 .187
DJI fell to 2582 on 11/6/89 and then rallied.
Simultaneous B17.
Paper Loss = 3%
See chart below.
--------------------------------------------------------------------
12 1/22/1990 2600.45 14.2% 2969.8 7/30/1990 S9
.954 -.382 -69 .019 -17 .018
DJI falls to 2543 and then rallied to 3000 in July 1990.
Buy B17 occurred the next day.
Paper Loss = 2%
13. 8322.91 6/23/2009 19.5% Sell S12 10/21/2009 -2.8%
.968 .063 36 (-14) .011 -115 .03
DJI fell to 8178 (paper loss of 2.5%) and then rallied to 3000 in July 1990.
Buy B17 occurred the next day.
====================================================================
Total Number of trades = 13
Avg. Gain = 10% approx.
--------------------------------------------------------------------
11 10/16/1989 2657.38 5.7% 1/2/1990 S15
.98 -.075 -75 .109 -1 .187
DJI fell to 2582 on 11/6/89 and then rallied.
Simultaneous B17.
Paper Loss = 3%
See chart below.
--------------------------------------------------------------------
12 1/22/1990 2600.45 14.2% 2969.8 7/30/1990 S9
.954 -.382 -69 .019 -17 .018
DJI falls to 2543 and then rallied to 3000 in July 1990.
Buy B17 occurred the next day.
Paper Loss = 2%
13. 8322.91 6/23/2009 19.5% Sell S12 10/21/2009 -2.8%
.968 .063 36 (-14) .011 -115 .03
DJI fell to 8178 (paper loss of 2.5%) and then rallied to 3000 in July 1990.
Buy B17 occurred the next day.
====================================================================
Total Number of trades = 13
Avg. Gain = 10% approx.