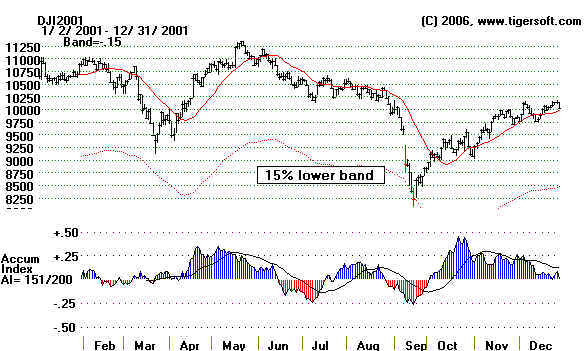
Big declines to the same very oversold status called the bottoms in 1987, 2001 and 2002.
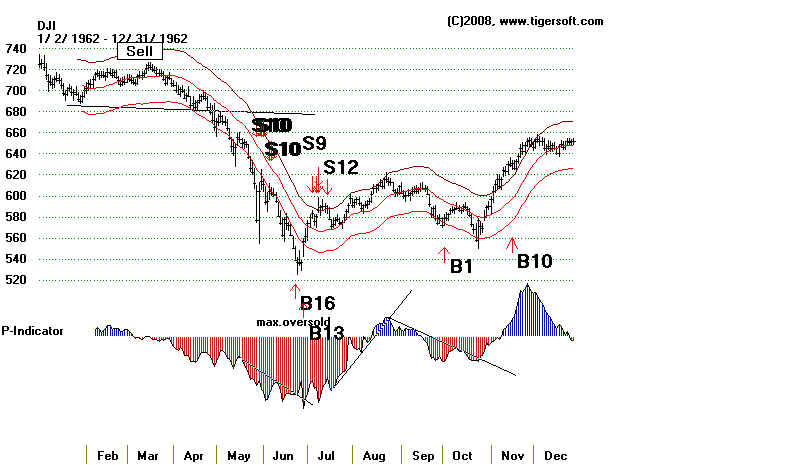
When these rules were back-tested, they also called the bottoms in 1946 and 1962.
The Buy B16s since 1928 averaged a gain of 19.9%. There were no losers in the 26 cases.
Size of Gains
>10% 16
5%-9.99% 8
2%-4.99% 1
0%-1.99% 0
Losses 0
Buy B16 Signals:
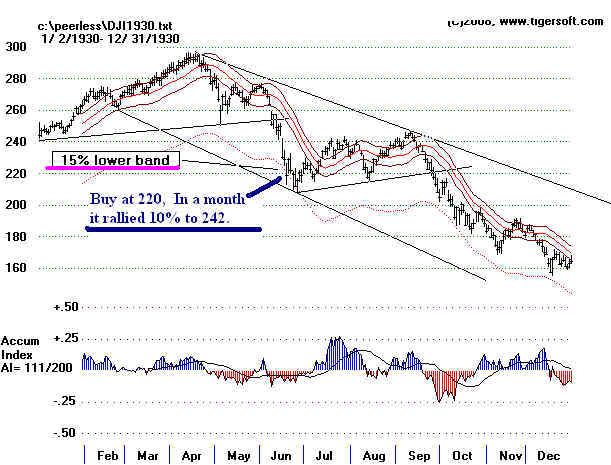
1928-2013 19291112 B16 209.7 .214 Fell to 198.7
.73 -5.796 -249 -47 -1071 -.175 -2478 -.414 -.405
--------------------------------------------------------------------
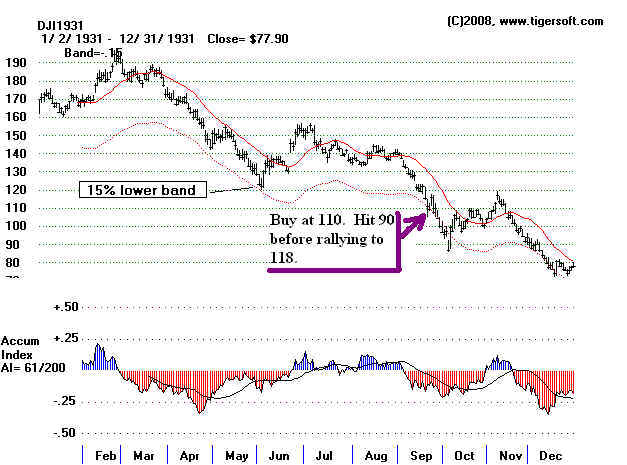
19311006 B16 99.3 .147 no paper loss
.89 -3.501 -213 26 -1201 -.124 -973 -.393 -.351
--------------------------------------------------------------------
19311211 B16 79.6 .06 fell to 76.5
.842 -4.016 -210 -7 -1188 -.323 -784 -.572 -.384
--------------------------------------------------------------------
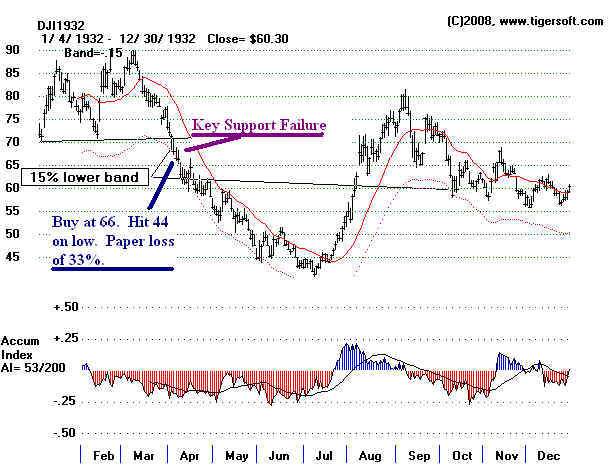
19320602 B16 47.3 .004 no paper loss
.900 -1.553 -104 13 -736 -.084 -305 .182 -.423
--------------------------------------------------------------------
19320708 B16 41.2 .85 no paper loss
.902 -1.038 -19 7 -131 -.117 -63 .025 -.381
The Buy B16 over-rides the Sell S13 the same day.
Sell S13 cannot be allowed when 65-day up pct change is -.381!
--------------------------------------------------------------------
19321205 B16 56.5 .113 no paper loss
.920 -.387 -52 17 -365 .009 -98 -.118 -.24
--------------------------------------------------------------------
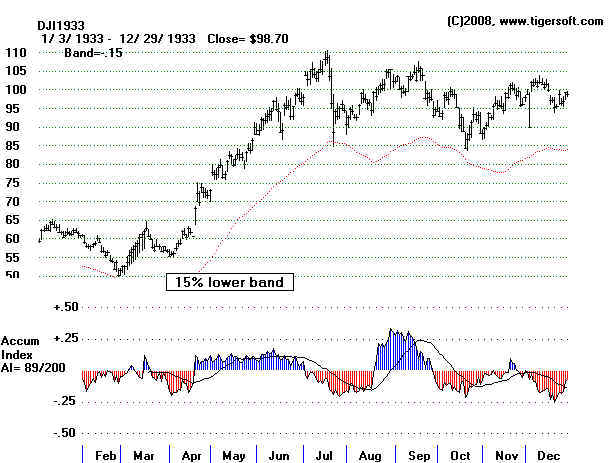
19330228 B16 51.4 .988 no paper loss
.904 -2.139 -82 4 -594 -.045 -263 -.065 -.187
-------------------------------------------------------------------
19330731 B16 90.8 .095 no paper loss
.905 -.722 -28 -20 -202 -.159 -645 .029 .266
-------------------------------------------------------------------
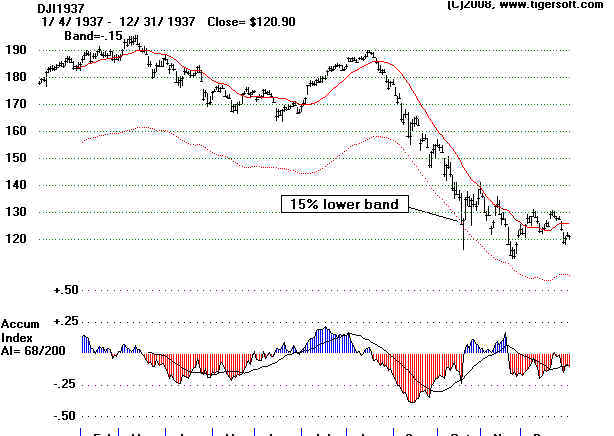
19371119 B16 118.1 .086 fell to 114.2
.904 -.80 11 -12 49 -.023 128 .119 -.377
-------------------------------------------------------------------
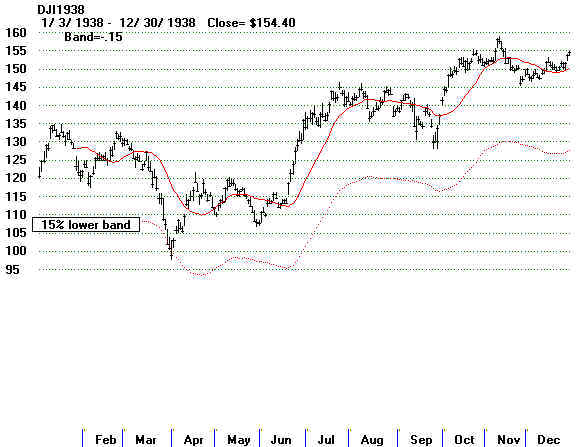
19380331 B16 98.9 .162 no paper loss
.838 -3.04 -267 -5 -1408 -.373 -438 -.677 -.178
--------------------------------------------------------------------
19380404 B16 105.6 .088 no paper loss
.912 -2.263 -210 22 -1105 -.321 -.383 -.53 -.127
--------------------------------------------------------------------
19390410 B16 124 .106 no paper loss
.888 -2.307 -163 2 -750 -.202 -361 -.393 -20
--------------------------------------------------------------------
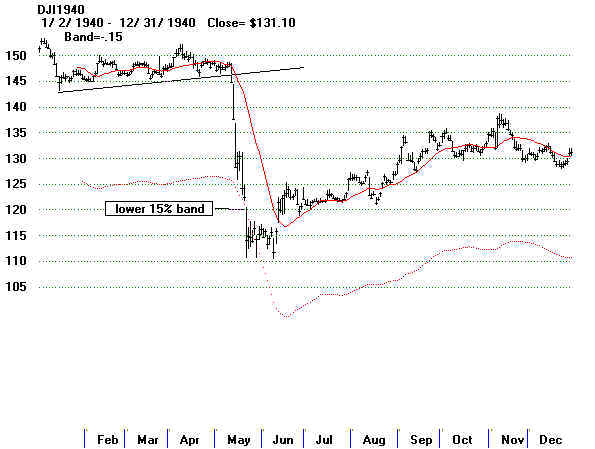
19400527 B16 116.4 .161 fell to 111.8
.866 -2.743 -164 38 -819 -.317 -632 -.06 -.211
--------------------------------------------------------------------
19620622 B16 539.2 .083 fell to 537.7
.919 -1.758 -398 1 -1104 -.233 -2167 -.293 -.248
--------------------------------------------------------------------
X Note that 19400515 S13 and B16 cancel each other out.
-------------------------------------------------------------------
19660831 B16 788.51 .022 no paper loss
.966 -.643 -257 41 -667 -.189 -13 -.312 -.109
-------------------------------------------------------------------
19700525 B16 641.36 .108 fell to 631.16
.911 -1.778 -449 -36 -951 -.172 -5 -.478 -.154
-------------------------------------------------------------------
19710809 B16 842.65 .055 fell to 839.59
.963 -.802 -277 -36 -586 -.159 -4 -.404 -.102
-------------------------------------------------------------------
19711123 B16 797.97 .202 no paper loss
.966 -.726 -273 -19 -579 -.144 -4 -.205 -.106
-------------------------------------------------------------------
19731205 B16 788.31 .076 no paper loss
.917 -1.802 -473 -2 -913 -.224 -6 -.377 -.120
-------------------------------------------------------------------
19740930 B16 607.87 .077 fell to 584.56
.931 -.89 -173 -3 -173 -.103 -3 -.269 -.244
-------------------------------------------------------------------
19741210 B16 593.87 .456 fell to 586.83
.961 -1.404 -296 18 -296 -.214 -4 -.328 -.105
-------------------------------------------------------------------
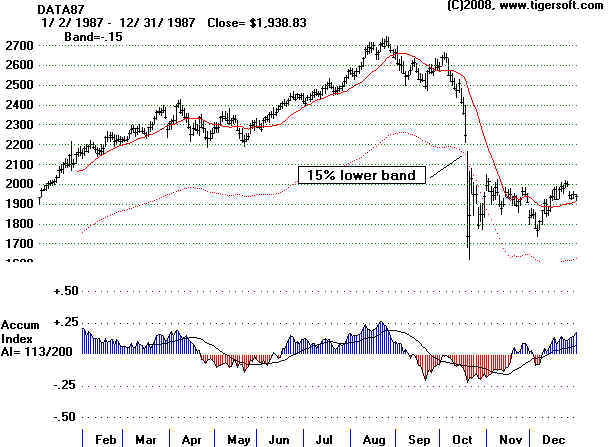
19871019 B16 1738.74 .117 no paper loss
.698 -3.699 -391 -84 -769 -.223 -69 -.267 -.308
-------------------------------------------------------------------
20010921 B16 8235.81 .228 no paper loss
.846 -2.609 -655 -98 -638 -.180 -504 0.534 -.230
-------------------------------------------------------------------
20021009 B16 7286.27 .204 no paper loss
.923 -1.969 -574 -131 -574 -.181 -516 -.399 -.199
-------------------------------------------------------------------
20081120 B16 7552.29 .185 no paper loss
.905 -2.314 -842 121 -759 -.071 -464 -.294 -.155
-------------------------------------------------------------------
20090305 B16 6594.44 .277 no paper loss
.867 -1.314 -638 -28 -575 -.126 -393 -.208 -.339
--------------------------------------------------------------------
No. = 26 .199
Presidential Election 5 .263
PE + 1 7 .281
PE + 2 8 .150
PE + 3 6 .115
January 0 ---
February 1 .988
March 2 .220
April 2 .097
May 2 .135
June 2 .044
July 2 .047
August 2 .039
September 2 .153
October 3 .156
November 4 .172
December 4 .176
1-10 9 .201
11-20 6 .173
21-31 11 .210
|
===================================================================================
DJI - 1987 ....
Two Buy B16s called the bottom after the Crash of 1987
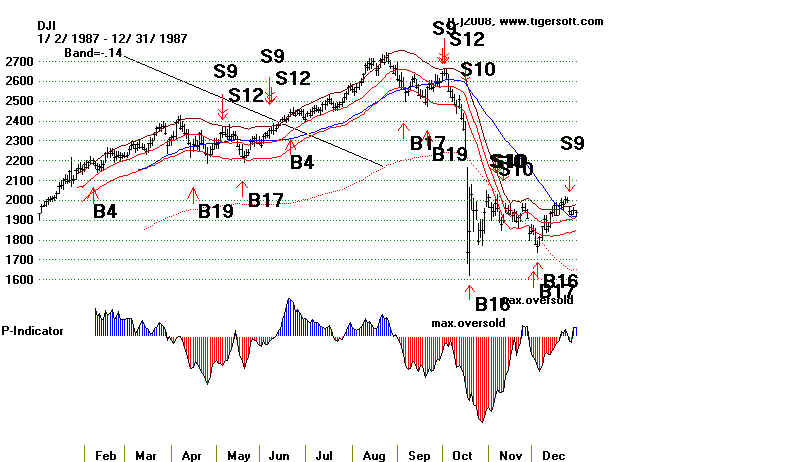
The Peerless Buy B16 is based on the DJI closing more than
14% below the
50-day ma. (The old
Peerless said simply that the DJI must close at least 14.8%
below the 21-day ma.) The
DJI must not be falling more than 4% in the current day.
Peerless Buy B16s always had the power to reverse a bear
market between 1942 and 2007.
They did so in 7 cases. The two cases in 2008 are still undecided.
However, in the
Depression era bear markets, their record is less satisfactory. In the
1929-1942 period,
the DJI fell far more than 14% below the 50-day ma on 9 occasions. In 5 cases,
buying
then would have been profitable. But in 4 cases, it would have led to losses of
between
10% and 25%: 1929, 1931, 1932 and 1937.
The Peerless Buy B16 is based on the DJI closing more than
14% below the
50-day ma. (The old
Peerless said simply that the DJI must close at least 14.8%
below the 21-day ma.) The DJI must not be falling more than 4% in the current day.
There can be no Buy B16 signals in August or in Septembers until after the 14th of the
month.
This allows for the bearishness of September.
Look also at the associated key values:
1) Note that this signal has since 1938 reversed decines that were very steep,
where the Annualize Rate of Change of the 21-day ma was under -1.75
(or under 175%) for a year.
2) In all but one case, the DJI was down between 9% and 14% from its 21-day ma.
These are mostly (6 of 9) October and November Buys.
3) Note also that Accumulation Index is not as negative as might be expected given
how far below the 21-day ma the DJI is. In only 2 cases was the current Accumulation
Index (IP21) below -.18.
1962 Buy B16
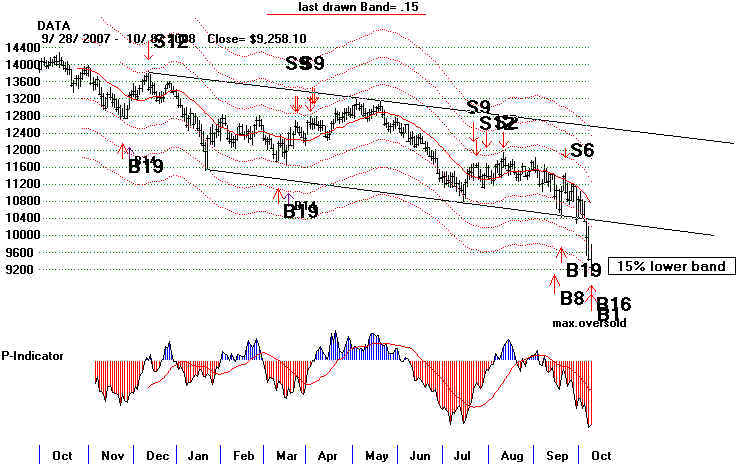
2008 Buy B16
Buy B16 Track Record: 1942-2008
Date
DJI AnnRoc. LA/MA IP21
Gain When Reversed by Next Peerless Sell
-------------------------------------------------------------------------------------------------------------------------
9/19/1946 165.2
.911 -2.348 -137 -.141 -310 -.471
+ .053
Final bottom was at 163 on 11/22
Do not use a continuation Sell S10 just a few days after Buy B19.
(This will be eliminated in a future version of the software.)
6/22/1962 539.2
.919 -1.758 -398 -.233 -2167
-.283 + .083
Final bottom was at 535.7 on 6/26
5/25/1970
641.36 .911 -1.778 -449 -.172 -5
-.457 + .113
This was final bottom of 1969-1970 bear market.
12/5/1973 788.31 .917
-1.802 -473 -.224 -6
.36 + .085
This was bottom for 1973 bear market. It resumed after March 1974 high of 891.66,
10/3/1974 587.61 -1.113
.914 -151 -.138 -3 -.34
+ .093
This produced a six week rally to 675 and then a re-test of lows.
10/20/1987 1841.01 .748
-3.114 .748 -408 -.180
-63 -.076 + .055
More retests of 1800 were needed.
12/4/1987 1766.74 .929 -1.112
-193 -.076 -31
-.074 + .10
This was final bottom. A bull market ensued.
9/19/2001 8759.13 .882 -1.965
-444 -.158 -409 -.394 + .055
The DJI bottomed a few days later on 8/21 at 8235.81
10/8/2008 9250.10 .862 -2.168
-795 -.03 -378 -.168
+.006
Also Buy B1
The DJI fell to 8175 on 10/27/2008 before rallying.
11/21/2008 8046.42 .927
-.881 0555 -.091 -323 -.169 ????
==========================================================
Number of closed out trades = 9 Avg. Gain= % All
were profitable.
There is one significant problem. These signals assume there will be no Depression. If we look
at the period from 1929 to 1938, we see a number of cases when the DJI kept falling even
though it had closed more than 14.8% below the 21-day ma. We should also be wary of using
this signal if there has been a price-breakdown not much above the Buy B16. That point of
breakdown will act as resistance on the next rally. We want to have enough over-head room
to make it worth while buying on a Buy B16. Look at the case between 1839 and 1937 and you
will see examples of what would have been failed Buy B16s.