Peerless Stock Market Timing: 1915-2011:
Automatic Buys and Sell Signals
TRACK RECORD OF BUYS/SELLS 1928-1948
95 Reversing Buys and Sells.
Avg. Gain on a Buy was + 11.1%
Avg. Gain on a Sell was + 8.8%
William Schmidt, Ph.D. (Columbia University) EMAIL william_schmidt@hotmail.com About Us
(C) 2011 All rights reserved. www.tigersoft.com
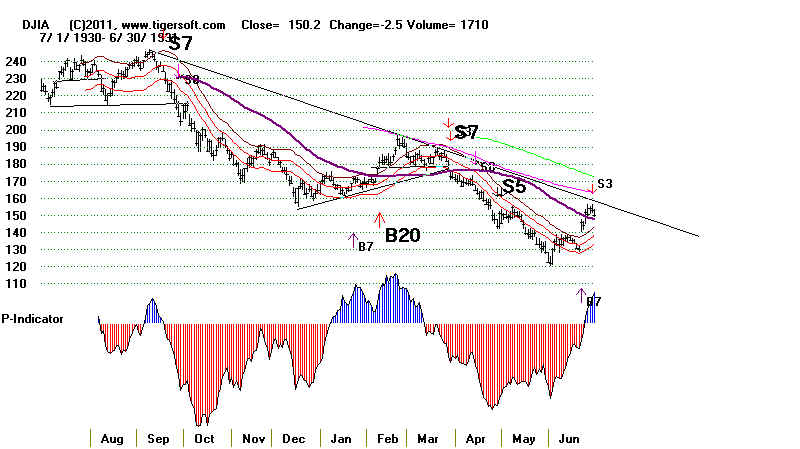
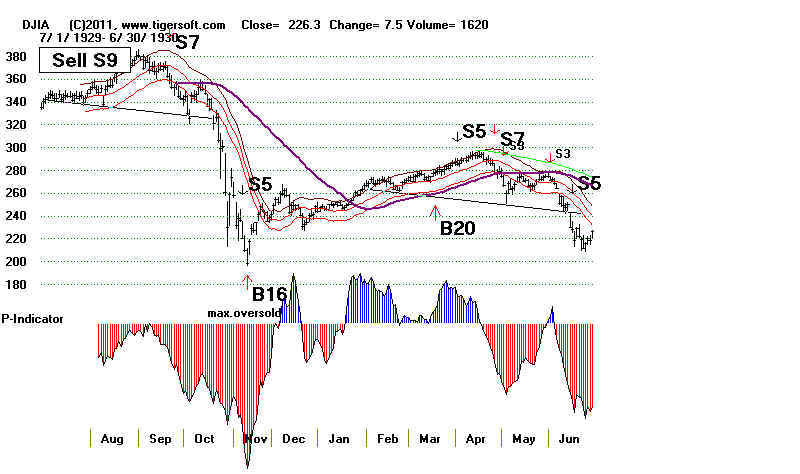
1929-1930 Peerless Chart of Start of The Worst Bear Market
with Automatic Peerless Buys and Sells that test best between 1928 and 2011.
Peerless Book shows these charts for every year since 1915.

and BOTTOMS, too
TRACK RECORD OF BUYS/SELLS 1928-1948
Track Record of Automatic Peerless Buys/Sells: 1948-2011
Introduction to Peerless Stock Market Timing
On-Line Book Order Here: $95
One Year of Peerless/Tiger HOTLINE $350
Peerless Stock Market Timing: 1929-2010 $395.
TigerSoft & Peerless Stock Market Timing: 1929-2010 $495.
TRACK RECORD OF BUYS/SELLS 1928-1948
The signals are based on historical data and applied to the DJI for simplicty. The basic
Peerless indicators used could be calculated by hand. But the Peerless software and our Tiger
Data page make easy the production of the indicators and our automatic Buy and Sell signals.
These Peerless Buy and Sell signals can profitably be superimposed on most stocks and ETFs
worldwide. Our software does this and also lets users see gains and losses when it is assumed
that all trades are made at the Opening the day after the Buy or Sell.
Numbers are used to classify particular signals. Higher numbers signals are not necessarily
more powerful than lower numbered signals. Numbering them distinguishes one from another
and let users see the historical potency and reliability of each signal in the documentation. Our documentation
explains the general basis of each signal. "B" means Buy. "S" means Sell. The asteriix shows
the market was in "extreme Bearish Mode". Our Peerless system is always long or short.
It is assumed for simplicity that one always trades at the exact close of each signal.
Note: The Peerless charts do not show all the Buy and Sell signals for the first 100-days
because that much data is needed to produce the signals. There are lots of Buys and Sells
that are not reversing signals, i.e. a Buy after a Sell or a Sell after a Buy. The table below
gives all the reversing Buys and Sells for the period.
Peerless provides you the data since 1965 so that you can
replicate results and better
study how the signals are produced. Our manual shows all the charts and
signals since 1915
and discusses the history and basis of each signal since 1928, when the necessary
data
to produce the signals first comes available.
.
  PEERLESS AUTOMATIC BUYS AND SELLS:
                          1929-1948
Peerless   Date           DJI      Pct.
Signal                             Gain
--------------------------------------------------------------------
Buy  B2     12/7/1928    271.1     15.3%

Sell S9     1/30/1929    312.6     3.6%
Buy  B17    2/8/1929     301.5     5.3%
Sell S9     2/28/1929    317.4     4.5%
Buy  B17    3/27/1929    303.2     2.9%
Sell S9     4/18/1929    311.9     27.0%
*Buy B16    11/13/1929   198.7     35.1%
*Sell S5 4/2/1930 285.3 39.8%
*Buy B7     1/23/1931    171.8     3.2%
*Sell S7    3/27/1931    177.3     17.8%
*Buy B7     6/22/1931    145.8     4.7%    .
*Sell S3    6/29/1931    152.7    30.2%
*Buy B3     10/8/1931    105.8     7.7%
*Sell S5    11/10/1931   113.9    31.0%
*Buy B7     2/11/1932    78.6      3.2%
*Sell S3    3/14/1932    81.1     47.2%
*Buy B8     6/30/1932    42.80    73.6%
Sell S8     8/30/1932    74.30     5.9%
Buy B17     9/13/1932    69.9      2.3%
Sell S8     9/29/1932    71.5     12.9%
*Buy B7     1/5/1933     62.3     -5.1%
*Sell S3    1/9/1933     59.1     -5.1%
*Buy B8     3/15/1933    62.10    65.4%
Sell S12    7/5/1933     102.7    14.2%
Buy B7      10/23/1933   88.1     12.3%
Sell S12    12/1/1933    98.9      1.7%
Buy B7      12/18/1933   97.2     12.0%

Sell S4     2/1/1934     108.9     4.8%
Buy B9      2/27/1934    103.7     1.4%
Sell S9     4/11/1934    105.2     4.5%
Buy B9      4/30/1934    100.5    -1.5%
Sell S9/S5  6/19/1934    99.0     12.4%
Buy B8      9/17/1934    86.7      7.7%
Sell S9/S12 9/27/1934    93.4     -6.6%
Buy B6      12/20/1934   99.6      4.9%
Sell S12    1/2/1935     104.5     4.2%
BUY B5      3/11/1935    99.4     33.9%
Sell S8     9/17/1935    133.1     3.8%
Buy B11     10/2/1935    128.1    19.8%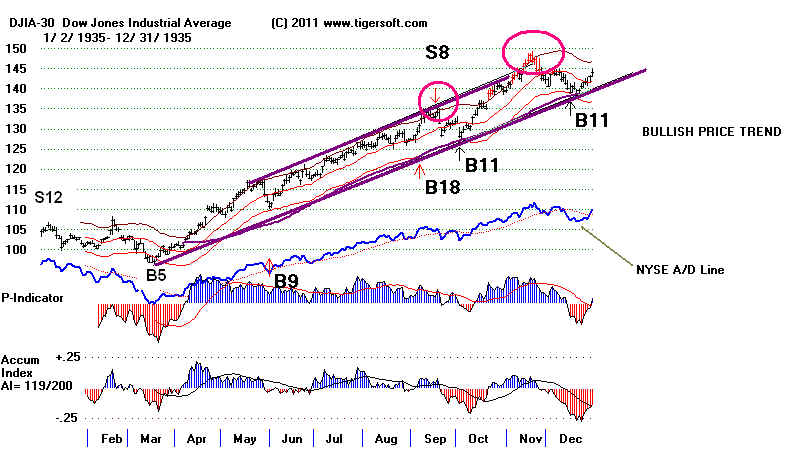
Sell S15    2/18/1936    153.4     3.1%
Buy B2      5/5/1936     148.6    14.1%
Sell S2     9/8/1936     169.6     2.6%
Buy B11     9/16/1936    165.2     4.6%
Sell S12    10/5/1936    172.8     4.2%
Buy B8      6/14/1937    165.5    14.4%
Sell S9     8/13/1937    189.3    37.6%
*Buy B8     11/19/1937   118.1     8.6%
*sELL s7    12/9/1937    128.20    7.5%
*Buy B7     6/20/1938    118.6    21.8%
Sell S12    8/5/1938     144.5     5.5%
Buy B17     8/12/1938    136.5     15.4%
Sell S12    11/10/1938   157.5     5.7%
Buy B6      12/1/1938    148.6     3.4%
sELL S12    1/3/1939     153.6     4.1%
Buy B17     1/12/1939    147.3     1.4%
Sell S12    3/7/1939     149.4     4.0%
Buy B9/B17  3/21/1939    143.4    -0.1%
Sell S8     7/31/1939    143.3     4.2%
Buy B7      8/11/1939    137.3    12.2%
Sell S9     9/13/1939    154.1     2.8%
Buy B1      11/14/1939   149.8    -3.3%
Sell S10    5/10/1940    144.8     15.5%
Buy B16     5/20/1940    122.4     10.4%
Sell S4     10/3/1940    135.1      6.7%
Buy B19     2/20/1941    119.9      7.4%
Sell S12    9/18/1941    128.8      8.2%
Buy B1      11/7/1941    118.3     -3.7%
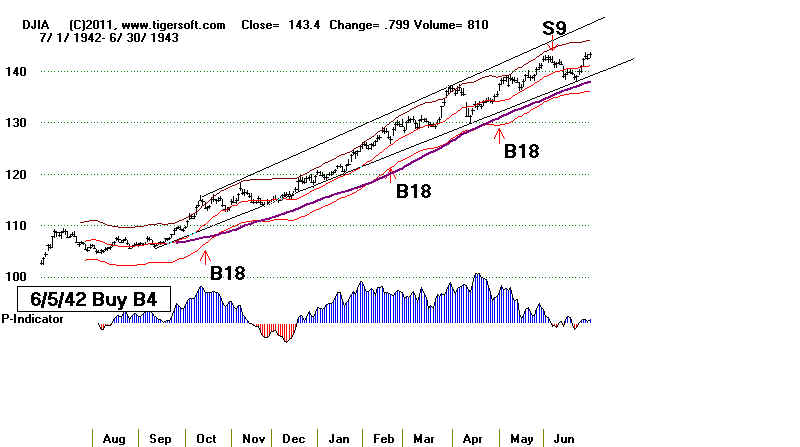
Sell S9     1/6/1942     113.9      6.2%
Buy B9      2/10/1942    106.8     -7.1%
Sell S9     5/11/1942    99.2      -5.2%
Buy B4      6/5/1942     104.4     35.8%
Sell S9     6/7/1943     141.8      3.9%
Buy B17     8/10/1943    136.2      8.6%
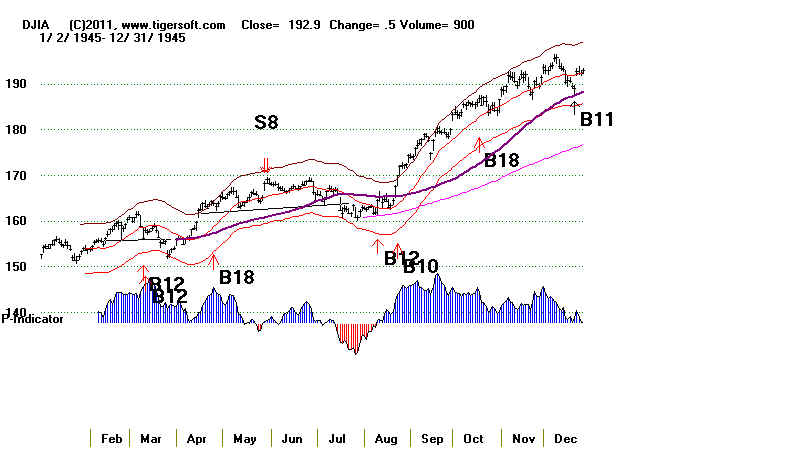
Sell S2     6/21/1944    147.9      1.8%
Buy B11     8/4/1944     145.3     12.9%
Sell S9     5/15/1945    164       -3.6%
Buy B10     8/24/1945    169.9     17.2%
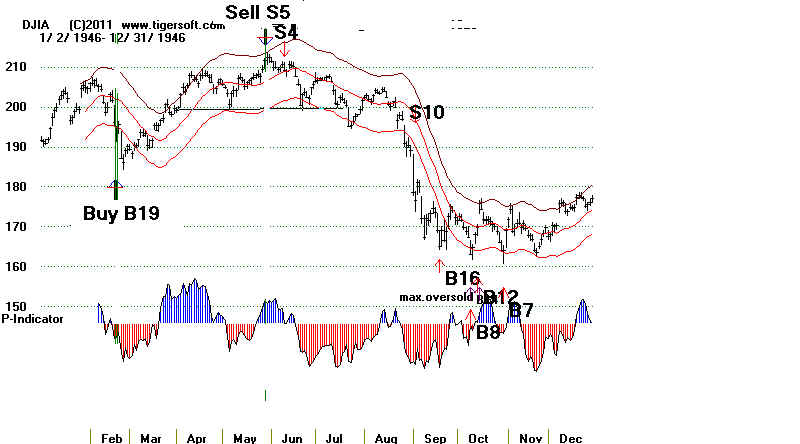
Sell S9     1/10/1946    199.2      0.3%
Buy B17     2/13/1946    198.7      1.5%
Sell S6     2/18/1946    201.6      3.0%
Buy B19     2/21/1946    195.6      8.6%
Sell S5     5/29/1946    212.5     23.2%
Buy B14     10/9/1946    163.1      2.2%
Sell S10    4/14/1947    166.7     -1.7%
Buy B19     4/21/1947    169.5      8.8%
Sell S4     10/22/1947   184.4      5.8%
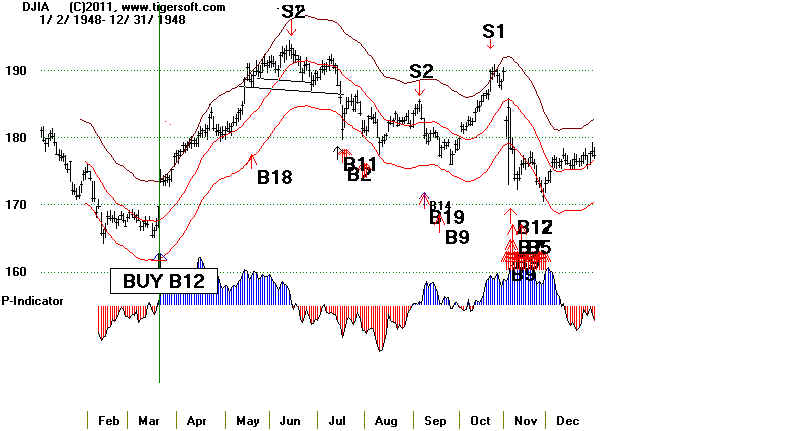
Buy B12     3/22/1948    173.7     11.2%
Sell S2     6/15/1948    193.2      2.8%
Buy B11     7/15/1948    187.7     -1.2%
Sell S2     9/7/1948     185.4      2.8%
Buy B14     9/9/1948     180.3      5.3%
Sell S1     10/22/1948   189.8      3.8%
Buy B9      11/3/1948    182.5     -0.7%
       .
Sell S12    1/7/1949     181.3      8.9%
Buy B14     6/6/1949     165.2      24.3%
--------------------------------------------
  95 trades avg gain = 9.94%

  48 long trades: avg gain = 11.05%
                8 losses (17.0% of long trades)
                7 gains of more than 20% (14.9%)
                17 gains of more than 10% (36.2%)
                24 gains of more than 7% (51.5%)
                27 gains of more than 5% (57.4%)

 47 short trades: avg gain = 8.81%
                6 losses (13.0% of long trades)
                7 gains of more than 20% (15.2%)
                12 gains of more than 10%  (26.1%)
                15 gains of more than 7% (32.6%)
                21 gains of more than 5% (45.7%)
from Book/Software Peerless Stock Market Timing: 1915-2011
1929-1930