Last edited May 25, 2016 -- (C) William Schmidt, Ph.D.
B11s occur when the DJI pulls-back to a rising 65-dma that it has not
been violated for two months. There must not have been a recent Sell S9
or S12. Their presence would increase too much the odds of a deeper
decline and also warn that the DJI is probably topping out and so upside
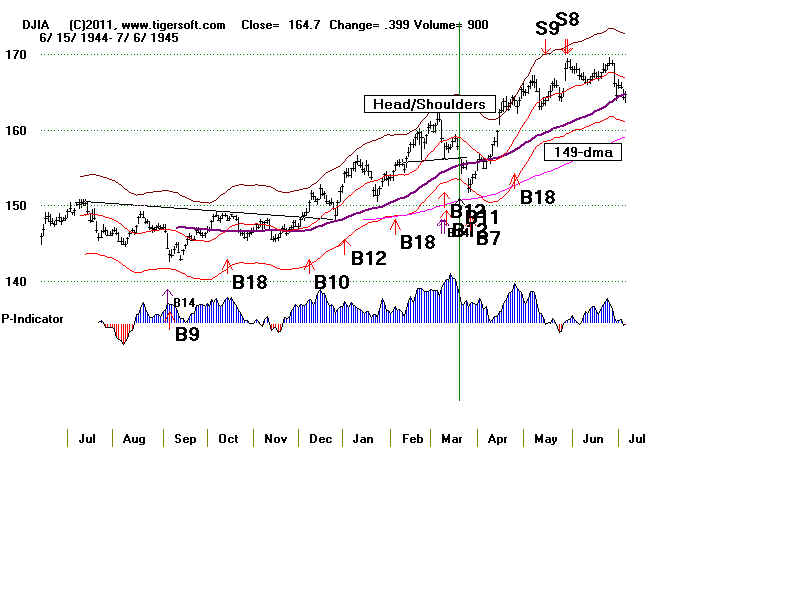
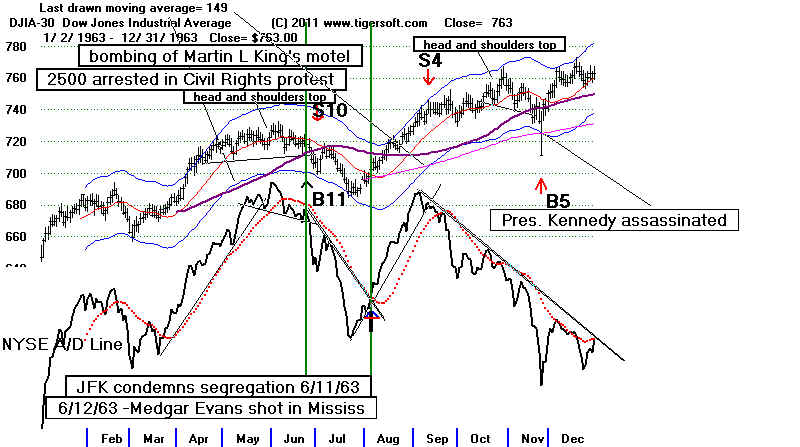
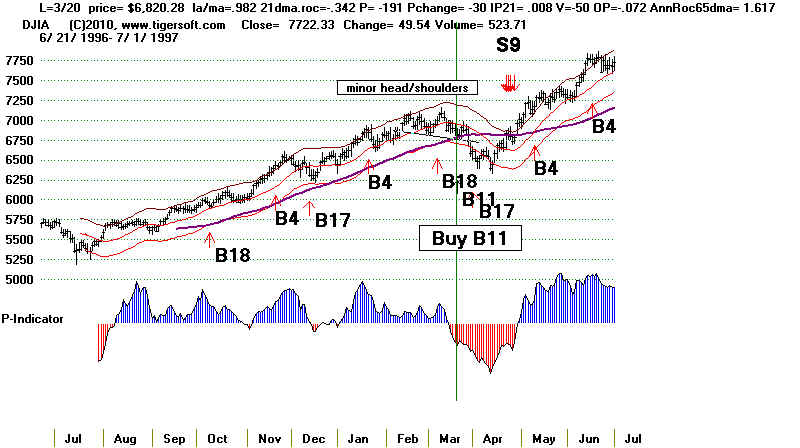
potential is more limited. When a head/shoulders is present at the time
of the Buy B11, the odds are then 44% that the DJI will still violate the
H/S neckline and the 65-dma. Be prepared in these cases for a small paper loss.
There have been 21 cases of Buy B11s since 1928. The average gain
was 12.3%. There was only 1 loss.
The signal derives from the observation that when the DJI is rising quickly,
there are sometimes quick retreats to the 65-dma and then just as quick surges
back up. See the case below in October 1935. These trigger a Buy B11
when conditions are right. (You can see the Basic program that produces
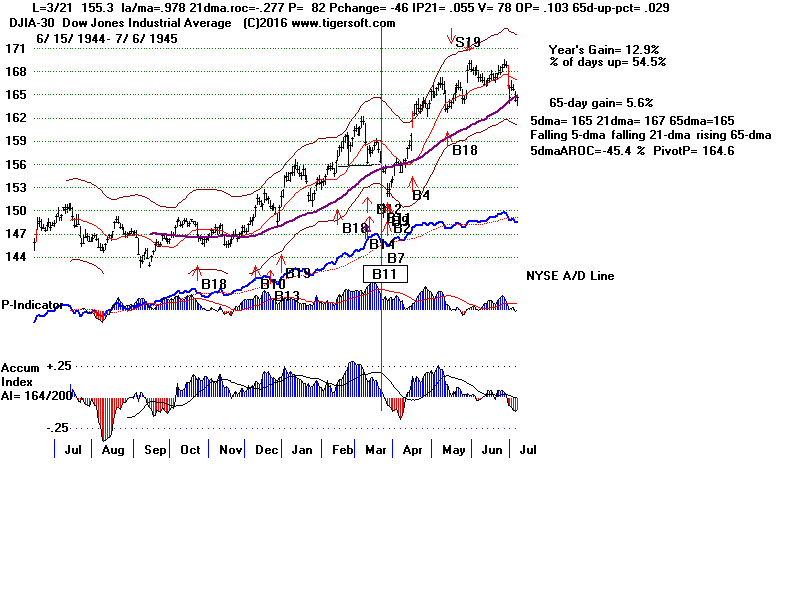
these signals at the bottom of this page.)
We do have to be careful when there are signs that the 65-dma might
be penetrated. Deteriorating breadth and negative Accumulation at
the last top are such warnings. We pick up on these by the presence
of Sell S9s or S12s. There can be no Buy B11, when there has been an
S9 or S12 signal in the two months prior to the point where there is a
pullback to the 65-dma,
The presence of a head/shoulders pattern is a warning that there is
almost a 50% chance of a quick decline below the neckline and the
65-dma. In 9 instances of head/shoulders patterns, there were 4 cases
where the neckline and 65-dma were decisively violated.
There are other factors associated with unusual degrees of success
from Buy B11s. For example, the highest average gains were those
occurring in the year after the Presidential Election, +21.3%. Presidential
Elections apart from the year 1944 when the US was at war, showed
only modest gains after a Buy B11.
May and June seldom bring Buy B11s and when they do. the gains have been
only half as good as normal. The best gains come when the B11 occurs in March
and October.
Noticeably weaker B11s seem to occur in the last 11 days of the month.
Size of Gains
>.10 10
.05-.099 2
.02-.049 6
0 - .019 1
loss 1
BUY B11:
1928-2016 la/ma AROC P P^^ P-Cha IP21 V-I OPct 65-day Pct.Ch.
1)
19351002 B11 128.1 .219 Case 2
.974 .072 -10 -22 -54 -.124 -159 .288 .078
----------------------------------------------------------------
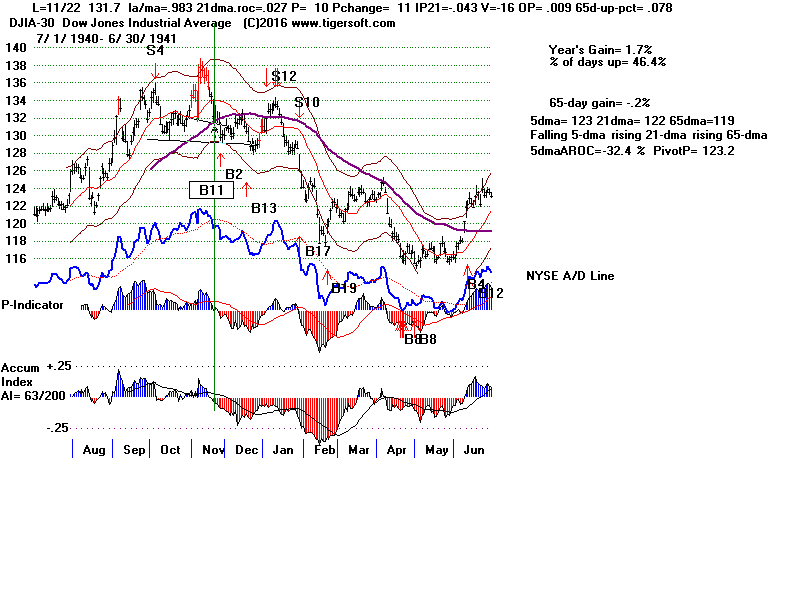
2)
19401122 B11 131.7 .002 Case 5
.969 -.142 -29 -16 -145 -.008 -57 -.142 .026
----------------------------------------------------------------
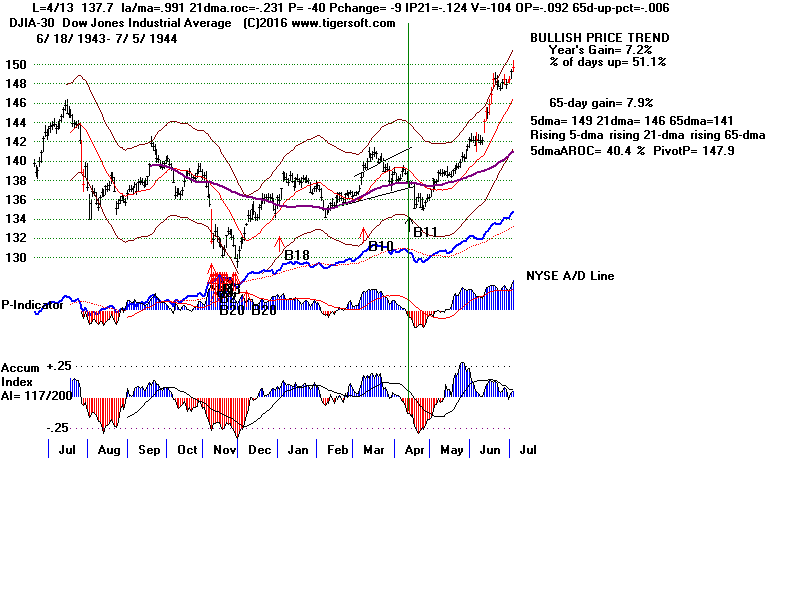
3)
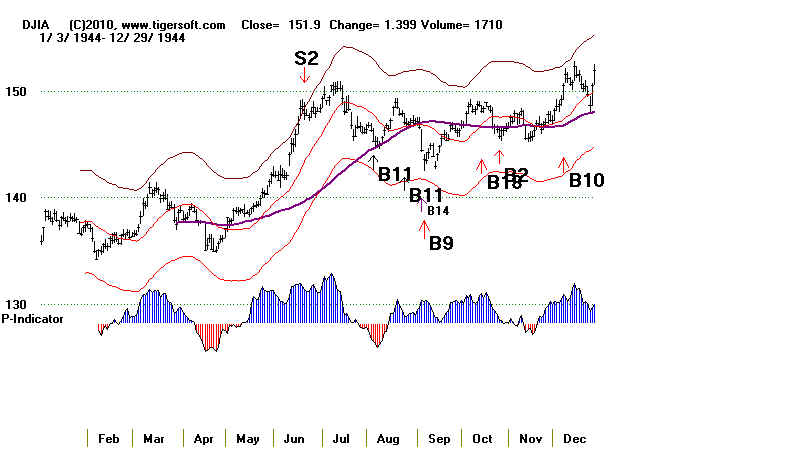
19440413 B11 137.7 .191 Case 5
.991 -.231 -40 -9 -213 -.124 -104 -.092 -.006
----------------------------------------------------------------
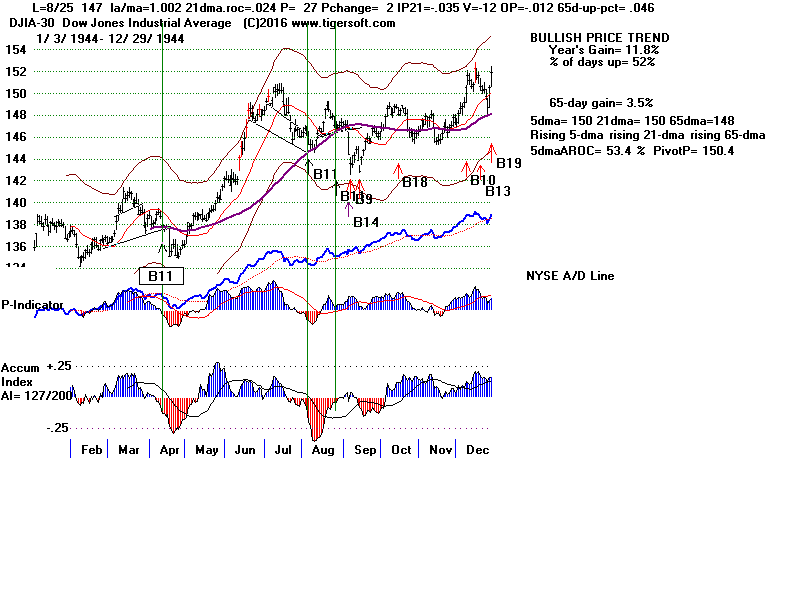
4)
19440804 B11 145.3 .129 Case 5
.983 -.306 -67 -9 -.187 -172 -.134 .054
paper loss = 2.4/145.3
----------------------------------------------------------------
5)
19440825 B11 147.0 .115 Case ?
.983 -.306 -67 -9 -.187 -172 -.134 .054
paper loss = 4.1/147.0
------------------------------------------------------------
6)
19450321 B11 155.3 .056 Case 3
.978 -.277 82 -46 371 .055 78 .044 .029
paper loss = 0
----------------------------------------------------------------
7)
19450705 B11 164.3 .212 Case 5
.984 -.271 -9 -26 -38 -.113 -131 -.02 .051
----------------------------------------------------------------
8)
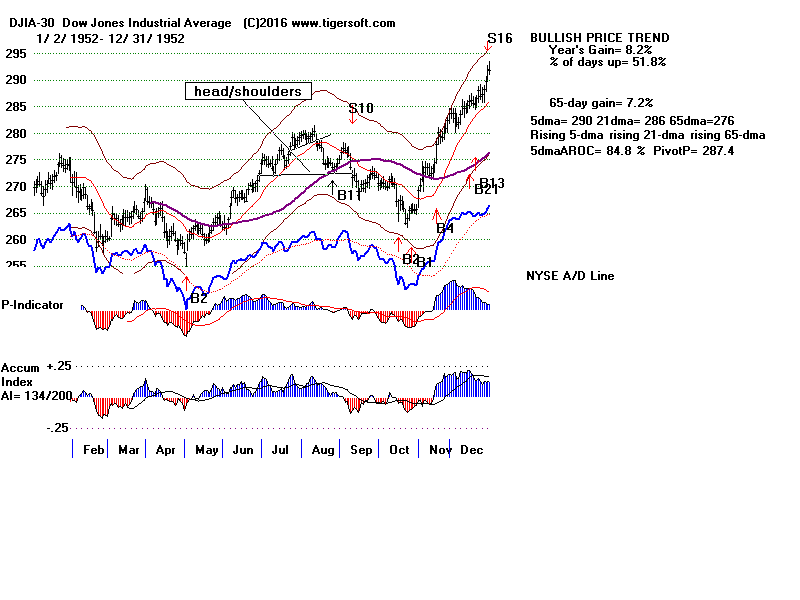
19520825 B11 273.6 -.007 Case 5
.986 -.176 -16 -7 -59 .04 -79 .091 .039
----------------------------------------------------------------
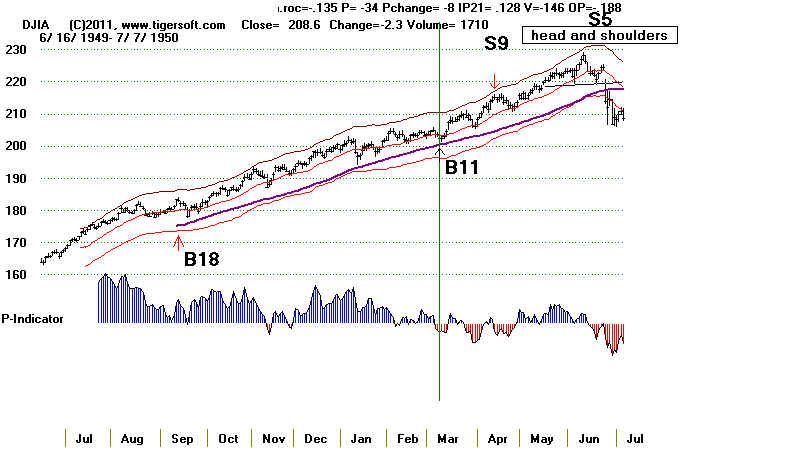
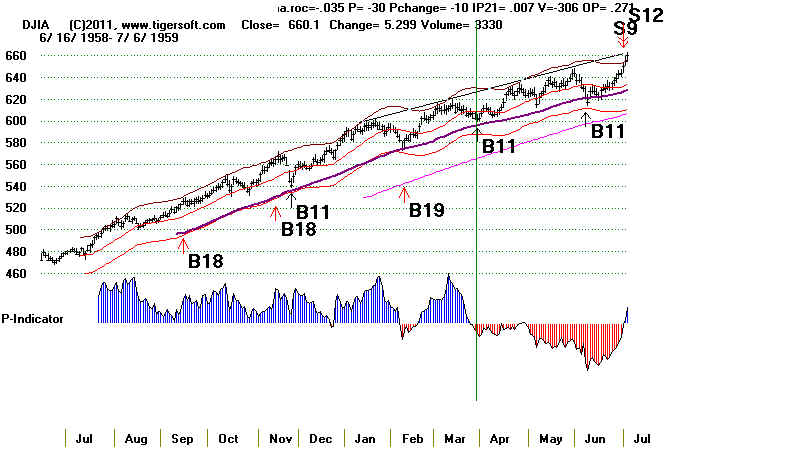
9)
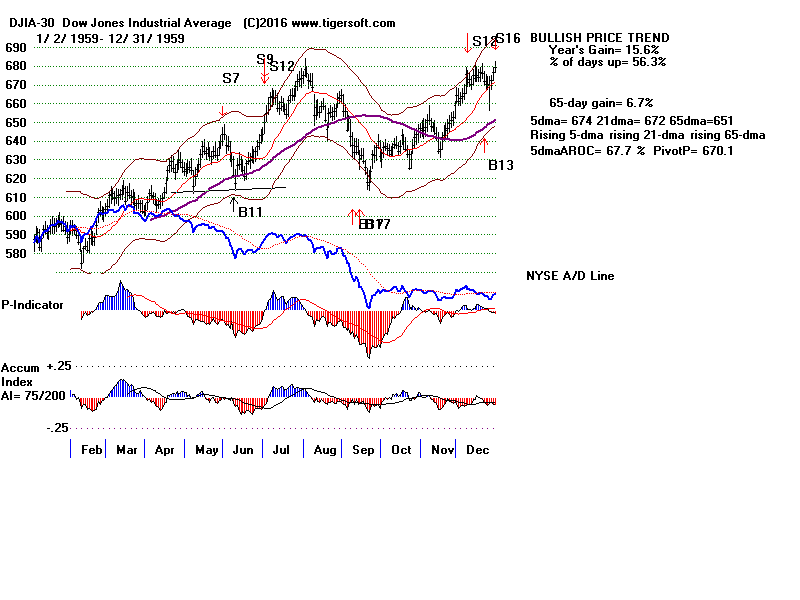
19590608 B11 621.6 .046 Case 1
.981 .004 -112 -55 329 -.041 -484 -.121 .019
----------------------------------------------------------------
10)
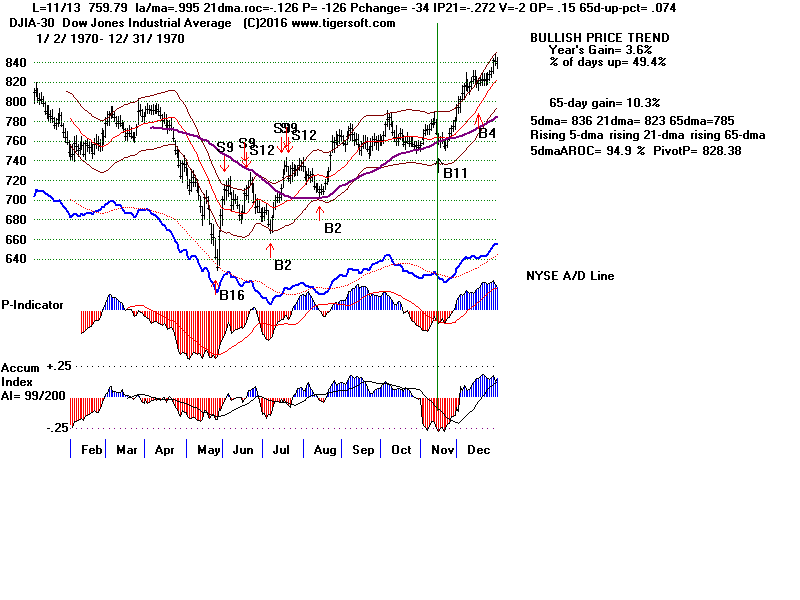
19701113 B11 759.79 .234 Case 5
.995 -.126 -126 -34 -266 -.272 -2 .15 .074
----------------------------------------------------------------
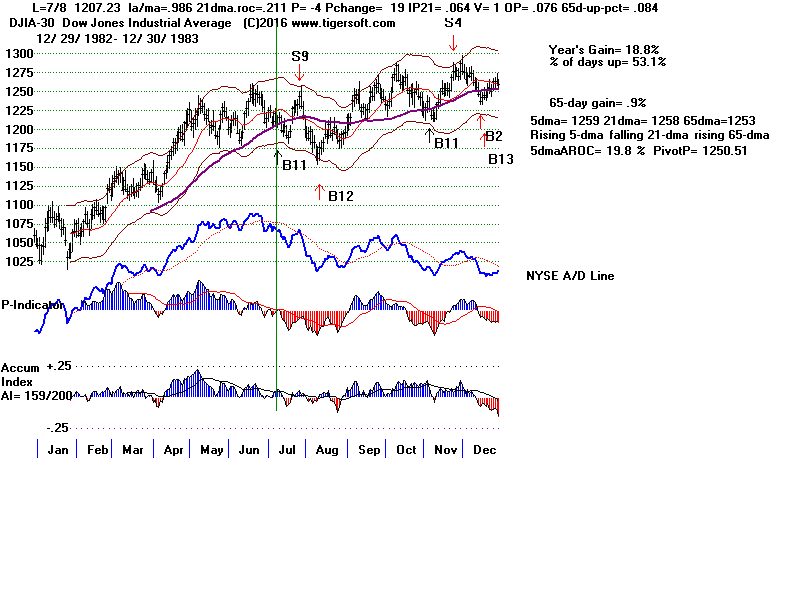
11)
19830708 B11 1207.23 .03 Case 5
.986 .211 -4 19 -7 .064 1 .076 .084
----------------------------------------------------------------
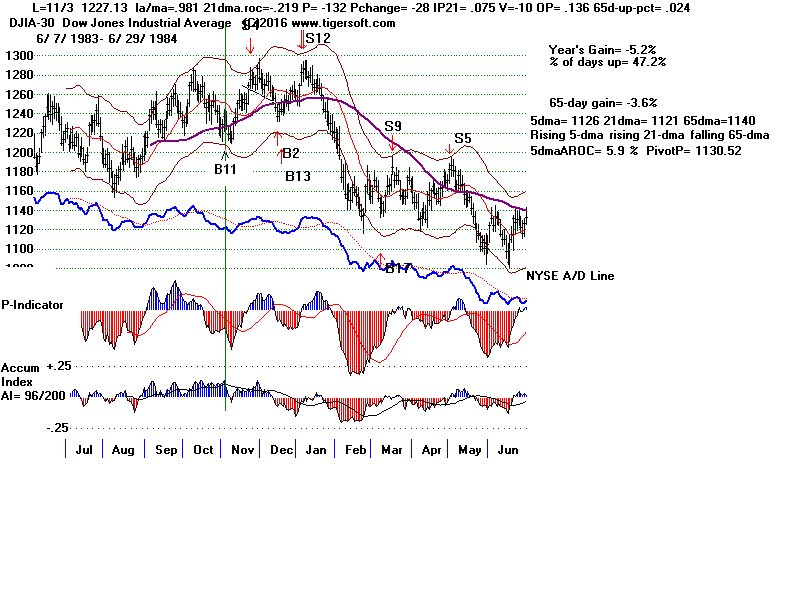
12)
19831103 B11 1227.13 .04 Case 5
.981 -.219 -132 -28 -260 .075 -10 .136 .024
----------------------------------------------------------------
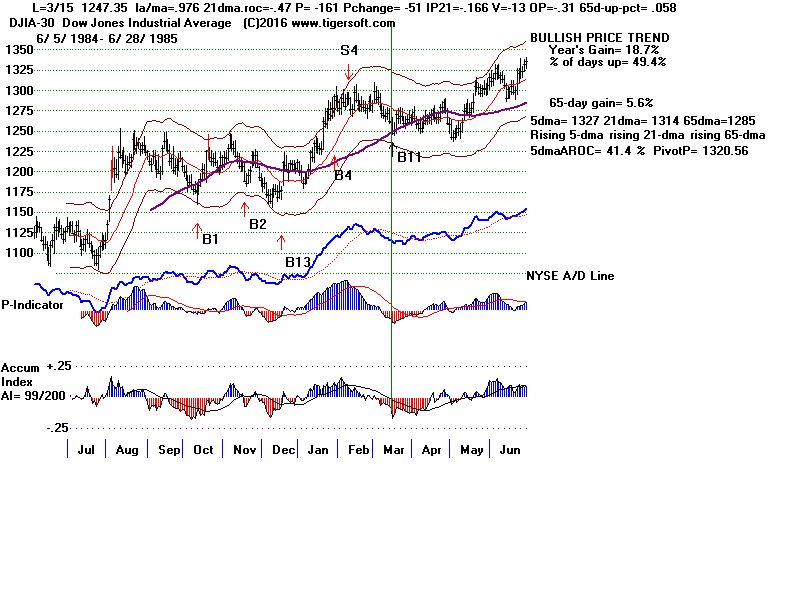
13)
19850315 B11 1247.35 .463 Case 3
.976 -.47 -161 -51 -319 -.166 -13 -.31 .058
----------------------------------------------------------------
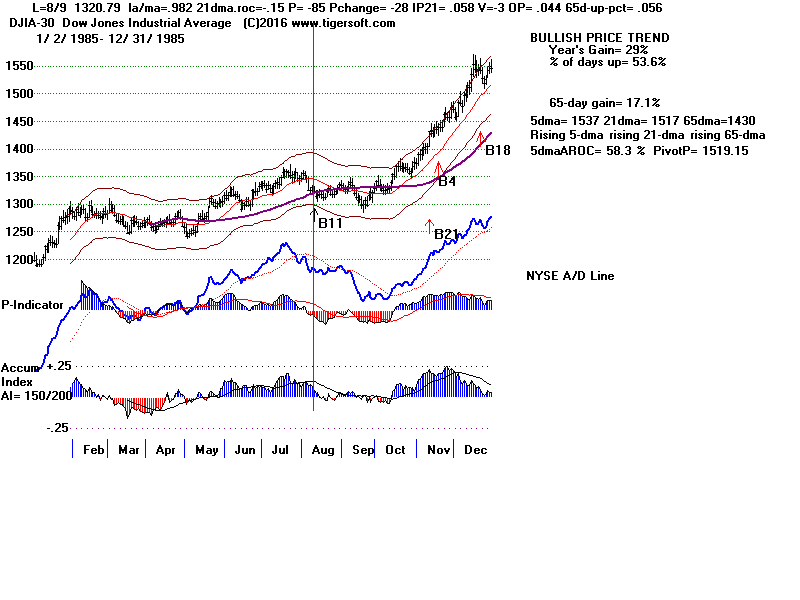
14)
19850809 B11 1320.79 .382 Case 5
.982 -.15 -85 -28 -169 .058 -3 .044 .056
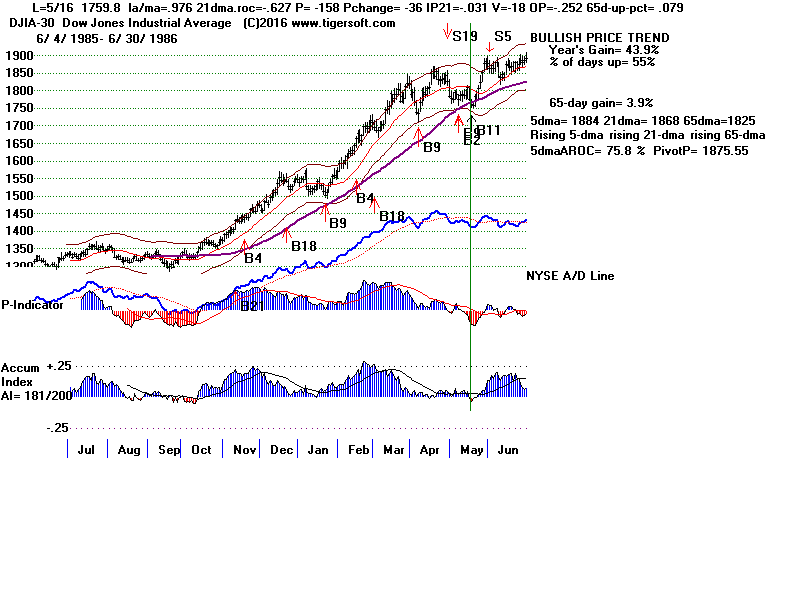
----------------------------------------------------------------
15)
19860516 B11 1759.8 .058 Case 4
.976 -.627 -158 -36 -302 -.031 -18 -.252 .079
----------------------------------------------------------------
16)
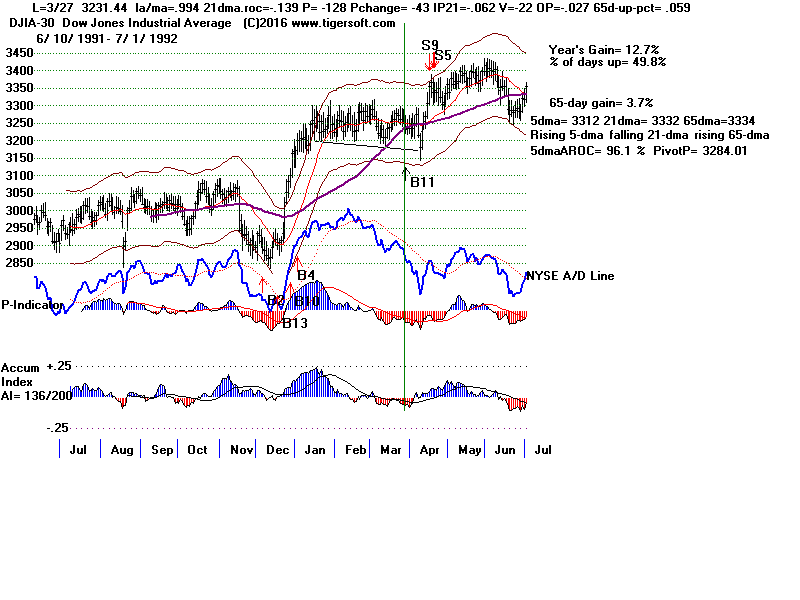
19920327 B11 3231.44 .038 Case 5
.994 -.139 -128 -43 -248 -.062 -22 -.027 .059
----------------------------------------------------------------
17)
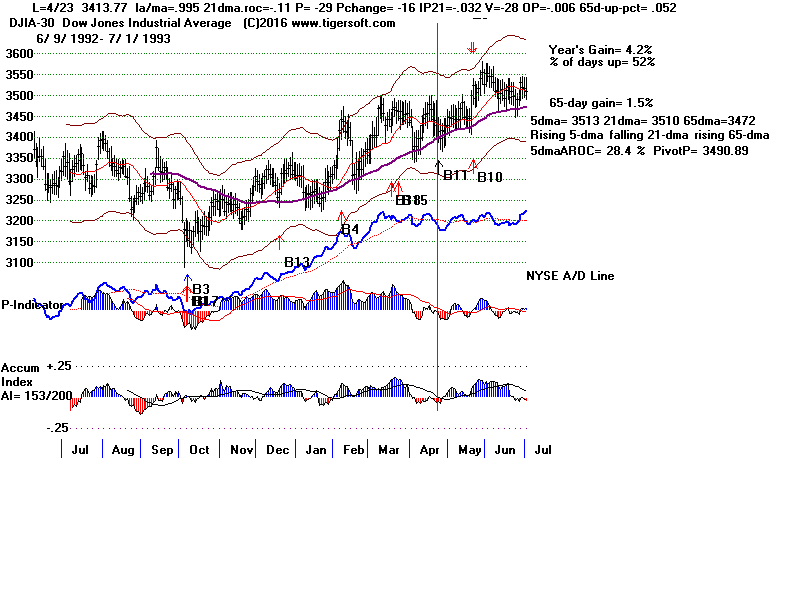
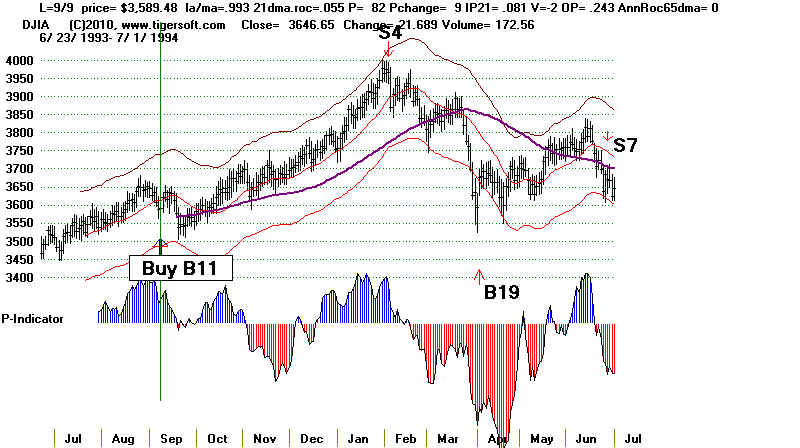
19930423 B11 3413.77 .025 Case 5
.995 -.11 -29 -16 -50 -.032 -28 -.006 .052
Paper loss = none
----------------------------------------------------------------
18)
19930702 B11 3483.96 .139 Case 5
.993 -.207 11 -7 19 -.035 -21 -.099 .014
Fell to 3449.92
----------------------------------------------------------------
19)
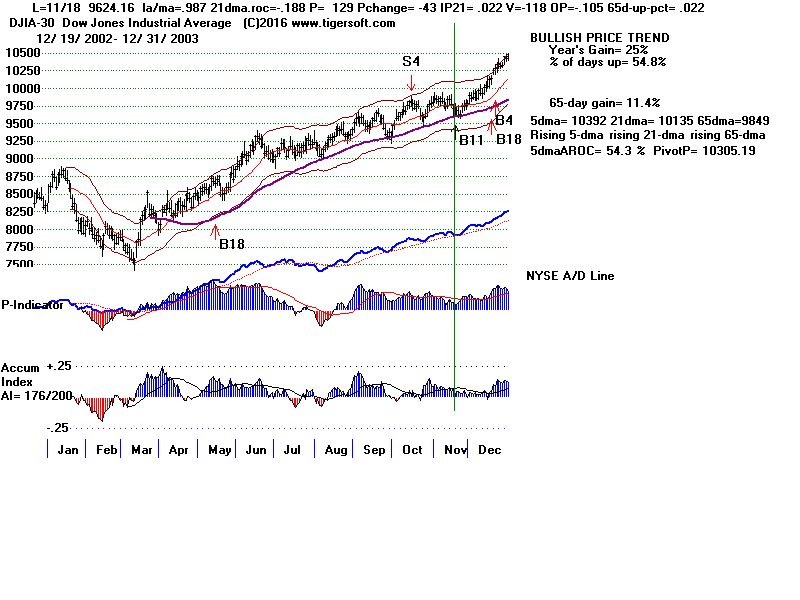
20031118 B11 9624.16 .103 Case 5
.987 -.188 129 -43 124 .022 -118 -.105 .022
----------------------------------------------------------------
20)
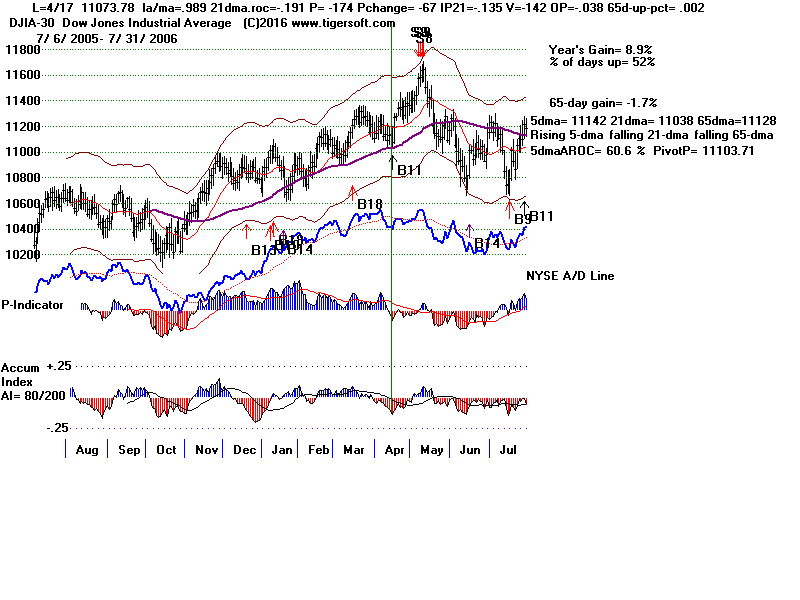
20060417 B11 11073.78 .046 Case 5
.989 -.191 -174 -67 -160 -.135 -142 -.038 .002
--------------------------------------------------------------------
21)
20160520 B11 17500.94 open Case ?
.986 -.323 40 +40 .004 -110 -.064 .066
====================================================================
Completed trades No.=20 Avg. = .123
Presidential Election Year   6   .106 (But there were 3 B11s in 1944.)
PE + 1                       7   .213
PE + 2                       3   .113
PE + 3                       4   .084
January 0 ---- February 0 ---- March 3 .186 April 3 .107 May 1 .058 June 1 .053 July 3 .127 August 4 .155 September - ---- October 1 .219 November 4 .095 December - ---- 1-10 8 .150 11-20 6 .183 21-31 6 .038
|
| B11s on Charts Included 9 cases where Head/Shoulders present Neckline & 65-dma held - 1935, 1941, Aug 1944, 1959, 1992 (5) Neckline & 65-dma violated - April 1944, Aug 1944, 1945, 1952, (4) No Cases of Broad trading ranges like 2016 brought Buy B11s. - 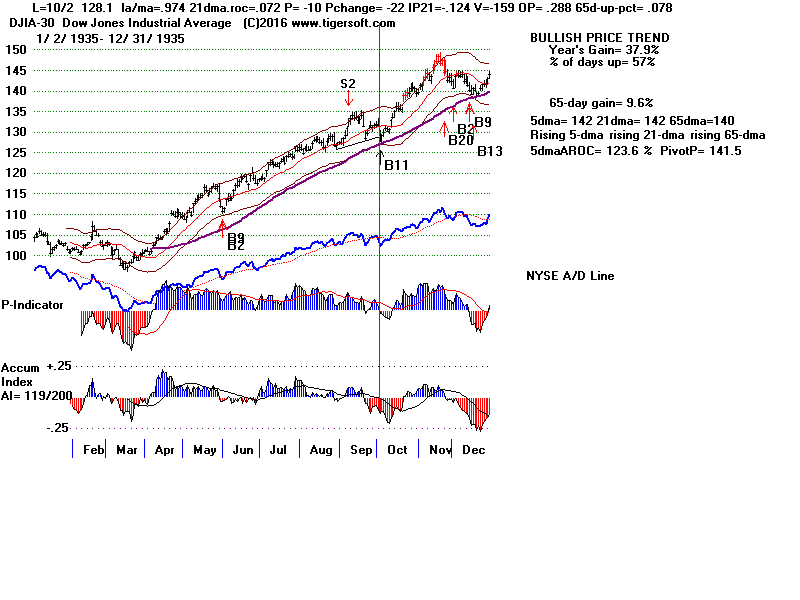 |
 |
 |
 |
 |
 |
 |
 |
 |
 |
 |
 |
 |
 |
 |
 |
 |
| Code used: Sub b11calc () Static ma65(300) Erase ma65 Dim i As Integer, j As Integer For i = 1 To 65: ma65(65) = ma65(65) + la(i): Next i For i = 66 To rn: ma65(i) = ma65(i - 1) + la(i) - la(i - 65): Next i For i = 65 To rn: ma65(i) = ma65(i) / 65: Next i For i = 110 To rn ' Case 1 If (yr(i) + 1) / 4 <> Int((yr(i) + 1) / 4) Then 26666 If mo(i) <> 6 Then 26666 If la(i) / ma65(i) > 1.004 Then 26666 If la(i) / ma65(i) < .9942 Then 26666 If la(i) / ma(i) < .97 Then 26666 If la(i) / ma(i) > .9825 Then 26666 If newipxxx(i) < -.125 Then 26666 If opma(i) < -.2 Then 26666 annroc = ((ma(i) - ma(i - 1)) / ma(i - 1)) * 250 If annroc < -.4 Then 26666 For j = i - 10 To i If s9(j) = 9 Then 26666 Next j If pvv(i) < -561 Then 26666 pi = i: mb(i) = 11: buyb11arrows (pi): : i = i + 10 26666 Next i '-------------------------------------------------- For i = 110 To rn ' Case 2 If (yr(i) + 1) / 4 <> Int((yr(i) + 1) / 4) Then 46666 If la(i) / ma65(i) > 1.0076 Then 46666 If la(i) / ma65(i) < .994 Then 46666 If la(i) / ma(i) < .97 Then 46666 If la(i) / ma(i) > .98 Then 46666 If newipxxx(i) < -.125 Or p(i) < -70 Then 46666 If opma(i) < .275 Then 46666 If mo(i) <> 10 Then 46666 If pvv(i) < -310 Then 46666 pi = i: mb(i) = 11: buyb11arrows (pi): : i = i + 10 46666 Next i '------------------------------------------------ ' case 3 For i = 110 To rn If mo(i) <> 3 Then 66 If (yr(i) - 1) / 4 <> Int((yr(i) - 1) / 4) Then 66' If la(i) / ma65(i) > 1.002 Then 66 If la(i) / ma65(i) < .994 Then 66 If la(i) / ma(i) < .97 Then 66 If la(i) / ma(i) > .98 Then 66 If newipxxx(i) < -.166 Then 66 If pvv(i) < -14 Then 66 If opma(i) < -161 Then 66 pi = i: mb(i) = 11: buyb11arrows (pi): : i = i + 10 66 Next i '--------------------------------------------- ' ' case 4 For i = 110 To rn If mo(i) = 1 Then 6 If (yr(i) - 2) / 4 <> Int((yr(i) - 2) / 4) Then 6 If la(i) / ma65(i) > 1.002 Then 6 If la(i) / ma65(i) < .994 Then 6 If la(i) / ma(i) < .97 Then 6 If la(i) / ma(i) > .98 Then 6 If newipxxx(i) < -.032 Then 6 If mo(i) <> 5 Then 6 If pvv(i) < -310 Then 6 pi = i: mb(i) = 11: buyb11arrows (pi): : i = i + 10 6 Next i '------------------------------------------------------------ ' Case 5 For i = 110 To rn If mo(i) = 9 Or mo(i) = 10 Then 6612' excludes strange 1967 case If mo(i) = 7 And (yr(i) + 1) / 4 = Int((yr(i) + 1) / 4) And opma(i) < .01 Then 6612 AROC = 250 * (ma(i) - ma(i - 1)) / ma(i - 1) If mo(i) = 6 And ((yr(i)) - 1) / 4 = Int((yr(i) - 1) / 4) Then 6612 If mo(i) = 7 And (yr(i)) / 4 = Int((yr(i)) / 4) And pvv(i) < -165 And AROC < -.32 Then 6612 ' If la(i) / ma65(i) > 1.01 Then 6612 If la(i) / ma65(i) < .997 Then 6612 If lo(i) / ma65(i) < .994 Then 6612 For j = i - 50 To i ' If mo(j) = 11 And da(j) = 18 Then Stop If mo(i) = 6 And (yr(i) + 2) / 4 = Int((yr(i) + 2) / 4) Then 6612 If mo(i) = 6 And (yr(i)) / 4 = Int((yr(i)) / 4) Then 6612 If mo(i) = 6 And ((yr(i)) - 1) / 4 = Int((yr(i) - 1) / 4) Then 6612 If mo(i) = 2 And (yr(i) + 1) / 4 = Int((yr(i) + 1) / 4) Then 6612 'If j = 128 Then Stop ' If mo(j) = 7 And da(j) = 1 Then Stop If s9(j) = 9 Then 6612 If s9(j) = 4 And mo(i) <> 11 Then 6612 If s9(j) = 1 Then 6612 If s9(j) = 15 Then 6612 If s9(j) = 1 Then 6612 If s9(j) = 120 Then 6612 If s9(j) = 12 Then 6612 If s9(j) = 8 And (250 * (ma(j) - ma(j - 1)) / ma(j - 1)) < .5 Then 6612 Next j 'If mo(i) = 11 And da(i) = 18 Then Stop For j = i - 45 To i - 1 'If mo(i) = 6 And da(i) = 16 Then Stop 'If mo(i) = 11 Then Stop If lo(i) < .995 * ma65(j) Then 6612 If mo(j) <> 9 And la(j) < .998 * ma65(j) Then 6612 If mo(j) = 9 And la(j) < .997 * ma65(j) Then 6612 'If mo(j) = 11 And la(j) < .97 * ma65(j) Then 6612 Next j 'if la(i)/ma65(i)> If mo(i) = 9 And da(i) = 18 Then Stop If pvv(i) < -278 Or opma(i) < -.2 Then 6612 If la(i) / ma65(i) < 1.0045 Then : pi = i: mb(i) = 11: buyb11arrows (pi): i = i + 10 6612 Next i 56140 DoEvents End Sub |
=====================================================
Buy because Sell S11 paper loss has
reached
2.2%, taking it out of the range of
past S11s,
which should render it suspect,
void and reversed.
(Introduced temporarily on 3/8/2013)
or
Buy on GLANCING TEST OF RISING 65-DAY MA
LAST REVISED 5/29/2011
(c) 2011
William Schmidt - www.tigersoft.com
They
confirn a power advance is occuring and provide a great way to add to positions
in what is often a powerful
advance. They cannot occur immediately after a major Sell
and the 65-day moving
average must not have been violated by more than 1% for
two months.
Buy B11s are usually powerful
Buys. There have been 66 completed Buy B11s
since 1928. Their
average gain is 12.5% at the time of the next reversing Peerless Sell.
In 67 occurrences, there have
only been 2 losses, both minor. There were 15 cases
when the B11 gained more than
20%. In 31 cases, or 46.3% of all cases, the gain
was over 10%.
Buy B11 gains are apt to be
greatest when the IP21 is positive along with the P-Indicator,
V-Indicator or Accumulation
Index. The biggest average gains were in October, August
and March. The lowest
gains were in July, June and December.
In
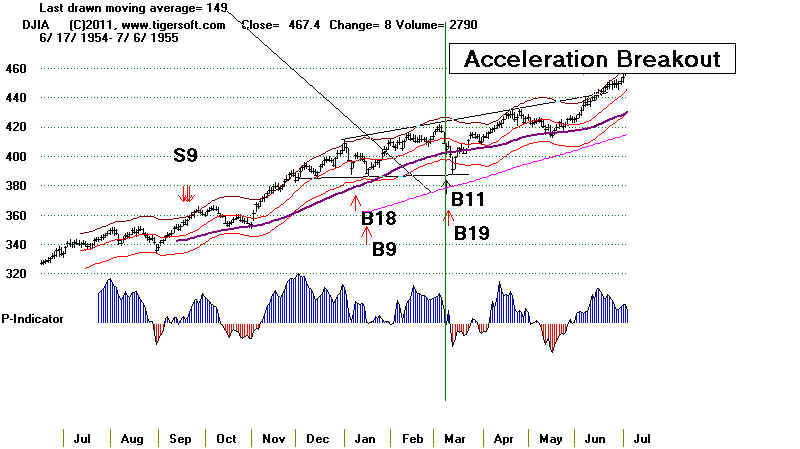
exceptionally strong markets, instead of using a 65-day ma, the adept trader may
want to watch for pullbacks
to a rising 50-day, provided it has not been violated
for the last six weeks.
See the 1953-1954 and 1995-1996 periods.
The presence of a completed head and shoulders patterns often
will bring a decline,
perhaps 4% or so, below the
rising 65-day ,ma. This is seen in March 1945, June 1963
and March 1997.
A positive IP21 (current Accumulation Index) reading at the time of a Buy
B11
generally brings bigger advances.
In the 23 cases where the IP21 was greater than 0
the average gain for a B11 was 17.4%, 33% higher than for all B11s. Where
both the P-Indicator and IP21 was greater than 0, the average gain for a Buy B11
was 16.8%. There were 9 cases. Positive IP21 with positive V-Indicator Buy
B11s were
scarce. There were only 3. But the average gain was an impressive 26.9%. When
the IP21 and OPct were both positive, the Buy B11 brought an average gain of
17.6% in a more reliable 14 cases. Where the V-Indicator is negative anf the P-I,
IP21 and OPct indicators are positive the DJI gained an average 10.3%
Buy B11s with Positive Accumulation Index (IP21) >0
Date
Gain
LA/MA
21dmaROC P-I
IP21
V
OPct
1/21/36 +6.9% .996 -.381
93 .084 104 .112
8/26/42 +34.2% .996 -.101
16
.024
-5 .094
9/11/42 +33.9% .995 .056
27 .073
0 .17
3/20/45 +2.5% .983 -.135
127 .069
150 .243
12/21/45 +5.3% .986 -.025
24
.083
-28 .069
3/9/50 +6.4% .99
-.135 -34 .128 -146 -.142
8/30/54 +42.5% .985 -.227
-34 .056 -270 -.025
11/25/58 +20.3% .977 .022
25
.039
-173 .249
3/31/59 +8.1% .988 -.035
-30 .007
-306 .271
10/26/70 +24.2% .989 -.083
-103 .016
-2 .062
6/8/83 +4.9% .981 - .42
-37 .003
-5 -.012
7/5/83 +2.9% .988 - .044
-54 .005
-1 .058
11/3/83 +4.0% .981 - .219
-132 .075
-10 .13
10/4/84 +53.8% .982 - .213
-11 .147
3 -.037
8/6/85 +37.8% .984 -.029
-59 .09
-2 .124
3/20/89 +22.5% .989 -.254
-75 .033
-8 .145
7/3/89 +13.0% .984 -.31
-67 .011 -11 -.091
5/10/93 +15.2% 1.002 -.162 51 .03 -7 .025
6/10/93 +13.6% .995
.078 -69 .092 -9 .133
9/9/93 +10.3% .993
.055 82 .081 -2 .242
8/18/95 +20.2% .988 -.061
100
.005
1 -.249
10/30/95 +16.7% .999 -.081
-164 .048 -43 -.062
3/20/1997 +0.2% .982 -.342
-191
.008 -50
-.072
9/25/03 +4.9% .984 .004
300
.023
-29 .035
------------------------------------------------------------------------------------------
N=24 Avg. Buy B11 Gain = 16.8%
Paper Losses
In 67 cases, there were 22 paper losses of more than 2%. Still the paper losses
are limited. Only 7 of the paper losses were more than 3%. None of the declines
after a Buy B11 saw the DJI go below the rising 200-day ma. Most did not reach
the 149-day ma (30-week ma.
The presence of a head and shoulders did make a decline below the 65-dma likely.
A positive IP21 (current Accumulation Index) only occurred in 1 of the 7 cases
where the paper loss was more than 3%, and it was only +.008. The more negative
were all the internal strength indicators (P-I, IP21, V-I and OPct), the more likely the
DJI would fall an additional 2% before rallying.
Paper Losses of 2% or Greater after a Buy B11.
Date Paper Loss LA/MA MAROC
P-I IP21 V-I OPct
-------------------------------------------------------------------------------------------
4/13/44
4%
.991 -.231
-40 -.124
-104 -.088
8/4/44 2%
1.003 .041
25
-.034
-15 .113
8/24/44
4%
1.003 .041
25
-.034
-15
.058
3/20/45 2.5%
.983 -.135
127
-.069
150
.143
8/20/47 2%
.983
.314 -43 -.091
-90 -.196
8/30/54 2%
.985 -.227
-34
.056 -270 -.025
3/9/55
3%
.983 -.136
-2 -.061 -226 .133
1/16/56
3%
986 -.113
-20
-.183 -187 -.04
5/10/56
6%
.995 -.259 -53 -.173
-279 -.204
5/15/61 2%
.989 -.019
-87 -.012
-502
.014
5/24/63 2%
.996 -.049
-21 -.053
-393 -.045
11/30/64 2%
.999 -.047
-28 -.021
-405 - .028
7/3/68
3%
.998 .109
63
-.049
8 - .035
9/26/80 2%
.993 - .038
-5
- .011 -1
.124
7/5/83 2%
.988 - .044
-54
.005
-1 .058
10/4/84 2%
.982 - .213
-11
.147
3 - .037
This case did see a rally back to upper band, before the decline.
3/14/85 2%
.998 -.162
-42
-.121 -3
-.182
8/6/85 2%
.984 -.029
-59 .09
-2 .124
4/26/91 2%
.994 -.021
-67 -
.022 -3 -.026
3/27/92 2%
.994 -.139
-128 - .062 -22 .131
3/20/97 6%
.982 -.342
-191
.008 -50
-.072
3/10/11 2%
983 -.242
59
.044 -154 - .033
----------------------------------------------------------------------------------------------------------------
17/22 16/22 19/22 13/22
Negative
Multiple BUY B11s Are Markers of Major Bull Markets
Since 1929, there have been 10 major bull markets which might have
been
recognized by the extended advances they made and a third Buy B11 without
as much as a 10% DJI decline occurring. The third Buy B11 averaged a gain
of 11.0%, although only 3 of the Buy B11s gained this much. The medium
gain was 7.35%. When the first or second Buy B11 shows a positive P-Indicator
and IP21, the average gain was 27.5% in 4 cases. In the two cases when both
the P-Indicator and IP21 were positive on the thrid Buy B11, the DJI subsequently
rose 11.1% from the third Buy B11..
Sets of Buy B11s in Major Bull Markets
Date
DJI
Gain P-I
P-I^^ IP21 V-I
OPct 65-day
Pct Change
----------------------------------------------------------------------------------------------------------------------------------
10/2/35
128.10
+10.8%
-10 -54
-.124 -159 +
.277 .07
1/21/36
143.5
+6.9%
+93 +416 .084
103 + .118 .049
8/21/36 160.8%
+5.5% -56 -248 -.144
-171 + .013 .073
8/26/42
105.6
+34.2%
+16 +81
.024 0 + .093
.014
9/11/42 106
+33.9% +27
+140 .073
0 + .083
.014
4/13/44 137.7
+7.4% -40 -213
-.124 -104 +
.076
-.006
8/4/44 145.3
+12.9%
-67
-353 -.187
-172 -.143
.051
lowest
8/24/44
147.1
+11.5% +25
+134 -.034 -15 + .058
.048
3/20/45 156.4
+4.9%
+127 +577
..069 +150 +.243
.036
12/21/45 189.10
+5.3% +24 +110
.083 -28
+.069 .075
8/30/54
341.3
+42.5%
-34
-112
.056 -207
+.022
.043
3/9/55 404.9
+21.4% -2
-4 -.061 -226 +.135 .03
8/22/55
452.6
+7.4% -104 -298
-.06
-313 -.012 .072
1/16/56 476.2
+8.9% -20 -64
-.183
-187 -.064
.078
11/25/58
540.50
+20.3%
25 +81
.039 -173 .249
.059
3/31/59 601.70
+8.1%
-30 -88
.007
-306 .271 .058
6/8/59
621.6
+4.6%
-112 -55
-.041
-484
.002 -.041
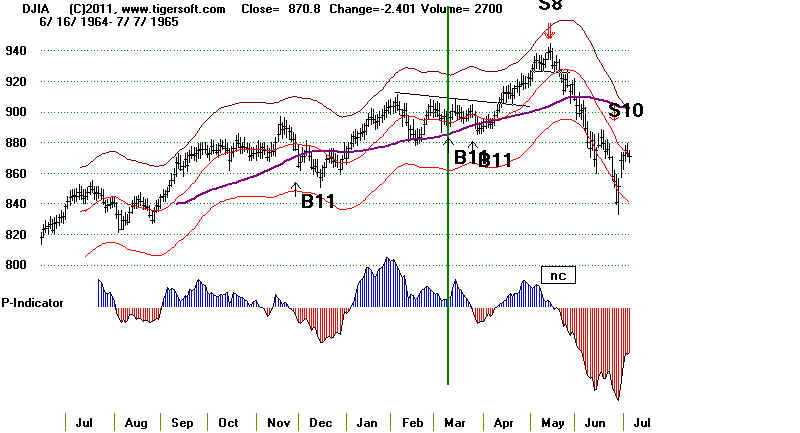
4/27/64
811.9
+ 21.1%
-44 -122
-.119
-545 .047 .035
11/10/64
870.6
-40
-109 .059 -500 -.184 .047
11/30/64
875.40
+7.3%
-28 -77 -.021 -405
.041 .045
3/10/65 892.40
+5.2%
41
-.077
3/25/65
898.30
+4.5% -10
-.073
6/8/83
1185.5
+4.9%
-37
.003
7/5/83
1208.53
+2.9%
-54
.005
11/3/83
1227.13
+4.0%
-132
.075
10/4/84
1187.57 +53.8% -11
.147
3/14/85
1260.05
+43.9% -111
-.089
3/29/85
1266.78 +44.1% -42
-.181
8/6/85
1325.16 +37.8% -59
.09
3/1/89
2243.04 +23.5%
-89
-.116
3/20/89
2262.5
+22.5% -75
.033
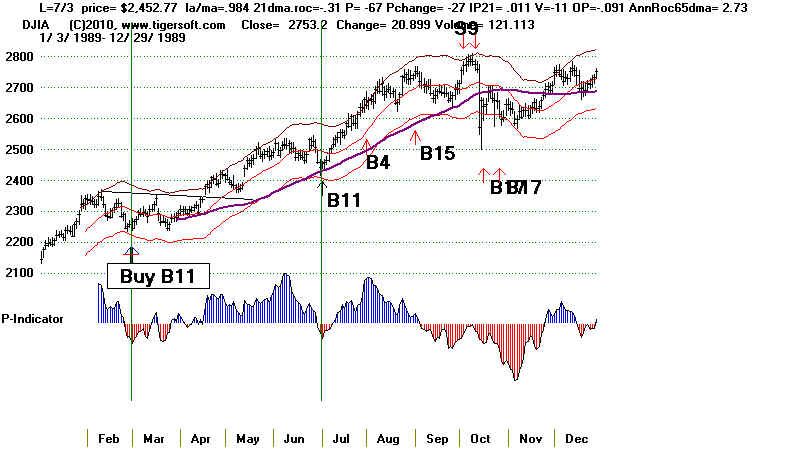
7/3/89
2452.77 +13.0% -67
.011
4/7/93
3397.77
+16.8% -77
- .028
4/23/93 3413.77
+16.2% -29
- .032
5/10/93
3443.28
+15.2% 51
.03
6/10/93 3491.72
+13.6% -69
.092
6/25/93 3490.89
+13.7% -33
-.033
9/9/93
3589.48
+10.3% 82
.081
8/18/95
4614.78
+20.2% 100
.005
10/30/95 4756.57
+16.7% -164 -226
.048 -43 -.062 .008
(
3/20/1997
6820.28
+0.2% -191
-223 .008 -50 -.072
.08
head and shoulders. Not in 3/2013
Peerless)
11/30/2010 11006.02
+13.0% -36
-.146
3/10/2011
11984.61
+ 59
.044
5/24/2011
12356.21
+26
.02
BUY B11s Average Gain by Month
Cases Avg.Gain
--------- --------------
January 2
7.9%
February 0
--------
March 14
14.4%
April 7
11.6%
May 3
12.9%
June 8
6.0%
July 3
5.2%
August 10
17.9%
September 6
9.9%
October 5
22.1%
November 5
13.6%
December 4
6.0%
==========================
67 Avg.=
In exceptionally strong markets, the same concept of a retreat to a rising 50-day ma works well.
See the 1953-1954 and 1995-1996 periods.
|
Reversing
Buy B11s There were only 5 reversing Buy B11s since 1928. All were profitable. The average gain was 8.9%. Note the signals' distribution by month: May 1 August 1 September 2 October 1 Reversing Buy B11s: 1928-2011 Date DJIA Pct. Gain Reversing Sell ---------------------------------------------------------------------------------------------------------------------- Buy B11 10/2/35 128.1 19.6% S15 2/18/36 3.1% Buy B11 9/16/36 165.2 4.6% S12 10/5/36 4.2% Buy B11 8/4/44 145.3 12.9% S9 5/15/45 -3.6% Buy B11 5/10/56 501.6 2.5% S2 8/2/56 10.0% Buy B11 9/26/80 940.1 4.9% S9 11/14/80 5.3% ---------------------------------------------------------------------------------------------------------------------------- N=5 Avg.= +8.9% |
BUY B11s - 1929-2011
Date DJIA Gain
-----------------------------------------------------------------------------------------------------------------------------------------------------
1. 10/2/35 128.10 +10.8% Reversing Buy.
LA/MA 21dmaROC P-I IP21 V OPct
.974 -.072 -10 -.124 -159 .281 Head/Shoulders was not completed.
Immediate rally. No paper loss.
2. 12/16/35 139.10 +10.3%
LA/MA 21dmaROC P-I IP21 V OPct
.968 .537 -51 -.224 -298 .018 Head/Shoulders was not completed.
Immediate rally. No paper loss.
3. 1/21/36 143.5 +6.9%
LA/MA 21dmaROC P-I IP21 V OPct
.996 -.381 +93 .084 104 .112
Immediate rally. No paper loss. Positive IP21 is bullish.
4. 8/21/36 160.8% +5.5%
LA/MA 21dmaROC P-I IP21 V OPct
.968 -.272 -56 -.144 -171 -.071
Immediate rally. No paper loss.
5. 9/16/36
165.2
+4.6% Reversing Buy
LA/MA 21dmaROC
P-I IP21
V
OPct
.994 -.014 +6
-.116
-62 -.026
Good signal but prices keep rising past
Sells because of flat topped breakout.
Immediate rally. No paper loss.
6. 12/9/38
146.10
+4.2%
LA/MA 21dmaROC P-I
IP21
V OPct
.98
-.592 -109 -.083 -195 -.142
No paper loss
7. 8/15/41 124.9
+3.1%
LA/MA 21dmaROC P-I
IP21
V OPct
.976 -.205
-4 -.017 -29
-.24
No paper loss.
8. 9/9/41 127.4
+1.1% CL/MA=1.00 (too high?)
LA/MA
21dmaROC P-I IP21
V
OPct
1.000 -.103 18
-.056 -16 -.174
Normally, we want to buy 2% to 3% below the 21-day ma to
have some
good upside potential. No paper loss.
9. 8/26/42
105.6
+34.2%
Next sell was on 6/7/1942 with DJI at 141.8
LA/MA 21dmaROC P-I
IP21
V OPct
.996 -.101
16
.024 -5
.094
No paper loss.
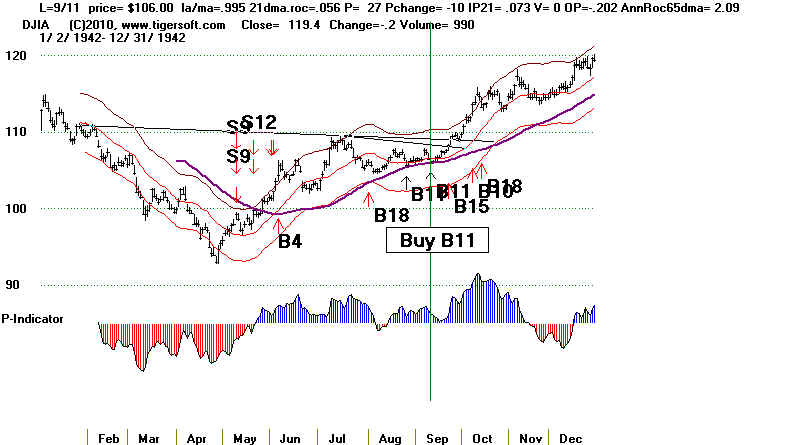
10. 9/11/42
106
+33.9%
LA/MA 21dmaROC P-I
IP21
V OPct
.995 .056
27 .073
0 .17
No paper loss.
11. 4/13/44
137.7
+7.4%
next Sell ... S2 - 6/21/1944 at 147.9
LA/MA
21dmaROC P-I IP21
V
OPct
.991 -.231 -40
-.124 -104 -.088
Paper Loss = 4%
12. 8/4/44
145.3
+12.9% next Sell ... S9 - 5/15/1945 at 164 Reversing Buy.
LA/MA 21dmaROC
P-I IP21
V
OPct
1.003 .041
25 -.034 -15 .113
Paper Loss = 2%
13. 8/24/44
147.1
1.003 (too high?) +11.5% next Sell... S9
- 5/15/1945 at 164
LA/MA
21dmaROC P-I IP21
V
OPct
1.003 .041
25 -.034 -15 .058
Paper Loss =
4%
14.
3/20/45
156.4
+4.9% Head and
Shoulders present.
LA/MA
21dmaROC P-I
IP21
V
OPct
.983 -.135
127 -.069
150 .143
H/S completed. Fell to
152.30 and then rallied. Paper
Loss = 2.5%
15. 12/21/45 189.10
+5.3%
LA/MA 21dmaROC
P-I IP21
V
OPct
.986 -.025
24 18 .083
-28 .069 No paper loss. DJI
rallied immediately.
16. 8/20/47
179.00
+3.0%
LA/MA
21dmaROC P-I
IP21
V
OPct
.983 .314
-43 -9 -.091 -90
-.196
DJI fell to 175 and then rallied. 2%
Paper Loss.
17. 3/9/50
202.3
+6.4%
LA/MA
21dmaROC P-I
IP21
V
OPct
.99 -.135
-34 -8 .128
-146 -.142 No paper loss.
18. 3/13/51
245.9
+11.5%
LA/MA
21dmaROC P-I
IP21
V
OPct
.974 -.348
-111 -59 -.024
-290 -.028
Rallied two days later. No paper loss. Next sell - S4 on 9/17/51 at 275.15
19. 8/30/54
341.3
+42.5%
LA/MA
21dmaROC P-I
IP21
V
OPct
.985 -.227
-34 -40 .056 -270 -.025
DJI fell to 335.80 and then rallied to 486 on 9/22/55. 2% Paper loss.
20. 3/9/55
404.9
+21.4%
LA/MA
21dmaROC P-I
IP21
V
OPct
.983 -.136
-2 -48 -.061
-226 .133
DJI fell to 391.40 and then rallied. 3% paper loss.
Next sell was on 3/6/56 at 491.4
21. 8/22/55
452.6
7.4%
LA/MA 21dmaROC
P-I IP21
V
OPct
.988
-.314 -104 -24
-.06 -313 -.012
DJI rallied
immediately.
22. 1/16/56
476.2
+8.9%
LA/MA 21dmaROC
P-I IP21
V
OPct
.986 -.113
-20 -11
-.183 -187 -.04
DJI fell to 462. 3% paper loss and DJI then rallied.
23. 5/10/56
501.60
+3.9% Reversing Buy
LA/MA 21dmaROC
P-I
IP21
V OPct
.995 -.259
-53
-41 -.173
-279 -.204
DJI fell to 468. 6% paper loss and DJI then rallied.
24. 6/24/57
497.10
+4.3%
LA/MA 21dmaROC
P-I IP21
V
OPct
.984 -.163
-126
-.031
-392 -.012
No paper loss. DJI rose immediately.
25. 11/25/58
540.50 +20.3%
LA/MA 21dmaROC
P-I IP21
V
OPct
.977 .022
25 -9
.039 -173
.249
No paper loss. DJI rose immediately.
26. 3/31/59
601.70
+8.1%
LA/MA
21dmaROC P-I
IP21
V
OPct
.988 -.035
-30 -10 .007 -306 .271
No paper loss. DJI rose immediately.
27. 6/8/59
621.6 +4.6%
LA/MA 21dmaROC
P-I
IP21
V OPct
.981 .004 -112 -55
-.041 -484 -.013
DJI fell to 617.60. 0.6% Paper Loss. DJI then rose.
28. 6/15/61
691.2
+ 3.5%
LA/MA 21dmaROC
P-I
IP21
V OPct
.989
-.019 -87 -32
-.012 -502 .014
DJI fell to 679.30. 2% Paper Loss. DJI then rose.
29. 6/24/63
718.4
- 2.4%
Head/Shoulders completed.
worn LA/MA 21dmaROC
P-I
IP21
V OPct
.996 -.049 -21 -1
-.053 -393
-.045
2.4% Paper Loss.
30. 4/27/64
811.9
+ 21.1%
LA/MA 21dmaROC
P-I IP21
V
OPct
.988
-.058 -44 -28
-.119 -545 .046
DJI fell to 805.50. Paper loss of 1%.
It then rallied to 938.3 on 5/13/65.
31. 5/18/64
821.3
+19.7%
LA/MA
21dmaROC P-I
IP21
V
OPct
.999
-.087 -65 -17
-.092 -644 - .138
DJI fell to 805.50. Paper loss of 1%.
It then rallied to 938.3 on 5/13/65..
32.
11/30/64 875.40
+7.3%
LA/MA 21dmaROC
P-I IP21
V
OPct
.999
-.047 -28 -28
-.021 -405 - .028
DJI fell to 860.10. Paper loss of 2%.
It then rallied.
33. 3/10/65 892.40
+5.2%
LA/MA 21dmaROC
P-I IP21
V
OPct
.999
-.073 41 12
-.077 -234
.035
DJI fell to 889.10. Paper loss of 0.3%.
It then rallied.
34. 3/25/65 898.30
+4.5%
LA/MA 21dmaROC
P-I IP21
V
OPct
1.0
.007 -10 -23
-.073 417 -
.059
DJI fell to 889.10. Paper loss of 0.3%. It then rallied.
35. 4/7/67
853.34
+4.0%
LA/MA 21dmaROC
P-I
IP21
V OPct
.99
.138
21 -16 -.059
-1 .105
DJI fell to 842.43.
Paper loss of 1%. It then rallied to upper band.
36. 7/3/68
903.51
-0.3%
LA/MA 21dmaROC
P-I IP21
V
OPct
.998
.109 63
22 -.049
8 - .035
DJI fell to 870.37.
Paper loss of 3%. It then rallied to upper band.
37.
10/26/70 756.43
+24.2%
LA/MA 21dmaROC
P-I
IP21
V OPct
.989
-.083 -103 -20
.016 -2
.062
DJI hesitated and
then rallied to 937.39 on 5/6/71. No paper loss.
38.
11/13/70 759.79
+23.4%
LA/MA 21dmaROC
P-I IP21
V
OPct
.995
- .126 -126 -34 -
.087 -2 .143
DJI hesitated and
then rallied to 937.39 on 5/6/71. No paper loss.
39. 9/26/80
940.10 +4.9%
LA/MA 21dmaROC
P-I
IP21
V OPct
.993
- .038 -5 -29
- .011 -1
.124
DJI fell to
921.93. 2% paper loss. DJI then rallied to upper band.
40. 6/8/83
1185.5
+4.9%
LA/MA 21dmaROC
P-I
IP21
V OPct
.981
- .42 -37 -39
.003
-5 -.012
DJI rallied
to upper band. No paper loss.
41. 7/5/83
1208.53
+2.9%
LA/MA 21dmaROC
P-I
IP21
V OPct
.988
- .044 -54 -57
.005
-1 .058
DJI fell to
1189.90. Paper loss was 2%. DJI then rallied to upper band.
42. 11/3/83
1227.13
+4.0%
LA/MA 21dmaROC
P-I
IP21
V OPct
.981
- .219 -132 -28
.075
-10 .13
DJI fell to
1214.94. Paper loss was 1%. DJI then rallied to upper band.
43. 10/4/84
1187.57
+53.8%
LA/MA 21dmaROC
P-I
IP21
V OPct
.982
- .213 -11 21
.147
3 - .037
DJI fell to
1189.90. Paper loss was 2%. DJI then rallied to 1825.89 pm 4/29/86
44 3/14/85
1260.05
+43.9%
LA/MA 21dmaROC
P-I IP21
V
OPct
.984 -.154 -111
-6 -.089 -8 -.183
DJI fell . 2% Paper Loss. DJI then rose to 1825.89 on 4/29/85.
45 516/1986
1759.80 +6.7%
LA/MA 21dmaROC
P-I IP21
V
OPct
.976 -.627
-158 -36 -.031
-18 -.243
Two days later,
DJI rose to 1878.28 on 4/29/86.
46
3/29/85 1266.78
+44.1%
LA/MA 21dmaROC
P-I IP21
V
OPct
.998 -.162
-42 -6 -.121
-3 -.182
DJI fell . 2% Paper Loss. DJI then rose to 1825.89 on 4/29/85.
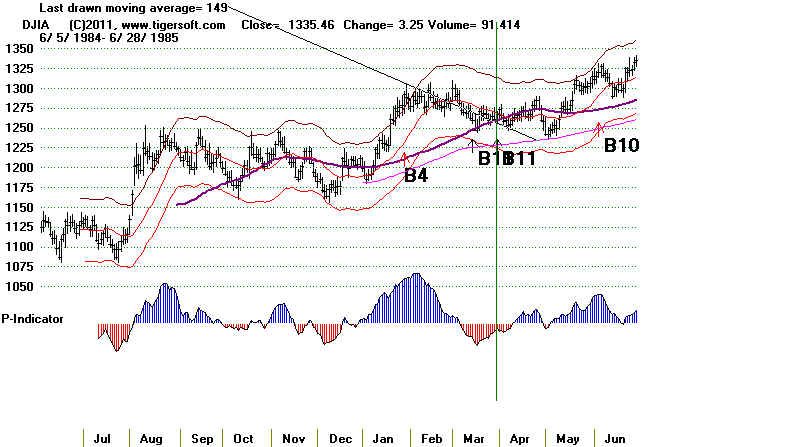
46. 8/6/85
1325.16
+37.8%
LA/MA 21dmaROC
P-I
IP21
V OPct
.984 -.029
-59 -29 .09
-2 .124
DJI fell to
1300.40. 2% Paper Loss. DJI then rose to 1825.89 on 4/29/85.
47. 3/1/89
2243.04
+23.5%
LA/MA 21dmaROC
P-I
IP21
V OPct
.974 -.512
-89 -29 -.116
-9 -.228
DJI reversed
upwards immediately. DJI rose to 2771.09 on 10/4/89.
48. 3/20/89
2262.5
+22.5%
LA/MA 21dmaROC
P-I
IP21
V OPct
.989 -.254 -75
-49 .033
-8 .145
DJI fell to
2257.86. 0.3% Paper Loss. DJI rose to 2771.09 on 10/4/89.
49. 7/3/89
2452.77
+13.0%
LA/MA 21dmaROC
P-I IP21
V
OPct
.984 -.31
-67 -27 .011
-11 -.091
DJI rose immediately.
No Paper loss.

50. 4/26/91
2912.38
+13.5%
LA/MA 21dmaROC
P-I IP21
V
OPct
.994 -.021
-67 -18 - .022
-3 -.026
DJI fell to 2865 and
then rose to 3306.13 on 4/14/92. 2%
paper loss.
51.
3/12/92
3208.63
+3.0%
LA/MA 21dmaROC
P-I IP21
V
OPct
.986 -.157
-151 -27 - .053
-28 -.263
DJI fell to 3181.35
and then rose. 0.6% paper
loss.
52.
3/27/92
3231.44 +2.3%
LA/MA 21dmaROC
P-I IP21
V
OPct
.994 -.139
-128 -43 - .062
-22 .131
DJI fell to 3181.35
and then rose. 2% paper
loss.
53.
4/7/93
3397.77
+16.8%
LA/MA 21dmaROC
P-I IP21
V
OPct
.998 -.26 -77
-5 - .028
-29 .002
DJI rose
immediately. No paper loss. Next sell at 3967.66 on 2/3/94
54. 4/23/93
3413.77
+16.2%
LA/MA 21dmaROC
P-I IP21
V
OPct
.995 -.11 -29
-16 - .032
-28 .006
DJI rose
immediately. No paper loss. Next sell at 3967.66 on 2/3/94
55. 5/10/93
3443.28
+15.2%
LA/MA 21dmaROC
P-I IP21
V
OPct
1.002 -.162 51 6
.03
-7 .025
DJI rose
immediately. No paper loss. Next sell at 3967.66 on 2/3/94
56. 6/10/93
3491.72
+13.6%
LA/MA 21dmaROC
P-I IP21
V
OPct
.995
.078 -69 -22
.092
-9 .133
DJI fell to
3449.92. 1% Paper Loss Next sell at 3967.66 on 2/3/94
57. 6/25/93
3490.89
+13.7%
LA/MA 21dmaROC
P-I IP21
V
OPct
.993
-.167 -33 -15
-.033 -22
.108
DJI fell to
3449.92. 1% Paper Loss. Next sell at 3967.66
on 2/3/94
58. 9/9/93
3589.48
+10.3%
LA/MA 21dmaROC
P-I
IP21
V OPct
.993
.055 82
9 .081
-2 .242
DJI fell to
3537.23. Paper loss = 1.5%. DJI then rallied to next Sell at 3967.66 on 2/3/94
59. 10/4/94
3801.13
+3.2%
LA/MA 21dmaROC
P-I IP21
V
OPct
.991 -.259
-262 -52 -.047
-43 -.106
DJI fell to
3797.43. Paper loss = 0%. DJI then rallied ro resistance.
60. 8/18/95
4614.78
+20.2%
LA/MA 21dmaROC
P-I
IP21
V OPct
. 988 -.061
100 -20
.005
1 -.249
DJI
fell slightly for a week and then rose. 0.4% Paper Loss. Next
Sell on 2/27/96 at 5549.21.
61. 10/30/95
4756.57 +16.7%
LA/MA 21dmaROC
P-I
IP21
V OPct
. 999 -.081
-164 -19
.048 -43 -.062
DJI
rose immediately. No paper loss. Advanced until next Sell on 2/27/96 at 5549.21.
62.
3/20/1997
6820.28
+0.2% Note head
and shoulders.
LA/MA 21dmaROC
P-I
IP21
V OPct
.982 -.342
-191 -30 .008
-50 -.072
DJI
declined to 6391.69. 6.3% Paper
Loss. Note the head/shoulders pattern
that was
completed soon after the Buy B11. DJI then rallied to Sell S9 at upper band.
63 . 6/15/1999
10594
+2.5%
LA/MA 21dmaROC
P-I
P-I^^
IP21
V OPct
.991 -.354 -136 +96
-136 -.045
-76 -.144
DJI rose immediately. No Paper Loss.
64. 12/26/02
8432.61
+4.0%
LA/MA 21dmaROC
P-I
IP21
V OPct
.981 -.576 50 +5
-.068
210 -.334
DJI rose immediately. No Paper Loss.
65. 9/25/03
9343.95
+4.9%
LA/MA 21dmaROC
P-I
IP21
V OPct
.984 .004 300 -66
.023
-29 .035
DJI fell to 9275.06. 1% Paper
Loss. DJI then rallied to sell at
upper band and Sell.
66. 4/13/06
11137.65
+4.0%
LA/MA 21dmaROC
P-I
IP21
V OPct
.994 -.077 -107
-62 -.116 -123 .051
DJI fell to 11074. 0.5% Paper
Loss. DJI rallied to upper band
and Sell.
67. 11/30/2010
11006.02
+13.0%
LA/MA 21dmaROC
P-I
IP21
V OPct
.983 -.12 -36
-72 -.146
-108 .002
DJI rose immediately. As of 5/27/2011 with DJI at 12441.58, there is no
reversing Sell.
68 3/10/2011
11984.61
open ...
LA/MA 21dmaROC
P-I IP21
V
OPct
983
-.242 59
-139
.044
-154 - .033
DJI fell 2% and then rallied. 2% Paper
Loss.
As of 5/27/2011 with DJI at
12441.58, there is no reversing Sell.
69 5/24/2011
12356.21
open ...
LA/MA 21dmaROC
P-I IP21
V
OPct
.978 -.117 26 0
.02
-119 .022
DJI rose immediately. No paper loss.
As of 5/27/2011 with DJI at
12441.58, there is no reversing Sell.