BUY B15 Steadily Rising 21-day MA for 40 or more Straight Days
December Peerless 2013 version - December 9, 2013
(C) 2013 William Schmidt, Ph.D.
There have been 24 of the December Peerless-2013 Buy B15s. All were profitable.
Their average gain from 1928 to 2013 was 10.8%. The biggest gains generally
came in the 2nd and 3rd Years in the Presidential 4-Year cycle. The smallest gains
came in the year after the Presidential Election, only 7.6%. Except for August, there
are no Buy B15s from May to October.
Size of Gains
   >10%          9
   5% - 9.99%    5
   2% - 4.99%    9
   0% - 1.99%    1
   Losses        0
BUY B15s: 1928-2013 19360120 B15 144.1 .084
1.002 .331 92 -12 411 .08 100 .046 .067
X 19360806 B15 161.9 .143
19430302 B15 126.7 .124
1.01 .393 94 -22 480 .131 107 .246 .123
------------------------------------------------------------------------
19451121 B15 189.5 .051 fell to 187.8
1.005 .265 90 -3 411 .163 85 -.032 .149
------------------------------------------------------------------------
A19470327 B15 179.2 sell 184.4 fell to 163.6
1.014 .135 91 58 381 .11 55 .215 .01
------------------------------------------------------------------------
19580211 B15 442.4 .470 fell to 436.9
.986 .072 122 -27 387 .035 144 -.032 .007
------------------------------------------------------------------------
19580820 B15 504 .290 no paper loss
.998 .215 67 4 214 .138 22 .241 .105
------------------------------------------------------------------------
19590126 B15 592.4 .098 fell to 574.5
1.004 .526 137 2 406 .112 164 .416 .088
------------------------------------------------------------------------
X 19610118 b15 634.1 .106
------------------------------------------------------------------------
19610207 B15 643.9 .089 fell to 637.00
1.008 .364 134 -20 390 .117 180 .148 .094
------------------------------------------------------------------------
19610315 B15 662.9 .058 no paper loss
1.005 .468 113 15 328 ,19 92 .331 .085
------------------------------------------------------------------------
X19650325 B15 813.2 .045
------------------------------------------------------------------------
19710118 B15 847.82 .106 no paper loss
1.016 .411 308 17 653 .087 1 .456 .111
------------------------------------------------------------------------
19710329 B15 903.48 .038 no paper loss
.999 .136 60 10 127 .131 0 .237 .158
------------------------------------------------------------------------
A19760226 B15 728.1 .188 no paper loss
1.012 .588 114 .47 217 .097 1 .195 .196
------------------------------------------------------------------------
19750316 B15 764.0 .132 fell to 742.88
1.01 .435 89 -9 169 .053 0 .192 .301
------------------------------------------------------------------------
19760227 B15 972.61 .038 no paper loss
1.001 .261 151 -8 280 .024 2 .232 .15
------------------------------------------------------------------------
X19790315 B15 847.02 .046
19800826 B15 953.41 .035 fell to 924.49
1,007 .352 80 -10 155 .104 2 .112 .116
---------------------------------------------------------------------
19860116 B15 1230.68 .048 no paper loss
1.02 .542 245 11 485 .101 9 -.027 .04
---------------------------------------------------------------------
X19860403 B15 1766.40 .034
19870227 B15 2223.99 .082 no paper loss
1.012 .329 102 -4 201 .065 7 .078 .166
-------------------------------------------------------------------
A19870313 B15 2258.66 .065 fell to 2248.44
1.009 .462 63 -32 125 .046 8 .167 .178
-------------------------------------------------------------------
19890821 B15 2647.00 .047 no paper loss
.997 .195 36 -11 62 .085 8 .155 .073
-------------------------------------------------------------------
19920210 B15 3245.08 .033 fell to 3181.35
1.001 .168 75 39 146 .027 0 .025 .068
--------------------------------------------------------------------
A19950125 B15 3871.45 5549.21 fell to 3832.08
1.00 .117 74 -2 102 .061 -5 -.151 -.006
--------------------------------------------------------------------
19950417 B15 4159.38 .333 no paper loss
1.009 .362 111 -30 154 .064 9 .324 .087
--------------------------------------------------------------------
A19970124 B15 6696.48 .024
1.005 .311 188 -60 230 .091 12 .195 .104
-------------------------------------------------------------------
19980327 B15 8796.08 .043 no paper loss
1.012 .419 161 -43 246 .122 24 .148 .124
------------------------------------------------------------------
19990514 B15 10913.32 .02 fell to 10490.51
1.008 .497 15 -106 214 .06 11 .243 .189
-----------------------------------------------------------------------
20061031 B15 12080.73 .026 fell to 11986.28
1.009 .409 531 17 489 .207 47 .342 .08
Note S19 on 1/5/2007.
-----------------------------------------------------------------------
20120229 B15 12952.07 .013 fell to 12759.15
.988 -.095 -85 -204 -85 .037 -92 .052 .059
unique negative readings here.
--------------------------------------------------------------------
No.= .108
PE     6    .093
PE+1   6    .076
PE+2   4    .211
PE+3   8    .120
January 6 .093 February 6 .121 March 5 .077 April 2 .184 May -- ---- June -- ---- July -- ---- August 4 .129 September-- ---- October -- ---- November 1 .051 December - --- 1-10 4 .100 11-20 6 .157 21-30 12 .079 |
=====================================================
Steady Momentum Up, Shown by 40 or More Straight Rising
Days for 21-day MA and/or 65-Day ma.
Updated 9/7/2009
The Peerless Buy B15 brings
gains on average about 6%. There have been XXX of B15s
since 1928. Only one produced a
small loss, about 1%, at the time the signal was reversed.
That would have been prevented watching for the
development of a head and shoulders
pattern. In only 2 cases did the
DJI fall as much as 6% after a Buy B15, but never more
than 7% before rallying. So,
B15 rallies are quite reliable.
What stands out, is how the DJI nearly always rallies past the first tagging of the upper
band after
a Buy B15. Only a Sell S9/S12 or a
head and shoulders pattern seems to prevent such a bullish outcome.
Do
nor employ a Buy B15 within 10 trading days of another Peerless Sell.
Examples: 2/16/1946 . There
had been a Sell S8 on 2/5/1946.
9/25/1967. There had been a Sell S12 on 9/14/1967.
3/11/2005. There had been a Sell S15 on 3/4/2005
Do not employ a Buy B15 unless the DJI is less than 2.3% over the 21-day ma but not more
than .
2% below the lower band.
Example - 9/1/33 CL/MA = 1.045 ... In this case a Sell S9 would have
closed out the trade with a 1.5% gain.
The P-Indicator bearishly stood at only +19 despite the DJI being
above the upper 3.5% band. If the
IP21 is below -.06, look for a pullback just below the 21-day ma and
expect only a small rally. See the
cases of 9/8/1936 and 3/8/1985. Another example - 9/9/1955.
There are a
few cases of Buy B15s where the DJI's 21-day ma has not been rising 40 straight days.
See 9/23/42 for example. In these
cases, the 65-day ma has been rising more than 40 straight days AND
the 21-day ma is above its levels five,
10, 15, 20, 25 and 30 days before. In this case, note that the IP21 was a very
high +.163
and the Opct was +.283 .
Eliminate
Buy B15s in late September, after the 23rd. Too often there is a steep decline in
October.
The case of 9/27/1951 is an example.
occurs when the DJI's 21-day ma rises 39 days in a row with reasonably good internals. In the table
below you can see the internals we look at. They are:
1) CL/MA - the DJI's close divided by its 21-day ma value.
2) ANN ROC - the annualized rate of change of the 21-day ma.
3) P-Indicator - based on NYSE advances and Seclines
4) Daily chamge of P-I.
5.) Current Accumulation Index value - also originally called "IP21"
6) V-Indicator - based on Adjusted NYSE Up volume minus Down Volume.
7) OPct - base don daily OBV.
Buy B15s 1929-2009
Date DJI Gain
LA/MA Ann.Roc P IP21 V-I OPct.
----------------------------------------------------------------
9/5/1935 +4.6% Gain = +2.9%
129.3 1.014 .346 46 19 .024 -11 .345|
Immediate rally to upper band.
------------------------------------------------------------
(9/8/1936 169.69 +1.9%
1.021 .115 11 -9 -.126 -51 .171
DJI fell back to 165.20 before rallying to upper band S9/S12
0n 10/5/1936 at 172.80.)
------------------------------------------------------------
9/23/1942 108.30 +30% approximately.
1.015 .112 23 9 .163 -2 .283
DJI immediately rallied to 6/7/1943 with the DJI at 141.80
-----------------------------------------------------------
3/3/1943 130.00 +9.1%
1.019 .43 102 7 .157 135 .197
DJI immediately rallied past first tagging of the upper band.
------------------------------------------------------------
9/23/1949 Gain +18.8%
181.3 1.006 .165 86 8 .127 51 .145
Immediate strong rally up to Sell S9 at 215.30 on 4/14/1950
------------------------------------------------------------
2/17/1950 Gain +6.0%
203.20 1.007 .219 15 16 .189 -75 .21
Immediate rally up to Sell S9 at 215.30 on 4/14/1950
-----------------------------------------------------------
2/26/1951 Gain +6.6%
253.20 1.006 .417 33 3 .142 62 .203
Not reversing signal.
DJI fell to 243. Paper loss of 4%.
------------------------------------------------------------
3/2/1954 Gain = +0.7%
297.50 1.017 .208 63 -3 .135 0 .034
Not reversing signal.
------------------------------------------------------------
9/2/1958 511.80 +20% approx.
1.008 .15 31 -5 .096 -94 .334
Immediate rally. S8 should not have been taken in September
as this was an all-time high. DJI rallied to 624.1 on 4/17/1059
------------------------------------------------------------
3/17/1959 Gain +6.1%
611.8 1.013 .487 104 3 .115 83 .546
DJI declined to 601.70 on 3/31/1959 and then rallied to S9 at upper band.)
start here
---------------------------------------------------------------
2/7/1961 643.9 +7.4%
1.008 .364 134 -20 .117 180 .143
Declined to 637 on 2/13/1961 and then rally beyond firsttagging of upper band,
-----------------------------------------------------------
3/1/1961 663 +7.9%
1.019 .227 115 -23 .131 130 .1836263
Declined only to 662.90 on 3/15/61 and then rallied past first tagging of the upper band.
-----------------------------------------------------------
2/27/1963 670.8 +10.4%
.985 -.211 -43 -24 .06 -367 .099
Declined to 659.70 on 3/1/1963 and then rallied past first tagging of the upper band.
-----------------------------------------------------------
(4/8/1963 706.00
1.035 .588 91 6 .097 99 .48
DJI declined to 687.80 on 7/23/1964 and then rallied. )
-----------------------------------------------------------
2/17/1964 796.20 +6.3%
1.013 .311 1 1 .013 -305 .336
Immediately rallied...
-----------------------------------------------------------
3/23/65 898.70 +4.5%
1.001 .174 23 -11 -.02 0265 .407
DJI declined to 809.10 on 3/30/65 and rallies to Sell S9.
-----------------------------------------------------------
(3/23/67 876.67
1.029 .456 56 15 .005 9 .335
DJI declined to 847.66 on 4/11/67 and then rallied to upper band and S12.
This B15 occurred just four days after Sell S12.)
------------------------------------------------------------
(9/25/67 943.08
1.03 .582 78 16 .06 8 .45
DJI declined to 849.57 on 11/8/67.
This B15 occurred a week after a Sell S12.)
------------------------------------------------------------
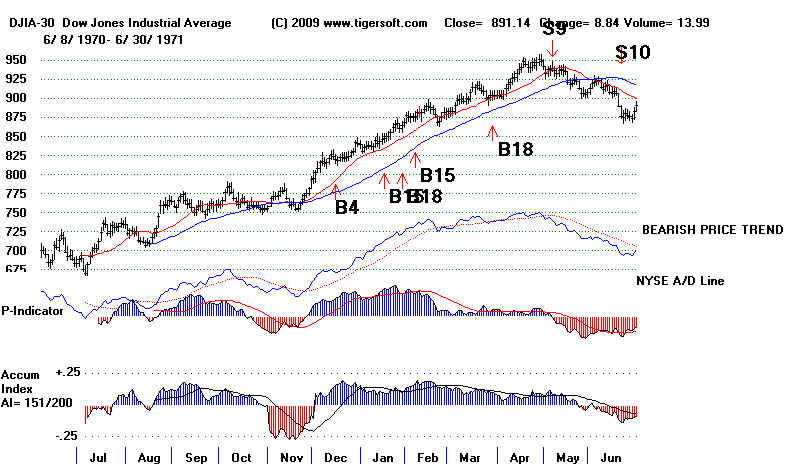
1/18/1971 847.82 +10.6%
1.021 .326 243 -24 .096 1 .464
Immediately rallied past first tagging of the upper band.
-----------------------------------------------------------
2/5/1971 876.57 +6.9%
1.022 .539 253 4 .162 2 .51
DJI declined to 870 on 2/23/1971 and rallied past the first tagging of the upper band.
-----------------------------------------------------------
3/2/72 933.77 +1.0%
1.018 .416 56 -2 .038 0 .177
DJI rallied to upper band and S4.
------------------------------------------------------------
2/26/75 728.1 Big Gain!
1.012 .588 114 -47 .097 1 .19
DJI immediately rallied to 877.42 on 7/1/75
------------------------------------------------------------
3/24/75 743.43 Big Gain!
.982 -.10 -6 -70 .03 -1 .024
DJI immediately ra;;ied.
------------------------------------------------------------
3/1/1976 975.36 +3.5%
1.003 .081 116 -36 -.004 1 .214
DJI immediately ra;;ied to upper band and S9/S127475
-----------------------------------------------------------
4/11/1979 871.71 +1.0%
1.01 .342 99 -39 -.008 2 .095
DJI declined to 822.33 on 5/31/1979 and then rallied past recent high.
Note the completion of a head and shoulders pattern gave warning to the coming of
this decline. So did the NYSE A/D Line trend-break. 6% decline first.
-----------------------------------------------------------
9/2/1980 940.78 +4.8%
.993 .117 16 25 .047 2 .101
DJI went sidewise until reversing sell. The lowest close in this period
was 817.75 on 10/30/1980.
-----------------------------------------------------------
3/23/1983 1140.87 +9.0% Rallied to S9 on 7/26/1983
1.015 .642 146 53 .07 6 .277
DJI declined to 1130.49 on 4/6/1983and then rallied past the first tagging of the upper band.
-----------------------------------------------------------
3/6/1985 1280.37 +6.5% Rallied to 1354.73 S9 on 10/14/1985
.997 -.09 7 -46 -.062 -1 -.111
DJI declined to 1242.05 on 5/1/1983 and then rallied past first tagging of the upper band.
3% decline first
------------------------------------------------------------
(2/26/85 1696.9 +7.6%
1.041 1.169 270 =11 .259 17 .424
DJI declined to 1686.66 on 3/5/1986 and then rallied.)
-----------------------------------------------------------------
2/27/1987 2223.99 +5.3%
1.012 .329 102 -4 .065 7 .076
DJI immediately rallied rallying past false S8 (which cannot occur at or near an all-time high)
and was reversed by Sell S9/S12 on 5/6/1987 with DJI at 2342.19.
--------------------------------------------------------------------
3/2/1987 2220.47 +5.5%
1.009 .327 105 3 .066 8 .091
DJI immediately rallied rallying past false S8 (which cannot occur at or near an all-time high)
and was reversed by Sell S9/S12 on 5/6/1987 with DJI at 2342.19.
--------------------------------------------------------------------
4/18/1989 2379.40 Big Rally - to 2771.09 on 10/4/1989
1.036 .453 83 85 .084 9 .249
DJI declined to 2376/47 on 5/8/1989 abd then rallied to 2771.09 on 10/4/1989
--------------------------------------------------------------------
9/1/1989 2752.09
1.02 .418 48 10 .158 13 .311
DJI declined to 2659.19 (4% paper loss) and then rallied to Sell S9 at upper band.
--------------------------------------------------------------------
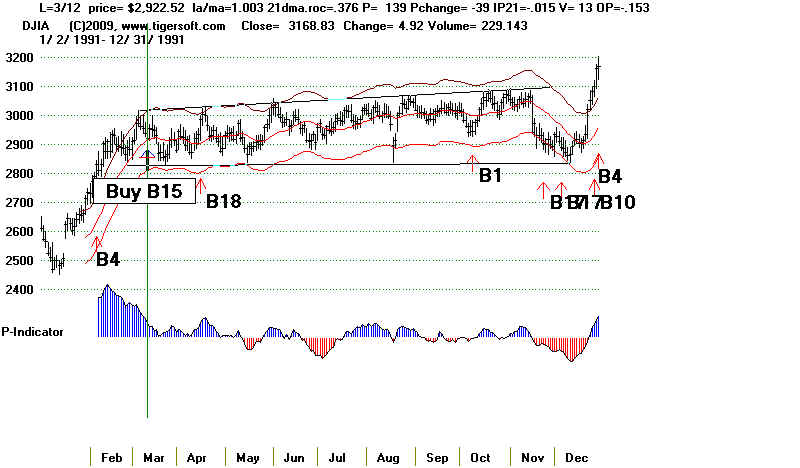
3/12/1991 2922.52
1.003 .376 139 -39 -.015 13 -.154
DJI declined to 2858.91 and went sidewise for 9 months.
 --------------------------------------------------------------------
2/10/1992 3245.0 +1.9%
1.001 .168 75 39 .027 0 .025
DJI went sidewise, falling to a low of 3224.96 before rallying to a Sell S9 at the upper band.
--------------------------------------------------------------------
3/2/1993 3400.53 +2.9%
1.01 .32 142 20 .101 -4 .181
DJI declined to 3379.19 on 4/5/1993 and rallied beyond Sell S15 at 3500.03 on 5/19/93.
The B15 might be assumed to be too strong to use the S15.
--------------------------------------------------------------------
3/26/1993 3439.98 +1.7%
1.001 .26 104 -20 .09 0 .162
DJI declined to 3379.19 on 4/5/1993 and rallied beyond Sell S15 at 3500.03 on 5/19/93.
The B15 might be assumed to be too strong to use the S15.
--------------------------------------------------------------------
9/1/1993 3645.10 +9% approx.
1.012 .277 151 03 .116 8 .252
DJI fell to 3537.23 on 9/21/1993 and rallied to 3967.66 on 2/3/1994.
--------------------------------------------------------------------
4/3/1995 4168.41 +31% gain ... 5458.53 S1 on 2/29/1996199
1.022 .523 67 11 .117 9 .419
DJI immediately rallied. Note that the S8s do not count when the DJI is near an
all-time high. The next Sell, a Sell S1, was at 5458.53 on 2/28/1996
--------------------------------------------------------------------
9/22/1995 4764.15 Big Gain 6468.53
1.014 .455 125 -15 .135 2 .118
DJI fell to 5703.82 on 10/26/1995 and then rallied to 6468.53 on 2/28/1996
---------------------------------------------------------------------
2/13/1996 5492.12 -0.6%
1.049 .825 158 37 .302 28 .336
DJI rallied 5% but the next sell was a Sell S1. on weakness below Buy point.
-----------------------------------------------------------------------
2/24/97 7008.20 -2.5%
1.022 .429 99 35 .097 -7 .043
DJI declined to 6391.69 after completing a head and shoulders top with no
Peerless Sell signal and then rallied stongly, but had to be sold because
of an errant S89 on 4/22/97 at 6833.59.
----------------------------------------------------------------------
3/26/1998 8846.83 +3.8%
1.019 .535 204 -51 .159 34 .23
DJI fell to 8782.12 on 3/30/1998 and then rallied past the first tagging of the upper band.
---------------------------------------------------------------------
9/2/2003 9523.27 +2.9%
1.024 .474 402 134 .177 101 .41
DJI fell to 9275.06 on 9/30/2003 and then rallied past the upper band and Sell S4
on 10/15/2003. The P-Indicator stood at 305 then, which should have made the S4
dubious.
---------------------------------------------------------------------
3/1/2004 10678.14 -1.1%
1.007 .189 270 120 .039 -18 -.03
Fell to 9906.91 on 5/17/2004. The B15 should not be used only two weeks after a
Sell S9. The program will add this condition. 7% decline first
---------------------------------------------------------------------
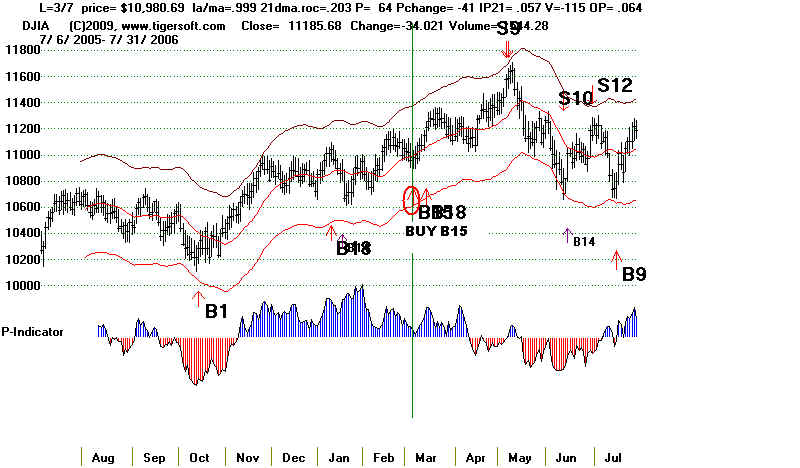
3/11/2005 10774.36
.997 .122 22 16 -.002 -83 .045
DJI fell to 10012.36 on 4/20 and then rallied. This B15 occurred a week
after a Sell S15 and so should not be allowed or have been taken.
---------------------------------------------------------------------
3/7/2006 10980.69 +5.4%
.999 .203 64 -41 .047 -115 .064
DJI immediately rallied to upper band and S9 on 5/5/2009.
---------------------------------------------------------------------
9/1/2009 9310.60 No closed out.
.993 .031 78 -194 .031 -8 .077
=========================================================================
=========================================================================
Number of Completed Trades = Avg. Gain= %
BAD or ELIMINATED B15s
9/14/1933 Gain = +0.6%
104.70 1.031 .953 7 .23 -61 .177
Not a reversing signal. No Paper Loss
This was reversed a day later.
-------------------------------------------------------------
3/3/1936
156.20 1.026 .525 38 13 .014 -109 .022
------------------------------------------------------------
3/1/1945 160.70
160.70 1.023 .501 148 9 .263 197 .568
This was not a reversing Buy45
This occurred near short-term top. DJI fell 5% to 152 before rallying.
-------------------------------------------------------------
9/9/1955 474.6
1.026 (Too high) .627 1-3 3 .119 69 .225
DJI rallied past the upper band but then fell to 438.60 on
Eisenhower's heart attack.
------------------------------------------------------------
--------------------------------------------------------------------
2/10/1992 3245.0 +1.9%
1.001 .168 75 39 .027 0 .025
DJI went sidewise, falling to a low of 3224.96 before rallying to a Sell S9 at the upper band.
--------------------------------------------------------------------
3/2/1993 3400.53 +2.9%
1.01 .32 142 20 .101 -4 .181
DJI declined to 3379.19 on 4/5/1993 and rallied beyond Sell S15 at 3500.03 on 5/19/93.
The B15 might be assumed to be too strong to use the S15.
--------------------------------------------------------------------
3/26/1993 3439.98 +1.7%
1.001 .26 104 -20 .09 0 .162
DJI declined to 3379.19 on 4/5/1993 and rallied beyond Sell S15 at 3500.03 on 5/19/93.
The B15 might be assumed to be too strong to use the S15.
--------------------------------------------------------------------
9/1/1993 3645.10 +9% approx.
1.012 .277 151 03 .116 8 .252
DJI fell to 3537.23 on 9/21/1993 and rallied to 3967.66 on 2/3/1994.
--------------------------------------------------------------------
4/3/1995 4168.41 +31% gain ... 5458.53 S1 on 2/29/1996199
1.022 .523 67 11 .117 9 .419
DJI immediately rallied. Note that the S8s do not count when the DJI is near an
all-time high. The next Sell, a Sell S1, was at 5458.53 on 2/28/1996
--------------------------------------------------------------------
9/22/1995 4764.15 Big Gain 6468.53
1.014 .455 125 -15 .135 2 .118
DJI fell to 5703.82 on 10/26/1995 and then rallied to 6468.53 on 2/28/1996
---------------------------------------------------------------------
2/13/1996 5492.12 -0.6%
1.049 .825 158 37 .302 28 .336
DJI rallied 5% but the next sell was a Sell S1. on weakness below Buy point.
-----------------------------------------------------------------------
2/24/97 7008.20 -2.5%
1.022 .429 99 35 .097 -7 .043
DJI declined to 6391.69 after completing a head and shoulders top with no
Peerless Sell signal and then rallied stongly, but had to be sold because
of an errant S89 on 4/22/97 at 6833.59.
----------------------------------------------------------------------
3/26/1998 8846.83 +3.8%
1.019 .535 204 -51 .159 34 .23
DJI fell to 8782.12 on 3/30/1998 and then rallied past the first tagging of the upper band.
---------------------------------------------------------------------
9/2/2003 9523.27 +2.9%
1.024 .474 402 134 .177 101 .41
DJI fell to 9275.06 on 9/30/2003 and then rallied past the upper band and Sell S4
on 10/15/2003. The P-Indicator stood at 305 then, which should have made the S4
dubious.
---------------------------------------------------------------------
3/1/2004 10678.14 -1.1%
1.007 .189 270 120 .039 -18 -.03
Fell to 9906.91 on 5/17/2004. The B15 should not be used only two weeks after a
Sell S9. The program will add this condition. 7% decline first
---------------------------------------------------------------------
3/11/2005 10774.36
.997 .122 22 16 -.002 -83 .045
DJI fell to 10012.36 on 4/20 and then rallied. This B15 occurred a week
after a Sell S15 and so should not be allowed or have been taken.
---------------------------------------------------------------------
3/7/2006 10980.69 +5.4%
.999 .203 64 -41 .047 -115 .064
DJI immediately rallied to upper band and S9 on 5/5/2009.
---------------------------------------------------------------------
9/1/2009 9310.60 No closed out.
.993 .031 78 -194 .031 -8 .077
=========================================================================
=========================================================================
Number of Completed Trades = Avg. Gain= %
BAD or ELIMINATED B15s
9/14/1933 Gain = +0.6%
104.70 1.031 .953 7 .23 -61 .177
Not a reversing signal. No Paper Loss
This was reversed a day later.
-------------------------------------------------------------
3/3/1936
156.20 1.026 .525 38 13 .014 -109 .022
------------------------------------------------------------
3/1/1945 160.70
160.70 1.023 .501 148 9 .263 197 .568
This was not a reversing Buy45
This occurred near short-term top. DJI fell 5% to 152 before rallying.
-------------------------------------------------------------
9/9/1955 474.6
1.026 (Too high) .627 1-3 3 .119 69 .225
DJI rallied past the upper band but then fell to 438.60 on
Eisenhower's heart attack.
------------------------------------------------------------