---------------------------------------------------------------------------------------------------------------------------------------------------------
DJI Rockets Up Past Upper Band with either
Very Positive P-Indicator Readings or
Sharply Improving Accumulation Index Readings.

There have been 56 cases of a Peerless Buy B4 since 1928.
The average gain was 8.5%. 3 of the 56 would have resulted in a loss. The biggest
average gain for the Buy B4s occurred in the Year of Mid-Term Elections and
during the first 10 days of the month.
Size of Buy B4 Gains
>.10 16 28.6%
.05 - .10 12 21.4%
.02 - .0499 17 30.4%
0-.0199 8 14.3%
<0 3 5.4%
------------------------------------
56

Type-2 Buy B4s
In mid-2013, I discovered that DJI take-offs, as with stocks, often occur when
there is a rapid improvement in the Accumulation Index and the DJI surpasses
its normal 3.5% upper band. All the Buy B4s before 1942 were of this new type.
There have been 16 instances when this new Buy B4s (marked as "Type 2) would
have appeared. 11 of the 16 occurred since 1945. These Type-2 Buy B4s
averaged gains of 6.4%. Their trading results were held back a lot by allowing
between January and April. You can see below how low their trading gains were
compared to those Buy B4s in the 2nd year of the Presidential cycle or Novembers.:
Type-2 Buy B4s' Success Varies Widely
Jan 2 .019 low
Feb 1 .017 low
Mar 0 ----
Apr 1 .010 low
PE +2 4 .132
. Nov 5 .094
The Importance of Buy B4s
Buy B4s are important because they tell you when the DJI has probably
broken out above the resistance of the upper band. If Peerless is already
on a Buy, the Buy B4 will keep you bullish. If Peerless is on a Sell, the
Buy B4 warns you to switch to a long position. A reversing Buy B4 is not
common. But it would have worked out well in the 6 cases below. They
brought gains that averaged 7.6%. None of the reversing Buy B4s
would have brought a loss.
Reversing Buy B4s
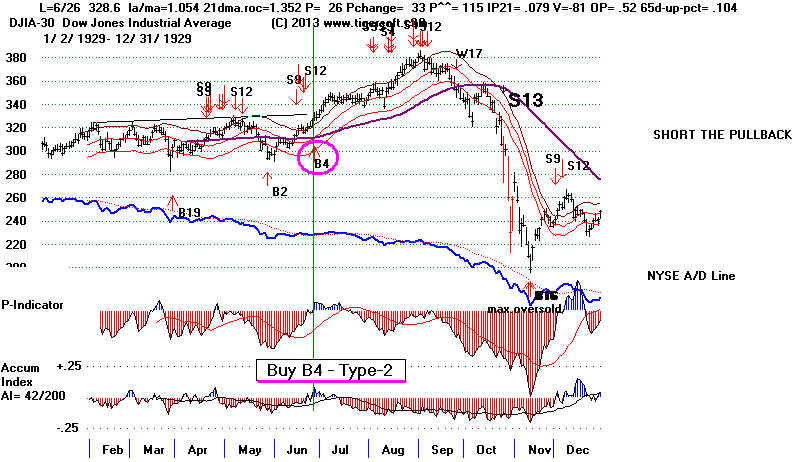
19290626 B4 328.6 .067 Type 2|
19341016 B4 95.3 .091 Type 2
19420528 B4 101.0 .041
19730925 B4 940.55 .049
19870622 B4 2445.51 .105
19970509 B4 7169.53 .105
-------------------------------------------------------------------
No. = 6 Avg.= .076
BUY B4 SIGNALS: 1928-2013 19290626 B4 328.6 .067 Type 2
19300123 B4 253.5 .125 Extreme Bearish Mode
19310210 B4 181.2 -.022 Extreme Bearish Mode
19321110 B4 65.5 .038 Type 2
19330821 B4 100.2 .022 ??????????
19341016 B4 95.3 .091 Type 2
19370120 B4 185.9 .019 Type 2
19390717 B4 142.8 .081
19400904 B4 132.2 .022 ?????
19410611 B4 122.2 .047 Type 2
19420528 B4 101.0 .041 ????
19420605 B4 104.4 .364
19420709 B4 108.8 .309
19421218 B4 118.9 .198
19450416 B4 162.4 .01 Type 2
19500809 B4 216.9 .195
19500915 B4 225.9 .147 Type 2
19521118 B4 278 .05 Type 2
19541115 B4 376.7 .244 Type 2
19551109 B4 473.9 .095 Type 2
19630408 B4 706 .33
19670118 B4 847.49 .047
19680906 B4 921.25 .061 Type 2
19701215 B4 819.62 .144
19721114 B4 1003.16 .044 Type 2
19721122 B4 1020.54 .026
19730925 B4 940.55 .049
19750205 B4 717.85 .205
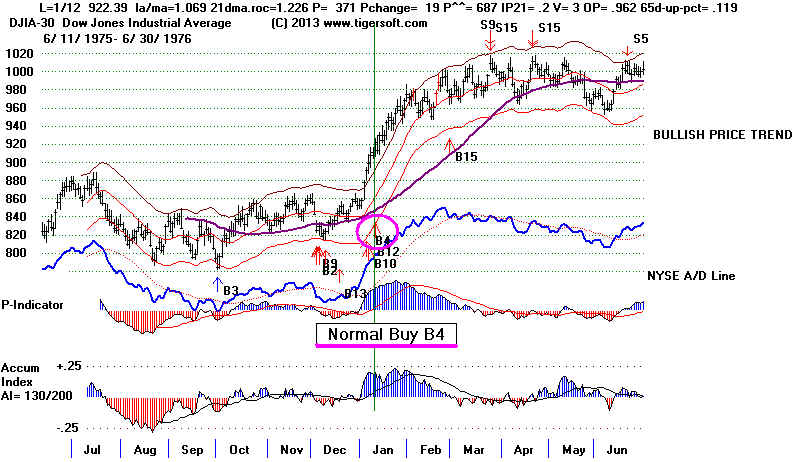
19760112 B4 922.39 .094
19780424 B4 826.06 .049
19780502 B4 840.18 .031
19780803 B4 886.87 .024
19790816 B4 884.04 .002
19821011 B4 1012.79 .044 Type 2
19821021 B4 1036.98 .019
(19840806 B4 1202.96 .072 Type 2 This signal is cancelled by simultaneous Sell S2)
19850129 B4 1292.62 -.002
19851118 B4 1440.02 .268
19860210 B4 1626.38 .123
19860318 B4 1789.87 .02
19870114 B4 2035.01 .182
19870622 B4 2445.51 .105
19890201 B4 2338.21 -.006
19890801 B4 2641.12 .049
19910204 B4 2772.28 .092
19911231 B4 3168.83 .058
19930205 B4 3442.14 .017 Type 2
19951130 B4 5074.49 .094
19960208 B4 5539.45 .002
19961120 B4 6430.02 .066
19970115 B4 6726.88 .019 Type 2
19970122 B4 6850.03 .001
19970509 B4 7169.53 .105
19970617 B4 7760.78 .021
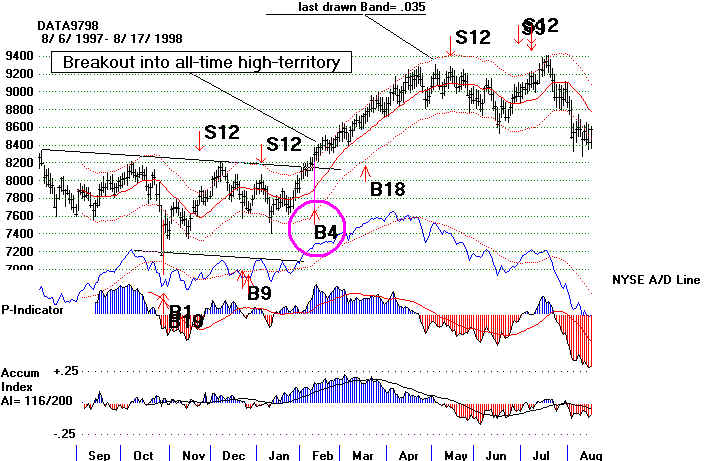
19980210 B4 8295.61 .107
20031219 B4 10278.22 .033 Type 2
-----------------------------------------------
N0. = 56 .085
PE     10    .048
PE +1  15    .046
PE +2  18    .127
PE +3  13    .099
Jan 8 .061 Feb 8 .065 Mar 1 .020 Apr 3 .130 May 3 .059 Jun 5 .121 Jul 2 .196 Aug 6 .061 Sep 4 .070 Oct 3 .051 Nov 9 .103 Dec 4 .108 1-10 17 .116
11-20 24 .084
21-31 15 .049
Type 2 Buy B4s
19290626 B4 328.6 .067
19321110 B4 65.5 .038
19341016 B4 95.3 .091
19370120 B4 185.9 .019
19410611 B4 122.2 .047
19450416 B4 162.4 .01
19500915 B4 225.9 .147
19521118 B4 278 .05
19541115 B4 376.7 .244
19551109 B4 473.9 .095
19680906 B4 921.25 .061
19721114 B4 1003.16 .044
19821011 B4 1012.79 .044
19930205 B4 3442.14 .017
19970115 B4 6726.88 .019
20031219 B4 10278.22 .033
--------------------------------------------------
No.=16 .064
Buy B4s-Type 2 since 1945 No.= 11 .069)
 >10%      2
 5%-9.99%  5
 2%-4.99%  5
 0%-1.99%  4
 losses    0

 PE        4   .048
 PE +1     6   .030
 PE +2     4   .132
 PE +3     2   .064

 Jan       2   .019 low
 Feb       1   .017 low
 Mar       0   ----
 Apr       1   .010 low
 May       0   ----
 June      2   .057
 July      0   -----
 Aug       0   -----
 Sept      2   .104
 Oct       2   .068
 Nov       5   .094
 Dec       1   .033

 1-10      3   .078
 11-20    11   .070
 21-31     2   .043

                   Code for Regular Buy B4
      For i = 22 To rn
        r47 = 1.0294: explo = 5
        If la(i) / ma(i) > 1.045 And v21(i) < 2 Then 43914
        If mo(i) = 12 Then r47 = 1.0274: explo = 4
        If mo(i) = 11 And da(i) > 15 Then r47 = 1.0274: explo = 4
        If la(i) / ma(i) > r47 Then hm = hm + 1 Else hm = 0
        If pvv(i) < 0 Or ipxxx(i) < .125 Then 43914
        If yr(i) > 2000 And S9(i) = 0 And hm > explo And P21(i) > 367 Then hm = 0: S9(i) = 4
        If yr(i) > 1964 And yr(i) <= 1999 And S9(i) = 0 And hm = explo And P21(i) > 200 Then hm = 0: S9(i) = 104
        If yr(i) > 64 And yr(i) <= 99 And S9(i) = 0 And hm = explo And P21(i) > 200 Then hm = 0: S9(i) = 104
        If yr(i) > 1964 And yr(i) <= 1999 And S9(i) = 0 And hm > explo And P21(i) > 180 Then hm = 0: S9(i) = 104
        If yr(i) > 64 And yr(i) <= 99 And S9(i) = 0 And hm > explo And P21(i) > 180 Then hm = 0: S9(i) = 104
        If S9(i) = 104 Then pi = i: mb(i) = 4:   S9(9) = 104: buyB4arrows (pi): i = i + 20
        43914 Next i

         For i = 31 To rn
         If (yr(i) + 2) / 4 <> Int((yr(i) + 2) / 4) Then 44454  ' Only Mid-Term Election Cases considered.
         If mo(i) < 5 Or mo(i) > 8 Then 44454
         If la(i) / ma(i) < 1.042 Or la(i) / ma(i) > 1.05 Then 44454
         If roc(i) < .7 Then 44454
         If P21(i) < 45 Then 44454
         If newipxxx(i) < .1 Then 44454
         If opma(i) < .18 Then 44454
         If da(i) > 10 Then 44454
         pi = i: mb(i) = 4:   S9(9) = 104: buyB4arrows (pi): i = i + 20
         44454 Next i


                   Code for Type 2 Buy B4
           For i = 70 To rn
               If ms(i) = 9 Or ms(i - 1) = 9 Or ms(i - 2) = 9 Then 6740
               If ms(i) = 12 Or ms(i - 1) = 12 Or ms(i - 2) = 12 Then 6740
               If mo(i) = 8 And ms(i - 3) = 12 Then 6740
               If mo(i) = 8 And ms(i - 3) = 9 Then 6740

              AROC = 250 * (ma(i) - ma(i - 1)) / ma(i - 1)
              CHANROC = (la(i) - la(i - 65)) / la(i - 65)
              If mo(i) = 8 And chan65 > .18 Then 6740
              If mo(i) = 8 And AROC < .7 Then 6740
              If opma(i) > .65 Then 6740 'Excludes 7/1959
              If AROC < .86 And opma(i) > .55 Then 6740' Excludes 1959, 1960
              If AROC < .8 And pvv(i) < 7 Then 6740' Excludes 1986
              If ((lo(i - 1) - HI(i - 2)) / lo(i - 1)) > .045 Then 6740

              If la(i) / ma(i) < 1.027 Then 6740
              If la(i - 10) / ma(i - 10) > 1.01 Then 6740
              If opma(i) < .32 And AROC < 1.1 Then 6740
              chan65 = (la(i) - la(i - 65)) / la(i - 65)
              If chan65 < -.045 Then 6740
              If newipxxx(i) < .07 Then 6740
              If newipxxx(i - 4) > .045 Then 6740
              If newipxxx(i) - newipxxx(i - 4) < .08 Then 6740
              pi = i: mb(i) = 4:  :  S9(9) = 104: buyB4arrows (pi): i = i + 20
6740      Next i
|
----------------------------------------------------------------------------
Peerless - 5/12/2011
Buy B4s have been part of the
Peerless system since 1981.
They show us when a trading market is switching
to an up-trending market and
sometimes, it is necessary to take a small loss to make a bigger gain.

There have been 29 B4s since 1929. All took
place between 1942
and 2000. The average gain
was 9.3%. 93% were profitable.
` 13 of the 29 trades brought gains of
more than 9%.
9 of the 29 brought gains of
less than 4%. The biggest gains tended to
come in the year before a
Presidential Election and from November to
February.
Reversing Buy B4s are very powerful
and so must be heeded. They average
a gain of 17.1% at the time of the
next Peerless Sell. Only 6 of the
29 Buy B4s were reversing and
switched the stance of Peerless from bearish to bullish.
But in this, they are essential,
because they prevent being short, or out of, a strongly
rising market. When they
reverse a previous Sell, they show the need to
accept a small loss to make a much
bigger gain. Each such case was profitable
and there were no losses.
Reversing Buy B4s since 1928
Gain Date
Previous Sell Signals' Gain at Time of Buy B4
-------- ------------
-------------------------------------------------------------------
+35.6% 6/7/1943
Sell S9 5/11/1942 -5.2%
+6.2% 8/9/50
Sell S9 4/14/50
-1.6%
+4.9% 9/2573
Sell S9 9/4/73
-5.0%
+0.5%
8/3/78
Sell S12 7/17/78 -5.7%
+10.5% 6/22/87
Sell S9/S12 6/8/87
-4.0%
+10.5% 5/9/97
Sell S9 4/22/97
-4.9%
-----------------------------
n = 6 Avg = 11.4%
Many of the biggest gaining
B4s did not pull back and never showed a paper loss.
Waiting for a pullback is not
advised, unless the DJI has risen a long way and the
new Buy B4 is one in a series
of Buy B4s.
Biggest Gainers (over 20%)
Pct Gain Paper Loss
6/5/1942
+35.8% 2%
2/5/1975
+22.2% no paper loss
11/18/1985 +26.8% no paper loss
2/4/1991 +21.0%
no paper loss
Lowest Gainers (under 3%)
Pct Gain Paper Loss
11/22/1972 + 2.6% no paper loss
8/3/1978 + 2.4%
no paper loss
8/16/1979 -0.4% 2%
10/21/1982 1.9%
5%
2/8/1996 0.2%
6%
1/22/1997 -0.2%
8%
6/17/1997 2.1% no paper loss
November to February account for 16 of the 29 signals.
February, June
and November. 10 of the 16
B4s in this period gained more than 9.3%.
August to October Buy B4s are
weaker, averaging only 4.8% in 6 cases.
BUY B4s by month
Pct Gains
Average Pct
Gain
-------------------------------------
--------------------------
Jan
9.4 4.8 18.2 -0.2
(4)
8.1%
Feb
22.2 12.3 18.5 21.0 0.2 10.7
(6) 14.2%
March 2,0 (1)
2.0%
April
4.9 (1)
4.9%
May
3.1 10.5 (2)
6.8%
June 35.8
10.5 2.1 (3)
16.1%
July
Aug
10.5 -0.4 4.9 6.7 (4)
5.4%
Sept
4.9 (1)
4.9%
Oct.
1.9 (1)
1.9%
Nov
2.6 26.8 9.4 6.3 (4)
11.3%
Dec. 14.4
4.3 (2)
9.4%
------------------------------------------------------------------------------
Totals
n=29
9.3%
BUY B4s by Year in
Presidential Cycle
Presidential Election year
B4s are weaker than others. They are also less common.
The year before a
Presidential Election produces the most powerful B4s. All but one
of the B4s gained more than
9.3%. They average +12.6% per trade.
Presidential Election (PE)
1972
+2.6% 1976 +9.4% 1996 +0.2% 1996 +6.3%
n=4 Avg = + 4.6%
PE + 1
1973
+4.9% 1985 +4.8% 1985 +26.8% 1989 18.5% 1989
4.9% 1997 -0.2% 1997 10.5%
1997
2.1%
n=8 Avg = + 9.1%
PE + 2
1942 +35.8
1950 +6.7 1970 +14.4 1978 4.9% 1978 3.1%
1978 0.5% 1982 1.9%
1986
+12.3% 1986 +2.0% 1998 +10.7%
n=10 Avg = + 10.2%
PE + 3
1975 +22.2% 1979 -0.4% 1987
18.2% 1987 10.5% 1991 21.0% 1991 4.3%
1995
9.4%
n=7 Avg = +12.6%
BUY B4s aince 1928
     -----Major Buy B4 -------    ------------- Next Major Sell -----------
     Date         DJI             Date     Pct Gain   Approx Days Elapsed
     ----------   ------------    -----------------------------------------
1.   6/5/1942     104.40          6/7/1943  +35.8%
      1.046  .79  49  6    .107   19  .199
      Reversing Buy.
      Declined to 102.25 and rallied. 2% Paper Loss
===========================================================================
2.   8/9/1950     218.90          10/25/50     6.7%
      1.047  .709 .159  19 .219  128  .254
      Reversing Buy.
      Rallied immediately.
===========================================================================
3.   12/15/1970     819.62         5/6/1971   14.4%
     1.034  .902  193   20 .152    1  .627
     Not a Reversing Buy.
     Rallied immediately.
===========================================================================
4.   11/22/1972    1029.54         1/5/1973   2.6%
      1.039   .842   220 -14   .131   2  .425
     Not a Reversing Buy.
     Rallied immediately.
========================================================================
5.   9/25/1973      940.55         10/26/73   4.9%
     1.048   1.026   288  17  .295   2  .434
     Reversing Buy..
     Rallied immediately.
========================================================================
6.   2/5/1975       717.85         7/1/1975  +22.2%
     1.07    1.367   350   7  .129  2  .392
     Not a reversing Buy.
     Rallied immediately.
========================================================================
7.   1/12/1976      922.39         3/24/1976   9.4%
      1.069   1.226  371   19  .2    3   .588
     Not a reversing Buy.
     Rallied immediately.
========================================================================
8.   4/24/1978      826.06         6/13/1978  4.9%
     1.061   1.068  204  21  .156  5   .41
     Not a reversing Buy.
     Rallied immediately.
========================================================================
9.   5/2/1978       840.18         6/13/1978  3.1%
      1.049   1.331  236  25 .11   7   .474
      Not a reversing Buy.
      Pulled back to 820 and rallied immediately.
      Paper Loss = 2.5%
========================================================================
10.   8/3/1978       886.87         9/11/1978   0.5%
      1.055   1.154  279   52  .161  6    .409
      Not a reversing Buy.
      Rallied immediately.

      Also:
      8/7/1978       885.05         9/11/1978   0.7%
      1.044   1.024  288   -14 .118  6    .334
      Not a reversing Buy.
      Rallied immediately.
=======================================================================
11.   8/16/1979      884.04         8/23/1979   -0.4%
      1.038   .778   252   20  .262    5   .362
      Not a reversing Buy.
      Pulled back to 866 and rallied. Paper Loss = 3%
=======================================================================
12.  10/21/1982    1036.98        12/7/1982   1.9%
      1.076 (highest) 1.359  279 0    .165    15  .196
      Not a reversing Buy.
      Pulled back to 983 and rallied. 5% Paper Loss
=======================================================================
13.  1/29/1985     1292.62         10/14/85   4.8%
     1.049     .857  359  12   .126    17  .039
     Not a reversing Buy.
     Pulled back to 1242 and rallied. 4% Paper Loss
=======================================================================
14.  11/18/1985    1400.02         4/29/86   +26.8%
     1.033  .609   191  -5  .196   13  .266
     A reversing Buy.
     Rallied immediately.
======================================================================
15.  2/10/1986     1626.38         4/29/86  12.3%
     1.047  .868   193  21  .182   5   .259
     Not a reversing Buy.
     Rallied immediately.
======================================================================
16.  3/18/1986     1789.87         4/29/86   2.0%
     1.044  .874   246  -8  .175   20  .313
     Not a reversing Buy.
     Rallied immediately.
======================================================================
17.  1/14/1987     2035.01         5/6/1987  18.2%
     1.043  .751   193  54  .232  17 .401
     Not a reversing Buy.
     Rallied immediately.
======================================================================
18.  6/22/1987     2445.51         8/26/1987 10.5%
     1.042  1.12   232 -7   .156  25  .525
     A reversing Buy.
     Rallied immediately.
======================================================================
19.  2/1/1989      2338.21         10/4/89    +18.5%
     1.042  1.031  226  17 .187  31  .469
     Not a reversing Buy.
     Pulled back to 2244 twice and then rallied 7 weeks later.
     Paper loss = 4%
======================================================================
20.  8/1/1989      2641.12         10/4/89   4.9%
     1.032  .939   207   8 .183  21  .293
     Not a reversing Buy.
     Rallied immediately.
======================================================================
21.  2/4/1991      2772.28         1/28/1992    +21.0%
     1.065  .946   222  43  .179  24  .282
     Not a reversing Buy.
     Rallied immediately.
======================================================================
22.  12/31/1991    3168.83         4/14/1992     4.3%
     1.071  1.108  197  29  .138   17  .368
     Not a reversing Buy.
     Rallied immediately.
=====================================================================
23.  11/30/1995    5074.49         2/27/1996     9.4%
      1.028  .772   183   19   .175  20  .511
     Not a reversing Buy.
     Rallied immediately.
=====================================================================
24.  2/8/1996      5539.45        2/27/1996     0.2%
     1.052  1.151  245  86  .37   47   .445
     Not a reversing Buy.
     Fell back to 5250 and then rallied.
     5% Paper Loss
=====================================================================
25.  11/20/1996    6430.02         4/22/1997    6.3%
     1.043  .713   190    .135  20   .438
     Not a reversing Buy.
     Fell back to 6350 and then rallied.
     1% Paper Loss
=====================================================================
26.  1/22/1997     6850.03         4/22/1997    -0.2%
     1.031   .657  249      .174  26   .378
     Not a reversing Buy.
     Fell back to 6350 and then rallied.
     8% Paper Loss.
=====================================================================
27.  5/9/1997      7169.43         10/7/1997      10.5%
     1.046   1.098  206  38  .165  35   .268
     A reversing Buy.
     Rallied immediately.
====================================================================
28.  6/17/1997     7760.78         10/7/1997     2.1%
     1.044    .91   428  22 .153  55   .241
     Not a reversing Buy.
     Fell back to 7630 and then rallied
     2% Paper Loss.
====================================================================
29.  2/10/1998     8295.61         4/21/1998    10.7%
     1.048  1.08    346  134   .165  68   .255
     Not a reversing Buy.
     Rallied immediately.
====================================================================
     none since 1998.
====================================================================
                                    ------------------
                                    AVG GAIN = 9.3%
                                    93.1% were profitable.
revise ....
 Nov to Feb account for 18 of 31 signals
   4/12 of months
  missing 1 signal
   4 - Nov
   2 - Dec
   4 - Jan
   6 - Feb
   1 - March
   1   April
   2   May
   3 - June
   0 - July
   4 - August
   1 - Sept
   1 - Oct