------------------------------------------------------------------------------------------------------------------------------
BUY B2 - Buy at the Lower Band according to Parameters
which vary by Month in the 4-Year Presidential Cycle.
| Jan | Feb | Mar | April | May | June | July | Aug | Sept | Oct | Nov | Dec | Total | ||
| PresElec Year |
19360506 19520501 19720502 19960507 20000505 |
19480720 19480730 19600721 19600728 19680729 19720713 19840724 19960712 19960722 20040726 |
19360821 19680808 19760826 19920821 |
19521016 19721016 19801027 19841010 19921015 20001020 |
19401127 19481119 19481130 19561120 19561129 19761110 1980121 19801218 19841116 20001122 |
19281207 19361221 19961216 20001220 20121112 |
||||||||
| PE+1 | 19290215 19890227 |
19450327 19730326 |
19290527 | 19530828 19730823 |
19610925 | |||||||||
| PE+2 | 19380502 19460506 19860507 20100520 |
19940624 | 19700707 |
19380815 19380829 19700813 19780623 19880816 19880825 20100827 |
19380927 | 19381129 19501106 19581125 19821122 19821129 19861118 19881111 19881121 |
19341220 19381205 19501204 19661201 19821215 19941208 19981210 20021213 |
|||||||
| PE+3 | 19390628 19910624 20110603 |
19310807 19390810 19550809 |
19431110 | 19351202 19351213 19391201 19751203 19831215 19911211 |
There have been 95 Buy B2s since 1928. The average gain was
10.0%.
All produced a gain. The biggest average gains came in the
Second Year of
a Presidential Election, in February and from September to
December.
The lowest came in the Year after the Presidential Election and
in June and July.
Size of Percent Gains if DJI Sold Short
on Sell S2
and covered on next Peerless Buy
>10%
34
35.8%
5%-9.99% 31
32.6%
2%-4.99% 28
29.5%
0%-1.99% 2
2.1%
Losses
0
0%
Buy B2s: 1928-201319281207 B2 271.1 .153
19290215 B2 300.4 .057
19290527 B2 293.4 .069
19341220 B2 99.6 .044
19350531 B2 110.64 .198
19351202 B2 140.7 .11
19351213 B2 140.2 .114
19360506 B2 149.7 .265
19360821 B2 160.8 .178
19361221 B2 175.9 .077
19380502 B2 110.7 .065
19380815 B2 136.9 .045
19380829 B2 137.1 .044
19380927 B2 130.2 .21
19381129 B2 147.1 .05
19381205 B2 147.5 .047
19390628 B2 132.8 .16
19390810 B2 137.3 .122
19391201 B2 146.5 .043
19401127 B2 129.8 .017
19431110 B2 132.7 .236
19450327 B2 152.8 .073
19480720 B2 183.6 .034
19480730 B2 181.3 .047
19481110 B2 174.5 .033
19481119 B2 177 .018
19481130 B2 171.2 .053
19501106 B2 222.5 .164
19501204 B2 222.3 .166
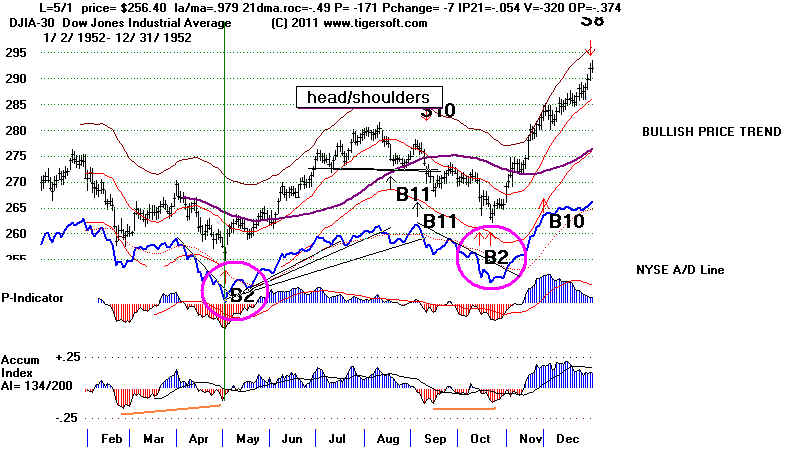
19520501 B2 256.4 .06
19521016 B2 264.9 .102
19530828 B2 265.7 .124
19550809 B2 448 .048
19561120 B2 470.1 .048
19561129 B2 466.6 .056
19581125 B2 540.5 .191
19600721 B2 616.6 .029
19600728 B2 605.6 .048
19601025 B2 566 .239
19610925 B2 691.2 .058
19661201 B2 789.95 .124
19680729 B2 883.36 .107
19700707 B2 669.36 .063
19700813 B2 707.35 .325
19720502 B2 935.2 .032
19720713 B2 916.99 .033
19721016 B2 921.66 .137
19730326 B2 927.9 .043
19730823 B2 864.46 .04
19750529 B2 815 .061
19751203 B2 825.49 .223
19760826 B2 960.44 .051
19761110 B2 924.04 .065
19780623 B2 823.02 .103
19801027 B2 931.74 .059
19801210 B2 916.21 .062
19801218 B2 930.2 .046
19810504 B2 973.34 .04
19821122 B2 1000 .057
19821129 B2 1002.85 .054
19821215 B2 992.64 .079
19831215 B2 1236.79 .037
19840724 B2 1086.57 .187
19841010 B2 1177.23 .096
19841116 B2 1187.94 .086
19861118 B2 1817.21 .324
19880816 B2 2021.51 .08
19880825 B2 2010.85 .086
19881111 B2 2067.03 .124
19881121 B2 2065.97 .124
19890227 B2 2250.36 .231
19910624 B2 2913.01 .033
19910628 B2 2906.75 .035
19911205 B2 2889.09 .161
19920821 B2 3254.1 .076
19921015 B2 3174.68 .102
19940624 B2 3636.94 .068
19941208 B2 3685.73 .506
19960507 B2 5420.95 .06
19960712 B2 5510.56 .035
19961216 B2 6268.35 .094
19981210 B2 8841.58 .259
19990611 B2 10490.51 .061
20000505 B2 10577.86 .038
20001020 B2 10226.59 .06
20001122 B2 10399.32 .082
20001220 B2 10318.93 .09
20021213 B2 8433.71 .04
20040726 B2 9961.92 .033
20041022 B2 9757.81 .118
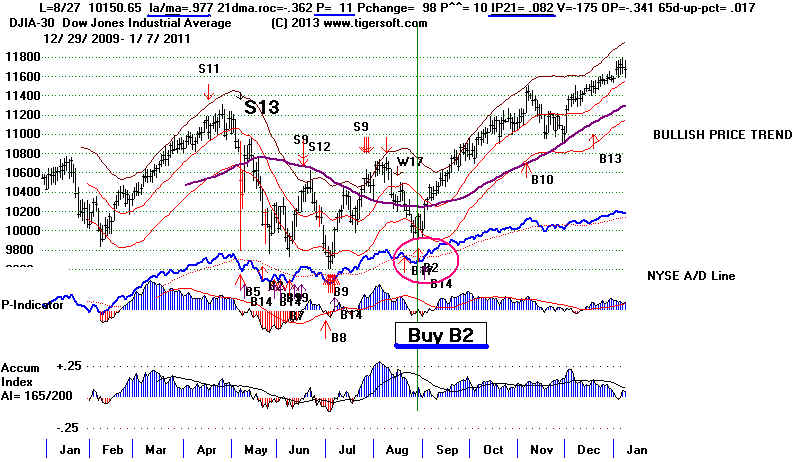
20100520 B2 10068.01 .034
20100827 B2 10150.65 .262
20110603 B2 12151.26 .022
20121112 B2 12815.08 .184
20130821 B2 14897.55 .02
------------------------------------------------
No.= 95 .100
(1945-2013 No.= 74 .098 )
PE       45   .085
PE +1    10   .076
PE +2    24   .139
PE +3    16   .104
Jan 0 - Feb 2 .144 Mar 2 .058 Apr 0 ---- May 11 .084 Jun 7 .059 Jul 10 .062 Aug 14 .107 Sep 2 .134 Oct 8 .114 Nov 19 .103 Dec 20 .124 1-10 20 .120
11-20 28 .107
21-31 47 .086
Code for Buy B2s is too lengthy to reproduce here.
They are broken down by months and year in the 4-year Presidentail
cycle. BCALC.bas - b2calc.
|
-----------------------------------------------------------------------------------
(C) 4/26/2013 William Schmidt, Ph.D.
Buying on a close between the DJI's
3.5% and 2.0% lower band only works
consistenly well when one also takes into
account the four year Presidential Cycle,
price momentum, the current IP21,
the V-Indicator and the DJI's chart. The latter
key values must not be unusually weak.
Valid Buy B2s mostly occurred from June to December
but never in September by design.
For momentum indicators, we use the
percent change of the DJI over the
last 65 days and the annualzied rate of change
of the 21-day ma. Beware of
buying at the lower band right after a mid-Summer
completed head and shoulders pattern
and too soon after a major Peerless Sell.
Most of the Buy B2s occur after May.
This has a lot to do with the trading range
and declines that are common after May.
Many have noticed this overall pattern.
http://allstarcharts.com/sell-in-may-and-go-away-2/
But I believe it is essential to
distringuish which year we are considering in the
four year cycle and whether a fiscally
conservative President is in office or a
Demcratic President who believes in
government stimulus using fiscal or monetary
policies.
Buy B2s Are Not Allowed in The Tear after A Presidential Election
The year after a Presidential
Election has historically has had to many big declines
that rupture the lower band to allow Buy
B2s. Bull markets or trading ranges occurred
only in 1921 and 1925 after April, for
four months in 1933, 1945, for the last 6 months of
1949 and the last 3 months of 1953.
Democrats after World War II stimulated the economy
through government invention. This
is seen in the bull markets of 1961, 1965, 1993, 1997
and 2009. The fiscally conservative
Democrat Carter was an exception. 1977 brought
an unrelenting bear bear market.
Market weakness was often quite
severe when a fiscally conservatove Democrat or
typical Republican was in office.
Just consider how weak the DJI was in 1917 after June.
The 1919-1921 bear market ended
only in April) 1921. Going forward we see severe bear
markets in 1929 after September,
1933 (where the DJI swang in 20%+ moves from down
to up and down and up and down),
1937, 1941, 1949 (the DJI fell until June),
1953 (DJI fell until September),
1957 (bear market from July to November),
1969 (bear market after May), 1973, 1977,
1981 (after April) and 2001.
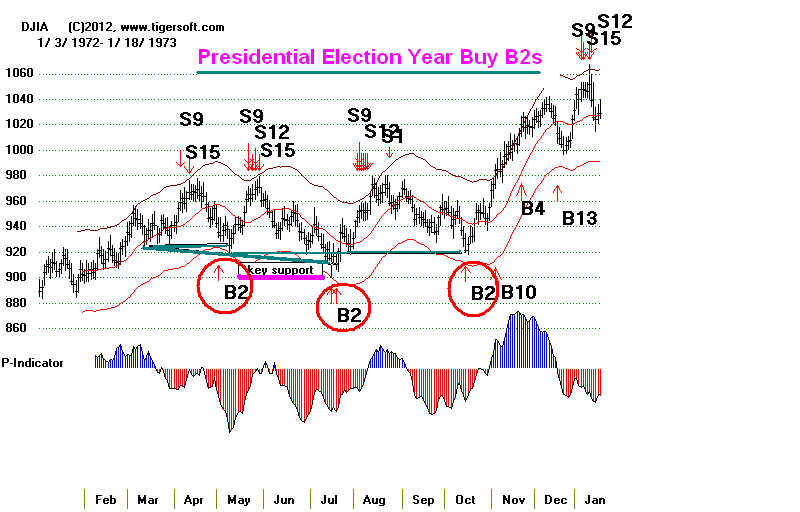
Buy B2s Occur Most Often in A Presidential Election Year.
But They Must Be Applied Carefully.
The first few months in a Presidential
Election Year often show unusual weakness.
From the summary just below, you
can see that the most reliable lower band Buys
occur in the second half of the
year, but that buying at the lower band in September
was particularly unreliable because
the decline worsened in October.
Presidential Election Years
First, we consider the Buy B2s in
the Presidential Election year. From the summary
below, you can see that Buy B2s
have been carefully crafted to work around the many
cases. We do this mostly by
eliminating cases were the Peerless momentum and internal
strength indicators were unusally
weak. The 65-day pct change was below -.11 (-11%)
and the annualzied 21-day ma was
falling at a rate below -0.65 (-65%).
See below how often there was too
much weakness in the first few months of the year
and how often September declines to
the lower band brought steeper additional
declines in September.
1916 DJI declined steadily
until August.
1920 DJI declined all year
1924 DJI declined steadily until late May
1928 The lower band brought tradeable rebounds all year except June.
1932 DJI declined from February to July and from September to
November.
1936 The lower band brought tradeable rebounds all year except April
1940 Only minor rallies until June. May collapse.
1944 Tagging the 3% lower band worked well. 3x: February, April and September
1948 DJI declined until March. Lower band buys would have
failed in July and early November.
1952 DJI declined steadily until April.
1956 10% trading range made buying at lower band bad trades in May, August and
September.
1960 DJI declined steadily until April.
The lower band in September failed to bring a rebound.
1964 DJI rose all year. June,
August and December declines to lower 2% band brought rebounds
1968 DJI declined until March. Lower band reversals in March and early August.
1972 DJI rose in first and last 3 months of year. Good Buy B2s in May, July and October
1976 DJI rose in first two months. Many good
lower band buys except early
October
1980 DJI declined until April.
Lower band buys worked well after August.
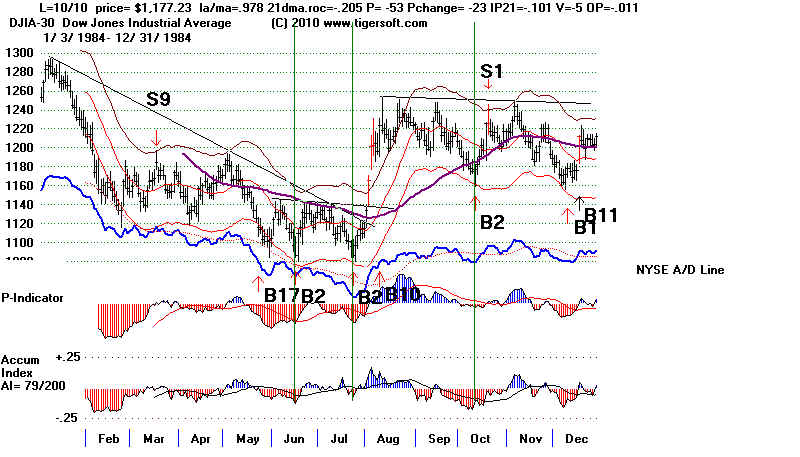
1984 DJI declined
steadily until July Good lower band reversals in October and December.
1988 Buying at 3.5% lower band worked well in Jan,
March, May, August and November
1992 Buying at 3.5% lower band worked well in April,
August and October
1996 Buying at 3.5% lower band worked well in April,
May, July and December
2000 DJI declined until March.
In September and October, the lower band did not hold up.
2004 DJI declined until October.
Buying at 3.0% lower band worked well in May, July and October.
2008 Extreme bear market. Only December brought a successul lower band Buy.
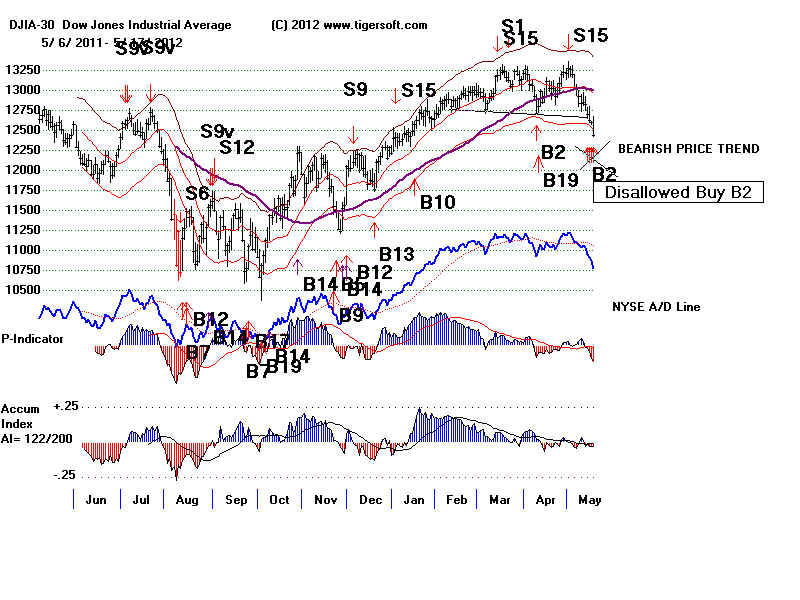
2012 DJI rose. Lower band buys in April, May and October would have led to paper losses.
Automatic Buy B2s in a Presidential Election Year
=========================================
Presidential Year Buy B2s:
57 cases.
12 Decembers
10 Novembers
8 Octobers
None in September
8 Augusts
8 Julys
2 June
3 May
12/71928 271.1
+15.3% .966 .442 -52
-40 -52 -.03 -652 .223 .11
(271.1-263.9)/ 271.1 adv = 110
decl 598 DJI fell one more day to 263.9
Also 12/11/1928
5/6/1936
149,7 +15.4% 0 .977
-.945 -128 12 -566 -.077 -403 -.24 -.007
(149.7-146.7)/148.6
adv= 519 decl = 135 DJI rose next day
8/21/1936 160.8 +7.5% 0
.968 -.272 -56 -38 -248
-.144 -171 -.126 .073
12/21/1936 +7.7% 0 175.9
.972 -.414 -72 -4 -318 -.138 -282 -.221
.052
11/27/1940 129.8 +1.7%
-.142 -29 -16 -145
-.088 -57 -.005 .025
fell to 128.4 before rallyiing
Note B9 on decline to lower band in Sept. No need for a Buy B2.
9/14/1944 142.9 .977 -.293 22
-18 117 -.079 1 -.163 -.016
7/20/1948 183.6 +3.4% .971 -.503
-90 27 -384 -.052 -250 -.021 .016
Declined to 176 on 9/27
Note bearish head/shoulders pattern.
7/30/1948 181.3 +4.7% .969 -.521
-93 -46 -395 -.104 -237 -.204 .001
11/10/1948 174.5 +3.3% .945 -.483
165 -4 705 .097 262 .054 -.049
Fell to 171.2 on 11/30
11/19/1948 177.0 +1.8% .972 -.60
+178 5 +.057 +275 -.078 -.019
Fell to 171.2 on 11/30
11/30/1948 171.2 +5.3% .962 1.206
83 4 357 -.08 157 -.332 -.067
5/1/1952 256.4 6.0% 0
.979 -.49 -171 -7 -631
-.054 -320 -.373 -.07
adv= 160 decl = 728 DJI rose next day
10/16/1952
maybe 10/15/52 267.1 +9.3%
.987 -.057 -49 -16 -180 -.009
-133 -.114 -.03
(267.1- 263.9)/ 267.1
Old S8/New S16 12/30/52
6.1%
adv= 120 decl = 915 DJI fell one more day to 264.9
X 8/22/1956 bad .975 -.252 -106 -6 -335 .004 -.319 .107
.021
X 8/30/1956 bad .969 -.527 -154 -33 -488 -.083 -386
-.169 .036
11/20/1956
11/29/1956
7/21/1960
7/28/1960
10/25/1960
June 8, 1964 should be a Buy B2
800.3
.978 .434 -103 -20
-283 -225 -664 -.391 -.005
7/29/1968
8/8/1968
X 12/23/1968 bad
X 12/30/1968 bad
5/2/72
935.2 3.2%
.977 -.071 -110 -24 -235 -.036 -1
.132 .03
7/17/1972
maybe 7/18/72 911.72
3.9% .978 -425 -179 -9 -383
-.094 -3 -.34 -.062
(
911.72 - 910.45) / 911.72-
10/16/1972
8/26/1976 good .977 -.253 -64 12 -117 -.006 -2 -.072 -.012
10/18/1976
11/10/1976
10/27/1980
12/10/1980
12/18/1980
7/24/1984
10/10/1984
11/16/1984
gone why? 12/3/1984
8/10/1988
8/18/1988
11/11/1988
11/21/1988
8/21/1992
10/15/1992
5/7/1996
7/12/1996
7/22/1996
12/16/1996
5/5/2000
10/20/2000
11/22/2000
12/1/2000
12/20/2000
7/26/2004
10/22/2004
X 6/3/2008 cancelled by S9/S12
X 6/9/2008 cancelled by S9/S12
11/12/2012
Automatic Buy B2s in Second Year
after
A Presidential Election Year
===================================
1930
1934 Decline ended in July
12/20/1934 .98
1938
8/15/1938
8/29/1938
11/18/1938 .98
11/29/1938 .968
12/5/1938 .975
12/9/1938 .98
1942 Decline to May
1946
X 8/26/1946 terrible.
1950 Decline ends in July
11/6/1950
12/4/1950
1954
1958
11/25/1958 .977
1962 Decline until end of June
1966 Secline until end of October
X 8/10/1966 -.057 BAD
12/1/1966 .028
1970 Decline until May
8/13/1970
1974
1978 11/1/1978 -.04
1982 Decline until August
11/22/1982
11/29/1982
12/15/1982
1986
5/16/1986 .976 -.627 +.073
11/18/1986
1990 8/28/90 don't buy on jump from .903 cl/ma t days ago
2614.85
1994 12/8/1994 -.054 .98
1998 8/17/1998 is bad -.071
12/10 .976
12/16 .972
2002 Declines until July
12/13/2002 .973
12/19/2002 .966
2006
2010 8/20/2010 .974 -.023
2014
Automatic Buy B2s in Third Year
after
A Presidential Election Year
===============================
1931
X
B3 to be B2 8/5/1931
+5.7%
134.1 .953 -.995 -35 7 -198
.065 -222 -.073 -.115
1935
12/2 12/1935
140.7 .979 .017 21 -9 118 -.041 -102
-.298 .097
12/13/1935
140.2, .973 -.281 -13 -33 -72 -.168 .111
.049
Reversed by S15 on 2/18/1936. Too early for Sell S15?
1939
Now a Buy B3 - 8/18/1939
+13.7% 3% Reversing Buy Signal +13.7%
8/28/1939
1943
8/4/1943
136.9 .965 -.578 =58 18 -291 -.119 -175
-282 -.004
8/9/1943 +4.9%
135.2 .961 -.759 -82 -10 -411 -.191 -197
-.414 -.028
also 8/10/1943
1947
8/11/1947
179 .975 -.376 -64 -42 -266 -.067 -111
-.095 .041
Fell to 174/9 before reversing up.
12/8/1942
176.7 .978 -.342 -121 32 -505 -.049 -182
-.076 -.018
1951
1955
1959
1963
1967
6/5/67
847.77 .966 -.733 -192 -58 -480 -.083 -11
-.35 .001
8/28/87
894.71 .979 -.089 -104 -9 -260
-.035 -5 .016 .026
1971
8/9/1971 +6.8%
1/2% Reversing Buy
Signal +6.8%
.963 -.802 -277 -36 -586 -.159 -4 -.376
-.112
1975
8/8/1975 817.74
.973 -.764 -325 -35 -618 -.202 -5 -.316
-.023
Now a Buy B3 8/20/1975
+5.3%
Reversing Buy Signal
+5.3%
8/20/75 793.26
.965 -.772 -373 -13 -708 -.277 -6 -.258
-.055
12/3/75 825.49
.976 -.003 -8 -37 -16
-.028 -2 .008 .002
12/9/75 824.15
.977 -.164 -96 -8 -181
-.034 -2 .004 -.02
1979
1983
8/4/1983 .979 -.369 -206 -63 -404 -.044
-14 -.124 -.021
Also 8/8/83, 8/9/83, 8/10/83
Now a Buy B3 8/8/1983 +7.0%
Reversing Buy Signal +7.0%
12/15/1983 .978 -.163 -66 -48 -130 -.072
-8 -.233 .01
1987
1991
6/24
.978 .052 -60 -47 -111 .113 -9 .016 .019
Also 6/28
8/19
.968 -.469 -42 -62 -78 -.062 -9 -.319
.001
12/5
.975 -.57 -128 -15 -235 .034 -23 -.184 -.042
1995
1999
6/11/99
.978 -.564 -184 -7 -183 -.038 -90 -.224 .067
8/2/1999
.965 -.453 -272 -41 -271 -.049 -108 -.223
-.022
8/6/99
.978 -.448 -410 -30 -409 -.069 -140 -.202
-.023
2003
2007
8/14/2007 +5.5% 1%
Reversing Buy Signal
+5.5%
13028.92 .964 -.809 -576 -63 -519 -.088
-.023
2011
6/3/2011
.972 -.544 51 -6
51 -.036 -140 -.047 .006
2015
More
Considerations on Buy B2s
There have been --- reversing Buy B2s since 1928. All would have been closed
out profitably on the next Peerless Sell signal but in 4 csses, there would have
been a paper loss of between 5% and 9%. One could use a stop loss 5%
below where the Buy B2 signal is employed or judge a Sell S10 if key,
well-tested support is decisively broken.
The best way to avoid these losses is not take the Buy B2 when a DJI
or even an S&P head/shoulders pattern has appeared until the minimum
downside objective from this pattern has been completed. Instead use
the Judged S10 rules. Look at the examples of 1956, 1976, 1988, 2000
and October-November 2012 below. Learn to recognize these head/shoulders
patterns.
Be very careful when a Head/Shoulders pattern appears.
These normally bring declines below the lower band. This makes
Buy B2s risky at this time. Should this occur, it is probably best to
not Buy until the NYSE A/D Line breaks its downtrend.
1956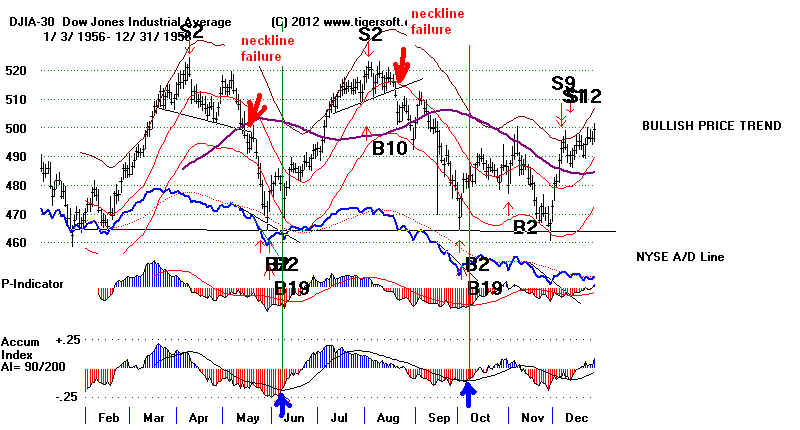 |
| 1976 There is no head/shoulders pattern here to get a minimum
downside objective, but the decline went 5% below the first Buy B2. 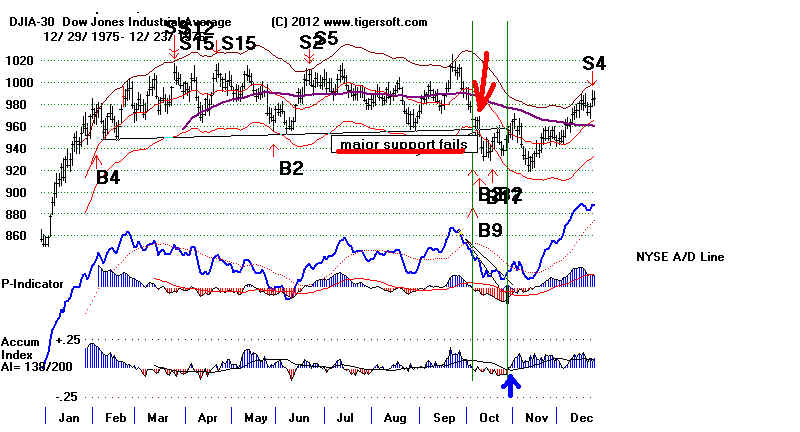 |
1988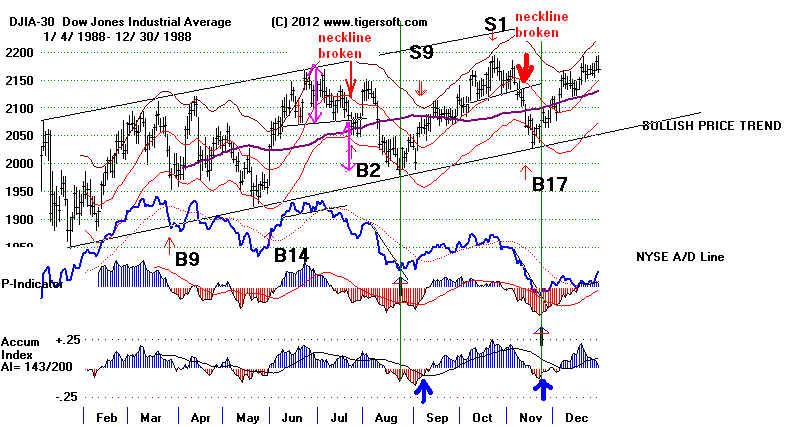 |
2000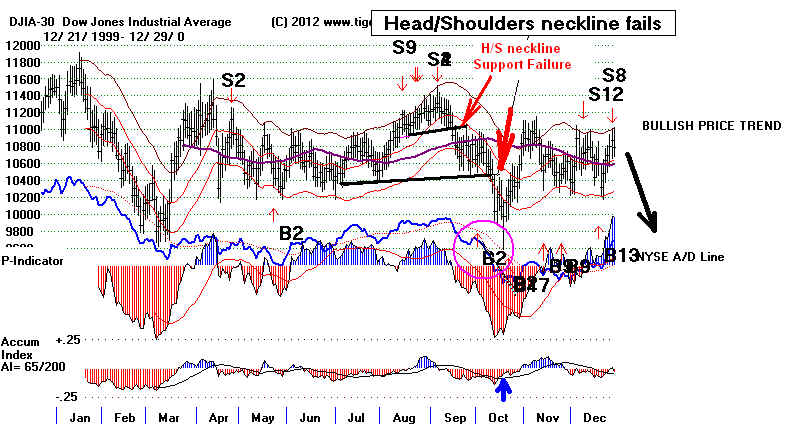 |
2012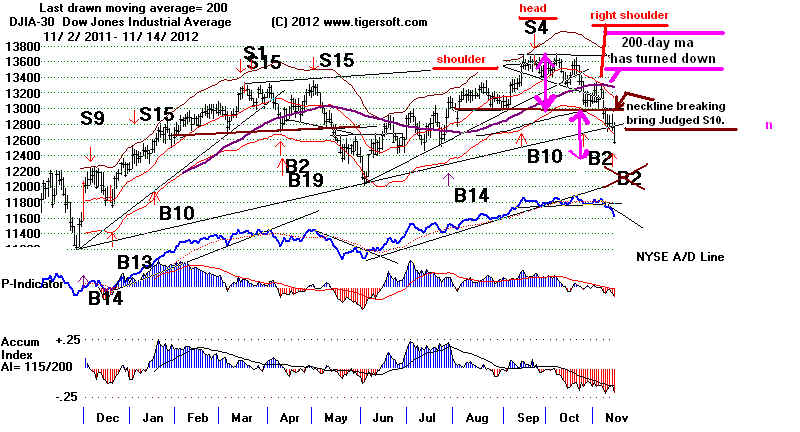 |
Simple drops to the lower band if they do not follow neckline-breaks
or well-tested support breaks are ordinarily buying opportunities
in a Presidential Election Year unless a head/shoulders pattern has appeared.
Altogether Buy B2s averaged a gain of 8.4%. But additional weakness is not
uncommon, especially if well-tested support or a head/shoulders pattern
neckline is violated. In 13 cases, declines out-numbered advances on the
day of the Buy B2. In 9 of these 13 cases, the DJI fell at least a day
further.
Very little harm is done waiting another day to Buy in these cases.
Early and Mid-November seldom brings a bottom if there is an October-
November sell-off. For this reason Buy B2s are not ordinarily allowed
in November.
Reversing Buy B2s: 1928-2013
Date
DJIA
Pct. Gain
Reversing Sell
----------------------------------------------------------------------------------------------------------------------
6/15/1928 205.9 +4.1% .964 -.60 -114
7 -114 0 -829 -.193 .023
(205.9-202/ 205.9)
12/719/28 271.1 +15.3% .966 .442 -52 -40
-52 -.03 -652 .223 .11
(271.1-263.9)/ 271.1 adv = 110
decl 598 DJI fell one more day to 263.9
5/5/1936 148.6 +12.0% .967
-.887 -141 24 -623 -.097 -423 -.066 -.007
(148.6-146.7)/148.6
adv= 519 decl = 135 DJI rose next day
8/21/1936 160.8 +7.5% 0 .968 -.272
-56 -38 -248 -.144 -171 -.023 .073
Dec 1936
10/26/1944 145.8 +12.5% .988 -.056
13 -20 72 .130
-28 .097 0
(145.8 - 145.6)/145.8
7/19/1948 181.2 +4.7% .957
,689 -118 -46 -500 -.068 -288
-.119 .004
(181.2-176)/ 181.2
5/1/1952 256.4 6.0% 0
.979 -.49 -171 -7 -631
-.054 -320 -.373 -.07
adv= 160 decl = 728 DJI rose next day
10/15/52 267.1 +9.3%
.987
-.057 -49 -16 -180 -.009 -133
-.114 -.03
(267.1- 263.9)/ 267.1
Old S8/New S16 12/30/52
6.1%
adv= 120 decl = 915 DJI fell one more day to 264.9
5/15/1956 494.8
.975 -.337 -80 -16 -.255 -.154 -334 -.294
.054
(494.8 - 468.8) Big loss.
5/29/1956 477.7
.963 -.918 -161 35 -512 -.229
-501 -.583 -.016
10/31/1956 479.9 +2.7%
.99
.111 -12 -67
-38 .029 -123 -.097 =.078
(479.9 - 466/1) / 479.9
high
4/28/1960 604.3 +3.4%
.974
-.307 -.93 -16 -263
-.135 -416 -.136 -.059
(604.3- 599.6) / 604.3
7/18/60 626 +1.3%
.977
-.414 -70 -10
-198 -.084 -381 -.185
-.001
(626 - 601.7) / 626
1.3%
S1 8/29/60 8.9%
adv= 335 decl =635 DJI fell five more day to 601.7
10/3/1960 577.8 +3.2%
.97 -.961 -198 -11 -559 -.206
-680 -.384 -.109
(577.8 - 573.1)/ 573.1
10/24/60 71.9 3.2%
.983 -.272 -126
-13 -354 -.094 -539
-.185 -.066
(571.9 -
.566) / 571.9
S9 8/3/61
4.1%
adv= 149 decl = 926 DJI fell one more day to 566.00
June 8, 1964 should be a Buy B2
800.3
.978 .434 -103 -20 -283
-225 -664 -.391 -.005
8/1/1968 878/07 11.3% .972
-.313 -143 -4 -329 -.049 -15
-.242 -.036
(878.07 - 869.65) /
878.07
5/2/72 935.2 3.2%
.977 -.071 -110 -24
-235 -.036 -1 .132 .03
S12 5/22/72
5.6%
(935.2 - -925.12)/ 935.2
adv= 501 decl = 980 DJI fell one more day to 933.47
7/18/72 911.72 3.9% .978
-425 -179 -9 -383 -.094 -3 -.34
-.062
( 911.72 - 910.45) / 911.72-
S9 8/3/72
2.7%
adv= 443 decl = 820 DJI rose next day
10/16/72 921.66 13.7%
0 .976 -.323 -134
-21 -287 -.093 -3 -.177
-.001
S4 12/11/72 15.6%
adv= 415 decl = 985 DJI rose next day
10/5/76 966.76
1.8%
(966.76 -- 931.43) / 966.76
S4 12/22/76
9.4%
adv= 418 decl =1022 DJI fell one more day to 959.69
Dec 1976?
10/27/1980 931.74 +5.9% .98 -.105
-49 23 -95 -.094 -3 .04 .014
(931.74 - 917.75 )/ 931.74
Dec 1980
7/24/1984 1086.57 % 0
-.473 -219 -21 -383 -.-67 -14 -.308
-.066
1825.89 - 1086.57) / 1086.57
Should be a Buy on
10/9/1984 .975
-.27 -31 5 -54 -.17 -5 -.105
.034
Dec 1984 hould be a Buy on
12/10/1984 .98
-.56 -150 0 -263 -.134 -11
-.229 -.041
7/22/1988 +5.6% .976 -.478 -136
-67 -233 .024 -26 -.209 .039
(2066.99 - 1990.22)/ 2066.99
Should be a Buy on 11/14/1988 .964 -.378 -15
-22 -265 .027 -15 -.043 .013
8/21/92 3254.1 21.9%
.976 -.128 48 -28 93 -.061 -8
-.186 -.043
(3254.1 -
3136.58) / 3254.1
??? S4 2/3/94
7.4%
adv= 669 decl =1036 DJI fell one more day to 3228.17
4/11/1996 5487.07 4.8%
-.205 0
-6 1 .035 -16 -.068 .065
( 5487.07 -
5420.95 )/ 5487.07
5/7/1996 5420.95 6.0% 0
.979 -.372 41
82 52 -.034 -4 -.012 .008
7/11/96
5520.54
23.8%
S9 4/22/97 -4.9%
(
5520.54- 5346.55 )/ 5520.54
adv= 531 decl =2020 DJI fell two more days to 5349.51
Dec 1996 ?
4/17/2000 +5.1%
.964 -.014 -73 -14 -73 -.033 -71 -.18
-.098
X
5/3/00
10480.13
7.9%
S4 9/6/00
9.6%
adv= 815 decl =2149 DJI fell one more day to 10412.49
5/22/2000 +4.1% .985 -.335 -123 -50
-123 -.001 -62 -.071 .002
(10542.55 - 10299.24
)/10542.55
6/22/2000
.981 -.051 117 -32 117 -.06
-51 .07 -.051
(10404.75 - 10376/12)/
10404.75
10/2/2000 10700.13 +2.0% .977 -.558 -145
-47 -146 -.065 -115 -.245 .028
BAD (10700.13 - 9975.02 )/ 10700.13
Dec 2000
5/18/04 9968.51 3.5%
.976 -.546
-454 70 -425 -.082 337 -.056 -.067
( 9968.51 -
9814.66)/ 9 9968.51
7/19/04 10894.05 +2.2%
.98 .327 243 -16 227 -.10 -161 -.149
-.028
(10894.05 - 9814.66) / 10894.05
S2
9/2/04 3.8%
adv= 2389 decl = 924 DJI fell two more days to 9937.64
10/15/04 9933.38 10.1%
.983 -.366 94
-21 88 -.047 -145 -.028 -.024
(9933.38 - 9749.99) / 9933.38
7/8/2008 1384.21 +2.2% .966
-.831 -642 150 -578 -.157
-335 -.064 -.11
(11384.21 -10962.54) /
11384.21
S9 7/23/08
6.1%
adv= 2165 decl =1037 DJI rose next day
4/10/2012 11715.93 4.4% 0%
.969 -.187 -253 -160 -253 .025 -126 -.078
S15 5/1/12
13279.32
( 11715.93 -
)
adv= 462 decl =2612 DJI rose next day to 12805.29
X Buy B2
5/14/2012 3.5
12695.35
====
adv= 481 decl =2607
10/23/2012 13102.53
-.403 -38 -39 -38 -.154 -98 -.078
.028
13102.53 -
12542.38) BAD!
11/13/2012 12756.18 .969 -.515 -146 -99 -146
-.145 -128 .01 -.032
Good and Nov is
reliable.
-----------------------------------------------------------------------------------
Presidential Election years often feature DJI prices getting
caught in a trading
range for a significant part of the middle of the year and the rallies from October
lows. These tendencies allows us to buy profitably at the lower band using our Buy
B2.
This is made safer because Sell-offs of more than 10% are rare after April
in Presidential
Election
years. Of course, 1920, 1932, 1960 and 2008 are notable exceptions, as prices
in these years fell more than 10% after April. In each of these 4 cases, there was a
serious economic slow-down under way. Will 2012 be able to hold up?
So, buying at the lower band or well-tested support works well most of the time
in May or June and from August to October. Trading ranges dominated the DJI for the
Presidential Election Years as follows:
1916 - Slightly declining trading range until mid August.
1920 - Declining trading range until end of October.
1924 - Flat trading range from August to end of October.
1928 - mid March to mid August trading range followed by an
upside breakout.
1932 - Sell-off until June. August to September was a
head/shoulders top.
1936 - April Sell-off. Trading
range from July to end of September.
1940 - May Sell-off and rising
price channel from June to October.
1944 - Flat trading range from mid June to end of November.
1948 - Flat trading range from mid April to end of October.
1952 - Rising price channel from mid January to mid November.
.
1956 - Broad trading range from January to end of December.
1960 - Trading range from March
to end of August.
1964 - Rising Price Channel for entire year.
1968 - Flat Trading range from early April to end of August.
1972 - Flat Trading range from early March to end of October.
1976 - Flat Trading range from February to mid September.
1980 - Flat Trading range from August to end of December.
1984 - Flat Trading range from August to end of December.
1988 - Rising Price Channel for entire year.
1992 - Flat trading range for entire year.
1996 - Flat trading range from February to early September.
2000 - Flat trading range from mid March to end of September
2004 - Rising Price Channel for entire year
2008 - Declining trend all year, except for brief
head/shoulder until mid November.
Buy B2s are Presidential Election Year Buys at the lower band from April
to December, except in September and November. The lower band is more often
fully tagged with these signals. The DJI should close more than 1.2% but not
more than 5% below the 21-day ma. The annualized Daily Rate of Change of
the 21-day ma must not be less than -61% with the V-Indicator below -200. Buy B2s
are not allowed in September; the probability of a sell-off sometime in late September
and October are too high. Other Buys take their place in November, but they can
occur in December, because the odds of a late December rally are so high.
We do have to be careful with Buy B2s. Major support could decisively
fail just after a Buy B2. Such support failures usually bring Sell S10s or judged
S10s. These bring additional sell-offs even when the computer cannot spot
a breakdown as a Sell S10 because it is not flat or the support level does not
last the requisite 40 trading days. Use the Tiger Sell S5 to find such breakdowns.
Waiting to see if a diagonal support holds or fails is probably a good tactic especially
in October.
It is also risky to use a Buy B2 within a month of a previous Buy B2, because this could
be the sign of a head and shoulders top formation. The case of mid 2012 stands out
because the second Buy B2 did occur as prices declined from a right shoulder-like
formation to the critical neckline support. A breaking of this particular support
was judged on 5/15/2012 here to be too dangerous to allow the Buy B2 to stand.
Disallow a Buy B2 with 30 trading days of an earlier B2. 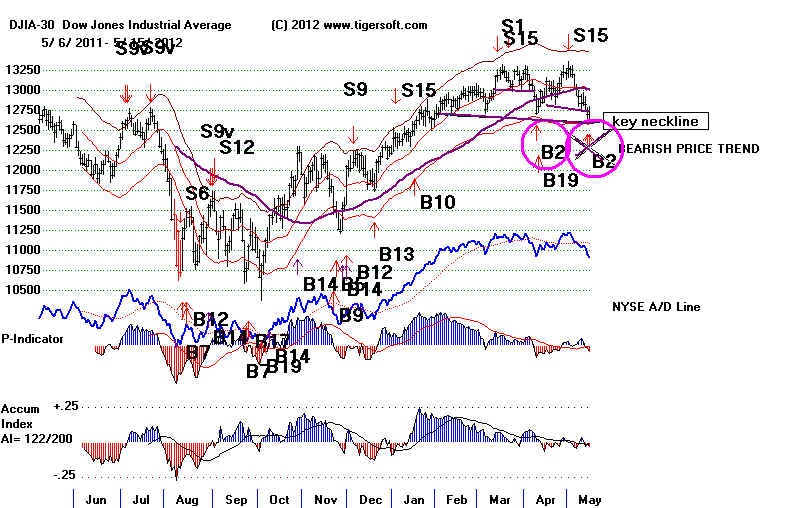
Buy B2s, as in March
1980, can occur after a serious
decline.
| Up until 2012, there have been 16 reversing Buy B2s since 1928 that have been closed out. . All were profitable. The average gain was 8.4%. Note the signals' distribution by month: May 5 6.9% avg. but only 4.4% since 1960 July 4 August 1 October 4 December 1 When breadth is negative on the day of the Buy B2, the odds are nearly 75% that the DJI will fall, at least, one more day, Reversing Buy B2s: 1928-2013 Date DJIA Pct. Gain Reversing Sell ---------------------------------------------------------------------------------------------------------------------- Buy B2 12/7/28 271.1 15.3% S9 1/30/29 3.6% adv = 110 decl 598 DJI fell one more day to 263.9 Buy B2 5/5/36 148.6 14.1% S2 9/8/36 2.6% adv= 519 decl = 135 DJI rose next day BuY B2 5/1/52 256.4 6.0% S10 9/10/52 1.7% adv= 160 decl = 728 DJI rose next day Buy B2 10/15/52 267.1 9.3% S8 12/30/52 6.1% adv= 120 decl = 915 DJI fell one more day to 264.9 Buy B2 7/18/60 626 1.3% S1 8/29/60 8.9% adv= 335 decl =635 DJI fell five more day to 601.7 Buy B2 10/24/60 571.9 3.2% S9 8/3/61 4.1% adv= 149 decl = 926 DJI fell one more day to 566.00 Buy B2 5/2/72 935.2 3.2% S12 5/22/72 5.6% adv= 501 decl = 980 DJI fell one more day to 933.47 Buy B2 7/20/72 910.45 4.1% S9 8/3/72 2.7% adv= 443 decl = 820 DJI rose next day Buy B2 10/16/72 921.66 12.4% S4 12/11/72 15.6% adv= 415 decl = 985 DJI rose next day Buy B2 10/5/76 966.76 1.8% S4 12/22/76 9.4% adv= 418 decl =1022 DJI fell one more day to 959.69 Buy B2 8/21/92 3254.1 21.9% S4 2/3/94 7.4% adv= 669 decl =1036 DJI fell one more day to 3228.17 Buy B2 7/11/96 5520.54 23.8% S9 4/22/97 -4.9% adv= 531 decl =2020 DJI fell two more days to 5349.51 Buy B2 5/3/00 10480.13 7.9% S4 9/6/00 9.6% adv= 815 decl =2149 DJI fell one more day to 10412.49 Buy B2 5/18/04 9968.51 3.2% S2 9/2/04 3.8% adv= 2389 decl = 924 DJI fell two more days to 9937.64 Buy B2 7/8/2008 11384.21 2.2% S9 7/23/08 6.1% adv= 2165 decl =1037 DJI rose next day Buy B2 4/10/2012 11715.93 4.4% S15 5/1/12 13279.32 adv= 462 decl =2612 DJI rose next day to 12805.29 Buy B2 5/14/2012 12695.35 ==== adv= 481 decl =2607 ---------------------------------------------------------------------------------------------------------------------------- N=16 Avg.= +8.4% |
All
Buy B2s (both reversing and reinforcing)
Count of All Buy B2s by Month
Month Count
Average Gain
--------- ---------
-------------------
April
6
+8.0%
May
9
+5.2%
June
2
+8.5%
July
8
+2.9% low
August
5
+7.2%
September none -
not allowed
October 13
+9.8%
November none - not
allowed
December 1
+15.3%
----------------------------------------------
44 Avg.Gain = +6.9%
There were 43 Buy B2s, counting only the first such signal in a cluster.
The average gain at the time of the next Peerless Sell is 7.0%. All but one
wase profitable. 19 of the 43 trades brought small gains, +1% to 5%. 8
produced
gains of more than 10%. There were 3 cases where B2s brought gains of more
than 20%. October B2s were generally the most powerful. July B2s were
relatively weak, gaining only +2.9%.
Paper losses should be about expected half the time. There were 23 instances
where a Buy B2 brought a paper loss of more than 1%. 3 showed a bigger loss
than
than 4%. The best support in these cases was the first quarter low.
Biggest Paper Losses
Presidential Election years often feature DJI prices getting caught in a trading
range for a sustained part of the Summer, with a price breakdown and bottom in October
and then a rally after the Election is over so that partisans can celebrate with
buy orders as prices near a top which then leads to a decline the next year. The
Peerless Buy B2s take advantage of this tendency.
When employing the Buy B2, recognize that a deeper decline may occur if
well-tested support lies below the lower band. Take into account where the added
risks if there has already been a speculative boom, as in 1999-2000, and the NYSE
A/D Line has been lagging for some time. Mid-October sell-offs can bring a deeper
decline, even though there has been a Buy B2 in early October. The presence of a
completed head and shoulders pattern also adds extra downside risk, as in 1956.
Buy B2s that come in too close a succession may be considered less trustworthy,
because they thereby become too obvious or they may signify a bearish head and
shoulders top is forming. There are no cases of separate Buy B2s that come within a
month of each other, except the disallowed one in May 2012.
Below are the four biggest paper losses when taking an automatic Buy B2 and
their Peerless charts.
1. 8% paper loss 5/15/1956 - The lower band did
not work because of the presnce
of a very broad trading range. In this case, there was a completed
head/shoulders pattern, which warned of more weakness..
2. 5% paper loss 10/5/1976 - Mid-October
sell-off went below the lower band to well-tested
horizontal support. Early October B2s can be somewhat premature.
3. 5% paper loss 8/10/1988 - The best support was at the
bottom of the price channel.
4. 9% paper loss 10/2/2000 - Mid-October sell-off went
below the lower band to well-tested
horizontal support.
Buy B2 -
8% paper loss 5/15/1956 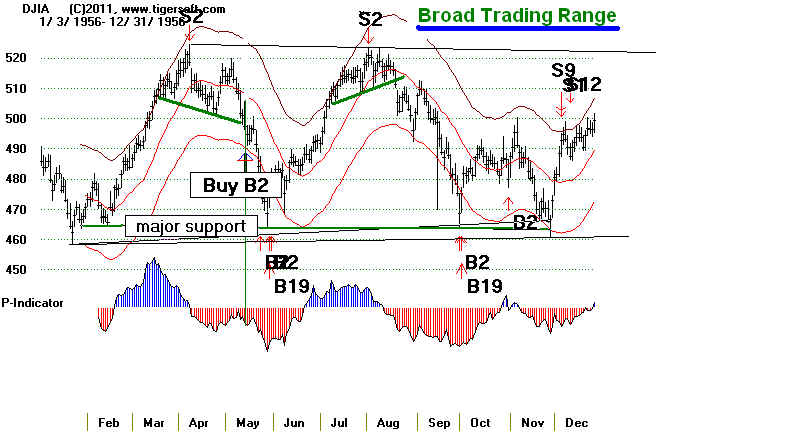 |
Buy B2 - 5% paper loss 10/5/1976 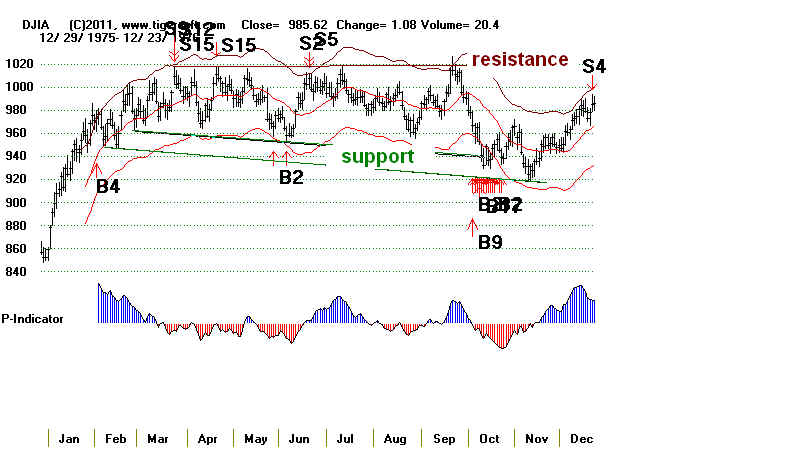 |
Buy B2 - 5% paper loss 8/10/1988 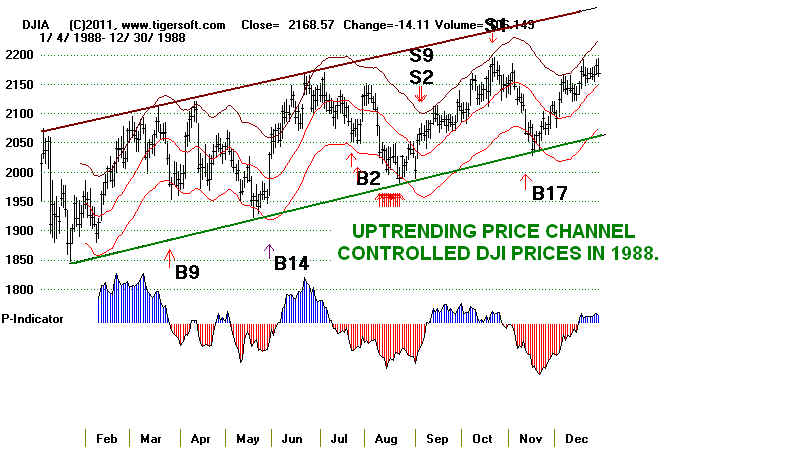 |
| Buy B2 - 9% paper loss 10/2/2000 |
Paper Losses and Buy B2s
In light of the paper losses, one might decide to buy on additional weakness
after a Buy B2, but this would have resulted in chasing and buying at much higher prices
in those cases where the Buy B2 was a reversing signal and the gains were
more substantial. In 8 of the 23 cases where the Buy B2 reversed a Peerless
Sell,
the B2's gain was more than 5%. The three cases where the resulting gains
were +25.1%, 13.7% and 21.9% are reason enough not to delay buying very much
when a Buy B2 occurs.
10/24/1960 Gain
= +25.1%
10/16/1972 Gain = +13.7%
8/21/1992
Gain = + 21.9%
Weak price momentum can be reversed by a Buy B2, as long as the
DJI does not close more than 5% below the 21-day ma or the 21-dma is not
falling at a rate or more than an annualized rate of 97%. There are 9 Buy B2s
where the ANN-ROC is lower than -60% but not lower than -97%. Each brought
a gain of more than 3%. The median gain is 4.6% in these cases.
B2 Date
Ann
Roc IP21
%Gain of a Buy B2
5/5/1936
-.887
-.097
Gain = 5.5%
Reversing Buy....No paper loss.
5/13/1936
-.83
-.035 Gain = 3.3%
Not a reversing Buy Signal. No paper loss.
10/1/1956
-.656
-.186
Gain = +5.1%
Reversing Buy.
This was a paper loss of 1%
10/3/1960
-.961
-.206 Gain = +3.2%
Reversing Buy.
No Paper Loss
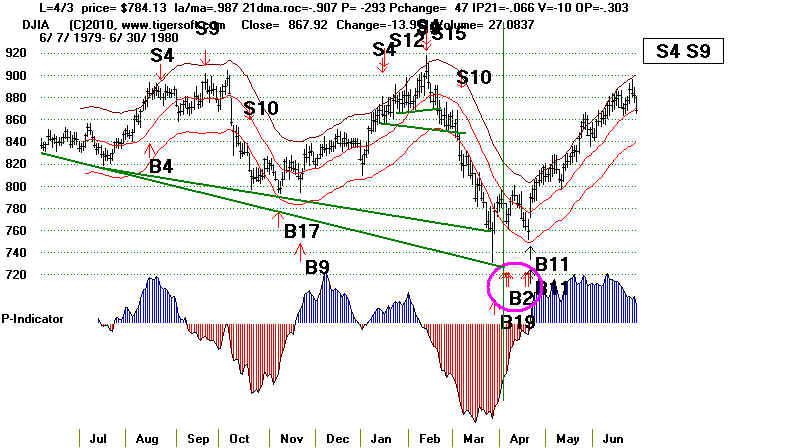
4/3/1980
-.907
-.066 Gain = +21.3%
Not a reversing Buy. Paper loss = 3%
6/15/1984
-.704
-.125 Gain = +12.8%
.
Not a reversing Buy. No Paper loss
7/11/1996
-.312
-.013
Gain = + 3.4%
Reversing Buy. Paper Loss
= 2%
7/8/2008
-.831
-.157 Gain
= + 2.2%
Reversing Buy. Paper Loss = 4%
. October
Buy B2s Are The Most Bullish
October Buy B2s are the most common and also the most likely to bring a
gain of more than 5%. 8 of the 13 B2s in October produced gains of more
than that at the time of the next Buy. Two were responsible for 24% gains.
I believe Buy B2s are successful because partisans regularly celebrate the outcome
of the Presidential Election. This is once of the most reliable season patterns
in the stock market. There were no Buy B2 losses, but 2 showed paper losses
of more than 5%. Both were in early October.
10/5/1976
966.76
Gain = +3.0%
.974 -.268
-13 -46 -.001 -1
-.265
DJI fell to 922 in mid October and then rallied to 1000.08 and Sell S2 on
12/28/77.)
Reversing Buy. Paper loss = 5%
10/2/2000
10700.13
Gain = + 0.1%
.977 -.558 -145
-47
-.065 -115
-.245
DJI fell to 9700 intra-day on 10/18/2000 and then rose to 10712.91 and Sell S12 on
12/8/2000
Not a reversing Buy Paper Loss = 9%
More B2s followed from 10/6/2000 to 10/23/2000. These were not used here in the
calculations.
The signals are more likely to work out more powerfully if the P-Indicator and
Accumulation Index show higher levels then on the previous low at the time
of the Buy B2.
BUY B2s: 1928-2012
1.
12/7/1928 271.1
Gain = 15.3%
.966 .442 -52 -40 -.03 -652
.223
Just
before the B2, the DJI was significantly above the Buy B2.
Reversing Buy....3% paper loss.
--------------------------------------------------------------------------------------------------------------------------
None in 1932
--------------------------------------------------------------------------------------------------------------------------
2.
5/5/1936
148.60
Gain = 5.5%
.967 -.887 -141 24 -.097 -423 -.066
Just before the B2, the DJI reached the Buy
B2.
Reversing Buy....No paper loss.
--------------------------------------------------------------------------------------------------------------------------
X - This B2 follows too closely an earlier B2.
5/13/1936 147.9
Gain = 3.3%
.986 -.83 -.92 36 -.035 -295
-.188
Not a reversing Buy Signal. No paper loss.
-------------------------------------------------------------------------------------------------------------------------
3.
8/21/1936
160.80 Gain = + 5.5%
.968 -.272 -.56 -38
-.144 171 -.071
Just before the B2, the DJI reached the Buy
B2.
Not a reversing Buy Signal...No paper loss.
-------------------------------------------------------------------------------------------------------------------------
None in 1940
--------------------------------------------------------------------------------------------------------------------------
4.
4/18/1944 135.1 Gain = +
9.5%
.976 -.489 -102 -34
-.233 -176 -.296
Next sell was on Sell S2 at 147.9 on 6/21/44
In next week, there were B2s on 4/1944 and 4/21/44
Not a reversing Buy Signal. No paper loss.
---------------------------------------------------------------------------------------------------------------------------
5.
10/26/1944
145.80 Gain = + 12.5%
.988 -.056
13 -20 .13 -28 -.144
The next sell was on Sell S9 at 154 on 5/15/45.
Continuation Signal. No paper loss.
-------------------------------------------------------------------------------------------------------------------------
6.
7/19/1948
181.2 Gain = +2.3% Paper
loss - (191.2-176)/181,2 =
3%
.971 -.503 -90
27 -.052 -250 -.08
A Buy B2 after a completed H/S Pattern like the one shown below is
risky.
DJI fell to 176 on 9/27 before rallying to 186.2 and Sell S1 on
10/19/48.
There were 5 more Buy B2s up until 8/2/1948 as part of this cluster.
Not a reversing Buy
Signal. Paper loss =3%.
At this
time, B2s also appeared on 7/20/48-8/3/48. Only the first
occurrence in this series is considered here.
--------------------------------------------------------------------------------------------------------------------------
7.
5/1/1952
256.4 Gain = +6.0%
.979 -.49
-171 -7 -.054 -320 -.374
DJI rallied immediately to 280 and then formed a head/shoulders top.
This was a reversing
Buy Signal. No
Paper loss.
-------------------------------------------------------------------------------------------------------------------------
8.
10/15/1952
267.10 Gain = +9.3%
.987 -.057
-49 -16 -.009 -133
-.114
DJI fell to 263. 2% paper loss. Rallied to Sell S8 at 292 on 12/30/1952.
This was a reversing Buy.
At this time, there was another Buy B2 on `10/22/52 at 263.1. It is not
separated out here
for statistical purposes.
--------------------------------------------------------------------------------------------------------------------------
9.
5/15/1956
494.80 Gain = +3.9%
.975 -.337
-80 -16 -.154 334
-.294
DJI fell from 510 to a low of 467 on 5/28/1956.
It then rallied to Sell S9 at 513.9 on 8/6/56.
The additonal Buy B2s here from 5/16/56 to 5/29/56 are considered part of the
same set.
This was not a reversing Buy. Paper
Loss = 8%
------------------------------------------------------------------------------------------------------------------------
10.
10/1/1956
468.70 Gain = +5.1%
. .949 -.656 -173
-5 -.186 -462 -.394
DJI fell from 468.70 to a low of 463 on 11/29/1956. This was a paper loss of 1%
It then rallied to Sell S12 at 492.7 on 12/6/56.
Reversing Buy.
There was a second Buy B2 on the next
day, 10/2/1956, with the DJI at 479.9
-----------------------------------------------------------------------------------------------------------------------
X - Disallow this B2 because it occcured too
close to an earlier B2.
10/31/1956
479.90 Gain = +2.7%
.99 .111
-12 -67
.029 -123 -.097
DJI fell from 479.90 to a low of 463 on 11/29/1956. This was a paper loss of 3%
It then rallied to Sell S12 at 492.7 on 12/6/56.
This was not a reversing Buy.
----------------------------------------------------------------------------------------------------------------------
11.
4/28/1960
604.30
Gain =
+7.5%
.974 -.307 -93
-16 -.135 -416
-.182
DJI bottomed here and rallied to 649.40 and Sell S2 on 6/15/60.
The simultaneous S7 would have delayed this Buy until 5/2/69
when there was another Buy B2.
5/2/1960
599.60
Gain = +8.3%
.969 -.327 -94
0 -.139
-425 -.189
This was not a reversing Buy. No Paper Loss.
----------------------------------------------------------------------------------------------------------------------
12.
7/18/1960
626.00
Gain =
+1.3%
.977 .414 -70
-10 -.084 -381
-.185
DJI fell to 600 and then rallied to 638.2 and Sell S1 on 8/29/60.
3% Paper Loss
and Reversing
Buy.
There were additional Buy
B2s from 7/19/1969 to 7/28/1960.
They are not used in calculating the statistics for Buy B2s.
----------------------------------------------------------------------------------------------------------------------
13.
10/3/1960 577.80
Gain = +3.2%
.97 -.961 -198
-11 -.206 -680 -.384
DJI bottomed here and rallied to 596.5 and Sell S9 on 10/14/60.)
No Paper Loss and Reversing Buy.
----------------------------------------------------------------------------------------------------------------------
X - Disallow this B2 because of earlier B2 being
too close in time.
The Buy B17 the next day was better by being 1%
lower..
10/24/1960 571.90
Gain = +25.1%
.983 -.272 -126
-13 -.094 -539
-.185
DJI bottomed here and rallied to 715.70 and Sell S9 on 8/3/61.
This was a bullish time of the year normally and there were bullish divergences
by the P-Indicator and Accum. Index.
1% Paper Loss
----------------------------------------------------------------------------------------------------------------------
1964 - no trades
----------------------------------------------------------------------------------------------------------------------
14.
8/1/1968
878.07 Gain = +2.5%
.972 -.313 -143
-4 -.049
-15 -.242
DJI bottomed at 868 and rallied to 900.36 and Sell S2 on 9/4/68.
Paper Loss = 1% and Not a
Reversing Buy.
There were additional B2s on 8/2/68 to 8/9/68.
They were not used in the statistics.
----------------------------------------------------------------------------------------------------------------------
15.
5/2/1972
935.2 Gain = +3.2%
.977 -.071 -110 -16
-.036 -1 .133
DJI fell to 931 and rallied to 965.31 and Sell S12 on 5/22/72
0.4% Paper Loss and Reversing Buy.
----------------------------------------------------------------------------------------------------------------------
16.
7/20/1972
910.45 Gain = +4.1%
.979 -.483 -178 -16
-.138 -3 -.336
DJI bottomed here and rallied to 947.7 and Sell S12 on 8/3/72
No Paper Loss and Reversing Buy.
----------------------------------------------------------------------------------------------------------------------
17.
10/16/1972
921.66
Gain = +13.7%
.976 -.323 -134 -21
-.093 -3 .232
DJI bottomed here and rallied to 1047.9 and Sell S9 on 1/5/73.
No Paper Loss and Reversing Buy.
----------------------------------------------------------------------------------------------------------------------
18.
10/5/1976
966.76
Gain = +3.0%
.974 -.268
-13 -46
-.001 -1 -.265
DJI fell to 922 in mid October and then rallied to 1000.08 and
Sell S2 on 12/28/77.)
Reversing Buy.
Paper loss = 5%
----------------------------------------------------------------------------------------------------------------------
19.
4/3/1980
784.13
Gain = +21.3%
.987 -.907 -293
47 -.066 -10 -.303
DJI fell to 757 in mid April and then rallied to 950.94 and Sell S2 on
8/7/80.
Not a reversing Buy. Paper loss = 3%
----------------------------------------------------------------------------------------------------------------------
20.
10/27/1980
931.74 Gain = +5.9%
.98 -.105
-49 23 -.094
-3 .04
DJI fell to 918 four days later and then rallied to 986.35 and
Sell S9 on 11/14/80.
Not a reversing Buy. Paper loss = 1%
There were B2s also on 10/30/1980-10/31/80. These were not used in
calculating statistics.
----------------------------------------------------------------------------------------------------------------------
21.
7/22/1984
1086.57 Gain = +12.8%
.972 -.473 -210
-21 -.067
-14 -.308
DJI bottomed here and then rallied to 1225.93 and Sell S1 on 10/19/1984.
Not a reversing Buy.
----------------------------------------------------------------------------------------------------------------------
22.
.
10/10/1984
1177.23 Gain = +4.1%
.978 -.205 -53
-23 -.101 -5
-.011
DJI bottomed here and then rallied to 1225.93 and Sell S1 on 10/19/1984.
Not a reversing Buy. No Paper Loss.
----------------------------------------------------------------------------------------------------------------------
23.
7/22/1988
2066.99
Gain = - 0.1%
.976 -.478
-136 -67 .024
-26 -.209
DJI bottomed at 1990 in mid August and then
rallied to 2065.26 and Sell S2 on 9/6/1988.
Not a reversing
Buy. Paper loss = 4%
Another B2 followed on 7/27/2008 that was not used here
in calculations.
----------------------------------------------------------------------------------------------------------------------
X - This B2 is cancelled because of
earlier B2 being to close in time.
8/10/1988
2034.14
Gain = 1.5%
.969 -.331 -153
-28 .042 -15
.084
DJI bottomed at 1990 in mid August and then rallied to 2065.26 and Sell S2 on
9/6/1988.
Paper loss = 5%
More B2s followed from 8/11/2008 to 8/23/2008. These
were not used here in the calculations.
----------------------------------------------------------------------------------------------------------------------
24.
8/21/1992
3254.10
Gain = + 21.9%
.976
.128 48
-28
-.061 -8 -.186
DJI bottomed here, then rallied to 3350 and then declined to 3150
before again rallying up throughout 1993.
Reversing Buy. Paper Loss = 3%
More B2s followed from 8/24/2008 to 8/25/2008. These were not
used here in the calculations.
----------------------------------------------------------------------------------------------------------------------
25.
10/15/1992
3174.68
Gain
= + 25.0%
.982 -.531
-113
12
-.005 26
.346
DJI bottomed at 3135 a week later and then rallied to 3967.66 at
beginning of 1994.
Not a reversing Buy. No Paper Loss
----------------------------------------------------------------------------------------------------------------------
26.
4/11/1996
5487.07 Gain = + 3.4%
.977 -.205
0
-6
.035
-16 -.067
Also a Buy B9
DJI fell to 5400 intra-day on 5/8/96 and then rose to 5673.83 and Sell S1 on
5/29/96
Not a reversing Buy. Paper Loss = 2%
---------------------------------------------------------------------------------------------------------------------------------------------
X - This B2 is cancelled because of earlier B2
being to close in time.
If the head/shoulders pattern had been completed there,
it would have been bad for this Buy B2.
5/7/1996
5420.95
Gain = + 4.7%
.979 -.372
41
82
-.034 -4
-.012
Also a Buy B9
Not a reversing Sell. No paper loss.
Another B2 followed on 5/12/1996 but was not counted in calculated in
counting statistics.
---------------------------------------------------------------------------------------------------------------------
27.
7/11/1996
5520.54 Gain = + 3.3%
.977 -.312 -225
-67 -.013
-47 -.134
DJI fell to 5250 intra-day and then rose for rest of year.
Reversing Buy. Paper Loss = 6%
More B2s followed from 7/16/1996 to 7/24/1996. These
were not used here in the calculations.
----------------------------------------------------------------------------------------------------------------------
28.
4 /17/ 2000
10582.51
Gain = + 5.1%
.964 -.014
-73
-14
-.033 71
-.18
DJI fell to 10250 intra-day on 6/30/2000 and then rose to 10804.27 and Sell S12 on
7/17/2000
Not a reversing Buy Paper Loss = 3%
More B2s followed from 4/18/2000 to 4/24/2000. These were not used here in
the calculations.
----------------------------------------------------------------------------------------------------------------------
X - This B2 is cancelled because of earlier B2 being
to close in time.
5 /3/ 2000
10480.13 Gain = + 7.9%
.962 -.808
-111
-64
-.049 -93
-.181
DJI fell to 10250 intra-day on 6/30/2000 and then rose to 10804.27 and Sell S12 on
7/17/2000
Reversing Buy. Paper Loss = 3%
More B2s followed from 5/4/2000 to 5/11/2000. These were not used here in the
calculations.
---------------------------------------------------------------------------------------------------------------------------------------------
29.
5 /22/ 2000
10542.55
Gain = + 7.3%
.985 -.335
-123 -50
-.001 -62
-.071
DJI fell to 10250 intra-day on 6/30/2000 and then rose to 10804.27 and Sell S12 on
7/17/2000
Not a reversing Buy Paper Loss = 3%
More B2s followed from 5/24/2000 to 5/26/2000. These
were not used here in the calculations.
----------------------------------------------------------------------------------------------------------------------
30.
6 /22/ 2000
10376.12 Gain = +4.1%
.981 -.052
117 -32
-.06 -51
-.07
DJI fell to 10250 intra-day on 6/30/2000 and then rose to 10804.27 and Sell S12 on
7/17/2000
Not a reversing Buy Paper Loss = 2%
----------------------------------------------------------------------------------------------------------------------
31.
10/2/2000
10700.13
Gain = + 0.1%
.977 -.558
-145
-47 -.065 -115
-.245
DJI fell to 9700 intra-day on 10/18/2000 and then rose to 10712.91 and Sell S12 on
12/8/2000
Not a reversing Buy Paper Loss = 9%
More B2s followed from 10/6/2000 to 10/23/2000. These were not used here in
the calculations.
----------------------------------------------------------------------------------------------------------------------
32.
5/18/2004
9968.51
Gain = + 3.2%
.976 -.546 -454
70
-.082 -337 -.056
DJI rose immediately and then rose to 10400 and then fell back to 9900 in July
and then rose again to Sell S2 on 9/7/2004
Reversing
Buy. Paper Loss = 2%
More B2s followed from 5/19/2004 to 5/21/2004. These were not used here in the
calculations.
----------------------------------------------------------------------------------------------------------------------
33.
7/19/2004
10094.06
Gain = + 1.9%
.98 -.327
243 -16
-.1
-161 -.049
DJI fell to 9800 intra-day on 8/13/2004 and then rose to 10342.79 and
Sell S2 on 9/7/2004
Reversing Buy. Paper Loss = 3%
More B2s followed from 7/21/2004 to 7/23/2004. These were not used here
in the calculations.
----------------------------------------------------------------------------------------------------------------------
X - This B2 is cancelled because of earlier B2 being to
close in time.
X.
8/6/ 2004
9815.33 Gain = + 4.8%
-.972 -.419 -57
10
-.049 -273 .024
DJI rose immediately then rose to 10342.79 and Sell S2 on 9/2/2004
Not a revewrsing Buy
Another B2 followed on 8/9/2004
----------------------------------------------------------------------------------------------------------------------
34.
10/15/2004
9933.38 Gain = + 9.3%
.983 -.366 94
-21 -.047
-145 -.028
DJI fell to 9740 intra-day on 10/25/2004 and then rose to 10854,54 on
12/28/2004.
Not a revewrsing Buy Paper Loss = 2%
----------------------------------------------------------------------------------------------------------------------
35. 7/8/2008
11384.21 Gain = + 2.2%
.966 -.831 -642
-157 -.157 -335 -.065
DJI fell to 11000 intra-day a few days later and then rose to 11632 on
7/23/2008 where an S9 occurred.
Because of the steepness of the decline (ROC = -.831)and low V-Indicator
(-335) readings, we were not
surprised that there was more weakness.
Reversing Buy. Paper Loss = 4%
------------------------------------------------------------------------------------------------------------------------------------------------
36.
4/10/2012
12715.93 Gain = + 4.4%
.969 -.187 -253
-160
.025 -126 -.078
DJI immediately rallied back to its previous highs where a Sell S15 reversed
the trend.
Reversing Buy. No Paper Loss
------------------------------------------------------------------------------------------------------------------------------------------------
X - This B2 was cancelled because of earlier B2 being to
close in time.
The Buy B2 here was ruled too dangerous because of what
might happen if the key support
was broken.
4/10/2012
12695/35
September
Buy B2s Are Not Allowed.
Octobers Often Bring Clmax Selling.
October Bottoms Make for Much Better Buys By Than September.
In Septembers there should be no Buy B2s. In 4 cases a Buy B2 would
have worked out, but in 9 cases, it would have been better to wait for October.
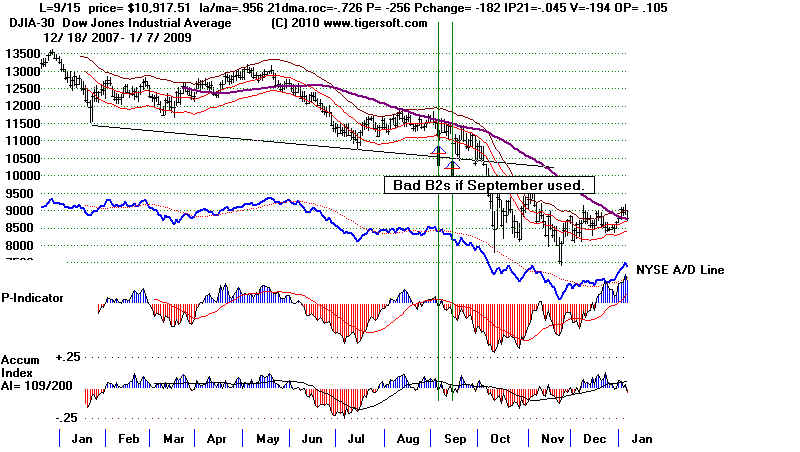
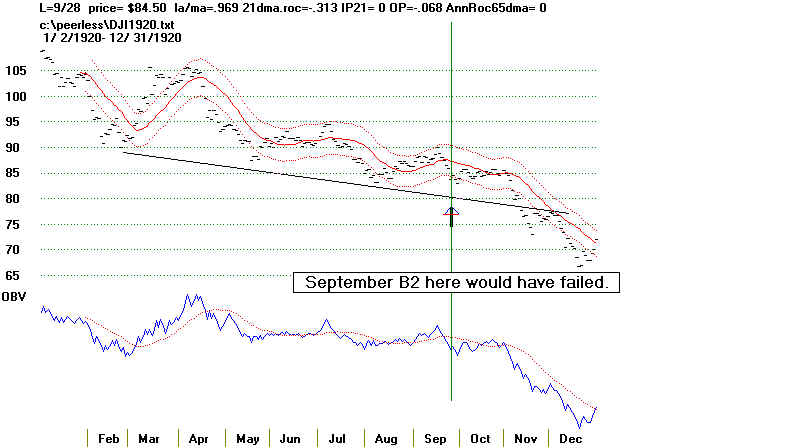
September B2's can lose a lot of money. If you have any doubts, see the charts of
1920 and 2008 in the charts below the list of signals.
.
Only in 1924, 1932, 1944 and 1948 would buying at the lower band in September
in a Pres. Election Year have worked out.
There were 11 Septembers where the 3.0% lower band was not reached.
Hypothetical
B2s in Septembers of Presidential Election Years: 1916 - 2008
1916 - No B2 pullback in Sept.
1920 - September and October B2 would have lost 20% by
December.
1924 - A Buy B2 4.0% below 21-dma would have worked for a
rally to 3.0% upper band.
1928 - No B2 pullback in Sept
1932 - Buying 6.6% below 21-d ma and selling at upper band
would have worked in Sept.
1936 - No B2 pullback in Sept
1940 - No B2 pullback in Sept. Good one on October.
1944 - There was a B9 in September. Market rose from it.
1948 - There was a B9 in September. Market rose from it.
1952 - A September B2 would have been premature, as there was
a better October B2.
1956 - There was a good B2 on 10/1 -Rally to 3% upper band.
Later it gained 5.1%
1960 - Any Sept. B2 would have been premature. 10/3 Buy B2
gained 3.2%
1964 - No B2 pullback in Sept.
1968 - No B2 pullback in Sept.
1972 - Better buying opportunity in October. 10/16 B2 worked
out.
1976 - Better buying opportunity in October.
1980 - No B2 pullback in Sept
Buy B19 on 9/30 worked out.
1984 - Better Buy B2 on 10/10 worked out, gaining 4.1%
1988 - No Buy B2 pullback in Sept.
1992 - Better Buy B2 on 10/2. Good gain.
1996 - No B2 pullback in Sept.
2000 - Much Better Buy B2 later in October.
2004 - No Buy B2 pullback in Sept. Good one in October.
2008 - Much Better Buy B2 later in October.
DJIA - 1920 - Do Not Buy at Lower Band using Buy B2
DJIA - 2008 - Do Not Buy at Lower Band using Buy B2