20-Day Stochastic Pct-D Sell
in A Presidential Election Year
There have been 22 Sell S1s since 1928. The average DJI decline from them until the
next Buy signal was 5.6%. None brought a loss. Shorting on a Sell S1 would generally
have been most profitable in the Year of Mid-Term Elections, in the first 10 days of the
month. February and March Sell S1s brought the smallest declines.
Size of Subsequent Declines
>10% 3
5%-9.99% 6
2%-4.99% 11
0%-1.99% 2
rallies 0 (number of losses if shorted.)
Sell S1s:
1928-203119360402 S1 160.4 .067
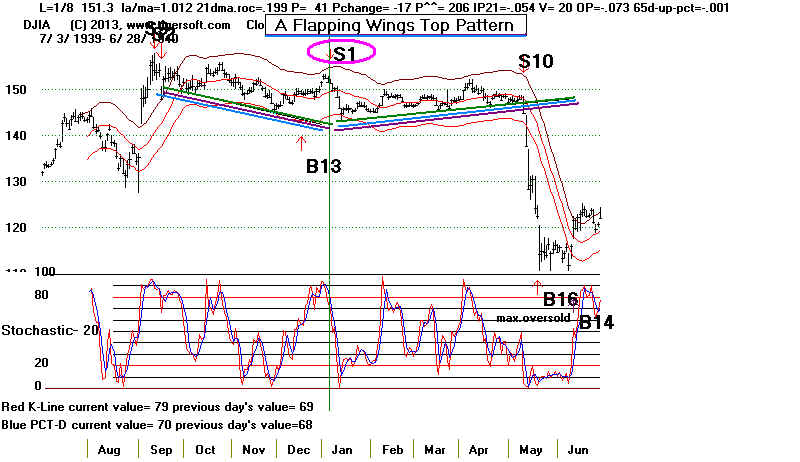
19400108 S1 151.3 .036
19520128 S1 274.2 .065
19561212 S1 487.5 .036
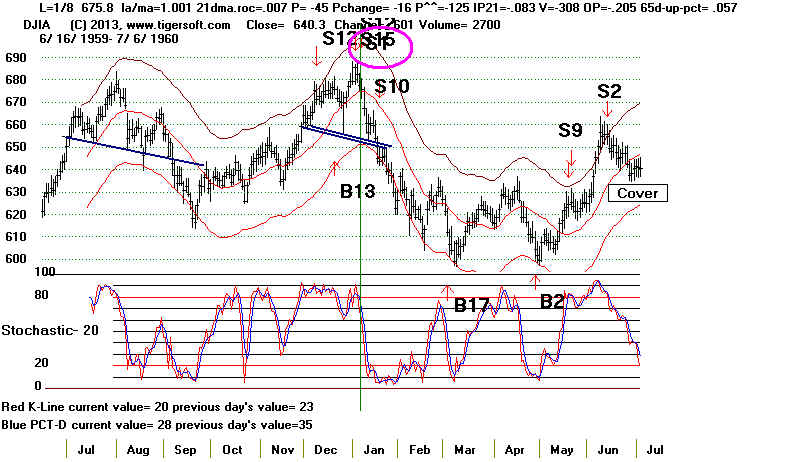
19600108 S1 675.8 .094
19600829 S1 634.4 .08
19620105 S1 714.8 .158
19620409 S1 692.9 .131
19660921 S1 793.59 .045
19681205 S1 977.69 .062
19720824 S1 958.38 .038
19750910 S1 817.66 .028
19760924 S1 1009.31 .042
19780913 S1 899.6 .120
19880226 S1 2023.21 .022
19881021 S1 2183.5 .053
19910905 S1 3008.5 .04
19940902 S1 3885.58 .023
19940920 S1 3869.09 .019
19960227 S1 5549.21 .011
19960529 S1 5673.83 .029
20120321 S1 13124.62 .024
--------------------------------------------------------
No.= 22 .056
3 6 11 2
PE     14   .047
PE +1   0   ----
PE +2   6   .083
PE +3   2   .034
January 4 .088 February 2 .017 March 1 .024 April 2 .099 May 1 .029 June 0 ---- July 0 ---- August 2 .059 September 7 .045 October 1 .053 November 0 ---- December 2 .049 1-10 8 .076 11-20 3 .061 21-31 11 .039 |
============================================
(C) www.tigersoft and William Schmidt, Ph.D. Last
revised 3/29/2013
Presidential Election
years often get caught in trading ranges for extended periods
of time. A Sell S1 occurs when the DJI reverses
downward from its resistance and its 20-day
Stochastic Pct-D Line drops back below 80.
There are some controls on the signals.
Most important, the DJI must not be below the 21-day
ma when the Sell S1 occurs.
And the P-I should not be more than +25 above the
previous day's P-I on the day of the signal.
This control is important; we want to see internal breadth
weaken with prices and the
Stochastic.
Most Sell S1 gains are modest. The average DJI
decline at the time of the next Peerless
is Buy is 5.46%. The Paper Losses are nearly all
quite small. The average Paper Loss
is less than one percent. All the paper losses were
3.0% and under, except for once case
in October 1948. Working with a stop loss of 3.1% on
a closing basis with Sell S1s
is is recommended.
Sell S1s generally have modest internals. Negative
divergences are not necessary.
The annualized rate of change of the 21-day ma should not
be above +.70. The
average rate of change is .333. But note that 5 of
the 15 Sell S1s occurred with
the DJI up between 9% and 10.8% from its level 65 trading
days earlier. The IP21
Indicator must not be above +.253. Its average value
is .064 on a Sell S1. The Adjusted
P-Indicator must not be more than +343.
Its average is 160. The OPMA must not be
above +.365. Its average is only .075. Only 2
of the 15 Sell S1s had a V-Indicator
reading 50. The highest was a +88.
If a Sell S1 should occur with key values above the highest
previously seen,
I would distrust the signal.
Paper Loss > 4.6%
LA/MA > 1.027
21-dayma ROC >.678
PI > +199
PI Change > +18
Adjusted PI > +343
IP21 > .253
VI > +88
OPct > .365
65-day Pct Change > .108
Sell S1s signals have occurred in January (3), late February (2), March (1),
late May (1), August (2),
September (2) and October (2) and December (2).
Since none took place in
early February, April, June, July or November,
I would discount them in
these months should they occur in the future.
Sell S1s: 1928-2012
Date
Gain
Paper LA/MA
21-dma P-I
P-I
Adj
IP21
V-I
OPct
65-day
Loss
ROC
change P-I
Pct Change
-------------------------------------------------------------------------------------------------------------------------
1/8/1940 +19.7% +0.0% 1.012 .199
41 -17 206 -.054
20-.073-.001
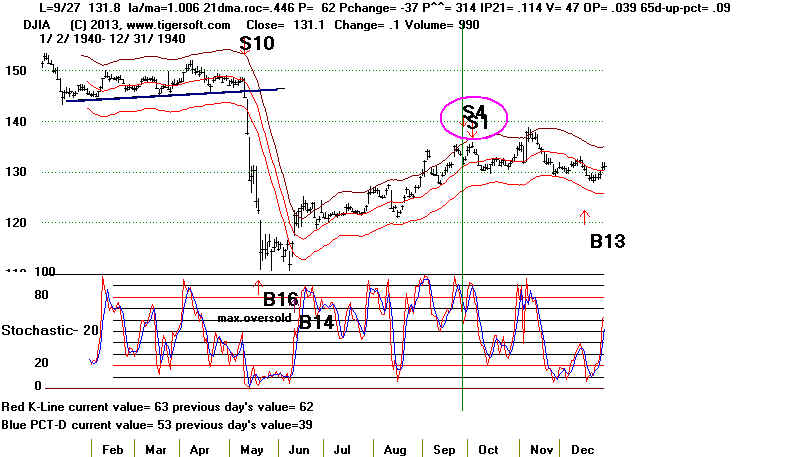
9/27/1940 +1.3% +4.6%
1.006 .446 62 -37 314 .114
47 .043 .090X
1/28/1952 +5.2% +0.0% 1.011 .329 82 -16 305
.065 23 .327 .043
12/12/1956 +3.6% +1.7% 1.017 .01 -74 -22 -233 -.098
-303-.135-.037
1/8/1960 +9.4% +0.0% 1.001 .007 -45 -16 -125 -.083 -308 -205 .057
8/29/1960 +8.9% +0.0% 1.016 .338 100 -41
284 .107 88 .365
.108
12/5/1968 +6.2% +0.4% 1.012 .328 133 +10 306 .088 15
.222 .094
8/24/1972 +3.8% +0.0% 1.005 .323 63 -16 135
.070 0 .095 -.005
9/24/1976 +4.6% +0.0% 1.021 .464 185 -17 342
.112 1 .016 .012
2/26/1988 +2.2% +2.9% 1.026 .678 199
0 343 .084 13-.019 .049
10/21/1988 +5.3% +0.0% 1.027 .581 59 +18 101 .253 13 .170 .044
2/27/1996 +1.1% +2.2% 1.009 .602 111 -27 142
.206 16 .349 .091
5/29/1996 +2.7% +1.0% 1.011 .213 22 -25
28 .026 5 -.11 .019
3/21/2012 +2.4% +1.1% 1.008 .145 97 -1
97 .011 -19 .004 .095
--------------------------------------------------------------------------
Avg. +5.46% +0.99% 1.013 .333 74 -14.8 160 .064 -28
.075 .047
There were some cases where Sell S1
signals came close to occurring. Possibly the software
should be modified so that cases
would be treated as Sell S1s.
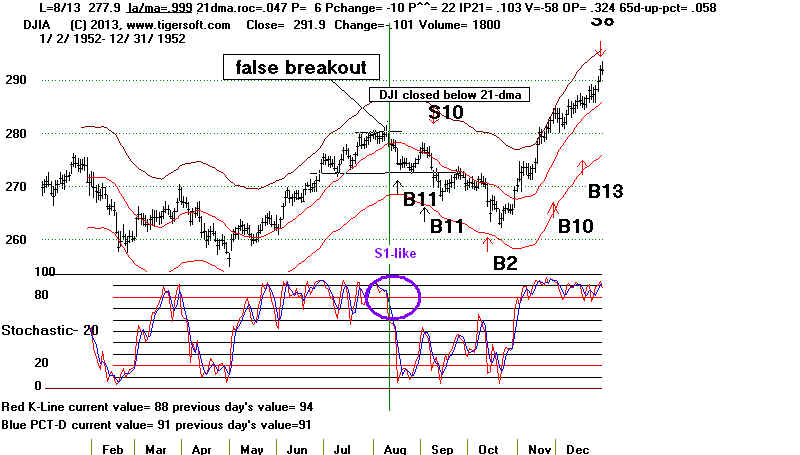
8/13/1952 DJI closed
slightly below 21- day ma and so no Sell S1.
Sell S1s 1929-2012
Data for 1928 was incomplete. Theoretical highs were not kept
back then and NYSE advance and decline data is suspect.
1932 No Sell S1s. Parameters not met and this was a perid
when the Extreme Bearish mode was operative.
---------------------------------------------------------------------
---------------------------------------------------------------------------
1936
X A Sell S1 early in February tends to bring a paper
loss too large.
2/24/1936 Gain = + 2.7% Paper Loss= 6.0%
(161-9 -152.70)/ 152.70
DJI LA/MA ANN-ROC P-I P-ch V-I IP21 OPct 65 Pct Change
152.7 1.013 .459 25 -32 113 -.045
(too strong)
---------------------------------------------------------------------------
1940
#1
 =========================================================================================
1940
#2
9/27/1940 +1.3% +4.6% 1.006 .446 62 -37 314 .114 47 .043 .090
=========================================================================================
1940
#2
9/27/1940 +1.3% +4.6% 1.006 .446 62 -37 314 .114 47 .043 .090
 --------------------------------------------------------------------
1944
X Stoch 20PCT drops below 80 but no Sell Sell.
3/23/44 Small decline follwed.
1.001 .206 84 -29P^^= 450 .067 62 .137
-----------------------------------------------------------------------------
X Stoch 20PCT drops below 80 but no Sell Sell.
8/22/1944 Small decline followed.
1.009 .163 67 -25 P^^ - 358 -.092 25 .064
--------------------------------------------------------------------------
-----------------------------------------------------------------------------
1948
X This should be listed as a Sell S2
10/22/1948 Gain = +3.8% Paper Loss = 3%
189.8 1.041 .694 110 .179 .445
DJI rallied to 191 and then fell to the lower band.
Violation of 65-dma.
--------------------------------------------------------------------------
1952
#3
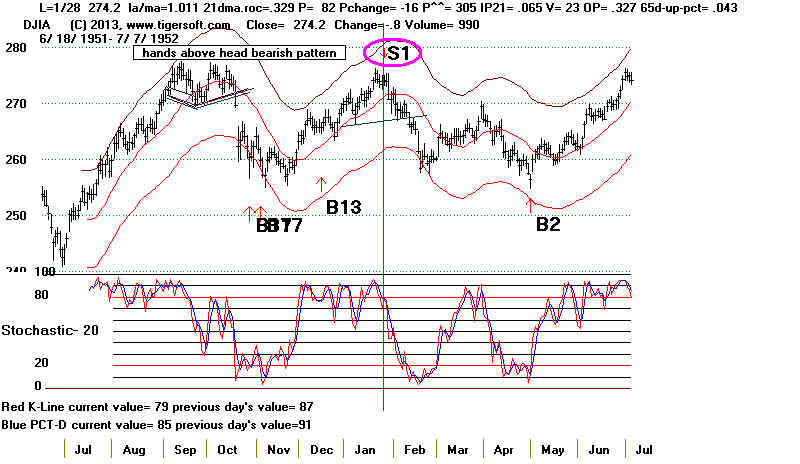
1/28/1952 Gain = +5.2% No paper loss
274.2 1.011 .329 82 -16 .065 23 .327
Sell S1s are not major Sells. It is advisable to cover
at the lower band or at well-tested support unless a Head/Shoulders
appears. Im this case, give a chance for the H/S pattern to
be completed and for an additional sell-off to materialize.
Covering on 5/2/1952 at 256.40 at support would have gained 5.2%.
5/2/1952 BUY B2 - 260. .994 -.318 -142 -.035 -.284
The 5th test of support holds and there is a gap back upwards.
Head/shoulders led to violation of 65-dma.
--------------------------------------------------------------------
1944
X Stoch 20PCT drops below 80 but no Sell Sell.
3/23/44 Small decline follwed.
1.001 .206 84 -29P^^= 450 .067 62 .137
-----------------------------------------------------------------------------
X Stoch 20PCT drops below 80 but no Sell Sell.
8/22/1944 Small decline followed.
1.009 .163 67 -25 P^^ - 358 -.092 25 .064
--------------------------------------------------------------------------
-----------------------------------------------------------------------------
1948
X This should be listed as a Sell S2
10/22/1948 Gain = +3.8% Paper Loss = 3%
189.8 1.041 .694 110 .179 .445
DJI rallied to 191 and then fell to the lower band.
Violation of 65-dma.
--------------------------------------------------------------------------
1952
#3
1/28/1952 Gain = +5.2% No paper loss
274.2 1.011 .329 82 -16 .065 23 .327
Sell S1s are not major Sells. It is advisable to cover
at the lower band or at well-tested support unless a Head/Shoulders
appears. Im this case, give a chance for the H/S pattern to
be completed and for an additional sell-off to materialize.
Covering on 5/2/1952 at 256.40 at support would have gained 5.2%.
5/2/1952 BUY B2 - 260. .994 -.318 -142 -.035 -.284
The 5th test of support holds and there is a gap back upwards.
Head/shoulders led to violation of 65-dma.
 -------------------------------------------------------------------------
1952
#4
-------------------------------------------------------------------------
1952
#4
 ------------------------------------------------------------------------
1956
#5
------------------------------------------------------------------------
1956
#5
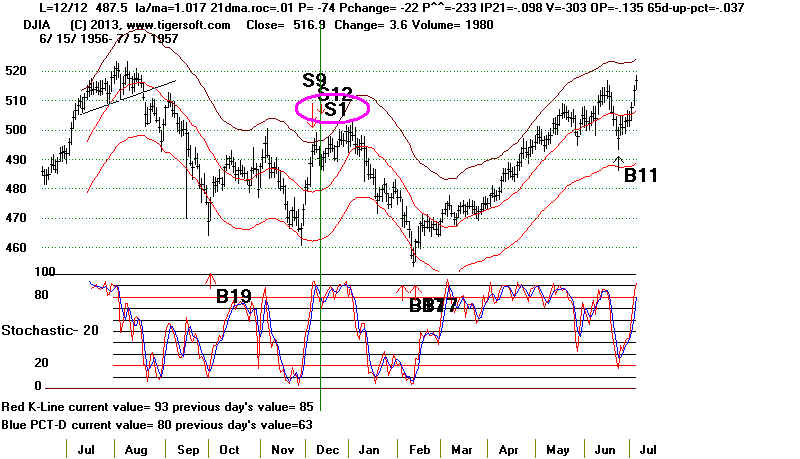 12/12/1956 Gain = +3.6% Paper Loss = 1.7%
Paper loss = (496-487.5)/ 487.5
487.5 1.017 .01 -74 -22 -233 -.098 -303 .135
DJI rose to 500, a paper loss of 3%, and then fell
directly to lower band ar 475 and then support ar 455.
Broke below 65-dma.
---------------------------------------------------------------------
1960
#6
12/12/1956 Gain = +3.6% Paper Loss = 1.7%
Paper loss = (496-487.5)/ 487.5
487.5 1.017 .01 -74 -22 -233 -.098 -303 .135
DJI rose to 500, a paper loss of 3%, and then fell
directly to lower band ar 475 and then support ar 455.
Broke below 65-dma.
---------------------------------------------------------------------
1960
#6
 ---------------------------------------------------------------------------
1960
#7
---------------------------------------------------------------------------
1960
#7
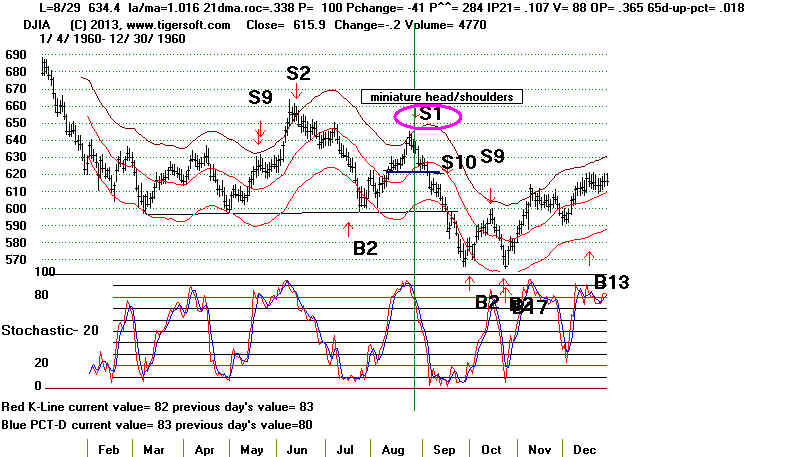 8/29/1960 Gain = +8.9% No paper Loss
634.4 1.016 .338 100 -41 .107 +88 .365
DJI fell directly to 600 at support, broke it with a Sell S10
and was reversed at 570.
Broke below 65-dma.
---------------------------------------------------------------------
1964 No Sell S1 signals
---------------------------------------------------
1968
#8
8/29/1960 Gain = +8.9% No paper Loss
634.4 1.016 .338 100 -41 .107 +88 .365
DJI fell directly to 600 at support, broke it with a Sell S10
and was reversed at 570.
Broke below 65-dma.
---------------------------------------------------------------------
1964 No Sell S1 signals
---------------------------------------------------
1968
#8
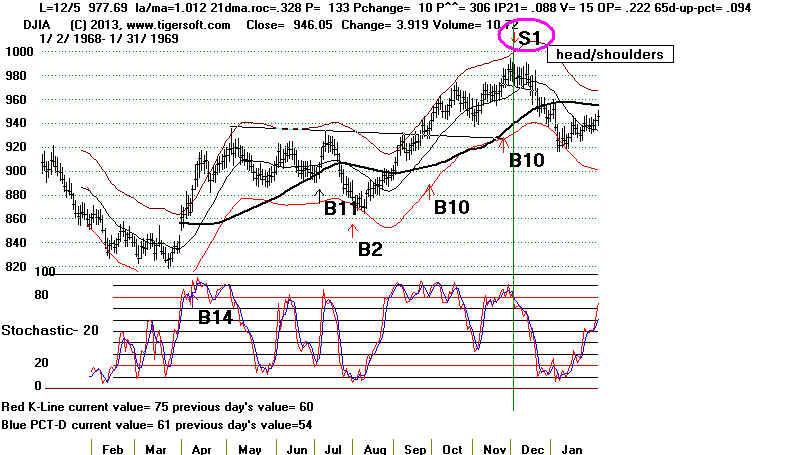 12/5/1968 Gain = +6.2% Paper Loss = 0.4%
(981.29-977.69)/977.69
977.69 1.012 .326 133 +10 .088 +15 .221
DJI fell directly to 930 and lower band, advanced on poor
breadth and then declined to 900 where buy signals appeared.
Broke below 65-dma.
---------------------------------------------------
1972
#9
12/5/1968 Gain = +6.2% Paper Loss = 0.4%
(981.29-977.69)/977.69
977.69 1.012 .326 133 +10 .088 +15 .221
DJI fell directly to 930 and lower band, advanced on poor
breadth and then declined to 900 where buy signals appeared.
Broke below 65-dma.
---------------------------------------------------
1972
#9
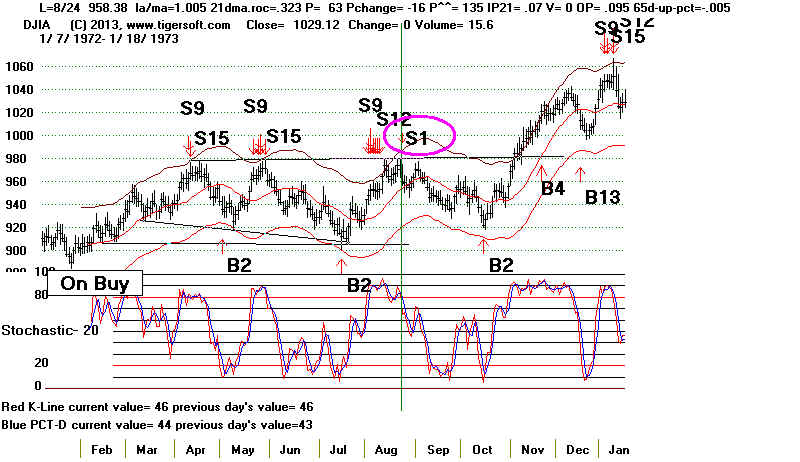 8/24/1972 Sell S1 Gain = +4.6% Paper Loss = 1.2%
Paper loss = (970.06 - 958/38)/958.38
958.38 1.005 .323 63 -16 .07 0 .096
DJI fell directly to 920 and Buy B2.
Violated 65-dma.
8/24/1972 Sell S1 Gain = +4.6% Paper Loss = 1.2%
Paper loss = (970.06 - 958/38)/958.38
958.38 1.005 .323 63 -16 .07 0 .096
DJI fell directly to 920 and Buy B2.
Violated 65-dma.
--------------------------------------------------- 1976 #10--------------------------------------------------- 1980 X - These 2 signals have disappeared because of changes elsewhere. 8/14/1980 Sell S1 Gain = +2.3% 962.63 1.028 .742 114 .178 .167 DJI fell directly to 940 and Buy B15. No paper loss. 8/19/1980 Sell S1 939.65 .999 .142 -12 -.072 -.014 DJI fell directly to 940 and Buy B15. No paper loss. 65-dma did hold up. ------------------------------------------------------- 1984 X - This signal has disappeared because of change elsewhere. 10/19/1984 Sell S1 Gain = +4.4% 1225.93 1.023 .128 22 -.022 .238 DJI rallied to 1229 and then fell to support/lower band and Buy B1. Paper Loss was under 1%. 65-dma did not hold. ------------------------------------------------------------------------- --------------------------------------------------- 1988 #11 2/26/1988 Sell S1 Gain = +2.2% Paper Loss = (2081.07-2023.21)/2023.21
2023.21 1.026 .678 199 0 .084 13 -.019 This was reversed at a loss by a Buy B18 on 3/4/88. But it is not clear that Buy B18s should be allowed in a Presidential Election Year from February thru October. Leaving out the B18 signal at this time of year would have gained the trader +2.6% bt going short the DJIA on the Sell S1 and then covering on the next Buy signal, a Buy B9 on 3/25/88 with the DJIA at 1978.95. There was a 1% paper loss. 65-dma did hold up. ------------------------------------------------------------------------- #12
10/21/1988 Gain = +5.3% No Paper loss 2183.50 1.027 .581 18 .253 13 .170 The DJI fell to the lower band and then to best support line at 2050. No Paper loss. 65-dma did not hold up. --------------------------------------------------------------------- --------------------------------------------------- 1992 No Sell S1s. --------------------------------------------------- 1996 #13 2/27/1996 Gain = +1.1% 5549.21 1.009 .602 111 -27 .206 16 .349 DJI rallied to 5700 (Paper Loss of 2.2%) (5609.74 - 5549.21)/ 5549.21) and then fell back to lower band and Buy B9. 65-dma did not hold up.
--------------------------------------------------------------------- #14 5/29/1996 Sell S1 Gain = +2.7% Paper Loss = 1.0% (5729.98-5673.83)/5673.83 5673.83 1.011 .213 22 -25 .026 5 -.11 DJI declined to lower band in two months. No paper loss. 65-dma did not hold up. --------------------------------------------------- 2000 X - This signal has disappeared because of change elsewhere 4/6/2000 Gain = +4.8% 11114.27 1.037 1.404 128 .075 -.062 DJI declined to lower band in two months. No paper loss. DJIS first rallied to 11400 and then fell quickly to the lower band and a Buy B2. Paper Loss of 3% 65-dma did not hold up. --------------------------------------------------- 2004 No Sell S1s --------------------------------------------------- 2008 No Sell S1s --------------------------------------------------- 2012 #15 3/21/2012 Sell S1 Gain = +2.4% Paper Loss = 1.1% Paper Loss = (13264.49-13124.62) 13124.62 13124.62 1.008 .145 97 -1 .011 -19 .004
========================================================== Number of trades = 14 Avg. Gain= 5 %