-----------------------------------------------------------------------------------------------------------
DJI Makes A New Low below The 2% Lower Band Which
Is Widely Unconfirmed by the P-Indicator.
The Buy B8 of the December 2013 Peerless would have brought on 22 trades since 1928.
The avererage gain was 15.2%. There were no losses. June B8s brought very big gains,
averaging 26.5%. Buy B8s afer the 20th of the month were nearly 3x more powerful than
Buy B8s in the first 10 days of the month.
Two of the 22 Buy B8s would have brought a paper loss of more than 4%. This seems
unacceptably high. It would seem a good idea to use a protective stop loss of 4% when a
Buy B8 occurs and then simply wait for the NYSE A/D Line downtrend to come to an end..
        Size of Buy B8 Gains

     >10%      10      45.5%
     5%-9.99%   7      31.8%
     2%-4.99%   2       9.1%
     0%-1.99%   3       0.0%
     losses     0      -----
| Buy B8s:
1928-2013 ^^ = Extreme bearish mode. DJI Gain -------------------------------------------------------------------------------------------------------------------------------------------------- 19320630 B8^^ 42.8 .78 Ext.Bear-Mode 3.7% paper loss
LA/MA = .915 P= -24 OPMA= +.221
(19320708 B8 occurs same day as S13 and B16. B8 here is not counted.)
19340601 B8 91.8 .078 type 3 no paper loss
LA/MA = .969 P= -69 Previous low = -142 (5/14/1934)
19340917 B8 86.7 .069 type 2 no paper loss
LA/MA = .944 P= -64 Previous low = -126 (7/31/1934)
19370614 B8 165.5 .123 type 4 no paper loss
LA/MA = .96 P= -65 Previous low = -136 (5/13/1934)
19410418 B8 116.3 .1 type 1 0.86% paperloss
LA/MA = .956 P= -66 Previous low = -159 (2/14/1941)
19410430 B8 115.5 .107 type 1 no paper loss
LA/MA = .969 P= -56 Previous low = -159 (2/14/1941)
19420414 B8 97.9 .013 type 1 7.2% paper loss
LA/MA = .972 P= -56 Previous low = -676 (3/11/1942)
19431115 B8 131.6 .246 type 4 1.5% paper loss
LA/MA = .963 P= +152 Previous low = -86 (8/23/1943)
--------------------------------------------------------------------------
19461009 B8 163.1 .126 type 3 no paper loss
LA/MA = .956 P= -1 Previous low = -137 (9/19/1946)
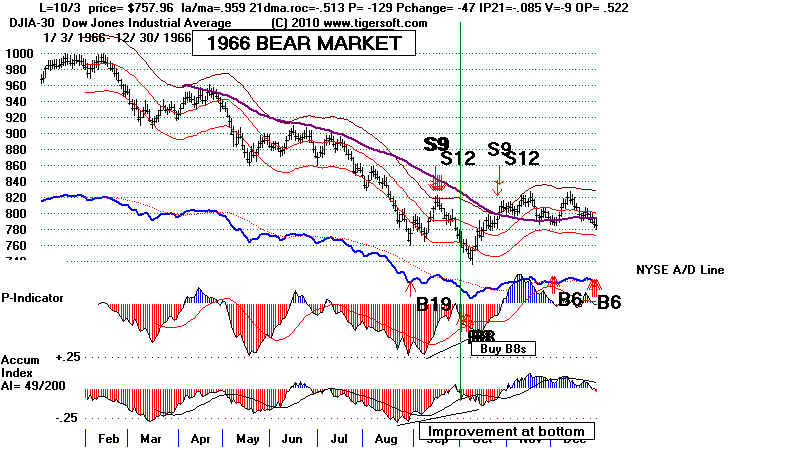
19661003 B8 757.96 .046 type 3 1.8% no paper loss
LA/MA = .959 P= -129 Previous low = -342 (9/8/1966)
19700127 B8 763.99 .018 type 4 2.3% paper loss
LA/MA = .968 P= -125 Previous low = -419 (12/10/1969)
19740927 B8 621.95 .053 type 3 6.0% paper loss
LA/MA = .950 P= -171 Previous low = -437 (9/13/1974)
19741002 B8 601.53 .089 type 3 2.8% paper loss
LA/MA = .950 P= -179 Previous low = -437 (9/13/1974)
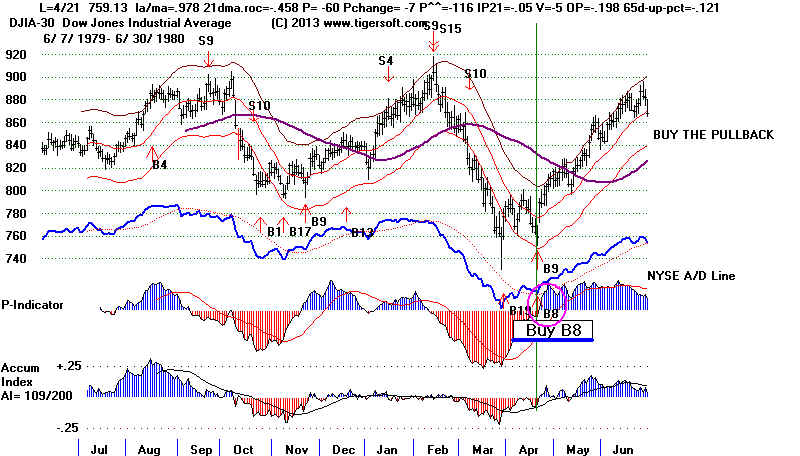
19800421 B8 759.13 .299 type 1 none
LA/MA = .978 P= -60 Previous low = -536 (3/17/1980)
19820305 B8 807.36 .032 type 3 0.4% paper loss
LA/MA = .976 P= -117 Previous low = -248 (1/13/1982)
19820811 B8 777.21 .36 type 3 no paper loss
LA/MA = .956 P= -178 Previous low = -320 (6/10/1982)
19900924 B8 2452.97 .234 type 3 3.6% paper loss
LA/MA = .950 P= -104 Previous low = -438 (8/23/1990)
X 20020918 B8 8172.45 .074 type 2 10.8% paper loss
LA/MA = .953 P= -58 Previous low = -480 (8/6/2002)
The real low that needed to be tested was on 7/23/2002
when the P-Indicator was -732. When that low was broken,
the P-Indicator had improved to -414. This shows another
problem, the picking out the right lows to consider support,
when there is a head/shoulders pattern. The December 2013
Peerless eliminated this case by having the program look
back 34 days.
20030310 B8 7568.18 .295 type 4 0.55% paper loss
LA/MA = .965 P= -129 Previous low = -440 (2/13/2003)
20080307 B8 11899.69 .055 type 4 1.3% paper loss
LA/MA = .964 P= -224 Previous low = -303 (1/8/2009)
20080915 B8 10917.51 .009 type 4 3.0% paper loss
LA/MA = .956 P= -256 Previous low = -642 (7/8/2008)
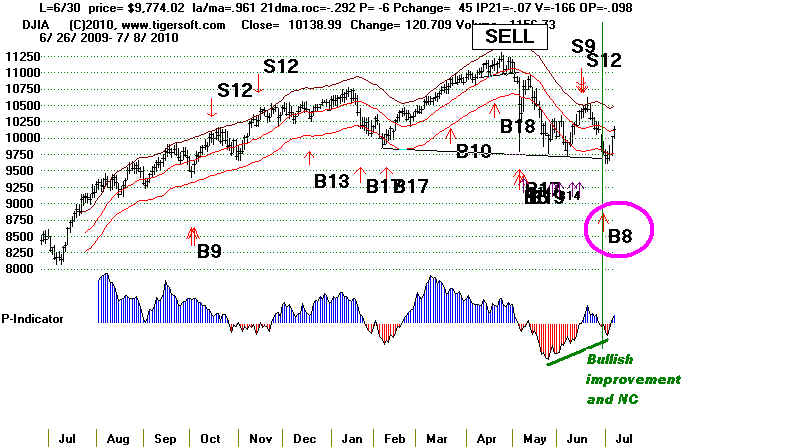
20100630 B8 9774.02 .079 type 3 0.9% paper loss
LA/MA = .961 P= -6 Previous low = -612 (5/25/2010)
20111003 B8 10655.3 .135 type 4 no paper loss
LA/MA = .957 P= -392 Previous low = -786 (8/8/2011)
-------------------------------------------------------------------------
                          No. = 22    Avg.=.152
       (1945-2013 Results No. = 15    Avg.=.122)
        Gains by Year
                      No.  Avg.Gain
Pres. Election Years   4   .286
PE +1                  3   .11
PE +2                 12   .100
PE +3                  3   .225

     Gains by Month
            No.  Avg.Gain
Januaries    1   .018
Februaries   0   ----
March        3   .127
April        4   .130
May          0   ----
June         4   .265 but this includes one gain of .78
July         0   ----
August       1   .360
September    4   .091
October      4   .099
November     1   .246
December     0   ----

   Gains by Day of Month
         No.  Avg.Gain
1-10         7   .080
11-20        8   .152
21-31        7   .224

               Code:
       Type 1
         For i = 126 To rn
                If mo(i) <> 4 Then 13022
                PMAXLO = 9999999999#
                pricemaxlo = 9999999999#
                ip21maxlo = 9999999999#
                vmaxlow = 99999999
                x = z
            For j = i - 50 To i - 1
              If p(j) < PMAXLO Then PMAXLO = p(j)
              If newipxxx(j) < ip21maxlo Then ip21maxlo = newipxxx(j)
              If la(j) < pricemaxlo Then pricemaxlo = la(j)
            Next j
              If PMAXLO > -60 Then 13022
              If da(i) < 14 Then 13022
              If la(i) > pricemaxlo Then 13022
              If newipxxx(i) < .5 * ip21maxlo Then 13022
              If p(i) < .5 * PMAXLO Then 13022
              pi = i: S9(i) = 108: mb(i) = 8: pi = i: Stop: b8arrows (pi): i = i + 5
13022  Next i

          Type 2
           For i = 126 To rn
             If (yr(i) - 1) / 4 = Int((yr(i) - 1) / 4) And mo(i) = 1 Then 45451
             chan65 = (la(i) - la(i - 65)) / la(i - 65)
             If (yr(i) + 2) / 4 = Int((yr(i) + 2) / 4) And mo(i) < 3 And chan65 < -.05 Then 45451
             If la(i) / ma(i) < .944 Or la(i) / ma(i) > .96 Then 45451
             If newipxxx(i) < -.125 Then 45451
             If p(i) < -90 Then 45451
             If (yr(i) + 2) / 4 <> Int((yr(i) + 2) / 4) Then 45451
             If mo(i) <> 9 Then 45451
             pricelow1 = 9999999999#

                 For j = i - 34 To i - 1
                   If la(j) < pricelow1 Then pricelow1 = la(j)
                 Next j
                 If la(i) > pricelow1 Then 45451 ' searching for a new 30 day low

                  plow1 = 9999999999999#
                For j = i - 100 To i - 1
                   If P21(j) < plow1 Then plow1 = P21(j)
                Next j

                If P21(i) < .6 * plow1 Then 45451: ' Requires a very big P-I NC of the new low.

                 ACCLOW1 = 9999999999#
               For j = i - 100 To i - 1    ' rem 100
                   If newipxxx(j) < ACCLOW1 Then ACCLOW1 = newipxxx(j)
                 Next j
               If newipxxx(i) < .3 * ACCLOW1 Then 45451:
                pi = i: S9(i) = 108: mb(i) = 8: pi = i:  b8arrows (pi)
          45451    Next i

      Type 3
         For i = 126 To rn
               chan65 = (la(i) - la(i - 65)) / la(i - 65)
          If (yr(i) + 2) / 4 = Int((yr(i) + 2) / 4) And mo(i) < 3 And chan65 < -.05 And p(i) < -84 Then 2102
          If (yr(i) - 1) / 4 = Int((yr(i) - 1) / 4) And mo(i) = 1 Then 2102
          If (yr(i) + 2) / 4 = Int((yr(i) + 2) / 4) And mo(i) = 2 Then 2102

          rocc = 250 * ((ma(i) - ma(i - 1)) / ma(i - 1))
      If la(i) / ma(i) >= .962 And rocc < -.6 And (la(i) / fiftyma(i)) > .933 And newipxxx(i) < -.11 Then 2102
      If (P21(i) - P21(i - 1)) < -8 Then 2102
      plow1 = 9999999999999#
         For j = i - 100 To i - 1
             If P21(j) < plow1 Then plow1 = P21(j)
         Next j
            pricelow1 = 9999999999#
         For j = i - 100 To i - 1    ' rem 100
            If la(j) < pricelow1 Then pricelow1 = la(j)
         Next j

      If mo(i) = 7 And opma(i) < -.29 Then 2102
      If v21(i) < -9 And opma(i) < -.34 Then 2102
      If v21(i) < -300 Then 2102
      If P21(i) < .56 * plow1 Then 2102:
      If la(i) > pricelow1 Then 2102
      If (yr(i) + 2) / 4 <> Int((yr(i) + 2) / 4) Then 2102
         ch = (la(i) - la(i - 125)) / la(i - 125)
         If ch > -.06 Then 2102
         If la(i) / ma(i) > .98 Then 2102
      pi = i: S9(i) = 108: mb(i) = 8: pi = i: b8arrows (pi)
2102    Next i

       Type 4
         For i = PMAL To rn: pvv(i) = pvv(i) / PMAL: Next i
            If (yr(i) + 2) / 4 = Int((yr(i) + 2) / 4) And mo(i) = 2 Then 888
         For i = 120 To rn
            If yr(i) / 4 = Int(yr(i) / 4) And mo(i) < 3 Then 888
            If (yr(i) - 1) / 4 = (Int(yr(i) - 1) / 4) And mo(i) = 5 Then 888
            If (yr(i) - 1) / 4 = Int((yr(i) - 1) / 4) And mo(i) = 1 Then 888
                 For j = i - 20 To i
                     If S9(j) = 100 Then 888
                     If S9(j) = 7 Then 888
                 Next j
         vh = -9999
              For j = i - 99 To i
                If la(j) > vh Then vh = la(j)
              Next j
           If la(i) / ma(i) > .97 Then 888
           If la(i) / ma(i) < .95 Then 888
        plow1 = 9999999999999#
                For j = i - 100 To i - 1
                 If (yr(i) + 2) / 4 = Int((yr(i) + 2) / 4) And mo(i) = 2 Then 888
                   If P21(j) < plow1 Then plow1 = P21(j)
                Next j
        pricelow1 = 9999999999#
                 For j = i - 100 To i - 1
                   If la(j) < pricelow1 Then pricelow1 = la(j)
                 Next j

                 If opma(i) < -.2 Then 888
                 If v21(i) < -300 Then 888
                 If P21(i) < .5 * plow1 Then 888: ' Big improvement in P-Indicator
                 If la(i) > pricelow1 Then 888
                 If (vh - la(i)) / vh > .2 Then 888
                 If mo(i) > 5 And mo(i) < 9 And P21(i) < -93 Then 888
                 pi = i: S9(i) = 108: mb(i) = 8: pi = i: Stop:    b8arrows (pi)
         888 Next i
|
====================================================================================
DJI New 25-Day
Closing Low with P-Indicator Much
Improved from Its Earlier100-Day Lows.
(July 9, 2010 - last edited.)
There have
been 12 closed out Buy B8s trades. As a whole, they averaged a gain of
11.3% when reversed by a Peerless Buy. 7 of the
12 experienced a paper loss of between 2%
and 7%. These are significant signals because
they have the power to reverse a recent Sell S9
or Sell S12 and have called the bottom to a number of
severe bear markets.
There are two types of Buy
B8s, a Bull
Market variety that occurs within 15% of a top
and the other where the DJI is down more than 15% from its
12 month highs.
The Bear Market
variety produced somewhat bigger gains than that of
the Bull
Market variety.
The user should
distinguish which type of these two Buy B8 is occurring.
This is because the bull market variety has so few cases,
making its power
less certain and because if there has been a Sell S9 or S12
in the previous 15 days
of the Buy B8, it is probably best to let these Sell
signals play out and wait for a
confirmed test of the support. A break in the
downtrendline of the CLosing Power
on the DIA is recommended if you have TigerSoft. With
Peerless, just wait for the
steep NYSE A/D Line downtrend to be broken.
Recent S9s, S8s or S12s should be assumed to override a Buy
B8 if they have occurred
in the previous two weeks. See the full list of B8s.
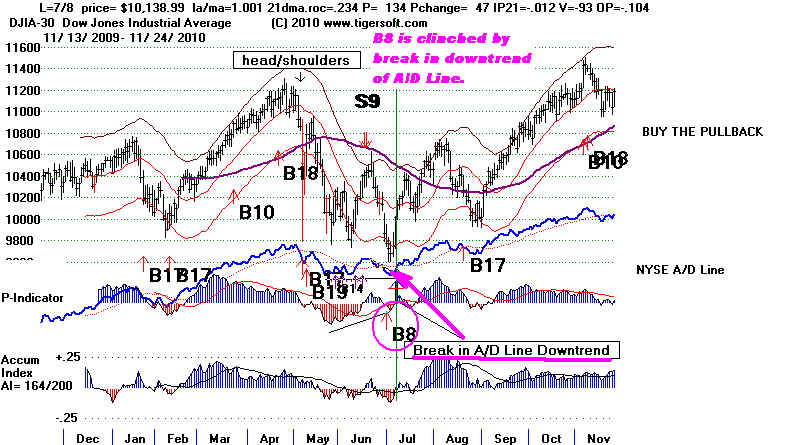
In addition, in a bull market, a head
and shoulders top pattern with a weak A/DLine should be
considered more potent and
made to override the B8. The mid 2010 B10 did not show a
weak NYSE A/D Line. But
simply waiting for the successful test of support of 9700 to be
confirmed worked fine then
See the charts just below.
Mid 2010 - Buy B8
Buy B8 after S9 is clinched when support holds and there is a break in
downtrend of NYSE A/D Line.
Bull Market-in-Question Variety
DJI is down 12% to 15% from high.
6/1/1934 Gain -
+7.8% Paper Loss= 0
6/14/1937 Gain - +14.4% Paper Loss= 0
1/27/70
Gain = +1.8% Paper Loss= 4%
5/21/1984 Gain = +8.9% Paper Loss=
7%
6/30/2010
Gain = +13%<1> Paper Loss= 1%
--------------------------------------
Avg. Gain = +11%
<1> As of 11/24/2010. Trade has not been closed out yet.
-----------------------------------------------------------------------------------------------------------------------
Buy B8s call bear market bottoms only if the
DJI is not in an Extreme Bear Market, i.e. where the
DJIA is notdown more than 40% from the high of
the last 12 months..
Bear Market-Ending Variety
DJI
is down more than 15% from high.
10/9/1946 Gain - +2.2% Paper Loss= 0
11/24/1948 Gain - +14.4% Paper
Loss= 7%
10/3/1966
Gain =
+4.6% Paper Loss= 3%
2/22/1982
Gain = +2.7% Paper Loss= 0 Small gain is a warning.
8/11/1982
Gain
= +36.0% Paper Loss= 0
9/25/1990
Gain = +18.5%
Paper Loss= 7%
3/10/2003
Gain = +29.5%
Paper Loss= 3%
3/7/2008 Gain = +5.5% Paper Loss= 2%
9/15/2008 Gain = +0.9% Paper Loss= 3% Small gain is a warning.
--------------------------------------
Avg. Gain = +11.6%
Be Wary When B8s Are Quickly Snuffed
Out
When a Buy B8 is quickly reversed, be
careful. In 2008, this occurred twice in 2008. It was a sign
of an impending Extreme Bear Market.
3/7/2008 11899.69 Gain -
+5.5%
( .964 -209 -224 0 .
045 -188 -.059 )
9/15/2008 10917.51 Gain -
+0.9%
( .956 -.726 -256 -182 -.045 -194 .105
)
B8 Rules
> DJI New 25-Day
Low with P-Indicator Greatly Improved from Its Own Earlier100-Day Lows.
>The P-Indicator must be more than 50% of the way back to zero from
its 100 day low as the DJI is making a 25-day low.
Other B8 Rules
>The DJI must not be down more than 20% from the 100 day high.
>B8s cannot occur in the first two months of a Presidential Election year.
>The DJI must be between 3% and 5% below the 21-dma
>OBVPCT must not be below -.20.
>The Current Accumulation Indicator must not be below -.225.
Completed Head and Shoulders Should Over-Rule B8s.
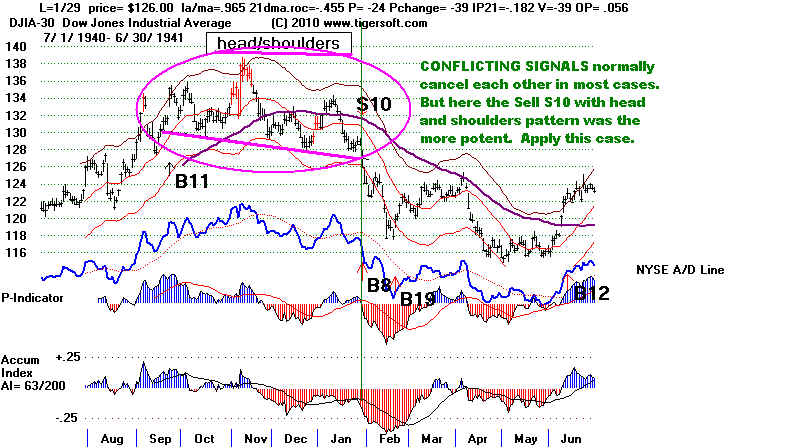
Do not use a Buy B8 to reverse a decline where the DJI has completed a head and
shoulders pattern. This was true in early 1941. For the pattern to be
completed, the DJI must
close decisively (by 1%) below the neckline of its head and shoulders pattern.
Note in June 2010, the obvious head and shoulders pattern was not quite completed.
Instead a
Summer Rally ensued right from the brink.over-ruled a Buy B8. False head and
shoulders
patterns are most likely to occur in the Summer. See the examples elsewhere
of July 1982
and July 2009.
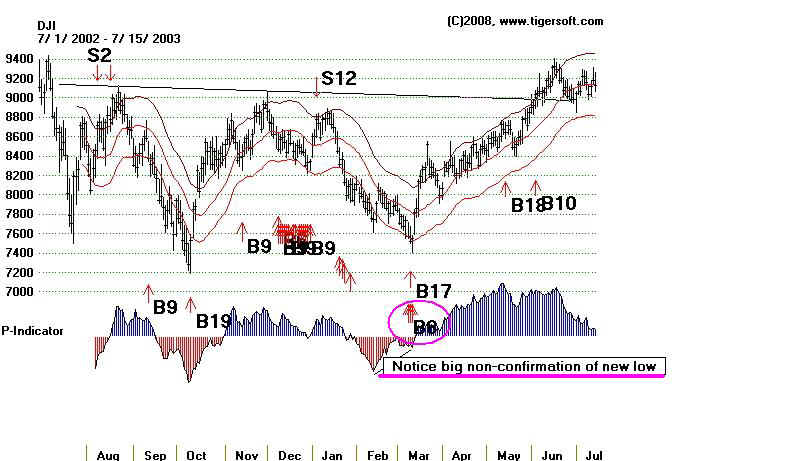
Even Buy B9s cannot successfully dtop a decline from a completed
head and shoulders pattern.
See October 2002 in the chart below. Buy B17 signals also are likely to fail
to stop a decline from
a completed head and shoulders top until much support has been reached. This
was true in 1941.
Buy B8 - Trading Results - 1929-2010 #1 6/1/1934 Gain - +7.8% 91.80 .969 .877 -69 2 -.09 -205 -.192 DJI rallied immediately and was reversed by Sell S9. DJI was down about 15% from recovery high when this successful Buy B8 occurred.------------------------------------------------------------------------ #2 6/14/1937 Gain - +14.4% 165.50 .96 -.138 -65 4 .041 -103 .085 DJI rallied immediately and was reversed by Sell S9. DJI was down about 15% from recovery high.
------------------------------------------------------------------------ Do Not Count This Buy B8 1/29/1941 126 .965 -.455 -24 -39 -.182 -39 -.056 There was a simultaneous head and shoulders top with Sell S10. This nullifies the signal. The head and shoulders was more powerful.
--------------------------------------------------------------------------- #4 11/24/1948 Gain - +14.4% 173.4 .961 -1.078 78 -55 -.029 152 -.193 DJI rallied to the upper band and then fell to 162. This was a paper loss of 7%. The DJI then rallied to an S9 on 4/14/1950 with the DJI at 215.30.
-------------------------------------------------------------------------- #5 10/3/1966 Gain = +4.6% 757.96 .959 -.513 -129 -47 -.085 -9 -.119 DJI fell to 740 before rallying to ipper band. This was a paper loss of 3%. 10 / 4 / 1966 +3.9% 763.19 .967 -.369 -142 -.053 -8 -.008 These were the only Buys on these days. These B9s correctly called the bottom of the 1966 bear market. The DJI was down 25% from its February peak.
----------------------------------------------------------------------------- #7 2/22/1982 Gain = +2.7% 811.26 .965 -.523 -85 -18 -.057 -.162 2/23/1982 812.98 .969 -.454 -81 -.028 -5 -.067 The DJI was down 20% from its peak in June 1981. It decline 20 points lower and then rallied 2% above the first tagging of the upper band. The bear market of 1981-1982 did not end for another six months.
--------------------------------------------------------------------------- #8 8/11/1982 Gain = +36.0% 777.21 .956 -.686 -178 -7 -.133 -9 -.444 DJI launched 1982 bull market from this point. Reaching the upper band so quickly after a Buy B8 that there is a Sell S9 or Sell S12 in the next few days should be understood as a sign of great bullishness, not bearishness.
--------------------------------------------------------------------------- #9 5/21/1984 Gain = +8.9% 1125.31 .969 -.335 -125 -.021 -7 -.014 Paper loss = 4% 5/22/1984 Gain = 9.8% 1116.62 .962 -.337 -134 -.004 -8 -.022 The DJI was down 14% from its January 1984 peak. A small three day rally ensured, but the bottom did not come for another two months about 20 points lower.
---------------------------------------------------------------------------- #10 9/25/1990 Gain = +18.5% 2485.64 .963 -.218 -118 -14 .057 -18 -.057 DJI fell to 2365 and then rallied. Paper loss = 5%
---------------------------------------------------------------------------- #11 3/10/2003 Gain = +29.5% 7568.18 .965 -.547 -129 -36 -.025 -199 -.104 DJI fell to 7300 intraday and then rallied. Paper loss = 3% 3/11/2003 Gain = 30.3% 7524 .962 -.516 -102 27 -.033 -196 -.109 3/12/2003 Gain = 29.8% 7552.07 .967 -.56 -147 -45 -.019 -216 -.097 The DJI was down 15% from its November 2003 peak. This was the final bottom in the 2001-2003 bear market. Traders should have been watching for it, as it occurred at the nadir of a right shoulder in a perfectly symetrical inverted head and shoulders pattern.
---------------------------------------------------------------------------- #12 3/7/2008 Gain = +5.5% 11899.69 -.964 -.289 -224 Pch=0 .045 -.059 The DJI fell 2% more and then rallied somewhat past the initial touching of the upper band.
---------------------------------------------------------------------------- #13 9/15/2008 Gain = +0.5% 10917.51 -.726 -256 -182 -.045 -194 -.105 DJI fell to 10640 intraday and then rallied. Paper loss = 3%
---------------------------------------------------------------------------- #14 6/30/2010 9774.02 +13% (as of 11/26/2010) .961 -.292 -6 45 -.07 -166 -.039 DJIA rallied up from the neckline at 9686. The Hotline said that 10500 and the declining 65-day ma were the likely targets for the ensuing rally, once the test of support was over. Paper Loss = 1%
Watch the Closing Power of DIA Using the Closing Power of ETFs like DIA or SPY helps decide when the support will hold. To have a higher likelihood of success, Buy when these downtrendlines are broken. Notice in the DIA chart also that this derivative vehicle did break its neckline support. The falseness of the DIA breakdown shows why we want instead to use the DJIA chart and its neckline.
========================================================== Number of completed Buy B8 trades = 14 Avg. Gain= 11%