12/6/2013 (C) www.tigersoft.com
There have been 32 Buy B19s. The average gain was 8.6%.
There was only one loss. March and October Buy B19s brought
the biggest gains, 12.2% and 15.2%, respectively. January B19s
only 3%.
Size of Gains
>10% 9
5%-9.99% 13
2%-4.99% 8
0%-2% 1
loss 1
BUY B1919290327 B19 303.2 .029
19330724 B19 94.3 .054
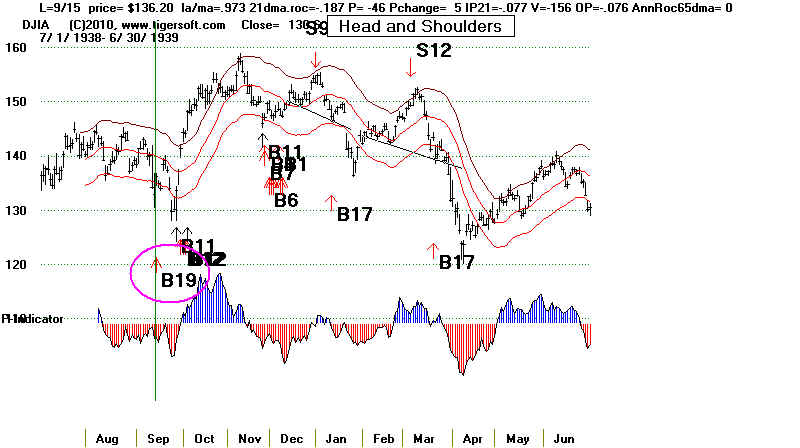
19380915 B19 136.2 .156
19380928 B19 133.7 .178
19390127 B19 138.9 .076
19410220      B19            119.9         .067
19460221      B19            195.6         .086
19470421      B19            169.5         .09
19550315      B19            399.3         .173
19560529      B19            477.7         .091
19590210 B19 582.7 .105 19650630 B19 868.04 .135 19660830 B19 775.72 .039 19670411 B19 847.66 .047 19670601 B19 864.98 .075 19741007 B19 607.56 .078 19800328 B19 777.65 .268 19800930 B19 932.42 .058 19870415 B19 2282.95 .026 19940405 B19 3675.41 .016 19971028 B19 7498.32 .225 20020724 B19 8191.29 .064 20040312 B19 10240.08 .031 20050421 B19 10218.6 .133 20070306 B19 12207.59 .143 20071123 B19 12799.04 .064 20080123 B19 12270.17 .023 20081202 B19 8419.09 .063 20090121 B19 8228.1 -.01 20110317 B19 11774.59 .088
20120411      B19            12805.39      .037
20130625      B19            14760.31      .048
   20130822      B19            14963.74      .015   add
-------------------------------------------------
                           No. = 33        .086
9 13 8 1 1 PE 7 .082 PE + 1 8 .085 PE + 2 7 .088 PE + 3 10 .089 January 3 .03 February 3 .086 March 6 .122 April 6 .058 May 1 .091 June 3 .086 July 2 .059 August 1 .039 September 3 .131 October 2 .152 November 1 .064 December 1 .063 1-10 5 .075 11-20 8 .063 21-30 19 .090 |
---------------------------------------------------------------------------------
8/22/2013
B19
Buy B19s occur when there is a
sharply down day followed by an equally sharp up day.
It is a 2-day reversal upwards Buy. It stems from the unexpected
way the DJI and NYSE
breadth reverse from down to up. Usually, after a steep decline,
the market is doing well simply
to stabalize. A reversal upwards is unusual. It often
portends a rally beyond the upper band.
This is a very helpful
signal, in that since 1956 there has not been a single case in the
21 Buy B19s of even a 1% paper loss. We should note that some of
the most recent Buy B19s
have not been very profitable. It may be that computerized
trading has reached a point where
this signal simply shows their short-term trading activities and
intentions. If this pattern continues,
the signal may have to be downgraded for intermediate-term traders.
However, when it occurs
with other Buy signals, a rally, at least, to the upper band is very
likely.
These B19
reversal occur often when politics intrudes, i.e. when government shifts the
quickly alters the slope of the playing field. We not only expect
these B19s to be more common,
as professionals turn to more to rapid-fire computerized trading, but
also in an economic down-turn
when insiders get wind that the Fed will intervene to stimulate the
economy.
To get a B19, the current day's NYSE
advances/declines must be over 3 and the same ratio
on the day before must be under .333. In most
cases, the current day's NYSE Up Vol must be
more than 4 times NYSE Down volume and the same ratio the day before must be
under .25.
There are some limitations, such as the DJI needing to be below the 1.7%
lower band so that
there is still upside potential. B19s cannot not occur too soon after a
Sell S9. In 2013,
B19 were added where there is a gap upwards on the day of the signal.
This suggests even more
upside energy.
There have been 30 completed Buy B19
trades. The average gain was about 9% at the time
of the next Peerless
Sell. 8 brought gains of more than 10%, but 8 gained less than 3%.
There was only
one loss with a Buy B19. If we take out the one case where the B19
called the bottom in 1974
and gained 72.9%, the average gain would be 6.9%. In the 12 cases when
the B19 occurs with the
DJI above a rising 200-day ma, the gains were more assured. In only two
cases were the declines
as low as 2.6% and 2.8%. In 8 of the 12 cases the gains ranged from
5.8% to 25.4%. The average
gain for B19s in a rising market were 8.8%, even without the benefit of the
single case of the Buy B19
bringing a 72.9% gain.
31 BUY B19s: 1929-2010
Gain Date
P^^ La/Ma IP21
Market Environment
Head/Shoulders Paper
Loss
-----------------------------------------------------------------------------------------------------------------------------------------------------[
+ .028 3/27/1929 -309
.974 -.085
Rising Market
none
+ .156 9/15/38 -241
.973 -.077
Rising Market
3%
+ .178 9/28/38 -567
.948 -.181
Rising Market
none
+ .067 2/20/41 -599
.969 -.308 below 200 day ma
3.5%
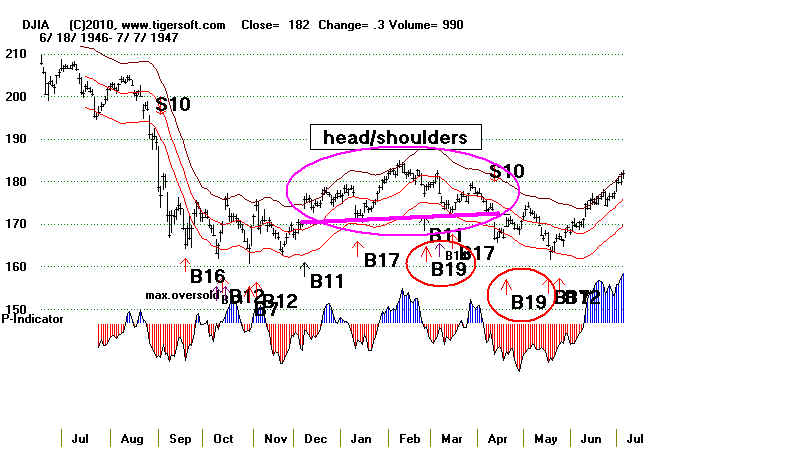
+ .086 2/21/46 -103
.969 .083
Rising Market
soon after head/shoulders none
+ .088 4/21/1947 -426
.976 -.177
below 200 day ma
4%
+ .173 3/15/1955 -161
.974 -.094
Rising Market
none
+ .076 5/29/1956 -161
.963 -.229
Rising Market
none
+ .116 2/10/1959 -64
.986 -.05
Rising Market
none
+ .039 8/30/1966 -299
.948 -.211
below 200 day ma
none
+ .047 4/11/1967 -41
.983 -.027
Rising Market
none
+ .075 6/1/1967 -122
.981 -.034
Rising Market
none
+ .078 10/7/1974 -149
.956 -.152
below 200 day ma
none
+ .223 3/28/1980 -454
.963 -.091
below 200 day ma
none
(Almost B19) + .036
9/28/1981 -524 .983 -.078 below 200
day ma
none
+ .026 4/15/1987 -389
.979 .08
Rising Market
2.5%
(Almost B19) + .028 9/22/1987 -240
.988 -.146 Rising Market
none
+ .016 4/5/1994 -475
.968 .011
below 200 day ma
none
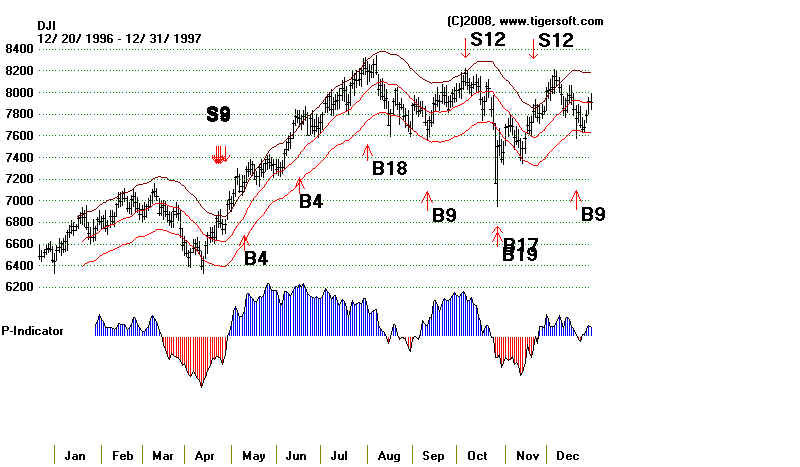
+ .044 10/28/1997 -214
.944 .037
below 200 day ma
1.3%
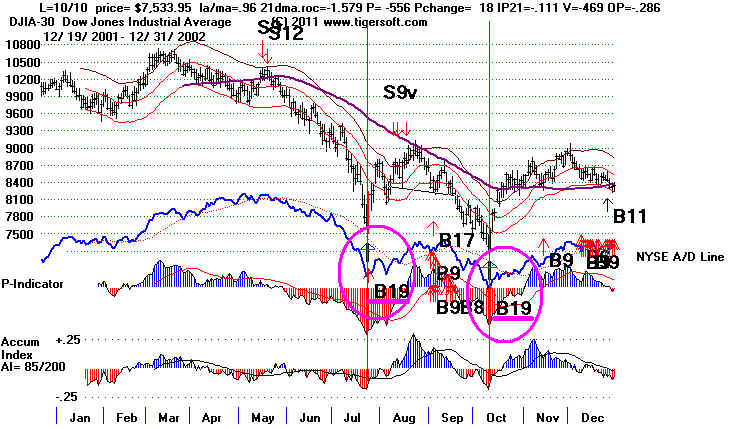
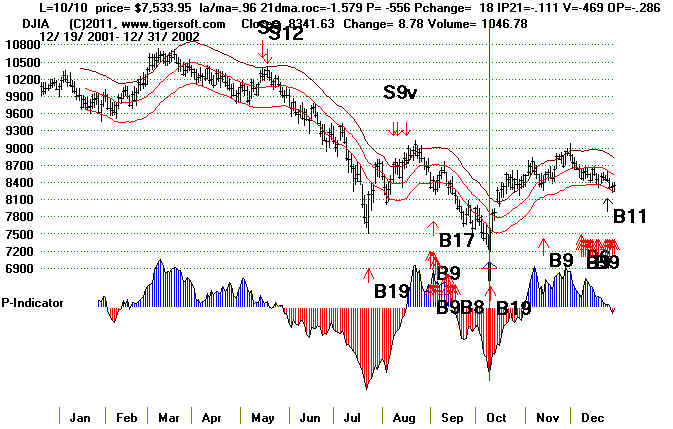
+ .064 7/24/2002 -673
.936 -.119 below 200
day ma
none
+.165 10/10/2002 -566 .960
-.111
below 200 day ma H/S played out
none
+.133 4/21/2005
-131 .985 -.131 Rising Market
1.5%
+.143 3/6/2007 -21
.974
-.023
Rising Market
1.0%
+ .064 11/23/2007 -373
.948 -.089 Rising Market
none
+ .023 1/23/2008 -138
.957 -.057
below 200 day ma
4.3%
+ .032 3/11/2008 -215
.987 .047
below 200 day ma
1.0%
+ .000
9/18/2008 -186 .972
.037 below 200 day ma
none
+.063 12/2/2008 -339
.981 -.03
below 200 day ma
none
-.01 1/21/2009 -140
.963 -.035
below 200 day ma
none
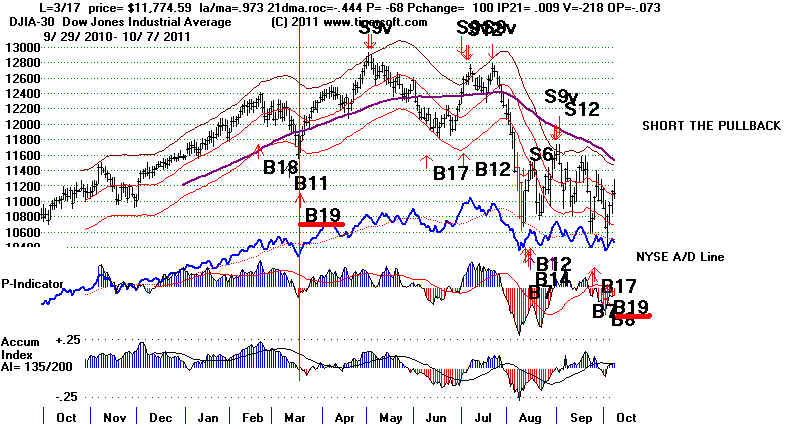
+.088 3/17/2011 -68
.973 .009
Rising Market
none
+.029 4/11/2012 -156
.976 .020
Rising Market
none
+.048 6/25/2013 -420
.978 -.126
Rising Market
none
8/22/2013 -310
.974 -.046
Rising Market
none
================================
30 completed trades - Avg =
2 losses, 0% to 1%
9 paper losses, 1% to 4.3%
8 gains of more than 10%
6 gains 1%-3.5%
18 gains of more 5%
16 of B19s were in a rising market
14 of B19s were below 200-day ma
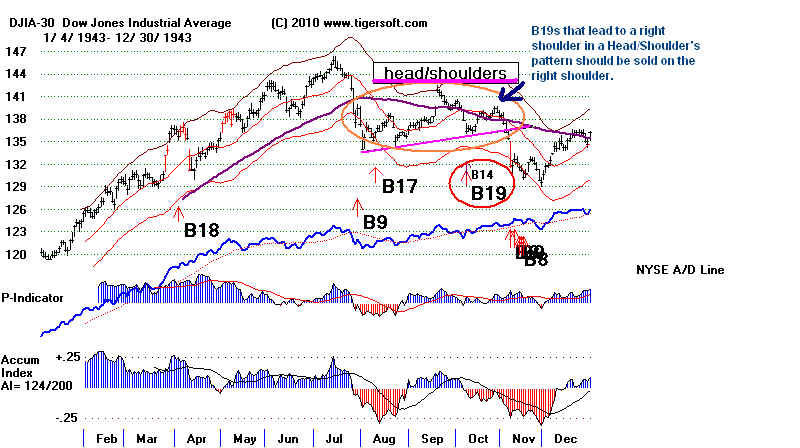
We should be wary of a Buy B19 that
follows soon after the completion of a quick
head and shoulders
formation. Note these patterns in the three B19s below..
 |
 |
 |
Here is a breakdown
of 2011 Peerless B19s. There is not much change. So the patterns
here seem likely to
continue.
The best Buy B19 signals occur in March and October. The worst seen to occur in the
period Decmber to January. Tax based buying and selling must add greatly to very short-term
volatility.
MONTH GAIN Number YEARS
----------------------------------------------------------------------------------------------
Jan -1.0% 1 2009
Feb +4.4% 4 1941 1946 1947 1959
Mar +13.6% 5 1929 1955 1980 2007 2008
Apr +6.4% 5 1947 1967 1987 1994 2005
May +7.6% 1 1956
June none 0
July +6.4% 1 2002
Aug +3.9% 1 1966
Sept +3.4% 6 1948(2) 1980 1981 1987 2008
Oct +14.4% 5 1943 1956 1974 1997 2002
Nov + 6.4% 1 2007
Dec -1.0% 1 2009
====================================================
31 completed trades - Avg = 7.6%
31 BUY B19s: 1929-2010 by
Year in Four Year Presidential Cycle
B11a in the third year of a Presudential Cycle are clearly the most bullish.
Presidential Year N= 8 Avg.Gain = 5.5%
Presidential Year +1 N= 6 Avg.Gain = 5.3%
Presidential Year +2 N= 7 Avg.Gain = 12.5%
Presidential Year +3 N= 10 Avg.Gain = 7.6%
Buy B19's may not occur within 10 days of each other to avoid whip-saws.
Important: They can reverse quick sell-offs as well as long bear markets.
B19 Statistics
1. They average a 6.4% gain
when the next Peerless signal is taken as a sell.
2. 90% of B19s were
profitable at time of next Peerless Sell
Only three B19s were not profitable. The biggest loss was 3.2%
3. The biggest paper
loss using a B19 was 8% in 1947. All were between 3% and 8%.
There were paper losses in 7 of the 30 cases but none after 1955.
4. Buy B19s do
occasionally act as reversing Buys. The 13 cases are:
3/27/29 303.2
+ .029
2/21/1946 195.6
+ .006
4/21/1947 169.5
+ .031
9/9/1948 180.3
+ .033 Reversed
a Sell S2 just a few days before.
10/2/1956 475.4
+ .036
8/30/1966 775.72
+ .039
3/28/1980 777.65
+ .223
9/30/1980 932.42
+ .058
9/28/1981 842.56
+ .036
9/22/1987 2568.05 + .028
4/5/1994 3675.41
+ .066
10/28/1997 7498.32 + .044
7/24/2002 8191.29 + .064
Only
5 of the 13 cases saw a DJI gain of more than 4.3%.
5.
all smaller than 6%.
6. 21 of 27 B19s called the bottom. All have done so, or nearly so since 1956.
7. There was only one B19 case in December. It lost money.
8. There were 3 B19s in 2008, showing the many oversold market conditions.
9. Bear markets were ended with B19s in 1966, 1974, 1980 and 2002.
10. Steeply declining ROCs (less than -1.6) should be eliminated. This would exclude two
poor trades: 10/1/30 ( - .129 ) and 10/28/2008 ( +.008).
11. Do not use the Buy B19 when the DJI closes more than 6.5% below the 21-day ma.
This would eliminate two poor trades: 10/1/30 ( - .129 ), 4/30/31 ( -.037 )
B19 Signals: 1929-1942 and Key Values
"ROC=annualized rate of change of the 21-day ma. So, -.043 means a slight declining
current trend. "CL/MA"=DJI close/21-day ma. "P", "IP21", "V" and "OP" are Peerless indicators.
Date DJI Gain CL/MA ROC P IP21 V OP
---------- ----------- ---------- --------- ------ ------ ----- ------- ------
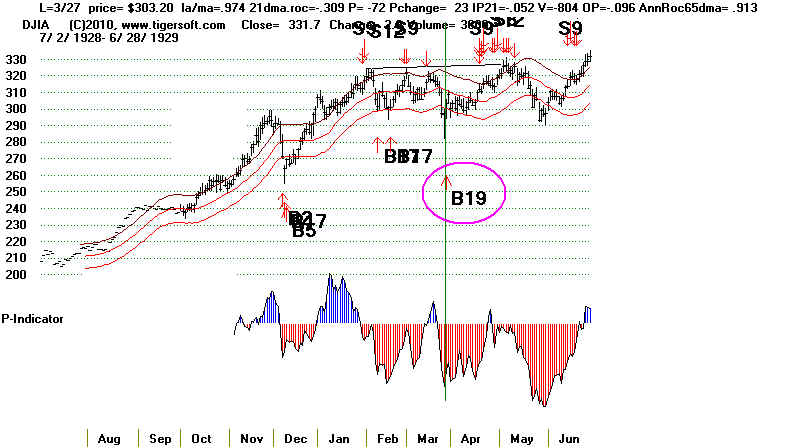
1 3/27/29 303.2 .029 .974 -.309 -72 -.052 -804 -.096
This was a reversing Buy.
No Significant paper loss. This was the bottom for a rally to the upper band.
...above 200-day ma
...ratio based up/down volume 1:4 and then 4:1.
-------------------------------------------------------------------------------------------------------------------------------------------
In October 1930, users would have employed the Extreme Bearish Mode. Thus the following
B19s would not have been allowed. This switch ended in mid 1932. There were two B19s
in this period. They should be eliminated simply by seeing how fast the 21-day ma was
falling and how far below the 21-day ma the DJI was when they occurred. The code will
be changed for B19s to reflect this.
Date DJI Gain CL/MA ROC P IP21 V OP
X 10/1/30 214.1 -.129 .908 -2.445 -199 -.057 -1171 -.319 (very negative internals)
X 4/30/31 151.2 -.037 .935 -1.551 -167 -.157 -820 -.375 (very negative internals)
------------------------------------------------------------------------------------------------------------------------------------------
Date DJI Gain CL/MA ROC P IP21 V OP
2. 9/15/38 136.2 .128 .973 -.187 -46 -.077 -156 -.076
There was a 3% paper loss here.
...above 200-day ma
...ratio based up/down volume 1:4 and then 4:1.
Date DJI Gain CL/MA ROC P IP21 V OP
3. 2/20/41 119.9 .074 .969 -.796 -113 -.308 -129 -.283
There was a 3% paper loss here.
...below 200-day ma
...ratio based up/down volume 1:4 and then 4:1.
Date DJI Gain CL/MA ROC P IP21 V OP
4. 10/7/1943 136.4 .013 .98 -.043 41 -.025 12 -.048 smaller recovery than loss day before.
1/14/44 138.2 S1
There was a 4% paper loss here. DJI fell to 130 in mid Nov. before rallying.
...below 200-day ma
...ratio based up/down volume 1:4 and then 4:1.
Date DJI Gain CL/MA ROC P IP21 V OP
5. 2/21/1946 195.6 .006 .969 -.106 -27 .083 -135 0
Right after quick head/shoulders.
This was bottom for a rally then went up past next Sell by 6% in 3 months.
This was a reversing Buy.
Date DJI Gain CL/MA ROC P IP21 V OP
6. 2/27/1947 178.9 -.023 .986 .013 7 .106 -63 .023 recovered almost what was lost day before.
Thus was right after quick head/shoulders
There was an 8% paper loss here. DJI fell to 163 in mid May before rallying.
Date DJI Gain CL/MA ROC P IP21 V OP
7. 4/21/1947 169.5 .088 .976 -.404 -103 -.177 -177 -.109 bigger recovery than loss day before.
There was a 4% paper loss here. DJI fell to 163 in mid May before rallying.
This was a reversing Buy.
Date DJI Gain CL/MA ROC P IP21 V OP
8. 9/9/1948 180.3 .033 .989 -.02 70 .11 17 .067 smaller recovery than loss day before.
There was a 5% paper loss here. DJI fell to 171 in late November before rallying.
Thus was a reversing Buy. It occurred just a few days after a Sell S2. It is probably better to wait
a little longer in these cases.
Date DJI Gain CL/MA ROC P IP21 V OP
9. 3/10/1955 406.8 .254 .987 .302 50 -.05 -96 .226 recovered almost what was lost day before.
There was a 4% paper loss here. DJI fell to 391 in mid March before rallying. 3/6/1956 491.40 S12
Date DJI Gain CL/MA ROC P IP21 V OP
10. 5/29/1956 477.7 .076 .963 -.918 -161 -.229 -501 -.586 recovered almost what was lost day before.
This was the bottom before a rally a little past the upper band and next Sell.
Date DJI Gain CL/MA ROC P IP21 V OP
11, 10/2/1956 475.4 .036 .965 -.641 -164 -.172 -435 -.369 recovered almost what was lost day before.
This was the first of two same-level bottoms before a rally past the upper band and next Sell.
This was a reversing Buy. 12/6/1956 492.70 S1
Date DJI Gain CL/MA ROC P IP21 V OP
12. 2/10/1959 582.7 .116 .986 -.199 -22 -.05 -300 .061 bigger recovery than loss day before.
This was the bottom before a rally past the upper band and the next Peerless Sell.
4/17/1959 624.10 S9
Date DJI Gain CL/MA ROC P IP21 V OP
13. 8/30/1966 775.72 .039 .948 -.862 -299 -.211 -14 -.392 recovered almost what was lost day before.
This was the bottom before a rally to the upper band and the next Peerless Sell.
This was in a bear market. 9/14/1966 806.23 S9
This was a reversing Buy.
Date DJI Gain CL/MA ROC P IP21 V OP
14. 4/11/1967 847.66 .047 .983 -.012 -17 -.027 -2 -.024 recovered almost what was lost day before.
This was the bottom before a rally to the upper band and the next Peerless Sell.
4/21/1967 993.18 S12
Date DJI Gain CL/MA ROC P IP21 V OP
15. 10/7/1974 607.56 .729 .956 -1.31 -149 .152 -3 -.431
Recovered more than what was lost day before.
This was the bottom. Rallied to the upper band. Pulled back and roared upwardsl.
10/18/74 S12 S12
Date DJI Gain CL/MA ROC P IP21 V OP
16. 3/28/1980 777.65 .223 .963 -1.127 -454 -.091 -13 -.305 recovered more than what was lost day before.
This was the bottom but two more tests of lows were needed before bull market began.
This was in a bear market 8/7/1980 950.94 S2
This was a reversing Buy.
Date DJI Gain CL/MA ROC P IP21 V OP
17. 9/30/1980 932.42 .058 .985 -.002 -6 -.01 -1 .122 recovered almost what was lost day before.
This was the bottom for a trading range rally to the upper band. 11/14/1980 986.35 S9
This was a reversing Buy.
Date DJI Gain CL/MA ROC P IP21 V OP
18. 9/28/1981 842.56 .036 .983 -.645 -302 -.078 -11 -.234 recovered more than what was lost day before.
This was a reversing Buy. This was the bottom for a trading range rally to the upper band.
This was in a bear market.
Date DJI Gain CL/MA ROC P IP21 V OP
19. 4/15/1987 2282.95 .026 .979 -.009 -198 .08 -15 .208 recovered almost what was lost day before.
This was the bottom for a trading range rally to the upper band.
Date DJI Gain CL/MA ROC P IP21 V OP
20. 9/22/1987 2568.05 .028 .988 -.646 -240 -.146 -30 -.30 recovered more than what was lost day before.
This was a reversing Buy. This was the bottom for a trading range rally to the upper band.
Date DJI Gain CL/MA ROC P IP21 V OP
21. 4/5/1994 3675.41 .03 .968 -.941 -301 .011 -41 -.107 smaller recovery than what was lost
day before.
This was a reversing Buy. This was the bottom for a rally to the upper band.
Date DJI Gain CL/MA ROC P IP21 V OP
22. 10/28/1997 7498.32 .044 .944 -.737 -175 .037 -48 -.058 recovered less than what was lost day before.
This was the bottom for a rally past the upper band and the next Sell.
This was a reversing Buy. This was in a bear market
Date DJI Gain CL/MA ROC P IP21 V OP
23. 7/24/2002 8191.29 .064 .936 -1.475 -673 -.119 -629 -.514 recovered more than what was lost day before.
This was a reversing Buy. This was the bottom for a rally to the upper band.
This was in a bear market
Date DJI Gain CL/MA ROC P IP21 V OP
24. 10/10/2002 7533.95 .165 .96 -1.579 -556 -.111 -469 -.286
Recovered more than what was lost day before.
This was the bottom for a rally up above the upper band.
Date DJI Gain CL/MA ROC P IP21 V OP
25. 4/21/2005 10218.6 .133 .985 -.289 -97 -.167 -228 -.168
Recovered more than what was lost day before.
This was a reversing Buy. This was the bottom for a rally
Date DJI Gain CL/MA ROC P IP21 V OP
26. 3/ 6/2007 12207.59 .144 .974 -.423 -21 -.023 -254 -.10
Recovered more than what was lost day before.
This was the bottom for a rally up past the upper band.
This was in a bear market
Date DJI Gain CL/MA ROC P IP21 V OP
27. 11/23/2007 12799.04 .064 .958 -.779 -414 -.089 -315 -.158
Recovered more than what was lost day before.
This was the bottom for a rally to the upper band.
Date DJI Gain CL/MA ROC P IP21 V OP
28. 3/11/2008 12156.81 .032 .987 -.024 -238 .047 181 -.058
Recovered more than what was lost day before.
This was the bottom for a rally up past the upper band.
Date DJI Gain CL/MA ROC P IP21 V OP
29. 9/18/2008 11019.69 .000 .972 -.345 -210 .036 147 .202
Recovered more than what was lost day before.
This was the bottom for a rally only to falling 21-day ma.
This was in a bear market
=======================================================================
Date DJI Gain CL/MA ROC P IP21 V OP
X 10/28/2008 9065.12 .008 .979 -1.661 -653 -.108 -151 -.436
Recovered what was lost day before.
This was the bottom for a rally only to falling 21-day ma.
This was in a bear market )
X = Extreme Bear Market
Date DJI Gain CL/MA ROC P IP21 V OP
X . 12/2/2008 8419.09 -.032 .981 -1.25 -376 -.03 -230 .002
Recovered less than what was lost day before.
This was in a bear market
X = Extreme Bear Market
Date DJI Gain CL/MA ROC P IP21 V OP
X 1/21/2009 8228.10 -.01 .963 -.524 151 - .035 -126 -.185 .
Recovered less than what was lost daybefore.
This was in a bear market
X = Extreme Bear Market
===================================================================================
Date DJI Gain CL/MA ROC P IP21 V OP
30. 3/17/2011 11774.59 .069 .973 -.345 -210 (+100) .009 -218 -/073
Recovered more than what was lost day before.
This was the bottom for a rally to upper band.
This was in a bear market
Date DJI Gain CL/MA ROC P IP21 V OP
31. 10/4/2011 10808.71 opem .972 -0.461 -260 .021 193 .127
Recovered more than what was lost day before.
This was the bottom for a rally only to falling 21-day ma.
This was in a bear market
----------------------------------------------------
30 completed trades - Avg = 7.6%