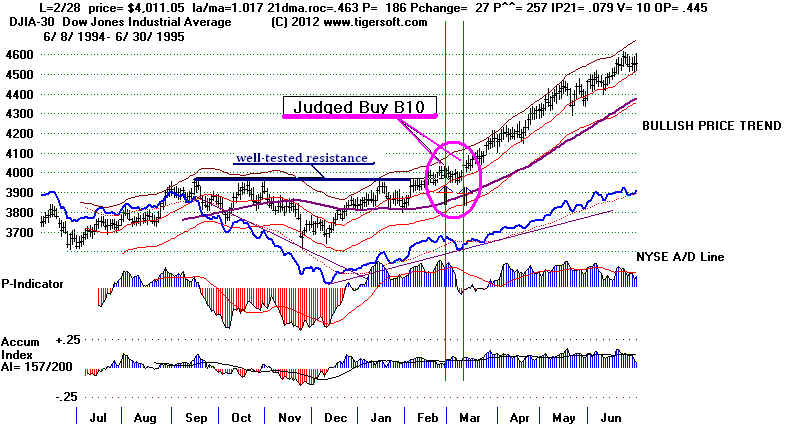
Confirmed Price Breakouts above flat,
well-tested resistance
that goes back more than 40 days
There have been 35 December 2013 Buy B10s since 1928.
The average gain was .120. The biggest gains occurred in the Year of
Mid-Term Elections. Their 5 cases averaged a gain of +26.7%. The
following year's gains averaged only 7.8% in 8 instances. Buy B10s
in the first 10 days of the month were also more profitable, gaining .166
in 13 occurrences.
Size of Gains
>.10 17
>.05 - .099 8
>.02 - .499 8
>0 - .0199 1
loss 1
BUY B10s:
1928-2013s 19341108 B10 97.3 .069
1.029 .606 35 22 193 .086 11 .121 .104
19421008 B10 113.6 .254
1.044 .691 114 20 579 .325 91 .593 .052
19440308 B10 139.5 .176
1.023 .463 110 22 587 .179 86 .348 .052
19441208 B10 150.5 .09
1.022 .243 106 18 568 .134 91 .575 .026
19450824 B10 169.9 .172
1.038 .598 139 28 628 .139 69 .348 .023
19480519 B10 188.3 .026
1.027 .494 108 13 461 .211 138 .412 .118
19490802 B10 177.6 .242
1.021 .652 153 -11 599 .33 137 .492 .02
19521128 B10 283.7 .029
1.034 .774 186 13 688 .19 217 .406 .033
19550415 B10 425.5 .101
1.028 .646 109 -18 315 .063 73 .444 .064
19560309 B10 497.8 .042
1.035 .66 165 49 524 .085 266 .218 .022
19580204 B10 458.7 .404
1.026 .429 197 18 625 .101 296 ,211 .041
19611114 B10 732.6 -.002
1.033 .493 86 12 251 .128 55 .324 .013
19621116 B10 630.9 .488
1.056 .864 115 32 322 .111 70 .148 .039
19640706 B10 844.2 .112
1.027 .605 134 39 371 .089 196 .653 .028
19650817 B10 894.3 .102
1.019 .190 7 243 .000 38 .264 -.049
19650916 B10 931.2 .058
1.031 .487 92 9 255 .05 27 .347 .064
19670117 B10 843.67 .052
1.046 .510 181 46 456 .092 9 .226 .084
19680930 B10 935.79 .045
1.020 .565 119 8 275 .09 12 .591 .028
19730926 B10 949.5 .04
1.053 1.045 305 17 590 .301 2 .481 .092
19760107 B10 898.69 .123
1.057 1.124 286 35 530 .20 2 .569 .107
19790115 B10 848.67 .044
1.042 .568 133 42 252 .108 2 .337 -.059
19790815 B10 885.84 0
1.044 .807 232 49 441 .317 5 .497 .073
X19840809 B10 1224.04 .054
1.079 1.218 139 77 244 .135 15 .433 .04
19840802 B10 1211.57 .106
1.046 .34 -33 48 -57 .106 0 .10 -.015
19850605 B10 1320.56 .383
1.023 .673 234 11 464 .125 15 .473 .024
19890112 B10 2222.32 .045
1.023 .454 118 21 204 .078 11 .197 .033
19910131 B10 2736.39 .106
1.058 .580 143 33 263 .116 12 .226 .125
19911227 B10 3101.52 .081
1.057 .755 117 18 216 .077 7 .218 .026
X19930520 B10 3540.16 .121
1.023 .290 11 19 2- .097 4 .025 .063
Simultaneous Sell S7
19950914 B10 4801.8 .156
1.032 .413 237 24 328 .08 14 .159 .07
19960912 B10 5771.94 .188
1.014 .261 129 60 165 .117 8 .258 .018
20030604 B10 9038.98 .085
1.041 .697 569 63 550 .101 154 .244 .153
20051121 B10 10820.28 .07
1.026 .685 277 -10 307 .108 108 .329 .024
20101104 B10 11434.84 .12
1.029 .501 358 106 348 .112 4 .329 .07
20120118 B10 12578.95 .043
1.023 .69 553 46 553 .125 95 .115 .095
20130122 B10 13712.21 .107
1.026 .411 460 57 460 .263 12 .154 .021
20131113 B10 15821.63 .043
1.015 .50 231 133 231 .170 6 .124 .023
----------------------------------------------------------------
No. Completed Trades Avg. =
17 8 8 1 1 Presidential Election Year 2 .086 PE + 1 11 .122 PE + 2 5 .267 PE + 3 8 .078 January 7 .074 February 1 .404 March 2 .109 April 1 .101 May 2 .074 June 2 .234 July 1 .112 August 5 .114 September 5 .095 October 1 .254 November 6 .129 December 2 .086 1-10 13 .166 11-20 13 .099 21-31 9 .086
|
-----------------------------------------------------------------------------------------------------------
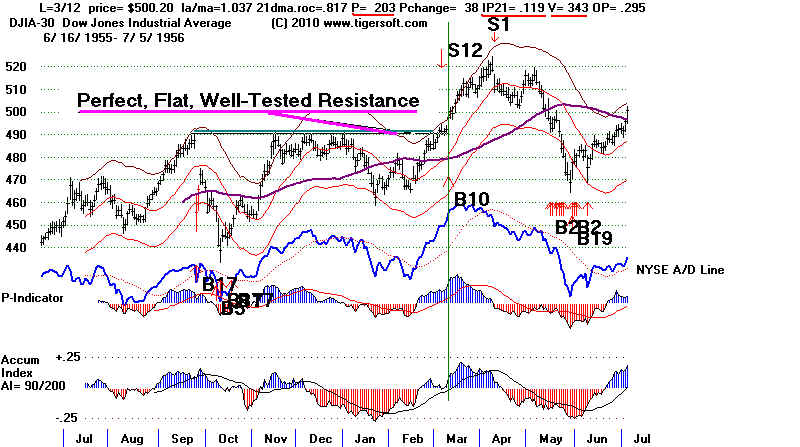
2012 Peerless version
Breakouts above well-tested flat
resistance are
usually bullish. But to
increase the odds of success
we usually require the P-Indicator
and Accumulation
Index to be very positive on the
breakouts unless
the DJI has just had an
intermediate-term correction
and is rising back above the
neckline of an inverted
head/shoulders pattern.
Last edited 1/22/2013
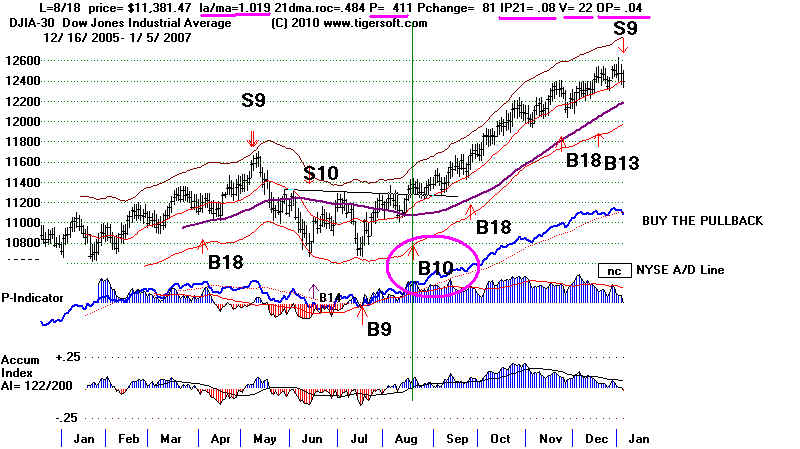
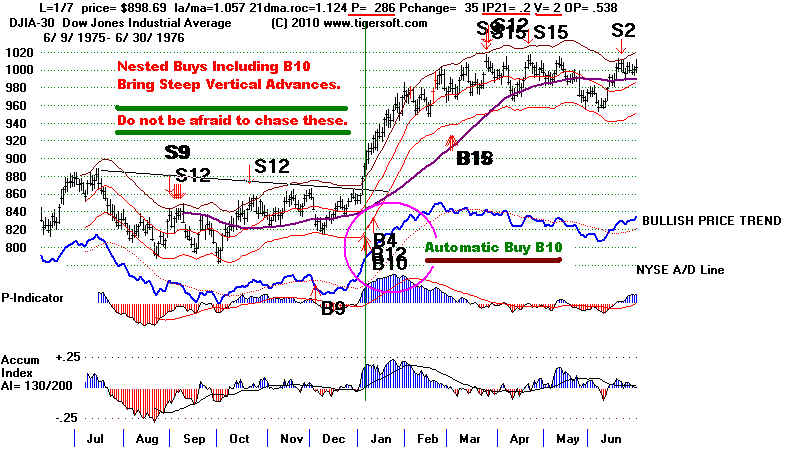
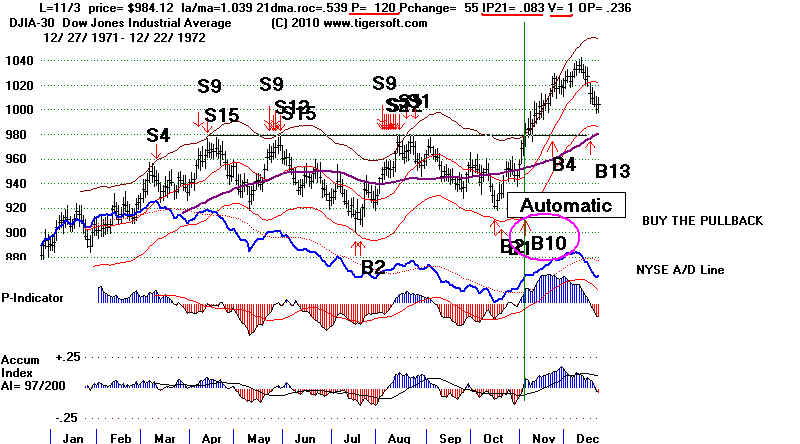
>>> Buy B10s can bring
scary swift upward take-offs.
You should not be afraid to chase a confirmed Buy B10.
They usually bring steep immediate advances. But understand
the concepts here.
A valid Buy B10 normally clears most nearby overhead resistance
for the last six months. That is why prices should advance
easily after a valid Buy B10. The gains vary greatly.
Continued vigilance is always needed if prices fail to keep rising.
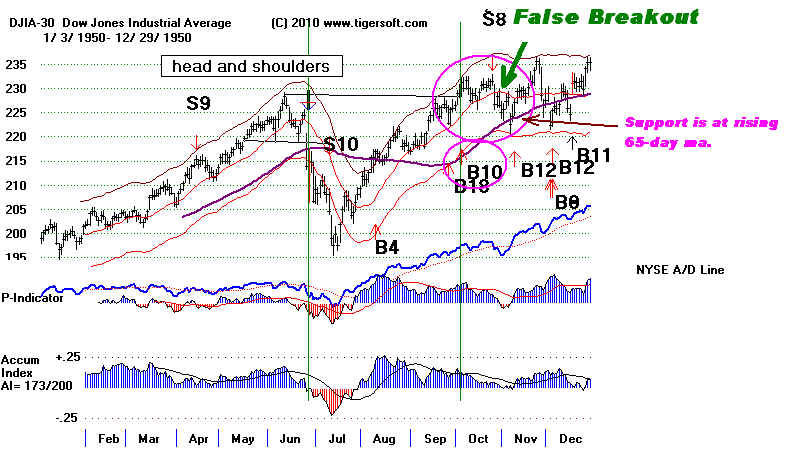
Buy B10 failures are rare. These are false breakouts. They typically
occur if there is a major Sell S8, Sell S9. Sell S12 or Sell S15
soon after the Buy B10. But there are a few cases of breakout B10
failures because unexpected bearish news hits the market. In October
1950, it was news that the Chinese Red Army had crossed the Yalu.
The DJI then retreated to its 65-day ma before rallying back to the
upper band and entering a trading range.
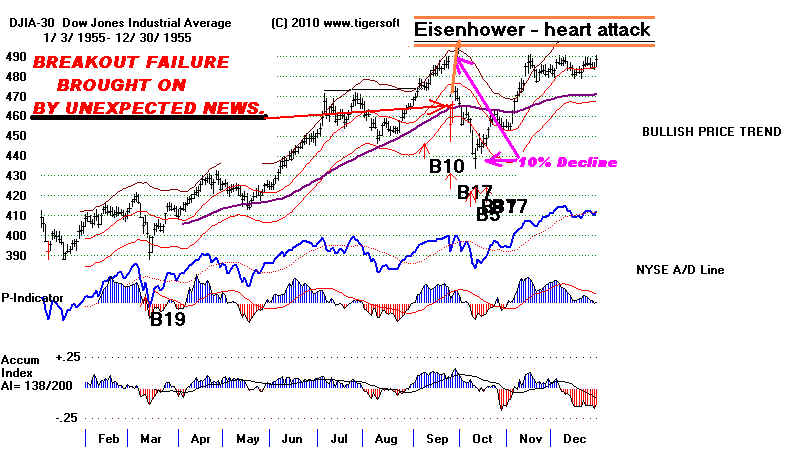
The September 1955 Buy B10 was short-circuited because of
Eisenhower's heart attack. In this case the DJI fell back to 10% before
making a full recovery. The September 1955 Buy B10 techicals did
show some weakness, in that the NYSE A/D Line did not confirm
the breakout. A/D Lines sometimes do lag if there is a Buy B10 as the
DJI comes out of a basing formation after a bear market. In the case of
on-going bull market Buy B10s, this shows that we should be more
wary when the A/D Line appears to be lagging.
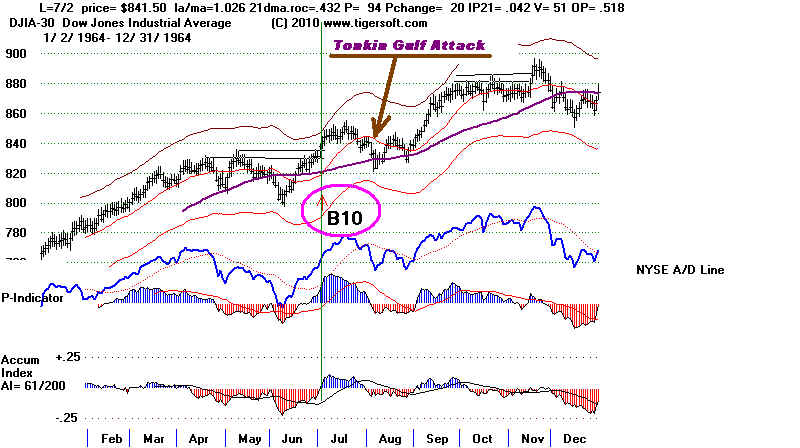
Another failed Buy B10 breakout took place in July 1964. Here the
breakout was sabotaged by news that North Vietnames patrol boats
had attacked American destroyers in international war. Though the
evidence was shaky, at best, President Johnson used this story to
get Congress to commit to paying for what became the 10 year war in
Viet Nam.
.
There have been 30 automatic B10s, all of them after 1941.
14 of these B10s brought gains of more than 10% while
9 led to gains under 3.5%. The biggest paper losses were
arounf 5%.
When a Buy B10 signal occurs,
check the key values underlined
here in red:
>>>High IP21 levels over .30 are associated with the biggest advances.
There were only two cases, +24.8% and 21.2%
>>>An OPct value above +.50 occurred in six cases.
Their average gain was +3.0%.
Which month the B10 occurs in is also important. January anf February
bring big gains. So, does September, which normally is not considered
a
bullish month. B10s between March and June are anemic. The biigest gain
was
only +6.0%.
No. Avg, Gain
---------- --------------
January
4 + 15.9%
February
1
+ 36.1%
March
2
+4.3%
April
0 ----------
May
2
+ 7.1%
June
1
+2.6%
July
1 + 11.6%
August
5 + 11.6%
September 3
+ 13.1%
October
4
+
6.8%
November 4
+
6.9%
December 3
+
10.6%
-------------------------------------------------
Total Cases 30
10.7%
Which year in the 4 year Presidential cycle is
an important factor, too.
No. Avg Gain
------- ------------
. Presidential Election (PE)
11
+ 6.6%
Year after P.E.
8 + 13.0%
Two Years after P.E.
6 +15.9%
Three Years after P.E.
5 + 7.5%
-----------------------------------------------------------------------
Total Cases 30 10.7%
1956 - Automatic B10
1976 - Automatic B10
1972 - Automatic B10
The computer is not
as good as we are in spotting breakuyt B10s above well-tested
flat resistance line. So, I would advise looking for them, even
if the computer
does not issue a Buy B10. And be careful, when the computer gives
a Buy B10,
to be sure that it is reasonable, namely that it is signaling a clear
breakout past
such resistance.
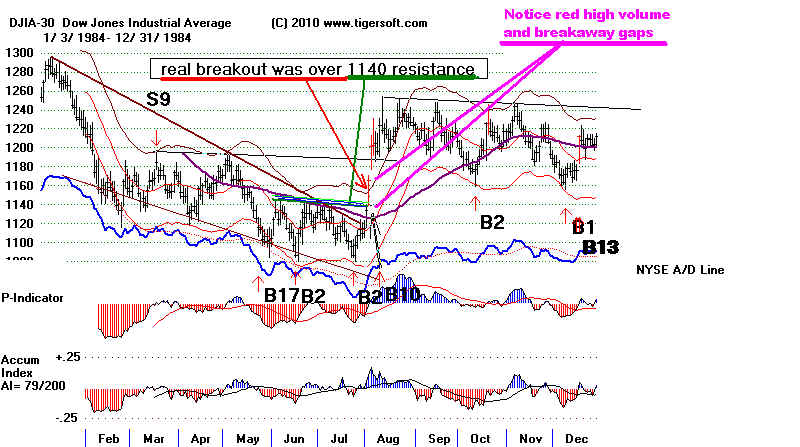
Technical Resistance Dominoes
When you
look at a chart, you will want to inspect for trendlines and
horizontal support and resistance lines. In July 1984, I noted
the price
downtrendline and the NYSE A/D Line downtrends coming from the Janaury
peaks. I also saw the flat topped horizontal resistance at 1180
and the
two previous peaks at 1995. I reasoned if the price and NYSE A/D
Line
downtrends were ruptured, there would be enough new buying to get
the DJI past the 1140 resistance. And if there was a breakout at
1140,
the DJI might well be able to get back up to 1200. These
three resistance
levels were perfectly set up to act like dominoes. And that is
exactly
what did happen. Calls on a stock like Boeing jumped in four days
to 1/4
to over 3. The automatic Buy B10 here does not do justice to the
important breakouts it is trying to ponpoint. Look for them
yourself
and notice wheh they set up in a dominoe like way. It can be easy
money.
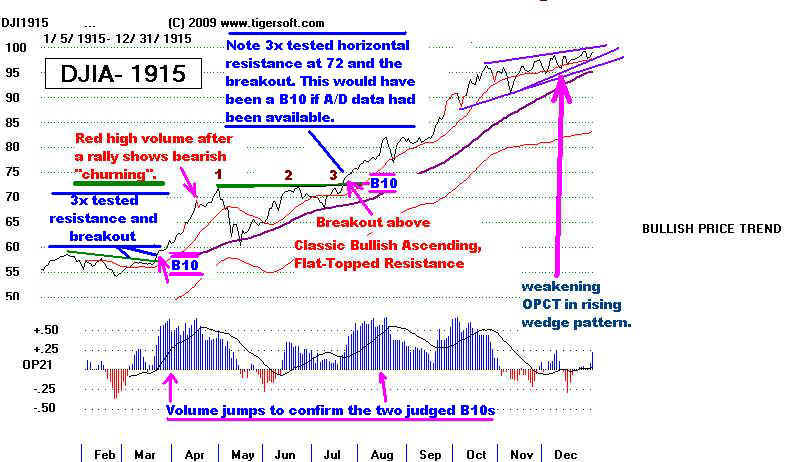
Look for
Three-Times Tested Horizontal Resistance Lines
You should after studying automatic Buy
B10s in this chapter,
get to a point where you immediately look for flat and diagonal
support and resistance.. The 1915 chart shows two classic
breakouts past horizontal resistance. Prices immediately
rose
in both cases. That is the norm.
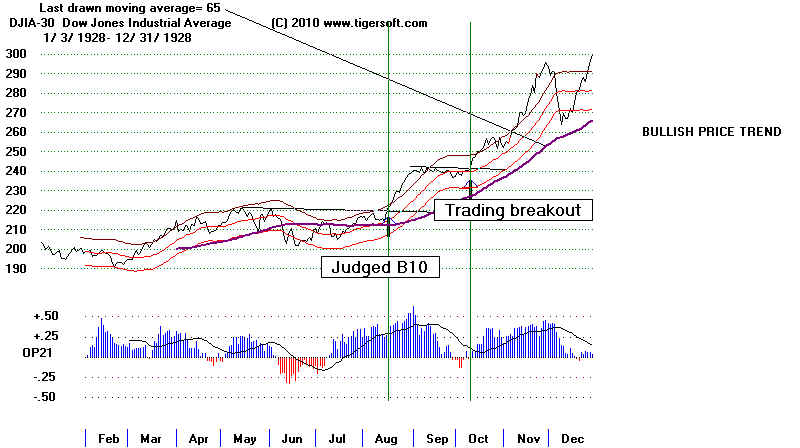
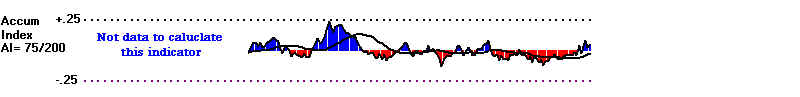
In the chart below, we see only
price closes and there is no
A/D Line, Peerless P-Indicator or Tiger Accumulation Index.
The
necessary data for these computations was not available
then.
Even without the fine data of today, one should then have been
able to see the importance of the two breakouts, which are
judged as Buy B10s, in the chart below.
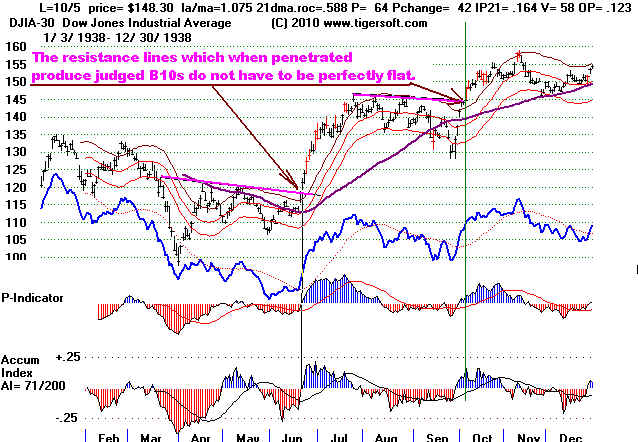
B10s occur on breakouts past well-tested flat
resistance lines. "Well-tested" means
three or more times. The lines dp not have to be perfectly flat, but it
helps because
then more traders immediately recognize the change in price action that a
breakout signifies. B10s, if they are genuine, should produce runaway
moves.
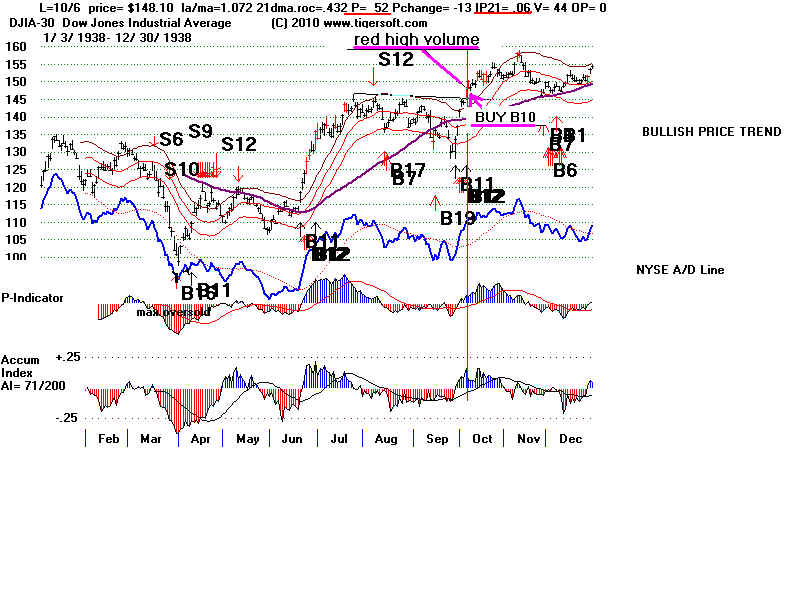
The two judged B10s in 1938 did have good internals and the resistance lines
were not flat, but they were well-tested and the DJI rose immediately after
each
breakout and did not fall back below the point of resistance. One of
the concerns
traders should have if they employ the Buy B10 is about false
breakouts. The
point of breakout should act as support if the B10 is going to work
out. Another
point: flat tops in uptrends usually do bring upside breakouts. But not
always.
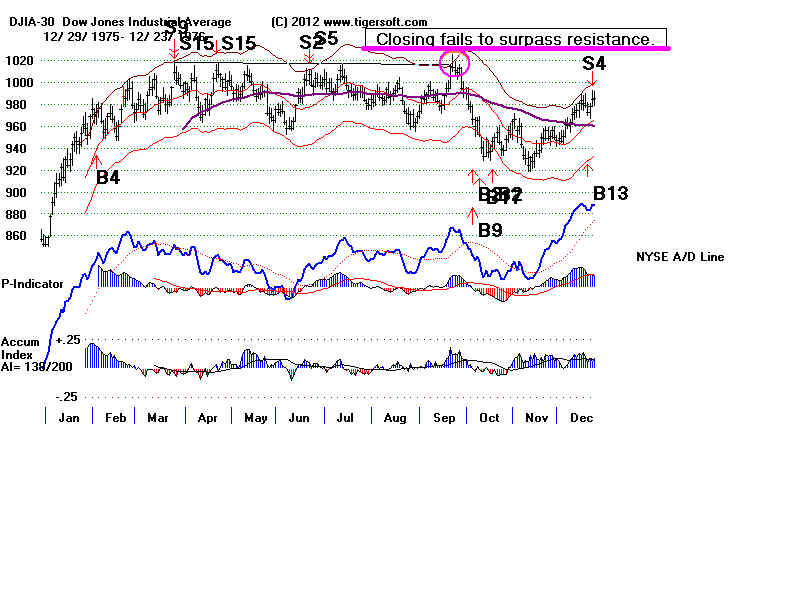
The 1000-1010 flat resistance in 1976 was not breached for years.
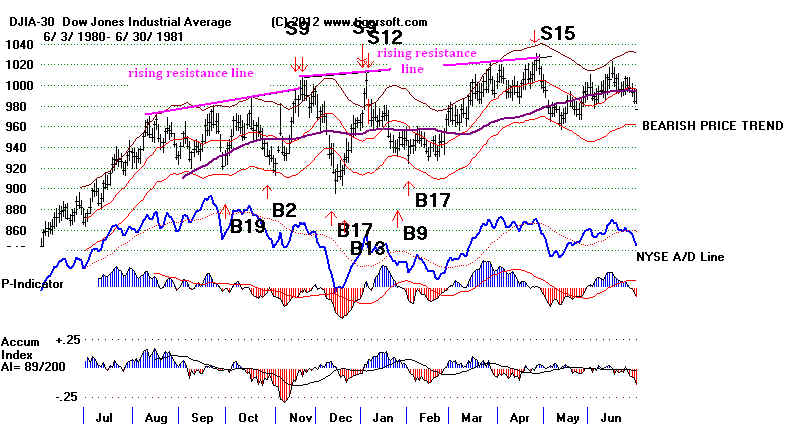
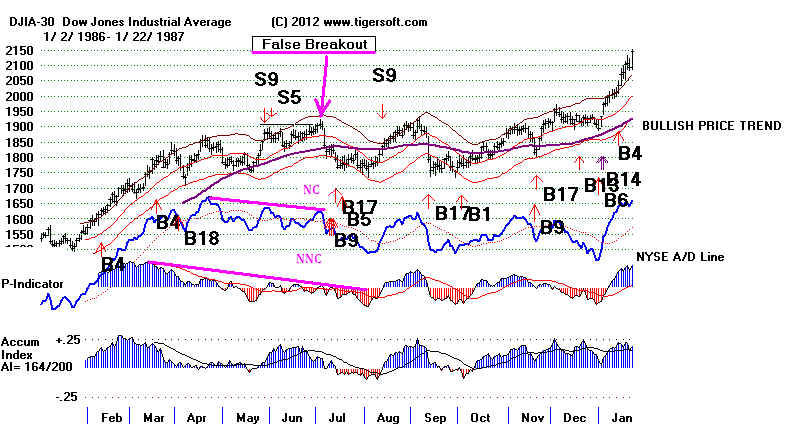
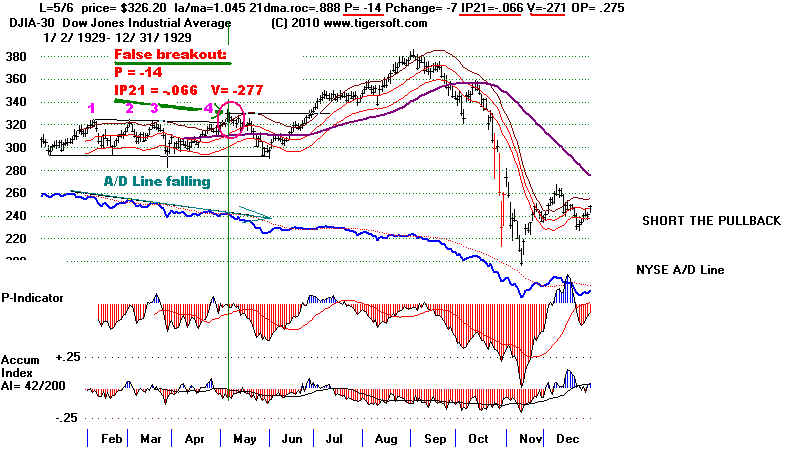
False Breakouts
How can we spot potential false
breakouts? We should look closely at the key
values on days when there are breakouts. If the internals are weak, be
very
suspicious. A false breakout may be in the making. But there are
other factors also
at work.
Usually in the cases of false breakouts,
prices do not completely surpass
a line drawn through the earlier days' highs or the resistance line is rising
and not flat. The line of resistance must go through 3 or more 3
previous highs,
all at essentally the same price level. Often Peerless will give a Sell
signal on
a false breakout. And often the other averages do not make a
corresponding new high.
 |
 |
 |
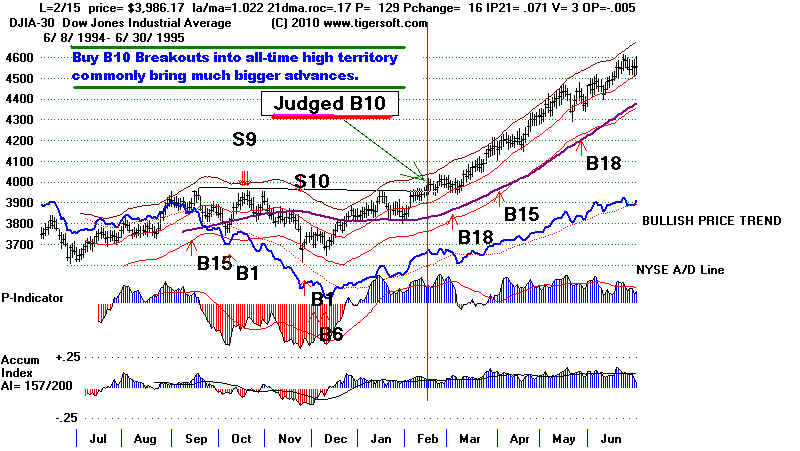
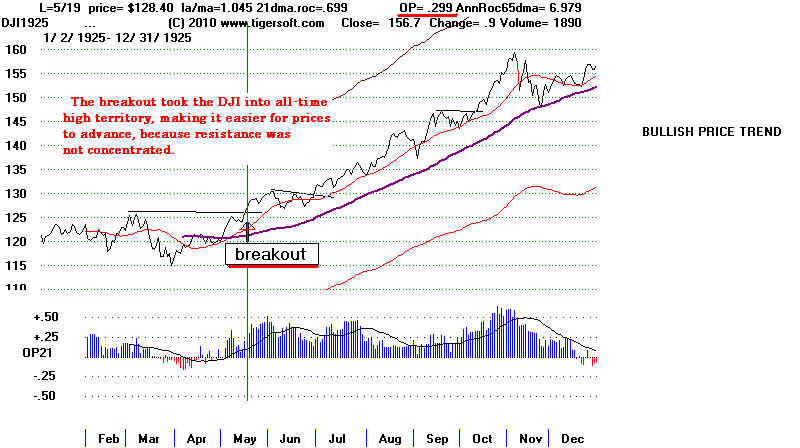
Flat-Topped Breakouts into All-Time High Territory Are Bullish.
This concept helped us a lot early in 1995 when the DJI closed above 4000 for
the first time.
.
On May 5th, 1929, the DJI broke out over 320. This was a level that had
been
tested four times until the breakout. This was a breakout from a
70 day consolidation
pattern in an on-going bull market. This was not an automatic Buy B10 because
the
key internals were all negative and the A/D Line was downtrending.
Still prices rose
another 15%. The pattern was perfect, there was strong upward momentum
and the
breakout took prices into all-time high territory. Short sales taken
earlier should have
been covered.
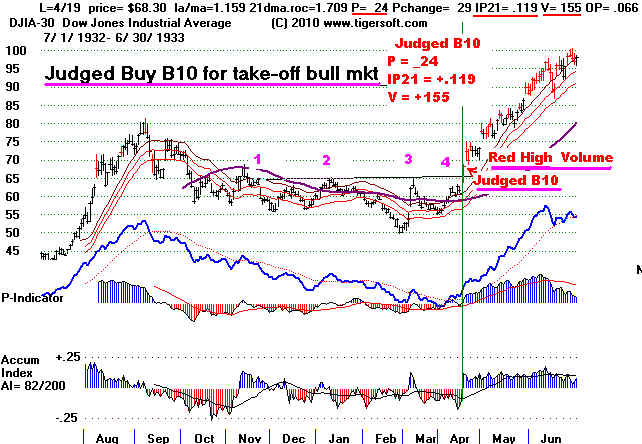
Bottom Formation Buy B10s
Buy B10 - judged and automatic - produce bigger gains when they soon occur after
a long bear market. In these cases, they mark the end of the bottoming process.
They launch a new bull market; so their gains are excellent.
In the case of April 19, 1933, the accompanying key indicators were each positive.
Red high volume and a price gap add to their power and authenticity.
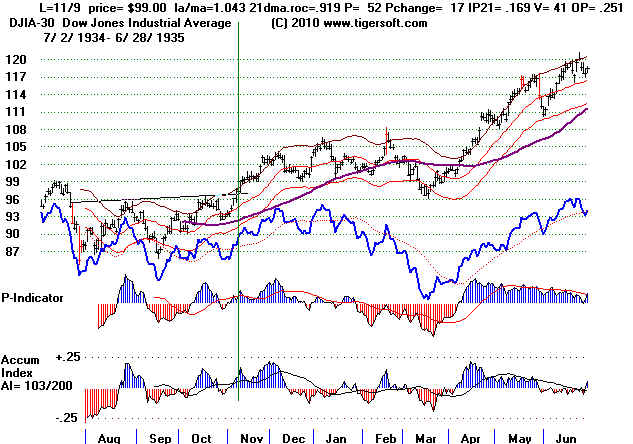
Continuation Pattern Buy B10s
You will see many flat topped
breakouts if you observe charts in an on-going bull market.
These are "continuationBuy B10s". Look at them closely. Be
sure that there were
at least 3 points of reversal before the breakout. Check the key internal strength
indicators to see that are not just positive, but that they are making a monthly
high, too. If these conditions, are not present, the breakout will not move up
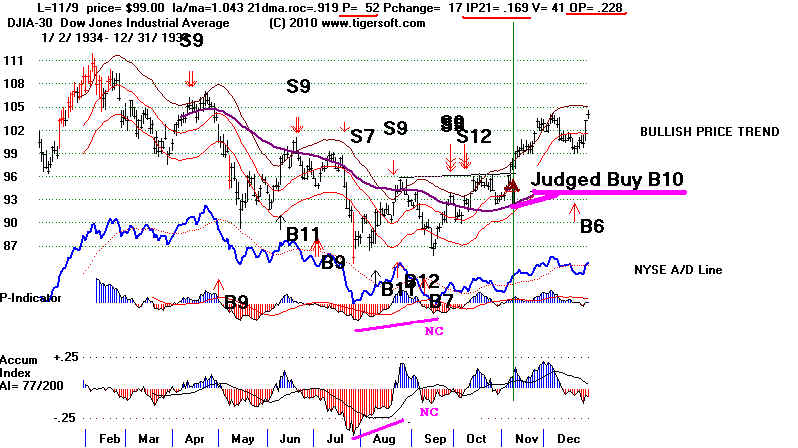
as strongly. See the case on 11/19/1934. The point of breakout was not
confirmed
by the A/D Line or the P-Indicator making a month's new high. In addition, the
the resistance line had only been tested twice.
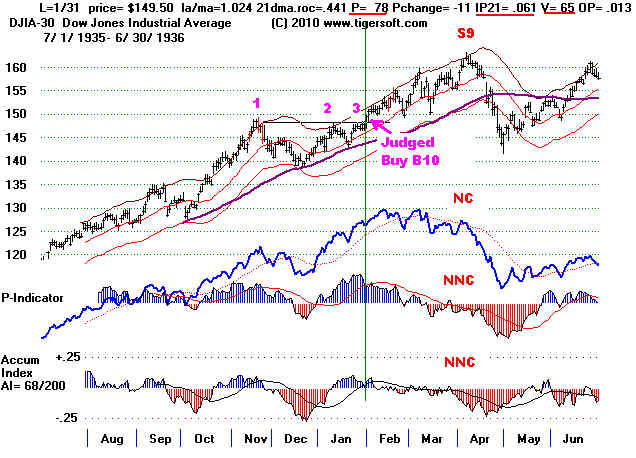
In the January 1936 judged B10, we see
a nice flat top-breakout. The A/D Line
was in a strong uptrend and leading
prices higher. But within two months,
there were severe negative non-confirmations of DJI new highs at the upper
band (Sell S9 and S12) and the DJI quickly fell back 10%. The lesson here
is that continuation B10s often bring only modest intermediate-term gains.
All-Time High Buy B10s
The
biggest gains from "Continuation B10s" tend to occur when the DJIA
is moving up into all-time high
territory. That is because there are no longer
sellers who want to get out even and there is
no obvious place for sellers
to concentrate their sell order.
(Work in progress. This section will be edited soon.)
1915-1928
In this period we only have closing prices and volume. Even so, you
can see the power of flat topped breakouts when volume or OPCT (the
21-day moving average of OBV/Volume confirms.
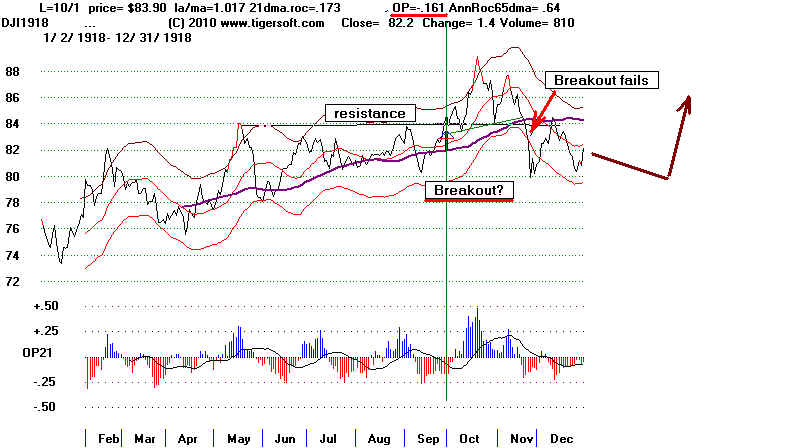
September 1918
The September 1918 breakout was problematic. The previous tops did not line up well.
The day of the breakout did not occur on high (red) volume. Most important, the OPCT was less
than zero on the breakout. You can see how the breakout point at 84 does act as support for a
month. This follws the principle that broken resistance becomes support. In November the
breakout failed. Prices fell below the 84 breakout point and could not get back above it until
February. At that point the rally resume.
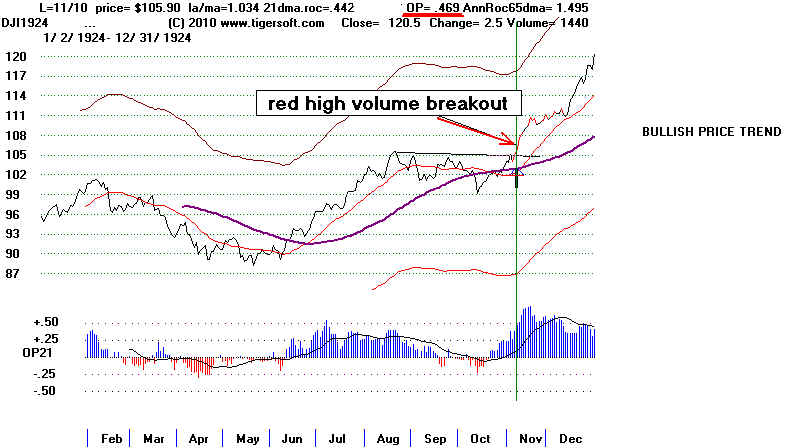
November 1924
The November 1924 breakout looked powerful, much stronger than the 1918 breakout.
The volume on the day of the breakout was high. It turned the price bar red. The OBV-PCT was
very positive, a +.469. The price pattern was perfect. There has been 4 tests of 105 before the
breakout above it. This created a precise horizontal resistance level which when exceeded cried
out for buying by informed traders. The breakout was so bullish that prices never pulled back.
May 1925
Excellent breakout. Minor hesistation and renewed run upwards. No red high volume..
 April 1927
Excellent trading breakout. Flat well-tested resistance. High value for OPct.
Into all-time high territory. No pull-backs even though volume was not high
enough to turn the price bar red.
April 1927
Excellent trading breakout. Flat well-tested resistance. High value for OPct.
Into all-time high territory. No pull-backs even though volume was not high
enough to turn the price bar red.
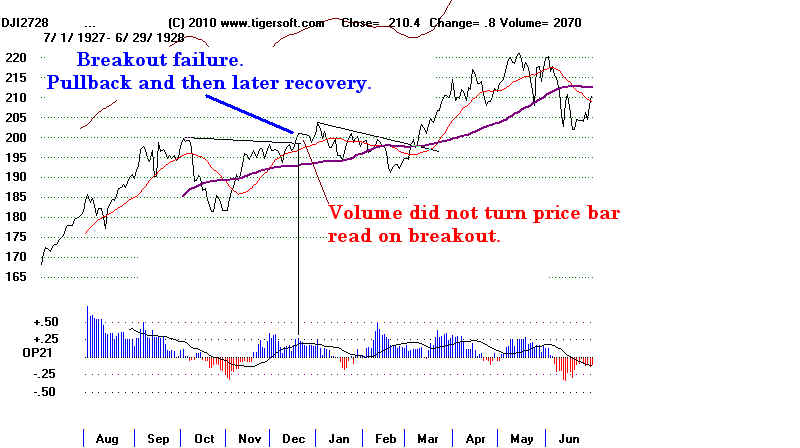
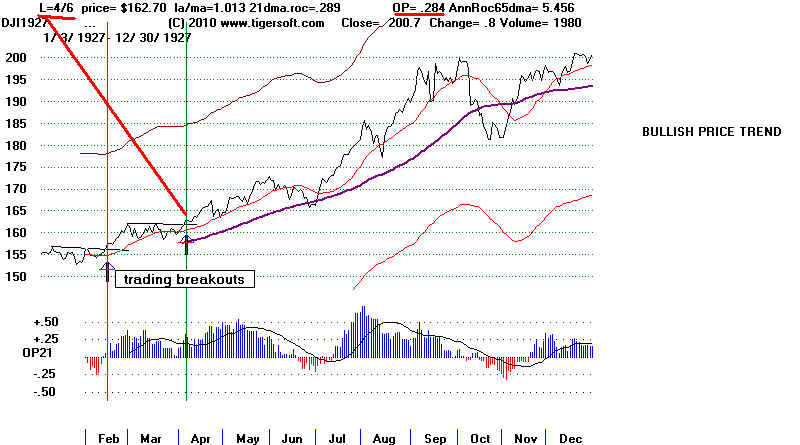 December 1927
Breakout had high value for OPct, + .30). It was into all-time high territory.
But volume was not high enough to turn the price bar red on day of breakout. No pull-backs.
December 1927
Breakout had high value for OPct, + .30). It was into all-time high territory.
But volume was not high enough to turn the price bar red on day of breakout. No pull-backs.
 August and October 1928
Speculative bull markets tend to pause with flat tops, which are eventually broken above.
August and October 1928
Speculative bull markets tend to pause with flat tops, which are eventually broken above.
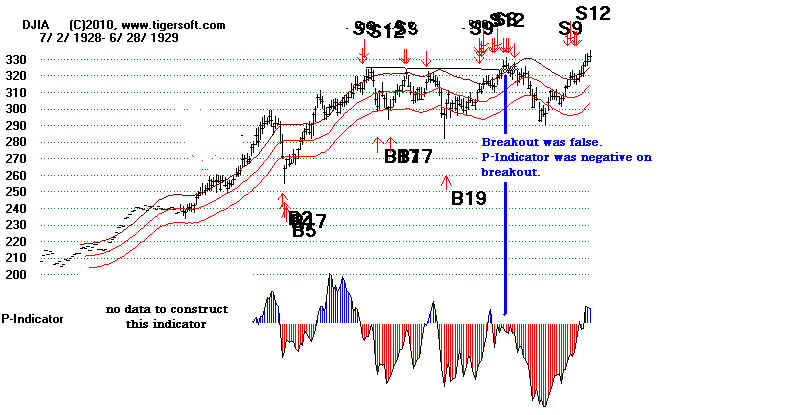
 1929-1942
May 1929 - Flat Topped Breakout Fails.
1929 is the earliest we can see the Peerless P-Indicator and Accumulation Index on
our charts. (The necessary data is not available before that.) These indicators are
very important. The breakout in May above four previous top occurred with the P-Indicator
and the Accumulation Index in negative territory. Instead of a Buy, the breakout took place
on automatic major Peerless Sells.
1929-1942
May 1929 - Flat Topped Breakout Fails.
1929 is the earliest we can see the Peerless P-Indicator and Accumulation Index on
our charts. (The necessary data is not available before that.) These indicators are
very important. The breakout in May above four previous top occurred with the P-Indicator
and the Accumulation Index in negative territory. Instead of a Buy, the breakout took place
on automatic major Peerless Sells.
 NNC
NNC
 May 1934
Judged Buy B10 (Breakout above Well-Tested Resistance Horizontal Resistance)
Sometimes, it's important to judge that a Buy B10 has occurred. In Noveember 1934, the
the DJI had just fallen 20% and then recovered after making a marginal low and
reaching the lower band. Horizontal breakouts after a mini-bear market going into
the bullish 3rd year of a 4-Year Presidential Election Cycle should be respected as bullish.
In this case the P-Indicator and Accumulation Index were both clearly posiitve. (A reading of
52 for the P-Indicator would corresponf to a +300 in 2010. The sum of advances and declines
on 11/9/1934 was 490. It was more than six times that on 11/4/2010, 3062.
May 1934
Judged Buy B10 (Breakout above Well-Tested Resistance Horizontal Resistance)
Sometimes, it's important to judge that a Buy B10 has occurred. In Noveember 1934, the
the DJI had just fallen 20% and then recovered after making a marginal low and
reaching the lower band. Horizontal breakouts after a mini-bear market going into
the bullish 3rd year of a 4-Year Presidential Election Cycle should be respected as bullish.
In this case the P-Indicator and Accumulation Index were both clearly posiitve. (A reading of
52 for the P-Indicator would corresponf to a +300 in 2010. The sum of advances and declines
on 11/9/1934 was 490. It was more than six times that on 11/4/2010, 3062.
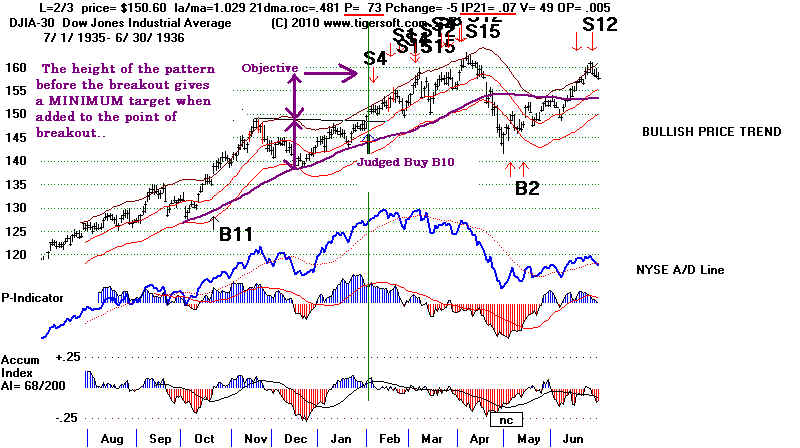
 February 1936
Judged Buy B10 (Confirmed Breakout above Flat, Well-Tested Hotizontal Resistance)
The February horizontal breakout had to be judged here. The P-Indicator was an adjusted +350 to +420.
The Accumulation Index was clearly positive. Use this example as a standard to employ in
on-going bull markets. It will help. The height of the pattern before the breakout gives a reliable count
of the minimum number of points prices are likely to rise from the point of breakout. Knowing this,
one would have dismissed the Sell S4 only a few days after the breakout.
February 1936
Judged Buy B10 (Confirmed Breakout above Flat, Well-Tested Hotizontal Resistance)
The February horizontal breakout had to be judged here. The P-Indicator was an adjusted +350 to +420.
The Accumulation Index was clearly positive. Use this example as a standard to employ in
on-going bull markets. It will help. The height of the pattern before the breakout gives a reliable count
of the minimum number of points prices are likely to rise from the point of breakout. Knowing this,
one would have dismissed the Sell S4 only a few days after the breakout.
 October 1938
Judged Buy B10 (Confirmed Breakout above Flat, Well-Tested Resistance Hotizontal Tl )
October 1938
Judged Buy B10 (Confirmed Breakout above Flat, Well-Tested Resistance Hotizontal Tl )
 1942-2010
Date DJIA Gain LA/MA ROC P-I P-chan. IP21 V-I OPCT 65dCh
-------------------------------------------------------------------------
1 10/8/1942 113.6 +24.8% 1.044 .691 114 20 .325 91 .546 .05
Red high volume.
DJI rallied immediately ... Reversed on 6/7/43 at 141.8 by S9.
This signal came at the end a bottom formation.
It was clustered with other Buy signals.
-------------------------------------------------------------------------
2 3/8/1944 139.5 +6.0% 1.023 .463 110 22 .179 86 .328
DJI rallied only to 141 and then fell back to 135.
See in the chart below that resistance at 142 still remained.
The DJI then rallied and was Reversed on 147.9 by S2
1942-2010
Date DJIA Gain LA/MA ROC P-I P-chan. IP21 V-I OPCT 65dCh
-------------------------------------------------------------------------
1 10/8/1942 113.6 +24.8% 1.044 .691 114 20 .325 91 .546 .05
Red high volume.
DJI rallied immediately ... Reversed on 6/7/43 at 141.8 by S9.
This signal came at the end a bottom formation.
It was clustered with other Buy signals.
-------------------------------------------------------------------------
2 3/8/1944 139.5 +6.0% 1.023 .463 110 22 .179 86 .328
DJI rallied only to 141 and then fell back to 135.
See in the chart below that resistance at 142 still remained.
The DJI then rallied and was Reversed on 147.9 by S2
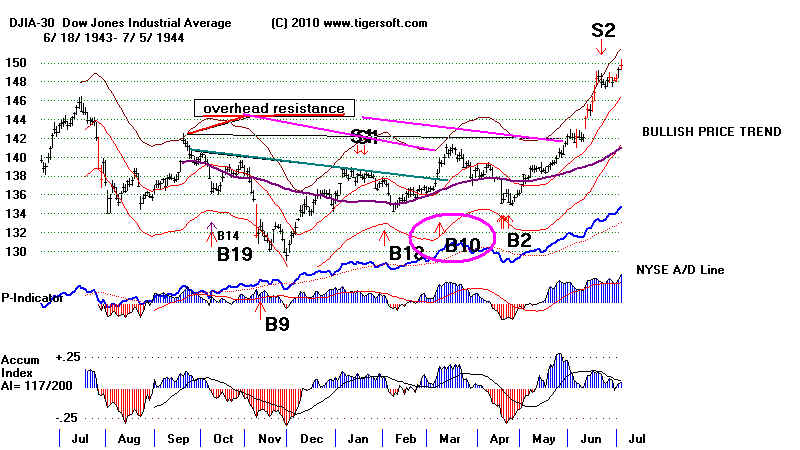 --------------------------------------------------------------------------
3 12/8/1944 150.5 +9.0% 1.022 .243 106 18 .134 91 .532
DJI rallied only to 152 and then fell back to 148 and rallied.
Reversed on 5/15/45 at 164 by S9
--------------------------------------------------------------------------
4 8/24/1945 169.9 +17.2% 1.038 .598 139 28 .139 69 .254
DJI rallied immediately ... Reversed on 1/10/46 at 199.2 by S9
--------------------------------------------------------------------------
5 10/15/1947 183.3 +0.6% 1.027 .535 98 21 .181 768 .342
DJI's breakout quickly fizzled....Reversed on 10/22/47 at 184.4 by S4
Note overhead resistance at 187 was still a factor.
--------------------------------------------------------------------------
6 5/19/1948 188.3 +2.1% 1.027 .494 108 13 .211 138 .40
Also a Buy B18
DJI rallied immediately but only for 3 weeks.
It was Reversed on 6/16/48 at 192.3 by S1
A bearish head and shoulders top pattern should not appear so quickly
after a valid Buy B10.
--------------------------------------------------------------------------
7 8/2/1949 177.6 +21.2% 1.021 .652 153 -11 IP21=.33 137 .471
DJI rallied immediately ... Reversed on 4/14/1950 at 215.3 by S9
Volume rose noticeably on the advance, compared to the decline.
--------------------------------------------------------------------------
8 10/4/1950 231.2 +0.1% 1.03 .595 143 15 .133 169 .45
DJI rally fizzled out after breakout. Unexplected news hit Wall Street.
Chinese Red Army crossed Yalu and attacked UN forces in October..
DJI reversed at 231.5 on 10/25/50 by S8 at 262.80 5/4/51
The strength in the NYSE A/D continued as the DJI went into a trading range.
--------------------------------------------------------------------------
3 12/8/1944 150.5 +9.0% 1.022 .243 106 18 .134 91 .532
DJI rallied only to 152 and then fell back to 148 and rallied.
Reversed on 5/15/45 at 164 by S9
--------------------------------------------------------------------------
4 8/24/1945 169.9 +17.2% 1.038 .598 139 28 .139 69 .254
DJI rallied immediately ... Reversed on 1/10/46 at 199.2 by S9
--------------------------------------------------------------------------
5 10/15/1947 183.3 +0.6% 1.027 .535 98 21 .181 768 .342
DJI's breakout quickly fizzled....Reversed on 10/22/47 at 184.4 by S4
Note overhead resistance at 187 was still a factor.
--------------------------------------------------------------------------
6 5/19/1948 188.3 +2.1% 1.027 .494 108 13 .211 138 .40
Also a Buy B18
DJI rallied immediately but only for 3 weeks.
It was Reversed on 6/16/48 at 192.3 by S1
A bearish head and shoulders top pattern should not appear so quickly
after a valid Buy B10.
--------------------------------------------------------------------------
7 8/2/1949 177.6 +21.2% 1.021 .652 153 -11 IP21=.33 137 .471
DJI rallied immediately ... Reversed on 4/14/1950 at 215.3 by S9
Volume rose noticeably on the advance, compared to the decline.
--------------------------------------------------------------------------
8 10/4/1950 231.2 +0.1% 1.03 .595 143 15 .133 169 .45
DJI rally fizzled out after breakout. Unexplected news hit Wall Street.
Chinese Red Army crossed Yalu and attacked UN forces in October..
DJI reversed at 231.5 on 10/25/50 by S8 at 262.80 5/4/51
The strength in the NYSE A/D continued as the DJI went into a trading range.
 --------------------------------------------------------------------------
9 11/28/1952 283.70 +2.9% 1.034 .774 186 13 .19 217 .47
DJI needed to retest point of breakout. Then rallied.
... Reversed at 292 on 12/30/52 by S8. Note that S9 signals
do stop rallies in late December unlike most sell signals.
---------------------------------------------------------------------------
10 9/8/1955 475.1 +3.4% 1.03 .68 100 37 .131 65 .328
After a dip to the lower band, and rally the buy signal was
reversed at 491.4 on 3/6/1956 by S12
Hit 487 and retreated 10% on President's heart attack news.
--------------------------------------------------------------------------
9 11/28/1952 283.70 +2.9% 1.034 .774 186 13 .19 217 .47
DJI needed to retest point of breakout. Then rallied.
... Reversed at 292 on 12/30/52 by S8. Note that S9 signals
do stop rallies in late December unlike most sell signals.
---------------------------------------------------------------------------
10 9/8/1955 475.1 +3.4% 1.03 .68 100 37 .131 65 .328
After a dip to the lower band, and rally the buy signal was
reversed at 491.4 on 3/6/1956 by S12
Hit 487 and retreated 10% on President's heart attack news.
 ----------------------------------------------------------------------------
11 3/9/1956 497.8 +2.5% 1.035 .66 165 49 .085 266 .207
It was a perfect flat topped breakout.
The immediate B10 rally was reversed at 491.4 on 4/10/1956 by S1
----------------------------------------------------------------------------
12 2/4/1958 458.7 +36.1% 1.026 .429 197 18 .101 296 .23
Bottom formation B10 but initially this was a false breaout
Breakout failed. Bottom formation was not complete.
There was no Sell and after a month a huge rally followed.
DJI declined to 436.90 and then rose.
Rally was Reversed on 4/17/49 at 624.1 by S9
----------------------------------------------------------------------------
13 11/16/1962 630.9 +11.2% 1.056 .864 115 32 .111 70 .142
Bottom formation B10. Rose immediately.
Rally reversed on 7/1/63 at 701.3 by S10
---------------------------------------------------------------------------
14 7/2/1964 841.5 +11.6% 1.026 .432 94 20 .042 51 .518
Breakout required a re-testing of rising 65-dma
Then steady advance, which was reversed at 938.9 on 5/13/1965 by S8
----------------------------------------------------------------------------
11 3/9/1956 497.8 +2.5% 1.035 .66 165 49 .085 266 .207
It was a perfect flat topped breakout.
The immediate B10 rally was reversed at 491.4 on 4/10/1956 by S1
----------------------------------------------------------------------------
12 2/4/1958 458.7 +36.1% 1.026 .429 197 18 .101 296 .23
Bottom formation B10 but initially this was a false breaout
Breakout failed. Bottom formation was not complete.
There was no Sell and after a month a huge rally followed.
DJI declined to 436.90 and then rose.
Rally was Reversed on 4/17/49 at 624.1 by S9
----------------------------------------------------------------------------
13 11/16/1962 630.9 +11.2% 1.056 .864 115 32 .111 70 .142
Bottom formation B10. Rose immediately.
Rally reversed on 7/1/63 at 701.3 by S10
---------------------------------------------------------------------------
14 7/2/1964 841.5 +11.6% 1.026 .432 94 20 .042 51 .518
Breakout required a re-testing of rising 65-dma
Then steady advance, which was reversed at 938.9 on 5/13/1965 by S8
 --------------------------------------------------------------------------
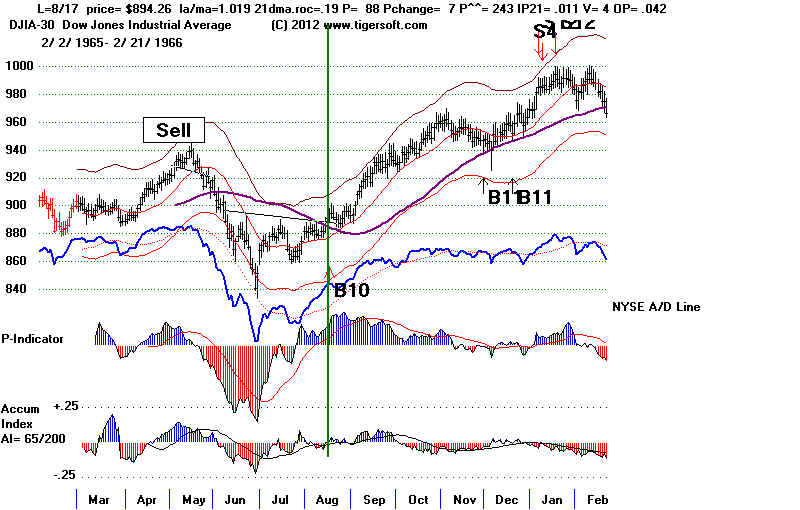
15 8/17/1965 891.1 +10.6% 1.017 .145 80 8 .011 20 .176 -.051
low
LOW turn around
This was a reversing Buy after an intermediate decline of 10%.
... Reversed at 985.41 on 1/10/66 by S4
--------------------------------------------------------------------------
15 8/17/1965 891.1 +10.6% 1.017 .145 80 8 .011 20 .176 -.051
low
LOW turn around
This was a reversing Buy after an intermediate decline of 10%.
... Reversed at 985.41 on 1/10/66 by S4
 --------------------------------------------------------------------------
16 1/13/1967 835.13 +4.0% 1.039 .273 135 21 .07 5 .221
Bottom formation B10. DJI rose immediately low
... Reversed at 968.49 on 3/16/67 by S12
---------------------------------------------------------------------------
17 9/30/1968 935.79 +4.5% 1.02 .565 119 8 .09 12 .564
DJI rose immediately ... Reversed at 977.69 on 12/5/68 by S1
---------------------------------------------------------------------------
18 12/3/1970 808.53 +15.9% 1.044 .623 143 -3 .06 0 .626
Bottom formation B10. DJI rose immediately LOW
... Reversed at 937.39 on 5/6/71 by S9
---------------------------------------------------------------------------
19 11/3/1972 984.12 +6.4% 1.039 .539 120 55 .083 1 .259
DJI rose immediately
... Reversed at 1047.49 on 1/5/73 by S9
---------------------------- ------------------------------------------------
20 10/5/1973 971.25 +1.6% 1.052 .908 251 1 .248 2 .388
DJI rose immediately
This B10 seemed arbitary because there was no breakout above
well-defined resistance.
... Reversed at 987.06 on 10/26/73 by S9
------------------------------------------------------------------------------
21 1/7/1976 898.69 +12.3% 1.054 1.124 286 35 .20 2 .536
DJI rose immediately ... Reversed at 1009.21 on 3/24/76 by S9
------------------------------------------------------------------------------
22 8/9/1984 1224.04 +0.2% 1.079 1.218 139 77 .135 15 .414
DJI rose immediately ... Reversed at 1225.93 on 10/19/76 by S1
-------------------------------------------------------------------------------
23 6/5/1985 1320.56 +2.6% 1.023 .673 234 11 .125 15 .456
DJI retreated back to edge of point of breaout at 1300
and then rose steadily.
...Reversed at 1354.73 on 10/14/85 by S9
-------------------------------------------------------------------------------
24 1/12/1989 2222.32 +24.7% 1.023 .454 118 21 .078 11 .185
DJI rose immediately
... Reversed at 2771.09 on 10/4/89 by S9
-------------------------------------------------------------------------------
25 1/31/1991 2736.39 +22.6% 1.058 .58 143 33 .116 12 .218
DJI rose immediately
... Reversed at 3353.76 on 4/15/92 by S9
-------------------------------------------------------------------------------
26 12/27/1991 3101.52 +6.8% 1.057 .755 117 18 .077 7 .289
DJI rose immediately
... Reversed at 3306.13 on 4/14/92 by S9
-------------------------------------------------------------------------------
27 5/26/1993 3540.16 +12.1% 1.022 .428 105 28 .138 15 .204
... Reversed at 3967.66 on 2/3/94 by S4
-------------------------------------------------------------------------------
28 9/14/1995 4801.8 +13.7% 1.032 .413 237 24 .08 14 .151
... Reversed at 5549.21 on 2/27/96 by S1
-------------------------------------------------------------------------------
29 9/13/1996 5838.52 +17.0% 1.024 .359 150 20 .116 13 .26
DJI rose immediately ... Reversed at 6833.59 on 4/22/97 by S9
-------------------------------------------------------------------------------
30 11/21/2005 10820.28 +7.0% 1.026 .685 227 -10 .108 108 .316
... Reversed at 11577.74 on 5/5/2006 by S9
------------------------------------------------------------------------------
31 8/18/2006 11381.47 +8.9% 1.019 .484 411 81 .08 22 .05
... Reversed at 12398.01 on 1/5/2007 by
==============================================================================
Number of trades = 31
Avg. Gain= +10.7%
---------------------------------------------------------------------------
32 3/23/2010 10888.83 -4.4% 1.031 .571 590 67 .166 90 .425||
DJI rose to 11205.03 on 4/26/2011 where mini-H/S appears.
DJI fell then fell to 9816.49. 9% paper loss.
It was closed out 6/16/2011 at 10409.46 for 4.4% loss.
----------------------------------------------------------------------------
33 11/4/2010 11434.84 +12.0% 1.029 .501 358 106 .112 4 .313
First dipped to 11052.49 before turning up. Gain = +12.0% on 5/2/2011 S9
----------------------------------------------------------------------------
34 1/18/2012 12578.95 +4.9% 1.023 .69 553 46 .125 95 .108
This reversed Sell. No paper loss. Gain - +4.9%, Sell S15 on 3/14/12
----------------------------------------------------------------------------
35 1/22/2013 13712.21 Open 1.026 .411 460 57 .263 12 .146
--------------------------------------------------------------------------
16 1/13/1967 835.13 +4.0% 1.039 .273 135 21 .07 5 .221
Bottom formation B10. DJI rose immediately low
... Reversed at 968.49 on 3/16/67 by S12
---------------------------------------------------------------------------
17 9/30/1968 935.79 +4.5% 1.02 .565 119 8 .09 12 .564
DJI rose immediately ... Reversed at 977.69 on 12/5/68 by S1
---------------------------------------------------------------------------
18 12/3/1970 808.53 +15.9% 1.044 .623 143 -3 .06 0 .626
Bottom formation B10. DJI rose immediately LOW
... Reversed at 937.39 on 5/6/71 by S9
---------------------------------------------------------------------------
19 11/3/1972 984.12 +6.4% 1.039 .539 120 55 .083 1 .259
DJI rose immediately
... Reversed at 1047.49 on 1/5/73 by S9
---------------------------- ------------------------------------------------
20 10/5/1973 971.25 +1.6% 1.052 .908 251 1 .248 2 .388
DJI rose immediately
This B10 seemed arbitary because there was no breakout above
well-defined resistance.
... Reversed at 987.06 on 10/26/73 by S9
------------------------------------------------------------------------------
21 1/7/1976 898.69 +12.3% 1.054 1.124 286 35 .20 2 .536
DJI rose immediately ... Reversed at 1009.21 on 3/24/76 by S9
------------------------------------------------------------------------------
22 8/9/1984 1224.04 +0.2% 1.079 1.218 139 77 .135 15 .414
DJI rose immediately ... Reversed at 1225.93 on 10/19/76 by S1
-------------------------------------------------------------------------------
23 6/5/1985 1320.56 +2.6% 1.023 .673 234 11 .125 15 .456
DJI retreated back to edge of point of breaout at 1300
and then rose steadily.
...Reversed at 1354.73 on 10/14/85 by S9
-------------------------------------------------------------------------------
24 1/12/1989 2222.32 +24.7% 1.023 .454 118 21 .078 11 .185
DJI rose immediately
... Reversed at 2771.09 on 10/4/89 by S9
-------------------------------------------------------------------------------
25 1/31/1991 2736.39 +22.6% 1.058 .58 143 33 .116 12 .218
DJI rose immediately
... Reversed at 3353.76 on 4/15/92 by S9
-------------------------------------------------------------------------------
26 12/27/1991 3101.52 +6.8% 1.057 .755 117 18 .077 7 .289
DJI rose immediately
... Reversed at 3306.13 on 4/14/92 by S9
-------------------------------------------------------------------------------
27 5/26/1993 3540.16 +12.1% 1.022 .428 105 28 .138 15 .204
... Reversed at 3967.66 on 2/3/94 by S4
-------------------------------------------------------------------------------
28 9/14/1995 4801.8 +13.7% 1.032 .413 237 24 .08 14 .151
... Reversed at 5549.21 on 2/27/96 by S1
-------------------------------------------------------------------------------
29 9/13/1996 5838.52 +17.0% 1.024 .359 150 20 .116 13 .26
DJI rose immediately ... Reversed at 6833.59 on 4/22/97 by S9
-------------------------------------------------------------------------------
30 11/21/2005 10820.28 +7.0% 1.026 .685 227 -10 .108 108 .316
... Reversed at 11577.74 on 5/5/2006 by S9
------------------------------------------------------------------------------
31 8/18/2006 11381.47 +8.9% 1.019 .484 411 81 .08 22 .05
... Reversed at 12398.01 on 1/5/2007 by
==============================================================================
Number of trades = 31
Avg. Gain= +10.7%
---------------------------------------------------------------------------
32 3/23/2010 10888.83 -4.4% 1.031 .571 590 67 .166 90 .425||
DJI rose to 11205.03 on 4/26/2011 where mini-H/S appears.
DJI fell then fell to 9816.49. 9% paper loss.
It was closed out 6/16/2011 at 10409.46 for 4.4% loss.
----------------------------------------------------------------------------
33 11/4/2010 11434.84 +12.0% 1.029 .501 358 106 .112 4 .313
First dipped to 11052.49 before turning up. Gain = +12.0% on 5/2/2011 S9
----------------------------------------------------------------------------
34 1/18/2012 12578.95 +4.9% 1.023 .69 553 46 .125 95 .108
This reversed Sell. No paper loss. Gain - +4.9%, Sell S15 on 3/14/12
----------------------------------------------------------------------------
35 1/22/2013 13712.21 Open 1.026 .411 460 57 .263 12 .146