TIgerSoft/Peerless HOTLINE
(C) 2016 William Schmidt, Ph.D.
www.tigersoft.com
william_schmidt@hotmail.com
---------------------- IMPORTANT
---------------------------------
This HOTLINE has changed its address
tonight.
An email was sent to all subscribers. But a few were returned.
Let me know if you did not get your email. Renewals are $400/year
of $235 for 6 months by CC.
-----------------------------------------------------------------------------------------------------------------
HELP
A
Guide To Profitably Using The Tiger Nightly HOTLINE
Introduction
to Tiger/Peerless Buys and Sells.
Peerless
Buy and Sell Signals: 1928-2016
Individual Peerless signals explained:
http://tigersoftware.com/PeerlessStudies/Signals-Res/index.htm
http://www.tigersoft.com/PeerInst-2012-2013/
Explanation of each Peerless signal.
http://www.tigersoft.com/PeerInst-2012-2013/
Different
Types of TigerSoft/Peerless CHARTS, Signals and Indicators
Peerless Signals and DJI
Charts - version 7/4/2013
1965
1965-6 1966
1966-7
1967
1967-8
1968
1968-9
1969
1969-70 1970
1970-1
1971
1971-2 1972
1972-3
1973 1973-4
1974
1974-5 1975
1975-6
1976 1976-7
1977
1977-1978
1978
1978-79
1979
1979-80
1980
1980-1
1981
1981-2
1982
1982-1983
1983 1983-1984
1984
1984-1985
1985
1985-1986
1986
1986-1987
1987
1987-8
1988
1988-9 1989
1989-90
1990
1990-1 1991
1991-2
1992
1992-3
1993
1993-4
1994
1994-5
1995
1995-1996 1996
1996-7
1997
1997-8 1998
1998-1999
1999
1999-2000
2000
2000-1 2001
2001-2
2002
2002-3
2003
2003-4
2004
2004-5
2005 2005-6
2006
2006-7
2007
2007-8
2008
2008-9
2009
2009-10
2010
2010-11
2011
2011-12
2012
2012-2013
Documentation for
TigerSoft Automatic and Optimized Signals.
How reliable
support is the DJI's rising 200-day ma?
SPY
Charts since 1994: Advisory Closing Power S7s, Accum. Index, 65-dma, Optimized
Signals.
1/19/2016
--->
Corrections,Deeper Declines and Bear Markets since 1945.
1/21/2016
--->
High Velocity Declines since 1929
2/12/2016 --->
Presidential Elections Years and Bullish IP21 Positive Non-Confirmations at
Lower Band.
2/12/2016 --->
OBV NNCs on
DJI's Rally to 2.7% Upper Band when DJI's 65-dma is falling.
Earlier
Q-Answers
New
QuickSilver Documentation
(1/11/2016)
Our Different Signals
Better
understand the difference between Peerless DJI-based signals,
the one-year optimized red Signals and
the fixed signals based
on technical developments.
Introduction to
Tiger/Peerless Buys and Sells.
Different Types of TigerSoft/Peerless CHARTS, Signals and Indicators
----------------------------------------------------------------------------------------------------------------
Important. You are at
www.tigersoft.com/55HL55/INDEX.html
This is new address for Nightly Tiger/Peerless Hotline.
===================================================================================
Hotline and Links -
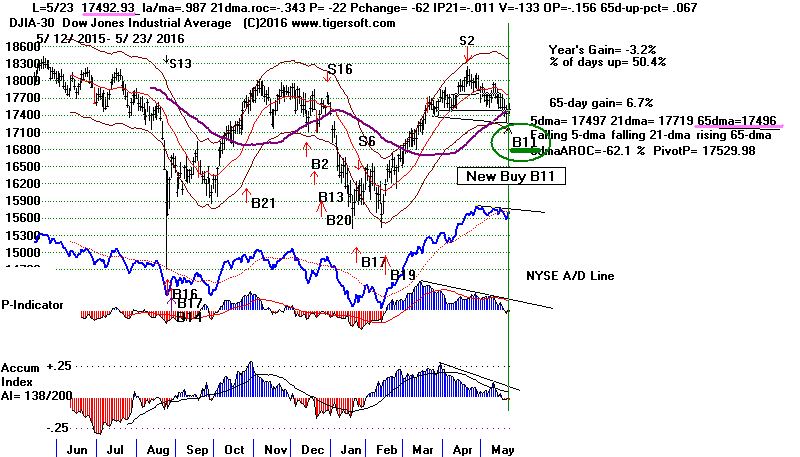
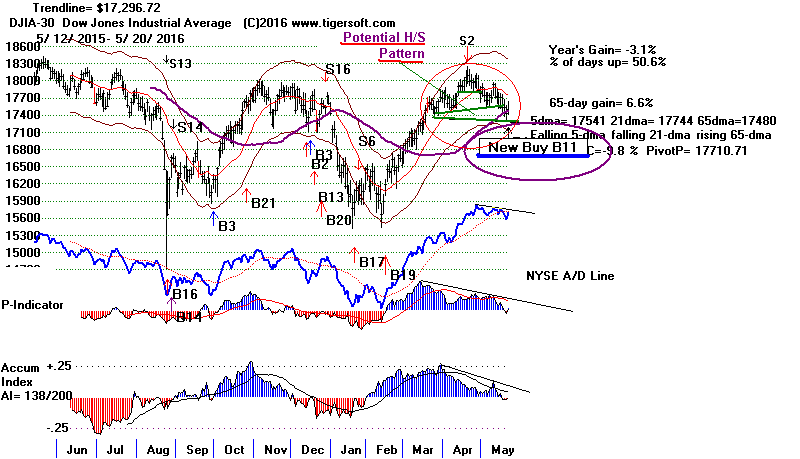
5-23-2016 The DJI could not stay above its 65-dma today.
See in the
Peerless chart below see that its closed 2 points below that ma
today. Again tomorrow, I would have to go with the Buy B11
provided the DJI can get back above the 65-dma. Keep in mind that
Seasonality is bullish in the week before Memorial Day
(next Monday), so there is a good chance we will be able to
act profitably on the Buy B11 that was shown on Friday's close.
Traders, notice that the DJI will need to close 38 points above
today's close to bullishly turn up its short-term 5-day ma.
Modest Risk Now.
Look back at the charts of the past Buy B11s.
http://www.tigersoft.com/PeerInst-2012-2013/-b11.htm
There are 7 cases where the paper losses were between
1.5% and 3%, This accords with the 44% historical probability
of the DJI dropping below a head/shoulders' neckline after
a Buy B11. So, there is still a 35% to 44% chance of an additional
2% decline.
Modest Gain Potential
When we look back at the Buy B11s from mid-April to the
end of June, we do see that the gains were modest. So, again
I would expect only a limited rally, probably back above 18000
but not above 18300.
Buy B11s from Mid-April to End of June.
Gain
5/8/1959 .046
5/16/1986 .058
4/23/1993 .025
4/17/2006 .046
----------------------
Avg = 4.4%
Charts: Peerless DJIA Hourly DJIA DIA SPY QQQ IWM
DJI-Utilities DJI-Rails A/D Line-6000 Stocks
Crude Oil SOXL TECL
Major Indexes and A/D Lines.
Key Tiger Software ETF Charts
Bullish MAXCPs
Bearish MINCPs
QUICKSilver
Some Stock Ideas
Using New "TigerSmart" Optimized Red Buys
(work in progress)
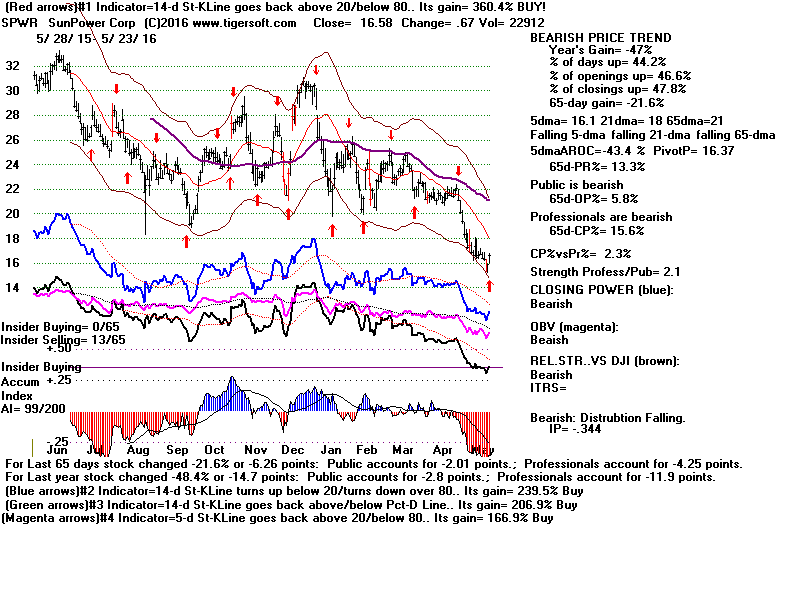
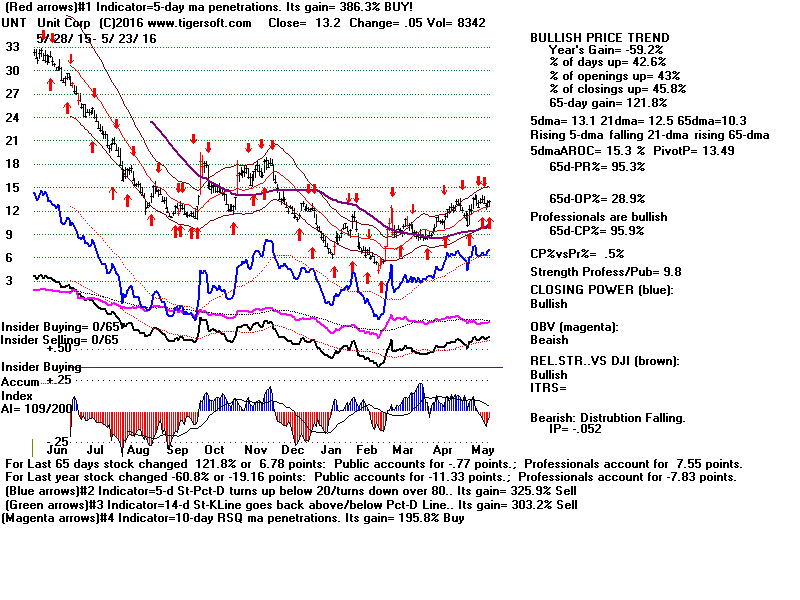
So how might we play a brief rally now? The
Bullish MAXCPs
are one way. Buying the highest AI/200 stock in the DJI-30, CAT
would be another. A third way, I'd like to suggest here, would be
be to buy the stocks giving new optimized Red Buys where the
trading system would have gained more than 150% for the last
year. In the next few days I will do a follow-up of these. There
are 11 shown below.
 |
 |
============================================================================
5-20-2016 Cover short in DIA
and take a long position in it
provided
the DJI can stay above its 65-dma
tomorrow. If it cannot do this, we will have to watch to
see if it can get back above its 65-dma on Tuesday
and act then.
Friday
brought a reversing Buy B11. This
May B11
has problems and limitations. As for the upside potential,
it seems
unlikely that we will see much more than a nominal new
high above 18300. This is because Buy B11s in May and
June get gains only about half the size of the 10% gains
that the signal typically brings.
It is important to appreciate also that the B11 gains are much
smaller in a Presidential Election when the US is not in a world war.
The three of these gained less than 2% on average.
And there is risk, when a head/shoulders pattern is present, since
the DJI breaks below the neckline (here about 17400) 44% of the time.
This alone should probably get us to wait another day.
But I think we do want to reverse positions on DIA if the
DJI can stay above its 65-dma. There are bullish forces at
work now. First, we do see support
coming in on each decline
below 17500. Secondly, we can guess that
the FED will be
most reluctant to raise interest rates if the May Jobs
Report
is as week as April's.
Thirdly, there ought to be a
bit of a
recovery before Memorial Day. The DJI has advanced
58% of the time over the next week since 1965. The average
DJI gain is 0.8% over the next two weeks. And fourthly, the
Hourly DJI's OBV-Line did not confirm the
recent drop to 17440.
Note the new Buy B11 on Friday. This
occurred because the DJI closed back
above its 65-dma.
===========================================================================
5-19-2016 Stay short DIA.
There was no Buy B11 signal today because
the DJI closed below its 65-dma by too great a margin. The
presence of bearish head/shoulders patterns in the
DJI and
SP-500 make this market look different from
the one other
case where there was a Buy B11 in May, that was in
1986
when DJI was running upwards and making a string of all-time
highs.
Charts: Peerless DJIA Hourly DJIA DIA SPY QQQ IWM
DJI-Utilities DJI-Rails A/D Line-6000 Stocks
Crude Oil SOXL TECL
Major Indexes and A/D Lines.
Key Tiger Software ETF Charts
Bullish MAXCPs
Bearish MINCPs
QUICKSilver

The Market Is Being Held Hostage by the FED.
. When Fiscal Policy Is Frozen in Political Stalemate,
This Is What We Get!
A weak rally from here may still occur. There may be a
bounce back to DJI-18000 if the the FED does not raise rates in June.
For one thing, because it is a Presidential Election Year, I think
we can expect the FED to be reluctant to raise interest rates. For
another, the April Jobs' numbers showed economic growth was
weakening. To the extent, that Yellen, as a Democrat, chooses
to use her influence, she can say the "consensus" of the next
FOMC meeting is whatever she chooses. Only if she is outvoted,
will rates go up.
So perhaps, the DJI will try to rally again to 18000 from where
it sits now, close to its 65-dma. For us, without a Buy signal from
Peerless, any rally would seem to be limited. And with the
head/shoulders pattern present, there may be other bearish
news which could snag the market.
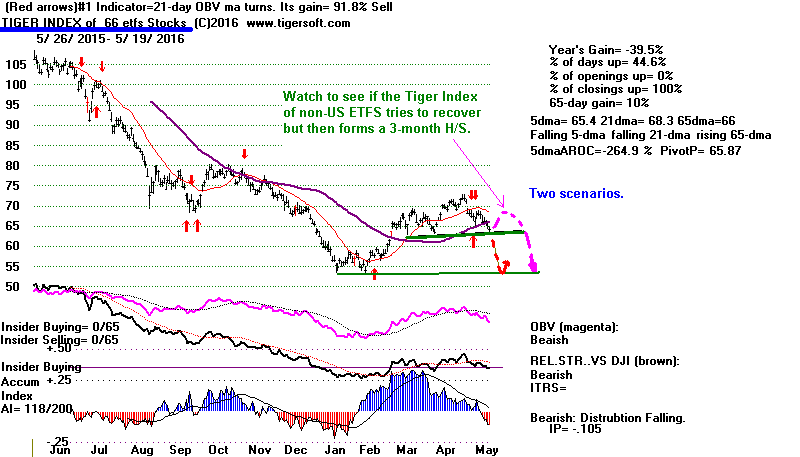
Overseas' Weakness Again
As it is now, overseas' markets are all significantly below their
65-dma. This calls into question whether their turnarounds can
continue. If they do not soon recover, we could be right back in
a deflationary world economy. How long can the US hold
world's economy up then.
Populism is against any more free-trade deals in this country.
What if the terrible "T" word is used, namely tariffs. If Trump
or Sanders create a populist demand for tariffs, the actual passage
of such tariffs could tip the already fragile World Economy into
a Depression. Many economists blame the 1930 Smoot Hawley
Tariff for causing the 1930s' world-wide Depression.
Let's watch the charts of all foreign ETFs,
in Europe, in the
Developing World, in
Latin America and in
China.
==========================================================================
5-18-2016 Stay short DIA.
Sell any longs if they break their steep
Closing Power uptrends. Every recent rally has failed.
Professionals in New York must be getting tired of seeing
their efforts to support the market be quickly eclipsed
by weak openings the next day. This is because
Asian, European
and Emerging Markets seem to have ended their
recovery.
;
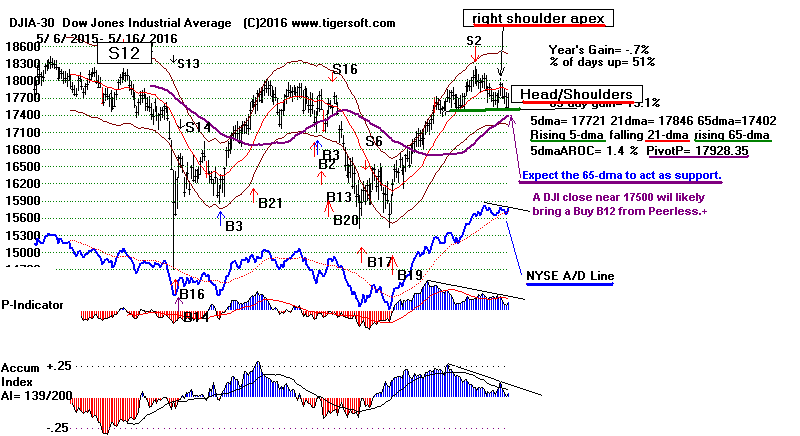
The Head/Shoulders patterns in the DJIA/DIA
and SP500/SPY
are classic. They are flat and they are symmetrical. A clear
violation of its neckline will occur on a closing below 17400.
Such a decline would also break the DJI's 65-dma. The minimal
DJI downside objective would then be 16900-17000.
When the 65-dma is also broken simultaneously,
these Head/Shoulders patterns are quite reliable. I show
hundreds of these patterns in my Short Selling book.
Their reliability is about 80% with stocks in all markets.
What is striking now is how many of the Tiger Indexes
of various sectors also show head/shoulders patterns.
The history of the DJI since 1888 shows at least a hundred
such top patterns. Maybe, maybe, there are ten failures, i.e.
where prices fail to fulfill their minimum downside price
objective. (See the links I posted last night to see many
of these H/S patterns on the DJI.)
See DJIA,
DJI-20, DJI-30,
Commodities,
Foreign ETFs,
Housing,
Industrial Materials,
Natural Gas,
Russell-1000,
Software and
SP-500
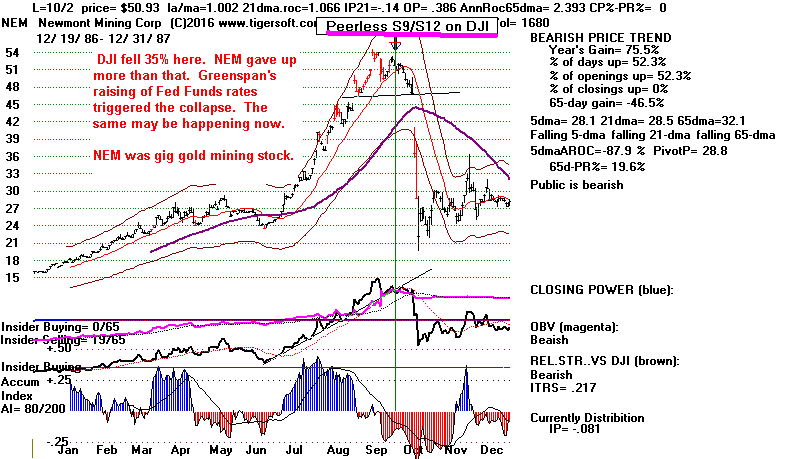
The 1987 Lessons of Gold
#1 Gold Big 4-Month Rally Warns of A Big Decline in DJI.
#2 Gold's New Warning: A Big Drop Today. See NEM below
how its collapse in October 1987 coincided with the
DJI's 33% sell-off.
#3 Do Not Look to Gold To Be A Safe Haven.
1987 Peak in Gold and Subsequent Crash
Today, the leveraged Gold ETFs, NUGT and
JNUG fell
more than 25%! This reminds me how NEM collapsed
in 1987 just before the Crash then. It had risen sharply
beforehand. But only when it, too, began a big sell-off
did the general market go over its cliff in October. Not
only that, this case suggests that Gold
and Silver will
not be a haven in the coming decline.

Charts: Peerless DJIA Hourly DJIA DIA SPY QQQ IWM
DJI-Utilities DJI-Rails A/D Line-6000 Stocks
Crude Oil SOXL TECL
Major Indexes and A/D Lines.
Key Tiger Software ETF Charts
Bullish MAXCPs
Bearish MINCPs
QUICKSilver
“I have seen the future and it doesn't work.”
Zardoz (1971)
I get the feeling that Hillary, Obama, the FED
and the market are all slow-walking toward the
cusp of an avoidable economic debacle. The Federal
Reserve's Helicopter is not taking off again. The
dropping of a trillion dollars into the hands of
Big Banks has run its course. It is not at all clear what can
hold the market up now?
Fed Is Seriously Considering Raising Interest Rates
in June, Meeting Minutes Say
By NY Times - BINYAMIN APPELBAUM
"The central bank sent an unusually frank message to Wall Street,
delivered
in the official account of the Fed's April meeting. "

The most recent FED minutes makes it seem that they are
no longer able to resist the pressures to raise interest-rates in June,
even though the US economy's growth is stalled at 1%/year
and does not match even the growth of population, much less
meet the needs of millions not working full time. And
now we have a tightening monetary policy?!
Where is the leadership? Federal budgets barely get passed.
There is fiscal paralysis. For years, it seems, the Republican
Congress continues to want to delay the starting of a
much needed, massive Public Works program. They
pay no political price for that. The President, a Milton Friedman
follower from Chicago and monetarist, acts like he is too
tired and too disinterested to have another spat with Congress
over such a program, something that is probably our last hope
to spark a real economic recovery.
Sanders does not help much. He is totally preoccupied
tilting, Don Quixote-like, with the Windmills of the
Democratic establishment. He has no chance to become
President but every campaign speech he makes attacking
Hillary's admittedly very poor judgment and close ties with
Wall Street only gives new strength to Donald Trump, the
insecure, egocentric wild-man pretend-Populist.
So, I expect Trump to become the next President. The risks
from that seem enormous and obvious. The kindest thing I can
think to say is that no one has a clue what a Trump administration
will do as President. Those who run money and own big stock
positions have every right to be perplexed and alarmed if the FED
unplugs the leaking dam walls in June. (Maybe, they'll
reconsider).
The Head/Shoulders Patterns tell us something not yet apparent
or visible is approaching the market and getting ready to clobber
stocks. This could be the catalyst for a steep decline. Once
the market starts melting down, new Hellicopter runs may
not matter. Who will want to borrow money to buy stocks
when the big dam breaks apart. Instead, they may just use the
money to buy leveraged short-ETFs.
===========================================================================
5-17-2016 Stay short
DIA, Peerless did not issue a reversing
automatic Buy signal today even though the DJI closed 1.6%
below the 21-day ma and the P-Indicator remains positive at +98
and the current Accum. Index (IP21) is only slightly negative
at -.012.
Charts: Peerless DJIA Hourly DJIA DIA SPY QQQ IWM
DJI-Utilities DJI-Rails A/D Line-6000 Stocks
Crude Oil SOXL TECL
Major Indexes and A/D Lines.
Key Tiger Software ETF Charts
Bullish MAXCPs
Bearish MINCPs
QUICKSilver
Tomorrow - Possibly a Buy,
But Possibly A Judged Sell, too
If Both Occur, They Cancel
out Each Other.
If breadth is no worse than today, it will only take a small
additional decline to bring a Peerless Buy provided the
DJI closes not much below its 65-dma now at 16427.
However, note that a deeper decline or one on worse breadth
than today will most likely not bring a Peerless Buy signal.
We also have to be concerned about getting either a Tiger S5,
a Peerless S10 or a judged S10 if the DJI closes decisively
below the H/S neckline drawn roughly through the DJI's
recent hypothetical lows, 17440.
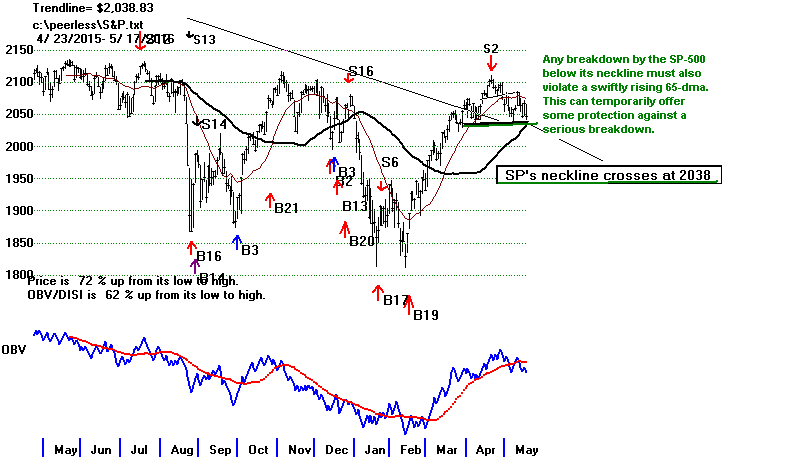
The H/S patterns we see now in the DJIA,
SP-500 and OEX
as well as the Tiger Indexes of DJI,
SP-500 are nearly perfectly
symmetrical, flat and very easy for all chartists to spot. Their
notoriety is thus enhanced and their bearishness thus becomes
more self-fulfilling.
With head/shoulders patterns, we often only later learn
why they are formed, i.e. what events like invasions,
missile crises, assassinations, terrorist attacks, new economic
policies lie behind them, But because Gold stocks are rising
very steeply, I believe that they are screaming a message
of caution for the general market. So, stay short
DIA for
now.
A
Judged
S10 Would Still Be Bearish.
Because these recent DJI lows set up a neckline in a head/shoulders
pattern that is less than 40 trading days long, we may have to
judge a Sell S10 if the DJI closes clearly below 17444.
That there have been no fewer than 7 reversals back up from
the neckline-support zone of 17444 to 17530, makes any decisive
breakdown more dangerous. These tests of lows here go back
33 trading days.
H/S
Pattern's
neckline lows:
4/1/2016 17515
4/7/2016 17444
5/4/2016 17530
5/6/2016 17519
5/13/2016 17500
5/17/2016 17450
| |
More Reading
about Sell S10s: Both Automatic and Judged.
www.tigersoft.com/judgedS10/index.html
Judged S10 Rules The results
from Peerless using automatic signals are
excellent. But they can be improved if one uses a
judged S10. The judged Sell S10 ...
www.tigersoft.com/HLZA15/
Oct 3, 2015 -
9/30/2015 The operative Peerless signal
is still the Sell S14. A DJI close below the
well-tested, flat support at 17000 would bes considered
a judged Sell S10.
|
|
==========================================================================
5-16-2016 We still have an operative Sell S2 to
guide us. Stay
short DIA.
In Presidential Election years this signal has averaged about
a 7.2% decline in the DJI. To reach this, the DJI will need
to close near 16800. Given the positive breadth, blue
Accumulation and the rising 65-dma, such a target seems
unlikely to be reached even given the DJI's head and shoulder
pattern.
We could cover our short in DIA if the DJI drops back towards
that 17500 neckline-support. But, I would just trust that the Peerless
system will tell us when it is time to buy back DIA and
go long. This is still a very defensive market. If that
changes and volume rises more on an advance, we can
then reconsider waiting for Peerless to tell us to buy
again. But right now, let's wait to cover. Buying at the
end of May often works out better.
This may all be mooted since a close near 17450 will likely bring
an automatic Buy B12, which is based on buying when
the DJI closes at a rising 65-dma that has not been
violated for 10 weeks or so.

Trading Range Peerless Sell S2s
in A Presidential Election Year, since 1928| PE = Presidential Gain if DJI Sold Short
Election Year and this position was
closed on next Peerless Buy.
=========================================================================
19480615 PE S2 193.2 .05 perfect
19481022 PE S2 189.8 .061 perfect
19560409 PE S2 518.5 .079 perfect
19560802 PE S2 521 .075 perfect
20000425  PE  S2             11124.82      .049    perfect
20000906  PE  S2             11310.64      .095    perfect
20001030  PE  S2             10835.77      .060    Very small Paper Loss

20040902  PE  S2             10290.28      .038    Very small Paper Loss
-------------------------------------------------------------------------
                                           Avg = 7.2%


                                       Charts:   Peerless DJIA  Hourly DJIA  DIA  SPY  QQQ  IWM

                                                 DJI-Utilities   DJI-Rails   A/D Line-6000 Stocks


                                                 Crude Oil  SOXL  TECL

                                                 Major Indexes and A/D Lines.

                                                 Key Tiger Software ETF Charts

                                                 Bullish MAXCPs   Bearish MINCPs

                                         QUICKSilver

                                       Warren Buffet bet $1.1 Billion on Apples's stock
                                       in the first quarter.  He is not prone to make bad investment
                                       decisions.  He has friends on the FED.  They must have
                                       told him that they would not be raising rates.  But now
                                       he is down about 17% on that investment already.  Was his
                                       timing just bad?  Perhaps, tech stocks are just out of favor
                                       temporarily and this announcement will be the catalyst that
                                       they need.

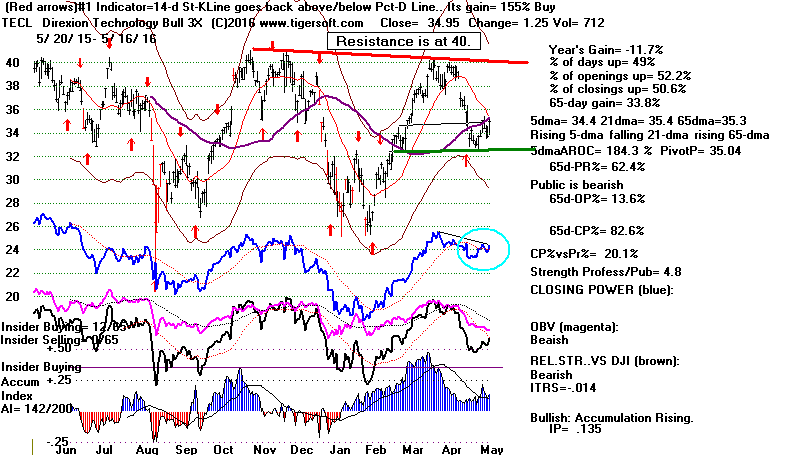
                                       Let's keep an eye on AAPL and TECL, the leveraged
                                       ETF for techs.  Specifically, we will need to see
                                       their Closing Power downtrends be violated with
                                       them above their 65-dma.  Until that happens, I
                                       would assume the risks are judged by Professionals
                                       here to be greater than the potential rewards.

                   AAPL           To be a false breakdown, AAPL will need to stay
                                        above its support-line shown below for a week.
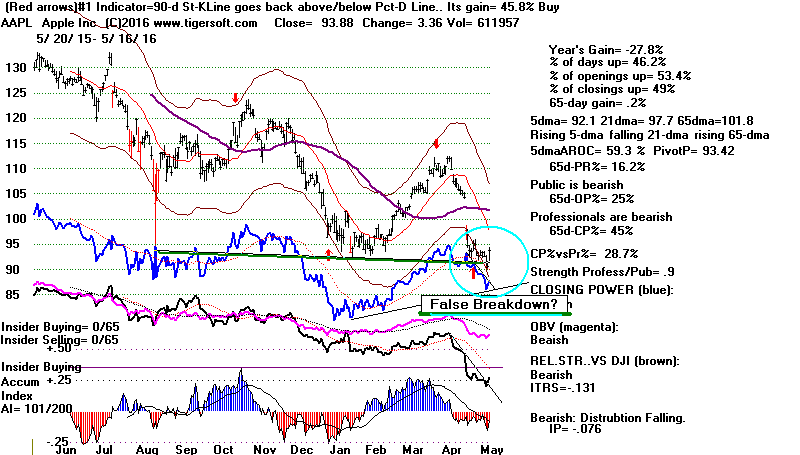 TECL looks ready to challenge 40 again if its Closing Power can
break its downtrend and it can close back above its rising 65-dma.
A strong day tomorrow would do that.
 ==========================================================================
5-13-2016 The Sell S2 still operates. Stay short DIA. We must
now wait to see if the DJIA, DIA, SPY, QQQ and IWM
can find the necessary support just below where each closed
on Friday, at the necklines of their head/shoulders patterns.
Another brief rally is likely this week. The rally would not
void the emerging head/shoulders and probably would quickly
fail. Commonly, head/shoulders patterns' right shoulders last
as long to form as the left shoulders took.
DJI's Bearish Head/Shoulders
must be scaring technically minded traders.
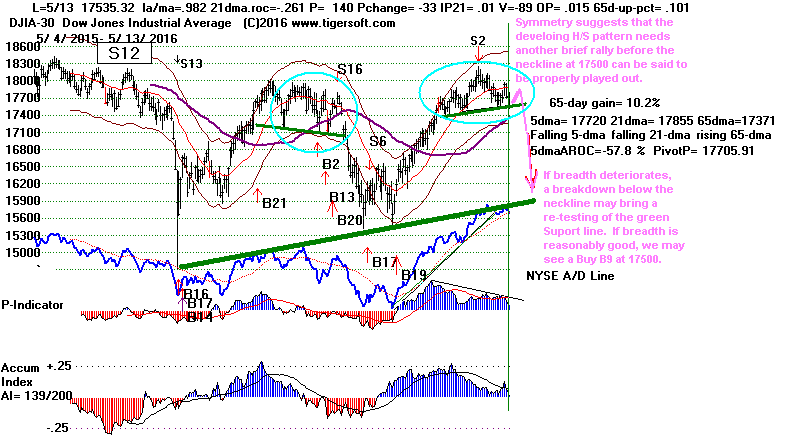

To get much a rally, we will need to see much more Blue
upside volume. See above the 10-day ma of Up and Down
Volume.
Charts: Peerless DJIA Hourly DJIA DIA SPY QQQ IWM
DJI-Utilities DJI-Rails A/D Line-6000 Stocks
Crude Oil SOXL TECL
Major Indexes and A/D Lines.
Key Tiger Software ETF Charts
Bullish MAXCPs Bearish MINCPs
QUICKSilver
In broad trading ranges, bids usually disappear in their middle.
We are in a broad trading range now with resistance at
18000 as resistance and 16000 as support. So, there is a
risk here that the market will drop sharply if the 65-dma
at 17250 is broken. Neither the Republican or likely
Democrat candidate for President generate a lot of public
trust or confidence.
But interest rates are likely to remain low, Mays tend to
bring shallow declines and Peerless will likely give a Buy B9
if the DJI closes more than 3% below the 21-day ma since
the P-Indicator is positive. It may also give a Buy B11 if
its closes near and above its 65-dma or produce a simple
Buy B2 around 17450.
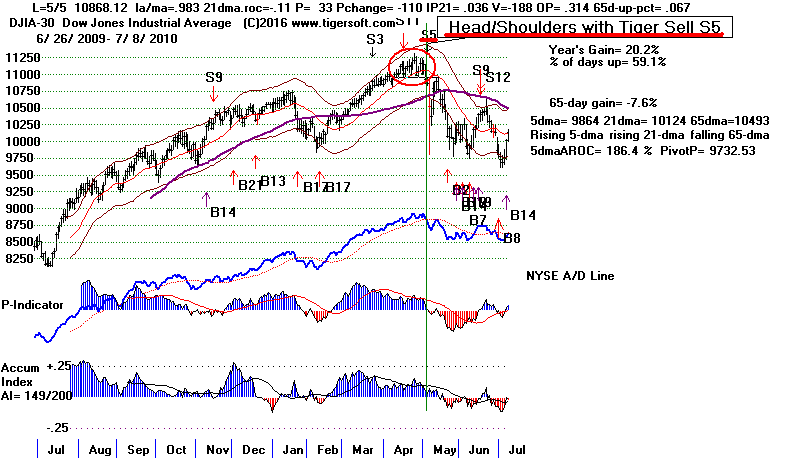
A bigger drop with very bad breadth and high volume would
have to be judged a head/shoulders Sell S10/S5, as in May
2010, thereby nullifying any Buy signals on the breakdown,
See how completed H/S pattern on May 5th, 2010
brought a mini-selling panic. A Tiger S5 can be placed
on the screen here. In our situation, a completed H/S
should probably be allowed to play out and reach
its downside objective, the height of the pattern extended
downward from the neckline at 17500.
Watch The 4-Horsemen
Our "four horsemen" of a possible world-wide Deflationary
spiral are holding up. That's good news for bulls.
Only China as measured by YINN, the
3x-leveraged ETF,
has broken down below its 65-dma.
Our Commodities Index, Crude Oil and Foreign ETFs' Index
are still above it. (YINN represents the performance of the FTSE
China 50 Index).
I believe it is very important that these four
investment vehicles do not all drop below their 65-dma. If they
do it will be a warning sign that low interest rates cannot prop
the worlds' markets up outside of the US. If all these start
falling at once, we may find ourselves in a worse situation
than we were in for much of last year because the pressures
to raise rates will be greater. The Fed has bought $4 trillion in
f bonds and mortgages from banks. Only bad things will happen
to the market if it sells them and starts to tighten up its Open Market
monetary actions.
( https://www.aei.org/publication/since-2009-feds-qe-purchases-transferred-almost-half-trillion-dollars-treasury-isnt-gigantic-wealth-transfer/ )
=================================================================
5-12-2016 The Peerless Sell S2 is bringing
along a number of
bearish-looking head and shoulders' tops to back it up.
The DJI's top may take another week to fully develop
so that the right shoulder's size and length match
the left shoulder's. We remain short DIA.
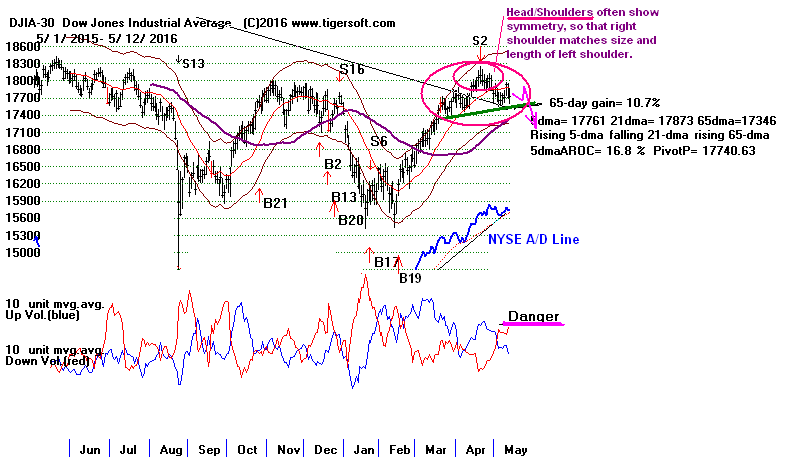
Watch to see if the following head/shoulders' necklines
are violated.
5/12 Close Neckline
DIA 177.42
175 (DJI-30)
ERX 27.72
25.37 (Energy)
IWM 110.37
109.1 (Russell-2000)
NVDA 35.59
34.51 (stock Nividia)
OEX 915.96
905.25 (SP-100)
OIH 27.32
26.4 (Oil)
QQQ 105.89
104.54 (NASD-100)
SLV 16.82
16.10 (Silver)
SPY 206.56
204 (SP-500)
Trouble seems to be looming. Today AAPL broke to a
new 12-month low. China's YINN has
fallen 8 of the
last 10 days. The DJI's 10-day ma of Down Volume
remains above Up Volume. This is what happened
last year before large DJI declines.
Can low interest rates continue to boost enough defensive
stocks to hold the market up? How much more heavy
lifting can AMZN and FB do? Their respective PEs are
296:1 and 93:1. Professionals are starting to have doubts.
The Closing Power uptrends for DIA and SPY
could
soon be broken. They have already been bearishly violated
for QQQ and IWM
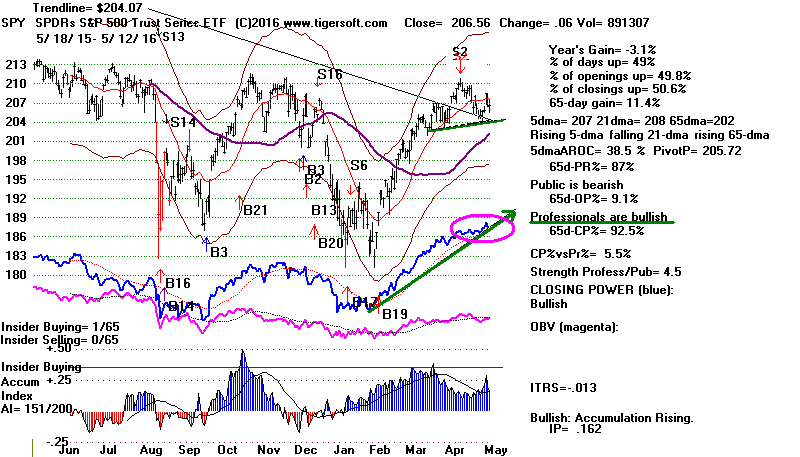
Since 1965, the DJI has risen only 40% of the time over
the next week. Most likely, we will see the DJI penetrate
is neckline support. But given the good breadth and
how positive the P-Indicator is, we will probably be
get a Buy B9 soon afterward. So, stay short DIA but
hold the defensive ETFs and stocks suggested here
as long as their Closing Powers are rising.
Charts: Peerless DJIA Hourly DJIA DIA SPY QQQ IWM
DJI-Utilities DJI-Rails A/D Line-6000 Stocks
Crude Oil SOXL TECL
Major Indexes and A/D Lines.
Key Tiger Software ETF Charts
Bullish MAXCPs Bearish MINCPs
QUICKSilver
==========================================================================
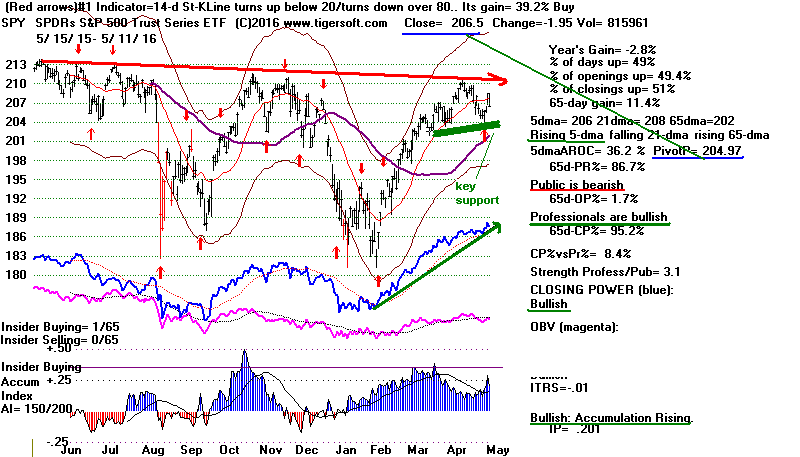
5-11-2016 Sell S2. What the bulls
feared, today has transpired:
the head/shoulders' patterns in the DJI and SP-500 are
taking clearer shape. If completed, look for the DJI
to fall to 17000.
Last night I wrote that "we may have just seen the rally
to right shoulder's apex in the SP-500 and DJIA.
In that case, the next few trading days may become
the right shoulder in head/shoulders patterns for the
DJI and SP-500."
The chief hope for the Bulls rests now on NY Professionals
and their continued buying of enough dividend-paying and
defensive stocks in DIA and SPY to keep these ETFs' Closing
Powers rising. Speculative stocks in the NASDAQ are
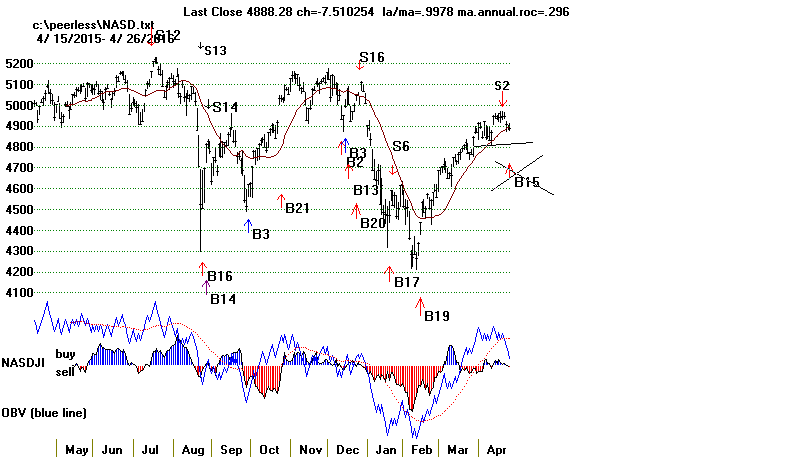
being avoided. See how Tiger's NASDAQ's
"NASDJI" indicator
remains quite negative.
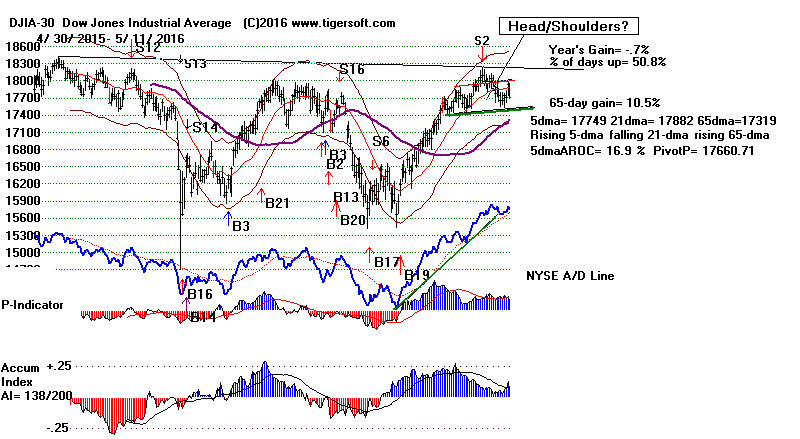
Let's Watch 10-day ma of NYSE Up and Down Volume.
The problem for the Bulls is that Down-day volume
is growing.
If this continues another week, our Red 10-day ma of Down-
Volume will be dominating our Blue 10-day ma of Up-Volume
for about two weeks. In this, it would then start to resemble
the DJI's chart last year before two big sell-offs.

Charts: Peerless
DJIA
Hourly DJIA
DIA SPY
QQQ
IWM
DJI-Utilities
DJI-Rails
A/D Line-6000 Stocks
Crude Oil
SOXL
TECL
Major Indexes and A/D Lines.
Key Tiger Software ETF Charts
Bullish
MAXCPs Bearish MINCPs
QUICKSilver
The good news is that the DJI's neckline at 17500 has not been
violated and breadth remains quite positive, showing that
the many dividend-paying stocks and bond funds on the
NYSE are holding up because the outlook for interest rates
staying unchanged is still very good.
Stay short DIA and hold your long positions
provided that their
rising Closing Powers are not violated.
============================================================================
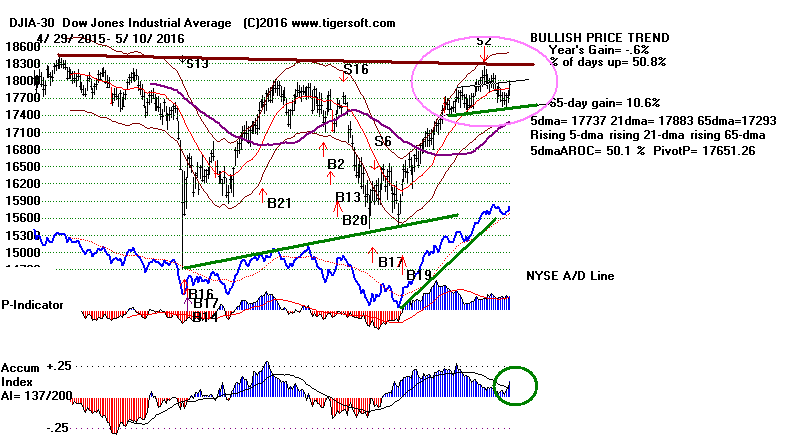
5-10-2016
Today brought the expected rally towards 18000 on
the DJIA. Professionals were proven correct and
overseas' sellers wrong. The Pros on Wall Street are
usually proven right when the Opening Power goes in a
different direction.
It's also been hard to find very many good short sales among
the
Bearish MINCPs .
Our Stocks' Hotline remains long about
twice as many
Bullish
MAXCPs
as we are short among
Bearish MINCPs.
Here I've suggested hedging the short on DIA with longs
among the strongest military stocks, REITs and defensives.
Until the SPY and
DIA show Closing power weakness enough
to break their uptrends, this hedging will probably be continued here.
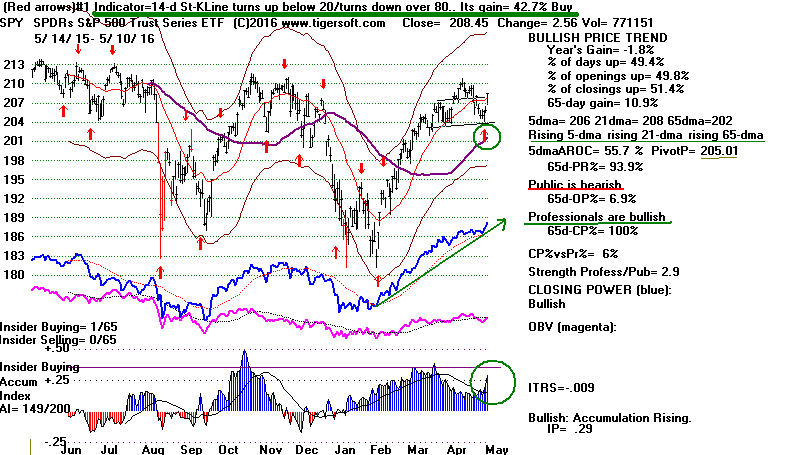
Volume Seems Too Low for A Big Rally.
NYSE daily Volume was lower than it should have been
if we were about to start a big advance upwards. 10-day
NYSE Down Volume is clearly above 10-day Up Vulume.
Though NYSE breadth was quite positive today (+1639
rise in A/D Line), volume was much lower than bulls must
have hoped for. Disappointing, too, the number of NYSE
new highs fell from 145 to 137.
More backing and filling is, therefore, likely. Today we
may have just seen the rally to right shoulder's apex in the
SP-500 and
DJIA. In that case, the next few trading days may
become the right shoulder in head/shoulders patterns for the
DJI and SP-500.
Charts: Peerless
DJIA
Hourly DJIA
DIA SPY
QQQ
IWM
DJI-Utilities
DJI-Rails
A/D Line-6000 Stocks
Crude Oil
SOXL
TECL
Major Indexes and A/D Lines.
Key Tiger Software ETF Charts
Bullish
MAXCPs Bearish MINCPs
QUICKSilver

Hillary Support Is Weakening
Hillary's big double-state defeats (West Va and Nebr.) must
be un-nerving to the establishment Democrats who
are counting on her to easily beat Trump for the Presidency.
She has just about lost her national lead over him in the Polls.
So, maybe, today's rally should be called the "Trump rally".
If Trump really were to reduce the principal on the National
Debt , as he has suggested, by bargaining with creditors, it
would surely lead to printing a lot more money and big inflation.
Initially, that would cause a surge of buying durables, real estate,
gold and collectibles before they rise too much in price. But
then eventually, it would cause much, much higher interest rates,
as in the 1970s and early 1980s. That would cause a market slump.
My thinking is that Trump could end up being the next President,
so we better start thinking about what that could mean. For
a start, it may well bring a lot more volatility to the market.
============================================================================
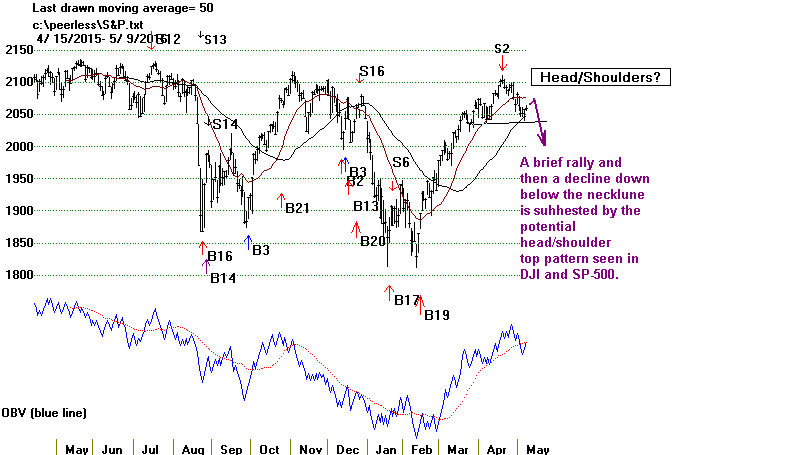
5-9-2016
With the Peerless S2 signal un-reversed, the
potential head/shoulders patterns in the DJI and
SP-500 present what seem the most likely
scenarios, namely a brief rally and then a decline to
1850 on the SP-500 and 17000 on the DJI.
Here we assume that the right shoulder apexes are
not surpassed for these indexes and that the next
decline has enough downside volume to break the
neckline supports. While we wait to see if this
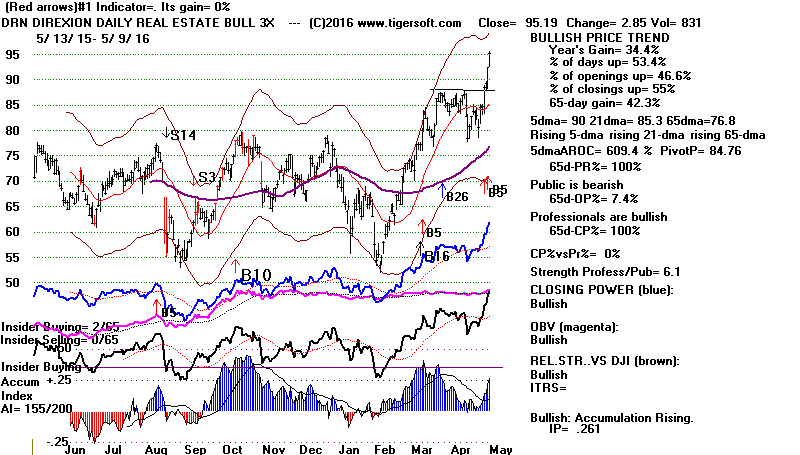
mildly bearish scenario plays out, I have suggested
buying some Reits, military stock leaders and
the leveraged ETF for Real Estate, DRN as hedges
against our shorts of DIA and some bearish MINCP
stocks
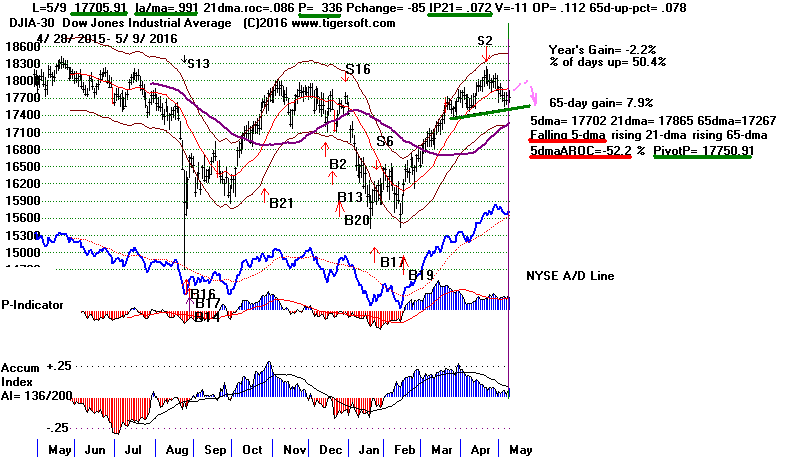
Note that a testing of the necklines could bring
a reversing Buy B9 since the P-Indicator is
likely still to be positive. The DJI would need
to close near 17500 for a Buy B9.
In the meantime, we have low interest rates and
a FED that clearly wants not to make the mistakes
it made in mid-2008 when it was slow to shore
up the Big Banks with "easier money" open market
operations and a Discount Rate cut. This year the
FED wishes not to become part of the political campaign.
Their private independence might then be challenged.
As a result also of the weakening economic data,
it does seem much less likely that the FED will jar the
market. So, buying the best performing REITs
and defensive issues seems a good plan.
Did you notice on the NYSE today, there were
many more breakout new highs. In fact, there were
145 new highs and only 14 new lows on the NYSE. By
contrast, the NASDAQ with its more speculative stocks
failed to draw the same interest. On the NASDAQ,
new lows outnumbered new highs by 10. So, this
remains a very defensive market. We can make money
here by hedging long and short, MAXCPs versus MINCPs.
Charts: Peerless
DJIA
Hourly DJIA
DIA SPY
QQQ
IWM
DJI-Utilities
DJI-Rails
A/D Line-6000 Stocks
Crude Oil
SOXL
TECL
Major Indexes and A/D Lines.
Key Tiger Software ETF Charts
Bullish
MAXCPs Bearish MINCPs
QUICKSilver
==========================================================================
5-6-2016
Consider starting to hedge again by being long some of
highest Accumulation military
stocks and REITs, but
remaining short the weakest of the
BEARISH MINCP
stocks. This strategy often starts to work well in April
and May until September.
The operative Sell S2 must now face off against a probable
rally in dividend paying stocks on the NYSE.
Interest
rates should not be going up soon. Friday's Jobs Report
showed the US economy is sputtering. 7 of the last 9 Jobs'
monthly reports showed a drop from 12 months before.
Look at the bottom of today's Hotline and note how a pattern
of monthly deterioration in the Jobs' numbers of 2007
led to a severe bear market in 2008-2009 The FED has to be
aware of this, one hopes.
But there is job growth: the numbers are positive even
though they are not matching what is needed to keep up
with the rising population. The weakening economy helps
explain why NASDAQ stocks, as a whole, are
clearly
the DJI.
Many defensive stocks remain in bull markets. With Hillary
ahead in the polls against Donald Trump, her past hawkishness
is boosting Lockheed (LMT),
Northrop (NOC) and
LLL.
Trump's real-estate ties are aiding Real Estate trusts and
DRN,
today's QuickSilver pick.
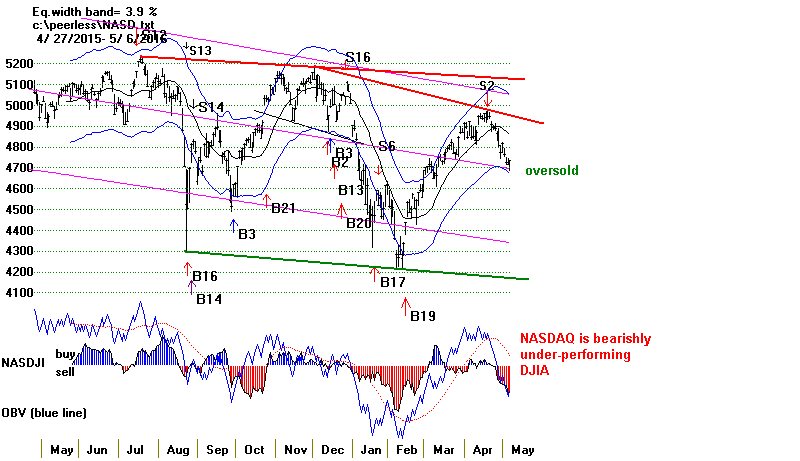
May most often brings a shallow decline and a bottom later
in the month, from which a nice advance then occurs. That
is clearly what Professionals are expecting. See how the
Closing Power for DIA and
SPY made recovery highs on
Friday.
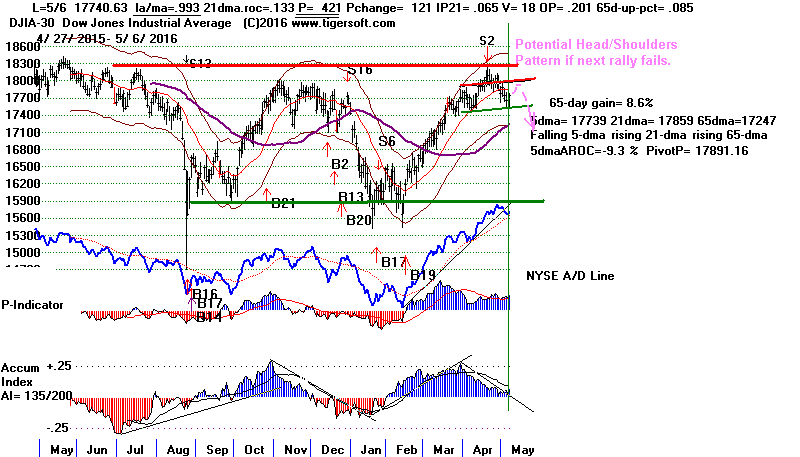
A recovery bounce is suggested by the technical position
of quite a few of the ETFs. But there is a danger that the DJI
will only rally about a hundred more points and then
come down hard. That would set up a bearish-looking head
and shoulders pattern. If the 17500 neckline was then
penetrated, a downside objective of 17000 could be
calculated. But this is complicated by the fact that the Peerless
P-Indicator (the 21-day ma of Advances-Declines) remains
positive.
Charts: Peerless
DJIA
Hourly DJIA
DIA SPY
QQQ
IWM
DJI-Utilities
DJI-Rails
A/D Line-6000 Stocks
Crude Oil
SOXL
TECL
Major Indexes and A/D Lines.
Key Tiger Software ETF Charts
Bullish
MAXCPs Bearish MINCPs
QUICKSilver
Monthly US Jobs Reports
red =
declining from 12 months earlier
blue = rising from 12 months earlier.
| US Job Growth by Month |
| Year |
Jan |
Feb |
Mar |
Apr |
May |
Jun |
Jul |
Aug |
Sep |
Oct |
Nov |
Dec |
| 2006 |
278 |
316 |
281 |
183 |
23 |
82 |
207 |
181 |
158 |
4 |
208 |
171 |
| 2007 |
240 |
90 |
189 |
79 |
143 |
78 |
-33 |
-24 |
88 |
85 |
115 |
97 |
| 2008 |
19 |
-86 |
-78 |
-210 |
-185 |
-165 |
-209 |
-266 |
-452 |
-473 |
-769 |
-695 |
| 2009 |
-791 |
-703 |
-823 |
-686 |
-351 |
-470 |
-329 |
-212 |
-219 |
-200 |
-7 |
-279 |
| 2010 |
28 |
-69 |
163 |
243 |
522 |
-133 |
-70 |
-34 |
-52 |
257 |
123 |
88 |
| 2011 |
42 |
188 |
225 |
346 |
73 |
235 |
70 |
107 |
246 |
202 |
146 |
207 |
| 2012 |
338 |
257 |
239 |
75 |
115 |
87 |
143 |
190 |
181 |
132 |
149 |
243 |
| 2013 |
190 |
311 |
135 |
192 |
218 |
146 |
140 |
269 |
185 |
189 |
291 |
45 |
| 2014 |
187 |
168 |
272 |
310 |
213 |
306 |
232 |
218 |
286 |
200 |
331 |
292 |
| 2015 |
221 |
265 |
84 |
251 |
273 |
228 |
277 |
150 |
149 |
295 |
280 |
271 |
| 2016 |
168 |
233 |
208(P) |
160(P) |
|
|
|
|
|
|
|
|
|
|
===========================================================================
5-5-2016
Another weak and failed rally today. At the close
there were even 165 more down than up and the
leading group, Utilities, was down. The
NYSE A/D Line
finally broke ts uptrend. That leaves just Bonds as
the leaders. Not very impressive. Fear about the Jobs'
numbers tomorrow before the opening is making speculators
timid. So, our Peerless Sell S2 still
operates. I think
we should stay short DIA. Be careful
about being fooled
by the first, knee-jerk reaction to the Job's numbers.
A dangerous right shoulder could be formed without
Peerless giving a reversing Buy signal.
More and more technical damage is being done. See how
close to breaking their supports are the DJI and SP-500.
By far, the bigger danger, however, would occur if
they only briefly rally and then complete weak right shoulders
which set up ugly head/shoulders, as shown below.
Peerless Sell S2 and Bearish
Head/Shoulders Rally Scenarios.
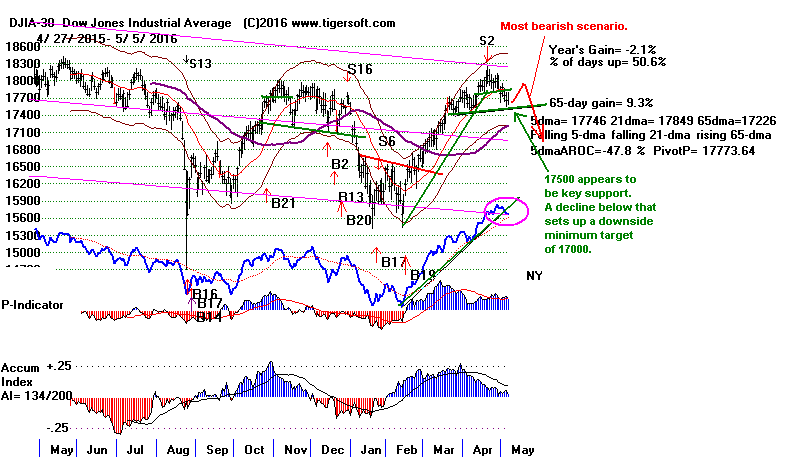
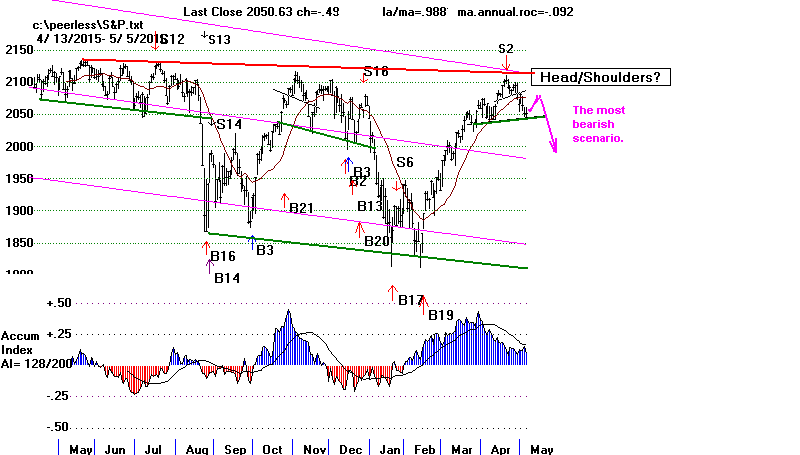
Unless breadth turns very bad, there still a good chance
we will get a Buy B9 if the DJI closes below 17500,
That would make technicals complicated and somewhat
contradictory. We will just have to wait to see what
tomorrow brings. Patience is also indicated by
.
bearish seasonality for the next two weeks of May.
Since 1965, the DJI had risen just 46% of the time
|
over this period and shows an average decline of 0.4%
There seems little reason to hurry to buy with each
rally failing before even 18000 is reached.
Charts: Peerless
DJIA
Hourly DJIA
DIA SPY
QQQ
IWM
DJI-Utilities
DJI-Rails
A/D Line-6000 Stocks
Crude Oil
SOXL
TECL
Major Indexes and A/D Lines.
Key Tiger Software ETF Charts
Bullish
MAXCPs Bearish MINCPs
QUICKSilver
===========================================================================
5-4-2016
No buy signal today, but the
DJI did close more than 1%
below the 21-day ma with the P-Indicator and Accum. Index
both positive. This is constructive. A close next below
17502, 148 points below today's close, would bring a
reversing Peerless Buy B9.
Professionals figure that weakness in Europe and higher
rates in the US will bring over hot international money
to the US. That, I think, is why the Closing Powers for
DIA and SPY
have not started downtrends, the NYSE
A/D Line is still rising and the recent
hourly DJI lows were
not confirmed by the OBV Line.
So, a bounce is indicated for tomorrow. However, I suspect
it will fail like others have in the last two weeks unless
the Jobs' Report Friday morning produces another "Goldilocks"
number. (One that is not too high, not too low and is
just right, somewhere between 220,000 - 230,000, I reckon.)
Charts: Peerless
DJIA
Hourly DJIA
DIA SPY
QQQ
IWM
DJI-Utilities
DJI-Rails
A/D Line-6000 Stocks
Crude Oil
SOXL
TECL
Major Indexes and A/D Lines.
Key Tiger Software ETF Charts
Bullish
MAXCPs Bearish MINCPs
QUICKSilver
Will there be much of a rally? Perhaps, 18000. More than
18000 seems unlikely. Utilities are
the primary leadership now.
Utility fans for this group doubt that the month of June
will bring higher rates. See some of their leaders in
the charts of the
Bullish
MAXCPs
tonight.
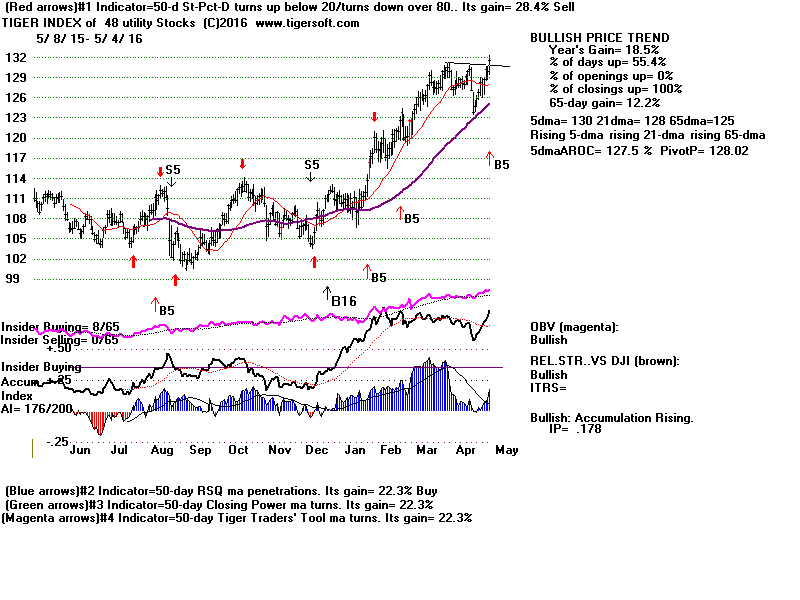
Overall, the market remains very defensive. There is
not enough head-room. So, speculators are showing
caution and even timidity now.
How do we determine this? The Peerless Relative
Strength Indicator of the NASDAQ versus the DJI
(NASDJI)
is negative. Biotechs have dropped
below their 65-dma.
Semi-conductors have broken down from their recent
side-wise consolidation. The Closing Powers for
QQQ
and IWM have had their up-trends decisively
violated.
Transports are not moving and the hot
Mining group has
turned down with a vengeance, all for fear international|
rates will go higher soon if the Fed tightens. So, I have
conclude that Speculators are simply too unwilling to take
a chance that the Aprils' Jobs report will be too good and
that will bring an interest rate hike and the market will slide
back more. Without more speculators, how high can the
blue chips go in splendid isolation?
May generally remains a soft month. After May 4th, the
DJI has rallied only 40% of the time over
the next two weeks
since 1965. A better buying opportunity will probably
present itself. Stay short DIA.
--------------------------------------------------------------------------------------------------------------------------
5-3-2016 The
operative Peerless signal remains a Sell S2.
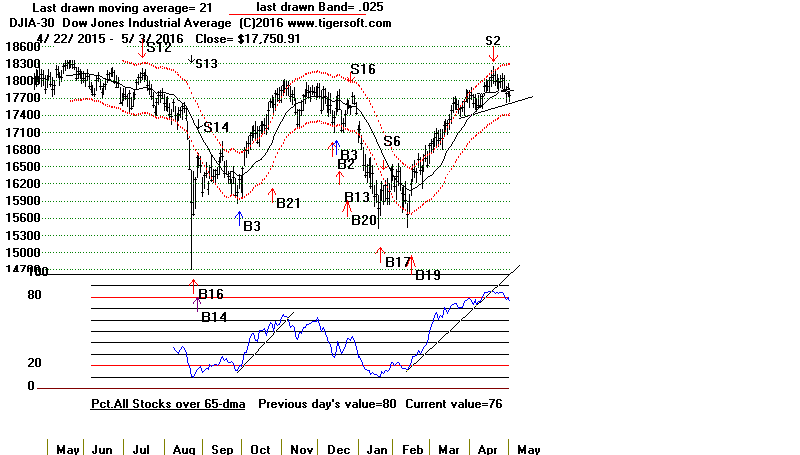
The NYSE A/D Line remains in an uptrend, but
the
chart above shows that is no longer true of all stocks.
Today's decline took the DJI 0.6% below its flat 21-day ma.
Price support is now at at 17617. The best support is at
the lower 3.5% band and the rising 65-dma, around 17200.
The DJI's Tiger Accumulation Index keeps
falling, warning
us not to trust rallies. Big Money keeps using intra-day
rallies to sell into.
Stay short DIA. The next two weeks are
seasonally week.
Since 1965, the DJI has risen only 40% of the time over this
period. The average decline is small, only -4.0%.
See how the Closing Power uptrends for QQQ,
IWM, SOXL
and TECL have been violated. It's
probably only a matter of time
before the same thing occurs for DIA and
SPY. These bluer
chip ETFs have not had Closing Power uptrend-breaks because
of the pattern of selling overseas and lower openings, which are
driven, I think, by the increased talk of rates being raised in the US.
The European economic policy makers continue to believe
that Government Austerity cures all economic ills. But they
apparently do not appreciate how much of the cheaply borrowed money
leaves the Continent of Europe and does not result in increased
investment in Europe.
(
Two Fed Officials Signal Markets May Be Wrong to Doubt June Hike
and
http://finance.yahoo.com/news/yellen-wants-it-both-ways--so-we-re-going-to-call-her--hovish-144213542.html#
)
Charts: Peerless
DJIA
Hourly DJIA
DIA SPY
QQQ
IWM
DJI-Utilities
DJI-Rails
A/D Line-6000 Stocks
Crude Oil
SOXL
TECL
Major Indexes and A/D Lines.
Key Tiger Software ETF Charts
Bullish
MAXCPs Bearish MINCPs
QUICKSilver
The Fed is now talking about raising rates in June. This
will kill the benefits the Europe hoped to get from a 0%
Discount Rate. Hot international money usually goes to
wherever it can get a higher rate. Money will flow to the
US and not be used to invest in a European recovery.
This spills over to other economies, the biggest being China.
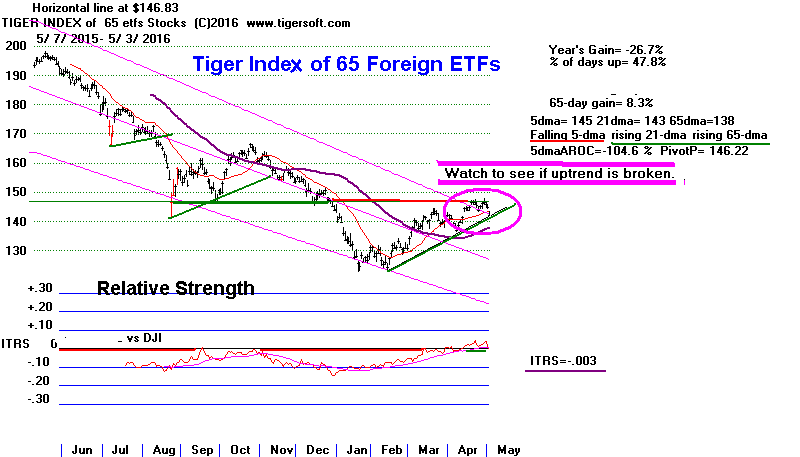
We now see a bearish head/shoulders in VGK
(European
stocks). The Chinese ETF, YINN, could not get
past
its resistance at 15 and now seems destined to test its lows.
The talk of a rise in rates in the US has also caused Gold stocks
to fall back again today. Because the FED does so much more
talking about raising rates than actually making that come to
pass, I suspect that Gold stocks will probably hold up
until rates are actually lifted. Reflecting the
Gold, Silver
and Oil Price outlook, Latin American
ETFs are now
approaching their best near-term supports in the current uptrend.
Caution rules right now. Traders want to see what the next
Jobs Report numbers are. A number for April above +250,000
would almost certainly give the FED's hawks the excuse
they need to raise rates, regardless of the consequences
overseas.
==============================================================================
5-2-2016 The
operative Peerless signal still is considered
a Sell S2. The DJI is too near the 18000 resistance
in a wide trading range with 16000 as the approximate
bottom to safely buy. But still the NYSE A/D Line is
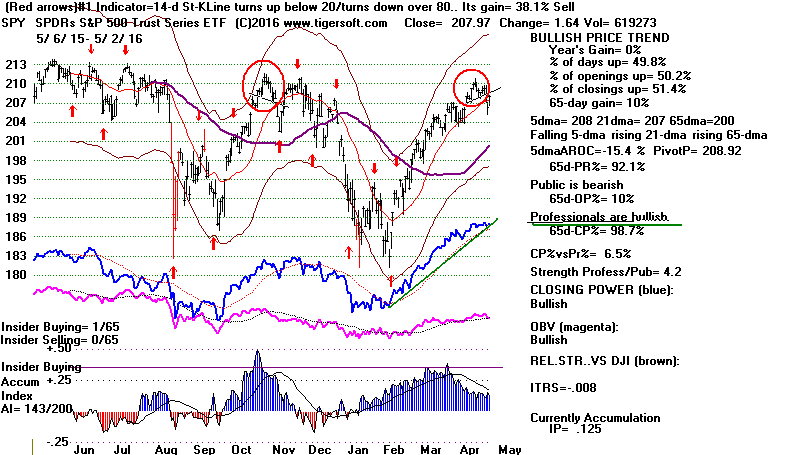
rising strongly as is the DIA's Closing Power. These bullish
attributes should prevent the DJI from declining below
the 2.5% lower band this week.
But keep in mind that the DJI still sports a bearish head/shoulders
top and the huge advances in Gold Stocks are reminiscent
of preludes to a number of significant market tops. Fortunately,
May retreats back to the lower band often set up good places
to go long again.
Buying near the lower band late in May was consistently
profitable until recently. May declines turned into bear
market sell-off in 2001, 2002 and 2008. I found no fewer
than 18 cases where May bottoms brought excellent trading
rallies. See charts.

For now, lets do some watchful waiting this week. .
The Jobs' numbers will be released before Friday's opening.
Remember that "Good is Bad". An estimated increase
in April of more than 250,000 may be sufficient for the
FED to justify a June rate hike. Because, the pundits
in the Financial Press will start talking about this, I
thought it might help to be armed with the past numbers.
US Dept of Labor's Monthly Job Gains in 1,000s
|
|
| Year |
Jan |
Feb |
Mar |
Apr |
May |
Jun |
Jul |
Aug |
Sep |
Oct |
Nov |
Dec |
| 2006 |
278 |
316 |
281 |
183 |
23 |
82 |
207 |
181 |
158 |
4 |
208 |
171 |
| 2007 |
240 |
90 |
189 |
79 |
143 |
78 |
-33 |
-24 |
88 |
85 |
115 |
97 |
| 2008 |
19 |
-86 |
-78 |
-210 |
-185 |
-165 |
-209 |
-266 |
-452 |
-473 |
-769 |
-695 |
| 2009 |
-791 |
-703 |
-823 |
-686 |
-351 |
-470 |
-329 |
-212 |
-219 |
-200 |
-7 |
-279 |
| 2010 |
28 |
-69 |
163 |
243 |
522 |
-133 |
-70 |
-34 |
-52 |
257 |
123 |
88 |
| 2011 |
42 |
188 |
225 |
346 |
73 |
235 |
70 |
107 |
246 |
202 |
146 |
207 |
| 2012 |
338 |
257 |
239 |
75 |
115 |
87 |
143 |
190 |
181 |
132 |
149 |
243 |
| 2013 |
190 |
311 |
135 |
192 |
218 |
146 |
140 |
269 |
185 |
189 |
291 |
45 |
| 2014 |
187 |
168 |
272 |
310 |
213 |
306 |
232 |
218 |
286 |
200 |
331 |
292 |
| 2015 |
221 |
265 |
84 |
251 |
273 |
228 |
277 |
150 |
149 |
295 |
280 |
271 |
| 2016 |
168 |
245(P) |
215(P) |
|
|
|
|
|
|
|
|
|
| P : preliminary |
http://data.bls.gov/timeseries/CES0000000001?output_view=net_1mth
|
|
. I Do Not Expect A. Rate Hike.
The FED is acting like it is limited by what the European
Central Bank is experimenting with. Their 0% Discount
Rate is meant to revive their stock markets. Their people
are told this "should" work to revive their sluggish economies,
too. But this is really the same "trickle-down" tripe the
Fed served us with QE-2 and QE-3. Still, what choice do they have.
Their politicians share the same automatic aversion to deliberate
deficit spending on Public Works as most of the Congress does.
Expect more "muddling through". Meanwhile, Gold should
keep rising.
Charts: Peerless
DJIA
Hourly DJIA
DIA SPY
QQQ
IWM
DJI-Utilities
DJI-Rails
A/D Line-6000 Stocks
Crude Oil
SOXL
TECL
Major Indexes and A/D Lines.
Key Tiger Software ETF Charts
Bullish
MAXCPs Bearish MINCPs
QUICKSilver
------------------------------------------------------------------------------------------------------------------------
4-29-2016 I take the operative Peerless
signal to be a Sell S2.
A brief DJI rally seems likely. Friday, the DJI could not
close decisively break its neckline. The rising Closing Power of
SPY has not yet been broken.
QQQ has fallen to expected
short-term support, its rising 65-dma. But Gold's rise
represents a grave danger to the EURO and the
Dollar.
If interest rates are not raised, Gold and its surrogates
are likely to keep rising.

Stay short DIA and, for more aggressive longs,
hold
a mix of Gold, Silver, Oil Service Sectors and
Emerging
Market ETFs. Watch
GLD closely now. Big bankers
in the FED ultimately are loathe to allow its strength to
showcase severe potential weakness in the Euro and Dollar.

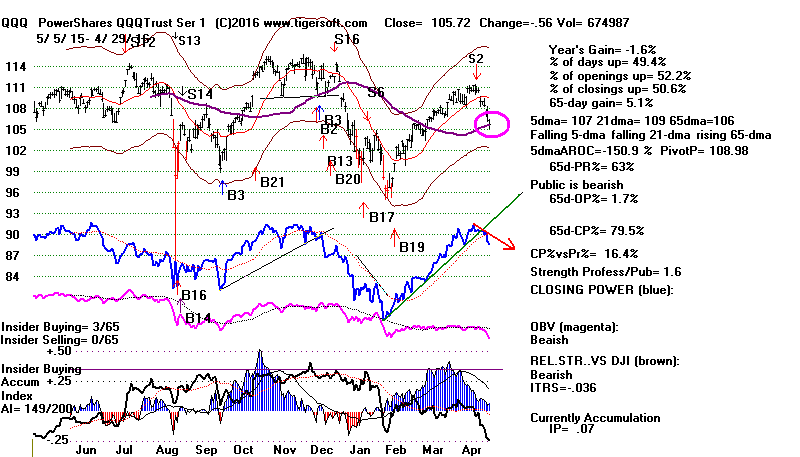
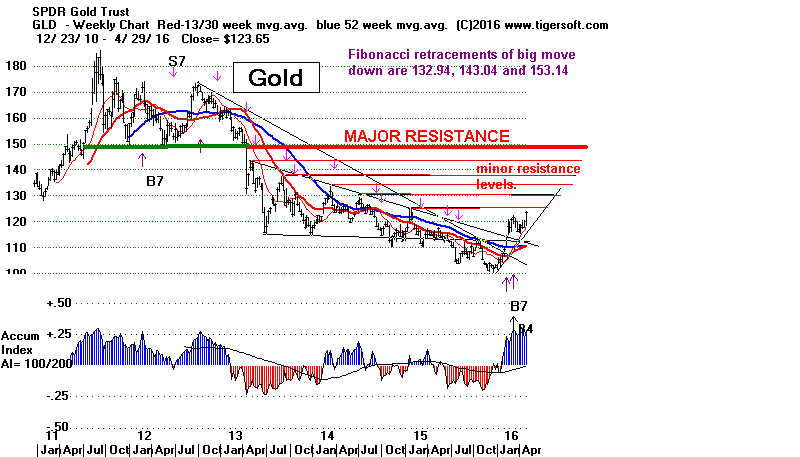
Gold has broken above the last resistance shown on
its Daily Chart. The weekly chart shows many points
resistance. The very number of them suggests sellers
have no one place to concentrate their sell orders
so as to better turn back Gold's rally.
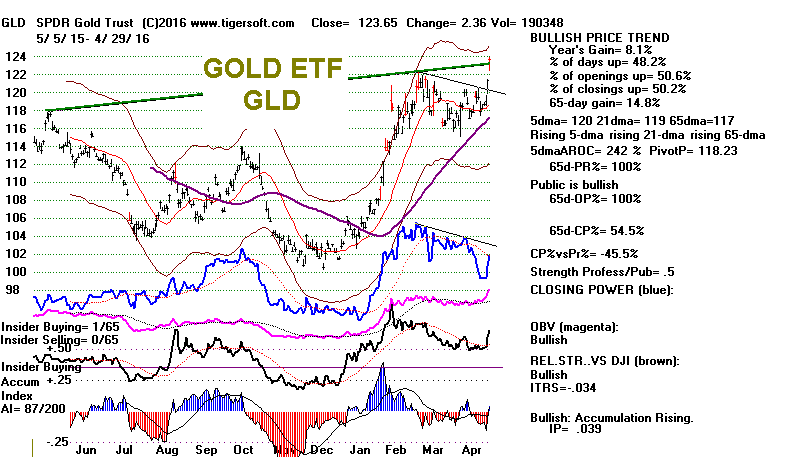
WEEKLY GLD CHART
Charts: Peerless
DJIA
Hourly DJIA
DIA SPY
QQQ
IWM
DJI-Utilities
DJI-Rails
A/D Line-6000 Stocks
Crude Oil
SOXL
TECL
Major Indexes and A/D Lines.
Key Tiger Software ETF Charts
Bullish
MAXCPs Bearish MINCPs
QUICKSilver
Gold and Silver Stocks explosion upwards is a result
how very oversold they were and how the European
Central Bank has declared it would keep its key
Discount Rate for banks at 0%. In theory, money
supply should grow fast and there should soon be
inflation. In theory, the Euro will become super-
plentiful. With it declining, the expectation is that
Gold will be the best safe haven. Because it pays
no dividend, any rise in European interest rates
should cause it to decline. But right now, as the
hottest performing investment around, it is attracting
thousands of speculators who are willing to bet that
neither the European Central Bank or the FED will
raise rates. In the short-run, they will probably
be right. But in the long run, the big banks cannot
allow their currencies to lose too much value relative
to Gold. At some point, US Treasuries would presumably
even be dumped by the Chinese in favor of Gold.
This the FED cannot allow.
----------------------------------------------------------------------------------------------------------------------------
4-28-2016 I take the operative Peerless
signal to be a Sell S2.
DJI and
SP-500 bulls must now fight off quickly appearing
head/shoulders patterns. Just because these are small
patterns does not make them less significant. The DJI's
neckline at 17780 is important to watch now. This is
50 points below the neckline support. If that support
does give way, way, I would expect the DJI next to decline
to the support of its rising 65-dma.
The DJI has slightly penetrated its 21-day ma. With the
current annualized rate of change of the 21-day ma now below
+.07 and the current IP21 below +.07, this mvg.avg.
will probably give way. So, therefore, will the neckline
at 17780. (Key Values DJI Chart).
We remain short DIA. A retreat to the
DJI's lower band
near 17250 would then seem to be the most likely next
scenario. It is also possible that we will see a deeper
decline, though still bounded by the broad trading range,
15700-18000. The best earlier examples of such
broad trading ranges are those of 1956-1957, 1986 and 2000.
We will need to get another Peerless Buy signal to buy
DIA.
The Rise of Gold Stocks
Is A General Market Warning,
I am also concerned by how big advances in Gold
and Gold stocks can cause the FED to tighten rates.
Just before the October Crash of 1987 saw NEM,
a key gold stock, rise 125% in 11 weeks, It peaked
on 9/15/1987. Two weeks later we got our most famous
Sell S9. Five weeks after the Sell S9, the DJI was
down 33%.
The
"Nifty-35" May
Be Topping Out,
One of the reasons that the DJI is declining is the
fear that tech stocks will start to break down following
APPL's lead the last few days. Now at
94.83, it is
nearing important support at 93.
Charts: Peerless
DJIA
Hourly DJIA
DIA SPY
QQQ
IWM
DJI-Utilities
DJI-Rails
A/D Line-6000 Stocks
Crude Oil
SOXL
TECL
Major Indexes and A/D Lines.
Key Tiger Software ETF Charts
Bullish
MAXCPs Bearish MINCPs
QUICKSilver
The New Boom in Gold/Silver Stocks
Another reason for the recent decline in blue chips and
many defensive stocks is that they've simply had very
good runs and now it's simply time for some profit-taking.
Some of that money is being shifted to the very hot
gold and silver stocks.
As you know, mining stocks declined throughout 2012,
2013, 2014 and 2015. That's a long bear market by
any measure. Since the beginning of this year, they
have been springing back,
With interest rates very low, the EURO and the Dollar
look suspect to "Gold-Bugs". The
mining stocks' up-trends
are outstanding. High performance funds cannot ignore
them. It has been an across-the-board mining stock rally,
but it is the smaller mining stocks that are now rising the
most steeply.
Because of how far they came down, I believe that they
could still rise a lot more before they reach significant
and over-powering resistance. See JNUG's weekly chart
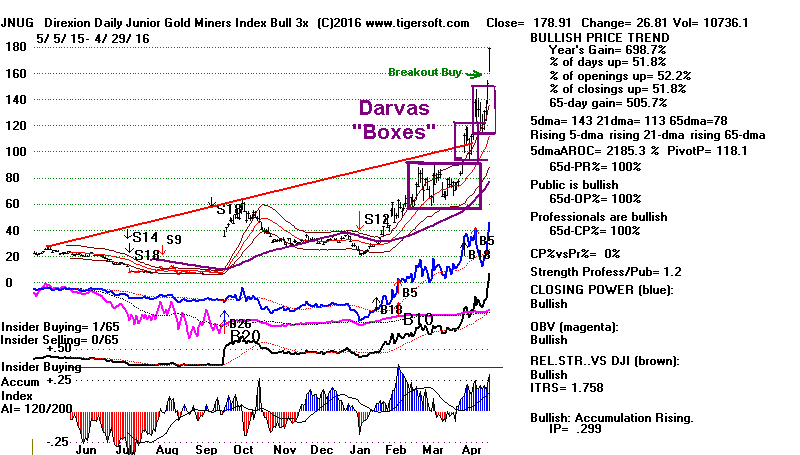
below. This is the bullish leveraged ETF for smaller miners.
It is now 152, In theory, it may not face key resistance until
it reaches 600!
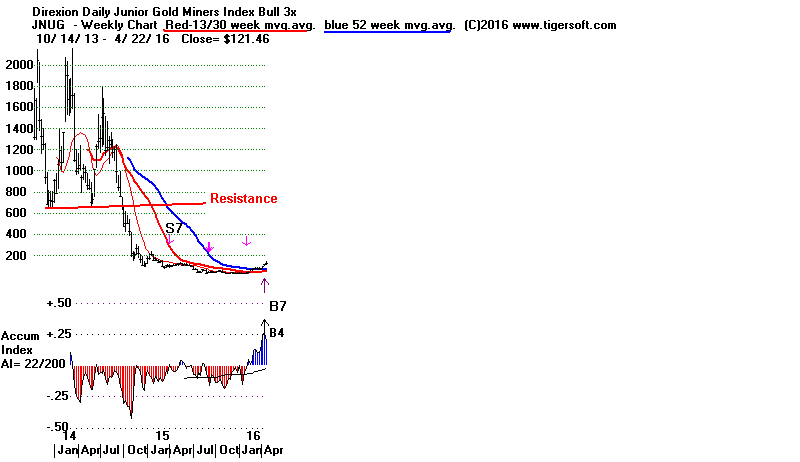
How Darvas Would Trade Them
In 2009 and 2010, many of the same stocks also made
big advances. But there is a big differences now.
In the earlier period they rose more gradually, rising up
and down from a steadily rising 65-day mvg.avgs.
Here they are rocketing upwards. Traders have to
use the rising 5-day ma and 10-day ma as points to buy
and they must also be prepared to buy the breakout-
new highs. Such breakout-buying is hard for most
people. But it must be used when extraordinarily
bullish news has excited both big money and increasing
numbers of speculators who do not want to be left out
of the action. Rallies like this seldom last longer than
a year. But they can be profitably traded.
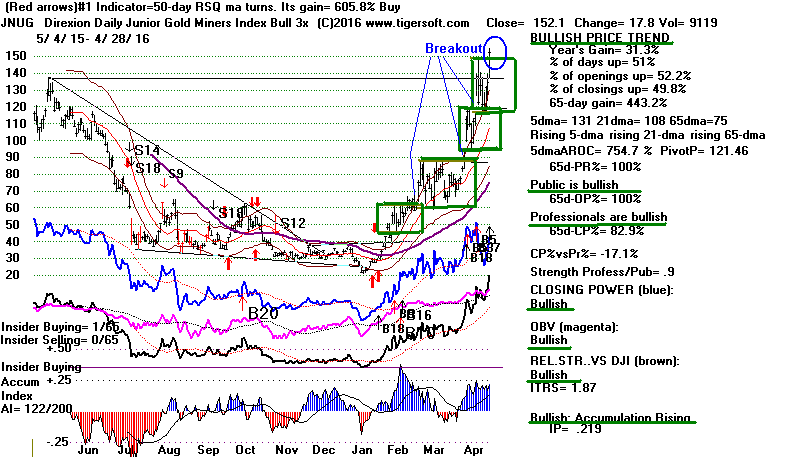
This is the type of market favored by devotees of the
box system of Nicolas Darvas. As long as the floor of
each higher price-box is not closed below, folks using
the original Darvas system simply stay long after buying
on a breakout. See the boxes in the Daily JNUG chart
below.
(
https://en.wikipedia.org/wiki/Nicolas_Darvas
)
Daily JNUG
===========================================================================
4-27-2016 We need to see if the DJI can get
and stay above 18000
before trusting yesterday's B15. Breakout runs
just do not seem to happen in April or May in a
Presidential Election Year. I would hold DIA short and
trust the Sell S2 a little longer. I explained the reasoning
for this in last night's Hotline.
Charts: Peerless
DJIA
Hourly DJIA
DIA SPY
QQQ
IWM
DJI-Utilities
DJI-Rails
A/D Line-6000 Stocks
Crude Oil
SOXL
TECL
Major Indexes and A/D Lines.
Key Tiger Software ETF Charts
Bullish
MAXCPs Bearish MINCPs
QUICKSilver
Hillary's victory over Sanders was expected. So
was today's Fed announcement that there would be
no April Rate hike. Taking profits in major market
ETFs on this news was probably the right tactic for
traders.
Overseas developments are taking all the
world's
market's down this morning.
http://www.bloomberg.com/
It's April. That means it time for another round of
the big austerity-obsessed European banks squaring off
against the long-suffering Greek people.
https://www.rt.com/business/341140-greece-imf-bailout-europe/
Institutional Dumping
Multiple Tiger Sell S14s Are Mean and Ugly
When Stock with S14s Break Support at 65-dma.
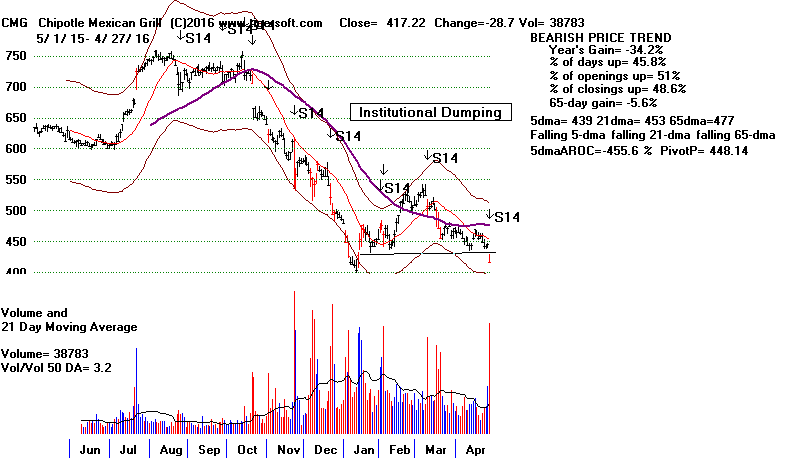
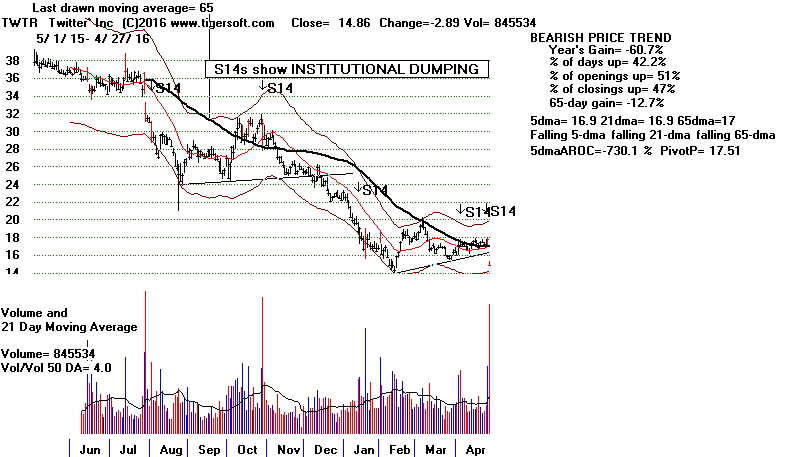
AAPL's awful earnings, Twitter's tanking and Chipotle's collapse
are warnings that US growth stocks could start to turn down badly.
These stocks' sell-offs should limit the upside potential for TNA and
QQQ. If their recent lows do not hold, look for them and the key
ETFs to fall further. All three look like good short sales.
The Sudden Rise of The Fallen and Long Depressed
With low interest rates in Europe gas come strength
in Gold, Silver
and South American ETFs like LBJ
and BRZU. The Oil and Gas service
sector OIH, shows
lots of Accumulation as it recovers. So does the
very depressed GASL. Buying small
positions in
these on 10% declines from their peaks is a tactic
that should continue to work so long as the European
Discount rate is effectively zero percent.
---------------------------------------------------------------------------------------------------------------------------
4-26-2016 I still take the operative
Peerless signal to be a
Sell S2 despite the Buy B15 that appeared today.
Stay short DIA. There is still a good chance that
the recent neckline-support levels for the DJI, SP-500
and QQQ will be broken. If that occurs, I would think the
DJI will have to test 17000 and its lower band.
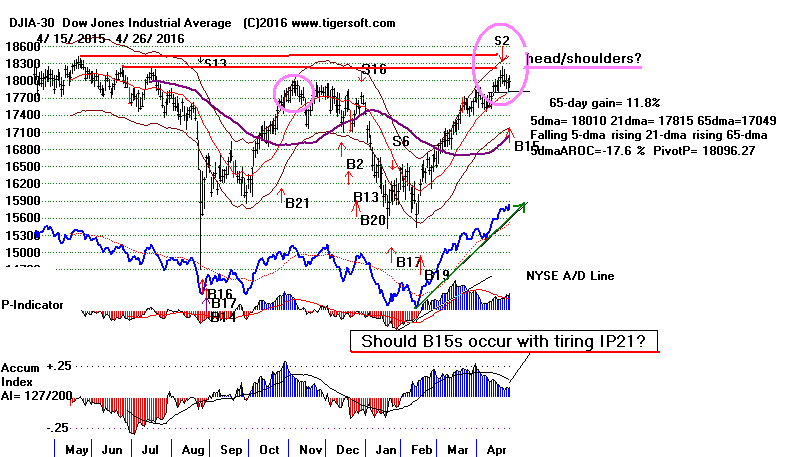
The Buy B15 occurs because the DJI had risen
strongly and has not closed below its 21-day ma for
more than 40 some days. It has only occurred
once in April and once in May. Given the overhead
resistance, let's hold off taking the Buy B15 for now.
We may well see more inconclusive backing and
filling for the next month or two by the major
averages. Special situations and low-priced minerals'
stocks are the only good offerings now for traders
among stocks. They may heat up more.
Charts: Peerless
DJIA
Hourly DJIA
DIA SPY
QQQ
IWM
DJI-Utilities
DJI-Rails
A/D Line-6000 Stocks
Crude Oil
SOXL
TECL
Major Indexes and A/D Lines.
Key Tiger Software ETF Charts
Bullish
MAXCPs Bearish MINCPs
QUICKSilver
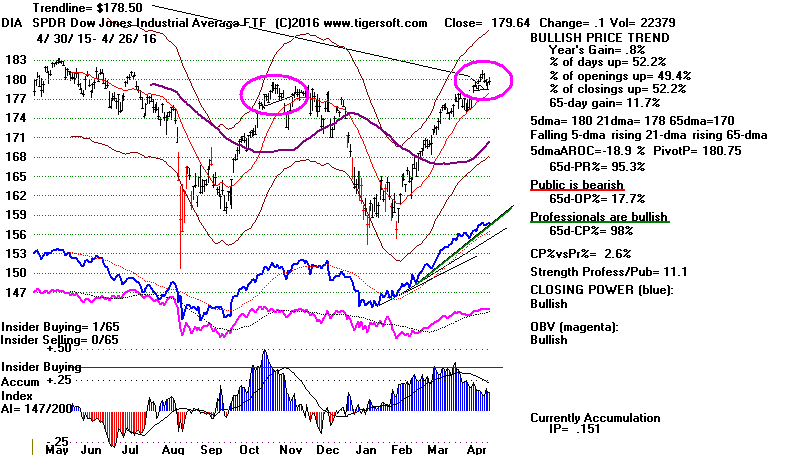
The new B15's appearance is problematic mainly because
of the amount of overhead resistance in the DJI and the
bearish looking head and shoulders patterns that we
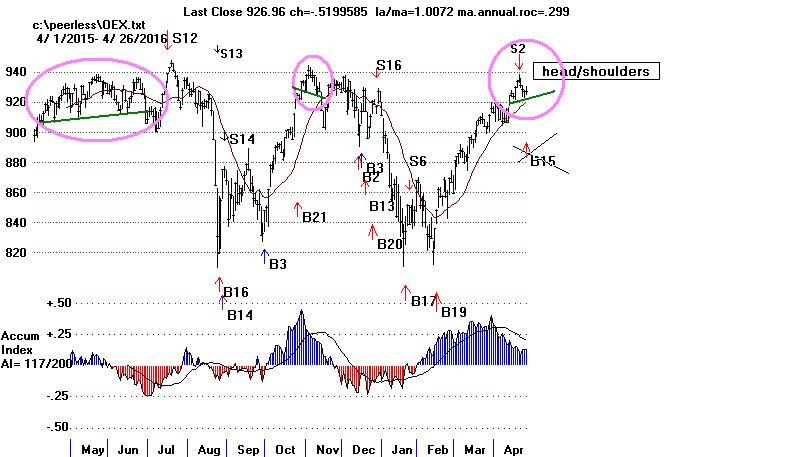
see now in the QQQ, NASDAQ, OEX, SP-500
and even the DJI. AAPL reported poorer than
expected earnings after the close today. Because
of its huge size, a much lower opening by AAPL
will almost certainly bring a test of these indexes
necklines. It will also mean the DJI will again test
its rising 21-dma. If these necklines are broken, I
would think the DJI will have to test its lower
band.
There is another problem with today's Buy B15.
Buy B15s seldom occur in April or May. There has been
only one B15 in April. True, that brought a big gain in 1995 and 1996.
But it also occurred after the DJI had already made a very bullish
flat topped breakout into all-time high territory. The
DJI is now 3% below such a breakout. The overhead resistance needs
to be eaten up before any April or May Buy B15.
The single May B15, in 1999, did occur above resistance,
but
because of how late it occurred in the ordinarily bullish
November-May period, it immediately brought a significant
paper loss. The DJI back fell to the lower band
And there is one more problem with taking seriously this
Buy B15 that we got today. This problem arises from the
market's typical behavior in a Presidential Election Year.
Breakouts in April or May just do not go anywhere in
these years. One has to go back to the wild and highly
speculative 1928 April and May breakouts to see them
succeed. Since then, any April or May breakouts have
proven to be failures.
So, we need to be cautious about taking this Buy B15
at present. It could succeed, I surmise. But that would
require the FED to go along with the zero-Discount rate
in Europe. We need more evidence that this is what they
will do.
Let's watch to see how these head/shoulders patterns
play out. At present, I would stay short DIA and avoid
most long positions, except for some foreign ETFs and
some of the strongest oil/gas stocks among the Bullish MAXCPs.
If these head/shoulders patterns are completed, they
should be treated as Tiger S5s. If the DJI completes
its head/shoulders, that, too will be a Tiger Sell S5.
My thinking right now is simply to change Peerless
so that Buy B15s simply cannot occur in April or May
in a Presidential Election Year.
The market is waiting.
I think it is waiting to see what the European Central Bank
and the Fed continue to do. Until Professionals jump
on the bearish side and DIA's Closing Power breaks its
uptrend and the NYSE A/D Line breaks its steep uptrend,
any decline will probably be limited.
The outcome of US Presidential Primaries will probably be Hillary
Clinton vs Donald Trump race. If so, Wall Street looks to be safely
in control for another four years. That will work to hold
the market up, too. Only a sudden rise in US interest rates would
pose much risk to the market. Because it's a Presidential Election
Year and the FED remembers 2008, they will probably be very
cautious and leave rates unchanged.
--------------------------------------------------------------------------------------------------------------------------
4-26-2016 The operative signal remains a
Peerless Sell S2.
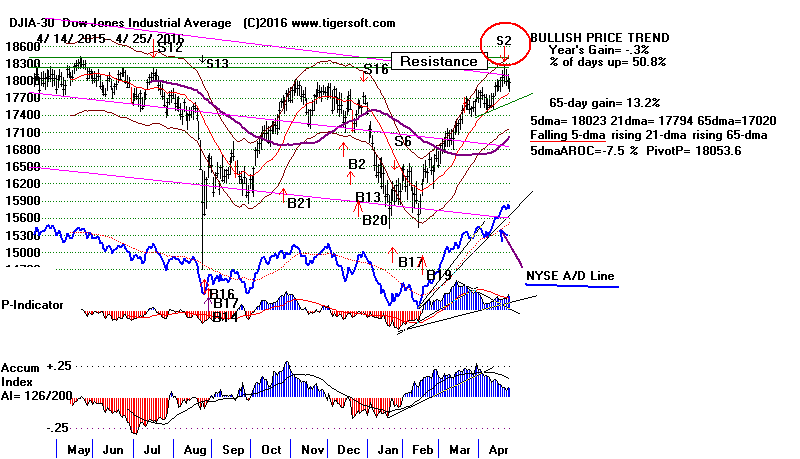
However, short-term support is apparent. The Closing Powers for DIA.
SPY and QQQ are still in uptrends. So is the NYSE A/D Line.
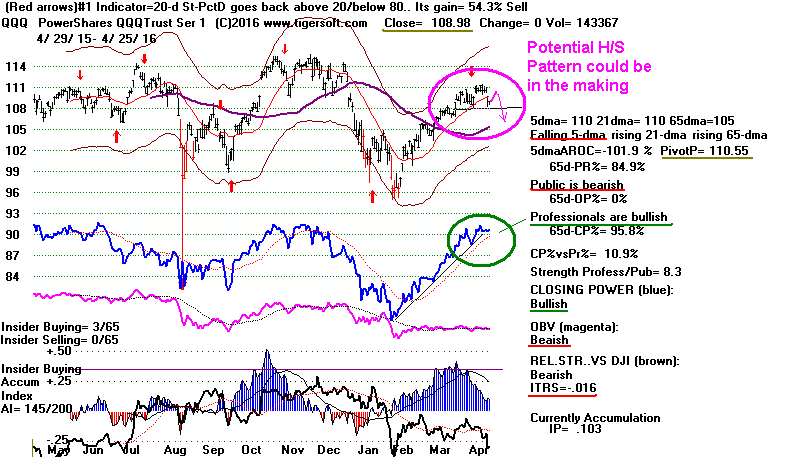
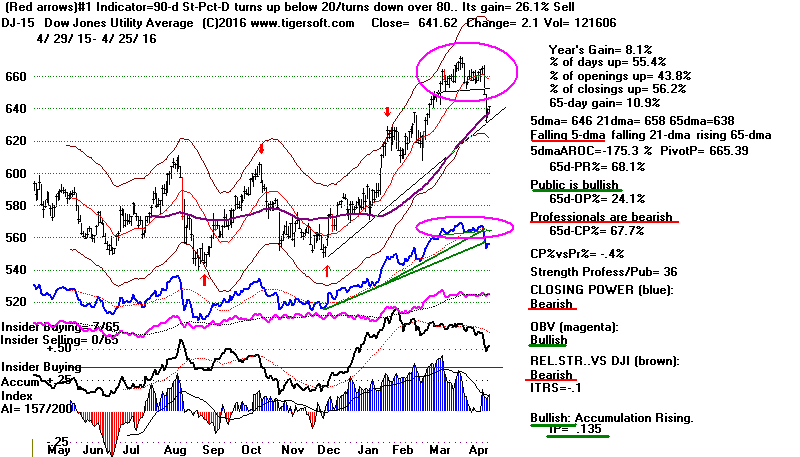
Let's watch the QQQ now. It could forming a little head/shoulders
pattern. You may remember that we noticed a similar pattern
in the Dow Jones Utilities as it tested its neckline similarly.
It has not broken its support. Fed watchers, apparently,
have not decided whether there will be a June rate hike.
Charts: Peerless
DJIA
Hourly DJIA
DIA SPY
QQQ
IWM
DJI-Utilities
DJI-Rails
A/D Line-6000 Stocks
Crude Oil
SOXL
TECL
Major Indexes and A/D Lines.
Key Tiger Software ETF Charts
Bullish
MAXCPs Bearish MINCPs
QUICKSilver
Professionals Have Insider Information on Rates.
Watch Them Closely Now.
A lot depends on whether the European Central Bank continues
its very low rates. If it does keep its Discount Rate at 0%, that
will put pressure on the FED also to keep rates low. To have
them much higher would hurt the Euro and drain "Hot Money"
away from Europe to the US just when they are seeking to
encourage| new investments in Europe. Would the US
financially sabotage Europe?
Assuming the FED chooses to go along with very low ECB
rates, that should allow the DJI to move to a nominal new high
despite the Peerless Sell. A bigger rally would seem unlikely.
One has to go back to 1928 (when the boom became a bubble)
to find a case where the DJI made a big move up from an April
or May breakout in a Presidential Election year.
One of the main reasons for monitoring what Professionals
are doing is because they have contacts within not only the
Fed but also the Bank of England, in Brussels and the European
Central Bank.
One thing I've learned about predicting the stock market:
more than any other factor, its Central bank changes of
Discount Rates that hold the most sway over what the
stock market does... unless (and this is important) there are
extraordinary emotional forces at work at the same time.
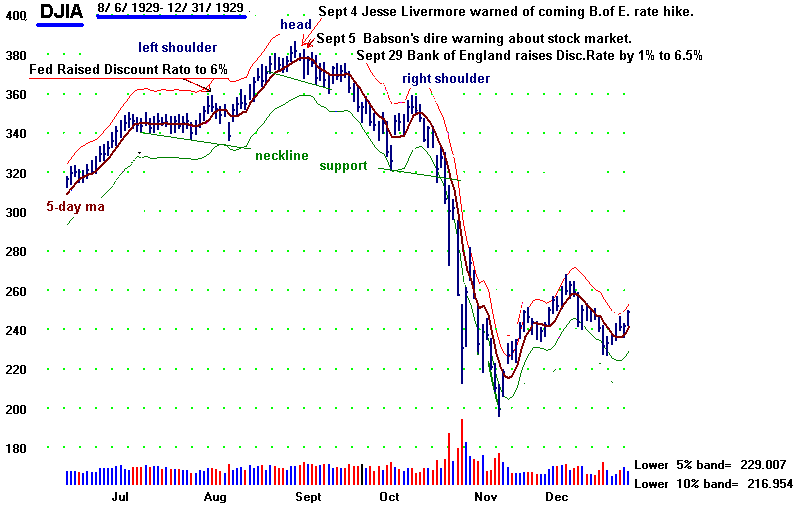
An Untold Story about 1919
As you all probably know, there was a famous Wall Street
trader named in the 1920s named Jesse Livermore. He made a
colossal amount selling short just before the Crash in 1929. What is
not so well know is that he had spies within the Bank of England.
Only a few days after the DJI peaked on September 3rd 1929,
Livermore received a telegram that the Bank of England was about to
raise its own Discount Rate from 5.5% to 6.5% in an effort to
get British "hot money" to withdraw their funds from Wall Street
before the cataclysm came.
"On the morning of 4 September 1929, the New York hedge fund
operator Jesse Livermore received a message from a source in London
according to which a “high official” of the Bank of England – either Montagu
Norman or one of his minions – had told a luncheon group of City of London
men that “the American bubble has burst.” The same official was also quoted
as saying that Norman was looking for an excuse to raise the discount rate
before the end of the month..."
(
http://tarpley.net/online-books/against-oligarchy/british-financial-warfare/
)
The same author insists that it was always the intent of the Bank of England
to restore the "City" of London (the financial community there) to its
former position as the center of world Finance. He presents evidence
showing that the Bank of England was even hoping for a US Crash.
Did they actually design their Rate Hike to do that? Or
was their move to a very deflationary 6.5% simply a response
to the Fed's rate hike to 6% a month earlier? The author claims that
when JP Morgan heard of the actual B of E rate hike on September
29th and, five days later, how the Labour Government's Chancellor
of the Exchequer Phillip Snowden was calling the full one percent rate
hike a necessary step to end the dangerous US stock market "orgy
of speculation", he became enraged, feeling betrayed. At that point he
ordered going even more heavily short.
============================================================================
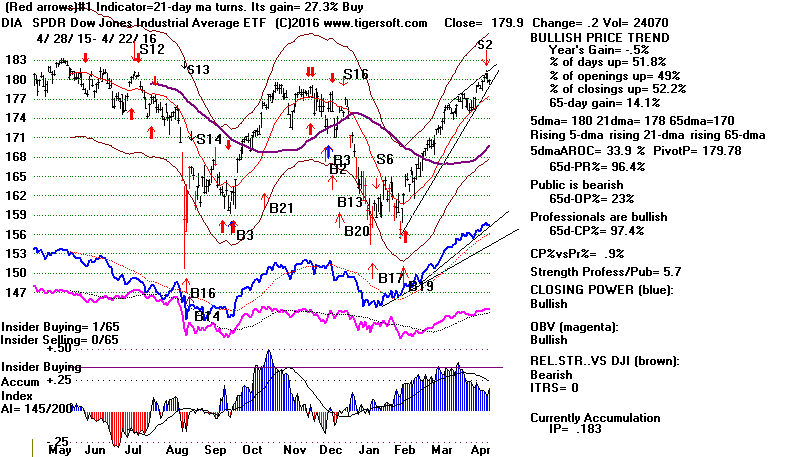
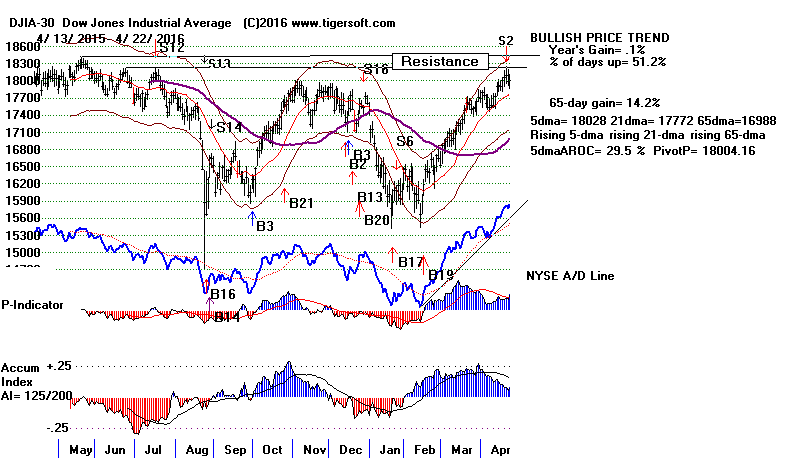
4-22-2016 Peerless now shows the operative signal
to be a Sell S2.
Lots of Indexes and Sectors appear to have reached resistance
levels. See for example the SP-500,
QQQ and OEX.
A pullback to re-group seems likely even though
the NYSE
A/D Line remains in a steep uptrend.
Professionals have
not yet switched from net Bullish to net Bearish. The DJI
which is the first Index they jump on to attract buyers or
sellers is still rising. Until DIA's Closing
Power uptrend is
broken, there is still some chance that new lower interest
rates will be unveiled to push the market higher. The Federal
Reserve may not want to risk another 10%-14% sell-off
in this a Presidential Election Year.
Charts: Peerless
DJIA
Hourly DJIA
DIA SPY
QQQ
IWM
DJI-Utilities
DJI-Rails
A/D Line-6000 Stocks
Crude Oil
SOXL
TECL
Major Indexes and A/D Lines.
Key Tiger Software ETF Charts
Bullish
MAXCPs Bearish MINCPs
QUICKSilver
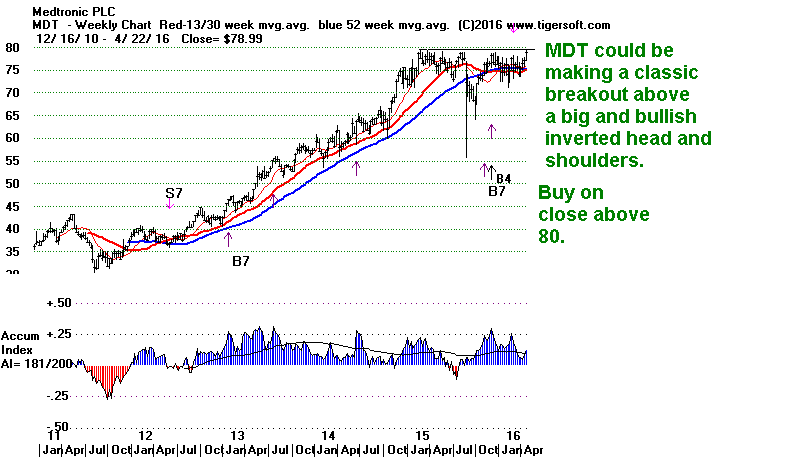
Medtronics (below) has been a 2-year base just
below 80. A
breakout over 80 would look especially appealing
as a place for chartists to buy.
------------------------------------------------------------------------------------------------------------------
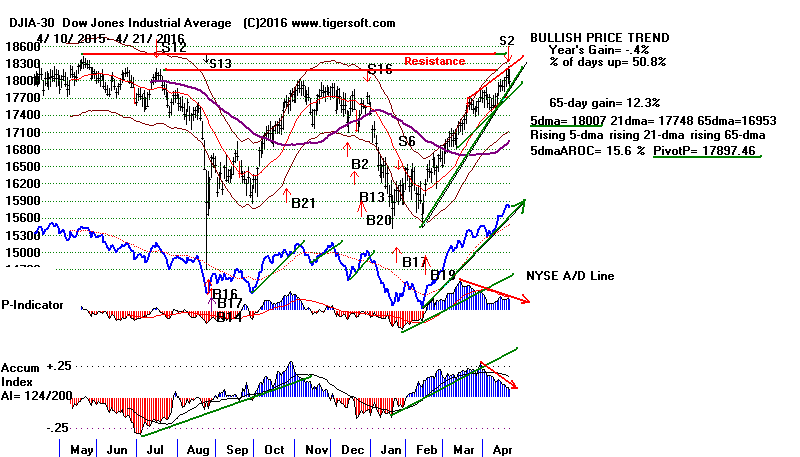
4-21-2016 Yesterday brought a reversing Sell S2 from
Peerless.
The head/shoulders pattern of the
DJ-Utilities worsened
today. Some 40 S&P-500 stocks now show
completed
head/shoulders patterns.
The Closing
Powers for the key ETFs have not yet been
broken. Ordinarily, we would
prefer to wait for these uptrendlines
to be broken, before suggesting
going short DIA. But these
Sell S2 signals are very reliable,
especially when the
DJI seems locked in a broad trading
range in a Presidential
Election Year. So, I suggest going
short DIA or some of the stocks
showing completed head/shoulders
patterns where the
stock has also closed below its
65-dma.
See these SP-500
H/S stocks here.
Charts: Peerless
DJIA
Hourly DJIA
DIA SPY
QQQ
IWM
Crude Oil
SOXL
TECL
Major Indexes and A/D Lines.
--->
http://tigersoft.com/MAJOR-INDEXES/INDEX.htm
Key Tiger Software ETF Charts
Bullish
MAXCPs
Bearish MINCPs
QUICKSilver
The German Finance
Minister, Schäuble,
has come out strongly
against the zero-interest rate policies of
Mario Draghi, the head of the
European Central Bank. The markets are
interpreting the
German bankers' opposition as being powerful
enough to threaten
any long-term "helicopter - free money"
plan.
http://www.politico.eu/article/3-messages-from-draghi-for-ecb-critics/
This is a highly
reliable Sell. 2/3 of the cases have
occurred in a Presidential Election year.
The average
decline by the DJI when reversed with a
Peerless
Buy is 7%. The closest parallels to now
among
earlier S2 signals were those occurring in
Presidential
Election years and when the DJI was visibly
locked
in a broad trading range. Those are the
cases in
1948, 1956, 2000 and 2004.
Trading Range
Peerless Sell S2s
in A Presidential Election Year,
since 1928| PE = Presidential Gain if DJI Sold Short
Election Year and this position was
closed on next Peerless Buy.
=========================================================================
19480615 PE S2 193.2 .05 perfect
19481022 PE S2 189.8 .061 perfect
19560409 PE S2 518.5 .079 perfect
19560802 PE S2 521 .075 perfect
20000425 PE S2 11124.82 .049 perfect
20000906 PE S2 11310.64 .095 perfect
20001030 PE S2 10835.77 .060 Very small Paper Loss
20040902 PE S2 10290.28 .038 Very small Paper Loss
-------------------------------------------------------------------------
Avg = 7.2%
================================================================================
4-20-2016 Today brought a reversing Sell S2 from Peerless.
This is a highly reliable Sell. 2/3 of the cases have
occurred in a Presidential Election year. The average
decline by the DJI when reversed with a Peerless
Buy is 7%. See the list of S2s further below. S2s
are based on the DJI approaching the upper band
in certain months in the 4-year Presidential cycle
with significantly weakening internals.
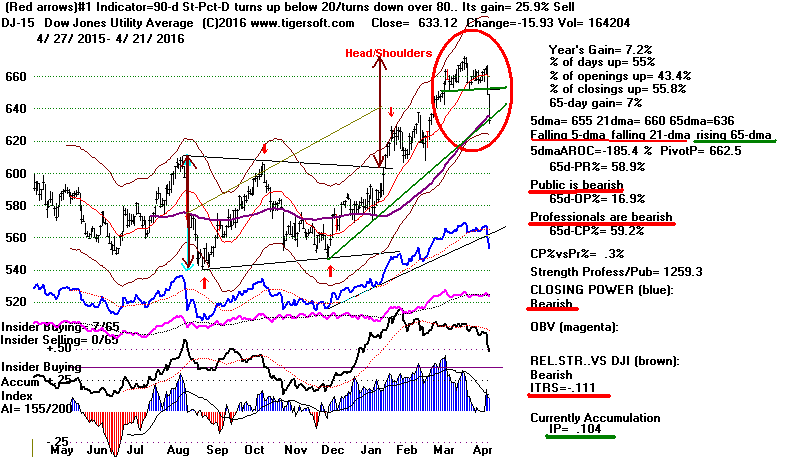
 While our internals now are not negative, the DJ Utilities
quickly completed a bearish-looking head and shoulders
today. Fear must be returning that the FED will raise rates
in June. See these charts further below.
 QUICKSilver
Just by looking at the DJI, it is not clear that it will immediately
fall back. But it did close 2.1% above the 21-day ma and
is in the zone of resistance from the highs of last Summer.
Today the NYSE A/D Line has made another new high
far ahead of the DJI, The DIA's Closing Power is still
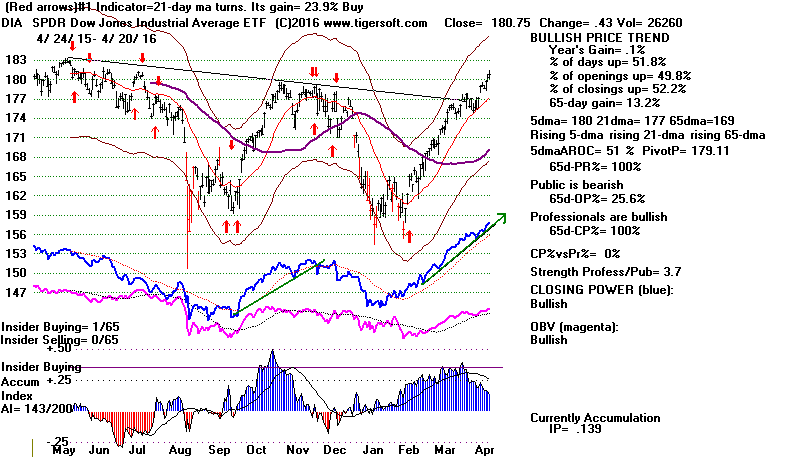
rising. Conclusion: I would take some profits in general
market ETFs. But let's wait until the DIA's Closing Power
breaks its uptrend before selling short DIA.
Peerless Sell
S2s since 1928| PE = Presidential Gain if DJI Sold Short
Election Year and this position was
closed on next Peerless Buy.
=========================================================================
19321111 PE S2 68.0 .135 perfect
19350909 S2 132.5 .033 Very small Paper Loss
19430920 S2 141.8 .071 perfect
19480615 PE S2 193.2 .05 perfect
19481022 PE S2 189.8 .061 perfect
19560409  PE  S2             518.5         .079    perfect
19560802  PE  S2             521           .075    perfect
19600614  PE  S2             654.8         .058    perfect
19670918      S2             938.74        .084
19710907      S2             938.74        .103
20000425  PE  S2             11124.82      .049   perfect
20000906  PE  S2             11310.64      .095   perfect
20001030  PE  S2             10835.77      .060   Very small Paper Loss
20040902  PE  S2             10290.28      .038   Very small Paper Loss
20070919      S2             13815.56      .062

20160520  PE  S2             18096.27      ----
------------------------------------------------------------
                                         Avg = 7%
|
DJI
Utilities have completed a bearish Head/Shoulders.
Fears shot up today that rates
would be rising soon.
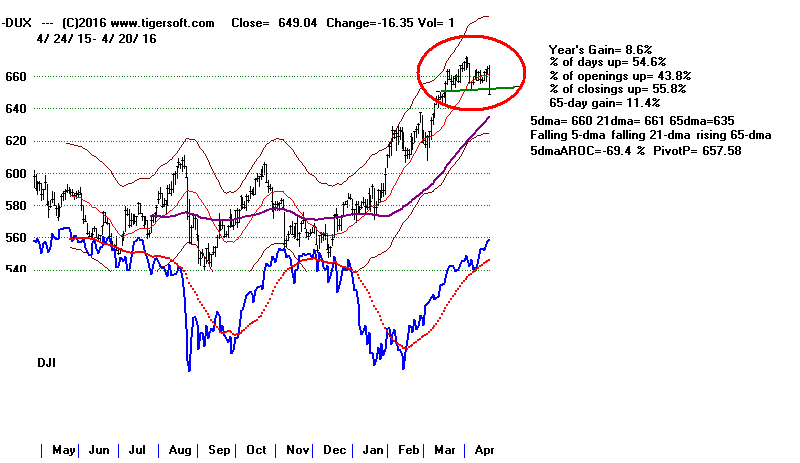
Utilities' Head/Shoulders since 1997
What is Significance for DJI?
Bearish 8 of 9 times.
Feb 2001 DJI fell a long ways.
May 2002 After quick rebound, DJI fell a
long ways
July 2008 DJI fell a very long ways.
May 2011 After a month-long rebound
DJI fell significantly.
August 2012 DJI rebounded for 2 months
and then fell sharply.
November 2012 DJI fell significantly
May 2013 Minor DJI decline followed.
August 2013 Minor DJI decline followed.
May 2014 Brief decline only to 65-dma and
then rally..
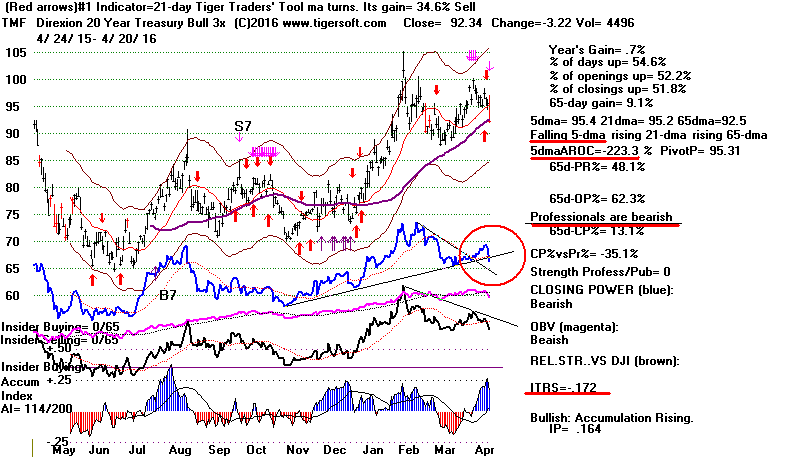 |
===========================================================================
4-19-2016
The operative Peerless signal remains a Buy B19.
The
NYSE A/D Line has made
another new high far ahead
of the
DJI, So has
DIA's Closing Power.
Yesterday, I
highlighted the bullishness of 0% interest rates
offered by European banks for what
could be a good long
while. Let me ask, what's to deny
US banks borrowing
from European banks for a small
amount more? And what
now prevents US banks from using
this money to either buy
stocks themselves or from making
margin loans to their best
customers at very low rates to buy
stocks? If the answer
is very little, then 0% European
rates are much like a cut in the
US Discount Rate.
What has happened in the past when
the FED cut the Discount
Rate in a Bull Market? With three
exceptions, the market
has always gone up to new highs.
Sometimes, it went much higher.
Recently I have
underscored the bullish outcome for two years
of the Discount Rate cuts in July
and August 1927, when the
DJI was also close to making an
all-time high. But there
are many other instances where the
DJI danced higher to
the tune of a Discount Rate cut in
an on-going bull market.
The pattern's bullishness is
difficult not to appreciate when we
see what happened in the past when
the FED was very generous
with funds in an extant bull market.
http://tigersoft.com/Tiger-Blogs/8-18-2003/index.htm
May 1954 -
bull market lasted until 1957.
April 7, 1967 - bull market until
10% correction after Sept. peak.
August 3, 1968 - DJI only tested over-head resistance in December.
May 16, 1975 - more new highs for
two more months.
Jan 19, 1976 - big January
take-off and rally until Summer.
November 1976 - DJI only tested over-head resistance
July 28, 1980 - DJI peaked with
Election of Reagan.
May 24, 1985 - DJI rallied
strongly for another year.
March 7, 1986 - DJI rallied to
new highs for another 3 months.
April 30, 1991 -
DJI
rallied until January 1994 intermediate-term peak
September 13, 1991 -
DJI
rallied until January 1994 peak
November 6, 1991 -
DJI
rallied until January 1994 peak
December 20, 1991 -
DJI
rallied until January 1994 peak
April 2,
1992 - DJI rallied until January 1994 peak.
January 31, 1996 - Powerful bull
market.
November 1998 - DJI rallied until
Summer of 1999.
Sept 18, 2007 - DJI kept falling
QUICKSilver
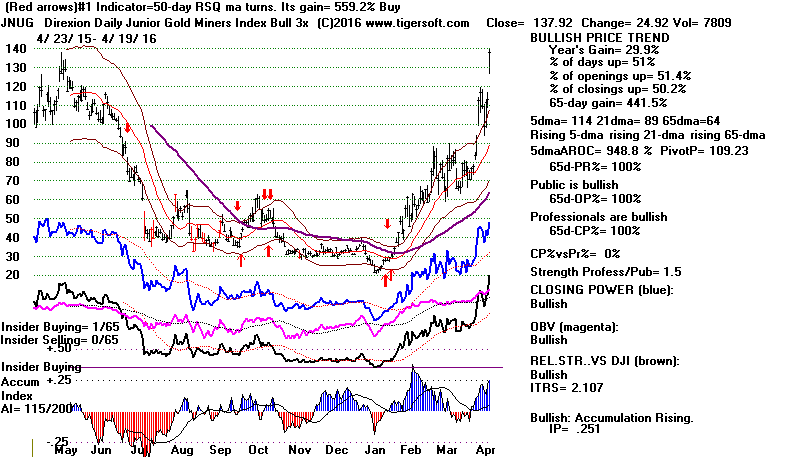
The Four Horsemen of The New Inflation
With EUROs
now borrow-able very cheaply,
Gold
and
Silver are rising very
fast. Perhaps, much too
powerfully, if the US Fed
decides to break away from
its own cheap money policies.
For now, the rush into
mining stocks is the hottest
game in town. Until we
see clear signs of Professional
Selling, continue to be
represented in this group, as
well as Foreign ETFs,
especially
LBJ and
BRZU.
Oil and
Gas Stocks have
also turned around. Look at the
recent jump in
Commodities
generally. All we need now for a
complete reversal from our four
Horsemen, will
be for
YINN to get up past $16,
its overhead resistance,
just a few pennies higher.
=================================================================================
Personal Links
http://www.huppi.com/kangaroo/Timeline.htm#BackFed


