(C) 2014 William Schmidt, Ph.D.
--------------------------------------------------------------------------------------------------------
There are 6 types of signals in our software.
1) Peerless Automatic Buys and Sells
2) Judged Peerless Buys and Sells coupled with Automatic Technical Signals
3) Extreme Closing Power Divergence Warning Signals
4) Fixed Rule Technical Signals
5) User-Picked Signals
6) Optimized TigerSoft Signals
Which signals you will want to employ should depend
on how much you trade, your experience with technical indicators,
what you are trading and how important is the trend shown by
Professionals and TigerSoft Closing Power.
In addition, we should always be aware of the special nature
of the current market, noting in particular if there a
big difference between the behavior of speculative growth stocks,
the DJI-30 and defensive inter-rate driven vehicles
of investment. Normally the markets are in synch. When they
are not, we should take note and use more tools to discern
the differences in the markets. They cannot all be played
the same way.
1) Back-tested Automatic Peerless Signals.
These are the numbered B(uy) and S(ell) signals shown on the Peerless DJI chart
shown below.

These Peerless signals are derived from the Dow's theoretical high, low
and close as well as NYSE Advances, Declines, Up-Volume
and Down-Volume. Seasonality plays a big role, too. These
have been rigorously back-tested to 1928.
Different editions of Peerless have marginally changed the rules,
indicators and signals for the whole period from time to time.
We do keep learing new things. For example, the acquiring of
the data for 1929-1965 allowed us to see the importance of
the Presidential four-year cycle.
Despite the lessons that new makets offer, the Peerless basics
are the same as they were in 1981. It is these basic rules which
govern the the calling of major tops and bottoms.
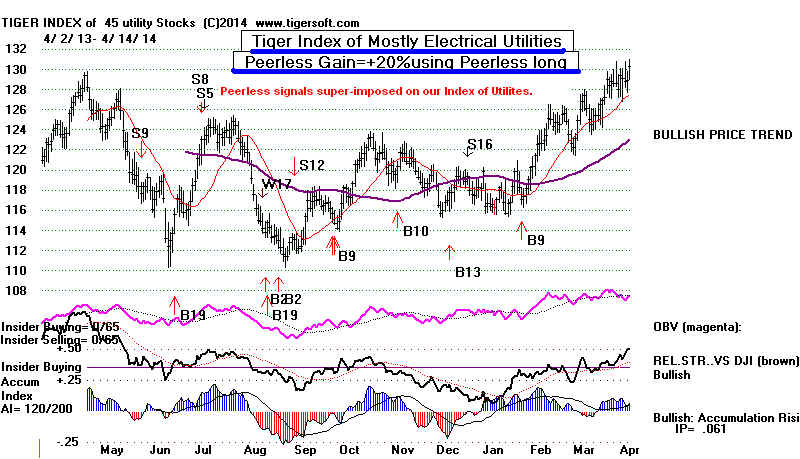
The Peerless signals are automatic abd saved into a history
file of signals. This allows them easily to be super-imposed on
all stock, ETF and mutual fund Tiger charts. See below
how they are super-imposed on defensive Electric Utility
stocks in March 2014.

Becuase most stocks rise and fall with the major moves of
the market and the DJIA, in particular, the Peerless automatic
Buys and Sell work very well most of the time with ETFs like DIA,
QQQ, SPY, IWM, TNA... There are numerous links on the
tigersoft.com page to this. See
http://www.tigersoftware.com/TigerBlogs/April-7-2010/index.html
They also work very well with most stocks. The Power Ranking
Program lets you quickly see how well the Peerless Buys and
Sells work with all the stocks in a directory for the time period
you are charting..
If you are trading financials, yhou should know that this is the group
that most closely corresponds with the general market whose
major trends Peerless effectively signal.
But Peerless Signals do have some limits. Commodities usually
have their own cycles. Thus, Gold, silver, copper and mining stocks
are not well-timed by Peerless because of their trends' low correlations
with the trends of the general market.
Underand another limitation. Peerless is an intermediate-term system.
It typically gives a reversing signal every 2-3 months. Short-term
swings in the DJI can move as much as 7% or 8% without
a Peerless signal.
--------------------------------------------------------------------------------------------------------------------------------------------------------
2) Judged Sells and Buys coupled with TigerSoft Sells and Buys.
We also have learned that certain price patterns are self-fulfulling
and historically have been very reliable predictors of events the
market has not expected. Whether or not Peerless has given
a Buy or Sell signal, these completed price patterns are worth
trading. In the past, there has always been a Tiger signal to
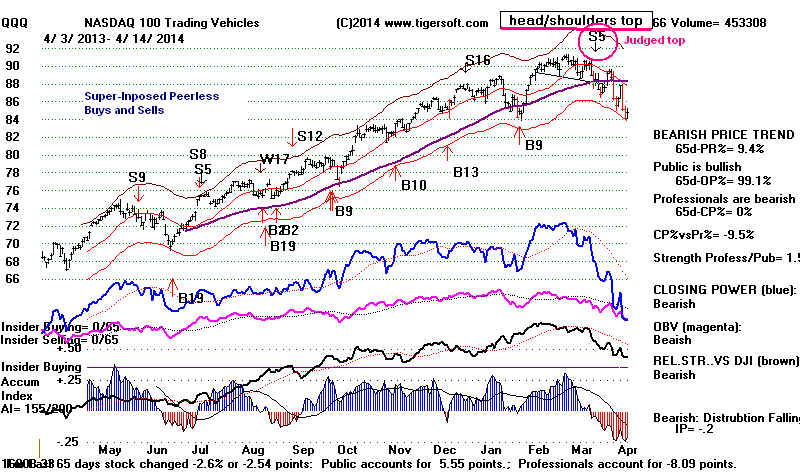
accompany these few judged Buys or Sells. For an example,
see the Sell S5 on the current QQQ chart below. The Sell S5
is a user requested signal. It confirms the completion of a key
chart pattern. Other examples appear in our Nightly Hotline
and in the new Peerless book when finished.

-----------------------------------------------------------------------------------------------------------------------------
3. Extreme Closing Power Divergence Signals
In addition, some stocks are too powerful or too weak to be
contained and controlled by the general market's cycles and momentum..
These are the special siutations we find with our Bullish and Bearish
MAXCP and MINCP approach.
Pink Sell S7s and red Sell S4s tell you when Closing Power is
diverging significantly from price. See the FAS and SPY charts below.


The more experience you have in trading, the more you may want
to trade short-term within the confines of the strategic Buys and
Sells of Peerless.
You will also want to take advantage of the signals and rules
that our Closing Power and Accumulation Index offer. Thus
big Closing Power divergences from price new highs or lows
followed by Closing Power trend-breaks are very important
supplements to Peerless.
You can both see these CP versus Price divergences on
Tiger charts and have the presence of these divergences
brought to your attention by Closing Power warning arrows
and signals. It is the breaking of the 65-day ma that
we usually use to take long and short positions in the
direction of the divergence.
-------------------------------------------------------------------------------------------------------------------------------------------------------
4. Fixed Rule Technical TigerSoft Signals

Tiger technical signals that show a particular technical condition.
Buy conditions: B1-B40. Sell conditions: S1 to S40.
Documentation on each signal is seen in the Help section of the
software.
With a stock chart on the screen use
Help (upper right) + Tiger Stock Signals Explained
See them also using the commands:
Peercomm + Older Charting + Help + Tiger Stock Signals Explained (7th Item down)
You should be able to do this with the command
Peercomm + Charts-2014 + Help + Tiger Stock Signals Explained (1st item down)
but I forgot to make it visible. So I will fix that and send you the link.
You can display groups of Tiger signals (type #3) by using all
the choices under Signals(1). I like to use
==> Stocks' Signals compatible with 65-dma.
And then place S6s and S9s on the chart using the next technique.
You can place a specific Tiger signal (#3) on the screen using the following command.
Signals(1) + Display User Selected Signal + your choice (B1-B37 or S1 - S37).
You may also design a set of signals, giving it a special name.
Use File + Build/Run User Defined Signals' Set +
+ Check the Tiger technical signals you want using the check boxes for each signal..
+ Enter in pink area at top right a 4-8 letter name for this set of signals.
(Example "BUYS", "SELLS", "STRONG". "DOWN". )
Then click "Save name".
You can apply the signals immediately. or you can put another
chart on the screen and then place this set of arrows on the chart
using the commands:
Signals(1) + Display User Defined Signals' Set (5th item down)
A bigger study of each of these signals should probably be done.
But it's hard to decide how exactly to do that. The signals are
based on generally accepted technical principles, though. And
users can define their own set of signals.
------------------------------------------------------------------------------------------------------------------------------------------------------------
5) User set signals with vertical arrow up or down
With a chart on the screen use the commands:
Lines + Vertical Line: User Set Buy B28/S28 +
Point the mouse at the place you want to see a signal.
Click the left mouse key.
Then enter B for a Buy or a Sl for a Sell or a Z for no arrow.
When you do a vertical arrow signal, the trading results will
reflect this added Buy or Sell. One might thereby put Buys
and Sells for each Closing Power trend-break.

http://www.tigersoft.com/7476/CPPCT-Inst/index.html
-----------------------------------------------------------------------------------------------------------------------------------------------------
6. Red automatic and optimized Signals.
(Also Blue Arrows for second best system...)
Documentation for TigerSoft Automatic and Optimized Signals.
Tigersoft calculates the best trading system from among 60 different
systems as a TigerSoft chart is displayed. Signals when the
5-day stochastic is the best system are typically the most helpful
and reliable as long as major price support or failure has not occurred.
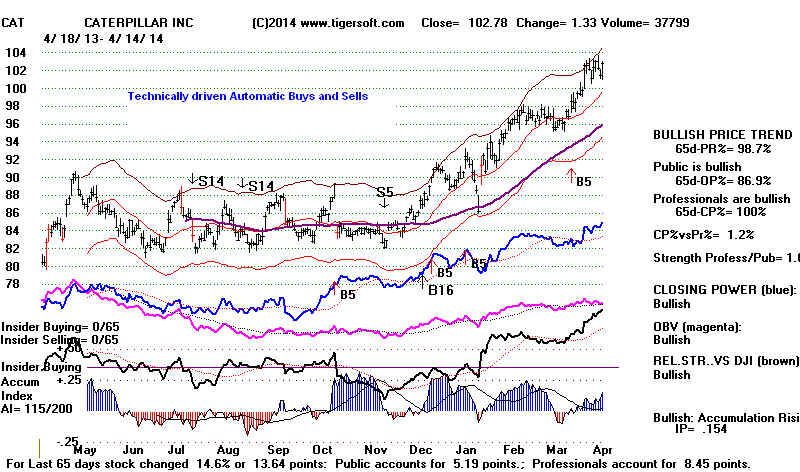
Here is an examples of a stock we would trade using the automatic system.
The best system is a Stochastic-5 and it has gained more than the
requisite 75% over the last year.
