HOW BEST TO USE
                TIGERSOFT AUTOMATIC and OPTIMIZED
                           BUY AND SELL SIGNALS

                            (C) 2013  William Schmidt, Ph.D.  www.tigersoft.com    6/16/2013

indcfvmnbdex.1.jpg (109055 bytes)
---------------------------------------------------------------------------------------------------------------------------------------------------

                In a flash, the computer calculates which are the best of 60 different trading system
                 for the stock you are displaying using TigerSoft.  They are often extremely profitable.
                
These Automatic Signals are Simple and often very Powerful and Profitable.

                 But we also need to establish some trading rules for using them. 
                 I would also factor in:
                    1)    new Peerless Buys and Sells,
                    2)    the trend of Closing Power,
                    3)    the levels of Accumulation and Relative Strength trends.  
                    4)    Price patterns and trends.
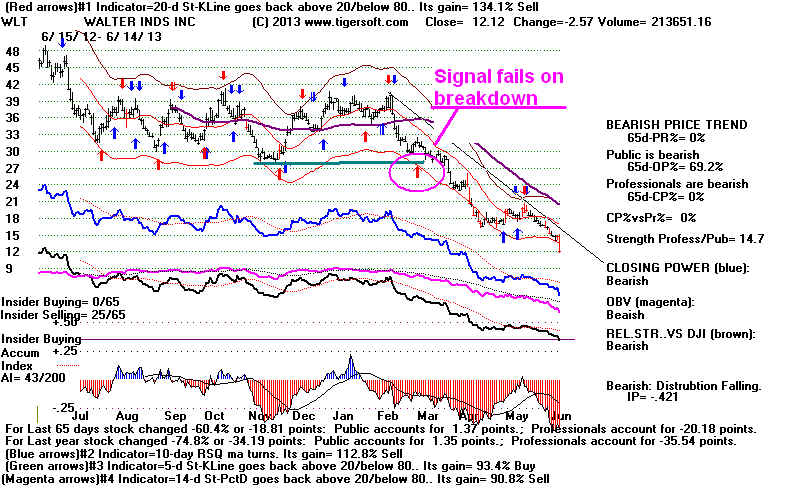
                                  Breakouts above well-tested resistance,
                                  Breakdowns below well-tested support,
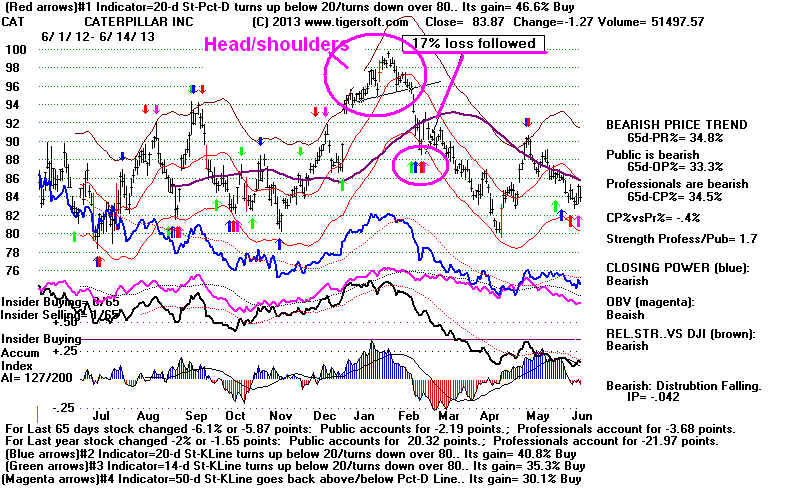
                                  Head/Shoulder Patterns
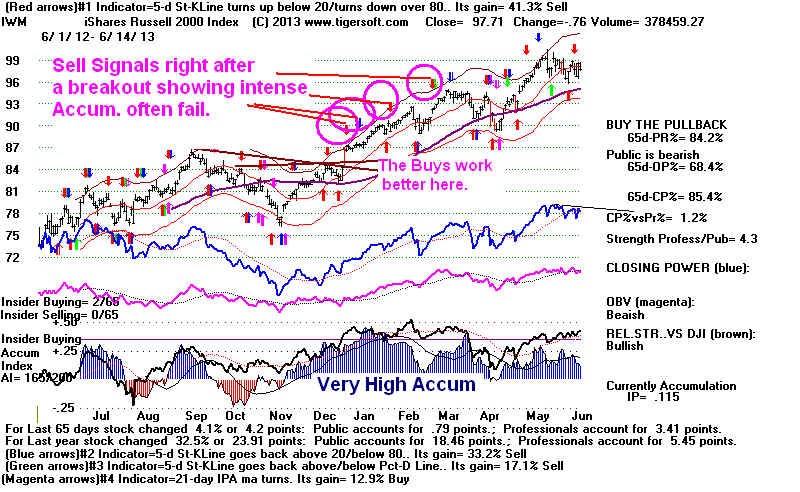
                                  Rising 65-dma is usually very good place to buy after bulge of Intense Accumulation.
                                  Falling 65-dma is usually very good place to short when Red Distribution is heavy.
                    5) How well a particular indicator works with a stock over a
                    long time is important.
                    6) Be cognizant of the signals produced by the 2nd, 3rd and 4th best systems
                   and not just the best system.  This will give more confidence and will reduce
                   some of the paper losses.
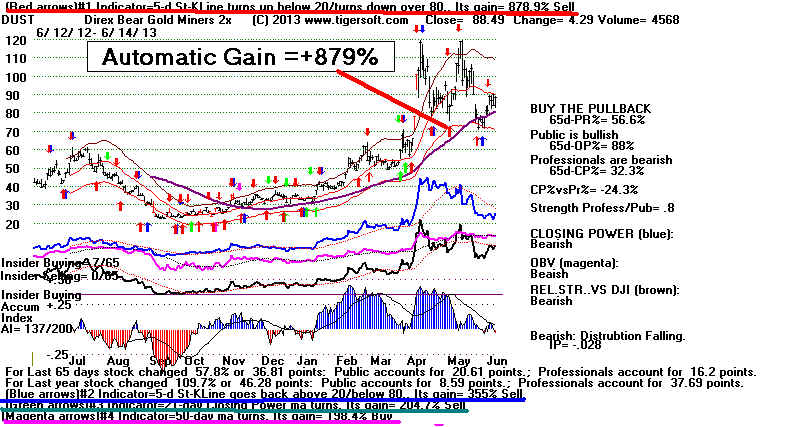

                          
                                DUST Case Study

                 With the ETF DUST (shown below), a simple 5-day Stochastic systemm all
                 by itself gained 872.7%. Using the next day's opening to trade would have gained
                 +804%.   There would have been 25 winning trades and 13 losing trades.  Unfortunately,
                 the biggest paper losses were very sizeable: 37.6% on long trades and 32.2%
                on short trades.  It is necessary to understand the limitations as well as the
                strengths of TigerSoft's aututmatic Buys and Sells.  There are many steps
                Tiger users can take to avoid such big paper losses.  This study shows
                 how find these very profitable trading situations and also how to limit paper losses.
               
Detailed DUST Case Study
                                    http://tigersoft.com/Automatic-Signals/DUST-CaseStudy/index.htm


DUST.BMP (1024854 bytes)

                  
----------------------------------------------------------------------------------------------------------------------------

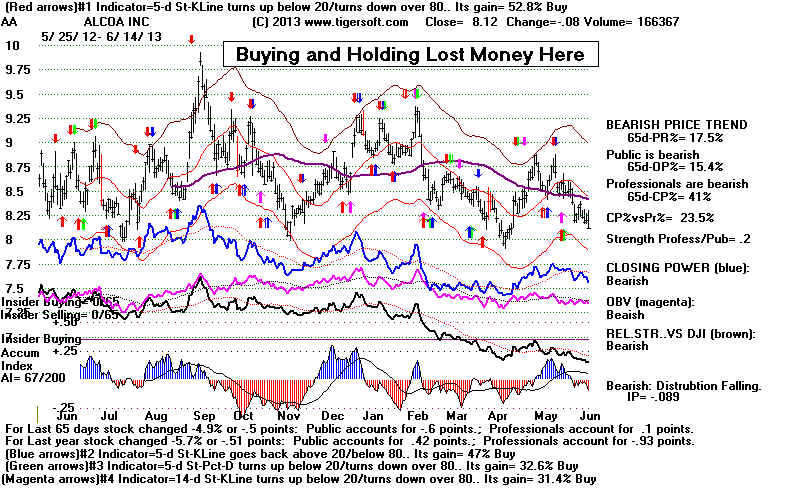
                                      Selling Options Is An Option.

                 Many times a stock is stuck in neutral.  Using the red automatic signals based on short
                 term stochastics can turn this situation around and make it profitable.  Options could
                 be written very profitably here. Sometimes, it is more profitable to trade on the next day's
                 opening can actually be more profitable.  That was true here by 5%.  In this situation, there
                 was no paper loss bigger than 9.8%.  There were 21 qinning trades and 7 losses.


AA.BMP (1188054 bytes)

----------------------------------------------------------------------------------------------------------------------------
                                                        The Best of The Best
        
         When a frequency distribution is done of the various best Tiger automatic systems, we
         consistently find that 5-day Stochastics  generally occur 3 times more than chance would
         allow.  With NASDAQ-100 stocks 29% of all the stocks trade best with one of the 5
         different 5-day Stochastics.  Among the Stochastic systems,  two occur more than 4x more
         than chance  would suggest.    See the separate study of The Frequency of the
        5-day Stochastics Being The Best Trading Systen from 1990-2013.  It reaches the same
         conclusion but  it does show there is considerable variation in their frequencies
         from year to year.  Even so these 2 Stochastic-5 systems still out performed chance
         in the worst years, 1995-1999, 2003 and 2008-2009.

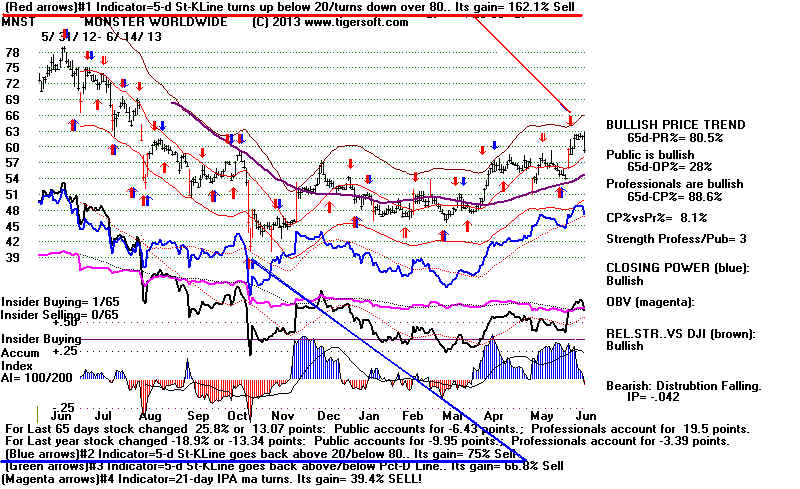
          By far the most commonly occurring best systems are:

                  1)     The 5-day K-Line turning up from below 20 or turning down from above 80.
                                5/30/12 - 6/14/2013     Pct of Cases   Probability of Being Best System
                                                      A stocks -   .0808
                                                      B stocks     .0736
                                                     
DJI stocks .10
                                                     
QQQ stocks  .1702
                                                     SP-500 stks  .105
                                                      chance           .0196

                   2)     the 5-day K-Line crossing the 5-day Pct-D
                             5/30/12 - 6/14/2013     Pct of Cases   Probability of Being Best System
                                                      A stocks -   .0727
                                                      B stocks     .0796
                                                      C stocks     .0763
                                                     
DJI stocks .10
                                                      QQQ stocks  .0744
                                                      SP-500 stks  .0903
                                                       chance           .0196

         Clearly the bigger the company, the more likely one of these two stochastics
         will be the best trading system.   That these numbers are so high in a market
         that is near its all-time high, shows their continuing power.
        
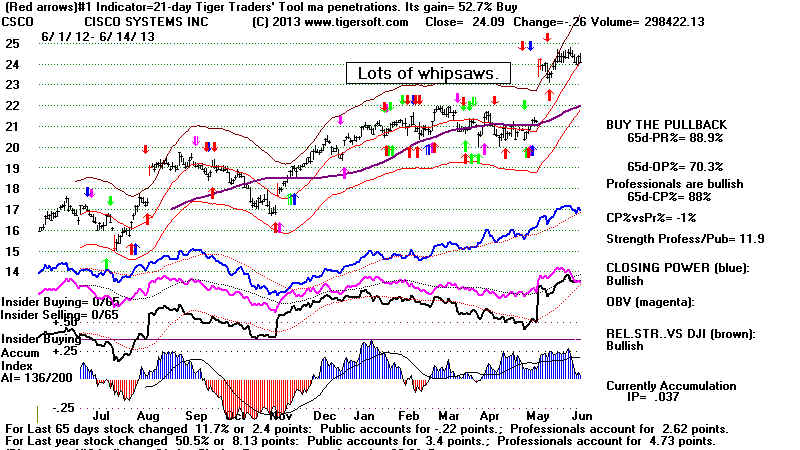
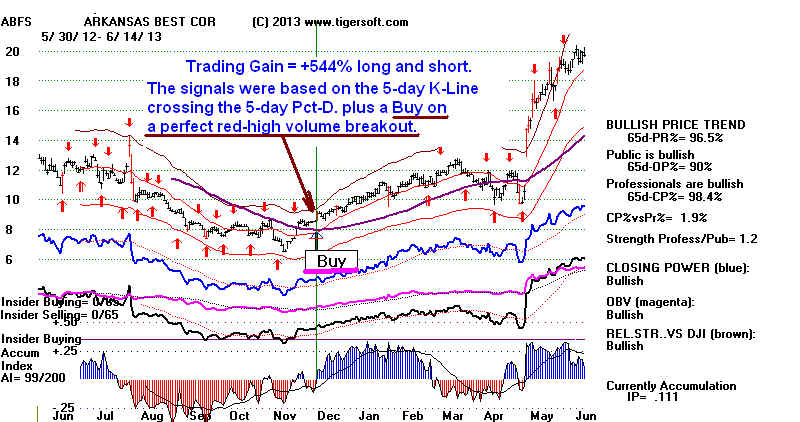
         A very good trading approach is to find a stock that trades well with one of these
         two systems and add to it some additional trading rules, such as "Buy on a breakout
         when prices close above a well-tested flat resistance and show red high volume
         to confirm the breakout.  Following such a modified system would have gained
         a whopping +544%  from 6/19/2012 to 6/14/2013.  See its chart below.
ABFS.BMP (1012854 bytes)

-----------------------------------------------------------------------------------------------------------------------------
                            
  wpe1AA.jpg (45235 bytes)    There are quite a few TigerSoft tools to let you find
                  and use the  best trading systems and their automatic signals.
                  Please read "Using TigerSoft To Get Most out of These Automatic Signals"
                      http://ww.tigersoft.comAutomatic-Signals/Start/index.htm


-----------------------------------------------------------------------------------------------------------------------------
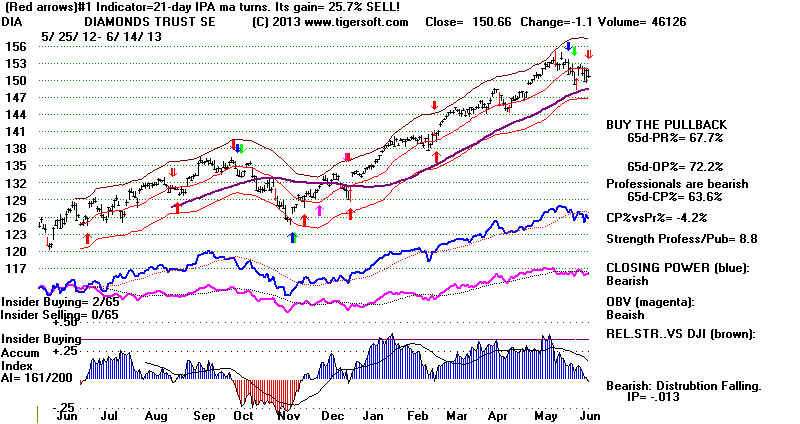
                                        There's Strength in Numbers
                  
                   Very often when there has not been a signal for a long time, the sudden appearance
                   of one or more signals, it a good alert to a reversal. See how the cluster of multiple
                   Sells
using the FOUR best trading systems together, caught the tops in DIA in
                   September 2012. The biggest paper loss here was  only 1.2% long
                   or short.  There were  9 winning trades and just 1 loss.  The gain was 34.6%.  
                   Note that the chart below displays the top 4 systems' signals.
                  
         
wpe581D.jpg (74938 bytes)
                         

                                A Quick Study of The Effectiveness of
        Using The Best Two Trading Systems' Automatic Signals


             You will want to do your own study of using more than just the Red #1 best system's
             Buy and Sell signals.  I am convinced that using the Red #1 and the Blue #2 signals
             together tends to produce a high return and may even prevent a larger paper loss.

MNST.BMP (1173654 bytes)

            A Quick Study of The Effectiveness of Using More Than Best System
                               8 Stocks Sampled between June 2008-June 2009
                                                         PL= paper loss
Stock    Best System  Best 2 Systems     Best 3 Systems   Best 4 Systems 
=========================================================================
5 QQQ STOCKS TAKEN RANDOMLY
ADBE        34.5%         46.1%           33.3%             37.0% 
wins/losses  2/0          8/1             25/9              25/13
Long PL     -6.6%         -7%             -4.4%              -4.4% 
Shrt PL     -0.7%         -3.8%           -10.1%            -10.1%
------------------------------------------------------------------------
ADI         22.4%         11.6%           12.4%             8.5% 
wins/losses  4/1          4/1             18/9              17/10
Long PL     -0.9%         -4.2%           -5.3%              -5.3% 
Shrt PL    -13.4%         -16.9%          -10.2%            -10.2%
------------------------------------------------------------------------
ADP         29.3%         31.9%           31.9%             23.11% 
wins/losses  3/0          5/2             5/2               9/10
Long PL     -1.1%         -1.8%           -1.8%             -4.0% 
Shrt PL     -1.8%         -1.8%           -1.8%             -2.0%
------------------------------------------------------------------------
AKAM        64.6%         64.6%          51.8%             53.11% 
wins/losses  7/4          7/4             9/5               9/7
Long PL     -10.3%        -10.3%          -10.3%             -9.5% 
Shrt PL     -14.7%        -14.7%          -17.6%            -17.6%
------------------------------------------------------------------------
ALTR        34.6%         64.6%          50.1%             53.11% 
wins/losses   3/0          7/4            10/6               9/7
Long PL      -1.6%        -10.3%          -1.9%             -9.5% 
Shrt PL      -4.1%        -14.7%          -6.7%            -17.6%
------------------------------------------------------------------------
                         3:1 improved     1:3 improved     0:5 improved
                         on just 1 sign.  on just 2 sign.  on just 2 sign

Stock    Best System  Best 2 Systems     Best 3 Systems   Best 4 Systems 
=========================================================================
HIGHEST ONE SYSTEM GAINERS IN QQQ

MNST       197.7%       197.7%           145.3%             145.3% 
wins/losses 25/7         25/7             27/9              27/9
Long PL    -16.2%        -16.2%          -13.8%             -10.5% 
Shrt PL    -26.7%        -26.7%          -26.7%             -8.8%
------------------------------------------------------------------------ 
EXPE       123.9%        134.7%           134.7%            134.7% 
wins/losses 24/7          25/7            25/7              25/7
Long PL     -6.1%         -6.1%           -6.1%               -6.1% 
Shrt PL    -14.7%        -14.7%           -14.7%             -14.7%
------------------------------------------------------------------------
CERN        98.7%        103.4%           62.7%             62.7%
wins/losses 26/7          27/7            25/13             25/13
Long PL     -14%          -14%           -16.8%             -16.8%
Shrt         -7%           -7%            -7%                -7%
-----------------------------------------------------------------------
MU          85.7%         85.7%           80.7%            115.7% 
wins/losses 12/3          12/3            12/5              17/11
Long PL    -10.3%        -10.3%          -10.2%            -10.3% 
Shrt PL    -31.5%        -31.5%          -31.5%            -23.3%
------------------------------------------------------------------------ 
SNDK        83.2%         93.4%           60.7%             53.7% 
wins/losses 27/8          28/8            28/8              26/10
Long PL     -4.5%         -4.5%          -11.3%            -11.3% 
Shrt PL    -12.4%        -12.4%          -12.4%            -12.4%
------------------------------------------------------------------------

                         3:0 improved     0:4 improved      1:3 improved 
                         on just 1 sign.  on just 2 sign.    on just 2 sign.


-------------------------------------------------------------------------------------------------------------------------------
                          

                             But There are Disadvantages To These Automatic Signals. 
                             It is best to know them, too, so that we can limit losses,
                             whipsaws and confusion.

                             - There is an element of
carpiciousness to the signals.  They are
                                based only on the 12 months of the present chart.  A different
                                12 months often shows a different best system.  In fact, every month
                                 when 20 days are lopped off from the beginning of the data as
                                 the number of records is reduced from the 270 maximum back
                                 to 250, the signals can sometimes change.
  
                             - Focusing on just the automatic signals may mean less attention
                               is given to a stocks' internals. 
Examples: Do not heed automatic buys
                               on the new Bearish MINCP stocks just after they breakdown.
                               Use the Closing Power trend to determine when to cover.  Do not
                               heed automatic sells on the new Bullish MAXCP stocks breaking
                               out.   Use the Closing Power trend-breaks, the 65-dma or the
                               completed top patterns to decide when to Sell.


WLT.BMP (1180854 bytes)

                             - The signals do not take into account chart patterns, breakouts,
                                breakdowns or the general market's conditions
.   This must
                                be appreciated.


                                Studying the SPY charts since 1993 shows the variable success
                                of the Stochastic-5 K-Line signals.  But consistently, the results
                                are improved if you disallow certain Stochastic Buys and Sells,
                                such as after a breakout. breakdown, either past well tested horizontal
                                or diagonal support/resistance.

                                Another example: The biggest loss in CAT in 2012-2013 owed
                                to the non-recognition of an obvious head/shoulders top.

wpe1A.jpg (102759 bytes)

                                See below how the Sells in January 2013 ignore the bulging Accumulation
                                Index in the January take-off in IWM.  Of course, the 4-best systems
                                together gained 39.7% despite this.      

IWM.BMP (1180854 bytes)       

                              - Buys and Sells based on a trending system can whipsaw a lot
                                before the big move.  See all the whipsaws in CSCO's chart.
                                Eventually a big move does occur.  And this is what makes the
                                optimum system profitable.

wpe1C.jpg (86650 bytes)


                              - If the best trading system has gained a lot more than the second best
                                trading system, it may be some time before the second system can
                                over-take the best system.  In that time, the losses could become
                                substantial.

                              - The paper losses are sometimes very big if one follows the signals
                                 mechanically.   The size of the paper losses can often be reduced
                                if you use the top 4 trading systems instead of only the top system.


                        What happens if you blindly Follow the best system's signals?
                        Please read "Optimized Signals: Case Study of SSRI"
                                    http://www.tigersoft.com/SSRI/
                            
                        I have tried to set out "Rules for Using the Automatic Signals"
                        and I have applied them to ADBE in a Case Study of a month's
                        trading in 2007
                                    http://www.tigersoft.com/Automatic-Signals/ADBE2007.htm