TigerSoft Hotline
(C) 2016 William Schmidt, Ph.D.
www.tigersoft.com
william_schmidt@hotmail.com

Current Address -
www.tigersoft.com/64HRL/INDEX.html
Previous Address -
www.tigersoft.com/55HL55/INDEX.html
----->
IMPORTANT NOTICE <-----
The market will be closed on July 4th. There will be a
hotline posted that evening for Tuesday's trading. A brief
hotline will be posted here tomorrow evening for Friday.
WE ARE MOVING
The address for this Hotline will be changed this weekend.
You should get a new address this weekend to be used
Sunday. If you do not, email me or look in your Junk folder.
----->
Suggestion <-----
A number of your email accounts are putting emails from me
using william_schmidt@hotmail into
the Junker folder. Please
"be-friend" an email from me so that you promptly get change
of address information regarding new Hotline links.
-----------------------------------------------------------------------------------------------------------------
HELP
A
Guide To Profitably Using The Tiger Nightly HOTLINE
Introduction
to Tiger/Peerless Buys and Sells.
Peerless
Buy and Sell Signals: 1928-2016
Individual Peerless signals explained:
http://tigersoftware.com/PeerlessStudies/Signals-Res/index.htm
http://www.tigersoft.com/PeerInst-2012-2013/
Explanation of each Peerless signal.
http://www.tigersoft.com/PeerInst-2012-2013/
Different
Types of TigerSoft/Peerless CHARTS, Signals and Indicators
Peerless Signals and DJI
Charts - version 7/4/2013
1965
1965-6 1966
1966-7
1967
1967-8
1968
1968-9
1969
1969-70 1970
1970-1
1971
1971-2 1972
1972-3
1973 1973-4
1974
1974-5 1975
1975-6
1976 1976-7
1977
1977-1978
1978
1978-79
1979
1979-80
1980
1980-1
1981
1981-2
1982
1982-1983
1983 1983-1984
1984
1984-1985
1985
1985-1986
1986
1986-1987
1987
1987-8
1988
1988-9 1989
1989-90
1990
1990-1 1991
1991-2
1992
1992-3
1993
1993-4
1994
1994-5
1995
1995-1996 1996
1996-7
1997
1997-8 1998
1998-1999
1999
1999-2000
2000
2000-1 2001
2001-2
2002
2002-3
2003
2003-4
2004
2004-5
2005 2005-6
2006
2006-7
2007
2007-8
2008
2008-9
2009
2009-10
2010
2010-11
2011
2011-12
2012
2012-2013
Documentation for
TigerSoft Automatic and Optimized Signals.
How reliable
support is the DJI's rising 200-day ma?
SPY
Charts since 1994: Advisory Closing Power S7s, Accum. Index, 65-dma, Optimized
Signals.
Previous Hotlines -
www.tigersoft.com/55HL55/INDEX.html
^^^^^^^^^^^^^^^^^^^^^^^^^^^^^^^^^^^^^^^^^^^^^^^^
1/19/2016
--->
Corrections,Deeper Declines and Bear Markets since 1945.
1/21/2016
--->
High Velocity Declines since 1929
2/12/2016 --->
Presidential Elections Years and Bullish IP21 Positive Non-Confirmations at
Lower Band.
2/12/2016 --->
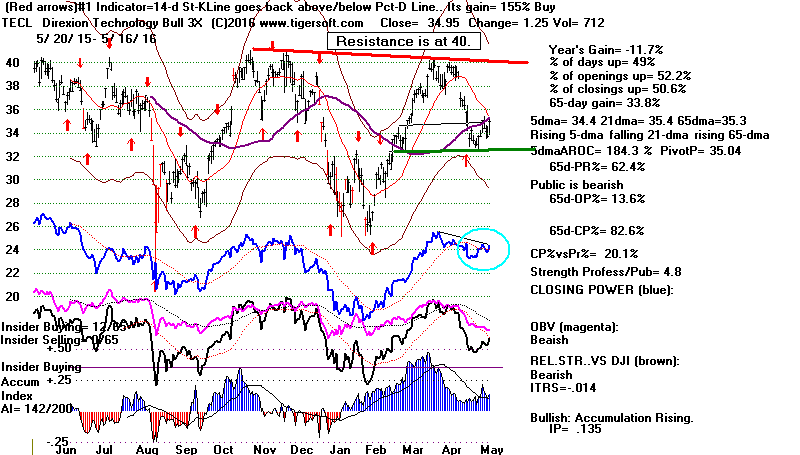
OBV NNCs on
DJI's Rally to 2.7% Upper Band when DJI's 65-dma is falling.
Earlier
Q-Answers
New
QuickSilver Documentation
(1/11/2016)
Our Different Signals
Better
understand the difference between Peerless DJI-based signals,
the one-year optimized red Signals and
the fixed signals based
on technical developments.
Introduction to
Tiger/Peerless Buys and Sells.
Different Types of TigerSoft/Peerless CHARTS, Signals and Indicators
===================================================================================
Peerless/TigerSoft Hotlines and Links
6/30/2016 The operative signals now are
Buy B3,
Buy B19 and
Buy B20. .
Relax and enjoy
the rally. CVX (our Tahiti
stock), UCO,
BRZU and
the ETFs on RED buys have done
quite well. Some of these ETFs
have reached over-sold status. If they give red Sells tomorrow, I
would take profits in them.
NYSE A/D Line made a 12-month high
ahead of the DJI. The FED is probably on hold
and US bonds and utilities look like a good place
to park EUROs and POUND in light of
continuing weakness in both.
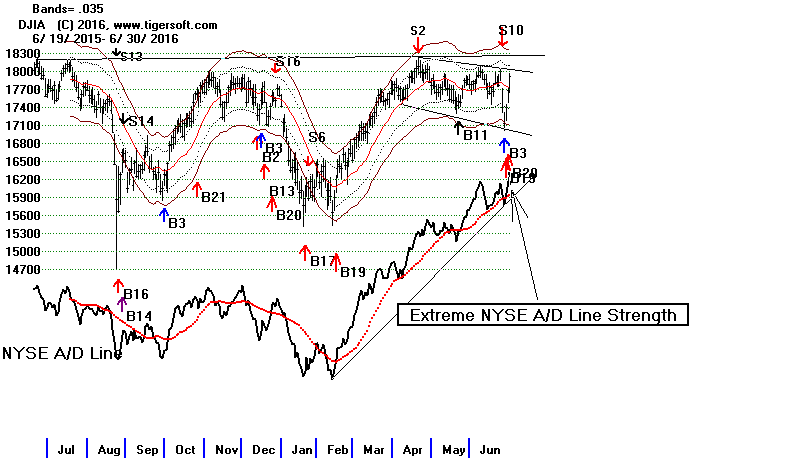
Super Breadth: US Stocks Are The Place To Be, Apparently
and The FED will do its best to boost the market for the
remainder of this Presidential Election Year, With July
will come the historical possibility of a DJI new high, as
in 1964 and 1980.
The ratio of NYSE advancers to decliners was better than 3.75 today.
Tuesday and Wednesday this week, this ratio was above 5:1. Three
such consecutive good days has not occurred since 1950. It has only
been seen on seven earlier occasions. In each case the DJI rose at least
10% more over the next 4 to 16 weeks. Only twice (2/7 or 28.6%) was
there a retest of the lower band before the big rally. The risk:reward
ratio
now looks quite favorable. Continue to hold long positions and phase
out most short sales, especially those whose Closing Power breaks above
its downtrendline.
Earlier Cases of 3-StraightExtremely
Good Breadth Days
10/25/1934
Pullback but 18% rally in 2 months.
6/ /1938
No pullback. 12% rally in one month.
9/ /1938 Pullback
and then 12% rally in six weeks.
9/30/1938
No pullback.
and 10% rally in six weeks.
8/27/1945 No
pullback. and 14% rally in 14 weeks.
7/ /1950
Shallow pullback and 10% rally in 4 months
11/9/1950
Shallow pullback and 10% rally in 3 months
Charts: Peerless
DJIA Hourly DJIA
DIA
SPY
QQQ IWM
DJI-Utilities
DJI-Rails
A/D Line-6000 Stocks
Crude Oil
SOXL TECL
Major Indexes and A/D Lines.
Key Tiger
Software ETF Charts
Bullish MAXCPs
Bearish MINCPs
Charts of Key ETFs


"FAST-FIVERS"
(See discussion of last night for background.)
The graphs linked to here are not updated.
Gain 5-day K Tomorrow?
OKS Buy
246% 79
No sell possible tomorrow.
DZK Buy
232% 96
Sell possible. +1.29 today
AKBA Sell
209% 61
No buy is possible...
SLCA Buy
202% 91
Sell possible. +.27 today
EWU Buy
154% 98
Sell possible. +.40 today
IPGP Buy 143%
39 No sell is possible...
CXO Buy
115% 39
No sell is possible....
ITT Buy 115%
36 No sell is possible....
CRZO Buy
112%
DO Buy
124% 60
No sell possible...
GMT Buy
110% 61 No
sell possible...
/
VRTX Buy
107% 91
Sell possible tomorrow +1.02
ATW Buy
102% 86
Sell possible tomorrow +.12
SAN Buy
93% 97
Sell possible. +.03 today
ERX Buy 106%
100 Sell likely tomorrow
+.77
BEAV Buy
90% 70
No Sell possible...
FAS Buy
85% 100
Sell likely tomorrow +.94
TGA Buy
75% 67 No Sell
possible
MA Buy 64%
8 No sell possible -4.07
MSFT Buy
48% 96
Sell possible... +.63
JPM Buy
44% 99
Sell possible ... +.94
---------------------------------------------------------------
Totals
20 red Buys 1 red Sell
8 could give Red Sells if their 5-dy Stoch.K-Line falls tomorrow.
2 have a K-Line value of 100. K-Line will fall unless they show
extreme strength and close at day's high. With these, I think
I would wait an additional day.
===================================================================================
6/29/2016 Now we have
a Peerless Buy B3, B19 and B20.
We're rollin'.
Volume could be better, but breadth could not get much better. We even
got a momentum based Peerless Buy B20 today. (Explanation
in next
hotline.) The DJI closed just a little under its 65-dma.
Tomorrow it should
make a valiant attempt to get past 17700. That would be impressive.
It would be
a big shock to all the "gloom and doomers". Let's see if the DJI can reach
18000
this week.
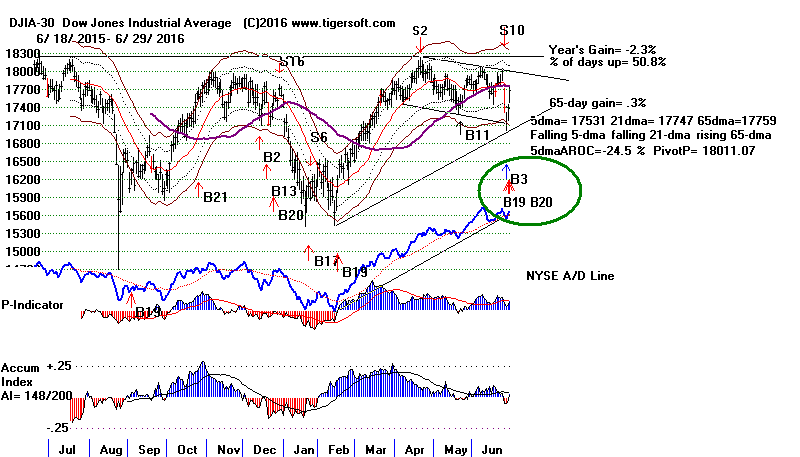
DIA: A false breakdown below 174?
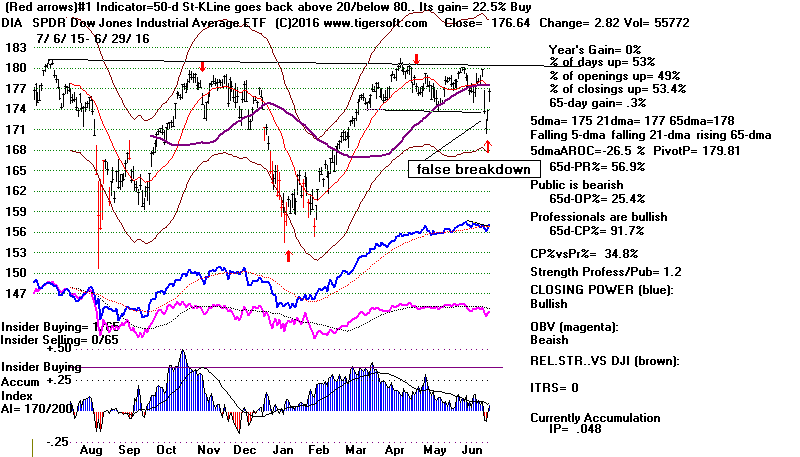
The operative signals now are
Buy B3,
Buy B19 and Buy B20.
Relax and enjoy
the rally. CVX, UCO,
BRZU and new ETFs on RED buys have done
well.
They have not given any new SELLs yet.
Charts: Peerless
DJIA Hourly DJIA
DIA
SPY
QQQ IWM
DJI-Utilities
DJI-Rails
A/D Line-6000 Stocks
Crude Oil
SOXL TECL
Major Indexes and A/D Lines.
Key Tiger
Software ETF Charts
Bullish MAXCPs
Bearish MINCPs
Charts of Key ETFs


"FAST-FIVERS"
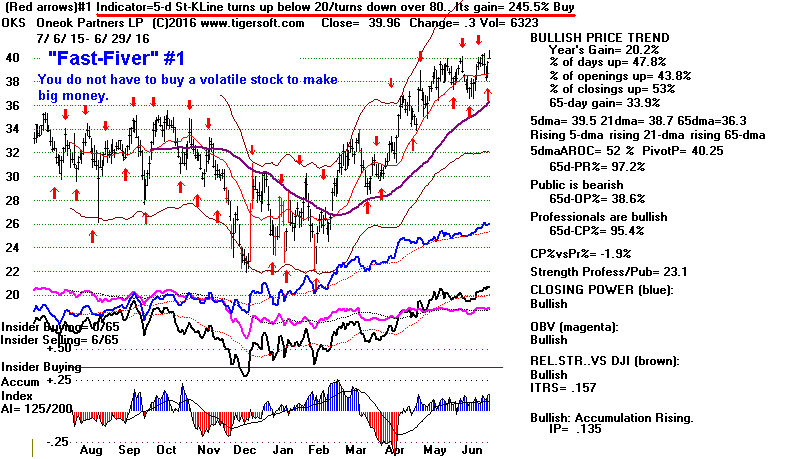
I created a group of "FAST-FIVERS" tonight. These are the stocks and
ETFs whose best trading system (the one shown with red arrows on the
Tiger charts) is based on Buys being given by the fast 5-day Stochastic K-Line
turning up from below 20 and on Sells being given when the 5-day Stochastic
K-Line turns down. There are 20 of them in my list, shown below.
Only 2 are
on sells. The red Buys and Sells are working very well on them, the
annual gains ranging
from 42% for JPM to 246% for OKS. They are in a self-perpetuating
groove.
I believe that it is the Professionals and Market Makers who are making these
stocks and ETFs trade so profitably (and predictably IF you know the
secret of the 5-day Stochastics.) These are very short-term signals.
Until
we get more Sells, we should see higher prices.
Time is short tonight, but I will show how to use this list more fully
on Thursday night.
OKS Buy
246%
DZK Buy
222%
AKBA Sell
211%
SLCA Buy
200%
EWU Buy
147%
CXO Buy
117%
ITT Buy
113%
CRZO Buy
112%
DO Buy
107%
GMT Buy
106%
VRTX Sell
104%
ATW Buy
102%
SAN Buy
92%
ERX Buy
86%
BEAV Buy
84%
FAS Buy
78%
TGA Buy
75%
MA Buy
71%
MSFT Buy
47%
JPM Buy
42%
How To Trade These on The Day of The Signal
Most of these move quickly away from a Buy or Sell. Often the opening the
day after the signal is a good ways from previous day's close. You can
trade these
on the day of the signal just before the close if you test what you think is a
good
guess about what will be the day's opening, high, low, close and volume.
Use these commands: Peercomm + Older Charting + Daily Stocks + symbol.
Then when graph appears, use the Operations pull-down menu and choose
Rechart Using Tentative Day's Data. This will show you if you do will get a new
Buy or Sell that night. Note this method is for seeing stocks and ETFs
using
TigerSoft indicators and signals, and note, too, the data you've entered is only
temporarily stored. When you leave this operation, it is gone.
To see whether Peerless will give you a new major market signal in the minutes
before the close use PEECOMM + EDIT + Peerless Indexes + Peerless-DJI +
Append. Enter the provisional/tentative data. Save it. Chart
the DJI and then
place the Major Buys and Sells on it. When you download the night's data
from or website, it will be replaced.
==============================================================================
6/28/2016 Today brought a classical reversal upwards.
Whereas Monday the
DJI fell 260 on poor breadth (1937 more down than up), today it gapped up
and rallied up off the Friday's lower band. Once again it was
"turn-around" Tuesday
after an emotional selling climax on Monday. The ratio of NYSE advancers
to decliners today was a bullish 5.71:1. And impressively, the DJI surged
at the end of the day as mutual fund managers jumped in
for fear of missing
another rally to 18000.
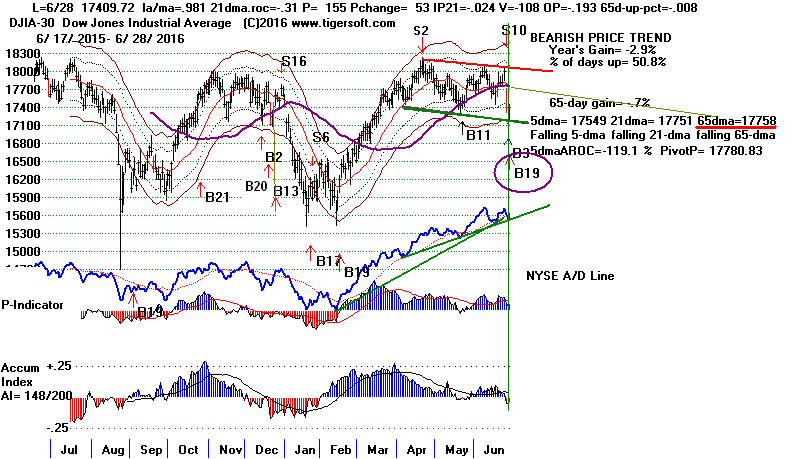
A rally to the DJI's 65-dma, at the least, is strongly suggested by the history
of such
reversal days, by the earlier emotional selling induced by the unending barrage of
bearish
commentary on TV stations about the consequences of BREXIT
and by the bullish pre-July Fourth seasonality.
After this week, if volume does not
increase a lot, a retest of 17000 seems likely
given the historical finding that 11
of the
earlier 19 Bull Market B19s showed a
paper loss of 1% to 4.9% before
eventually going higher.
It was a classic Buy B19 using Peerless. Below are the most relevant
historical Buy B19 statistics I can come up with here.
See
the full comments here:
BUY B19
B19s occur after a sharp decline when the DJI suddenly rallies and shows a ratio
of advances
to declines more than 3:1 and up volume to down volume of more than 4:1, whereas
on the
day before the reverse ratio of breadth was true. There are several
variations on Buy B19s,
but this is always their central feature.
B19s are reliable and moderately profitable. Their average gain is 5x
their average paper loss.
Considering all B19s, they are more than twice as likely to occur since 2000
as before. The advent of Computerized Program Trading probably is responsible.
The last nine B19s, from mid-2007 to present, have averaged only 4.6% gain.
Paper loss occurred only 25% of the time in the June B19s. The average
gain
was 8.4%. But the average B19 gain was only 6.1% is an on-going Bull
Market.
June Buy B19s:
Gain Paper Loss
19650630 B19
868.04 .135 None
Correction
19670601 B19
864.98 .075
.02
Bull Market
19741007 B19
607.56 .078
None Bear Market
20130625 B19 14760.31
.048 None
Bull Market
-----------------------------------------------------------------------
.084 .025
11 of the 19 Bull Market B19s showed a paper loss of 1%
to 4.9%.
Election Year Bull Market B19s showed only modest 4% additional gains in DJI
at time of next Peerless Sell.
800930
B19 932.42
.058
.016
Late in Election year. DJI got back above 65-dma in a week but only made
nominal new high.
040312
B19 10240.08
.031 .019
DJI got back above 65-dma in three days but only made a nominal new high.
120411
B19 12805.39
.037 none
DJI got back above 65-dma in a week and went to new high at upper band.
--------------------------------------------------------------------------------------------------
No. = 3 Avg.Gain = .042
.012
.
Charts: Peerless
DJIA Hourly DJIA
DIA
SPY
QQQ IWM
DJI-Utilities
DJI-Rails
A/D Line-6000 Stocks
Crude Oil
SOXL TECL
Major Indexes and A/D Lines.
Key Tiger
Software ETF Charts
Bullish MAXCPs
Bearish MINCPs
Charts of Key ETFs
What To Buy?
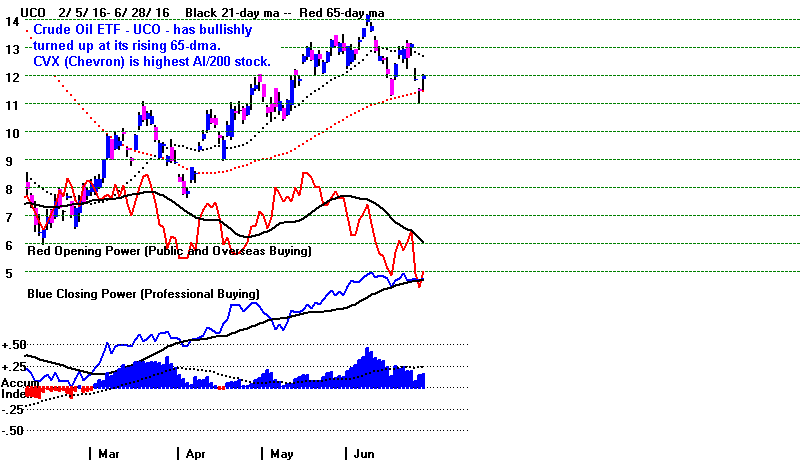
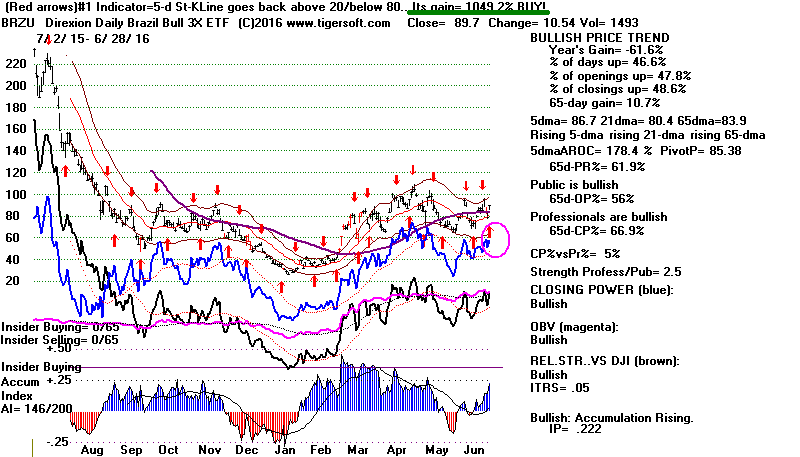
Besides bullish MAXCPs, buy UCO or CVX. BRZU is
trading especially well with its short-term Red Stochastics.
It's very hard to anticipate all the possibilities for the market
the next day here and provide a full list of contingencies.
My suggestion is run Tiger and see the red signals yourself.
You can put in dummy numbers before the close and get
both the Peerless and red Tiger signals so that they can be acted on
the day of the signal. We can get you all set up on a Fast
DELL XP laptop to make it even easier.
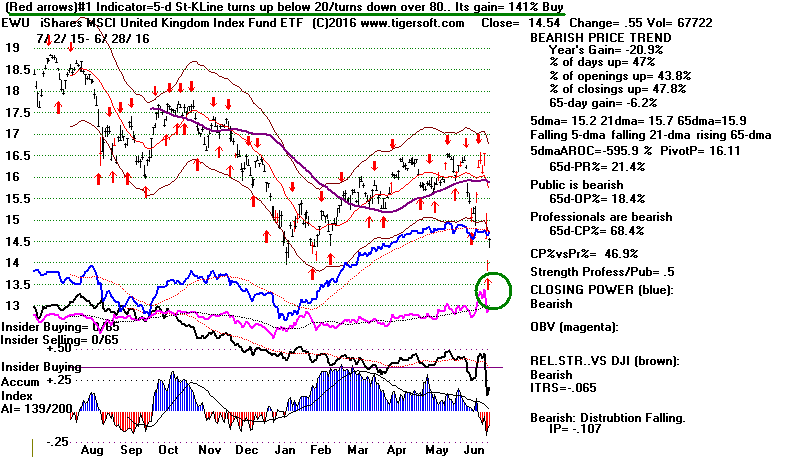
Example: Look at EWU (UK's ETF) below. Its Red Buys and Sells
are simply based on the 5-day Stochastic-Kline turning
up in oversold territory and turning down in the overbought
zone. They have gained more than 140% for the past year.
Seeing the red Buys and Sells shown here on your own
computer or with a little arithmetic before the close on
the day of the signal is very easy. There is always something
volatile that can be traded this way. If you do the calculations
by hand, know that the 5-day Stochastic K-Line is:
Let i = the current day,
Kline (i) = close (i)- 5day low / (high of last 5 days - low of last 5 days).
Clearly, EWU is being manipulated on this basis. This simple
system has gained 141% over the last year. That number drops
down to 105% if you use the next day's opening. Our software
assumes $10,000 is traded continually long and then short. A
charge of $40 per round trip trade is further assumed.
I will post a list of volatile stocks with similar optimized red 5-day
K-Line systems. Of course, they work best when Peerless gives
a good signal and when there is other technical support or resistance
shown.
===================================================================================
6/27/2016 The DJI has closed 3.6% below the 21-day ma.
The P-Indicator remains positive.
The Accum. Index is only slightly negative. This has given us a
New Reversing Buy B3.
Now we get to see how much of the overhead resistance the first rally up can eat
up.
For SPY and
DIA, I suspect the resistance on this rally will be the broken 65-dma.
The biggest negative here is how fast the DJI fell back to the lower band.
More than
5% in just 2 trading days. I suggest this owes especially to the unusually
bearish mass media
coverage of BREXIT and its fallout. For now, this has left stocks in
"strong hands"
and a rally is starting. Surely, so much pessimism invites a quick DJI
rally back
to its 65-dma. resistance. Seasonality is bullish enough. As long as
the Bank of England
does not raise its Minimum Lending Rate to protect the plunging Pound, I would
not be
short the major Indexes. This may be coming. But not immediately. I
did notice today
that the Chancellor of the Exchequer is starting to grease the skids for a rate
hike. He
announced that big cuts in spending and higher taxes are now necessary.

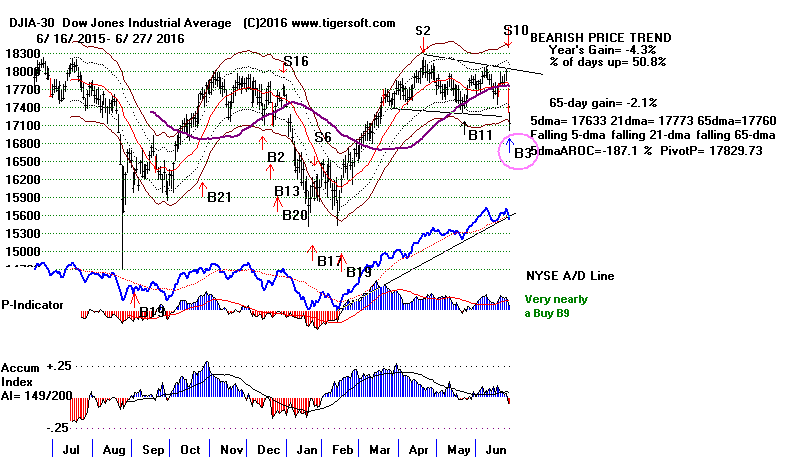
New Reversing Buy B3.
It tells us that the DJI's 20-day Stochastic is very oversold
and the internals (P-I and IP21) show more internal strength than the
price action does. It is not coded to preclude cases where the DJI has
has fallen 5% in two days, as we have here. Still, I think we can do well
here with the Bullish MAXCPs. I doubt if the Bearish MINCPs will
rally much. So, you can also stay hedged, if you like.
This is a highly reliable signal. Here it does not preclude an additional
paper loss
of 1.3% to 3.3%. But the gains are substantially greater than the paper
losses.
There is only one case where the DJI was down right before the
Buy B3 like we have just seen here. That was in November 1948. It
did bring
more paper losses after a quick failed rally. But it eventually was
profitable..
I think we have to be bullish unless the Hourly DJI's OBV Line starts again
showing tell-tale weakness. The main reason is that I have never heard
such
non-stop unadulterated fear-mongering about BREXIT by TV's talking heads.
All this nonsense has undoubtedly have put stocks in "strong hands". I
feel very
uncomfortable being short DIA or SPY when the talking heads are so bearish.
.
Seasonality is now more bullish as we go into the period around July 4th.
Since
1965, the DJI has risen 61% of the time over the next 3 trading days. It
then flattens out. But it is up 63% over the next 10 trading days.
The DJI futures are up 200 points as I write this. It looks like the DJI
is
ready to rally up to its 65-dma at 17700. That would be consistent with
the bullish seasonality up to the July 4th holiday. After that, more
probing for a
bottom near 17000 seems very likely, but this should produce a bottom.
I think we have to take this Buy Signal. But until the DJI's openings stop
being so
far away from the previous closes, consider Buying the best of the
MAXCPs
and hedge by shorting the weakest of the
Bearish MINCPs. Look also at the
ETFs traded best with short-term Stochastics. Those whose Buys and Sells
are dependent on a 5-day Stochastic-K-Line can be traded at the close for
the day of the signal if you do a little arithmetic or use Tiger's older
Peerless
to put in hypothetical data. See EWU (UK)
for example.
Here are some facts about the 25 instances of Buy B3s since 1928.
12/25 or 48% brought gains of more than 10%
6/25 brought gains of more than 5%
7/25 brought gains of less than 5%
No losses.
10/25 or 40% brought paper losses between 1.2% and 3.3%
Presidential Election Year B11 Results
11/24/1948 12.7% gain 1.5% paper loss
- closest parallel.
7/22/1960 4.0% gain 1.3% paper loss
10/8/1976 3.4% gain 3.0% paper loss
10/7/1992 11.4% gain 0.4% paper loss
7/23/1996 6.7% gain No paper
loss
6/4/2012 12.2% gain No paper
loss
---------------------------------------------
AVG 6 cases 8.3% gain 0.8% paper loss
4 Junes average gain of 10% in 4 cases. No Paper losses.
The links below will be posted later than usual
tonight.
Charts: Peerless
DJIA Hourly DJIA
DIA
SPY
QQQ IWM
DJI-Utilities
DJI-Rails
A/D Line-6000 Stocks
Crude Oil
SOXL TECL
Major Indexes and A/D Lines.
Key Tiger
Software ETF Charts
Bullish MAXCPs
Bearish MINCPs
Charts of Key ETFs
The media's fear-mongering is not going to quickly stop. CNN, in
particular, is closely
tied to to the Big Banks and Multinationals. These are the folks who just
got a big dose
of how disaffected and alienated the British working class people are from the
rich and
powerful in the "City" and the "British Establishment". Look for
"belt-tightening" and
high interest rates to protect the Pound. These are measures aimed to
shore up
the "City" and the Pound, not bring more manufacturing jobs or better living
conditions.
All I wrote in my dissertation for Columbia University about Britain in the
1920s
seems to be repeating once again. Very sad.
See
http://tigersoftware.com/tigerblogs/83---2011/index.html
===================================================================================
6/24/2016 Friday's sell-off should be
considered a new
Peerless "Fail-Safe"
Sell S10. This is triggered when
when DJI drops 3.3% or more
in a single day, is still between lower 3% band
and 21-day ma,
and DJI is at or below its 65-dma.
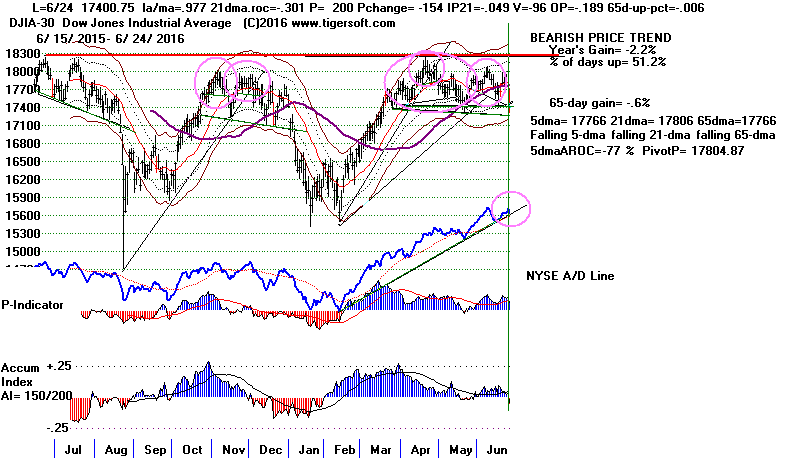
There have only been 4 or 5 cases in the
past, but one was
right before
the
1987 Crash and another occurred when Truman unexpectedly bear
Dewey in the Presidential Election of 1948. Each case would have been
profitable
for short
sellers, though the next opening was often down from
the close
for the day of the
failsafe Sell S10. This is also the only case
where this type
of Sell S10 reverses a previous Peerless Buy, but support
failure Sell S10s can reverse a previous buy signal.
Failsafe S10s
1. 11/3/1948 Truman's surprise - DJI fell from 182.5 to 171.2
2. 10/6/1987 Greenspan decides to raise rates - DJI fell from 2549
to 1739
3. 4/14/1988 DJI fell from 2085.64 to 1952.59
4. 11/6/2008 DJI fell from 8695.75 to 755229
Plus
10/9/1979.
(A revised Peerless showing this S10 will be posted on the ESP Page
tomorrow.)
What If The DJI Recovers from 17400?
17400-17500 is a well-tested zone of support. The DJI has not
yet closed below it. Perhaps, 17400
will hold. But I doubt it. The DJI
closed
Friday at its lows on
very high volume. This is exactly what happened
in August 2015
as the DJI came down to the support at 17000. The next day in
plunged downward, very quickly below 16000.
Of course, the FED might intervene and change the picture. But I would
expect them to save whatever monetary arrows they still have left in
their quiver - and they
don't have
many left now - for use when the DJI
reaches a more defensible support level,
like
15500-16000, rather use them
all up here near the old highs.
If it looks like 17400 is holding tomorrow, wait for a failed rally to
17500-17700
to go short. The broken 65-dma is up at 17700.
What To Do?
Be careful here. There seems to be very little support beneath
174 in the chart of DIA.
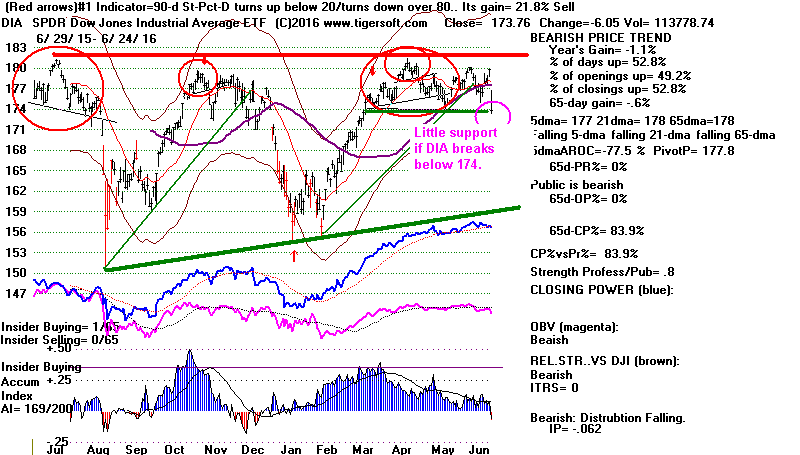
I had previously said not to buy DIA. Sell any of the
other long positions
if their rising Closing
Power trends are violated. Go
short
some of the
Bearish MINCP and near
17500 go short DIA. A decisive break of
174 by DIA would set up a dangerous situation. There is little support
underneath it.
Charts: Peerless
DJIA Hourly DJIA
DIA
SPY
QQQ IWM
DJI-Utilities
DJI-Rails
A/D Line-6000 Stocks
Crude Oil
SOXL TECL
Major Indexes and A/D Lines.
Key Tiger
Software ETF Charts
Bullish MAXCPs
Bearish MINCPs
Red Buys and Sells on major
ETFs
More Considerations
1) The DJI has now broken the 65-dma decisively
by a wide margin. That puts in serious doubt the validity
of the previous Buy B11 which is based on a decline to
the 65-dma support.
2) The past case that seems to be the closest parallel is when
everyone expected Dewey to defeat Truman in November
1948. The DJI then was also down sharply the day after the
Election.. There was a brief and weak recovery the following day,
but then the DJI declined for another month.
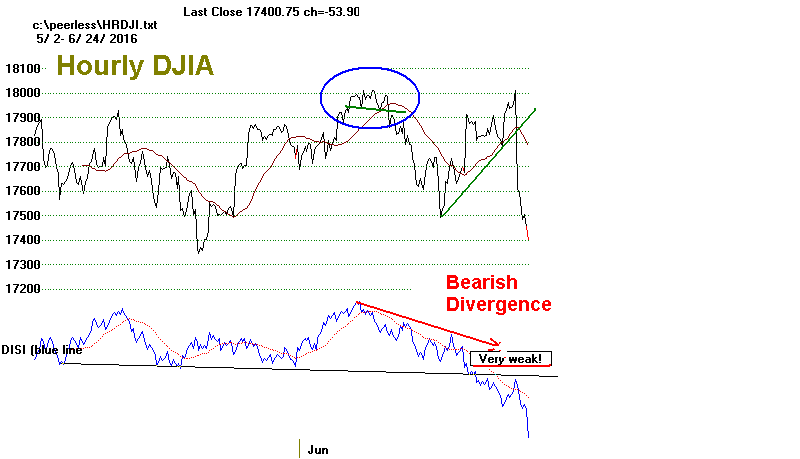
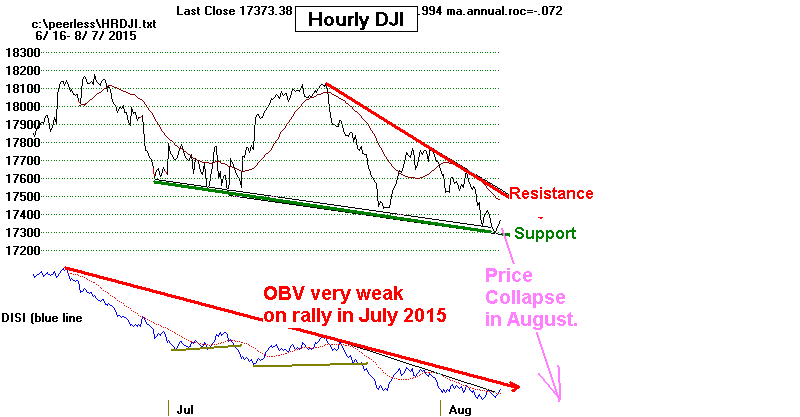
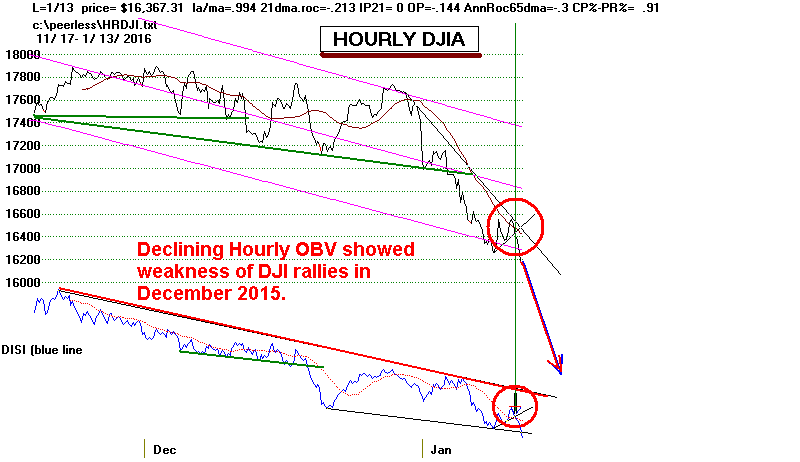
3) As
you know, the Hourly DISI/OBV was bearishly
making new
lows on the last few rallies by the DJI. This also happened just before
13.5% DJI declines in August 2015 and January 2016.
This pattern is definitely a warning we should heed.
|
 |
4.) We have also called your attention to the many
head/shoulders
patterns the DJI and DIA were
making. These were warning
us of significant distribution
and some impending bad news.
5) A number of the most bullish MAXCP Utilities, Water Utilities
and Bonds were up Friday, even making new highs. This is
a sign of how desperate "hot money" is to flee Britain
and the Euro, too. This trend will likely continue until there
is a better sense of the what the new European Community
will look like in the coming years. That may take quite
a while to clarify. Investors dislike uncertainties. I would think
Bonds and Gold should continue to rise. Utilities may, too.
6. Do not trust the Bank of England. They warned everyone
such a vote would be disastrous. Now they are in a position
to fulfill their "veiled threat". Expect them to protect the "City",
London's financial community, their main client. I expect
them to raise interest rates to defend the Pound. When they were
forced off the
Gold Standard in mid-September 1931, the Bank
of England then jumped their Lending Rate from 4.5% to 6.0%
on September 21.
Fed's Discount Rate
June
1.5%
Bank of England Lending Rate July 30 1931
4.5%
Bank of England Lending Rate Sept 21 1931
6.0%
Fed's Discount Rate
October
2.76%
Fed's Discount Rate
November
3.5%
http://www.bankofengland.co.uk/statistics/documents/rates/baserate.pdf
In response,
the
FED more than doubled their own rates in 6 weeks.
The Depression
got much worse. More Banks failed. Deflation.
24%
Unemployment in 1932. The stock market fell 50% more over next
8 months.
The US Government had no solutions in 1931. Only in 1932,
when Washington was invaded by armies
of Protestors, did the Federal
Government start taking responsibility for Relief and Unemployment.
7 The most positive thing I can think of now is how unanimously all
the
CNN talking-heads are about BREXIT being a terrible event for England
and the rest of the World. Since, they were so wrong about the likelihood
of BREXIT winning. I suspect that they will be just as wrong about how
dire BREXIT will be. Some will benefit. Some will be hurt.
The Big Banks will have to scramble now. They may even be paid back
in local currencies on the Sovereign Bonds they hold. London real estate
developers
will also be hurt. If the stock market does dive, that could
mean a break in our own urban real estate bubbles.
So, now we must watch to see how each country in Western Europe
reacts
and watch their ETFs. I think it may well turn out that the
European Community may have to allow individual currencies again.
I think what is most unique and the most positive, compelling feature
is cultural anyways, the free flow of people across all these borders.
People
are now very angry about "Austerity" and losing their
manufacturing jobs to businesses run elsewhere. Making it harder
for capital to take jobs anywhere it wants would not end the cultural
inter-mixing that the Euro stands for, too.
"Free trade" is a misnomer. It is a choice, like tariffs or taxes on whiskey,
which politicians make or don't make, to benefit one segment of society and
hurt another. I still remember having to regurgitate a whole lot of free-trade
propaganda in ECON-101 to get a good grade. I knew it was not the whole story
then. And millions know it is not the whole story now.
===============================================================================
6/23/16
The "surprise" BREXIT vote has caused a dramatic
drop in the
Pound and in the Futures' markets generally. But, perhaps, it
was not such a surprise in this age of "populist revolt". The "STAYS"
were relying on telephone polling. (I thought this went out when the
Literary Digest predicted Alph Landon over FDR in 1936). I have
also not found London's bookies's odds worth much. They claimed
that there was far more money on STAY than BREXIT. This is
what the very weak Hourly DISI was
trying to tell us. Somebody
sure knew to do some heavy selling!
Buying Opportunity?
The normal reaction of Professionals to situations like this
where emotional selling is so dominant is to buy on early weakness
in expectation that there will be a rally when cooler heads prevail.
At least, that is what seems the most likely development. After all,
it will be 3 months before the next British Government tells the
European Union officially of the decision to "BREXIT". And after
that, Britain still has two years to negotiate new terms of its relationship
to the European Union.
The 3x leveraged gold miners' ETF, NUGT is
up 30%(!) overnight
on the news. Now we get to see if Professionals can control the
gold speculators. Until, they do, it would probably be prudent not
to try to call a bottom for the Pound, the Euro or the
EWU.
What worries me is that the Bank of England chimed in almost
immediately saying that they would support the Pound and the
FTSE with a reserve worth 250 billion Pounds. Currency
speculators like Soros hear such words as a challenge. Like
sharks, they can smell a bleeding currency an ocean away.
What I now fear most is the the Bank of England will eventually raise
its interest rates to try to defend the Pound. This will cause big
problems
for the FED's easy money policies. This is probably why they warned
Englishmen that BREXIT would produce dire financial and economic results.
On the Continent, we should now see more pressures from Greece,
Spain, Portugal and Italy to renegotiate their own relationship
with the European Central Bank. These centrifugal forces will
not immediately become evident. But they are probably now
inevitable. Big Banks do not want to be paid back in Pesos, Lire
of Drachma. So, the American big banks should now be watched
very closely.
The markets crave certainties. BREXIT has released all sorts
of dangers and fears now. Now we get to see how good the FED
really is in containing these demons before they take control.
Immediately ahead, I suspect Peerless may give a Buy B9 on tomorrow's
weakness. They are reliable. We would have to take it. It will
occur if the DJI closes 3% below the 21-day ma and shows a
positive P-I and IP21. A close near 17400 will probably bring such
a signal. But we should just wait and see, to be safer.
Charts: Peerless
DJIA Hourly DJIA
DIA
6-month DJI chart
SPY
QQQ IWM
DJI-Utilities
DJI-Rails
A/D Line-6000 Stocks
Crude Oil
SOXL TECL
Major Indexes and A/D Lines.
Key Tiger
Software ETF Charts
Bullish MAXCPs
Bearish MINCPs
Red Buys and Sells on major
ETFs
====================================================================================
6/22/16
Peerless still shows a
Buy B11.
Breadth is strong.
Hourly DJIA
Volume remains quite weak. I take this to mean that the Buyers
will not be able to take the DJI up
beyond 18000 by much.
The steep Closing Power uptrends for DIA and
SPY have been violated.
Early strength is starting to give way significantly to late selling. These
warning signs, OBV and Closing Power, may just reflect the
concerns of Professionals waiting for the results of the BREXIT
vote tomorrow.
Because the DJI is trading so narrowly,
I have suggested either
working with the Bullish MAXCPs
or the automatic, optimized
Red Buys and Sells on major
ETFs. I have two more suggestions.
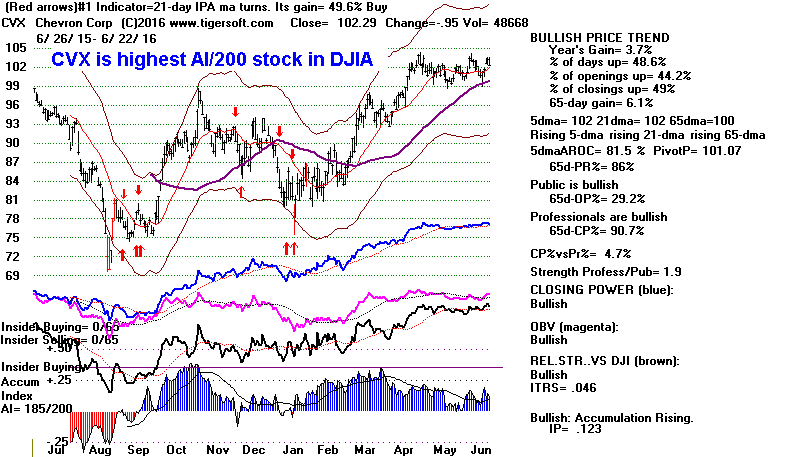
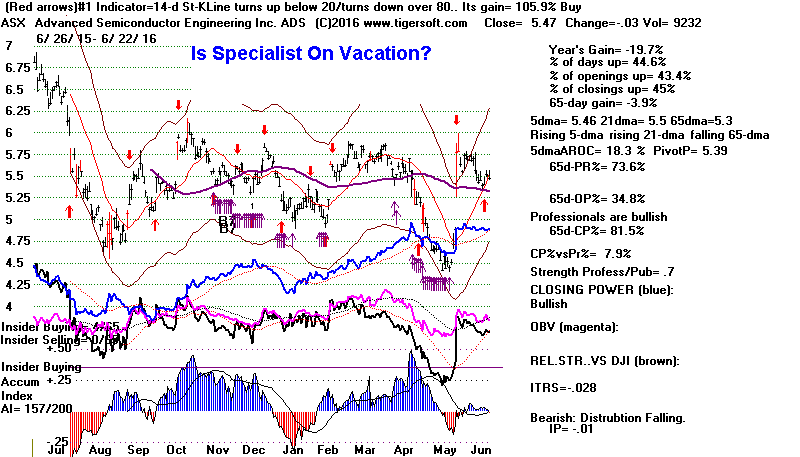
The highest AI/200 stock now is CVX. It should be bought as
a longer term investment. Buy ASX and trade it using its
Red optimized Buys and Sells. It has shown a striking tendency
to rise the day after the DJI rises. When the DJI rises, it lags
and the plays "catch-up". This is useful to know. See below...
Charts: Peerless
DJIA Hourly DJIA
DIA
6-month DJI chart
SPY
QQQ IWM
DJI-Utilities
DJI-Rails
A/D Line-6000 Stocks
Crude Oil
SOXL TECL
Major Indexes and A/D Lines.
Key Tiger
Software ETF Charts
Bullish MAXCPs
Bearish MINCPs
QUICKSilver
We don't usually get the time to try out some of the lesser known
and used TigerSoft tools. Under Runs/Setups you can answer
the following questions.
What Stock Moves Today Best Predict the DJI Tomorrow?
ASR 56.5% (Its success rate was 56.9% in 2015.)
This seems a random relationship. It is a small South
American ADR.
CVX 56.5%
(Only 50.4% in 2015. Very reliable this year.)
That CVX shows such high Accumulation and looks so
good
is probably a good sign that DJI will go higher this Summer.
What Stock Moves Tomorrow Are Best Predicted by DJI moves
Today?
ASX + 65.7% (Only 50.8%
in 2015. Very reliable this year.)
The specialist for ASX must be away a lot this year and
is slow to move the stock up when the DJI rises. The
market does that the next day for him. Perhaps, we can
profitably buy this on days the market is up and sell at the end of
the next day or when there is a Sell.
CG +57.3%
(Only 50.0% in 2015. Very reliable this year.)
DEM + 58.1% (Only 48%
in 2015. Very reliable this year.)
EWY + 58.1% (Only
50.0% in 2015. Very reliable this year.)
---------------------------------------------------------------------------------------------------------------------------
6/21/16
Peerless still shows a
Buy B11. If we judge the
market's strength
by breadth we have to be bullish. The
NYSE A/D Line is rising
steadily and a lot faster than the DJIA.
But if we judge it by the
Hourly DJI's DISI/OBV Line, we would have to be quite frightened.
This measure of up-hour versus down hour volume is making 2-month
lows as the DJI sits on its 21-day and 65-dma.
Which view should we trust? Which will be
right?
Perched on its two important moving averages, the DJI seems
perched and ready to spring either way, with the outcome controlled
probably
by whatever is the outcome of the BREXIT vote in the UK.
By Thursday mid-day
in NYC, we should know the outcome of the
vote. The latest polls
show BREXIT losing by 2%.
http://www.mirror.co.uk/news/uk-news/eu-referendum-britain-poll-2016-7699714
I suspect that the polls are right.
That's why Peerless is on a
Buy and Gold stocks, for example, are weakening. Mostly we
are getting bullish readings from the indicators and statistics we
trust. Here are the ones I like to follow the most.
1) The Closing Powers for DIA and
SPY are rising.
2) The 5-day moving averages of DIA, SPY and QQQ are rising.
3) Tonight there were 198 MAXCP stocks and only 44 MINCPs.
4) While on the NASD there were 22 highs today and 27 lows,
on the NYSE, there were 61 new highs and only 5 new lows.
Totals remain bullish: 83 versus 32.
5) Of the 20 major ETFs examined, 14 show current
optimized
Red Buys and 6 show RED Sells.
My conclusion: a low volume rally will probably be seen if BREXIT
loses. In rising now, the DJI will be showing unusual seasonal strength.
Typically since 1965, the DJI has only risen 38% of the time over the
next week and 44% of the time over the next two weeks. That may
be a good sign that the DJI will achieve a breakout in July. That would
be more in keeping with how the market behaves in a Presidential
Election Year if it approves of who the next President will be.
Charts: Peerless
DJIA Hourly DJIA
DIA
6-month DJI chart
SPY
QQQ IWM
DJI-Utilities
DJI-Rails
A/D Line-6000 Stocks
Crude Oil
SOXL TECL
Major Indexes and A/D Lines.
Key Tiger
Software ETF Charts
Bullish MAXCPs
Bearish MINCPs
QUICKSilver
===================================================================================
6/20/16
Peerless still shows a
Buy B11. The NYSE A/D Line is
rising
as is the 5-day ma of the DJIA.
Since March, the DJI has been
trading narrowly between its upper and lower 1.75% bands around
a 5-dma. At some point soon, I expect a much bigger move.
But until it breaks outside this confined area, it might be a good idea
to look at the trading possibilities offered by the Red Buys and Sells
on some of the foreign ETFs as well as FAS and UCO, among
others mentioned below..
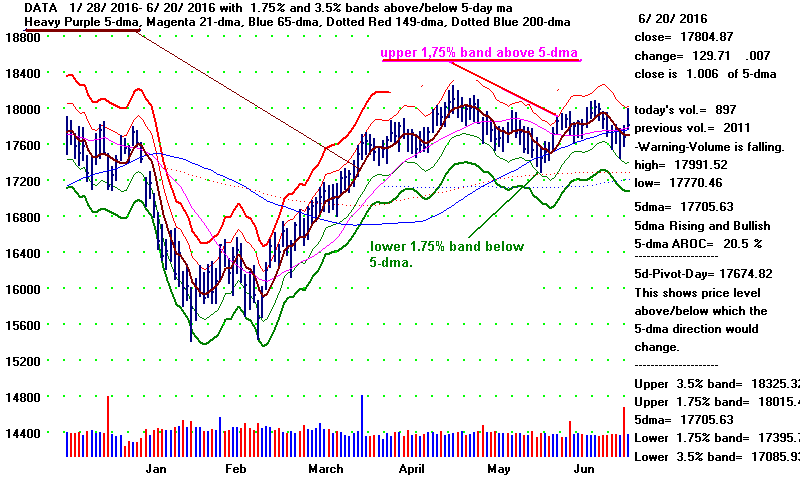
Sporting new Tiger Red Buys, Oil and
Gas led the market's recovery
today. Though the ETF representing UK's
stocks gave a new Red Sell,
the ETFs for Germany,
Italy and
Europe did not.
We now have a red Buy on QQQ. With the
Closing Powers rising,
it certainly seems like the DJI will make it back
to 18000 and the
2% upper band. Volume will probably need to be higher if the
DJI is going to get much higher. See the way OBV is lagging
on the Hourly DJIA and
OEX charts.
Charts: Peerless
DJIA Hourly DJIA
DIA SPY
QQQ IWM
DJI-Utilities
DJI-Rails
A/D Line-6000 Stocks
Crude Oil
SOXL TECL
Major Indexes and A/D Lines.
Key Tiger
Software ETF Charts
Bullish MAXCPs
Bearish MINCPs
QUICKSilver
About 60% of the most important ETFs
show TigerSoft RED Buys.
With the DJI locked in a narrowing trading range, it would
seem to be a good time now to trade with the automatic Red
Buy and Sells. Note that I have started posting all the ETFs whose
5-day Stochastics are now the best trading system on the Tiger
Data Page. For our purposes here it is probably sufficient to
to keep track of status of the Tiger Red signals for the following
ETFs. You can decide if you want to trade these or their leveraged
equivalents. Sometimes, the leveraged ETF gives a different
signal than the regular ETF. That is true now for DIA and
UDOW.
Current Gain Using Current
Signal Best System for last year
-----------------------------------------------------------------------------
DIA
90-day Stoch
Sell
Only
+19% (low is less reliable.)
(UDOW
21dma turns
Buy
+86% Leveraged DJI)
SPY
14-day St-Kline Buy
+35.4%
OEX 14-day St-Pct-D
Sell
+43.2%
QQQ
14-day St-Pct-D Buy!
+45.8%
IWM
14-day St-Kline
Sell
+30.8% Russell-2000
NASDAQ 14-day St-Pct-D Buy!
+49.8%
IBB
50-day St-Kline
Sell
+67.4% Biotechs
SOXL 14-day
St-Pct-D
Sell
+227.2% Semi-Conductors
TECL 14-day
St-Pct-D Buy
+135.5% Technology
FAS
5-day K-Line
Buy
+90.7% Banks
UCO
5-dma penetr. Buy
+113.7% Crude Oil
UGAZ 50-dRSQ turns
Buy
+160.2% Natl Gas
Food 21-dma IPA pen.
Buy
+23.7%
YINN 10-d RSQ pen.
Sell
+149.2% China
EWC 10-d RSQ pen.
Sell
+44.3% Canada
EWU 5-day K-Line
Sell
+109.4% U.K.
EWG 14-day St-Pct-D
Buy
+83.% Germany
VGK 5-day K-Line
Buy
+70.2% Europe
LBJ 21-dma turns
Buy!
+215.6% Developing
BRZU 5-day K-Line
Buy
+1187.2% Brazil
----------------------------------------------------------------
12 Buys
and 8
Sells
=================================================================================
6/17/16
Peerless still shows a
Buy B11. The DJI decline on
Friday
was artificially induced because of Options' Expirations. This
can be judged from the fact that there were 671 more up than
down on the NYSE despite the DJI's 58 point loss. The European
ETFs advanced on their short-term Red Buys.
Utilities were
particularly strong. The NYSE A/D Line uptrend is intact.
The Closing Powers for DIA and
SPY are rising. Assuming, the
DJI can close strongly tomorrow, it will get back above its
65-dma. This should induce additional buying.
However, a reversal downwards tomorrow would give the last 20
trading days the appearance of being yet another bearish head/shoulders.
So, Bulls will need to over-power the Bears after what looks like
will be a very positive opening tomorrow.
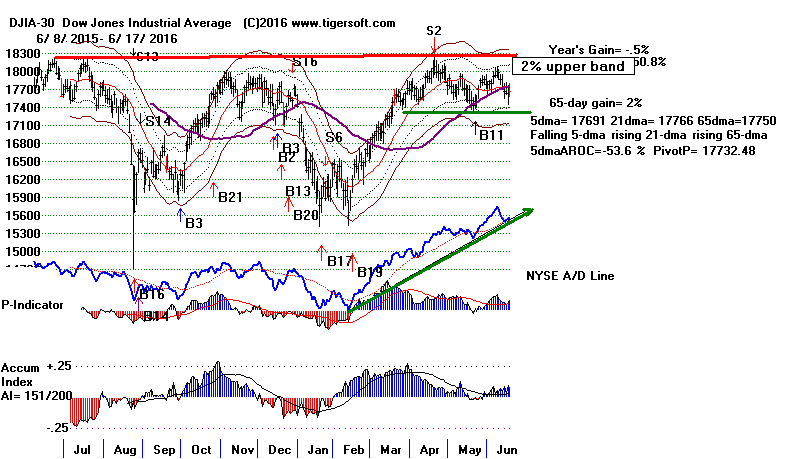
I still think that volume will need to expand a lot to allow the DJI
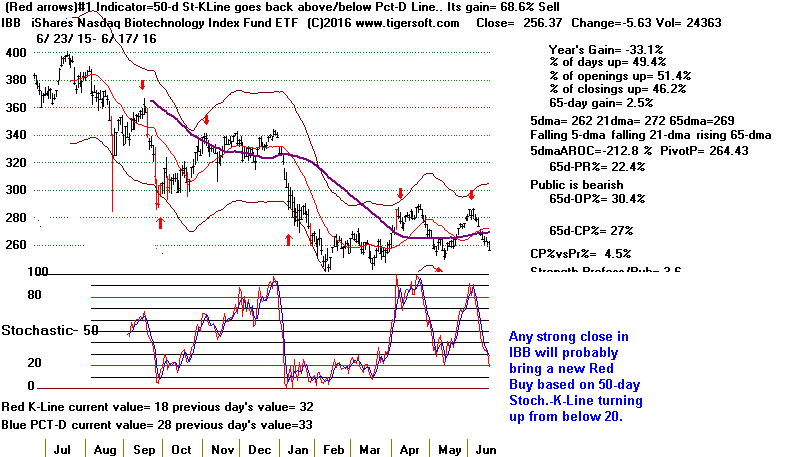
to rise much past 18000. But, Biotechs are not likely to keep
falling if the market moves up this week. So, close out any hedged
Bearish MINCP stocks that turn up at the close tomorrow. Any
rally in IBB will bring a new Red Buy for this ETF representing
NASDAQ biotechs.
The strength in Oil has sent most airlines'
stocks into a dive.
Let's watch them to see if their oversold Stochastics will turn
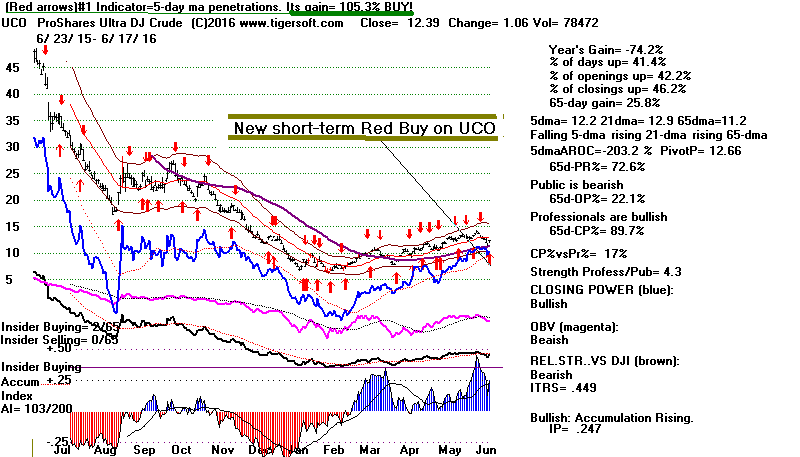
up and allow them to rally again. As long as Crude Oil (UCO)
stays above its 65-dma, I think it's best to assume that Deflation
is being kept safely at a distance, though rebels in Nigeria also
are affecting its supply. Short-term traders should buy UCO
based on its new red Buy. See below.
Charts: Peerless
DJIA Hourly DJIA
DIA SPY
QQQ IWM
DJI-Utilities
DJI-Rails
A/D Line-6000 Stocks
Crude Oil
SOXL TECL
Major Indexes and A/D Lines.
Key Tiger
Software ETF Charts
Bullish MAXCPs
Bearish MINCPs
QUICKSilver
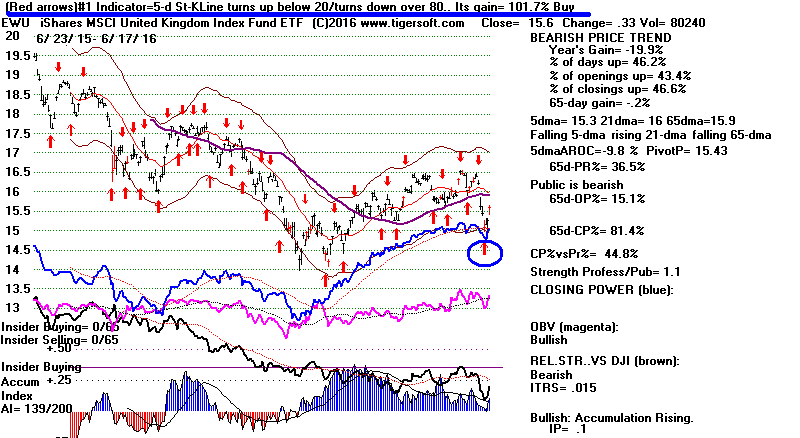
The optimized short-term red short-term stochastics applied
to the UK's ETF, EWU, will probably be as good a guide as
any regarding the chances for PREXIT. EWU's rally is positive
short-term news for DIA and American big
banks, FAS. But
weakness in a day or two could bring a new red Sell for EWU.
See below how its 5-day Stochastic K-Line is now in
over-bought territory. This red system has gained an amazing
101.7% over the last year. Until it fails, keep using it. There
is a 25% performance distance between taking the signals at
full advantage on the day of the signal and taking the signal
at the next day's opening. You can use the older Tiger programs
to put in hypothetical data. Place a chart of the screen and
under Operations, choose "Rechart using tentative data for next day."
You can also compute the 5-day K-Line's position quite easily.
This is the formula:
Stochastic-5-Kline = (Close - 5day low)
------------------------
5-day price range

==================================================================================
6/16/16
Peerless still shows a
Buy B11. Today the DJI opened
down
150 points and gradually rebounded all day and ended up 96.
This turned the Closing Powers back up at their rising 21-day ma.
So, Professionals must now be deemed to be net bullish on
DIA.
Nevertheless, I suspect there will need to be more testing of 17400-17500.
BREXIT overhangs the Financials. We need more "head-room"
to buy if 18000 and the upper 2% band are expected to block
the next rally. Seasonality is distinctly short-term bearish. Since
1965, the DJI has rallied only 36% of the time over the next week
and 44% of the time over the next two weeks.
Though we now see Red Optimized Buys on DIA
and SPY,
the charts of BBH,
OIL, QQQ,
SOXL and
UCO still show red
Sells.
NYSE Breadth and (up-volume minus down-volume were negative today
despite the DJI gain of 1/2%. Can the DJI lead the market back up
with this divergence? As long as we don't get a close below 17400,
the answer appears to be "Yes". Since the year 2000, there have been
6 such days when the DJI rose 1/2% or more but breadth and volume
were negative with the DJI not already below the lower band and
Peerless not already on multiple SELLs. In each case, the DJI rebounded
soon afterward to at least the 2% upper band.
Such action by the DJI used to be a bearish sign. But "hot" money
clearly now goes first to the big indexes at the start of a rally now.
Look
at the cases: 5/2/2009,
7/6/2009,
6/16/2011,
4/2/2013,
9/12/2015
and 12/12/2015. (I mark them on these charts with a B2s).
It is important to note that this unusual juxtaposition of a 1/2% jump
in the DJI with negative breadth and volume is not good to use as an
immediate Buy signal. In most of these cases, the DJI did drop
down a little further.
This is a new phenomenon. There were no cases between 2003 and 2007.
This is the third such case in the last year. This used to be primarily a
a bear market DJI. Thus, it occurred 4 times in 2008.
Charts: Peerless
DJIA Hourly DJIA
DIA SPY
QQQ IWM
DJI-Utilities
DJI-Rails
A/D Line-6000 Stocks
Crude Oil
SOXL TECL
Major Indexes and A/D Lines.
Key Tiger
Software ETF Charts
Bullish MAXCPs
Bearish MINCPs
QUICKSilver
===================================================================================
6/15/16
Peerless still shows a
Buy B11. But the DJI's response to
the Federal Funds' rate being kept down near 1/4% was very
disappointing. Breadth remained positive as bonds, utilities
and mining stocks loved the news that low rates are likely
to be here until the Jobs' market looks much better. It is the
bank stocks that are frightened most by the prospects of BREXIT.
Fortunately, for Tiger Users, though the banks stocks show weakness
now, our Bullish MAXCPs are
mostly utilities, which are made
more attractive by low interest rates AND by being a haven against
the uncertainties in Europe because of BREXIT.
A nagging question stands out now. Has the FED used up all its
anti-recessionary ammunition? Given the political gridlock, what's
to protect us from a new economic slow-down?
Would not even a DJI decline of 15% push the economy over
into a recession, given the importance of the general level of
consumption by those who are well-off and directly affected by
such a decline?
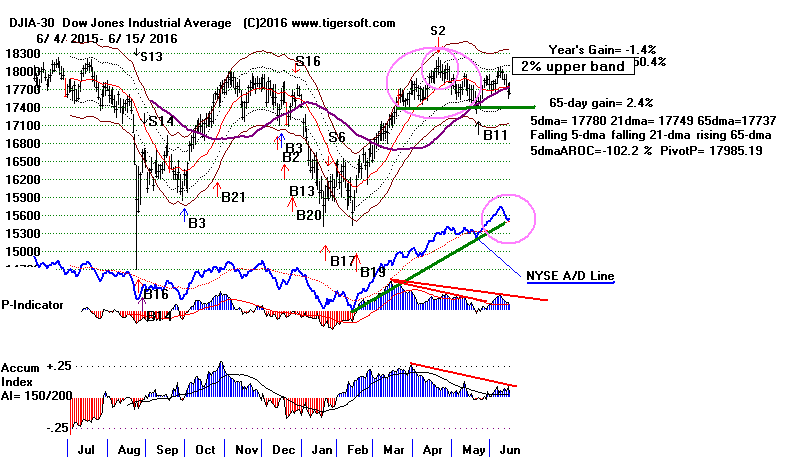
Unfortunately, I can no longer say that Professionals remain
bullish on DIA and SPY. Their Closing Power uptrends were
violated today.
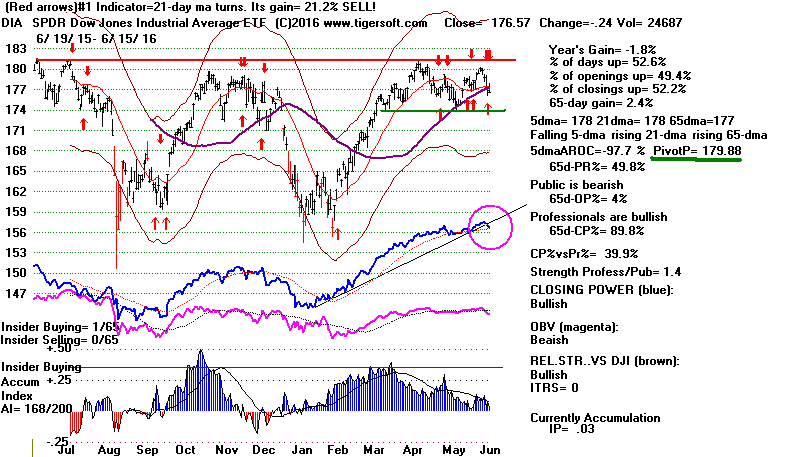
So, the short-term trend of DIA and SPY is now governed by their
falling 5-day mvg. averages. These cannot easily turn up. For now
short-term, traders should
not
hold DIA despite the Buy B11.
After all, the DJI is now below its 65-dma.
Otherwise, let's wait to see if the DJI's 17400 neckline support holds
and DIA can close back above its key short-term pivot-point, now
17900. For those who want to use
only Peerless signals, stay long
DIA, but treat a close below 17380 as a judged Sell S10.
Charts: Peerless
DJIA Hourly DJIA
DIA SPY
QQQ IWM
DJI-Utilities
DJI-Rails
A/D Line-6000 Stocks
Crude Oil
SOXL TECL
Major Indexes and A/D Lines.
Key Tiger
Software ETF Charts
Bullish MAXCPs
Bearish MINCPs
QUICKSilver
So What if Britain Leaves
The European Economic Community?
Isn't everyone over-reacting? While the polls show that
the British favor BREXIT by 7%, they could be wrong and
if that is the vote, Britain would still have two years to
reach a new accord with the European Market. This is what
Switzerland and Norway have done. If the results are very close,
the British Government may even choose to ignore the voting.
That's all true. But the Big Banks would be hurt by BREXIT.
And US stocks and even Bonds and Utilities could be hit hard
in the coming months.
First, BREXIT would be a big blow to "The City", London's Wall Street.
They would be hurt by the likely sudden drop in the value of the
Pound. Consequently, it must be expected that "The City" would
put tremendous pressure on the Chancellor of the Exchequer and
the Bank of England to raise interest rates to shore up the Pound.
Any big jump if British interest rates would rock the current world
of low interest rates. The FED and the European Central Bank might
feel compelled to respond in kind. Think what that would do to stocks
and bonds here. (It has happened before. In the Fall of 1931,
Britain
was forced off the Gold Standard by the Depression. The American
FED responded by boosting the Discount Rate from 1.5% to 3.5% in
less two months. The effects here were dire.)
Second, even if BREXIT does not lead to any dramatic changes in British
interest rates, Britain's departure from the EEC will be closely
watched in Athens, Rome. Lisbon and Madrid. Those who want
their Finance Ministers to challenge the reign of Austerity that the European
Central Bank has imposed on them will surely be emboldened. If the UK
can make the exit, why can't they? This is the last thing the Big Banks
in Europe and America want. They hold many billions in the government
debts of Greece, Italy, Portugal and Spain. They want to be paid back
in Euros, not Drachmas.... This is also a very big part of why our banks
have become frightened enough to send Jamie Diamond (JPM) and
President Obama over to try to fight off these dangers.

Britain’s chancellor of the
Exchequer, George Osborne, center, with Jamie Dimon, chief executive of JPMorgan
Chase, seated behind him, spoke about the referendum in Bournemouth, England,
this month.
Credit Will Oliver/European Pressphoto Agency
http://www.nytimes.com/2016/06/16/business/international/the-financial-plan-for-a-brexit-cross-your-fingers.html?emc=edit_th_20160616&nl=todaysheadlines&nlid=58223894
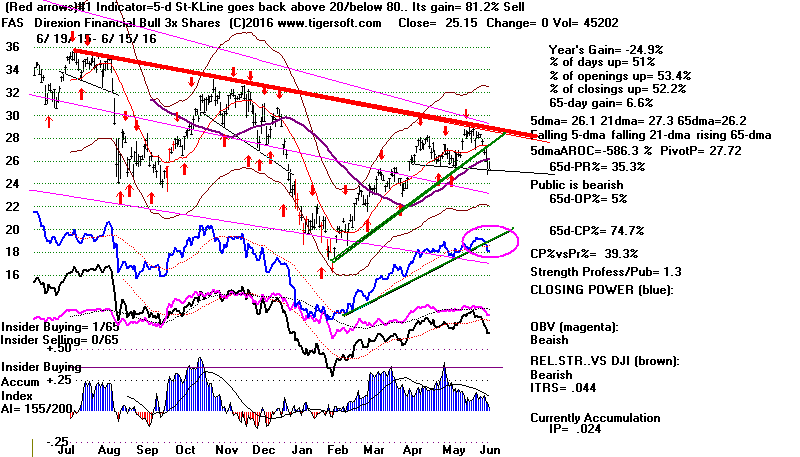
When we look at our Big Banks ETF, FAS, we still see lot of Accumulation.
So, for now, these dangers seem too futuristic to trade on. Still FAS
is in a downtrend. This is important because of how often whatever FAS
does, the DJI will soon do, too.
More Immediate Concerns
As a humble chartist, I have to be concerned that the DJI has
now repeatedly failed to get past its 18000 resistance - even with
a very accommodating FED. Now it must plumb for support
at 17000 or even 16000 if the 17400 support fails.
Doubts about the FED's monetary powers are only going to
turn more shrill if the DJI does start to fall as it did in January.
But now with rates so low and more Quantitative Easing probably
unthinkable given the $4.5 trillion worth of debt already on the Fed's
books, what can the FED still do to stimulate an economy whose growth
is slowing down very noticeably?
The Big Banks will always look after their own interests. If the
FED does provide Wall Street Banks with still more free money,
what is to prevent them from using it to go heavily short and on
down-ticks and without borrowing any stock, either? Certainly,
not the SEC, which just parrots the NYSE's spurious arguments that
derivatives and depressing short sales are a natural right, necessary
and provide extra liquidity.
As one who has researched DJI head/shoulders patterns in charts
going back to 1896, I have to write that their appearance is a
warning even when the DJI rallies back up to the right shoulders apex
and only then falls back to the neckline, as now.
And as a historian who has come to believe that seasonal price patterns
play a big role in market history, I think it's very important that there
has not been a significant June DJI breakout since 1928. (Sure,
1980 saw a Spring bull market, but the DJI did not make a breakout
until July 18th.) And, as I've shown recently, since 1945 all Junes
are 3 times more likely to bring a decline to at least the 2% lower
band from a top that tags the upper 2% band.
===================================================================================
6/14/16
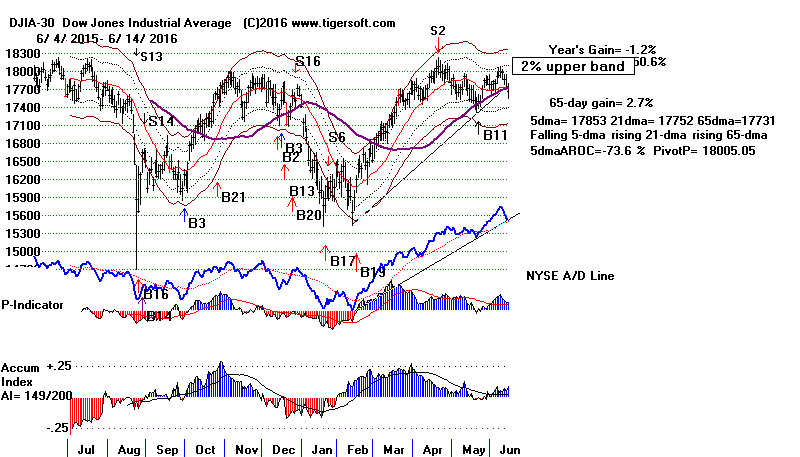
Peerless remains on a
Buy B11. Unless Yellen
disappoints
us and unexpectedly raises rates, we should see a nice rebound
tomorrow. The Futures are up. Overseas' selling appears
to be relenting. The Indexes are testing their rising 65-dma
support. The NYSE A.D line is testing its uptrend. The Closing
Powers for DIA and SPY are at their rising trendlines. And
the red 10-day Down Volume has now reached but not surpassed
the blue 10-day Up Volume. The Inverted Traders' Index is in
the oversold territory that often brings a good rebound.
DJI "should" be able to rally again to 18000
and tag the 2% upper band.
DIA has given a new Red Buy and still shows
a rising Closing Power trend.
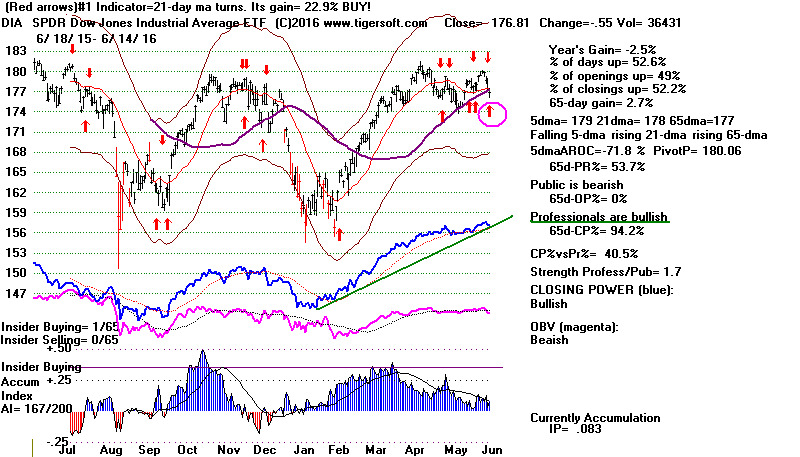
We should see a strong rebound. But plan to sell DIA if the DJI
tags the upper 2% band later this week, unless we get an additional
Peerless Buy signal. The 5-day ma of DIA is still falling. Junes
usually bring reversals at the 2% upper band and 18000 is clearly
where heavy pre-planned selling is scheduled. This is, after all
a bull market that is 7 years and 3 months' old.
Wild Cards
Wall Street is too complacent about Hillary's winning the Elections.
WikiLeaks claims possession of emails to and from her that show she
had highly sensitive and classified materials on her private server, something
which she has denied. Will the FBI really bring charges against her as
the Democratic candidate for President? If they are going to do this, it
be soon, not after she is the official candidate, I would think.
WikiLeaks will release new Clinton emails to add to incriminating evidence
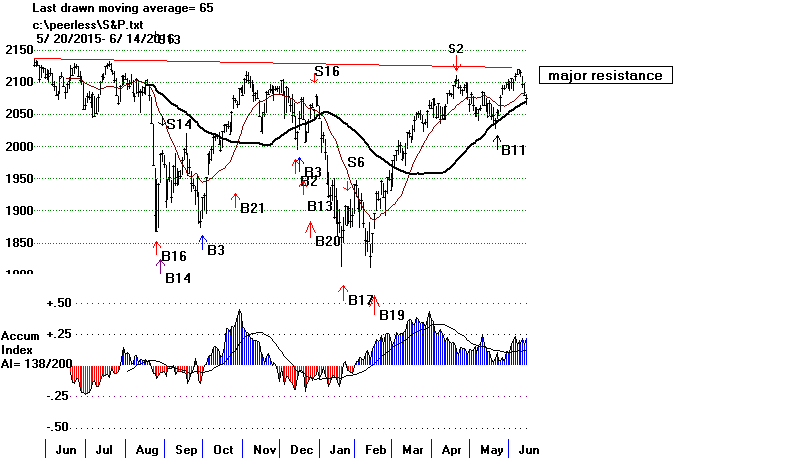
SP-500 is in perfect position to bounce up
from its rising 65-dma.
Charts: Peerless
DJIA Hourly DJIA
DIA SPY
QQQ IWM
DJI-Utilities
DJI-Rails
A/D Line-6000 Stocks
Crude Oil
SOXL TECL
Major Indexes and A/D Lines.
Key Tiger
Software ETF Charts
Bullish MAXCPs
Bearish MINCPs
QUICKSilver
Tonight we also see new optimized Buys, shown with
Blue "!",
from the cadre of European ETFs that have been leading the decline
because of BREXIT, namely, EWI,
EWG,
EWU and VGK.
Sector and Country ETFS on Red Sells
Best
Red Red System's ITRS
Relative to
System
Signal Yearly Gain
65-dma
--------------------------------------------------------------
Brazil
BRZU 5-d Stoch K
Sell 921%
+.002 below
DIA 21-dma turns
Buy!
23%
------ just below
EPU 21-dma turns Buy
63%
+.15 above
Italy
EWI 14-d Stoch K
Buy!
53%
-.061 below
Germany
EWG 14-d Stoch K Buy!
75%
-.035 below
Unit.King.
EWU 5-d Stoch K
Buy!
99%
-.031 below
FAS 5-d Stoch K
Sell 81%
+.009 below ma
GLD 50-dma turns Buy
23%
+.059 above
Biotechs
IBB 20-d
StoPctD Sell 69%
-.028 below
ILF 21-d OBV
Sell 57% -.03 below
IWM 14-d Stoch K Sell
32%
+.041 above
Airlines
JETS 5-d Stoch K
Sell 64%
-.137 below
JNUG 50-dayRSQ Buy
453%
+1.268 above
MDY 14-d Stoch K Sell
38%
+.032 above
OIH 5-d Stoch K
Sell 103%
+.143 above
NASD-100 QQQ
20-d StoPctD Sell
51%
-.016 just below
RSX 5-d Stoch K
Buy! 43%
+.056 above
SLV 21-dma IPA
Buy 42%
+.167 above
SOXL 50-d Stoch K Sell
212%
+.079 above
SPY 14-d Stoch K
Sell 36%
+.01 above
Technology TECL
14-d Stoch K Sell
138%
-.076 just below
UCO 5-dma penetr. Sell
103%
+.62 above
European VGK
14-d Stoch K Buy
61% -.052 below
Emerg.Mkts VWO
5-d Stoch K Sell
62%
-.02 below
XOP 5-d Stoch K
Sell 75%
+.189 above
China
YINN 10-d RSQ pen. Sell
215%
-.053 below
====================================================================================
6/13/16
The DJI is now testing its rising 65-dma.
Buy B11s in
the past seldom have big losses. Utilities
and Gold are
holding up well. This suggests that the FOMC will not
be raising rates in June. BREXIT may cause lots of
mischief for the EURO. That may hurt US big banks.
But it is not clear to me how this will impact US stocks.
I would stick with DIA but hedge, as shown below.
We have to be concerned that the DJI's last rally was quickly
stunted by big sellers who are expecting a bigger decline.
On the last rally, the DJI merely closed 1.5% over its 21-
dma at its peak. It needed to close another 1/2% higher
to get a Sell S2 or S9V.
If we were creating a Peerless system that worked well
for only the period since 2000, we would happily use the
1.5% band for closings in June to get a Sell S2. Since 2000,
there are no June take-offs and there are a number of peaks
1.5% over the 21-day ma that bring declines to the 2%
lower band.
But our Peerless signals must test very well for the whole
period, 1928-2016, to be allowed. Sells in June when
the DJI closes 1.5% over the 21-dma "only" work 75%
of the time since 1945.
See
June Tops
Outnumber Big June Advances by 3:1
For now, all this should make us hedge our longs with
a good number of Bearish MINCPs.
Another way to hedge is by shorting some of the sector
and country ETFs that are on automatic red (optimized)
Sells provided that they are below thier 65-dma and show
a negative ITRS (relative strength to the DJI.) The 11 ETFs
in red meet these criteria.
See a list of 26 candidates below. The graphs of these are
regularly shown here.
Charts: Peerless
DJIA Hourly DJIA
DIA SPY
QQQ IWM
DJI-Utilities
DJI-Rails
A/D Line-6000 Stocks
Crude Oil
SOXL TECL
Major Indexes and A/D Lines.
Key Tiger
Software ETF Charts
Bullish MAXCPs
Bearish MINCPs
QUICKSilver
Sector and Country ETFS on Red Sells
Best
Red Red System's ITRS
Relative to
System
Signal Yearly Gain
65-dma
--------------------------------------------------------------
Brazil
BRZU 5-d Stoch K
Sell 875%
-.082 below
DIA 21-dma turns
Sell 23%
------ just above
EPU 21-dma turns Buy
67%
+.14 above
Italy
EWI 14-d Stoch K
Sell 51%
-.056 below
Germany
EWG 14-d Stoch K Sell
75%
-.01 below
Unit.King.
EWU 5-d Stoch K Sell
95%
-.004 below
FAS 5-d Stoch K
Sell 76%
+.026 at ma
GLD 50-dma turns Buy
22%
+.051 above
Biotechs
IBB 20-d
StoPctD Sell
70%
-.012 below
ILF 21-d OBV
Buy 57%
-.045 below
IWM 14-d Stoch K Sell
31%
+.035 above
Airlines
JETS 5-d Stoch K
Sell 60%
-.104 below
JNUG 50-dayRSQ Buy
499%
+1.221 above
MDY 14-d Stoch K Sell
38%
+.026 above
OIH 5-d Stoch K
Sell 103%
+.132 above
NASD-100 QQQ
20-d StoPctD Sell
51%
-.019 just below
RSX 5-d Stoch K
Sell 42%
+.042 above
SLV 21-dma IPA
Buy 42%
+.158 above
SOXL 50-d Stoch K Sell
211%
+.053 above
SPY 14-d Stoch K
Sell 36%
+.009 above
Technology TECL
14-d Stoch K Sell
139%
-.089 just below
UCO 5-dma penetr. Sell
118%
+.54 above
Cons/Ret VGK
14-d Stoch K Sell
56%
-.015 below
Emerg.Mkts VWO
5-d Stoch K Sell
61%
-.024 below
XOP 5-d Stoch K
Sell 75%
+.173 above
China
YINN 10-d RSQ pen. Sell
215%
-.091 sell
===================================================================================
6/10/16
We still show a Buy B11 to be the current
Peerless signal.
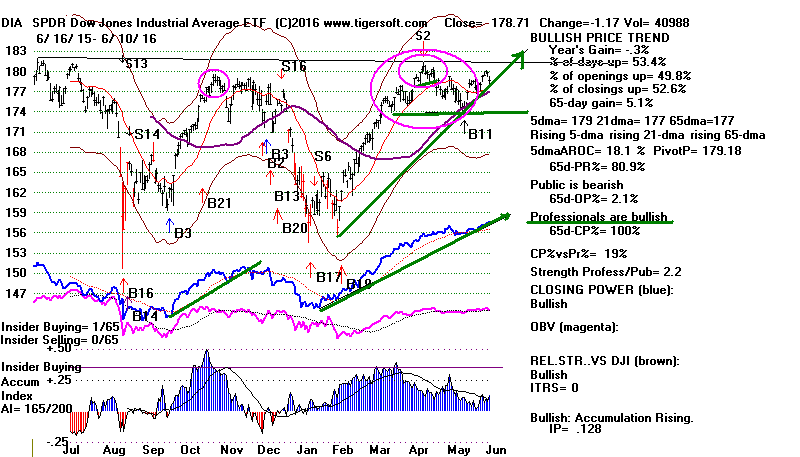
The DIA's Closing Power is rising. But
a re-testing of
the DJI's 65-dma seems likely.
18000 and the 2% upper
band look like imposing resistance unless there is a big
surge in up-Volume.
There are some attractive new short sales among our
Bearish MINCPs. I
suggest doing a little hedging. That
is what we will do on our Tiger Stocks' Hotline.
If the DJI manages a rally later this week leading up to the
announcement Wednesday by the FOMC and tags the 2%
upper band, I believe I should then sell DIA. There appears to
be more downside risk from there than upside potential.
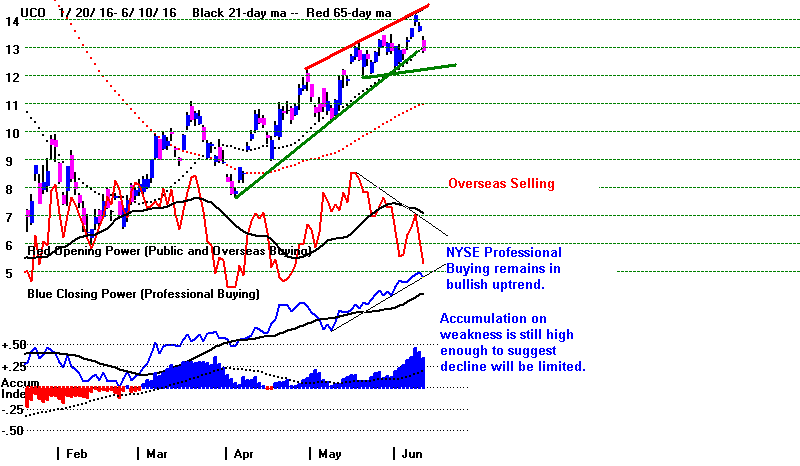
UCO is still in an uptrend, but must close
back above
13.25 to keep a rising 5-day ma. So, short-term traders should
sell it Monday if it closes below that. It still shows rising
Accumulation, so I believe that it is an intermediate-term hold.
News
The latest act of terrorism and mass killing in America should
add to weakness early Monday. Concern about BREXIT adds
to the bearishness, though no one, I suspect, really knows
how the vote will actually turn out or what the consequences will be.
There is less uncertainty about what the Fed's FOMC will
do on Wednesday. Because of May's very weak Jobs'
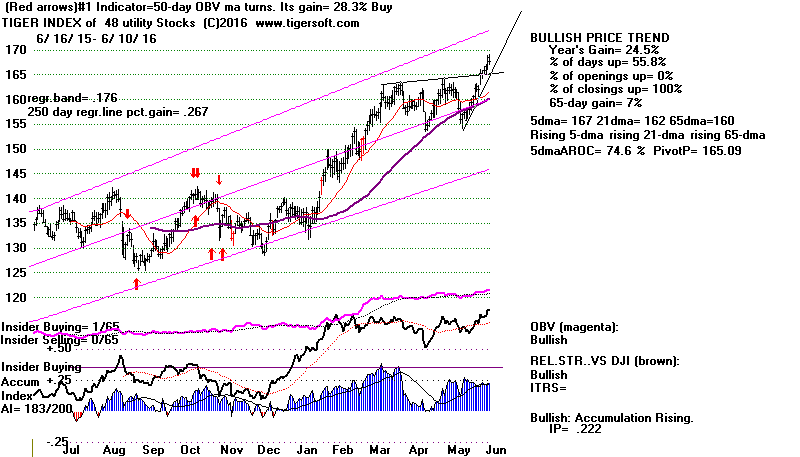
numbers, the FOMC will probably do nothing. Our Tiger Index of Utilities
remains in a firm uptrend. The only way Utilities could be rising
at an annualized rate of 26% at this time would be if competing
interest rates are expected to stay very low.
BREXIT
Good breadth has been the "saving grace" of the
rally since
February. But Friday saw more NYSE decliners than any day since
February bottom. Profit-taking in Oil stocks was only part of
the reason for the weakness. New British Polls place the likely
number of those voting to exit the European Economic Community
to be 10% above those in favor of staying it. This introduces
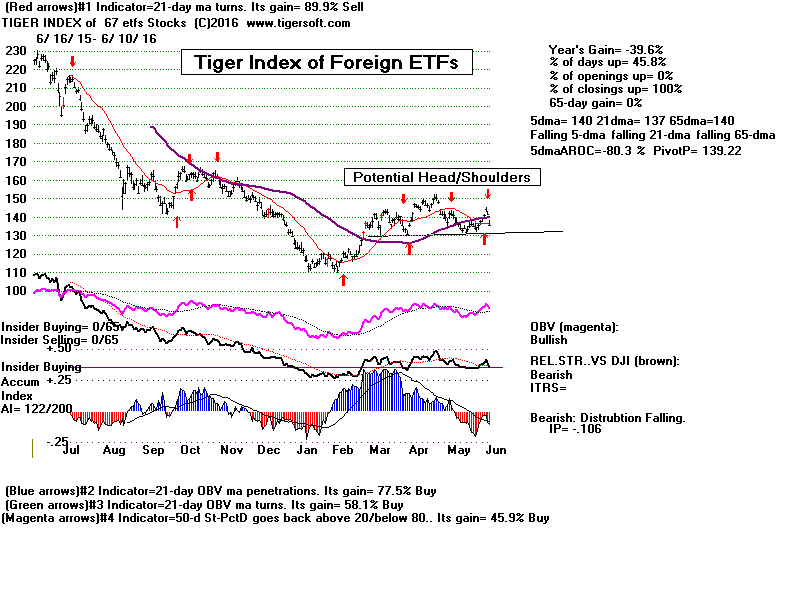
a new level of uncertainty for Foreign stock markets and US
Big Banks. 18%-20% of all NYSE
stocks are foreign owned.
As a consequence, it was weak along with most
foreign ETFs.
Even though we have not gotten a new Peerless
Sell, Junes
often do bring very tradable declines and recently have tended
not to bring ralliesany higher then the 2% upper band and a closing
not much more than 1.5% over the 21-day ma. See
new study of
June Tops.
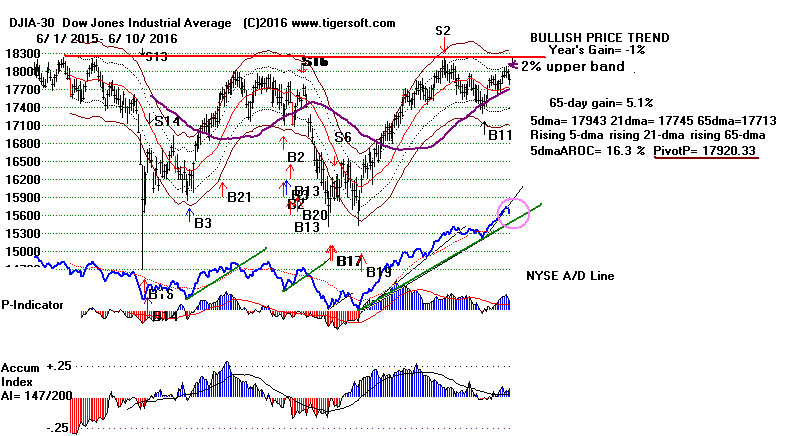
I think we have to start drawing in the 2% upper
band in the Summers.

DIA's Closing Is Still Rising
Break in 65-dma by Foreign ETFS
Crude Oil (UCO).
Charts: Peerless
DJIA Hourly DJIA
DIA SPY
QQQ IWM
DJI-Utilities
DJI-Rails
A/D Line-6000 Stocks
Crude Oil
SOXL TECL
Major Indexes and A/D Lines.
Key Tiger
Software ETF Charts
Bullish MAXCPs
Bearish MINCPs
QUICKSilver
June Tops
Outnumber Big June Advances by 3:1
This late in a bull market, we have to take note of how often there
are June tops and how there have not been any continuous advances
in June since 1999. Historically, I reckon the odds are about 3:1
that the DJI either has seen a top that will take the DJI down to a
point at least 2% below the 21-day ma or we will see it in that June
top in the next two weeks.
Research done this weeks shows that there have been 36 instances
since 1945 where the DJI peaked with a closing at least 1.5% over
the 21-day ma and then fell away and closed at least 2% below the 21-day
ma. There have have only been 12 cases where June allowed a rising
market to pass right through it and go substantially higher. None of
these cases have occurred since 2000.
Some of these peaks near the 2% upper band did not produce a Peerless
Sell signal. While, I don't see this tendency as powerful enough to
incorporate into Peerless for the whole period since 1928, we should
note the recent tendency for tops to occur before the 3.5% upper band is
reached and not necessarily wait for Peerless to sell.
More work will be done later this week on this study.
====================================================================================
6/09/16
Lack of convincing Up-Volume has been a problem
for this rally. The Hourly DJI's
OBV Line is lagging
Prices considerably. Now today the 10-day ma of
Down-Volume turned up and the 10-day ma of Up-Volume
turned down. The DJI's perch above 18000 has given
way to yet another retreat from the overhead resistance.
Since breadth has been excellent, since there are so many
more MAXCPs than
MINCPs and since Peerless
remains on
a Buy signal, I have to think the decline will probably be
limited by the rising 65-dma again.
The leadership here is not so great.
Semi-conductors and
technology stocks have not participated in
this two week bounce.
It is hard to see this old bull market jumping above the 18000 fence
when one leg consists of Utilities
and the other is made up of
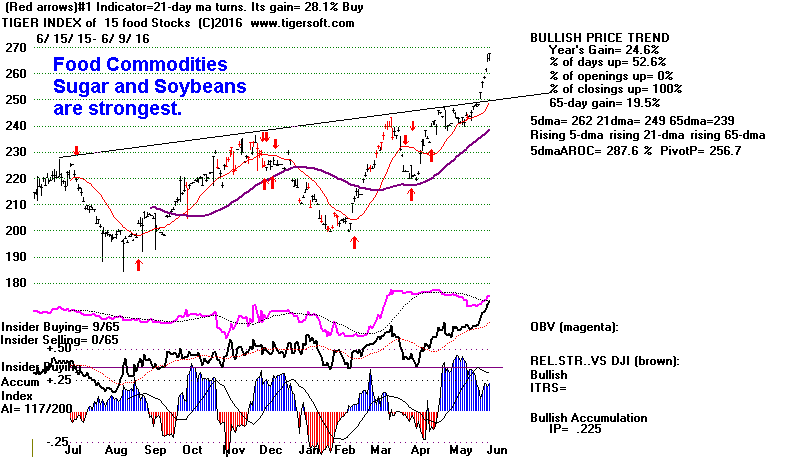
Gold Stocks. I also call your attention today to the way Food
commodities are rising. This may make it easier for the Hawks
on the FOMC to tell the Public that the "Inflationary Menace"
must be fought even at the expense of risking a recession.
DJI - Peerless remains on a Buy.
Excellent Breadth, but NYSE Down Volume is Rising
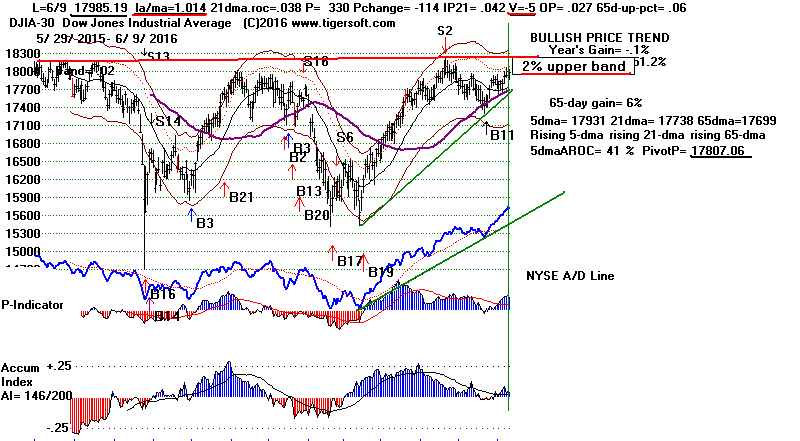

DIA's Closing Power is Rising
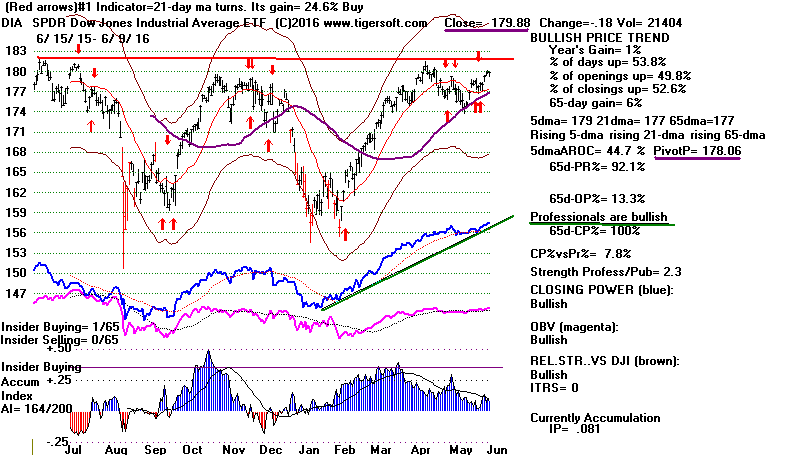
SPY's Closing Power is Rising
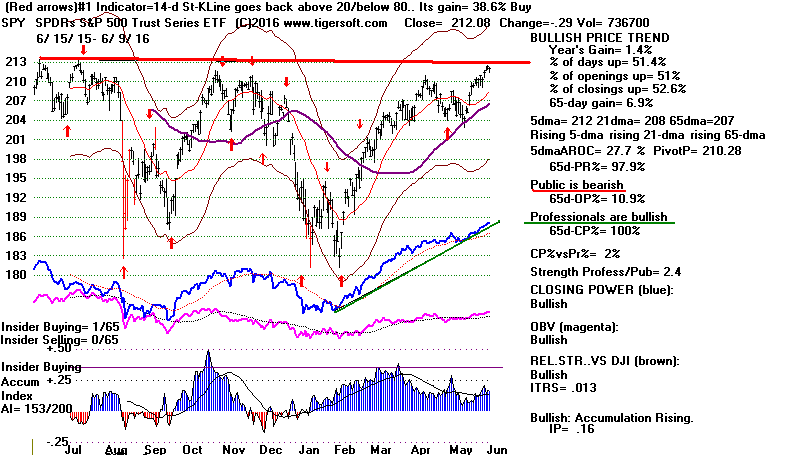
Food Commodities
Seasonality since 1965 shows that there is a 58% probability
of the DJI being higher from current levels a week from now,
but that drops to only 52% two seeks from now.
We probably will have to expect to be
sellers on the next rally
up to the 2% upper band based on the more modest record
of Buy B11s in April and May.
-
We should not expect a market-takeoff based on Peerless.
None of Peerless Buy B11s in the period
from mid April to the
end of June gained as much as 6%. So,
the likelihood is for
another Peerless Sell somewhere between
18000 and 18350.
Buy
B11 from Mid-April to End of June.
Gain at
time of next
Peerless
Sell.
5/8/1959 .046
5/16/1986 .058
4/23/1993 .025
4/17/2006 .046
----------------------
Avg = 4.4%
Charts: Peerless
DJIA Hourly DJIA
DIA SPY
QQQ IWM
DJI-Utilities
DJI-Rails
A/D Line-6000 Stocks
Crude Oil
SOXL TECL
Major Indexes and A/D Lines.
Key Tiger
Software ETF Charts
Bullish MAXCPs
Bearish MINCPs
QUICKSilver
Short DGAZ
TigerSmart Works!
Twelve days ago, two days after our last Peerless Buy signal, I listed the 12
stocks
that had just given TigerSmart automatic red Buys and whose gains using the best
system were over 100%. Below are the results so far. The average
gain since
is +8.4%, certainly much more than the DJI has advanced.
The best results came with the 3 stocks whose Red Buy signal was based on prices
coming back above the 5-day ma. This adds credence to our QuickSilver
system.
C:\tgrsmart   Days back= 12
 5 / 23 / 2016 - 6 / 9 / 2016
Rank          Symbol        Name                        Price          Pct.Gain
                                                                      since 5/23
---------     -----------------------------------       ----------    ------------
 1            UNT           Unit Corp                    16.82         27%         Based on 5-dma penetration.
 2            CLNE          Clean Energy Fuels Corp      3.64          18%         5-d Stochastic
 3            MSB           Mesabi Trust Cbi             10.55         15%         Based on 5-dma penetration.
 4            AXLL          Axiall Corporation           25.81         13%         Based on 5-dma penetration.
 5            DYN           Dynegy Inc                   20.74         10%
 6            GV            Goldfield Corp               3.1           9%
 7            ENPH          Enphase Energy Inc           2.1           6%
 8            IMN           Imation Corp                 1.72          5%
 9            KPTI          Karyopharm Therapeutics Inc  9.12          4%
 10           BHP           BHP Billiton Limited ADS     27.98         3%           5-d Stochastic
 11           SPWR          SunPower Corp                16.85         1%
 12           FCX           Freeport-McMoran Inc         10.9         -5%           21-d CP ma penetr.
 =============================================================================================
                                                                     Avg 8.4%
===================================================================================
6/8/2016 The Hotline from last night is
not loading properly.
Here are its central points. I am trying to restore the
Hotline page. But its contents may be lost. We'll see.
Hold DIA and
UCO.
We are still on a Buy B11. The A/D
Line is streaking upwards.
But the Hourly DJI clearly shows
volume is a problem. So, since
the SP-500 has reached a well-tested
resistance level and the DJI
has closed above 18000. a minor retreat seems likely.
The FED may now be tempted to try to jawbone the Dollar
back up. Protecting the Dollar is usually their highest priority.
The Gang of 5 anti-Dollar Investments have been running up
recently because most observers do not see a rate hike this Summer.
The "Gang of 5" are what I was calling the 5 Horsemen of the
Deflation Apocalypse:
Gold Stocks
Crude Oil(UCO) and
Crude Oil Stocks
Commodities
YINN (leading Chinese stocks)
Foreign ETFs
Gold stocks are the leaders of this group. They are on the
verge of breaking out above the top of a broadening formation.
Such a breakout would boost the whole group. Commodities
have completed an inverted Head/Shoulders and so will be
hard to stop. Oil is slanting upwards with good internals.
But Foreign Stocks and YINN have reached their upper price
bands and show negative no-confirmations from their Tiger
Accumulation Index.
Restored Version
Hotline and Links -
6-8-2016 We still have the Peerless Buy B11 as our
active signal.
But volume remains weak. See the bearish
OBV divergence
from Prices in the
Hourly DJI chart. The
SP-500 has now
reached its well-tested resistance line
and the DJI has managed
to close above 18000. I would think that
there will be another
small pull-back in the
DJI and the SP-500. The
NASDAQ
and Russell-2000 ETF,
IWM, also are nearing their resistance
levels, too.
Commodities have broken above a neckline in an inverted
head/shoulders pattern. Gold's strength
is highly unusual.
Another big move up in Gold would cause a
lot of new buying and
short-covering in what I call the
anti-Dollar "Gang of 5". The
Fed may try to "jawbone" down these
inflationary plays. That may
work with foreign ETFs and YINN, but Oil
seems to be in a solid
new uptrend. So, I would continue to
hold DIA and UCO.
Charts: Peerless
DJIA Hourly DJIA
DIA SPY
QQQ IWM
DJI-Utilities
DJI-Rails
A/D Line-6000 Stocks
Crude Oil
SOXL TECL
Major Indexes and A/D Lines.
Key Tiger
Software ETF Charts
Bullish MAXCPs
Bearish MINCPs
(no Bearish... tonight)
The last few days have seen big jumps in
our "Gang of 5"
anti-Dollar plays:
1) Commodities,
2) Crude Oil Stocks,
3) Gold stocks,
4) Foreign Stocks and
5) the Chinese major stocks'
ETF, YINN.
Recently they have stopped being the
"Five Horsemen of
a Deflationary Apocalypse". Their rises
were all a very
predictable response to growing
expectations that the
Fed would keep rates unchanged a lot
longer than previously
expected. The poor May Jobs' Report has
reinforced this
view.
Will this Inflation-Loving "Gang of 5" keep rising?
I would watch Gold stocks. Gold
Stocks are the leader.
Gold turned up first and gold stocks are
the strongest of "Gang of 5".
If Gold stocks are any indication of what
lies ahead now for this
Gang of Five, then they all are likely
entering a wild phase where
they could go up even faster, provided
Gold stocks now achieve
a new breakout.
I suspect the Dollar's weakness will now
cause the Fed to do or
say something to try to get the "Gang of
5" to retreat. The Fed's
highest priority is usually to protect
the Dollar and retrain the
"Gang of 5". You can see negative
non-confirmations by the
Accum. Index as YINN and Foreign Stocks
have rallied to their upper band.
===========================================================================
6-7-2016 Wall Street has to like Hillary's
clear victory over Sanders
in the "big enchelada", California.
Still. Sanders got 43%
of the vote. The Fed would be wise to
take note and not
cause another big market sell-off or
serious recession by
raising rates prematurely, otherwise a
true populist will
win next time.
The DJI would now need to close up 1% and
the Peerless V-I
would have to fall 9 to turn negative and
bring on a "S9V".
A 180 point jump tomorrow seems
unlikely. Though breadth
is still very positive and
Down Volume keeps falling, it's not
at
all clear that Volume will be high enough
to take the DJI
much past 18000, 62 points away. Note
that the Accumulation
Index stands at only +.037. There is
still a lot of big money
selling.
But with Peerless operating on a Buy B11
and DIA's Closing
Power still rising, I think we can expect
still higher prices, all
made gradually and grudgingly from the
Bears, who have
been unable to produce any
MINCPs again tonight.
Hold DIA
and UCO. The beaten down
Oil and
Gas stocks
are getting a good play here. Often they
get nice rallies when
the rest of the market is tiring. So, do
Biotechs, but they now
show a red Sell.
Charts: Peerless
DJIA Hourly DJIA
DIA SPY
QQQ IWM
DJI-Utilities
DJI-Rails
A/D Line-6000 Stocks
Crude Oil
SOXL TECL
Major
Indexes and A/D Lines.
Key Tiger
Software ETF Charts
Bullish
MAXCPs Bearish MINCPs
QUICKSilver
Short DUG.
Will Donald "Blow" It?
There are no cases going back more than
116 years of a Democrat
succeeding a sitting Democrat in the
White House, except by
death (Truman in 1945) or assassination
(LBJ in 1963).
Al Gore could not do it in 2000, even
after the fantastic stock boom
of the 1990's. Gore did not have the
baggage of poor judgment
or personal corruption that Hillary must
overcome. But Trump
could "blow" it. He will have to learn
some manners now to
appeal to a much larger audience. Can he
behave inoffensively
and sound responsible for even a week?
The next 5 months?
Was
his boorish, iconoclastic behavior all an act to win Republican
primaries? I suspect so.
I can't wait to hear his next big speech.
===========================================================================
6-6-2016 There is no S9V. The DJI closed only 1.2% over the 21-day
ma and the V-Indicator has turned positive
at +12. So, the
current Peerless signal remains a
Buy B11.
Bullishly, the 10-day
ma of NYSE Up-Volume is rising and the ma
of Down-Volume
is falling. The Closing Power for
DIA is rising, too. Hold DIA.
I suggested selling BBH and USD/SOXL on
today's strength.
Utilities again populate the
602 MAXCPs Bullish ranks more heavily
than any other group. But it cannot be
said this is only a defensive
rally. There were 1214 more up than down
on the NYSE. Oil jumped
as did
commodities and
oil stocks. I believe this is a
constructive
sign; we do not want world-wide
Deflation. The market seems to
agree, though the FED probably has
serious doubts.
See below how bullish Crude Oil's
internals are. I suggest buying it.
It might retreat a little, but look at
how high its Accum. Index readings
are and how its Closing Power is rising.
Professions are buying it
away from the Public and overseas'
sellers.
Charts: Peerless
DJIA Hourly DJIA
DIA SPY
QQQ IWM
DJI-Utilities
DJI-Rails
A/D Line-6000 Stocks
Crude Oil
SOXL TECL
Major Indexes and A/D Lines.
Key Tiger
Software ETF Charts
Bullish MAXCPs Bearish
MINCPs
Yellen spoke today and revealed a lot by
saying so little. The FED
is in a quandary. If it raises rates, it
could tilt decisively down the
monthly Jobs numbers and start a
recession. On the other hand,
commodity prices are starting to rise at
a pace that gives ammunition
to the Hawks. The market certainly
believes that there will be
no rate hike in June and probably none in
July.
Usually markets do not uncertainty. So,
the rally is telling us
not only is it close to certain that the
Fed will do nothing in June
but it approves of the Presidential
candidates. Trump is shedding
much of his populist pretensions and
Hillary never had them and
will make Wall Street proud of her.
Wall Street, in general, probably
considers Hillary the better,
safer, more orthodox candidate. But it's
anybody's guess if
she can win. Most of the Sanders'
supporters I have talked
with say they will not vote for her. She
cannot be trusted,
they say. And her judgment can be easily
questioned.
What Will Market Do if Trump
Becomes Next
President?
So, let's assume here for a minute that
Donald Trump
is going to become the next President.
How does the market
react in an Election year when a
Republican is going to
come into the White House? Below are the
cases.
What are cases when Republican beats
Democrat since 1900?
60% odds of a rally to
August. But 100% probability
of a bear market the next
year based on 5 cases.
1920 - Bear Market
because of FED tightening to end post war inflation.
1921 was
sharply down until August.
1952 - 7% May to August
rally. Decline to Nov and year-end top.
1953 was down
10% for 6 months.
1968 - Sidewise until late
Summer Rally to Dec 2nd and then down hard.
1969 started a
bear market which did not end until mid 1970.
1980 - Recovery from Bunk
Hunt Bear Market and July breakout followed
a flat period from October to February.
Then one more rally until May 1981.
That was
followed by a bear market and much higher interest rates from
mid 1981 to August 1982.
2000 - Narrowing market and sidewise DJI for
2000.
Then followed a
bear market in 2001 until April 2003.
Tomorrow, we can consider how
the market and DJI have
behaved when a different Democrat becomes
President.
This would seem more plausible is she can first
show that
she can bear Sanders in California. On the
other hand, if
she were to lose to Sanders by a wide margin,
that would
probably show even more vulnerability for her.
============================================================================
6-3-2016
The current Peerless signal remains a
Buy B11.
The 10-day
ma of NYSE Up-Volume is rising and the ma
of Down-Volume
is falling. The Closing Power for
DIA is rising, too.
I would continue to hold DIA, but since
they have red Sell
signals, I would take the modest profits
in USD/SOXL
and IBB
unless there is big opening up. The bleak increase
in May Jobs "should" prevent the Fed from
raising rates this
Summer, but they may make a mistake here,
just as they have
all too often.
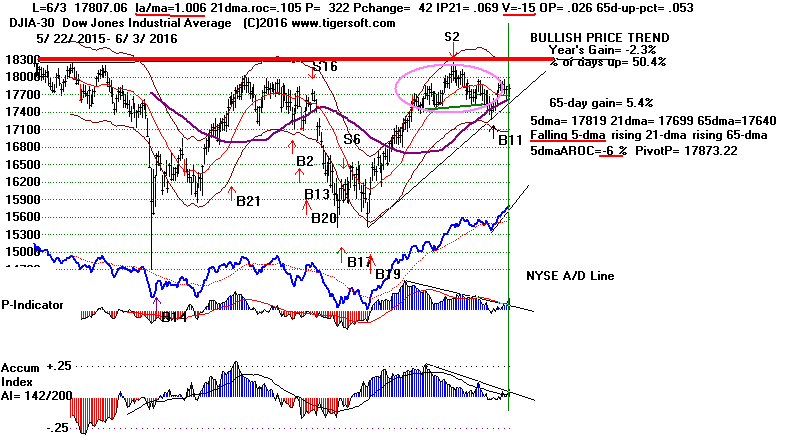

Charts: Peerless
DJIA Hourly DJIA
DIA SPY
QQQ IWM
DJI-Utilities
DJI-Rails
A/D Line-6000 Stocks
Crude Oil
SOXL TECL
Major
Indexes and A/D Lines.
Key Tiger
Software ETF Charts
Bullish
MAXCPs Bearish MINCPs
QUICKSilver
The Bad Jobs' Report for May
Will Surely Prevent Fed from
Raising Rates,
but Might There Be A Recession Soon Anyway.
The May Jobs report raises the specter of
a recession just
ahead. Larry Kudlow's comments are worth
reading about
this.
http://www.breitbart.com/video/2016/06/04/kudlow-on-mays-poor-employment-report-we-are-in-a-mild-business-recession/
With interest rates already low, how much
more can the Fed do
to stimulate the economy? Because of the
Congressional gridlock
and Obama's indifference to the fiscal
benefits of a new Federally
funded Public Works program, there will
be no new fiscal stimulus
to help out a stalling national economy
this year. By next year,
it may be too late. Manufacturing is
weakening and consumers
are tapped out as far as credit goes,
So, what will hold the market up?
Manipulated higher profits? More
exportinf of Jobs to cut costs?
More share buy-backs and monopolistic
take-overs?
Monthly Jobs'
Numbers
Red indicates the Number
was below the same month
a year earlier.
P indicates preliminary. |
| Year |
Jan |
Feb |
Mar |
Apr |
May |
Jun |
Jul |
Aug |
Sep |
Oct |
Nov |
Dec |
| 2006 |
278 |
316 |
281 |
183 |
23 |
82 |
207 |
181 |
158 |
4 |
208 |
171 |
| 2007 |
240 |
90 |
189 |
79 |
143 |
78 |
-33 |
-24 |
88 |
85 |
115 |
97 |
| 2008 |
19 |
-86 |
-78 |
-210 |
-185 |
-165 |
-209 |
-266 |
-452 |
-473 |
-769 |
-695 |
| 2009 |
-791 |
-703 |
-823 |
-686 |
-351 |
-470 |
-329 |
-212 |
-219 |
-200 |
-7 |
-279 |
| 2010 |
28 |
-69 |
163 |
243 |
522 |
-133 |
-70 |
-34 |
-52 |
257 |
123 |
88 |
| 2011 |
42 |
188 |
225 |
346 |
73 |
235 |
70 |
107 |
246 |
202 |
146 |
207 |
| 2012 |
338 |
257 |
239 |
75 |
115 |
87 |
143 |
190 |
181 |
132 |
149 |
243 |
| 2013 |
190 |
311 |
135 |
192 |
218 |
146 |
140 |
269 |
185 |
189 |
291 |
45 |
| 2014 |
187 |
168 |
272 |
310 |
213 |
306 |
232 |
218 |
286 |
200 |
331 |
292 |
| 2015 |
221 |
265 |
84 |
251 |
273 |
228 |
277 |
150 |
149 |
295 |
280 |
271 |
| 2016 |
168 |
233 |
186 |
123(P) |
38(P) |
|
|
|
|
|
|
|
|
|
The Jobs Report was
terrible. Only 38,000 new jobs were created,
or 73,000 if you leave out the Verizon
strikers. This marks the
6-th month of the last seven that the
monthly Jobs numbers were below
what they were a year ago. (Such
comparisons allow for adjusting
for Jobs' seasonality and the temporary
boost to employment that
comes most Summers.)
That this is the sixth
down-month
out of the last seven
brings July 2007 to mind. That is a
frightening thought. Back
then breadth was lagging and we got a
Peerless S9. Any breadth
deterioration now would add to the risks
now. Note in the 2007
chart, there was one last rally to new
highs and then two final
head/shoulders tops. Even a rise of Red
10-day Down Volume
over the Blue 10-day Up Volume now could
trigger a 10%+
sell-off as it did in 2007. The market
needs to keep rising and
appear to shrug off this Jobs' report.
Peerless says it can. I
admit to being doubtful!
Also very worrisome, is the extent to
which so many Jobs and
new Jobs are part-time (less than 35
hours a week.
============================================================================
============================================================================
6-2-2016 Continue to hold
DIA, IBB
and USD. Up volume
is bullishly rising while Down volume
is falling
on a 10-day. All three ETFs have
rising 5-day ma
and Closing Powers, too. The market's
strength
for the last two weeks suggests the
economy will
get good news on the Jobs' front. But
too good a
Jobs' report tomorrow, say, above
250,000 for May could
turn out to be too good. Such a number
would likely
be seized upon by Hawks who want the
Fed to
raise rates in June or July.
The current
Buy B11
keeps pushing the DJI up
towards and against the 18000
resistance. Even
though the NYSE A/D line has made new
12-month
highs, the DJI's rally keeps stalling
out. Eventually,
after enough failed efforts, I believe
it will turn down
just like the DJI did in 1976 after
nine separate attempts
to surpass 1000-1020.
Breadth is much better than it was in
1976, also a
Presidential Election Year, but our
current DJI chart
shows a still extent head/shoulders and
negative V-I readings.
By themselves, these are warnings that
the next 2% rally
will probably bring another Peerless
Sell.
Charts: Peerless
DJIA Hourly DJIA
DIA SPY
QQQ IWM
DJI-Utilities
DJI-Rails
A/D Line-6000 Stocks
Crude Oil
SOXL TECL
Major
Indexes and A/D Lines.
Key
Tiger Software ETF Charts
Bullish
MAXCPs Bearish MINCPs
QUICKSilver
Tomorrow's Job Numbers
Perhaps, the Jobs Report tomorrow AM
will somehow
bring a jump in the DJI. Eight of the
last eleven months have
shown falling jobs' numbers compared to
the year before.
I suspect a really nice improvement
from last month, in the
neighborhood of 225,000-235,000 new
jobs would set off
a rally. It would be a "Goldilocks"
number, not so low as
to scare traders into believing a
recession is closing in on us
and not so high as to give the Hawks
good ammunition to
raise rates.
On the other hand, another weak number,
below 150,000, would be positive in the
sense that it should
weaken the case for a rate hike,
but it would also make
the economy appear to be weakening just
when the FED is
about to decide to do nothing or even
raise rates. Lastly, a
really high number could bring an
upside spike in the market,
but then there will be 'second
thoughts' about how it will
make it easier for Hawks to justify a
rate hike.
See the monthly Jobs' table below from
the Dept. of Labor.
http://data.bls.gov/timeseries/CES0000000001?output_view=net_1mth
| |
| |
Jan |
Feb |
Mar |
Apr |
May |
Jun |
Jul |
Aug |
Sep |
Oct |
Nov |
Dec |
| 2006 |
278 |
316 |
281 |
183 |
23 |
82 |
207 |
181 |
158 |
4 |
208 |
171 |
| 2007 |
240 |
90 |
189 |
79 |
143 |
78 |
-33 |
-24 |
88 |
85 |
115 |
97 |
| 2008 |
19 |
-86 |
-78 |
-210 |
-185 |
-165 |
-209 |
-266 |
-452 |
-473 |
-769 |
-695 |
| 2009 |
-791 |
-703 |
-823 |
-686 |
-351 |
-470 |
-329 |
-212 |
-219 |
-200 |
-7 |
-279 |
| 2010 |
28 |
-69 |
163 |
243 |
522 |
-133 |
-70 |
-34 |
-52 |
257 |
123 |
88 |
| 2011 |
42 |
188 |
225 |
346 |
73 |
235 |
70 |
107 |
246 |
202 |
146 |
207 |
| 2012 |
338 |
257 |
239 |
75 |
115 |
87 |
143 |
190 |
181 |
132 |
149 |
243 |
| 2013 |
190 |
311 |
135 |
192 |
218 |
146 |
140 |
269 |
185 |
189 |
291 |
45 |
| 2014 |
187 |
168 |
272 |
310 |
213 |
306 |
232 |
218 |
286 |
200 |
331 |
292 |
| 2015 |
221 |
265 |
84 |
251 |
273 |
228 |
277 |
150 |
149 |
295 |
280 |
271 |
| 2016 |
168 |
233 |
208(P) |
160(P) |
|
|
|
|
|
|
|
|
| P : preliminary |
|
|
The good
news is the Peerless Buy signal,
the rising trendline and excellent
breadth.
The bad news is that the DJI has stalled
out
on nine separate tests of 18000-18300
and Volume has been low on the current
rally.
2015-2016
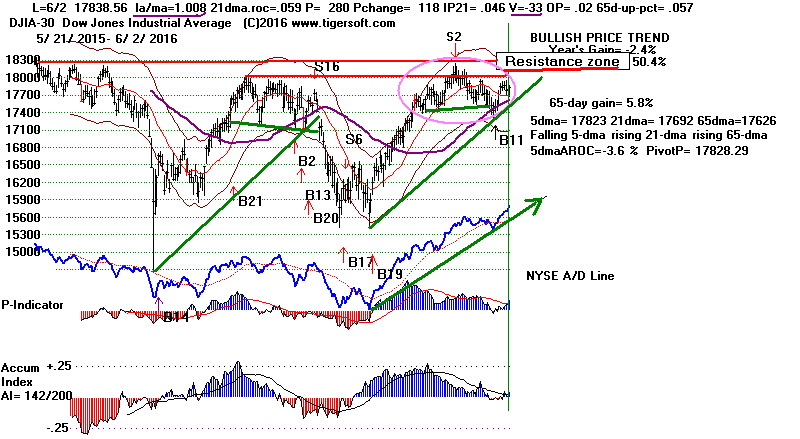

1976 suggests this dull, sidewise market could
last until the end of the year because it is a
Presidential
Election Year and because the NYSE A/D Line
is stronger than the DJI.
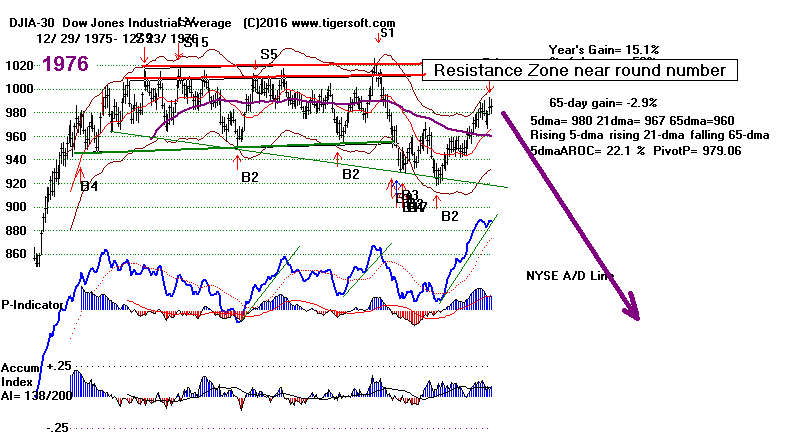

===========================================================================
6-1-2016 I take the current
Buy B11,
the continuing good
breadth (There were more than 2000 up
then down
on NYSE today.), the fact that the
DJI closed 100
points up off its lows, the continuing
strength in
volatile Semi-conductors and stubborn
leadership
by many Utilities, all to mean the DJI
will go
still higher this June and the Fed will
not be
raising rates this month.
Charts: Peerless
DJIA Hourly DJIA
DIA SPY
QQQ IWM
DJI-Utilities
DJI-Rails
A/D Line-6000 Stocks
Crude Oil
SOXL TECL
Major
Indexes and A/D Lines.
Key
Tiger Software ETF Charts
Bullish
MAXCPs Bearish MINCPs
QUICKSilver
Semi-Conductors strength now
shows that speculative energies
are still present to some degree.
This is not entirely a defensive advance.
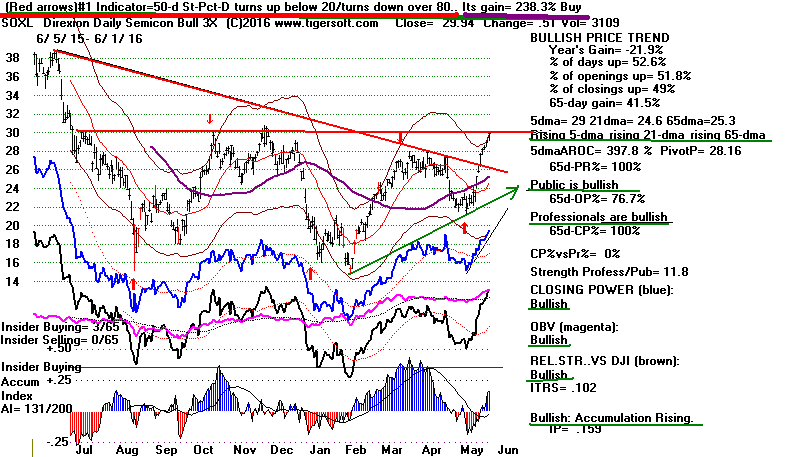
Up Volume is now bullishly rising. I
think it
is likely we will see a Sell S9V if DJI
should
jump up 1.6%. I suspect this will occur
on June
16th when FED does not raise rates.
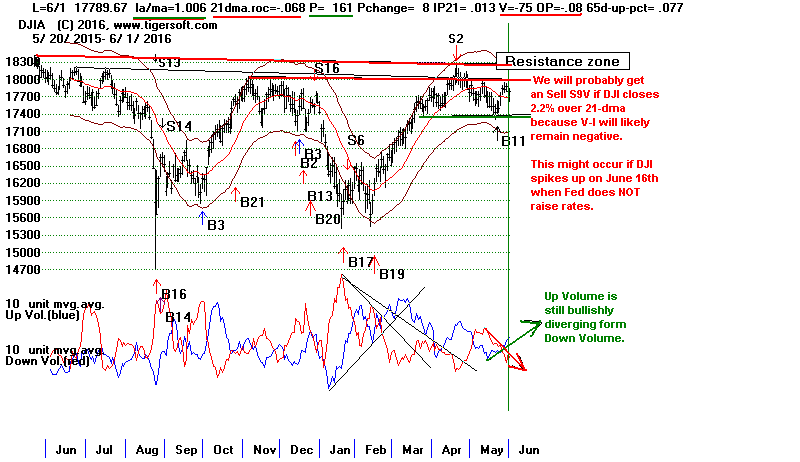
But that is mere speculation. As I
warned last night,
we still must watch the DJI. A drop by
it below 17400
would probably show that
insider-Professionals have
learned that the FED will be raising
rates, possibly despite
another weak Jobs' report.
The Utilities remain in uptrends and are
unusually
well-represented among our MAXCPs. That
shows the
Doves on the Fed are still ascendant and
have not yet
been overcome by the Hawks.
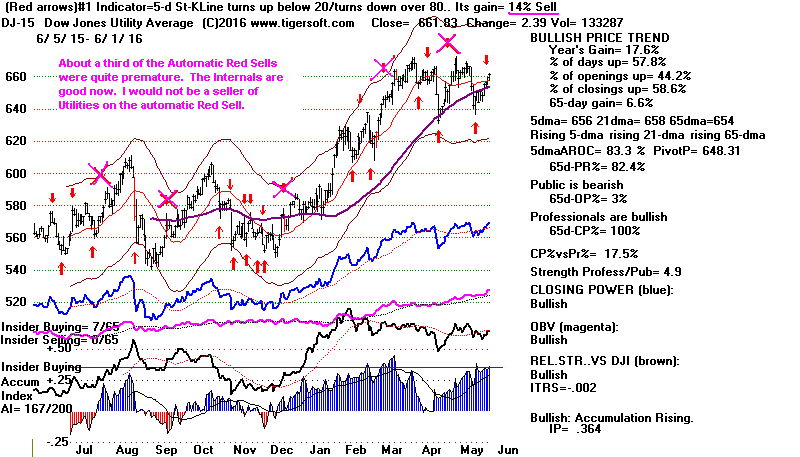
===========================================================================
5-31-2016 Different segments of the market are viewing
quite
differently the likelihood of a June rate
hike by the FED.
Utilities and
NASDAQ stocks are holding up, but the
DJIA is aiming to retest 17500.
For
now I would
still trust the good breadth and the
fact that
the
operative Peerless signal remains a
Buy B11.
Hold DIA,
IBB and
USD (semi-conductors) even
though
the DJI's bearish head/shoulders' pattern
has not been
destroyed by last week's rally and a drop
below 17400 would
be quite bearish. See also that the
uptrend for DIA's Closing
Power was violated today.
Charts: Peerless
DJIA Hourly DJIA
DIA SPY
QQQ IWM
DJI-Utilities
DJI-Rails
A/D Line-6000 Stocks
Crude Oil
SOXL TECL
Major
Indexes and A/D Lines.
Key
Tiger Software ETF Charts
Bullish
MAXCPs Bearish MINCPs
QUICKSilver
Buy B11 is active Peerless
Signal.
but it looks like there will
have to
be another test of the rising
65-dma.
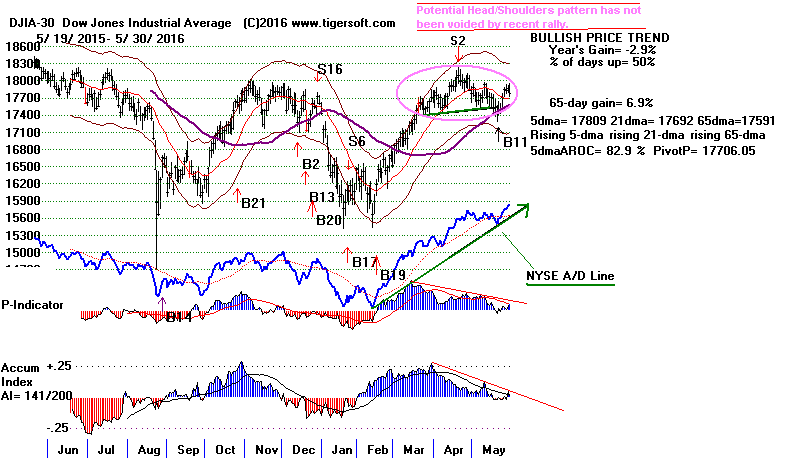
DIA's Closing Power has violated
its uptrend. This is short-term bearish
for DIA.
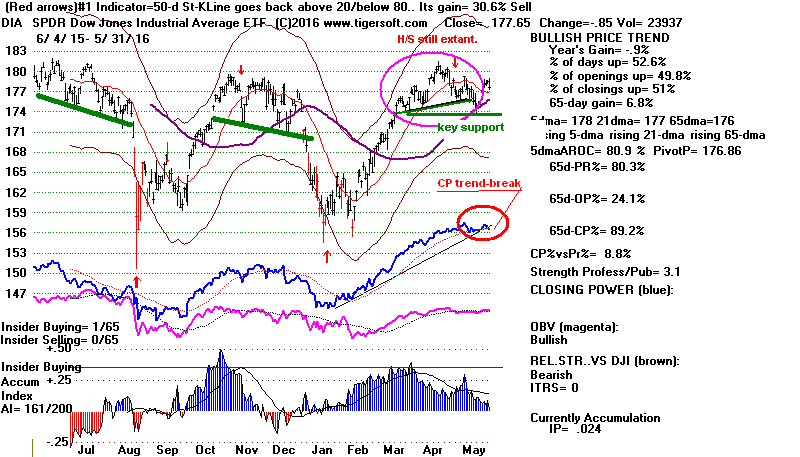
A FED Rate Hike?
My sense is that a rate hike in June
could easily
send the market reeling: the QE bubble
cannot be safely
reduced without a much stronger economy
and until
short selling is prohibited on
down-ticks. The FED
has erred before and could err again on
June 15th.
(Google "Blunders" and "Federal
Reserve". See for
example:
http://www.federalreserve.gov/boardDocs/speeches/2004/200403022/default.htm
)
It's a good bet, I think, that they could
raise rates in June
and that will send the weakening market
into a downward spin.
That would, in turn, seriously damage the
weakest economic recovery
in years.
Reading about their past mistakes is
quite unnerving.
See my recounting the Fed blunder of
October 1931
in last night's Hotline. They have
always erred on the side of
fighting phantom-inflation. What's more,
historically, they
are far more likely to raise rates in a
Presidential Election
Year when a Democrat is in the White
House.
DJI Head/Shoulders Patterns Can "Trump"
Good Breadth and Bring on
Higher Interest Rates:
The Lessons of 1977 and 2001.
It is important, therefore, to note that
the DJI can lead the
market down sometimes even when breadth
is good when
the completes a head/shoulders pattern.
That was especially
true in 1977 and 2001-2.
In 1977, it was the DJI's H/S and
subsequent break
in the NYSE A/D Line uptrend that started
that year's bear
market. The DJI-30 stocks, in effect,
were anticipating much higher
interest rates and Carter's fiscal
austerity better than the
A/D Line or NASDAQ did.
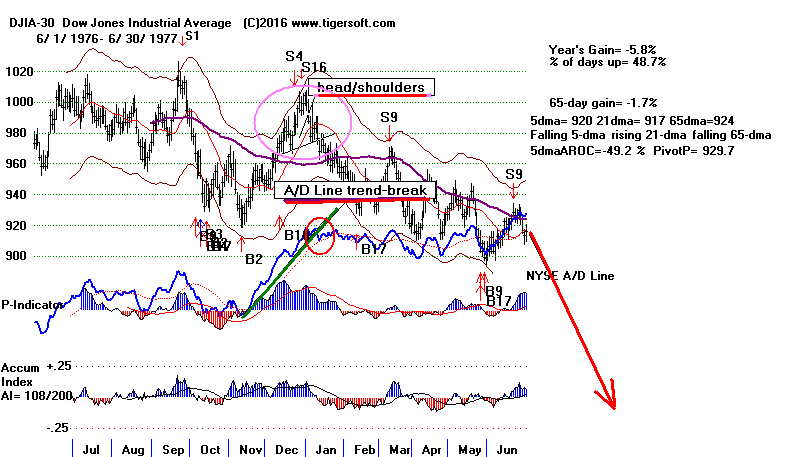
In 2001-2002, it was a DJI head/shoulders
that was the best
alert to the bear market that followed.
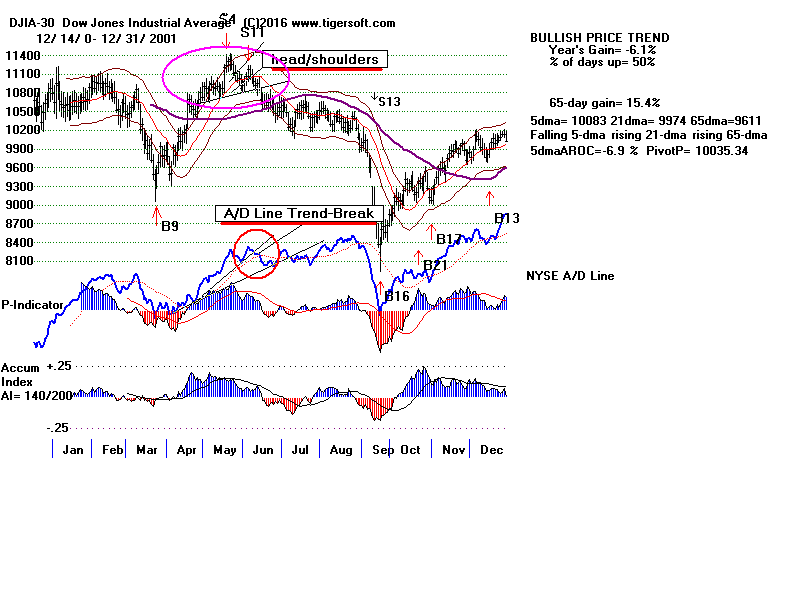
===========================================================================
5-27-2016 The
operative Peerless Buy B11 tells
us to continue to
hold DIA.
I have also suggested IBB and USD,
Breadth
is bullish now, as the NYSE A/D Line is
making new highs
ahead of all the major market indexes.
Professionals
are clearly net buyers, in the sense that
we see many more
MAXCPs than MINCPs (331 to 40) and the
Tiger Closing
Powers are rising for
DIA, SPY,
QQQ, IWM,
SOXL
and TECL.
Volume was quite low last week, but
prices still rise.
This warns that there will probably not
be enough buying
to fuel much of a breakout. So, I
suspect this rally will
reverse on a Sell S9V when the the DJI
spikes above the
2.3% upper band around the 21-dma. The
DJI on Friday
closed 1.0% over the 21-dma but the
Peerless V-Indicator
stands at -95. But for now, the 10-day
ma of Blue Up-
Volume has risen above the Red
Down-Volume. See these
indicators in the DJI chart just below.
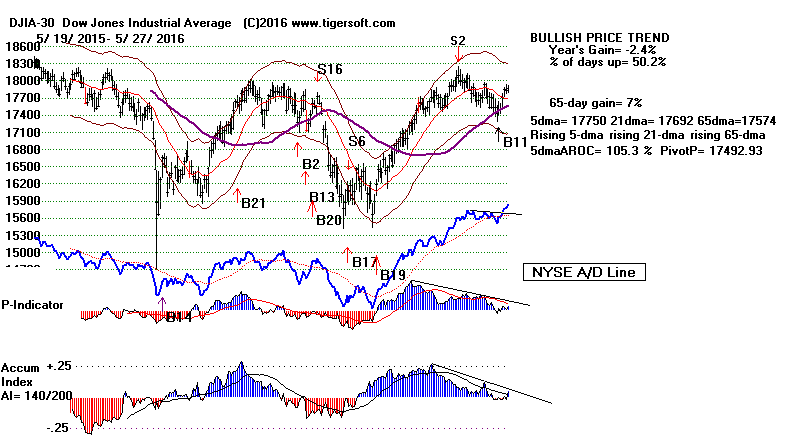


With IBB
(biotechs' ETF) and USD (Semi-conductors ETF)
I would suggest watching their 5-day ma
pivot points. This
means that we should sell them if they
close below the QuickSilver
pivot-point posted currently for the next
day. Presently,
the 5-day ma for IBB is rising at an
annualized rate of +222%
and will turn down only if IBB closes
below 266.03, more
than 10-points below today's close. For
USD, the 5-dma
is rising at a annualized rate of 399%
and will not turn down
tomorrow unless USD closes below 81.25,
which would be
a 5.45 decline tomorrow.
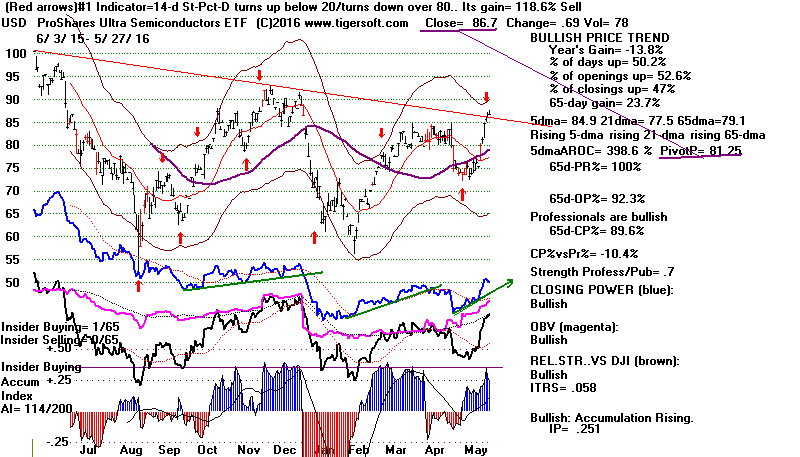
Seasonality is bullish for the next ten
days, but turns
bearish after than. Since 1965, the DJI
has risen 56%
of the time. But after that, it turns
down and shows
a small average decline over the next
month.
Charts: Peerless
DJIA Hourly DJIA
DIA SPY
QQQ IWM
DJI-Utilities
DJI-Rails
A/D Line-6000 Stocks
Crude Oil
SOXL TECL
Major
Indexes and A/D Lines.
Key Tiger
Software ETF Charts
Bullish
MAXCPs Bearish MINCPs
QUICKSilver

Deflation's Dangers Are Long Forgotten
Assuming, a typical person does not read
much current news
until he or she is, say, 20 years old,
one would have to be 103
years old now to have read much about the
severe Deflation of
the Depression. Therefore it is only
natural that most economists,
politicians and pundits discuss Inflation
almost exclusively.
This partly helps explain why Janet
Yellen and the Fed Governors
are always talking about Inflation and
predicting its imminent return
to levels that will necessitate higher
interest rates. But there are
of course, other reasons why they
especially worry about Inflation.
And if we do not understand these
reasons, we will ourselves
be prone to underestimate their dangerous
proclivity to raise rates
when they should not.
First and foremost, Wall Street wants to
be the financial center
of the world. To the extent that the
Dollar sinks, hot International
Funds go elsewhere and the Dollar ceases
to be the world's biggest
Reserve currency. This is definitely not
something the Big Banks
that run the privately owned Fed can
allow.
At its extreme, inflation would also be a
source of high anxiety
to the Big Banks' main clients, very
well-off savers and bond-holders.
Hyper-Inflation would also make it very
difficult for the US Treasury
to borrow money. In that event, either
the super-rich would have to
be taxed much more or the Gov't would
soon need to print money
wildly. So class interest, pure and
simple, heavily predisposes the
FED to err on the side of preventing
non-existent Inflation, much
like now.
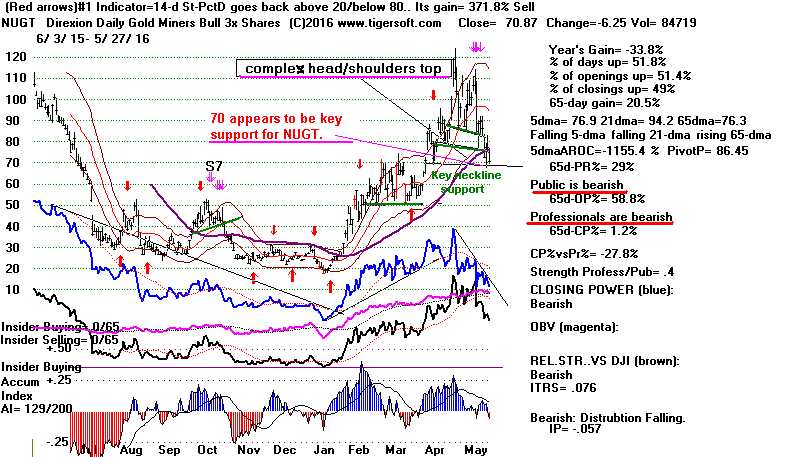
Nowhere was this clearer that when the
FED raised rates
and tightened money in the middle of the
Depression, all to
protect the Dollar. Arch conservative
Milton Friedman makes
the same point in arguing that it was the
Fed that turned a normal
recession into a Depression. Here is
Ben Bernanke's tribute to
Friedman.
http://www.federalreserve.gov/boardDocs/speeches/2004/200403022/default.htm
Not lowering rates fast enough in 1930
and then actually raising
Rates in 1931 caused thousands of small
banks to fail, which
in turn led to hoarding, disappearance of
credit and Deflation.
So, the Fed's obsession with Inflation is
a recurring theme in their
history. Often this obsession has caused
much hardship among
stock investors, not to mention the poor
folks who have been laid
off from work though no fault of their
own. Given this track record,
it must be surmised that the Fed will
again error on the side
of fighting non-existent Inflationary
forces. This is exactly what
they may do at their mid June FOMC
meeting.
So, we must watch the Closing Powers
closely for the key indexes
now. This reflects the insider
information that key Professionals
are getting from the big member banks
that control the Fed.
We also should watch our 4 horses of a
Deflationary Apocalypse.
Presently, 3 of 4 are all still in rising
intermediate-term trends, but
that could end, especially if the
European Central Bank's planned
purchase of 1 trillion Euros worth of
mortgages is stopped or
the YINN breaks down to new lows.
Tiger Commodities' Index (MASTCOMO)
-
55% of components are still
above their 65-dma
Crude Oil (UCO)
75% of Oil/Gas stocks are
still above their 65-dma (MASTOILG)
Tiger Foreign ETFs' Index (MASTETFS)
63% of Foreign ETFs are still
above their 65-dma
YINN
(ETF for biggest Chinese stocks)
24% of Chinese stocks are
still above their 65-dma
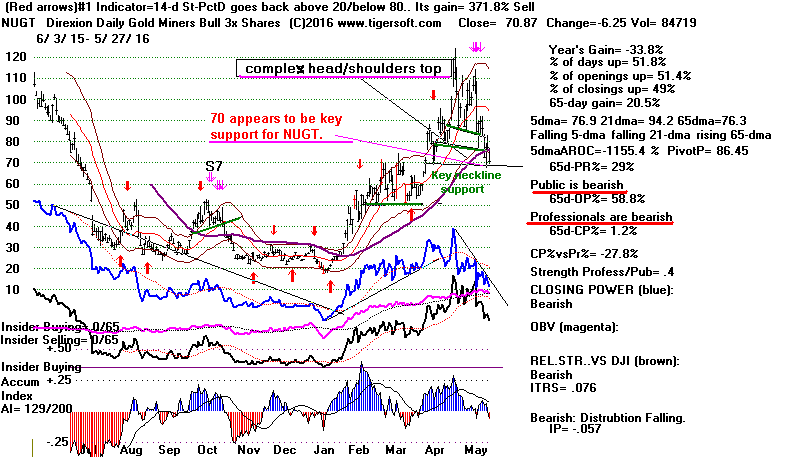
Why Do Gold
and Silver Appear
To Be Topping Out?
Gold and Silver tend to rise more when
Inflation is expected.
The low interest rate environment
finally did bring a recovery
in them this year. But now they show
bearish head/shoulders top
patterns, Red Distribution and
Professional Selling.
Could the apparent Gold and Silver tops
be predicting a
savage Deflationary turn? Some say this
is inevitable
given the steady fall in US consumer
buying as the Baby Boomers
reach retirement and as the Rich gobble
up an ever higher
proportion of national wealth and
income, but only use it
to buy stocks and bonds, rather than
spend it to keep
Consumption high and the economy strong.
Of course, average people are not in the
market like they were
in 1929. But an artificial bubble
surely exists now because
of the trillions the Fed has pumped into
Banks. What will
happen if the FED errors again and
raises rates to protect
the Dollar's prestige and international
position like they did
in the Fall of 1931? At least then, the
NYSE stopped allowing
depressing shorting on down-ticks.
There appear to be good reasons for some
caution now.
Small wonder that buying volume is
low.
============================================================================
5-26-2016 Peerless
is now on a Buy B11. Hold
DIA, IBB and
USD.
Breadth is excellent. The NYSE A/D Line
made a 12-month
high ahead of prices for any of the major
indexes. Professionals
remain much more bullish than they are
beaish. The number
of MAXCPs is 228 while there are only 32
MINCPs.
But volume would appear to be a problem,
See how the V-I
and OBV-Pct are quite negative. If the
DJI should reach a
point more than 2.2% over the 21-day ma
with the V-Indicator
negative, we will probably get a Sell S9V
(NNC) from Peerless.
DAILY DJIA Shows Rising A/D Line
and falling OBV. Most likely, the
flat
resistance overhead at 180250 will
not
breached by much. But we are in a
bullish seasonal period and volume
is
usually low before Memorial Day.
===========================================================================
5-25-2016 Peerless
is now on a Buy B11. Hold
DIA and IBB
long.
Buy
USD (Semi-conductors).
Charts: Peerless
DJIA Hourly DJIA
DIA SPY
QQQ IWM
DJI-Utilities
DJI-Rails
A/D Line-6000 Stocks
Crude Oil
SOXL TECL
Major
Indexes and A/D Lines.
Key Tiger
Software ETF Charts
Bullish
MAXCPs Bearish MINCPs
QUICKSilver
Seasonality is bullish. The DJI has
risen 62% of the time
over the next week since 1965. Its
average gain was +0.6%
in the five trading days following May
25th. In Presidential
Election Years, the DJI does even better,
rising 70% of the
time and averaging a 1% gain.
Today, the DJI closed 0.9% over the 21-day ma. Bullishly,
the NYSE A/D Line has made a new 12-month
high. This
shows that the advance is carrying more
than simply defensive
stocks higher.
Unfortunately, the Peerless volume
indicators are not so impressive.
The IP21 stands at only +.08 while the
Tiger "V-I" is -94 and
the "OBVPct" is -0.068. This warns us
that if the DJI closes
more than 2.3% over the 21-day ma next
month, we will probably
get a Sell S9V (based on the VI being
negative.)
So,
I expect the DJI to have difficulty again getting much past the
round number resistance at 18000, given
the low volume.
But, of course, volume and liquidity are
naturally low before
a three-day weekend. Monday is Memorial
Day, the day we
seek to honor our countrymen who were
killed in wars.
The market could surprise us and erupt to
new highs. After all,
we have no Sell now.
See how the DJI and SP-500
are now about to challenge their flat,
well-tested resistance lines.
Closes above these resistance lines
ordinarily bring an exciting
rush of short-covering and new buying for
a week or so.
Thus, the excellent Breadth could be
telling us to look for a breakout.
But, my sense, is that volume is
probably too low for a
real breakout run unless the market is
willing to risk a final
speculative and primarily short-covering
Summer rally such as
was seen just before the terrible
August-September tops in 1929,
1937 and 1987. That could be very
dangerous when breadth finally
weakens.
.
Charts: Peerless
DJIA Hourly DJIA
DIA SPY
QQQ IWM
DJI-Utilities
DJI-Rails
A/D Line-6000 Stocks
Crude Oil
SOXL TECL
Major
Indexes and A/D Lines.
Key Tiger
Software ETF Charts
Bullish
MAXCPs Bearish MINCPs
QUICKSilver
SP-500's Flat Well-Tested
Resistance,
as we like to say, "beckons for a
breakout."
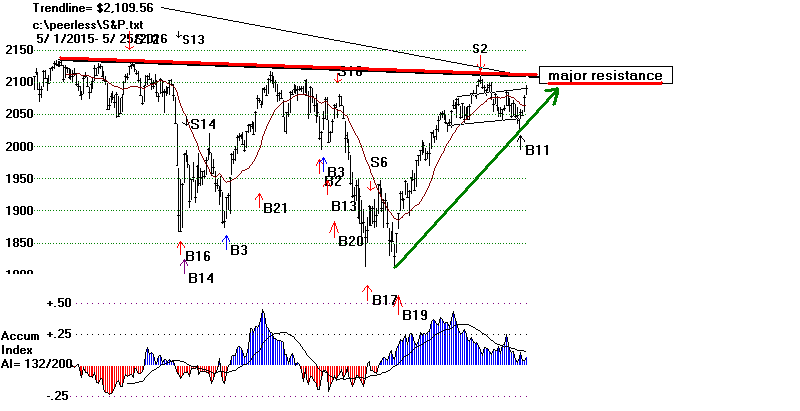

============================================================================
5-24-2016 Peerless
is now on a Buy B11. Hold
DIA long.
The
good news is that positive breadth is expanding
and Professionals are bullish many more
stocks than they
are bearish. The number of MAXCP is 341
and the number
of MINCPs is only 36.
Good shorts are hard to find.
(MAXCPs are Closing Power new highs and MINCPs are Closing Power new lows.)
The DJI
shot up 200 points past its rising 65-dma. We might
attribute some of this strength to
reduced liquidity ahead of the
3-day Memorial Weekend. But the market
was ready, I think,
for another crack at the 18000
resistance. The internals for the
DJI were not very weak and the A/D Line
just would not stay down.
The A/D Line is close again to scoring
another new high ahead
of the DJI. This has to be bullishly
construed, just as the
successful test of the rising 65-dma is.
Biotechs are turning around after
a sizeable decline. IBB
seems a reasonably safe buy.
Semi-conductors (SOXL
and the elite technology stocks in our
Nifty-35 (TECL)
are the likely leaders here, provided the
NASDAQ
can keep rising and the
DJI,
OEX and
SP-500 can
advance past the resistance of their
right shoulder apexes.
For the second time in three days, there
were 3x more stocks
up than down on the
NYSE. So, the rally holds some
promise to be more than simply a
defensive rally that will
quickly fizzle.
Charts: Peerless
DJIA Hourly DJIA
DIA SPY
QQQ IWM
DJI-Utilities
DJI-Rails
A/D Line-6000 Stocks
Crude Oil
SOXL TECL
Major
Indexes and A/D Lines.
Key Tiger
Software ETF Charts
Bullish MAXCPs Bearish
MINCPs
QUICKSilver
Homebuilders jumped today. They
would probably not do
this if the Fed was actually going to
raise rates in June. Gold
is negatively correlated with the
market. So, I take
the sharp sell-off in Gold today to be a
sign that the market is less
fearful and in need of a haven for
capital. Certainly, Gold
was ready for some serious profit-taking.
Volume Remains Low
To Bring An Upside
Breakout.
The main problem now is that volume
remains low. In addition,
the 10-day ma of NYSE Down Volule is
still above Up-Volume and
both the P-Indicator and Accumulation
Index are in downtrends.
We should not expect a market-takeoff
based on Peerless.
None of Peerless Buy B11s in the period
from mid April to the
end of June gained as much as 6%. So,
the likelihood is for
another Peerless Sell somewhere between
18000 and 18350.
Buy
B11 from Mid-April to End of June.
Gain at
time of next
Peerless
Sell.
5/8/1959 .046
5/16/1986 .058
4/23/1993 .025
4/17/2006 .046
----------------------
Avg = 4.4%
On the subject of Gold's negative correlation
to the market:
"The
value of gold ...depends on factors such as political and economic unrest,
currency fluctuations
and inflationary expectations. Almost universally, those
factors that boost
the gold price serve to depress the price of equities."
http://www.gold-eagle.com/article/declining-stock-markets-gold
On the
subject of >30% NEM rallies predicting bear markets
in the DJIA.
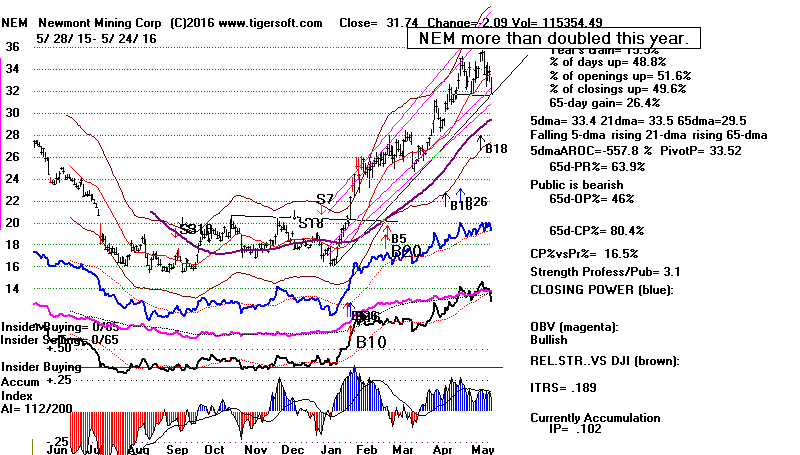
What Should We Make of This Year's
100% Vertical Advance in Newmont Gold?
I have said that rallies in the Gold
Stock NEM often
predict bear markets. Let me amend
that a little.
A volatile stock like NEM can rally
20% or 25%
and it is not very meaningful as a
predictor of the DJI.
And after it has dropped as much as we
saw last year,
it is very oversold and can bounce
back a long ways.
In a long bear market, like we saw in
2008-2009,
gold and silver stocks were very
depressed. They
were market leaders until 2011 and
then fell steadily
until the beginning of this year,
while the DJI was
mostly up. So, a big advance by NEM
after it is in
a long bear market was NOT a predictor
of trouble.
That may save
us here.
But the facts remain: there are many
cases where
Gold' rise and an advance by NEM of
more than 30%
are warning signs of trouble ahead for
the market.
Check out rises in 1968, 1971 and
1972-3 before
bear markets and Silvers explosion up
in early 1980
before the Bunker Hunt Bear Market of
Feb-April.
The 1987 example I high-lighted last
week.
Other Cases:
Greenspan was spooked in
January 1990 just as he was in
October 1987.
See also that NEM rose from
32 to 43 right before Kuwait
Invasion Bear Market of
1990.
NEM rose from 34 to 46, in
the period May to Sept 1997,
right before the DJI
swooned 14%.
It rose from 24 to 34.5 in
April '98, three months before DJI
peaked and fell 20% from
July to October.
It's advance from 17 to 30
in September 1999 was a warning
of the October 1999
sell-off and the start of a much deeper bear
market starting in January
2000.
In May 2001, before the DJI
dropped from 19500 to 17500,
NEM rose from 14 to
24.5.
Same thing happened in
November 2007. NEM had just
doubled.
There may a handful of
false positives, but I trust what I have found
and can explain why it's
reasonable to expect this "canary"
NEM to continue to work in
a helpful way in predicting the market's declines.
In our times now, the FED
is trying not to care about Gold,
but I think they will be
over-taken by events which NEM's and Gold's
big rises this year
portend.
James Dines often wrote about how
Gold's rises spelled
eventual trouble for the market. Maybe some
of you know of him and
would pass along what he said about this.
=================================================================================
Recent Hotlines
=========================================================================
5-23-2016 The DJI
could not stay above its 65-dma today. See in the
Peerless chart below see that its closed
2 points below that ma
today. Again tomorrow, I would have to
go with the Buy B11
provided the DJI can get back above the
65-dma. Keep in mind that
Seasonality is bullish in the week before
Memorial Day
(next Monday), so there is a good chance
we will be able to
act profitably on the Buy B11 that was
shown on Friday's close.
Traders, notice that the DJI will need to
close 38 points above
today's close to bullishly turn up its
short-term 5-day ma.
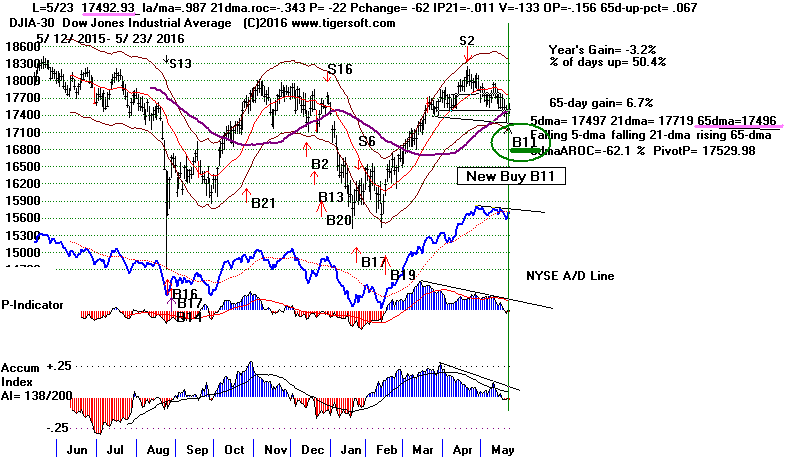
Modest Risk Now.
Look back at the charts of the past
Buy B11.
There are 7 cases where the paper losses
were between
1.5% and 3%, This accords with the 44%
historical probability
of the DJI dropping below a
head/shoulders' neckline after
a Buy B11. So, there is still a 35% to
44% chance of an additional
2% decline.
Modest Gain Potential
When we look back at the Buy B11s from
mid-April to the
end of June, we do see that the gains
were modest. So, again
I would expect only a limited rally,
probably back above 18000
but not above 18300.
Buy B11s
from Mid-April to End of June.
Gain
5/8/1959 .046
5/16/1986 .058
4/23/1993 .025
4/17/2006 .046
----------------------
Avg = 4.4%
Charts: Peerless
DJIA Hourly DJIA
DIA SPY
QQQ IWM
DJI-Utilities
DJI-Rails
A/D Line-6000 Stocks
Crude
Oil
SOXL TECL
Major
Indexes and A/D Lines.
Key Tiger
Software ETF Charts
Bullish
MAXCPs Bearish MINCPs
QUICKSilver
Some Stock Ideas
Using New "TigerSmart" Optimized Red Buys
So how might
we play a brief rally now? The
Bullish MAXCPs
are one way. Buying the highest AI/200 stock in
the DJI-30, CAT
would be another. A third way, I'd like to suggest
here, would be
be to buy the stocks giving new optimized Red Buys
where the
trading system would have gained more than 150% for
the last
year. In the next few days I will do a follow-up
of these. There
are 11 shown below.
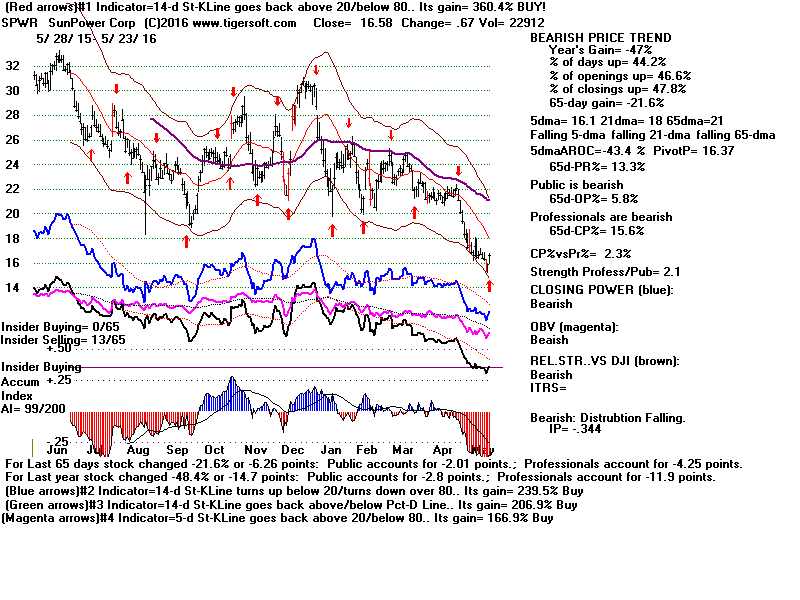 |
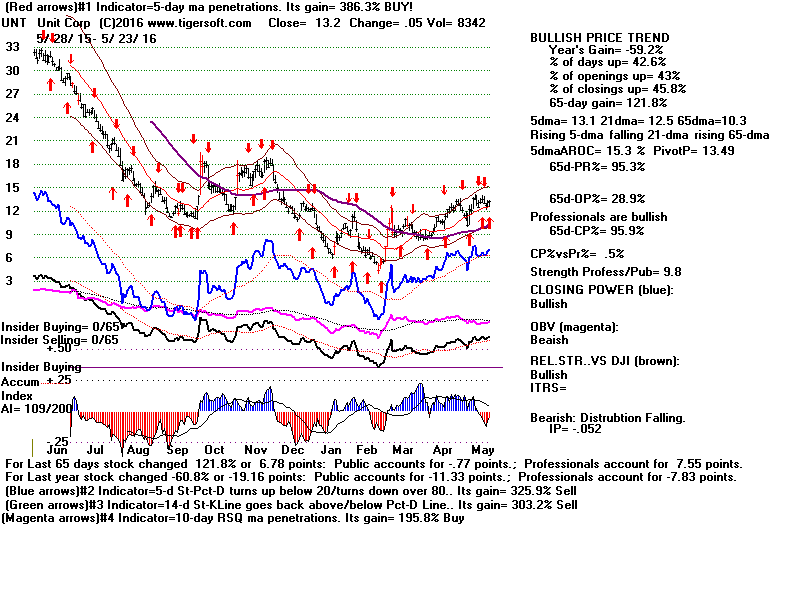 |
============================================================================
5-20-2016 Cover short in
DIA and take a long position in it
provided the DJI can stay above its 65-dma
tomorrow. If it cannot do this, we will
have to watch to
see if it can get back above its 65-dma
on Tuesday
and act then.
Friday brought a reversing
Buy B11. This
May B11
has problems and limitations. As for the
upside potential,
it seems unlikely that we will see much
more than a nominal new
high above 18300. This is because Buy
B11s in May and
June get gains only about half the size
of the 10% gains
that the signal typically brings.
It is important to appreciate also that
the B11 gains are much
smaller in a Presidential Election when
the US is not in a world war.
The three of these gained less than 2% on
average.
And there is risk, when a head/shoulders
pattern is present, since
the DJI breaks below the neckline (here
about 17400) 44% of the time.
This alone should probably get us to wait
another day.
But I think we do want to reverse
positions on DIA if the
DJI can stay above its 65-dma. There are
bullish forces at
work now. First, we do see support
coming in on each decline
below 17500. Secondly, we can guess that
the FED will be
most reluctant to raise interest rates if
the May Jobs Report
is as week as April's. Thirdly, there
ought to be a bit of a
recovery before Memorial Day. The DJI
has advanced
58% of the time over the next week since
1965. The average
DJI gain is 0.8% over the next two weeks.
And fourthly, the
Hourly DJI's OBV-Line did not confirm the recent drop to 17440.
Note the new Buy B11 on Friday. This
occurred because the DJI closed
back
above its 65-dma.
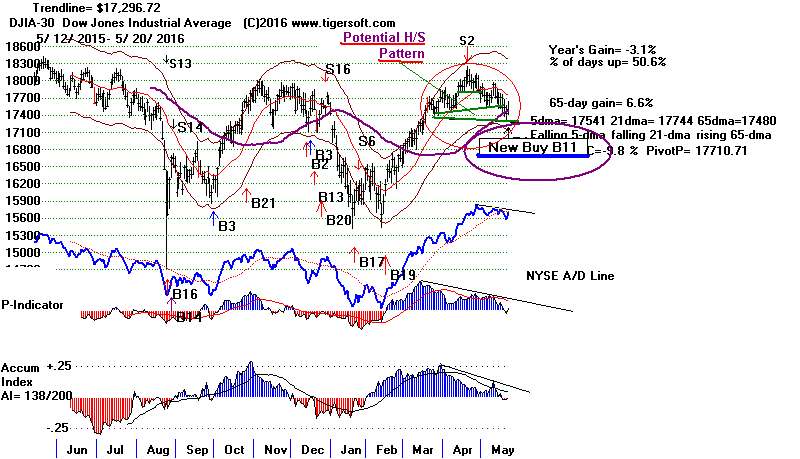
===========================================================================
5-19-2016 Stay short DIA.
There was no
Buy B11
signal today because
the DJI closed below its 65-dma by too
great a margin. The
presence of bearish head/shoulders
patterns in the DJI and
SP-500
make this market look different from the one other
case where there was a Buy B11 in May,
that was in
1986
when DJI was running upwards and making a
string of all-time
highs.
Charts: Peerless
DJIA Hourly DJIA
DIA SPY
QQQ IWM
DJI-Utilities
DJI-Rails
A/D Line-6000 Stocks
Crude
Oil
SOXL TECL
Major
Indexes and A/D Lines.
Key Tiger
Software ETF Charts
Bullish
MAXCPs Bearish MINCPs
QUICKSilver

The Market Is Being Held Hostage by
the FED.
. When Fiscal Policy Is Frozen in
Political Stalemate,
This Is What We Get!
A weak rally from here may still occur.
There may be a
bounce back to DJI-18000 if the the FED
does not raise rates in June.
For one thing, because it is a
Presidential Election Year, I think
we can expect the FED to be reluctant to
raise interest rates. For
another, the April Jobs' numbers showed
economic growth was
weakening. To the extent, that Yellen,
as a Democrat, chooses
to use her influence, she can say the
"consensus" of the next
FOMC meeting is whatever she chooses.
Only if she is outvoted,
will rates go up.
So perhaps, the DJI will try to rally
again to 18000 from where
it sits now, close to its 65-dma. For
us, without a Buy signal from
Peerless, any rally would seem to be
limited. And with the
head/shoulders pattern present, there may
be other bearish
news which could snag the market.
Overseas' Weakness
Again
As it is now, overseas' markets are all
significantly below their
65-dma. This calls into question whether
their turnarounds can
continue. If they do not soon recover,
we could be right back in
a deflationary world economy. How long
can the US hold
world's economy up then.
Populism is against any more free-trade
deals in this country.
What if the terrible "T" word is used,
namely tariffs. If Trump
or Sanders create a populist demand for
tariffs, the actual passage
of such tariffs could tip the already
fragile World Economy into
a Depression. Many economists blame the
1930 Smoot Hawley
Tariff for causing the 1930s' world-wide
Depression.
Let's watch the charts of all
foreign ETFs, in
Europe, in the
Developing
World, in Latin America and in
China.
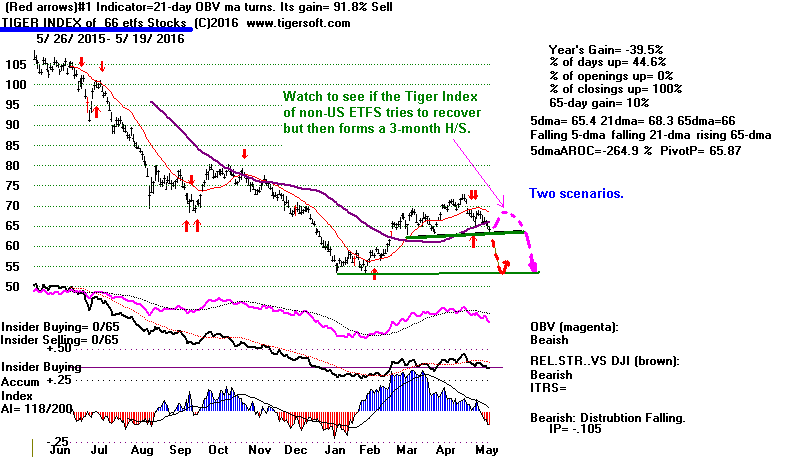
==========================================================================
5-18-2016 Stay short DIA.
Sell any longs if they break their steep
Closing Power uptrends. Every recent
rally has failed.
Professionals in New York must be getting
tired of seeing
their efforts to support the market be
quickly eclipsed
by weak openings the next day. This is
because Asian,
European
and
Emerging Markets seem to have ended their recovery.
;
The Head/Shoulders patterns in the
DJIA/DIA
and SP500/SPY
are classic. They are flat and they are
symmetrical. A clear
violation of its neckline will occur on a
closing below 17400.
Such a decline would also break the DJI's
65-dma. The minimal
DJI downside objective would then be
16900-17000.
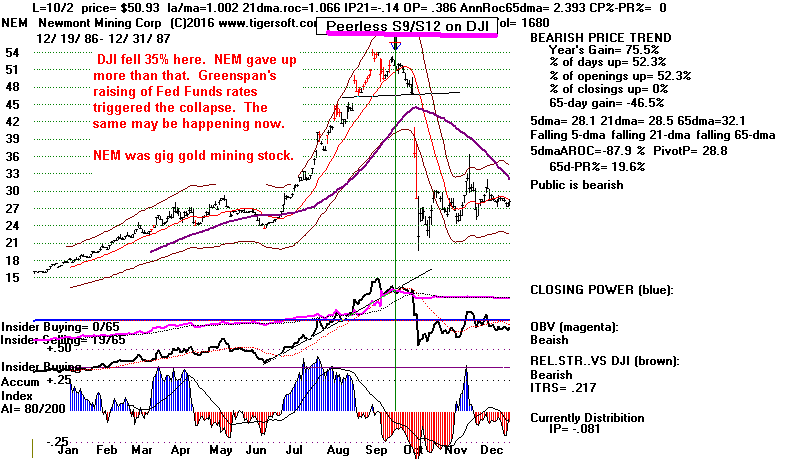
When the 65-dma is also broken
simultaneously,
these Head/Shoulders patterns are quite
reliable. I show
hundreds of these patterns in my Short
Selling book.
Their reliability is about 80% with
stocks in all markets.
What is striking now is how many of the
Tiger Indexes
of various sectors also show
head/shoulders patterns.
The history of the DJI since 1888 shows
at least a hundred
such top patterns. Maybe, maybe, there
are ten failures, i.e.
where prices fail to fulfill their
minimum downside price
objective. (See the links I posted last
night to see many
of these H/S patterns on the DJI.)
See
DJIA,
DJI-20,
DJI-30,
Commodities,
Foreign ETFs,
Housing,
Industrial Materials,
Natural Gas,
Russell-1000,
Software and
SP-500
The 1987 Lessons of Gold
#1 Gold Big 4-Month Rally Warns of
A Big Decline in DJI.
#2 Gold's New Warning: A Big Drop
Today. See NEM below
how its collapse in October 1987
coincided with the
DJI's 33% sell-off.
#3 Do Not Look to Gold To Be A
Safe Haven.
1987 Peak in Gold and Subsequent Crash
Today, the leveraged Gold ETFs,
NUGT and JNUG
fell
more than 25%! This reminds me how NEM
collapsed
in 1987 just before the Crash then. It
had risen sharply
beforehand. But only when it, too, began
a big sell-off
did the general market go over its cliff
in October. Not
only that, this case suggests that
Gold and
Silver will
not be a haven in the coming decline.

Charts: Peerless
DJIA Hourly DJIA
DIA SPY
QQQ IWM
DJI-Utilities
DJI-Rails
A/D Line-6000 Stocks
Crude
Oil
SOXL TECL
Major
Indexes and A/D Lines.
Key
Tiger Software ETF Charts
Bullish
MAXCPs Bearish MINCPs
QUICKSilver
“I
have seen the future and it doesn't work.” Zardoz (1971)
I get the feeling that Hillary, Obama,
the FED
and the market are all slow-walking
toward the
cusp of an avoidable economic debacle.
The Federal
Reserve's Helicopter is not taking off
again. The
dropping of a trillion dollars into the
hands of
Big Banks has run its course. It is not
at all clear what can
hold the market up now?
Fed Is Seriously Considering Raising Interest Rates
in June, Meeting Minutes Say
By NY Times - BINYAMIN APPELBAUM
"The
central bank sent an unusually frank message to Wall Street, delivered
in the official account of
the Fed's April meeting. "
The most recent FED minutes makes it
seem that they are
no longer able to resist the pressures
to raise interest-rates in June,
even though the US economy's growth is
stalled at 1%/year
and does not match even the growth of
population, much less
meet the needs of millions not working
full time. And
now we have a tightening monetary
policy?!
Where is the leadership? Federal
budgets barely get passed.
There is fiscal paralysis. For years,
it seems, the Republican
Congress continues to want to delay the
starting of a
much needed, massive Public Works
program. They
pay no political price for that. The
President, a Milton Friedman
follower from Chicago and monetarist,
acts like he is too
tired and too disinterested to have
another spat with Congress
over such a program, something that is
probably our last hope
to spark a real economic recovery.
Sanders does not help much. He is
totally preoccupied
tilting, Don Quixote-like, with the
Windmills of the
Democratic establishment. He has no
chance to become
President but every campaign speech he
makes attacking
Hillary's admittedly very poor judgment
and close ties with
Wall Street only gives new strength to
Donald Trump, the
insecure, egocentric wild-man
pretend-Populist.
So, I expect Trump to become the next
President. The risks
from that seem enormous and obvious.
The kindest thing I can
think to say is that no one has a clue
what a Trump administration
will do as President. Those who run
money and own big stock
positions have every right to be
perplexed and alarmed if the FED
unplugs the leaking dam walls in June.
(Maybe, they'll
reconsider).
The Head/Shoulders Patterns tell us
something not yet apparent
or visible is approaching the market and
getting ready to clobber
stocks. This could be the catalyst for
a steep decline. Once
the market starts melting down, new
Hellicopter runs may
not matter. Who will want to borrow
money to buy stocks
when the big dam breaks apart. Instead,
they may just use the
money to buy leveraged short-ETFs.
===========================================================================
5-17-2016 Stay short DIA,
Peerless did not issue a reversing
automatic Buy signal today even though
the DJI closed 1.6%
below the 21-day ma and the P-Indicator
remains positive at +98
and the current Accum. Index (IP21) is
only slightly negative
at -.012.
Charts: Peerless
DJIA Hourly DJIA
DIA SPY
QQQ IWM
DJI-Utilities
DJI-Rails
A/D Line-6000 Stocks
Crude Oil
SOXL TECL
Major Indexes and A/D Lines.
Key
Tiger Software ETF Charts
Bullish
MAXCPs Bearish MINCPs
QUICKSilver
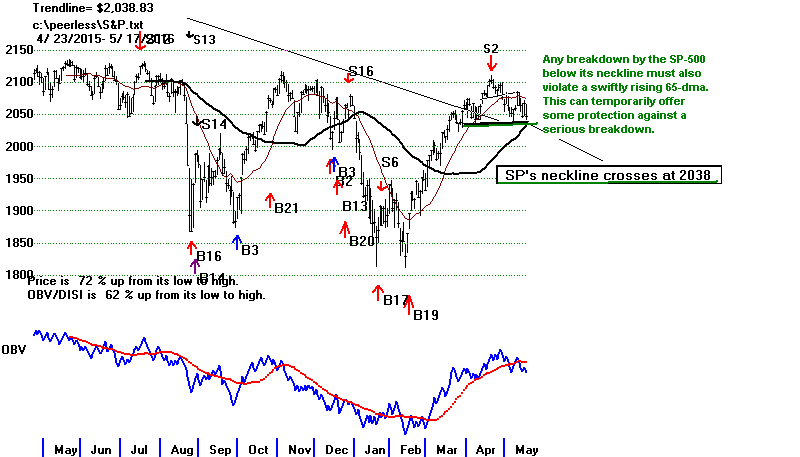
Tomorrow - Possibly a
Buy,
But Possibly A Judged
Sell, too
If Both Occur, They
Cancel
out Each Other.
If breadth is no worse than today, it
will only take a small
additional decline to bring a Peerless
Buy provided the
DJI closes not much below its 65-dma now
at 16427.
However, note that a deeper decline or
one on worse breadth
than today will most likely not bring a
Peerless Buy signal.
We also have to be concerned about
getting either a Tiger S5,
a Peerless S10 or a judged S10 if the
DJI closes decisively
below the H/S neckline drawn roughly
through the DJI's
recent hypothetical lows, 17440.
The H/S patterns we see now in the
DJIA,
SP-500 and
OEX
as well as the Tiger Indexes of
DJI,
SP-500 are nearly perfectly
symmetrical, flat and very easy for all
chartists to spot. Their
notoriety is thus enhanced and their
bearishness thus becomes
more self-fulfilling.
With head/shoulders patterns, we often
only later learn
why they are formed, i.e. what events
like invasions,
missile crises, assassinations,
terrorist attacks, new economic
policies lie behind them, But because
Gold stocks are rising
very steeply, I believe that they are
screaming a message
of caution for the general market. So,
stay short DIA for
now.
A
Judged S10
Would Still Be Bearish.
Because these recent DJI lows set up a
neckline in a head/shoulders
pattern that is less than 40 trading
days long, we may have to
judge a Sell S10 if the DJI closes
clearly below 17444.
That there have been no fewer than 7
reversals back up from
the neckline-support zone of 17444 to
17530, makes any decisive
breakdown more dangerous. These tests
of lows here go back
33 trading days.
H/S
Pattern's
neckline lows:
4/1/2016 17515
4/7/2016 17444
5/4/2016 17530
5/6/2016 17519
5/13/2016 17500
5/17/2016 17450
| |
More Reading
about Sell S10s: Both Automatic
and Judged.
www.tigersoft.com/judgedS10/index.html
Judged S10 Rules The results
from Peerless using automatic signals are
excellent. But they can be improved if one uses a
judged S10. The judged Sell S10 ...
www.tigersoft.com/HLZA15/
Oct 3, 2015 -
9/30/2015 The operative Peerless signal is
still the Sell S14. A DJI close below the well-tested,
flat support at 17000 would bes considered a judged
Sell S10.
|
|
==========================================================================
5-16-2016 We still have an operative Sell S2 to guide
us. Stay
short DIA.
In Presidential Election years this
signal has averaged about
a 7.2% decline in the DJI. To reach
this, the DJI will need
to close near 16800. Given the positive
breadth, blue
Accumulation and the rising 65-dma, such
a target seems
unlikely to be reached even given the
DJI's head and shoulder
pattern.
We could cover our short in DIA if the
DJI drops back towards
that 17500 neckline-support. But, I
would just trust that the Peerless
system will tell us when it is time to
buy back DIA and
go long. This is still a very defensive
market. If that
changes and volume rises more on an
advance, we can
then reconsider waiting for Peerless to
tell us to buy
again. But right now, let's wait to
cover. Buying at the
end of May often works out better.
This may all be mooted since a close near
17450 will likely bring
an automatic Buy B12, which is based on
buying when
the DJI closes at a rising 65-dma that
has not been
violated for 10 weeks or so.
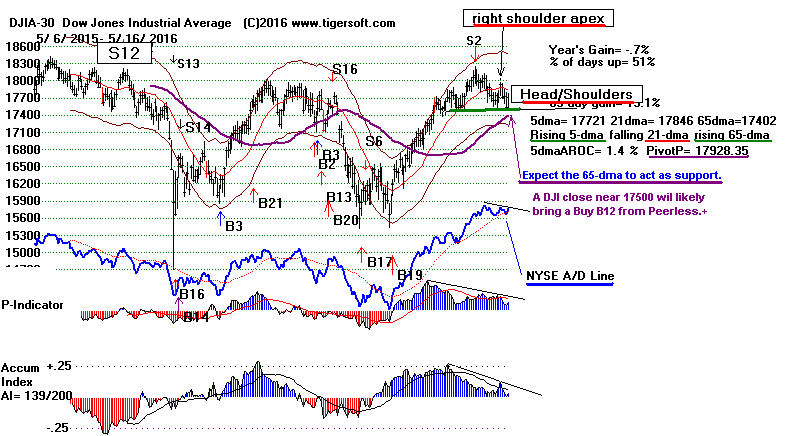

Trading Range Peerless Sell
S2s
in A Presidential Election Year, since 1928| PE = Presidential Gain if DJI Sold Short
Election Year and this position was
closed on next Peerless Buy.
=========================================================================
19480615 PE S2 193.2 .05 perfect
19481022 PE S2 189.8 .061 perfect
19560409 PE S2 518.5 .079 perfect
19560802 PE S2 521 .075 perfect
20000425  PE  S2             11124.82      .049    perfect
20000906  PE  S2             11310.64      .095    perfect
20001030  PE  S2             10835.77      .060    Very small Paper Loss

20040902  PE  S2             10290.28      .038    Very small Paper Loss
-------------------------------------------------------------------------
                                           Avg = 7.2%


                                       Charts:   Peerless DJIA  Hourly DJIA  DIA  SPY  QQQ  IWM
                                                 DJI-Utilities   DJI-Rails   A/D Line-6000 Stocks
                                                Crude Oil  SOXL  TECL
                                                 Major Indexes and A/D Lines.
                                                 Key Tiger Software ETF Charts
                                                 Bullish MAXCPs   Bearish MINCPs
                                         QUICKSilver

                                       Warren Buffet bet $1.1 Billion on Apples's stock
                                       in the first quarter.  He is not prone to make bad investment
                                       decisions.  He has friends on the FED.  They must have
                                       told him that they would not be raising rates.  But now
                                       he is down about 17% on that investment already.  Was his
                                       timing just bad?  Perhaps, tech stocks are just out of favor
                                       temporarily and this announcement will be the catalyst that
                                       they need.

                                       Let's keep an eye on AAPL and TECL, the leveraged
                                       ETF for techs.  Specifically, we will need to see
                                       their Closing Power downtrends be violated with
                                       them above their 65-dma.  Until that happens, I
                                       would assume the risks are judged by Professionals
                                       here to be greater than the potential rewards.

                   AAPL           To be a false breakdown, AAPL will need to stay
                                        above its support-line shown below for a week.
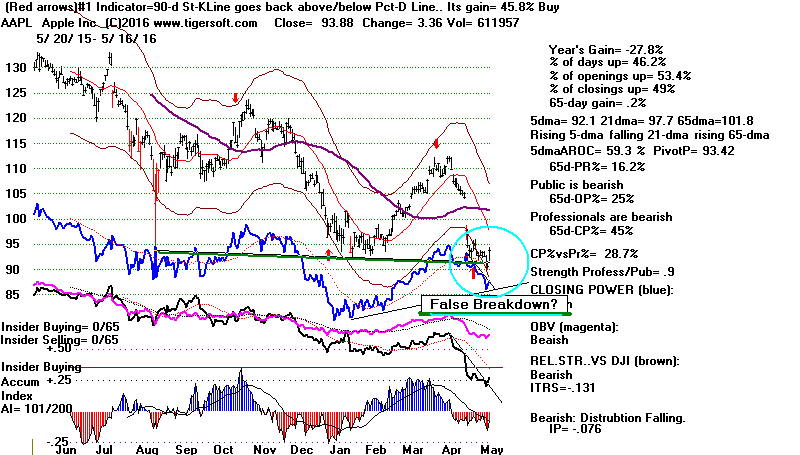 TECL looks ready to challenge 40 again if its Closing Power can
break its downtrend and it can close back above its rising 65-dma.
A strong day tomorrow would do that.
