Earlier Hotlines
previous hotline
earlier hotline
www.tigersoft.com/H77LION/INDEX.htm
www.tigersoft.com/H7TBR/INDEX.htm
www.tigersoft.com/HH9911/INDEX.htm
http://www.tigersoft.com/HH9911/olderINDEX.htm
http://www.tigersoft.com/HHH517/INDEX.htm
www.tigersoft.com/HHH517/XXXIndex.htm
www.tigersoft.com/HHH517/INDEX6917.htm
www.tigersoft.com/HHH517/OLDER.html
www.tigersoft.com/HH747/INDEX.html
www.tigersoft.com/HHLL217/INDEX.html
PREINDEX.html
www.tigersoftware.com/HL/INDEX.html
Hotlines: 2/4/2017 - 2/15/2017
These have somehow become corrupted. Some graphs may be
missing.
http://www.tigersoft.com/345HLN12/ZINDEX.html
http://www.tigersoft.com/333HLLL/INDEX.html
http://www.tigersoft.com/444HL444/INDEX.html
www.tigersoft.com/119HLPAZ/INDEX.html
http://www.tigersoft.com/888HLAZ/INDEX.html
www.tigersoft.com/821-HL/INDEX.html
http://www.tigersoft.com/816-HLN/INDEX.html
http://www.tigersoft.com/77HL7778/INDEX.html
http://www.tigersoft.com/64HRL/INDEX.html
http://www.tigersoft.com/55HL55/INDEX.html
HELP
A
Guide To Profitably Using The Tiger Nightly HOTLINE
Introduction to Tiger/Peerless
Buys and Sells.
Peerless Buy and Sell Signals: 1928-2016
Individual Peerless signals explained:
http://tigersoftware.com/PeerlessStudies/Signals-Res/index.htm
http://www.tigersoft.com/PeerInst-2012-2013/
Explanation of each Peerless signal.
http://www.tigersoft.com/PeerInst-2012-2013/
Different
Types of TigerSoft/Peerless CHARTS, Signals and Indicators
----->
More HELP LINKS
Documentation
for TigerSoft Automatic and Optimized Signals.
How
reliable support is the DJI's rising 200-day ma?
SPY
Charts since 1994: Advisory Closing Power S7s, Accum. Index, 65-dma,
Optimized Signals.
^^^^^^^^^^^^^^^^^^^^^^^^^^^^^^^^^^^^^^^^^^^^^^^^
1/19/2016 --->
Corrections,Deeper Declines and Bear Markets since 1945.
1/21/2016
--->
High Velocity Declines since 1929
2/12/2016 --->
Presidential Elections Years and Bullish IP21 Positive Non-Confirmations at
Lower Band.
2/12/2016 --->
OBV NNCs
on DJI's Rally to 2.7% Upper Band when DJI's 65-dma is falling.
11/6/2016 --->
Killer Short Selling
Techniques: ===>
Order Here
($42.50)
It's As Easy as
1,2,3
TigerSoft "Combination" Short-Selling...
Easy as 1-2-3 Short Sales
Earlier Q-Answers
QuickSilver
Documentation (1/11/2016)
Our Different Signals
Better
understand the difference between Peerless DJI-based signals,
the one-year optimized red Signals
and the fixed signals based
on technical developments.
Introduction to
Tiger/Peerless Buys and Sells.
Different
Types of TigerSoft/Peerless CHARTS, Signals and Indicators
New
TigerPeerless
Installation and Basic Uses' Instruction
(11/25/2016)
See
the re-written materials on TigerSoft Buys and Sells.
A few more pages will be added. But users could
print this
main Installation and Uses' Page for reference.
Study-
Trading SPY WITHOUT Peerless - Some Guidelines.
When completed this will be
a new Tiger Trading E-Book.
Study-
Examples of "Hands above the Head" top patterns.
Study-
9/3/2017
TigerSoft (not
Peerless) charts of Major Tops as they occurred.
===> Please report any broken
or out-of-date links.
william_schmidt@hotmail.com
==============================================================================
==============================================================================
2/2/2018
Peerless is now on a Sell S9. In on-going bull
markets, the original 2007
bull market Sell S9
variant dropped the DJI below the lower band in
7 of 11 past cases when it
would have been
applied in January and February. With the DJI not having had a bear
market's
18% or more DJI
decline since March of 2009, lots of investors are now worried that
a
8.5%-14% correction, at least, is now under way. Certainly, I would expect
Friday's very
steady deep decline
to spill over to Monday and beyond.
I have added this Sell S9 variation to the regular
Peerless. It will be available to Elite Subscribers
on Monday.
Here is its track record and its coded requirements.
I suspect the DJI will not rebound much until it
reaches its rising 65-dma, about 800 points
below Friday's
close. A successful double-test of the rising 65-dma did take
place in September
1987, whereon the
DJI rallied to its upper band with all negative internals. This is
what generated
the October 1987
S9. The DJI then utterly collapsed after the newly appointed Fed Chairman,
Alan
Greenspan, went
ahead with a rate hike to defend the Dollar.

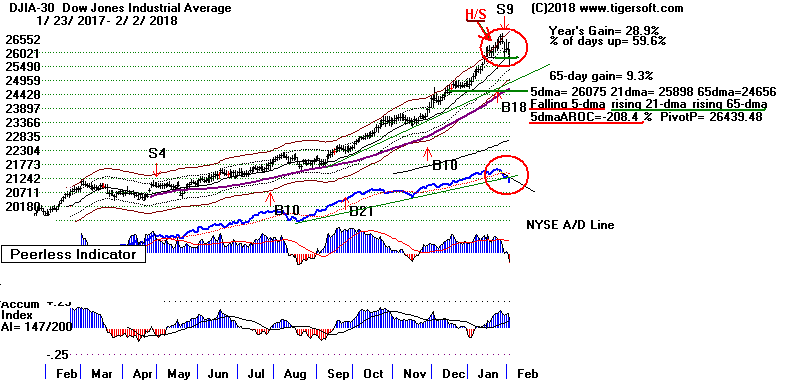
A comparison of the DJI's recent top now with the one in August 1987 seems appropriate.
Then like now,
there had been a long bull market and a correction was also long over-due.
Then
like now, the Dollar
had turned quite weak and this invited the FED to raise interest rates.
Then,
too, we had a new
Federal Reserve Chairman. He got his baptism in fire when the stock
market
cried like a baby
for a hand-out after falling 37% in just two months.
1987 Support at Rising 65-dma
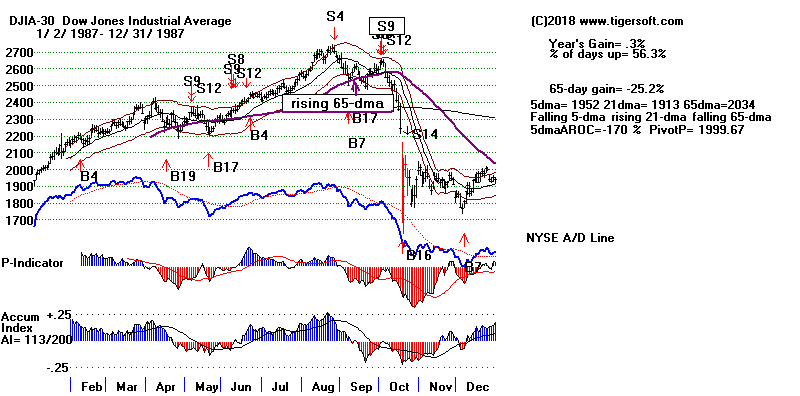
True, our internals
are not so negative as in 1987, but certainly the political situation now is
much more
divided and
dangerous for investors, I would judge. Republicans in 2018 will need
to prevent a deep
decline if they
wish NOT to lose many Congressional seats in the Fall Election. As of
a week ago,
their polls seemed
to be rising as the stock market's gains were lifting 401K retirement
accounts. But a
serious decline now
would change this. The problem now is it's not clear how they can go
about the
fiscal pumping up
of the market any more. Of course, the FED could provide lot of new
liquidity, but
Trump campaigned
against this. Even quickly passing a big Infrastructure spending bill
may not do
the job if the bond
market tanks as a result of Debt and Inflation concerns.
Far-sighted investors
have no choice but
to be quite cautious now. So should we.
Conclusion: Stay clear of the major market ETFs
unless you are already short them.
If you have not
already, Sell any stock whose Closing Power uptrends are violated. Add
more
bearish MINCPs
short sales.
Weaker Openings Now Cannot Be A Good Sign
For years the DJI
has been boosted by higher openings. If that pattern changes now, I
would
fear this will be a
very bad sign for the stock market.
Lower Openings Have Led The DJI Down This Last Week,
Don't Fight This Down-Trend.
"Buy at the Close and Sell at the
Opening." (Rising Opening Power and Falling Closing Power)
At long last, the New York Times has finally taken note
of our findings. Now that they have,
I would suggest
that this
Tiger short-term trading technique may no longer work:
https://www.nytimes.com/2018/02/02/your-money/stock-market-after-hours-trading.html?emc=edit_th_180204&nl=todaysheadlines&nlid=58223894
Since SPY's inception in 1993, "all of ...(its)
price gain since 1993 has come outside regular trading hours...
If you had bought the SPY at the last second
of trading on each business day since 1993 and sold at the
market open the next day — capturing all of the net after-hour gains — your
cumulative price gain
would be 571 percent. On the other hand, if you had done the reverse, buying
the E.T.F. at the first
second of regular trading every morning at 9:30 a.m. and selling at the 4
p.m. close, you would be down
4.4 percent since 1993. "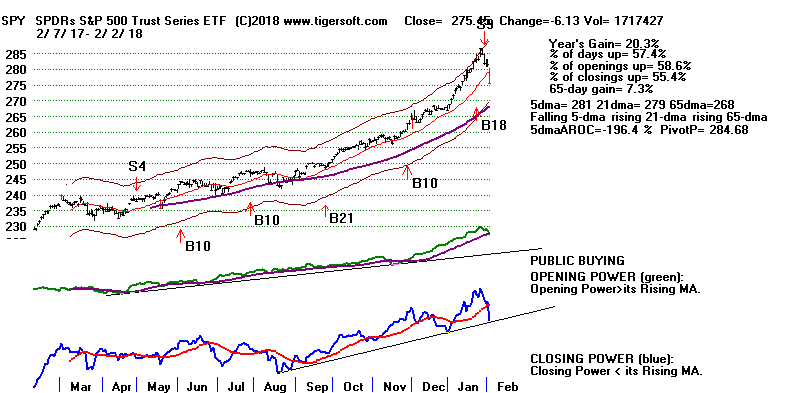
Charts 2/2/2018
PEERLESS
DJI, Signals, Indicators Daily
DJI Volume 10-DayUp/Down Vol
V-Indicator
Hourly DJIA
A/D Line for All
Stocks
(new) A/D
Line for SP-500 Stocks
NASDAQ
S&P
OEX
NYSE COMPQX
DJI-15 DJI-20
DJI-30
DIA
SPY
QQQ MDY
IWM
TNA
CrudeOil
FAS
GLD
BBH
IBB
JETS
JNUG
KOL
NUGT
OIH
OIL
RSX
RETL
SDS
SLV
SOXL
TECL
TMF
TNA UGA
(gasoline)
XIV
YINN
Commodities:
JJC, NIB,
CHOC
CORN,
WEAT
UUP
(Dollar)
AAPL ADBE
ALXN
AMAT
AMGN AMD
AMZN
BA BABA BAC
BIDU
CAT
CVX
DE
FB
GOOG
GS HD
IBM JPM M
(Macy's)
MSFT NFLX
NVDA
QCOM TSLA
TXN
XOM
WMT
ANDV (refinery),
CMG (Chipotle), LRCX,
SWKS,
TOWN
Also SPPI WATT
SQ
2/2/2018
Bullish MAXCPs Bearish
MINCPs |
Table 1 QUICKSILVER on ETFS - 02/02/18
ETF      CLOSE   CHANGE     PIVOT-PT    5-dma AROC   CL-PWR  CANDLE  IP21   ITRS
---------------------------------------------------------------------------------------------
DIA       254.93   -6.69    W264.16       -208.9%   ----      RED    .109     ----
---------------------------------------------------------------------------------------------
COMPQX    7240.95   -144.91 W7466.51      -178.1%   ----      RED    .208    -.022
---------------------------------------------------------------------------------------------
SPY       275.45   -6.13    W284.68       -196.4%   ----      RED    .146    -.022
---------------------------------------------------------------------------------------------
QQQ       164.61   -3.35    W170.1        -186.5%   ----      RED    .159    -.019
---------------------------------------------------------------------------------------------
MDY       348.38   -7.16    W359.43       -197.5%   Bearish   RED    .004    -.053
---------------------------------------------------------------------------------------------
IWM       153.83   -3.02    W158.7        -182.9%   Bearish   RED    .037    -.06
---------------------------------------------------------------------------------------------
FAS       74.82   -4.88     W80.11        -432.8%   ----      RED    .169     .158
---------------------------------------------------------------------------------------------
RETL      36.22   -3.16     W44.85        -1038.5%  Bearish   RED    .21     .146
---------------------------------------------------------------------------------------------
SOXL      157.03   -14.31   W180.55       -687.4%   Bearish   RED    .025    -.133
---------------------------------------------------------------------------------------------
TECL      124.76   -12.26   W137.52       -597.2%   Bearish   RED    .048     .04
---------------------------------------------------------------------------------------------
IBB       112.14   -1.84    W118.5        -253.9%   ----      RED   -.006     .002
---------------------------------------------------------------------------------------------
GLD       126.39   -1.68    W127.35       -65.8%    ----      RED    .098    -.047
---------------------------------------------------------------------------------------------
OIL       7.29    -.13      W7.34         -102.4%   Bullish   ----   .185     .126
---------------------------------------------------------------------------------------------
OIH       26.83   -1.19     W28.09        -337.5%   Bearish   RED    .144     .029
---------------------------------------------------------------------------------------------
GASL      22.21   -3.12     W28.11        -1408%    Bearish   RED   -.13    -.068
---------------------------------------------------------------------------------------------
UGA       33.27   -.46      W33.9         -129.1%   Bullish   BLUE   .174    -.023
---------------------------------------------------------------------------------------------
UUP       23.27    .14      W23.32         2.2%     Bearish   ----  -.043    -.137
---------------------------------------------------------------------------------------------
IEF       102.22   -.38     W103.51       -75%      Bearish   RED   -.173    -.124
---------------------------------------------------------------------------------------------
XLU      49.88   -.36       W50.39        -114.5%   Bearish   RED   -.155    -.192
---------------------------------------------------------------------------------------------
WEAT      6.25   -.06       W6.28          55.5%    Bullish   ----   .096    -.074
---------------------------------------------------------------------------------------------
YINN      45.45   -2.18     W50.48        -836%     ----      RED    .124     .22
---------------------------------------------------------------------------------------------
RSX       22.98   -.56      W23.33        -134.4%   ----      RED    .181    -.036
---------------------------------------------------------------------------------------------
AAPL      160.5   -7.28     W167.96       -327%     Bearish   RED   -.083    -.145
---------------------------------------------------------------------------------------------
GOOG      1111.9   -55.8    W1175.58      -273.1%   Bullish   RED    .181     .003
---------------------------------------------------------------------------------------------
MSFT      91.78   -2.48     W93.92        -121.3%   Bearish   RED   -.019     .023
---------------------------------------------------------------------------------------------
AMZN      1429.95    39.95   1417.68       98.3%    ----      RED    .091     .181
---------------------------------------------------------------------------------------------
FB        190.28   -2.81     185.98        7.4%     Bullish   RED    .035    -.024
---------------------------------------------------------------------------------------------
NVDA     233.52   -6.98     W246.85       -201.2%   Bullish   RED    .128     .002
---------------------------------------------------------------------------------------------
BA        348.91   -8.03     340.82        82.1%    ----      RED    .015     .23
---------------------------------------------------------------------------------------------
GS        260.04   -12.19   W272.48       -150%     Bullish   RED    .14     .003
---------------------------------------------------------------------------------------------
HD        193.97   -5.93    W204.92       -326.7%   ----      RED    .121     .049
---------------------------------------------------------------------------------------------
CAT        157.49   -4.75   W162.58       -292.3%   Bearish   RED    .077     .062
|
Table 2
Count of Stocks in Key Tiger Directories
Date = 180202
--------------------------------------
NEWHIGHS
42
NEWLOWS 256
So many new lows just a week from the DJI's new high is not good.MAXCP 26
MINCP 405 Professionals have turned quite bearish.
TTTNH          44
TTTNL          551
FASTUP         77
FASTDOWN       515   There is a lot of institutional dumping going on.
CPCROSSA       27
CPCROSSD       187
BIGVOLUP       5
BIGVODN        50
|
Table 3
Count of Stocks and New Highs in Key Tiger Directories
Date = 180202
               No.           NHs           Pct
-------------------------------------------------------------------
INDEXES        194           12            6 %
RUS-1000       837           52            6 %
GAMING         28            1             4 %
AUTO           40            1             3 %
SOFTWARE       66            2             3 %
NASD-100       100           3             3 %
BIOTECH        387           8             2 %
FINANCE        93            1             1 %
MORNSTAR       238           2             1 %
SP500          485           5             1 %
REIT           178           1             1 %
Others: None
|
 |
Table 4 RANKING OF KEY DIRECTORIES BASED PCT.OF STOCKS ABOVE 65-DMA
2/2/18
Bullish = 34
Bearish = 11
---------------------------------------------------------------------------------------
Directory Current day-1 day-2 day-3 day-4 day-5
----------------------------------------------------------------------------------------
BIGMIL 1 1 1 1 1 1
HOSPITAL .875 1 1 1 .875 .875
ETFS .865 .925 .94 .94 .97 .97
BIGBANKS .857 .857 .857 .857 1 1
INDEXES .835 .927 .927 .932 .938 .927
FINANCE .774 .817 .806 .817 .827 .827
COMODITY .771 .828 .785 .8 .8 .828
SP-100 .77 .843 .864 .885 .895 .906
MORNSTAR .756 .861 .869 .873 .894 .92
TRANSP .75 .8 .85 .85 .8 .85
DOWJONES .733 .866 .833 .9 .9 .9
FOOD .733 .8 .6 .6 .666 .733
GAMING .714 .785 .785 .785 .785 .821
MILITARY .71 .763 .763 .815 .789 .763
RETAIL .698 .754 .792 .83 .867 .867
REGBANKS .696 .787 .696 .727 .757 .787
SOFTWARE .696 .757 .757 .727 .772 .818
DJI-13 .692 .846 .769 .923 .923 .923
NASD-100 .69 .79 .83 .82 .85 .88
NIFTY .666 .766 .766 .733 .8 .8
CHINA .656 .718 .765 .75 .75 .796
COMPUTER .652 .608 .608 .652 .739 .739
SP500 .645 .75 .777 .787 .812 .845
RUS-1000 .609 .719 .734 .75 .774 .802
AUTO .6 .75 .775 .875 .875 .9
BEVERAGE .6 .75 .75 .8 .8 .85
HACKERS .6 .64 .6 .6 .68 .72
INFRA .571 .742 .771 .857 .885 .942
PIPELINE .571 .714 .714 .714 .714 .714
INSURANC .562 .625 .625 .625 .625 .656
INDMATER .555 .677 .722 .766 .8 .855
JETS .555 .777 .666 .777 .666 .666
BIOTECH .542 .583 .583 .633 .687 .697
OILGAS .514 .7 .7 .707 .778 .8
N= 34
============================================================================================
COAL .5 .6 .7 .7 .8 .8
============================================================================================
GREEN .483 .548 .516 .516 .58 .548
GOLD .47 .764 .764 .725 .725 .862
ELECTRON .382 .483 .455 .488 .533 .573
CHEM .328 .546 .593 .578 .64 .671
SEMI .323 .438 .43 .446 .5 .553
HOMEBLDG .235 .352 .352 .411 .47 .647
UTILITY .162 .232 .279 .255 .232 .232
EDU .142 .285 .285 .285 .428 .714
SOLAR .142 .238 .238 .238 .38 .333
REIT .073 .112 .162 .123 .129 .179
BONDFUND .018 .036 .027 .018 .036 .081
N=11
|
===============================================================================
===============================================================================
2/1/2018
The evidence from tonight's research is compelling
that we should consider a
revised Sell S9 to have occurred on Tuesday's close. See below.
There have
been 11 of these revised S9s in January and February in rising markets since
1929.
All 11 brought declines to the lower 3% band. 7 of the 11 brought
declines below
the lower 3.5% band. The Futures are already dropping sharply.
This probably
has something to do with the necklines of head/shoulders being broken.
It has to do with
Trump's political difficulties. But there is a lot more at stake, as I
discuss below.
A DJI decline back to its 65-dma and the lower 3% next seems highly likely.
There
should be very good support there.
All this week I have suggested we should expect the
DJI to retreat from its very
overbought position. In particular, I noted that the recent rally has
brought a
gain that more than matches the average gain after a September Buy B21 and
so profits should be taken, rather than be too greedy. The
deterioration of
breadth was mentioned as a bearish factor. Monday and Tuesday both
were
days when the number of NYSE decliners was more than 4 times the number of
advancers. As a result, on January 30th, the P-I and the V-I turned
negative.
Since the DJI closed down at only the 1.3% upper band, no Peerless S9 was
given
on January 29th. But back in the days before 2008, Peerless also used
its
hypothetical high in relation to the 21-day ma. I believe that is why
a Sell S9
using the 2007 version of Peerless was given.
I do not have the source code for the 2007
version of Peerless. But I tested the
following parameters for January and February when the DJI was near its 12
month
highs and not in a bear market:
1) Close/21-dma must be above 1.013
2) Theoretical High/21-dma must be above 1.026
3) P-Indicator must be negative.
4) V-Indicator must be negative.
There were 11 of the 2007-like variations on our classic Sell S9. All
brought declines to
at least the 3% lower band. Six saw paper losses, all under 5%.
But most significantly,
7 of the 11 produced a DJI decline below the lower 3.5% band.
1) 1/30/1929 312.64
DJI rallied to 322.1
and then fell to lower 3.5% band.
2) 2/28/1929 317.4
DJI fell directly to the lower 3.5% band.
3) 2/15/1935 104.7
DJI rose to 107.2
and then fell to lower 3.5% band.
4) 2/11/1937 190.3
DJI rose to 194.4 (3/10)
and then fell below lower 3.5% band.
5) 1/3/1939 153.6
DJI fell directly below lower 3.5% band.
6) 1/9/1946 197.37
DJI rose to 206.6
and then fell below lower 3.5% band.
7) 2/1/1955 409.7
DJI rose to 419.7
and then fell below lower 3.5% band.
8) 1/3/1973 1939
DJI fell directly far below lower 3.5% band.
9) 2/13/1980 903.84
DJI fell directly far below lower 3.5% band.
10) 1/13/1999 9349.55
DJI fell directly to lower 3.0% band.
11) 1/7/2000 11522.56
DJI rose to 11722.98
and then fell far below the 3.5% lower
band.
What To Do?
Take profits in longs. Do not let a gain turn into a loss. Sell
when the steep Closing Power
uptrends are violated. Sell some of the bearish MINCP stocks short.
Because of Boeing's
unduly large impact on the DJI, I am reluctant to suggest shorting DIA.
January's
JOBs' Numbers Are Unusually Important
The Fed's postponing a rise in interest rates until
March did not help dividend stocks.
Investors again quickly unloaded utilities' stocks, REITs and bond funds
Thursday.
The explanation is simple. Rates have been very, very low. Now
they will almost
certainly be going up. Trump's tax cuts and increased spending on the
military, domestic
security and, possibly, infrastructure has many big investors in bonds
really spooked.
But there is a much bigger storm approaching. It
has to do with the Trump's wager
on the strong and the power of "trickle-down" economics. What if the Economy
does not
get as big a boost as Republicans are expecting from Trump's economic
agenda? That
could cause a big turnover in Congressional seats. It conceivably
could even cause the
Democrats to regain control of the House of Representatives. That has
to be on Republican
investors' minds. I believe this is why the DJI, SP-500, Mid-Caps, QQQ and
NASDAQ
have
all quickly formed compact little head/shoulders price patterns.
If I am right, then tomorrow's Jobs' numbers for
January have taken on a special significance.
They wobble and fluctuate, of course, month to month. But anything
short of a really good
number, say above 210,000 for new jobs could be politically troublesome.
Ordinarily, a
low number, one that is less than 12 months ago and also the previous
month,
can sometimes be viewed as a cause for the Fed to delay raising interest
rates. But not
only has the Fed largely guaranteed a raise in short-term rates in March,
now a low number
of new monthly jobs, below, say 150,000 would mean economic Growth is
probably not
good enough to boost Republicans' political fortunes, especially in the
Midwest "rust belt".
So tomorrow's January Jobs' numbers will be important for partisans and for
the stock
market, too. The new numbers will be reported an hour before the NYSE
opens. Below are
current numbers which we will use for comparison.
| |
| Year |
Jan |
Feb |
Mar |
Apr |
May |
Jun |
Jul |
Aug |
Sep |
Oct |
Nov |
Dec |
| 2007 |
240 |
89 |
190 |
80 |
143 |
75 |
-34 |
-20 |
88 |
84 |
114 |
98 |
| 2008 |
17 |
-84 |
-78 |
-210 |
-186 |
-162 |
-213 |
-267 |
-450 |
-474 |
-766 |
-694 |
| 2009 |
-793 |
-702 |
-823 |
-687 |
-349 |
-471 |
-329 |
-213 |
-220 |
-204 |
-2 |
-275 |
| 2010 |
23 |
-68 |
164 |
243 |
524 |
-137 |
-68 |
-36 |
-52 |
262 |
119 |
87 |
| 2011 |
43 |
189 |
225 |
346 |
77 |
225 |
69 |
110 |
248 |
209 |
141 |
209 |
| 2012 |
358 |
237 |
233 |
78 |
115 |
76 |
143 |
177 |
203 |
146 |
132 |
244 |
| 2013 |
211 |
286 |
130 |
197 |
226 |
162 |
122 |
261 |
190 |
212 |
258 |
47 |
| 2014 |
190 |
151 |
272 |
329 |
246 |
304 |
202 |
230 |
280 |
227 |
312 |
255 |
| 2015 |
234 |
238 |
86 |
262 |
344 |
206 |
254 |
157 |
100 |
321 |
272 |
239 |
| 2016 |
126 |
237 |
225 |
153 |
43 |
297 |
291 |
176 |
249 |
124 |
164 |
155 |
| 2017 |
216 |
232 |
50 |
207 |
145 |
210 |
138 |
208 |
38 |
211 |
252(P) |
148(P) |
| P : preliminary |
|
|
Charts 2/1/2018
PEERLESS
DJI, Signals, Indicators Daily
DJI Volume 10-DayUp/Down Vol
V-Indicator
Hourly DJIA
A/D Line for All
Stocks
(new) A/D
Line for SP-500 Stocks
NASDAQ
S&P
OEX
NYSE COMPQX
DJI-15 DJI-20
DJI-30
DIA
SPY
QQQ MDY
IWM
TNA
CrudeOil
FAS
GLD
BBH
IBB
JETS
JNUG
KOL
NUGT
OIH
OIL
RSX
RETL
SDS
SLV
SOXL
TECL
TMF
TNA UGA
(gasoline)
XIV
YINN
Commodities:
JJC, NIB,
CHOC
CORN,
WEAT
UUP
(Dollar)
AAPL ADBE
ALXN
AMAT
AMGN AMD
AMZN
BA BABA BAC
BIDU
CAT
CVX
DE
FB
GOOG
GS HD
IBM JPM M
(Macy's)
MSFT NFLX
NVDA
QCOM TSLA
TXN
XOM
WMT
ANDV (refinery),
CMG (Chipotle), LRCX,
SWKS,
TOWN
Also SPPI WATT
SQ
2/1/2018
Bullish MAXCPs Bearish
MINCPs |
Table 1
QUICKSILVER on ETFS - 02/01/18 Bullish: Closing Power Rising = 15 Falling = 12
 Warnings:
          Below Pivot-Points = 26 of 31
          5-dma Falling = 20  Rising = 11
ETF      CLOSE   CHANGE     PIVOT-PT  5-dma AROC   CL-PWR      CANDLE  IP21   ITRS
---------------------------------------------------------------------------------------------
---------------------------------------------------------------------------------------------
DIA       261.62    .18     W265.91       -40.5%   Bullish      BLUE   .226    ------
---------------------------------------------------------------------------------------------
COMPQX    7385.86   -25.62  W7505.77      -17%     Bullish      BLUE   .307    -.032
---------------------------------------------------------------------------------------------
SPY       281.58   -.32     W286.58       -30.3%   Bullish      BLUE   .273    -.029
---------------------------------------------------------------------------------------------
QQQ       167.96   -1.44    W170.93       -11.5%   Bullish      RED    .288    -.03
---------------------------------------------------------------------------------------------
MDY       355.54    .54     W362.51       -75.1%   ----         BLUE   .087    -.06
---------------------------------------------------------------------------------------------
IWM       156.85    .49     W159.6        -68.9%   ----         BLUE   .103    -.064
---------------------------------------------------------------------------------------------
FAS       79.7    .9        W81.71        -30.7%   Bullish      BLUE   .268     .22
---------------------------------------------------------------------------------------------
RETL      39.38   -1.34     W45.02        -509.8%   ----        RED    .253     .264
---------------------------------------------------------------------------------------------
SOXL      171.34   -2.57    W181.13        169.4%   ----        BLUE   .141    -.041
---------------------------------------------------------------------------------------------
TECL      137.02    .18     W141.15        70.5%   Bullish      BLUE   .214     .132
---------------------------------------------------------------------------------------------
IBB       113.98   -.1      W118.04       -113.5%  Bullish      BLUE   .095    -.022
---------------------------------------------------------------------------------------------
GLD       128.07    .42     *128.07        3.9%    Bullish      BLUE   .125    -.079
---------------------------------------------------------------------------------------------
OIL       7.42    .18       W7.44          89.1%   Bullish      BLUE   .224     .105
---------------------------------------------------------------------------------------------
OIH       28.02    .56      W28.72        -115.5%   ----        BLUE   .241     .04
---------------------------------------------------------------------------------------------
GASL      25.33    .29      W29.74        -779%    Bearish      BLUE  -.08     .005
---------------------------------------------------------------------------------------------
UGA       33.73    .11      W34.14         3%      Bullish      ----   .181    -.047
---------------------------------------------------------------------------------------------
UUP       23.13   -.12      W23.26        -38.7%   Bearish      RED    .015    -.171
---------------------------------------------------------------------------------------------
IEF       102.6   -.7       W103.77       -71.4%   Bearish      RED   -.161    -.155
---------------------------------------------------------------------------------------------
XLU      50.24   -.8        W51.04        -75.8%   Bearish      RED   -.144    -.221
---------------------------------------------------------------------------------------------
WEAT      6.31   -.01        6.18          183.8%  Bullish      ----   .147    -.108
---------------------------------------------------------------------------------------------
YINN      47.63   -2.16     W53.8         -240%    Bullish      RED    .221     .292
---------------------------------------------------------------------------------------------
RSX       23.54    .05      W23.61        -55.3%   Bullish      BLUE   .3    -.048
---------------------------------------------------------------------------------------------
AAPL      167.78    .35     W171.51       -98.5%   Bearish      BLUE  -.014    -.135
---------------------------------------------------------------------------------------------
GOOG      1167.7   -2.24    W1175.84      -11.4%   Bullish      BLUE   .303     .025
---------------------------------------------------------------------------------------------
MSFT      94.26   -.75       94.06         103.1%  Bullish      RED    .06     .023
---------------------------------------------------------------------------------------------
AMZN      1390   -60.89     W1402.05       42.5%   Bullish      RED    .194     .109
---------------------------------------------------------------------------------------------
FB        193.09    6.2      190           149.6%  Bullish      BLUE   .108    -.042
---------------------------------------------------------------------------------------------
NVDA     240.5   -5.3       W243.33        85.4%   Bullish      BLUE   .205     .017
---------------------------------------------------------------------------------------------
BA        356.94    2.57     343.22        201.1%  Bullish      BLUE   .068     .24
---------------------------------------------------------------------------------------------
GS        272.23    4.34     268.14        59.4%   Bullish      BLUE   .174     .023
---------------------------------------------------------------------------------------------
HD        199.9   -1        W207.23       -134%    Bullish      BLUE   .205     .071
---------------------------------------------------------------------------------------------
CAT        162.24   -.54    W167.06       -215.9%  Bearish      BLUE   .135     .071
|
Table 2
Count of Stocks in Key Tiger
Directories
Date = 180201
---------------------------------------------------------
NEWHIGHS 196
NEWLOWS 156
MAXCP
84
MINCP
223
TTTNH
83
TTTNL
281
FASTUP
75
FASTDOWN 237
CPCROSSA 211
CPCROSSD 71
BIGVOLUP
5
BIGVODN 21
|
Table 3
Count of Stocks and New Highs in Key Tiger Directories
                   2/1/2018
               No            NHs           Pct.
-------------------------------------------------------------------
BIGMIL         6             4             67 %
BIGBANKS       7             2             29 %
DJI-13         13            3             23 %
MILITARY       38            8             21 %
GAMING         28            6             21 %
DOWJONES       30            5             17 %
FINANCE        93            14            15 %
=================================================
EDU            7             1             14 %
HOSPITAL       8             1             13 %
COMODITY       70            8             11 %
NIFTY          30            3             10 %
SP-100         96            10            10 %
INSURANC       32            3             9 %
NASD-100       100           8             8 %
SP500          485           34            7 %
RUS-1000       837           52            6 %
AUTO           40            2             5 %
INDEXES        194           10            5 %
MORNSTAR       238           11            5 %
TRANSP         20            1             5 %
BEVERAGE       20            1             5 %
BIOTECH        387           16            4 %
REGBANKS       33            1             3 %
ETFS           66            2             3 %
CHEM           64            1             2 %
SEMI           130           3             2 %
SOFTWARE       66            1             2 %
INDMATER       90            1             1 %
ELECTRON       178           2             1 %
REIT           178           1             1 %
====================================================
NONE:
GREEN  HOMEBLDG   HACKERS   OILGAS   INFRA   CHINA   SOLAR    COMPUTER
COAL   GOLD   RETAIL     UTILITY    PIPELINE    FOOD  BONDFUND    JETS
|
 |
Table 4
RANKING OF KEY DIRECTORIES BASED PCT.OF STOCKS
ABOVE 65-DMA
2/1/18Bullish = 38
Bearish = 8
---------------------------------------------------------------------------------------
Directory Current day-1 day-2 day-3 day-4 day-5
----------------------------------------------------------------------------------------
BIGMIL 1 1 1 1 1 1
HOSPITAL 1 1 1 .875 .875 .875
INDEXES .927 .927 .932 .938 .927 .927
ETFS .924 .939 .939 .969 .969 .969
DOWJONES .866 .833 .9 .9 .9 .9
MORNSTAR .861 .869 .873 .894 .92 .911
BIGBANKS .857 .857 .857 1 1 1
DJI-13 .846 .769 .923 .923 .923 .923
SP-100 .843 .864 .885 .895 .916 .927
COMODITY .828 .785 .8 .8 .8 .742
FINANCE .817 .806 .817 .827 .827 .849
FOOD .8 .6 .6 .666 .6 .4
TRANSP .8 .85 .85 .8 .85 .8
==========================================================================================
NASD-100 .79 .83 .82 .85 .89 .86
REGBANKS .787 .696 .727 .757 .787 .757
GAMING .785 .785 .785 .785 .821 .857
JETS .777 .666 .777 .666 .666 .666
NIFTY .766 .766 .733 .8 .8 .766
GOLD .764 .764 .725 .725 .862 .823
MILITARY .763 .763 .815 .789 .763 .789
SOFTWARE .757 .757 .727 .772 .818 .742
RETAIL .754 .792 .83 .867 .867 .867
AUTO .75 .775 .875 .875 .9 .875
BEVERAGE .75 .75 .8 .8 .85 .85
SP500 .75 .777 .787 .812 .851 .841
INFRA .742 .771 .857 .885 .942 .914
RUS-1000 .719 .734 .75 .774 .805 .801
CHINA .718 .765 .75 .75 .796 .781
PIPELINE .714 .714 .714 .714 .714 .714
OILGAS .7 .7 .707 .778 .8 .8
INDMATER .677 .722 .766 .8 .855 .855
HACKERS .64 .6 .6 .68 .72 .68
INSURANC .625 .625 .625 .625 .687 .75
COMPUTER .608 .608 .652 .739 .739 .739
COAL .6 .7 .7 .8 .8 .9
BIOTECH .583 .583 .633 .687 .695 .684
GREEN .548 .516 .516 .58 .548 .58
CHEM .546 .593 .578 .64 .671 .671
============================================================================================
ELECTRON .483 .455 .488 .533 .573 .511
SEMI .438 .43 .446 .5 .553 .469
HOMEBLDG .352 .352 .411 .47 .647 .647
EDU .285 .285 .285 .428 .714 .714
SOLAR .238 .238 .238 .38 .333 .333
UTILITY .232 .279 .255 .232 .232 .209
REIT .112 .162 .123 .129 .179 .235
BONDFUND .036 .027 .018 .036 .081 .099
N= 8
|
==============================================================================
==============================================================================
1/31/2018 I have
suggested doing some profit-taking and waiting for a pullback by the DJI
to buy again. In this way, we can again be positioned long to be
consistent with
the still active September Buy B21. That the 10-day Down Volume has
risen above the 10-day
Up Volume suggests this seems a good plan. So does the break in the
NYSE
A/D Line uptrend, which warns us that interest
rates are on the rise. It remains
to be seen if the DJI will decisively break below the near-term support at
25800;
such is the power of an accelerating uptrend. So patience seems
warranted as
far as the DJI goes. A continued decline in
Crude Oil and oil stocks would contribute
to a bigger DJI sell-off, so watch them now.
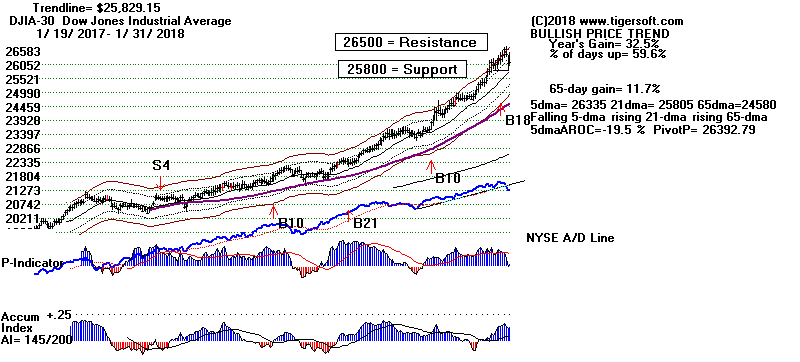
Should We Have Gotten an S9 on Tuesday?
An alert subscriber just emailed me, saying
that the 2006 version of Peerless would
have given a Sell S9 yesterday. There is no time tonight to back-test
it for January
and February. And I lost the source code for this version of Peerless
some time ago.
But the current version gives no such Sell S9 and I would trust the current
Peerless because
I know
how many hours went into back-testing all of its signals. See
2006 version's chart.
Still, tomorrow I will show this old S9's track record for this time of the
year. No time
tonight.


I still doubt if rising interest rates are ready to
bring a much bigger decline.
The bad breadth on the NYSE, so far, owes mostly to weak dividend plays,
bond
funds, REITs and utilities. I would suggest that an economic slow-down
is not in the
cards, judging from the still rising A/D Line for the SP-500 stocks shown
below.
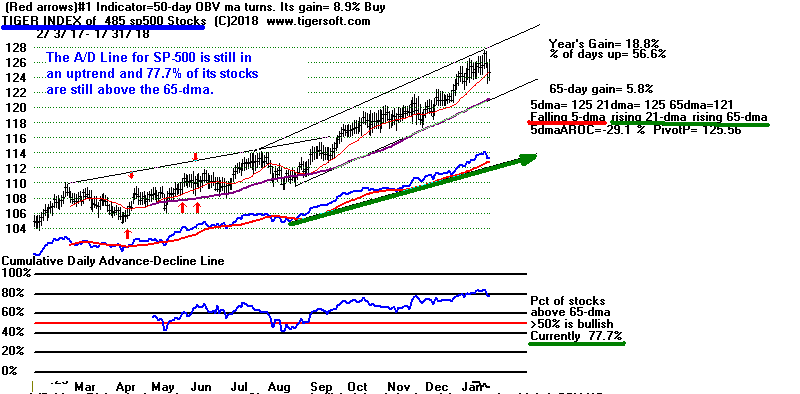
The leading tech stocks (NVDA,
GOOG, MSFT and
AMZN) seem not to be
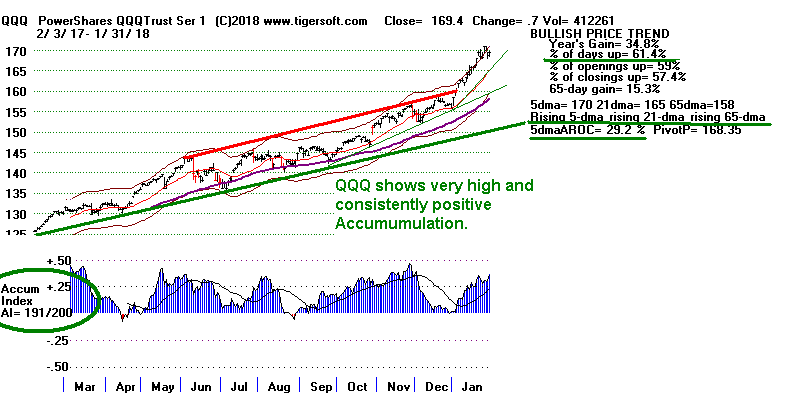
bothered by the prospects of higher interest rates. And so the
NASDAQ and
QQQ show very high levels of underlying
Accumulation. This suggests ample
support and only a limited pullback at this time. These stocks, QQQ
and the
NASDAQ are "tightly held". Because of this,
I would Buy QQQ if it makes a
run now and destroys its bearish-looking head/shoulders pattern. This
will
bring on another short-covering burst upwards.
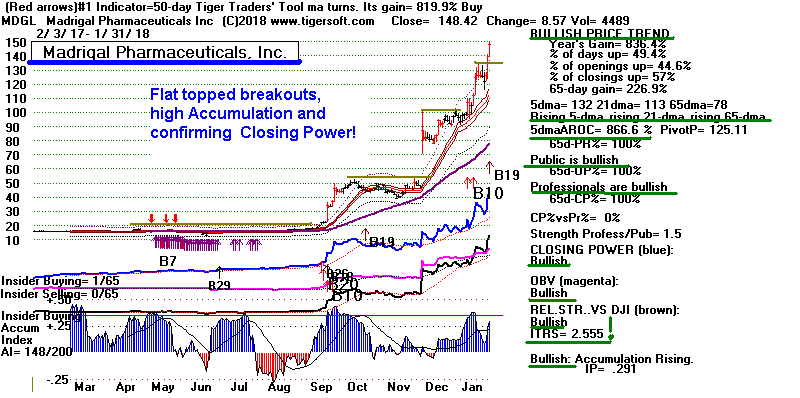
There are a number of very special biotech
situations that look bullish. We see
them in the Bullish MAXCPs
tonight. The star performer is
Madrigal. Its preliminary
trials for a novel way to treat fatty livers not caused by drinking has had
a high degree of
success. While trials are always limited. the stunning results its
drug is getting
would occur less than once in 10,000 randomized samples. It used to be
a $300
stock. It is still only half of that price. We will watch to see who
makes a bid for it.
It epitomizes what we always hope to find using our Explosive Super Stock
screens.
If someone came up to me and wanted one stock to buy, this is what I would
pick
for him.
http://www.madrigalpharma.com/wp-content/uploads/2018/01/Madrigal-Announces-EASL-Presentation.20180130_FINAL.pdf
Charts 1/31/2018
PEERLESS
DJI, Signals, Indicators Daily
DJI Volume 10-DayUp/Down Vol
V-Indicator
Hourly DJIA
A/D Line for All
Stocks
NASDAQ
S&P
OEX
NYSE COMPQX
DJI-15 DJI-20
DJI-30
DIA
SPY
QQQ MDY
IWM
TNA
CrudeOil
FAS
GLD
BBH
IBB
JETS
JNUG
KOL
NUGT
OIH
OIL
RSX
RETL
SDS
SLV
SOXL
TECL
TMF
TNA UGA
(gasoline)
XIV
YINN
Commodities:
JJC, NIB,
CHOC
CORN,
WEAT
UUP
(Dollar)
AAPL ADBE
ALXN
AMAT
AMGN AMD
AMZN
BA BABA BAC
BIDU
CAT
CVX
DE
FB
GOOG
GS HD
IBM JPM M
(Macy's)
MSFT NFLX
NVDA
QCOM TSLA
TXN
XOM
WMT
ANDV (refinery),
CMG (Chipotle), LRCX,
SWKS,
TOWN
Also SPPI WATT
SQ (Square)
1/31/2018
Bullish MAXCPs Bearish
MINCPs |
Table 1 QUICKSILVER on ETFS - 01/31/18
 Bullish:  Closing Power Rising = 21   Falling = 5
 Warnings:
          5-dma Falling = 21  Rising = 11
ETF      CLOSE   CHANGE     PIVOT-PT  5-dma AROC   CL-PWR       CANDLE  IP21   ITRS
---------------------------------------------------------------------------------------------
---------------------------------------------------------------------------------------------
DIA       261.44    .82     W263.75       -21.5%   Bullish       RED    .231    -----
---------------------------------------------------------------------------------------------
COMPQX    7411.48    9       7411.16      -2.4%    Bullish       RED    .373    -.022
---------------------------------------------------------------------------------------------
SPY       281.9    .14      W283.3        -22.5%   Bullish       RED    .325    -.023
---------------------------------------------------------------------------------------------
QQQ       169.4    .7        168.35        29.2%   Bullish       RED    .364    -.017
---------------------------------------------------------------------------------------------
MDY       355   -.7         W360.93       -85.8%   ----          RED    .173    -.051
---------------------------------------------------------------------------------------------
IWM       156.36   -.82     W159.03       -82.2%   ----          RED    .118    -.055
---------------------------------------------------------------------------------------------
FAS       78.8    1.1       W80.19        -99.4%   Bullish       BLUE   .228     .204
---------------------------------------------------------------------------------------------
RETL      40.72   -1.16     W43.79        -404.9%   ----         RED    .303     .428
---------------------------------------------------------------------------------------------
SOXL      173.91    4.35     165.44       -17.5%   ----          RED    .2    -.031
---------------------------------------------------------------------------------------------
TECL      136.84    3.21     135.09        31.1%   Bullish       BLUE   .264     .117
---------------------------------------------------------------------------------------------
IBB       114.08   -2.19    W116.63       -77.7%   Bullish       RED    .152    -.012
---------------------------------------------------------------------------------------------
GLD       127.65    .85     W127.97       -46.2%   ----          BLUE   .133    -.061
---------------------------------------------------------------------------------------------
OIL       7.24    .07       W7.29         -122.7%  Bullish       BLUE   .21     .123
---------------------------------------------------------------------------------------------
OIH       27.46   -.24      W28.67        -260.3%  ----          RED    .24     .042
---------------------------------------------------------------------------------------------
GASL      25.04   -.44      W29.63        -1036.7% Bearish       RED   -.022     .049
---------------------------------------------------------------------------------------------
UGA       33.62    .54      W33.71        -66.6%   Bullish       BLUE   .114    -.023
---------------------------------------------------------------------------------------------
UUP       23.25   -.03      W23.31        -6.4%    Bullish       ----   .051    -.16
---------------------------------------------------------------------------------------------
IEF       103.3    .03      W104.08       -26.5%   Bearish       RED   -.071    -.139
---------------------------------------------------------------------------------------------
XLU      51.04    .56        51.01         80%     Bearish       BLUE  -.117    -.205
---------------------------------------------------------------------------------------------
WEAT      6.32   -.1         6.08          201.4%  Bullish       ----   .161    -.087
---------------------------------------------------------------------------------------------
YINN      49.79    1.78     W50.05        -225%    Bullish       RED    .28     .34
---------------------------------------------------------------------------------------------
RSX       23.49    .23      W23.8         -61.6%   Bullish       ----   .337    -.028
---------------------------------------------------------------------------------------------
AAPL      167.43    .46     W171.11       -199.3%  Bearish      BLUE   .017    -.134
---------------------------------------------------------------------------------------------
GOOG      1169.94    6.25   W1170.37       24.4%   Bullish       RED    .331     .02
---------------------------------------------------------------------------------------------
MSFT      95.01    2.27      92.33         171.6%  Bullish       BLUE   .104     .029
---------------------------------------------------------------------------------------------
AMZN      1450.89    13.07   1377.95       333.8%  Bullish       RED    .31     .163
---------------------------------------------------------------------------------------------
FB        186.89   -.23     W187.48        9.1%    Bullish       RED    .106    -.072
---------------------------------------------------------------------------------------------
NVDA     245.8    3.08       236.35        207.5%  Bullish       ----   .257     .049
---------------------------------------------------------------------------------------------
BA        354.37    16.66    343.11        289.5%  Bullish       RED    .087     .231
---------------------------------------------------------------------------------------------
GS        267.89   -1.05    W269.03        41.1%   Bullish       RED    .135     .006
---------------------------------------------------------------------------------------------
HD        200.9   -.91      W205.37       -129.7%  Bullish       RED    .159     .086
---------------------------------------------------------------------------------------------
CAT        162.78   -.98    W169.37       -167.2%  Bearish       RED    .114     .081
|
Table 2
Count of Stocks in Key Tiger Directories
Date = 180131
--------------------------------------
NEWHIGHS       119
NEWLOWS        102

MAXCP          41
MINCP          267

TTTNH          54
TTTNL          403

FASTUP         74
FASTDOWN       234

CPCROSSA       37
CPCROSSD       119

BIGVOLUP       6
BIGVODN        28
|
Table 3
Count of Stocks and New Highs in Key Tiger Directories
Date = 180131
               No.          NHs            Pct
-------------------------------------------------------------------
BIGMIL         6             4             67 %
DJI-13         13            3             23 %
JETS           9             2             22 %
NIFTY          30            6             20 %
MILITARY       38            7             18 %
GAMING         28            5             18 %
DOWJONES       30            5             17 %
=========================================================
BEVERAGE       20            2             10 %
INSURANC       32            3             9 %
NASD-100       100           9             9 %
FINANCE        93            6             6 %
SP-100         96            6             6 %
SOFTWARE       66            4             6 %
AUTO           39            2             5 %
SP500          485           23            5 %
RUS-1000       837           38            5 %
HACKERS        25            1             4 %
MORNSTAR       238           9             4 %
BIOTECH        393           17            4 %
COMPUTER       23            1             4 %
GREEN          31            1             3 %
CHINA          64            2             3 %
INDEXES        194           4             2 %
RETAIL         53            1             2 %
INDMATER       90            1             1 %
ELECTRON       178           1             1 %
SEMI           130           1             1 %
REIT           178           1             1 %
------------------ None -------------------------------------
BIGBANKS REGBANKS   HOMEBLDG   CHEM    ETFS   OILGAS   INFRA
TRANSP  SOLAR    COAL    GOLD    EDU      UTILITY    PIPELINE
COMODITY  FOOD    BONDFUND   HOSPITAL
|
| |
Table 4 RANKING OF KEY DIRECTORIES BASED PCT.OF STOCKS ABOVE 65-DMA
1/31/18
Bullish = 38
Bearish = 8
---------------------------------------------------------------------------------------
Directory Current day-1 day-2 day-3 day-4 day-5
----------------------------------------------------------------------------------------
BIGMIL 1 1 1 1 1 1
HOSPITAL 1 1 .875 .875 .875 .875
ETFS .939 .939 .969 .969 .969 .954
INDEXES .927 .932 .938 .927 .927 .938
MORNSTAR .869 .873 .894 .92 .911 .92
SP-100 .864 .885 .895 .916 .927 .927
BIGBANKS .857 .857 1 1 1 1
TRANSP .85 .85 .8 .85 .8 .9
DOWJONES .833 .9 .9 .9 .9 .933
NASD-100 .83 .82 .85 .89 .86 .86
FINANCE .806 .817 .827 .827 .849 .849
N=11
===========================================================================================
RETAIL .792 .83 .867 .867 .867 .867
COMODITY .785 .8 .8 .8 .742 .757
GAMING .785 .785 .785 .821 .857 .821
SP500 .777 .787 .812 .851 .841 .83
INFRA .771 .857 .885 .942 .914 .914
AUTO .769 .871 .871 .897 .871 .871
DJI-13 .769 .923 .923 .923 .923 1
NIFTY .766 .733 .8 .8 .766 .833
CHINA .765 .75 .75 .796 .781 .781
GOLD .764 .725 .725 .862 .803 .901
MILITARY .763 .815 .789 .763 .789 .763
SOFTWARE .757 .727 .772 .818 .742 .757
BEVERAGE .75 .8 .8 .85 .8 .8
RUS-1000 .734 .75 .774 .805 .802 .8
INDMATER .722 .766 .8 .855 .855 .855
PIPELINE .714 .714 .714 .714 .714 .714
COAL .7 .7 .8 .8 .9 .9
OILGAS .7 .707 .778 .8 .8 .814
REGBANKS .696 .727 .757 .787 .757 .818
JETS .666 .777 .666 .666 .666 .777
INSURANC .625 .625 .625 .687 .75 .687
COMPUTER .608 .652 .739 .739 .739 .782
FOOD .6 .6 .666 .6 .4 .466
HACKERS .6 .6 .68 .72 .72 .72
CHEM .593 .578 .64 .671 .671 .687
BIOTECH .587 .631 .689 .689 .676 .651
GREEN .516 .516 .58 .548 .58 .645
N=27
==============================================================================================
ELECTRON .455 .488 .533 .573 .505 .601
SEMI .43 .446 .5 .553 .461 .576
HOMEBLDG .352 .411 .47 .647 .647 .882
EDU .285 .285 .428 .714 .714 .714
UTILITY .279 .255 .232 .232 .209 .162
SOLAR .238 .238 .38 .333 .333 .38
REIT .162 .123 .129 .179 .235 .23
BONDFUND .027 .018 .036 .081 .081 .081
N=8
|
==============================================================================
1/30/2018
The Peerless September
Buy B21 has not been reversed. But a bigger pullback than
we have seen so far would seem healthy and likely. Tomorrow's recovery
will be
partisan-inspired. The State of The Union Message is mostly a political
cheer-leading
event. For this reason, the DJI may stall out soon after it closes the
downside gap in
today's
trading. A run up to 26400 would do this.
Bulls, the animal that is, are
actually color-blind like most four-legged animals. So,
it is the
movement of the cape that gets them in trouble,
not the color. We should
not be fooled now by
a sudden lurch upwards. Buying on a decent pullback will be safer unless
Peerless first
generates a Sell signal. That could happen. We might get a Sell at DJI-26600
later this
week since both the the P-Indicator and V-Indicators are
now negative. As the DJI is
currently 1.3% over the 21-dma, a 300 point rally up from here on
poor breadth
and
low up-volume could bring a Sell S9.
Possibly good earnings this week for tech stocks, AAPL, GOOG and AMAZON will
lift
the NASDAQ, though profit-taking on the positive news seems just as likely.
Trump's
promise to take on the Drug Companies and their high prices may bring about
some weakness
on the NASDAQ, too.
Did you know that the City of New York is suing fossil fuel companies for
keeping to
themselves knowledge of their role in causing man-made global warming?
Seems far-fetched,
right? But oil stocks have turned weak.
I am always ruminating on historical parallels. Trump's tax cut and
de-Regulation are right
out of the 1920s, from the play-books of Harding and Coolidge. The
policies' parallels here
are quite close. Along with low interest rates and margin
requirements, these policies
produced the extraordinary bull market of the 1920s. But there are two
important differences.
The first is the absence now of many, many new consumer goods. In the
1920s cars, radios,
refrigerators, washing machines... were all relatively new. The second
difference is in the area
of consumer credit. At the start of the 1920s boom, consumer credit
was relatively new and
consumers were not as tapped out as they are now. This means the
dangers of over-production
and lack of consumer demand do over-hang the market. Most people need
credit, a lot of
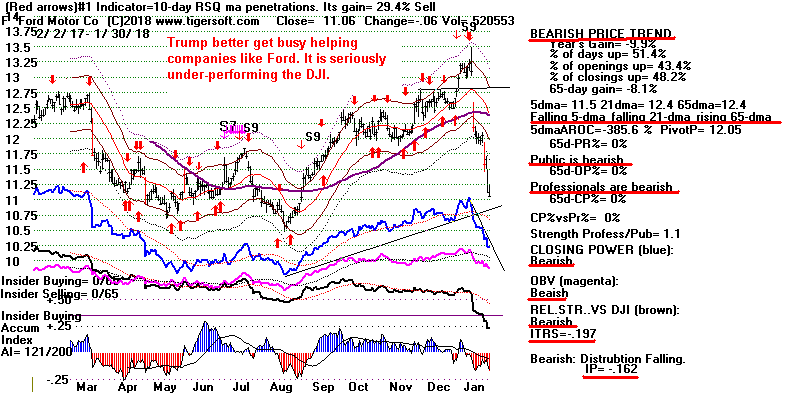
it, to buy a new car. We should watch Ford's stock. See below.
If tariffs on auto imports are
not enacted, Ford is in trouble. The American market is already
shrinking because credit
is harder to get now than in the past.
On balance, the bullish parallels are still much more weighty. The tax cuts
have not yet had a
chance to work their "voo-doo" magic and there has not yet been a take-over
binge. So, let's
plan to buy on a 5%-7% dip from here.
Today was the second day in a row when the ratio of NYSE decliners to
advancers
was more than 4:1. This should reinforce our resolve not to chase the
market at this
point. So should the fact that there were substantially more new lows
than new highs
today on the NYSE and the NASDAQ. See Table 2.
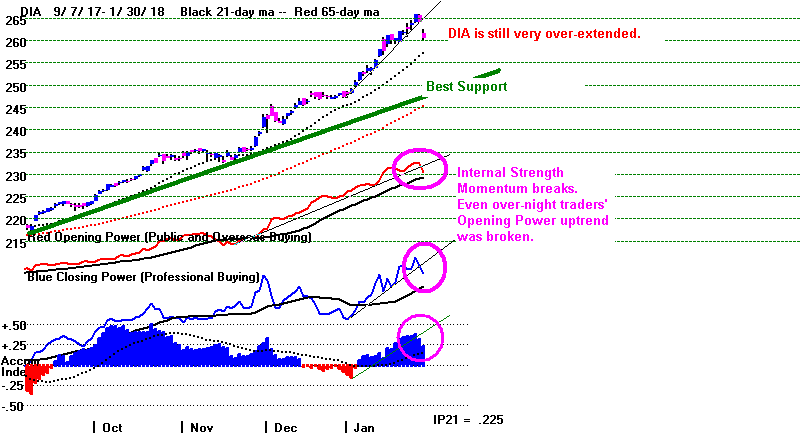
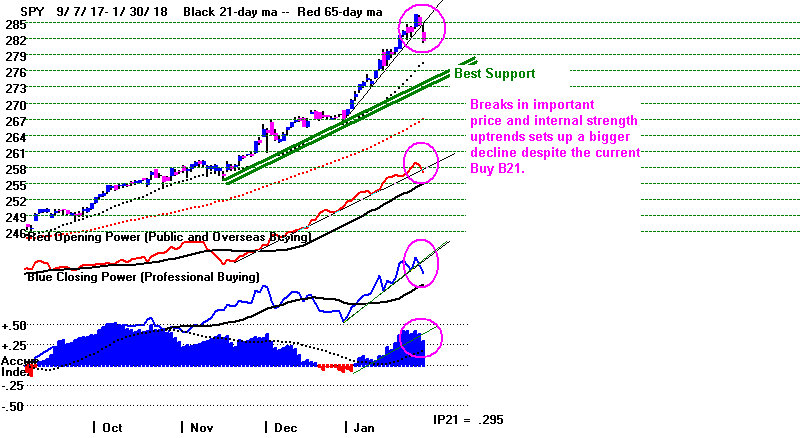
==============================================================================
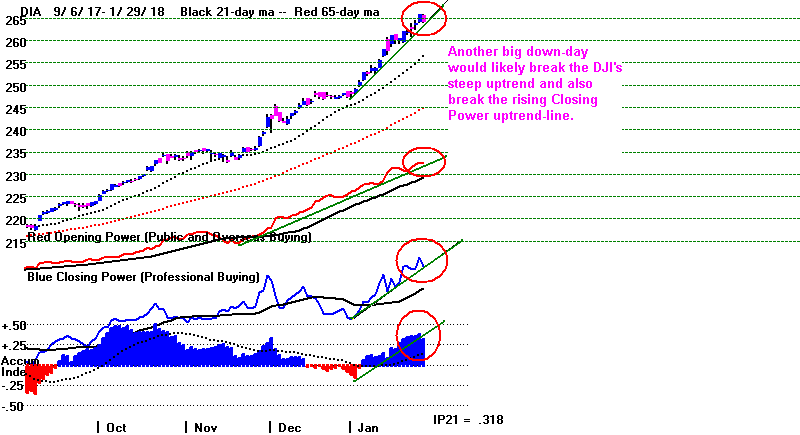
1/29/2018 Let's not be too
greedy in here. That could get us in trouble. Take some
profits. There are many big "Red Popsicles" in Table 1. Table 2
shows us
that Professionals are doing a lot of dumping now. MAXCPs outnumbers
MINCPs by a wide margin and the number of new lows is quite high
considering that the DJI is only one day away from its high. It is
even conceivable
that a new Peerless Sell signal could be devised that tests well and fit in
here.
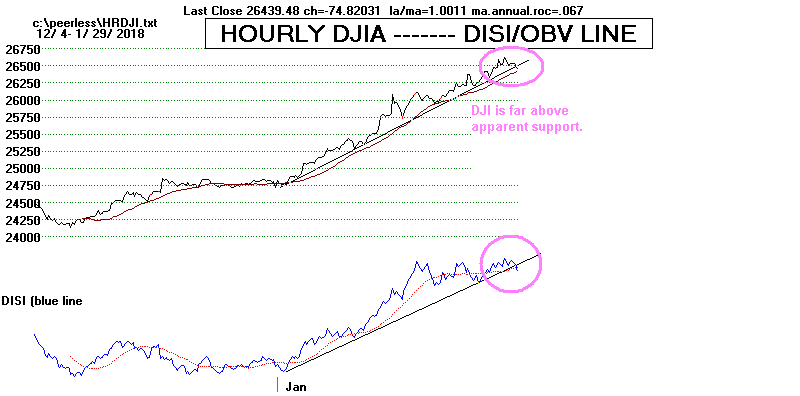
The ratio of declining stocks to advancing stocks was 4.4 today. This
shows
a big rush to sell by Professionals. What are they afraid of?
Peerless has given no Sell signal, but how can
taking some very ripe profits hurt?
That seems only prudent, I admit. So go ahead.
But understand that we may
only be able to re-enter at a higher price.
Today the number of NYSE decliners (2467) were
4.429 times the number of
advancers (557). Clearly there was a rush to sell dividend shares.
But it was more
than that. Interest rates rising are only one explanation.
Another is that Trump is now
in deeper political trouble than before A third is that investors are
afraid of a bad surprise from
Trump's State of The Union message Tuesday night. Adding some bearish
MINCPs
short sales to hedge with will help.
There is a good chance that the DJI will fall no further than the 21-dma.
Of course, that
is still a 3% decline. Such
a poor breadth ratio like we saw today with the DJI so far above
the 21-day ma, 3% now, is quite rare. Only once in the five earlier
cases with the DJI more
than 2% over the 21 day ma, did the DJI break below the 21-dma by as much as
the 3% lower
band. So, the odds of a 6% or more decline now are, perhaps, only 20%.
This would
seem to suggest that we should ride out the current decline. But why
take a chance?
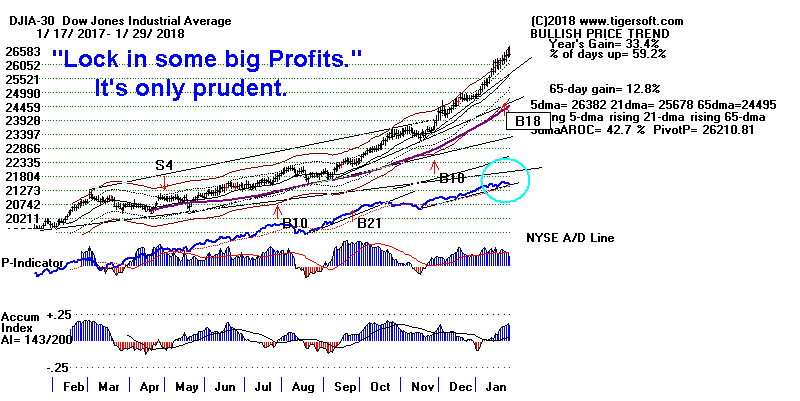
You have nice profits from the Buy B21, take them. As of today's
close, the September
B21 has gained +18.6% on the DJI. This is a percent higher than they
have averaged
in the past. Let's not be greedy.

============================================================================
==========================================================================
==========================================================================
A decline is certainly indicated. Below see all the cases of such poor
breadth when the
DJI was simply above the 21-dma. Only in 34% of the cases, did the
storm of selling
quickly pass. In 55% of the cases, such poor breadth was followed by a
decline to
at least the 2% lower band, but sometimes much lower..
Below are all the cases of such a poor breadth ratio
since 1945. Note that "la/ma" shows
how far the DJI is above the 21-dma. "Bad" means this case would
have failed as a sell signal
because the DJI advanced significantly without even a decline to the 21-dma.
"Good" means
a sell signal here would have brought a decline to the lower 2% band, at
least. "Flat" means
a sell signal here would have stopped the rally for 3 weeks or more.
There have been 38 cases of such poor breadth since 1945 with the DJI above
the 21-dma.
in 21 (55%) cases, the DJI fell at least to the lower 3% band but in 13
(34%) instances, the DJI
quickly rallied significantly. In the remaining 4, the DJI hesitated
for a few weeks and then
rose significantly. This would seem to argue for some
profit-taking now, especially when our
profits are so big.
Sell?
Date
la/ma outcome
----------------------------------------------------------
BAD 8/20/1945
1.002 DJI rallied
GOOD 12/12/1945 1.011
DJI fell to lower 2% band
GOOD 8/14/1946 1.008 Bear
market followed.
GOOD 10/17/1947 1.01 DJI
fell to lower 3.5% band.
GOOD 1/10/1948 1.006 DJI
fell to 3% lower band.
GOOD 5/6/1948
1.013 DJI fell to lower 3.5% band
GOOD 9/8/1948 1.004
DJI fell to lower 2% band
GOOD 10/24/1948 1.01 DJI
fell below lower 3.5% band.
GOOD 12/26/1948 1.001 DJI
fell below lower 3.5% band.
BAD 10/17/1949
1.009 DJI rallied.
BAD 8/25/1950
1.011 DJI rallied
BAD 1/10/1951
1.027 DJI rallied
STOP 1/5/1955
1.002 3-weeks sidewise.
GOOD 8/6/1956
1.001 DJI fell below lower 3.5% band.
BAD
12/10/1962 1.008 DJI declined only to ma and then
rose.
GOOD 9/21/1966 1.003 DJI
fell below lower 3.5% band.
BAD
2/25/1975 1.002 DJI rallied
GOOD 10/16/1978
1.001 DJI fell below lower 3.5% band.
GOOD 10/8/1979 1.002
DJI fell below lower 3.5% band.
STOP 8/18/1980
1.009 DJI stopped rallying and went sidewise.
BAD 10/25/1982 1.024
DJI fell only to 21-dma and rise sharply.
BAD 12/28/1988
1.021 DJI fell only to 21-dma and rose sharply.
BAD 3/17/1989
1.001 slight 4 day decline and then strong rally.
GOOD 4/13/2004
1.007 DJI fell below lower 3.5% band.
GOOD 5/24/2007 1.008
After a run to upper band, DJI fell below LB
GOOD 7/24/2007 1.003
DJI fell below lower 3.5% band.
GOOD 12/11/2007 1.017 Bear
market began.
GOOD 7/24/2008 1.001
Bear market followed.
BAD
3/30/2009 1.042 New bull market
continues.
BAD 5/13/2009
1.011 Bull market continues
STOP 11/19/2009
1.026 DJI went flat for a month. .
BAD
10/19/2010
GOOD 7/11/2011
1.023 DJI fell below lower band.
GOOD 11/1/2011
1.008 DJI fell below lower band. (No Peerless Sell here).
BAD
4/15/2013 1.001 DJI fell slightly and
then rallied strongly.
GOOD 7/17/2014
1.002 DJI fell to lower band.
GOOD 9/22/2014
1.004 DJI fell below lower band.
STOP 8/19/2017
1.002 DJI went sidewise for a month.
UNDECIDED 1/29/2018
1.030
Charts 1/29/2018
PEERLESS
DJI, Signals, Indicators Daily
DJI Volume 10-DayUp/Down Vol
V-Indicator
Hourly DJIA
A/D Line for All
Stocks
NASDAQ
S&P
OEX
NYSE COMPQX
DJI-15 DJI-20
DJI-30
DIA
SPY
QQQ MDY
IWM
TNA
CrudeOil
FAS
GLD
BBH
IBB
JETS
JNUG
KOL
NUGT
OIH
OIL
RSX
RETL
SDS
SLV
SOXL
TECL
TMF
TNA UGA
(gasoline)
XIV
YINN
Commodities:
JJC, NIB,
CHOC
CORN,
WEAT
UUP
(Dollar)
AAPL ADBE
ALXN
AMAT
AMGN AMD
AMZN
BA BABA BAC
BIDU
CAT
CVX
DE
FB
GOOG
GS HD
IBM JPM M
(Macy's)
MSFT NFLX
NVDA
QCOM TSLA
TXN
XOM
WMT
ANDV (refinery),
CMG (Chipotle), LRCX,
SWKS,
TOWN
Also SPPI WATT
SQ (Square)
1/29/2018 Bullish MAXCPs Bearish
MINCPs |
Table 1
QUICKSILVER on ETFS - 01/29/18
ETF      CLOSE   CHANGE     PIVOT-PT  5-dma AROC   CL-PWR     CANDLE  IP21     ITRS
---------------------------------------------------------------------------------------------
DIA       264.16   -1.75     261.87        41.4%   Bullish      RED    .319     ----
---------------------------------------------------------------------------------------------
COMPQX    7466.51   -39.26   7460.29       39.3%   Bullish      RED    .378    -.019
---------------------------------------------------------------------------------------------
SPY       284.68   -1.9      283.29        35.1%   Bullish      RED    .376    -.023
---------------------------------------------------------------------------------------------
QQQ       170.1   -.83       169.51        58.6%   Bullish      RED    .299    -.018
---------------------------------------------------------------------------------------------
MDY       359.43   -3.08    W362.1        -27.9%   Bullish      RED    .177    -.046
---------------------------------------------------------------------------------------------
IWM       158.7   -.9       W159.96       -23.5%   Bullish      RED    .165    -.042
---------------------------------------------------------------------------------------------
FAS       80.11   -1.6       79.48         82.4%   Bullish      RED    .258     .216
---------------------------------------------------------------------------------------------
RETL      44.85   -.17      W45.26        -42.5%   Bullish      BLUE   .413     .677
---------------------------------------------------------------------------------------------
SOXL      180.55   -.58     W187.42       -76%     Bullish      BLUE   .241     .015
---------------------------------------------------------------------------------------------
TECL      137.52   -3.63    W139.23        18.2%   Bullish      RED    .23     .129
---------------------------------------------------------------------------------------------
IBB       118.5    .46       116.81        127.8%  Bullish      BLUE   .233     .038
---------------------------------------------------------------------------------------------
GLD       127.35   -.72      127.28        27.4%   Bullish      RED    .137    -.08
---------------------------------------------------------------------------------------------
OIL       7.34   -.1         7.22          178.3%  Bullish      ----   .203     .117
---------------------------------------------------------------------------------------------
OIH       28.09   -.63      W29.32        -220.7%   ----        RED    .261     .027
---------------------------------------------------------------------------------------------
GASL      28.11   -1.63     W31.28        -399.1%  Bearish      RED    .047     .155
---------------------------------------------------------------------------------------------
UGA       33.9   -.24        33.9          67.9%   Bullish      RED    .228    -.054
---------------------------------------------------------------------------------------------
UUP       23.32    .06      W23.51        -53.5%   Bearish      ----   .055    -.171
---------------------------------------------------------------------------------------------
IEF       103.51   -.26     W104.05       -11.5%   Bearish      ----  -.056    -.15
---------------------------------------------------------------------------------------------
XLU      50.39   -.65       W50.54         32.6%   Bearish      RED   -.178    -.241
---------------------------------------------------------------------------------------------
WEAT      6.28    .1         5.94          239.6%   ----      ----   .181    -.123
---------------------------------------------------------------------------------------------
YINN      50.48   -3.32     W51.26         156.2%  Bullish      RED    .323     .374
---------------------------------------------------------------------------------------------
RSX       23.33   -.28      W23.58        -44.4%   Bullish      RED    .322    -.057
---------------------------------------------------------------------------------------------
AAPL      167.96   -3.55    W177.04       -259.5%  Bearish      RED   -.076    -.147
---------------------------------------------------------------------------------------------
GOOG      1175.58   -.26     1169.97       84.7%   Bullish      RED    .35     .018
---------------------------------------------------------------------------------------------
MSFT      93.92   -.14       91.9          125.1%  Bullish      RED    .041    -.01
---------------------------------------------------------------------------------------------
AMZN      1417.68    15.63   1362.54       330.9%  Bullish      BLUE   .311     .119
---------------------------------------------------------------------------------------------
FB        185.98   -4.02    W189.35        16.2%   Bullish      RED    .07    -.083
---------------------------------------------------------------------------------------------
NVDA     246.85    3.52      238.91        276.9%  Bullish      BLUE   .242     .025
---------------------------------------------------------------------------------------------
BA        340.82   -2.4      335.59        41.6%   Bullish      RED    .12     .174
---------------------------------------------------------------------------------------------
GS        272.48    4.34     260.09        206.9%  Bullish      BLUE   .17     .021
---------------------------------------------------------------------------------------------
HD        204.92   -2.31     204.9         11.2%   Bullish      RED    .069     .092
---------------------------------------------------------------------------------------------
CAT        162.58   -4.48   W169.43       -245.8%  Bearish      RED    .115     .055
|
Table 2
Count of Stocks in Key Tiger Directories
Date = 180129
--------------------------------------
NEWHIGHS
225
NEWLOWS
130 This is a lot of
new lows when the DJI is only 1 day from its high.
MAXCP
96
MINCP
252 Professionals are much more bearish than
bullish.
TTTNH
71
TTTNL
360
FASTUP
119
FASTDOWN
135
CPCROSSA
47
CPCROSSD
122
BIGVOLUP
3
BIGVODN
31 There is big rush for the exits here! |
Table 3Count of Stocks and New Highs in Key Tiger Directories
Date = 180129
-------------------------------------------------------------------
BIGMIL 6 3 50 %
JETS 9 3 33 %
BIGBANKS 7 2 29 %
MILITARY 38 9 24 %
GAMING 28 6 21 %
NASD-100 100 16 16 %
TRANSP 20 3 15 %
RETAIL 53 8 15 %
======================================================
EDU 7 1 14 %
DOWJONES 30 4 13 %
NIFTY 30 4 13 %
HOSPITAL 8 1 13 %
SP-100 96 11 11 %
BIOTECH 386 44 11 %
INFRA 35 4 11 %
SP500 485 52 11 %
INDEXES 194 19 10 %
FINANCE 93 8 9 %
MORNSTAR 238 22 9 %
DJI-13 13 1 8 %
RUS-1000 837 68 8 %
COMODITY 70 5 7 %
HOMEBLDG 17 1 6 %
SOFTWARE 66 4 6 %
INSURANC 32 2 6 %
BEVERAGE 20 1 5 %
COMPUTER 23 1 4 %
REGBANKS 33 1 3 %
AUTO 39 1 3 %
OILGAS 141 4 3 %
CHINA 64 2 3 %
CHEM 64 1 2 %
ELECTRON 178 3 2 %
SEMI 130 2 2 %
INDMATER 90 1 1 %
====================================================
None: GREEN ETFS HACKERS SOLAR COAL GOLD
REIT UTILITY PIPELINE FOOD BONDFUND
|
| |
Table 4
 RANKING OF KEY DIRECTORIES BASED PCT.OF STOCKS ABOVE 65-DMA
               1/29/18
 Bullish = 39
 Bearish = 6
---------------------------------------------------------------------------------------
Directory     Current       day-1         day-2         day-3         day-4         day-5
----------------------------------------------------------------------------------------
BIGBANKS       1             1             1             1             1             1
BIGMIL         1             1             1             1             1             1
ETFS           .969          .969          .969          .954          .954          .954
INDEXES        .938          .927          .927          .932          .907          .907
DJI-13         .923          .923          .923          1             1             1
DOWJONES       .9            .9            .9            .933          .933          .966
SP-100         .895          .916          .927          .927          .937          .947
MORNSTAR       .894          .92           .911          .92           .928          .911
INFRA          .885          .942          .914          .885          .942          .885
HOSPITAL       .875          .875          .875          .875          .875          .875
AUTO           .871          .897          .871          .871          .871          .923
RETAIL         .867          .867          .867          .867          .867          .867
NASD-100       .85           .89           .86           .86           .89           .87
FINANCE        .827          .827          .849          .849          .903          .881
SP500          .812          .851          .841          .83           .837          .835
BEVERAGE       .8            .85           .8            .8            .8            .85
COAL           .8            .8            .9            .9            .8            .8
COMODITY       .8            .8            .742          .757          .7            .7
INDMATER       .8            .855          .855          .855          .844          .855
NIFTY          .8            .8            .766          .833          .866          .866
TRANSP         .8            .85           .8            .9            .95           .9
MILITARY       .789          .763          .789          .736          .736          .789
GAMING         .785          .821          .857          .821          .821          .821
RUS-1000       .774          .805          .802          .799          .806          .799
OILGAS         .773          .794          .794          .808          .815          .815
SOFTWARE       .772          .818          .742          .757          .818          .787
REGBANKS       .757          .787          .757          .787          .848          .909
CHINA          .75           .796          .781          .781          .796          .796
COMPUTER       .739          .739          .739          .782          .826          .826
GOLD           .725          .862          .803          .901          .862          .862
PIPELINE       .714          .714          .714          .714          .714          .714
BIOTECH        .689          .696          .683          .655          .699          .681
HACKERS        .68           .72           .72           .72           .68           .72
FOOD           .666          .6            .4            .466          .333          .266
JETS           .666          .666          .666          .777          .888          .777
CHEM           .64           .671          .671          .687          .687          .687
INSURANC       .625          .687          .75           .687          .718          .687
GREEN          .58           .548          .58           .645          .677          .741
ELECTRON       .533          .573          .505          .595          .657          .64
===========================================================================================
SEMI           .5            .553          .461          .569          .6            .623
============================================================================================
HOMEBLDG       .47           .647          .647          .882          .882          .882
EDU            .428          .714          .714          .714          .714          .714
SOLAR          .38           .333          .333          .38           .38           .428
UTILITY        .232          .232          .209          .162          .139          .116
REIT           .124          .175          .231          .225          .248          .163
BONDFUND       .036          .081          .081          .081          .099          .081
|
==============================================================================
1/26/2018 The
September Peerless
Buy B21 and the recent Buy B18 both predict
higher prices.
All the key major market ETFs are running in all-time high territory above
the most
likely resistance lines. Each of these shows a rising Closing Power
and a 5-day ma.
Hold your long positions. Largely avoid the short side.
There has recently been a string of weak openings in the market on Monday
mornings
followed by renewed strength. That appears to be building up here.
Perhaps, the market
is a little nervous about the President's State of the Union Speech, or
perhaps about earnings
this week. In either case, the accelerating uptrend should make any
decline very brief.
Traders should still be buyers on weakness. I would favor stocks whose
Closing Powers
are making new highs, show steady Accumulation (AI/200>150) and high
recent accumulation
(IP21>.30). In this market, I would not buy laggards like CMG.
Here are examples
of stocks and an ETF that might be bought on weakness.
ENTA 78.32 AI/200=179 IP21=.46
Closing Power at high.
NYT
22.95 AI/200=166 IP21=.512 Closing Power at high.
TDG
314.13 AI/200=151 IP21=.38 Closing Power at high
UDOW 116.82
AI/200=163 IP21= .443 Closing Power at high.
==============================================================================
1/25/2018
More research on yesterday's Buy B18
signal shows it was unusually
powerful back in the second and sixth years of the Eisenhower Presidency.
The parallel with now is that the Trump Administration may also succeed
in launching a huge program of infrastructure spending. See in Table A
below
the huge DJI
gains on the Buy B18s in 1954 and 1958 at the time of the next Sell:
+56.1%, +34.0%, +28.7%, +21.8%, +16.4%. Of course, Trump may still
fail to get the infrastructure program funded and passed. Such a failure
would
almost certainly end the current upswing. In this vein, note how small the B18s'
gains were under Reagan and Bush
II,
also Republicans:
+2.5%. +7.6%, -0.6%, +4.8%, +3.3% +4.5%. (+3.7% on
average.
(See also the older research on the B18s here:
http://www.tigersoft.com/2018/Buy-B18.html )
Today was a strange day in the market. The DJI
rose 1/2%, but the NASDAQ
fell and there were 252 more down than up on the NYSE. The DJI-30 got
disproportionately big boosts again from its three high priced and heaviest
weighted
components: BA, GS and MMM. They accounted for more than 100 points of
the DJI's total gain. In the past year, we have not found days like
this to be bearish.
The A/D Line can lag for a day without mattering. In fact, the Buy B18
is based on
exceptional NYSE breadth strength.
What about earlier?
Has it been bearish in the past when the DJI closed
3.5% above the 21-day ma on a 1/2% advance with more up than down on the
NYSE? Since
1965, there were just four past instances where the DJI closed 3.2%
to 4% over the 21-day ma, rose by more than 0.4% from the previous day and
there were
at least 150 more down than up on the NYSE. 3 of 4 were very near a tradable
top.
http://www.tigersoft.com/2XYZHHH/AD-Divergences.htm
"The Ruling on the Field" (the Peerless Buy
B21/B18) Stands
(This is a reference to how US National Football
handles coaches'
challenges to the rulings by the games' referees. It is, after all,
almost Super Bowl time. )
The conclusion one might reach from this is that there is a 75% chance of a
decline to the
lower band in the next two months. But without a regular Peerless Sell
signal, I
would
rather trust the extraordinary upward momentum and only suggest shorting
some of
the bearish MINCPs if you want to hedge.
Hold all the major market
ETFs. After all, the NYSE A/D Line is
still in an
uptrend; there are 10x more new highs
than new lows (Table 2); the key major
market ETFs still show rising Closing Powers and
5-day moving averages (Table 1)
and
40 of our sectors show more than 50% of their
stocks above their 65-dma as
opposed
to only 6 that bearishly show the opposite.
I still think we are going to get some 500-point up-days or even a
1000-point up-day
to bring about a buying climax to this amazing bull market.
Table A
Peerless Buy B18s: 1929-2017
Blue: Republican President in 2nd Year of Four Year Presidential Cycle
Date
Signal DJI
Gain Paper
Loss
Low
----------------------------------------------------------------------------
19420804 B18 105.6
.348
none
19421015 B18 113.3
.257
113.1 <1%
10/28
19430219 B18 126.7
.124
none 0
19430420 B18 128.5
.108
none 0
19440103 B18 135.9
.207 134.2
-.013
2/7
19441016 B18 148.1
.107
145.6 -.017
11/14
19450214 B18 157.1
.044
155.5 -.010
3/23
19450511 B18 163.2
.005
none 0
19451011 B18 185.7
.073
none 0
19451213 B18 193.5
.029
189.1 -.023
12/21
19490829 B18 177.8
.241
none 0
19501013 B18 228.5
.134
222.3 -.027
12/2
19510110 B18 240.4
.078
none 0
19540318 B18 300.1
.561
296.4 -.012
3/25
19540802 B18 349.6
.340
335.8 -.039
8/31
19550110 B18 400.9
.168
388.2 -.032
1/17
19580801 B18 505.4
.287
502.7 -.005
8/18
19581003 B18 533.7
.218
none 0
19581203 B18 558.8
.164
none 0
19610201 B18 649.3
.08
637.00 -.019
2/13
19650315 B18 899.9
.043
887.8 -.013
3/29
19670303 B18 846.6
.032
842.43 -.005
4/10
19710128 B18 865.14
.084
none 0
19710329 B18 903.48
.038
none 0
19750305 B18 752.82
.149
742.88 -.013
4/07
19780512 B18 840.70
.031
none 0
19821201 B18 1031.09
.025
none 0
19830308 B18 1119.78
.111
1113.49 -.006
4/6
19851220 B18 1543.00
.183
none 0
19860303 B18 1696.67
.076
1686.30 -.006
3/4
19870310 B18 2280.09
.055
2248.44 -.014
3/16
19910326 B18 2914.85
.039
2873.02 -.014
4/9
19930317 B18 3426.74
.158
3370.81 -.016
4/2
19950303 B18 3989.61
.391
3979.23 -.003
3/8
19950525 B18 4412.23
.258
4369.00 -.010
5/26
19950801 B18 4700.37
.181
4580.62 -.025
8/24
19961009 B18 5930.62
.156
none 0
19980317 B18 8749.99
.050
none 0
20020103 B18
10172.14 -.006
9618.24 -.054
1/29
20030514 B18 8647.82
.134
8491.36 -.018
5/20
20031217 B18 10145.26 .047
none 0
20041221 B18 10759.43 .014
none 0
20060111 B18 11043.44 .048
10667.3 -.034
1/20
20060315 B18 11209.77 .033
11073.7 -.012
4/17
20061005 B18 11866.69 .045
none 0
20061204 B18 12283.85 .009
none 0
20070518 B18 13556.53 .026
13266.7 -.021
6/7
20130201 B18 14009.79 .083
13784.1 -.016
2/15
20130502 B18 14831.58 .023
none 0
20140423 B18 16501.65 .029
16374.3 -.008
5/20
---------------------------------------------------------------------------
N=50 Avg.Gain = +.122
Avg Paper Loss = .0097 |
Charts 1/25/2018
PEERLESS
DJI, Signals, Indicators Daily
DJI Volume 10-DayUp/Down Vol
V-Indicator
Hourly DJIA
A/D Line for All
Stocks
NASDAQ
S&P
OEX
NYSE COMPQX
DJI-15 DJI-20
DJI-30
DIA
SPY
QQQ MDY
IWM
TNA
CrudeOil
FAS
GLD
BBH
IBB
JETS
JNUG
KOL
NUGT
OIH
OIL
RSX
RETL
SDS
SLV
SOXL
TECL
TMF
TNA UGA
(gasoline)
XIV
YINN
Commodities:
JJC, NIB,
CHOC
CORN,
WEAT
UUP
(Dollar)
AAPL ADBE
ALXN
AMAT
AMGN AMD
AMZN
BA BABA BAC
BIDU
CAT
CVX
DE
FB
GOOG
GS HD
IBM JPM M
(Macy's)
MSFT NFLX
NVDA
QCOM TSLA
TXN
XOM
WMT
ANDV (refinery),
CMG (Chipotle), LRCX,
SWKS,
TOWN
Also SPPI WATT
SQ (Square)
1/25/2018 Bullish MAXCPs Bearish
MINCPs |
Table 1
QuickSilver
Documentation
This is for short-term trading
leveraged ETFs.
It also provides a useful short-term outlook
of these sectors ETF's and the sectors they represewnt
Blue is
Bullish and
Red is Bearish.
1 Candle-Stick color is shortest-term. This
changes when close vis-a-vis opening changes.
So, in stocks or ETFs that advanced a long
ways, traders should sell when a higher
opening gives way to a decline that brings
a drop below the previous day's close.
2 5-dma AROC and Close-versus- pivot point is
next most short-term.
W = warning. Close is below
PIVOT-Point.
3 Closing Power trend-direction vs. its 21-dma
is next most short-term.
4 IP21 is used to spot divergences and to
estimate underlying support.
5 > IP21 falling and below +.15 and its 21-dma
is bearish in an over-extended ETF, especially
when its Closing Power is falling and is
below its 21-dma.
> IP21 below 07 with AROC below .07 is less
likely to bring a rally back up from 21-dma.
6 Note price trend-lines, support/resistance
and price patterns on charts.
QUICKSILVER on ETFS - 01/25/18
ETF      CLOSE   CHANGE     PIVOT-PT   5-dma AROC   CL-PWR     CANDLE  IP21   ITRS
---------------------------------------------------------------------------------------------
DIA       263.75    1.18     260.54        68.7%   Bullish      BLUE   .348    ----
---------------------------------------------------------------------------------------------
COMPQX    7411.16   -3.9     7336.38       78%     Bullish      RED    .374    -.027
---------------------------------------------------------------------------------------------
SPY       283.3    .12       280.41        73.8%   Bullish      RED    .377    -.027
---------------------------------------------------------------------------------------------
QQQ       168.35   -.06      166.34        75.5%   Bullish      RED    .284    -.03
---------------------------------------------------------------------------------------------
MDY       360.93   -.25      359.6         69.9%   Bullish      RED    .153    -.039
---------------------------------------------------------------------------------------------
IWM       159.03    .06      158.6         78.4%   Bullish      RED    .17    -.04
---------------------------------------------------------------------------------------------
FAS       80.19   -.2        76.89         310.8%  Bullish      RED    .296     .229
---------------------------------------------------------------------------------------------
RETL      43.79   -.49      W43.84         262.4%  Bullish      RED    .374     .586
---------------------------------------------------------------------------------------------
SOXL      165.44   -9.08    W179.11       -365.2%   ----        RED    .197    -.073
---------------------------------------------------------------------------------------------
TECL      135.09   -.9       133.14        90.7%   Bullish      RED    .244     .1
---------------------------------------------------------------------------------------------
IBB       116.63    .73      112           234.5%  Bullish      BLUE   .225    -.004
---------------------------------------------------------------------------------------------
GLD       127.97   -.86      126.42        83.1%   Bullish      RED    .197    -.069
---------------------------------------------------------------------------------------------
OIL       7.29   -.13        7.05          146.4%  Bullish      RED    .21     .068
---------------------------------------------------------------------------------------------
OIH       28.67   -.27       28.49         76.2%   Bullish      RED    .322    -.013
---------------------------------------------------------------------------------------------
GASL      29.63   -1.38      28.29         161.9%  Bearish      RED    .111    -.002
---------------------------------------------------------------------------------------------
UGA       33.71   -.36       33.11         43.2%   Bullish      RED    .205    -.102
---------------------------------------------------------------------------------------------
UUP       23.31    .03      W23.65        -63.8%   ----         BLUE   .054    -.175
---------------------------------------------------------------------------------------------
IEF       104.08    .23      103.79        1%      Bullish      BLUE  -.056    -.142
---------------------------------------------------------------------------------------------
XLU      51.01    .78        49.99         86.7%   Bearish      BLUE  -.188    -.206
---------------------------------------------------------------------------------------------
WEAT      6.08    .01        5.97          75.1%   Bearish      RED    .141    -.158
---------------------------------------------------------------------------------------------
YINN      50.05   -2.03      48.12         428.6%  Bullish      ----   .327     .296
---------------------------------------------------------------------------------------------
RSX       23.8    .02        23.3          68%     Bullish      RED    .369    -.057
---------------------------------------------------------------------------------------------
AAPL      171.11   -3.11    W178.46       -230%    Bearish      RED   -.053    -.145
---------------------------------------------------------------------------------------------
GOOG      1170.37    6.13    1137.51       176.2%  Bullish      RED    .29     .013
---------------------------------------------------------------------------------------------
MSFT      92.33    .51       90            122.4%  Bullish      RED    .053    -.024
---------------------------------------------------------------------------------------------
AMZN      1377.95    20.44   1294.58       318.9%  Bullish      BLUE   .295     .099
---------------------------------------------------------------------------------------------
FB        187.48    .93      181.29        208.2%  Bullish      RED    .078    -.075
---------------------------------------------------------------------------------------------
NVDA     236.35    .55       230.11        256%    Bullish      RED    .185    -.032
---------------------------------------------------------------------------------------------
BA        343.11    8.42     337.73        43.7%   Bullish      BLUE   .146     .19
---------------------------------------------------------------------------------------------
GS        269.03    3.35     256.12        348.8%  ----         BLUE   .121    -.005
---------------------------------------------------------------------------------------------
HD        205.37   -.85      201.33        173.4%  Bullish      RED    .044     .126
---------------------------------------------------------------------------------------------
CAT        169.37    1.03   W170.41        15.9%   Bearish      RED    .141     .116
|
Table 2
Count of Stocks in Key Tiger
Directories
Date = 180125
--------------------------------------
NEWHIGHS
450 10:1 ratio is bullish for market as a whole.
NEWLOWS
44
MAXCP
96
MINCP
134 Professionals are finding more new shorts than
new longs.
TTTNH
54
TTTNL
281 Day traders are playing fades after strong
openings.
FASTUP
181 Short-term trend remains up.
FASTDOWN
79
|
Table 3
Count of Stocks and New Highs in Key Tiger Directories
Date = 180125
               No.           NHs           Pct.
-------------------------------------------------------------------
BIGMIL         6             4             67 %
BIGBANKS       7             4             57 %
DOWJONES       30            12            40 %
MILITARY       38            12            32 %
DJI-13         13            4             31 %
GAMING         28            8             29 %
SP-100         96            27            28 %
NIFTY          30            8             27 %
ETFS           66            18            27 %
MORNSTAR       238           54            23 %
CHINA          64            14            22 %
JETS           9             2             22 %
INDEXES        195           40            21 %
NASD-100       100           21            21 %
SP500          485           87            18 %
FINANCE        93            16            17 %
CHEM           64            10            16 %
RUS-1000       837           128           15 %
=====================================================
INDMATER       90            12            13 %
INSURANC       32            4             13 %
RETAIL         53            7             13 %
BIOTECH        387           40            10 %
COMODITY       70            7             10 %
OILGAS         141           12            9 %
AUTO           39            3             8 %
HACKERS        25            2             8 %
SOFTWARE       66            5             8 %
FOOD           15            1             7 %
GREEN          31            2             6 %
REGBANKS       33            2             6 %
HOMEBLDG       17            1             6 %
INFRA          35            2             6 %
TRANSP         20            1             5 %
UTILITY        43            2             5 %
BEVERAGE       20            1             5 %
COMPUTER       23            1             4 %
ELECTRON       178           5             3 %
GOLD           51            1             2 %
SEMI           130           1             1 %
====================================================
None:
SOLAR  COAL  REIT  EDU  PIPELINE  BONDFUND HOSPITAL
|
 |
Table 4
 RANKING OF KEY DIRECTORIES BASED PCT.OF STOCKS ABOVE 65-DMA
              1/25/18
 Bullish = 40
 Bearish = 6  SEMICONDUCTORS slipped be low 50% today.
---------------------------------------------------------------------------------------
Directory     Current       day-1         day-2         day-3         day-4         day-5
----------------------------------------------------------------------------------------
BIGBANKS       1             1             1             1             1             1
BIGMIL         1             1             1             1             1             1
ETFS           .969          .954          .954          .954          .969          .954
SP-100         .927          .927          .937          .947          .947          .937
DJI-13         .923          1             1             1             1             1
INDEXES        .923          .928          .902          .902          .897          .902
INFRA          .914          .885          .942          .885          .885          .914
MORNSTAR       .911          .92           .928          .915          .924          .903
COAL           .9            .9            .8            .8            .8            .9
DOWJONES       .9            .933          .933          .966          .966          .966
HOSPITAL       .875          .875          .875          .875          .875          .875
AUTO           .871          .871          .871          .923          .897          .897
RETAIL         .867          .867          .867          .867          .886          .811
NASD-100       .86           .86           .89           .87           .87           .87
GAMING         .857          .821          .821          .857          .821          .857
INDMATER       .855          .855          .844          .833          .822          .777
FINANCE        .849          .849          .903          .881          .903          .881
SP500          .841          .83           .837          .832          .814          .802
GOLD           .803          .901          .862          .862          .843          .803
RUS-1000       .802          .799          .806          .798          .782          .762
BEVERAGE       .8            .8            .8            .85           .8            .7
TRANSP         .8            .9            .95           .9            .9            .9
OILGAS         .794          .808          .815          .815          .808          .794
MILITARY       .789          .736          .736          .789          .842          .842
CHINA          .781          .781          .796          .796          .796          .765
NIFTY          .766          .833          .866          .866          .866          .866
REGBANKS       .757          .787          .848          .909          .939          .787
INSURANC       .75           .687          .718          .656          .625          .562
COMODITY       .742          .757          .7            .7            .685          .7
SOFTWARE       .742          .757          .818          .787          .803          .757
COMPUTER       .739          .782          .826          .826          .826          .782
HACKERS        .72           .72           .68           .72           .72           .68
EDU            .714          .714          .714          .714          .714          .571
PIPELINE       .714          .714          .714          .714          .714          .714
BIOTECH        .682          .653          .697          .671          .622          .586
CHEM           .671          .687          .687          .671          .703          .64
JETS           .666          .777          .888          .777          .777          .777
HOMEBLDG       .647          .882          .882          .882          .823          .823
GREEN          .58           .645          .677          .741          .774          .774
ELECTRON       .505          .595          .657          .64           .696          .651
=============================================================================================
SEMI           .461          .569          .6            .623          .669          .653
FOOD           .4            .466          .333          .266          .2            .266
SOLAR          .333          .38           .38           .428          .476          .428
REIT           .231          .225          .248          .163          .152          .118
UTILITY        .209          .162          .139          .116          .093          .093
BONDFUND       .081          .081          .099          .081          .063          .072
|
==============================================================================
1/24/2018
The DJI's runaway rise finally produced a
"continuation" Buy B18 to confirm
the importance of the current advance, just in case we had not noticed.
The good
news here is that Buy B18s in the second year of a 4-year Presidential cycle
are particularly bullish. They average an additional gain of 15% on
the DJI.
The Buy B18's rules are simple. They occur when the P-Indicator has
been positive
for 41 straight days. The OBVPct must be at least +.152 and the V-I
must be above
+7. They also cannot easily occur in the Summer months.
The Buy B18
gives us a chance now to see what might happen next if market history
approximately repeats.
If we
only look at the 7 cases since 2000, then we find that the
average additional
gain after the
B18 was only 4.5% on the DJI at the time of the next
Peerless Sell.
For all 50 cases, the average additional gain is roughly
+12%. (I will
re-compute this tomorrow night). The biggest
paper loss since 2000 was only 2.1%.
If we consider all 50 cases, we see that the
earlier B18s
were quite powerful. The first 6,
up until 1944, all gained more than
10%. So, perhaps
a look not at the average gains
for the whole period but at the biggest
losses will show us something of the risk now,
such as it
is. The paper losses were 2.6% or less in
45 of the 50 earlier B18s, 90%
of the time. The biggest paper loss
was 5.4% on
1/3/2002. The next biggest loss was
3.4% on 1/11/2006. So, we
should consider
any retreat to the 21-day ma from here to be
a buying opportunity. (More on
the
B18 tomorrow night. See the earlier research I did
on this signal here:
http://www.tigersoft.com/2018/Buy-B18.html )
Of course, there may not even be such a decline.
The red candle-sticks (Table 1 below)
may not be meaningful. All the major market ETFs show rising Closing
Powers
and 5-day moving averages and we still have not had a 500-point or a
1000-point
up-day to draw in all on-lookers and produce a buying climax.
Dollar Is Being Sent Downward by Trump
Administration.
A Test of Its Long Term Support at 21 Seems Likely..
Today brought a sharp decline in the Dollar, which
made a three year low. As a
result, Crude Oil, Gold and
Silver rose while REITS, Utilities and Bonds
were
again weak. Trump's policies will bring Inflation and higher
Interest Rates sooner
than we would have expected two years ago. But we won't worry for the
market
until interest
rates rise considerably over 3% . That will be the time to worry. Until
then,
a policy to deliberately weaken Dollar
invites traders to buy growth stocks and
foreign ETFs
while shorting the Dollar.
Avoid weakening dividend plays. Altogether, 42 of the 46 sectors we follow in
Table 4
have the majority of their stocks bullishly positioned above their 65-dma.
This is a
very broad advance.
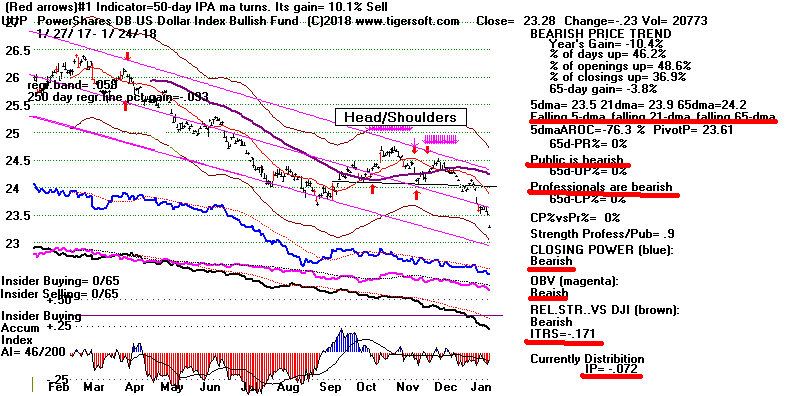
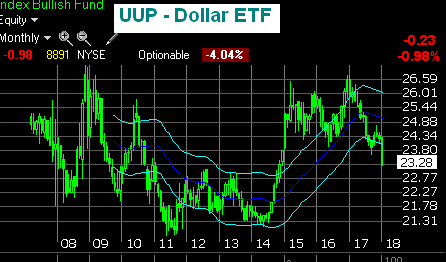
There is a reason that Treasury Secretaries never openly call for a
weaker Dollar.
It makes it very hard to finance more national Debt and encourages
Inflation.
But that is what Treasury Secretary Mnuchin did today. We are already
short the Dollar.
Now traders will see there is little upside risk in shorting it. This
will also boost Crude Oil,
which should be bought. Gold and Silver should go higher, but they have a
lot more
overhead resistance.
When Inflation really takes hold, stocks will be much preferred over
bonds. Low priced stocks should go wild, as they did in 1968.
But rather than buying US
stocks, many investors will buy growth stocks in overseas markets,
particularly China.
See
https://www.cnbc.com/2018/01/24/mnuchin-comment-surprises-financial-markets-turns-dollar-decline-into-one-way-bet.html
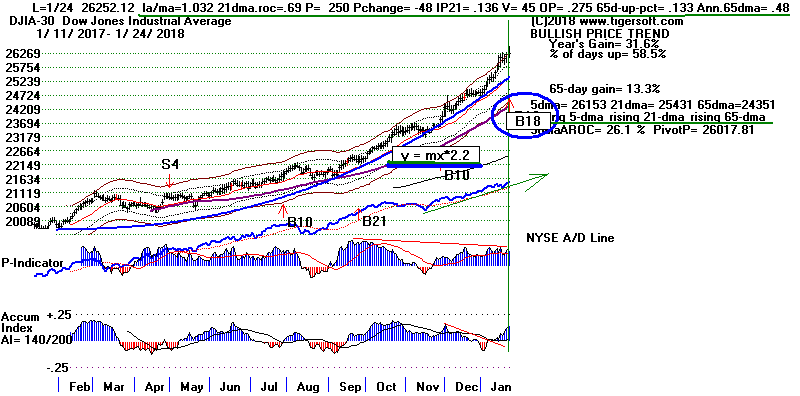
Past Buy B18s. 1929-2018
Date
Signal DJI
Gain Paper
Loss
Low
----------------------------------------------------------------------------
19420804 B18 105.6
.348
none
19421015 B18 113.3
.257
113.1 <1%
10/28
19430219 B18 126.7
.124
none 0
19430420 B18 128.5
.108
none 0
19440103 B18 135.9
.207 134.2
-.013
2/7
19441016 B18 148.1
.107
145.6 -.017
11/14
19450214 B18 157.1
.044
155.5 -.010
3/23
19450511 B18 163.2
.005
none 0
19451011 B18 185.7
.073
none 0
19451213 B18 193.5
.029
189.1 -.023
12/21
19490829 B18 177.8
.241
none 0
19501013 B18 228.5
.134
222.3 -.027
12/2
19510110 B18 240.4
.078
none 0
19540318 B18 300.1
.561
296.4 -.012
3/25
19540802 B18 349.6
.340
335.8 -.039
8/31
19550110 B18 400.9
.168
388.2 -.032
1/17
19580801 B18 505.4
.287
502.7 -.005
8/18
19581003 B18 533.7
.218
none 0
19581203 B18 558.8
.164
none 0
19610201 B18 649.3
.08
637.00 -.019
2/13
19650315 B18 899.9
.043
887.8 -.013
3/29
19670303 B18 846.6
.032
842.43 -.005
4/10
19710128 B18 865.14
.084
none 0
19710329 B18 903.48
.038
none 0
19750305 B18 752.82
.149
742.88 -.013
4/07
19780512 B18 840.70
.031
none 0
19821201 B18 1031.09
.025
none 0
19830308 B18 1119.78
.111
1113.49 -.006
4/6
19851220 B18 1543.00
.183
none 0
19860303 B18 1696.67
.076
1686.30 -.006
3/4
19870310 B18 2280.09
.055
2248.44 -.014
3/16
19910326 B18 2914.85
.039
2873.02 -.014
4/9
19930317 B18 3426.74
.158
3370.81 -.016
4/2
19950303 B18 3989.61
.391
3979.23 -.003
3/8
19950525 B18 4412.23
.258
4369.00 -.010
5/26
19950801 B18 4700.37
.181
4580.62 -.025
8/24
19961009 B18 5930.62
.156
none 0
19980317 B18 8749.99
.050
none 0
20020103 B18 10172.14 -.006
9618.24 -.054
1/29
20030514 B18 8647.82
.134
8491.36 -.018
5/20
20031217 B18 10145.26 .047
none 0
20041221 B18 10759.43 .014
none 0
20060111 B18 11043.44 .048
10667.3 -.034
1/20
20060315 B18 11209.77 .033
11073.7 -.012
4/17
20061005 B18 11866.69 .045
none 0
20061204 B18 12283.85 .009
none 0
20070518 B18 13556.53 .026
13266.7 -.021
6/7
20130201 B18 14009.79 .083
13784.1 -.016
2/15
20130502 B18 14831.58 .023
none 0
20140423 B18 16501.65 .029
16374.3 -.008
5/20
---------------------------------------------------------------------------
N=50 Avg.Gain = +.122
Avg Paper Loss = .0097
|
Charts 1/24/2018
PEERLESS
DJI, Signals, Indicators Daily
DJI Volume 10-DayUp/Down Vol
V-Indicator
Hourly DJIA
A/D Line for All
Stocks
NASDAQ
S&P
OEX
NYSE COMPQX
DJI-15 DJI-20
DJI-30
DIA
SPY
QQQ MDY
IWM
TNA
CrudeOil
FAS
GLD
BBH
IBB
JETS
JNUG
KOL
NUGT
OIH
OIL
RSX
RETL
SDS
SLV
SOXL
TECL
TMF
TNA UGA
(gasoline)
XIV
YINN
Commodities:
JJC, NIB,
CHOC
CORN,
WEAT
UUP
(Dollar)
AAPL ADBE
ALXN
AMAT
AMGN AMD
AMZN
BA BABA BAC
BIDU
CAT
CVX
DE
FB
GOOG
GS HD
IBM JPM M
(Macy's)
MSFT NFLX
NVDA
QCOM TSLA
TXN
XOM
WMT
ANDV (refinery),
CMG (Chipotle), LRCX,
SWKS,
TOWN
Also SPPI WATT
SQ (Square)
1/24/2018
Bullish MAXCPs Bearish
MINCPs |
Table 1
QuickSilver
Documentation
This is for short-term trading
leveraged ETFs.
It also provides a useful short-term outlook
of these sectors ETF's and the sectors they represewnt
Blue is
Bullish and
Red is Bearish.
1 Candle-Stick color is shortest-term. This
changes when close vis-a-vis opening changes.
So, in stocks or ETFs that advanced a long
ways, traders should sell when a higher
opening gives way to a decline that brings
a drop below the previous day's close.
2 5-dma AROC and Close-versus- pivot point is
next most short-term.
W = warning. Close is below
PIVOT-Point.
3 Closing Power trend-direction vs. its 21-dma
is next most short-term.
4 IP21 is used to spot divergences and to
estimate underlying support.
5 > IP21 falling and below +.15 and its 21-dma
is bearish in an over-extended ETF, especially
when its Closing Power is falling and is
below its 21-dma.
> IP21 below 07 with AROC below .07 is less
likely to bring a rally back up from 21-dma.
6 Note price trend-lines, support/resistance
and price patterns on charts.
QUICKSILVER on ETFS - 01/24/18
ETF      CLOSE   CHANGE     PIVOT-PT  5-dma AROC   CL-PWR       CANDLE  IP21   ITRS
---------------------------------------------------------------------------------------------
DIA       262.57    .7       260.16        28.5%   Bullish      RED    .348    -----
---------------------------------------------------------------------------------------------
COMPQX    7415.06   -45.23   7296.05       79.3%   Bullish      RED     .424    -.02
---------------------------------------------------------------------------------------------
SPY       283.18   -.11      279.14        63.5%   Bullish      RED     .408    -.022
---------------------------------------------------------------------------------------------
QQQ       168.41   -1.1      165.82        78.4%   Bullish      RED     .333    -.023
---------------------------------------------------------------------------------------------
MDY       361.18   -.92      355.9         56.5%   Bullish      RED     .18    -.032
---------------------------------------------------------------------------------------------
IWM       158.97   -.99      156.54        42.6%   Bullish      RED     .186    -.035
---------------------------------------------------------------------------------------------
FAS       80.39    .91       75.33         291.8%  Bullish      BLUE   .315     .231
---------------------------------------------------------------------------------------------
RETL      44.28   -.98       41.48         373.5%  Bullish      RED     .411     .673
---------------------------------------------------------------------------------------------
SOXL      174.52   -12.9    W178.63       -44.2%   Bullish      RED     .308     .012
---------------------------------------------------------------------------------------------
TECL      135.99   -3.24     132.63        149.5%  Bullish      RED    .3       .113
---------------------------------------------------------------------------------------------
IBB       115.9   -.91       111.27        198%    Bullish      RED    .217    -.001
---------------------------------------------------------------------------------------------
GLD       128.83    1.55     125.86        106.3%  Bullish      BLUE   .259    -.064
---------------------------------------------------------------------------------------------
OIL       7.42    .2         7.08          232.3%  Bullish      BLUE   .275     .092
---------------------------------------------------------------------------------------------
OIH       28.94   -.38       28.23         43.4%   Bullish      RED    .346    -.006
---------------------------------------------------------------------------------------------
GASL      31.01   -.27       28.66         193.4%   ----        RED      .138     .053
---------------------------------------------------------------------------------------------
UGA       34.07    .17       33.42         136.2%  Bullish      BLUE   .224    -.076
---------------------------------------------------------------------------------------------
UUP       23.28   -.23      W23.61        -76.3%   Bearish      ----  -.072    -.171
---------------------------------------------------------------------------------------------
IEF       103.85   -.2      W104.06       -26%     Bearish      ----  -.101    -.142
---------------------------------------------------------------------------------------------
XLU      50.23   -.31        50.14        -22.9%   Bearish      RED   -.283    -.218
---------------------------------------------------------------------------------------------
WEAT      6.07    .13        5.99          100.5%   ----        BLUE   .193    -.147
---------------------------------------------------------------------------------------------
YINN      52.08    .82       45.83         745.7%  Bullish      RED    .375     .387
---------------------------------------------------------------------------------------------
RSX       23.78    .2        23.48         130.3%  Bullish      BLUE   .439    -.057
---------------------------------------------------------------------------------------------
AAPL      174.22   -2.82    W179.26       -136.9%  ----         RED    .002    -.128
---------------------------------------------------------------------------------------------
GOOG      1164.24   -5.73    1129.79       140.9%  Bullish      RED    .267     .01
---------------------------------------------------------------------------------------------
MSFT      91.82   -.08       90.1          92.6%   Bullish      RED    .096    -.027
---------------------------------------------------------------------------------------------
AMZN      1357.51   -5.03    1293.32       237.8%  Bullish      RED    .232     .084
---------------------------------------------------------------------------------------------
FB        186.55   -2.8      179.8         245%    Bullish      RED    .095    -.078
---------------------------------------------------------------------------------------------
NVDA     235.8   -3.11       224.44        240.5%  Bullish      RED    .247     .03
---------------------------------------------------------------------------------------------
BA        334.69   -.9       340.16       -239.6%  Bullish      RED    .114     .155
---------------------------------------------------------------------------------------------
GS        265.68    5.59     250.97        234.5%  ----         BLUE   .08    -.015
---------------------------------------------------------------------------------------------
HD        206.22    1.32     198.33        158.6%  Bullish      BLUE   .06     .144
---------------------------------------------------------------------------------------------
CAT        168.34   -1.09    168.83       -4.7%    Bearish      RED    .134     .125
|
Table 2
Count of Stocks in Key Tiger Directories
Date = 180124
----------------------------------------
NEWHIGHS
545
NEWLOWS
41
MAXCP
128
MINCP
105
TTTNH
79
TTTNL
184
FASTUP
157
FASTDOWN
66
CPCROSSA
52
CPCROSSD
191
BIGVOLUP
8
BIGVODN
17
|
Table 3 Count of New Highs by Sector
Date = 180124
No. NHs Pct
-------------------------------------------------------------------
BIGBANKS 7 5 71 %
ETFS 66 45 68 %
COMODITY 70 28 40 %
BIGMIL 6 2 33 %
CHINA 64 20 31 %
DOWJONES 30 9 30 %
MORNSTAR 238 61 26 %
DJI-13 13 3 23 %
INDEXES 195 40 21 %
SP-100 96 19 20 %
SP500 485 96 20 %
TRANSP 20 4 20 %
FINANCE 93 17 18 %
MILITARY 38 6 16 %
NASD-100 100 16 16 %
GOLD 51 8 16 %
REGBANKS 33 5 15 %
AUTO 40 6 15 %
RUS-1000 837 127 15 %
====================================================
GAMING 28 4 14 %
NIFTY 30 4 13 %
INSURANC 32 4 13 %
HOMEBLDG 17 2 12 %
INDMATER 90 11 12 %
OILGAS 141 17 12 %
RETAIL 53 6 11 %
JETS 9 1 11 %
BEVERAGE 20 2 10 %
INFRA 35 3 9 %
COMPUTER 25 2 8 %
BIOTECH 386 27 7 %
FOOD 15 1 7 %
GREEN 31 2 6 %
CHEM 64 4 6 %
UTILITY 43 2 5 %
HACKERS 25 1 4 %
ELECTRON 178 6 3 %
SOFTWARE 66 2 3 %
SEMI 130 3 2 %
REIT 176 1 1 %
BONDFUND 111 1 1 %
=========================================================
None: SOLAR COAL EDU PIPELINE HOSPITAL
|
 |
 RANKING OF KEY DIRECTORIES BASED PCT.OF STOCKS ABOVE 65-DMA
              1/24/18
 Bullish = 41
 Bearish = 5
---------------------------------------------------------------------------------------
Directory     Current       day-1         day-2         day-3         day-4         day-5
----------------------------------------------------------------------------------------
BIGBANKS       1             1             1             1             1             .857
BIGMIL         1             1             1             1             1             1
DJI-13         1             1             1             1             1             1
ETFS           .954          .954          .954          .969          .954          .954
DOWJONES       .933          .933          .966          .966          .966          .933
INDEXES        .928          .902          .902          .897          .902          .907
SP-100         .927          .937          .947          .947          .937          .906
MORNSTAR       .92           .928          .915          .924          .903          .915
GOLD           .901          .862          .862          .843          .764          .882
COAL           .9            .8            .8            .8            .8            .8
TRANSP         .9            .95           .9            .9            .9            .95
INFRA          .885          .942          .885          .885          .914          .914
HOMEBLDG       .882          .882          .882          .823          .823          .823
AUTO           .875          .875          .925          .9            .9            .875
HOSPITAL       .875          .875          .875          .875          .875          .875
RETAIL         .867          .867          .867          .886          .83           .811
NASD-100       .86           .89           .87           .87           .87           .86
INDMATER       .855          .844          .833          .822          .777          .811
FINANCE        .849          .903          .881          .903          .881          .924
NIFTY          .833          .866          .866          .866          .866          .833
SP500          .83           .837          .832          .814          .802          .812
GAMING         .821          .821          .857          .821          .857          .821
OILGAS         .808          .815          .815          .808          .787          .843
BEVERAGE       .8            .8            .85           .8            .7            .75
COMPUTER       .8            .8            .8            .8            .76           .84
RUS-1000       .799          .806          .798          .782          .762          .772
REGBANKS       .787          .848          .909          .939          .787          .787
CHINA          .781          .796          .796          .796          .765          .812
JETS           .777          .888          .777          .777          .777          .888
COMODITY       .757          .7            .7            .685          .7            .714
SOFTWARE       .757          .818          .787          .803          .757          .757
MILITARY       .736          .736          .789          .842          .842          .842
HACKERS        .72           .68           .72           .72           .68           .72
EDU            .714          .714          .714          .714          .571          .571
PIPELINE       .714          .714          .714          .714          .714          .714
CHEM           .687          .687          .671          .703          .64           .718
INSURANC       .687          .718          .656          .625          .562          .625
BIOTECH        .655          .699          .673          .624          .585          .603
GREEN          .645          .677          .741          .774          .774          .741
ELECTRON       .595          .657          .64           .696          .657          .691
SEMI           .569          .6            .623          .669          .653          .661
==========================================================================================
FOOD           .466          .333          .266          .2            .266          .266
SOLAR          .38           .38           .428          .476          .428          .571
REIT           .227          .25           .164          .153          .119          .17
UTILITY        .162          .139          .116          .093          .093          .093
BONDFUND       .081          .099          .081          .063          .072          .099
|
===============================================================================
1/23/2018 The
September Peerless
Buy B21 still operates and predicts
higher prices.
The tech ETFs (TECL, SOXL and QQQ) are soaring above
all resistance.
All the major ETF show rising Closing Powers and rising 5-dma. Don't
sell
these or DIA and SPY. It looks like they could go much higher.
Trump's economic policies are very much responsible, as hard as it is for
some commentators to admit it. Of course, Obama's policies set the
stage
for this runaway market, too and the developing world-wide Bull Market
should sustain our bull market, barring a trade war. Chinese ETFs are
leading
this advance and YINN is the best of them.
Buy YINN.
The
Size of China's Retail Market Has Just Overtaken The US's
For example, 24 million cars were sold in China
while 17 millions were sold in the US. China's
rapid growth rate ensures that this trend will almost certainly continue.
Global investors should
be considering Chinese stocks and ETFs now. 3x leveraged YINN is the
simplest way to play
boom. It is headed back to 65 short-term. It is the strongest
performing ETF now by a wide margin,
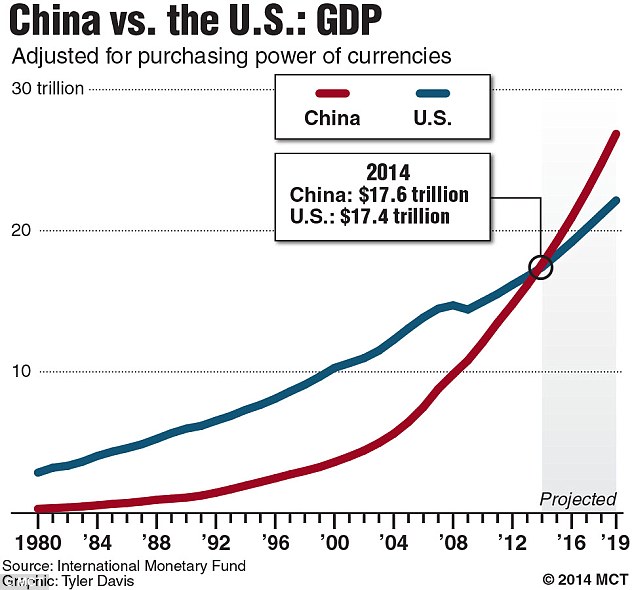
A world-wide economic boom is taking place now. YINN seems to me the
best way to play it.
YINN is immediately headed back to its highs near 60. With the Dollar
declining, YINN has even
more appeal. I think it will breakout past that 60-resistance.
At that point, we may well see an even
wider and more speculative advance in Chinese stocks.
Over the last ten years, the per capital average income in China has risen
from $2000 to $8000.
Average real wages here have stagnated despite the boom in the stock market.
This is not a story
that the American mass media talks much about, but it is a story that the
now falling US Dollar attests to.
==============================================================================
1/22/2018 The
September Peerless
Buy B21 still operates and predicts
higher prices.
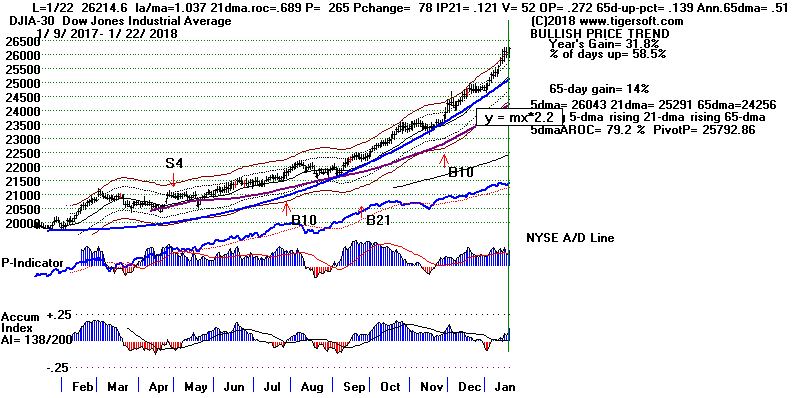
The major ETFs all show bullish (blue) Quicksilver
components. The rally
should continue into February and quite possibly much longer unless
Trump's announcements of tariffs today quickly starts a TRADE WAR.
That could happen, but not overnight. So, the bull market should be
able to ride out whatever turbulence the White House brings into the
picture. However, the Planet is not happy. A very big earthquake
is
reported in Alaska. I fear the "big one" is getting closer.
(
https://www.washingtonpost.com/business/economy/trump-tariffs-will-save-some-solar-jobs-and-destroy-others/2018/01/22/756feb60-fca2-11e7-8f66-2df0b94bb98a_story.html?utm_term=.563dc68816e2
)
.
The big Techs are the leaders once again. Look at
TECL and
TQQQ
A number of speculative biotechs are making new highs with confirming
Closing Power and IP21s. See the
Bullish MAXCPs for ideas in this
vein.
Otherwise, I would buy GOOG.
Its smart phones are competitively priced
and the new models it showed at the Las Vegas COMDEX have many special
features, including voice recognition, that allow automated search of GOOGLE
and YOUTUBE. See:
https://finance.yahoo.com/news/google-determined-crush-amazons-alexa-2018-010022288.html
Today, the Democrats "caved". As if to prove
that they really are the
"Party of Big Government", they just could not bring themselves to prolong a
government shut-down. After the ends of each of the past shut-downs
(January 1986,
Fall of 2011 and February 2013, the markets always rose. And so it did
today.
Now what? For how long?
The DJI's accelerating uptrend most closely resembles
the markets of 1915
when the US very profitably exported vast amount of war materials to Britain
and France and 1954-1955 when Eisenhower launched the Interstate Highway's
Infrastructure federal spending. In both cases, the DJI showed a hyperbolic
rise on a standard (arithmetically scaled) DJI chart. After the
parabolic uptrend-line
was broken the 1915 bull market went into a sidewise 13% deep corrective
phase
until August 1916 when it took off again and made its final new highs when
President
Wilson was re-elected. What stopped the 1915 hyperbolic uptrend was
Inflation,
tighter money and fears that the US would be drawn into the actual fighting
of World
War I.
The Eisenhower bull market, 1952-1957 had three 10% corrections before
inflation fears and higher interest rates finally stopped it in July 1957.
So, it's a
good bet that inflation will cause the much higher interest rates and the
end of the
Trump Bull Market. It will not just be that labor costs will become
higher.
It will be also be because of tariffs, higher oil prices and raw materials'
shortages which will be the result of world wide economic growth, which is
presaged now by the bullish trends in foreign ETFs.
1915
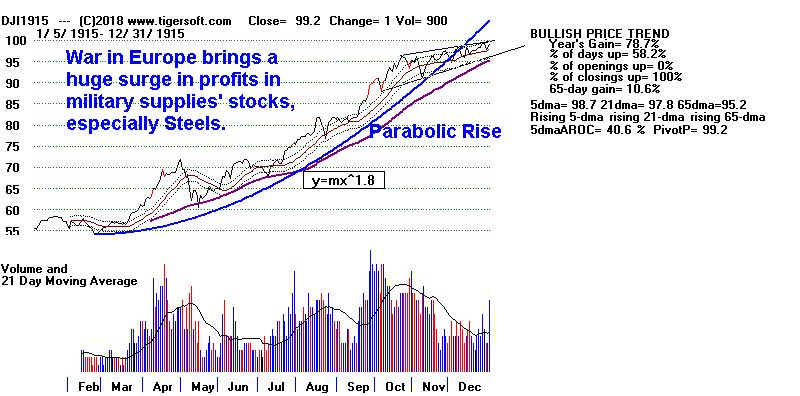 |
1915-1916
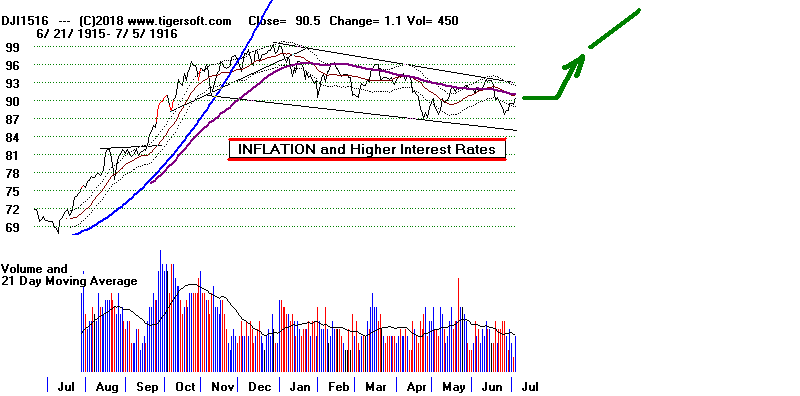 |
1954-1955
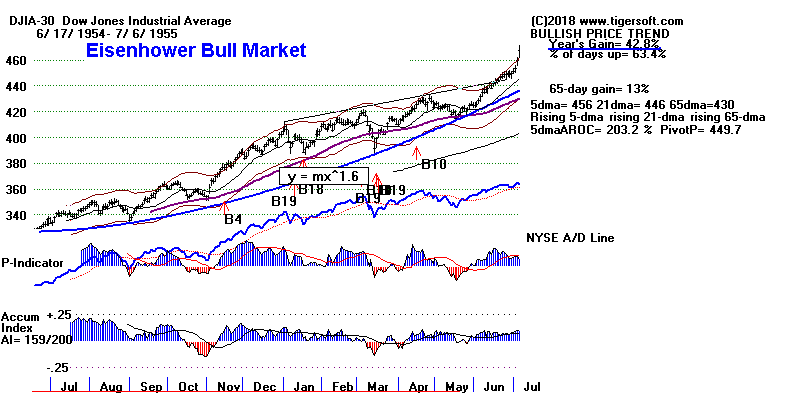 |
1955
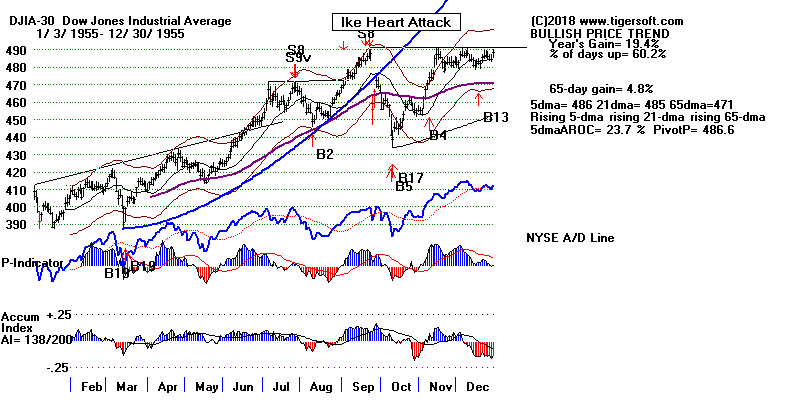 |
Charts 1/22/2018
PEERLESS
DJI, Signals, Indicators Daily
DJI Volume 10-DayUp/Down Vol
V-Indicator
Hourly DJIA
A/D Line for All
Stocks
NASDAQ
S&P
OEX
NYSE COMPQX
DJI-15 DJI-20
DJI-30
DIA
SPY
QQQ MDY
IWM
TNA
CrudeOil
FAS
GLD
BBH
IBB
JETS
JNUG
KOL
NUGT
OIH
OIL
RSX
RETL
SDS
SLV
SOXL
TECL
TMF
TNA UGA
(gasoline)
XIV
YINN
Commodities:
JJC, NIB,
CHOC
CORN,
WEAT
UUP
(Dollar)
AAPL ADBE
ALXN
AMAT
AMGN AMD
AMZN
BA BABA BAC
BIDU
CAT
CVX
DE
FB
GOOG
GS HD
IBM JPM M
(Macy's)
MSFT NFLX
NVDA
QCOM TSLA
TXN
XOM
WMT
ANDV (refinery),
CMG (Chipotle), LRCX,
SWKS,
TOWN
Also SPPI WATT
SQ (Square)
1/22/2018
Bullish MAXCPs Bearish
MINCPs
|
Table 1
QUICKSILVER on ETFS - 01/22/18
ETF      CLOSE   CHANGE     PIVOT-PT    5-dma AROC  CL-PWR      CANDLE  IP21   ITRS
---------------------------------------------------------------------------------------------
DIA       261.98    1.44     257.81        78.4%    Bullish      BLUE   .317    -----
---------------------------------------------------------------------------------------------
COMPQX    7408.03  71.65     7223.69       100.9%   Bullish      BLUE   .336    -.018
---------------------------------------------------------------------------------------------
SPY       282.69    2.28     276.97        85.5%    Bullish      BLUE   .362    -.02
---------------------------------------------------------------------------------------------
QQQ       168.12    1.78     164.02        109.8%   Bullish      BLUE   .311    -.02
---------------------------------------------------------------------------------------------
MDY       361.45    1.85     354.53        59.5%    Bullish      BLUE   .177    -.028
---------------------------------------------------------------------------------------------
IWM       159.45    .85      156.14        41%      Bullish      BLUE   .179    -.028
---------------------------------------------------------------------------------------------
FAS       78.79    1.9       74.06         284.1%   Bullish      BLUE   .209     .191
---------------------------------------------------------------------------------------------
RETL      45.23    1.39      40            305%     Bullish      BLUE   .386     .818
---------------------------------------------------------------------------------------------
SOXL      183.26    4.15     162.17        665.8%   Bullish      BLUE   .313     .014
---------------------------------------------------------------------------------------------
TECL      137.02    3.88     126.27        356%     Bullish      BLUE   .331     .119
---------------------------------------------------------------------------------------------
IBB       115.52    3.52     110.6         158.8%   Bullish      BLUE   .22    -.009
---------------------------------------------------------------------------------------------
GLD       126.65    .23     W127.17       -12.3%    Bullish      BLUE   .243    -.068
---------------------------------------------------------------------------------------------
OIL       7.08    .03       *7.08         -49.4%    Bullish      BLUE   .256     .038
---------------------------------------------------------------------------------------------
OIH       29.37    .88       28.51         34.9%    Bullish      BLUE   .439     .022
---------------------------------------------------------------------------------------------
GASL      30.54    2.25      29.52        -71.3%    Bullish      BLUE   .227     .053
---------------------------------------------------------------------------------------------
UGA       33.44    .33       32.8          78.6%    Bullish      BLUE   .169    -.092
---------------------------------------------------------------------------------------------
UUP       23.57   -.08      W23.58        -29.6%    Bearish      ----  -.099    -.157
---------------------------------------------------------------------------------------------
IEF       103.75   -.04     W104.62       -39.3%    Bearish      RED   -.114    -.139
---------------------------------------------------------------------------------------------
XLU      50.06    .07       W50.15        -19.9%    Bearish      RED   -.318    -.213
---------------------------------------------------------------------------------------------
WEAT      5.99    .02        5.88          58.9%    ----         ----   .195    -.161
---------------------------------------------------------------------------------------------
YINN      48.88    .76       42.54         704.2%   Bullish      BLUE   .364     .312
---------------------------------------------------------------------------------------------
RSX       23.54    .24       22.78         49.6%    Bullish      BLUE   .385    -.054
---------------------------------------------------------------------------------------------
AAPL      177   -1.46        176.19       -2.5%     Bullish      RED    .102    -.1
---------------------------------------------------------------------------------------------
GOOG      1155.81    18.3   1121.76        148.6%   Bullish      BLUE   .227     .006
---------------------------------------------------------------------------------------------
MSFT      91.61    1.61      88.35         112.1%   Bullish      BLUE   .128    -.026
---------------------------------------------------------------------------------------------
AMZN      1327.31    32.73   1304.86       85.1%    Bullish      BLUE   .198     .069
---------------------------------------------------------------------------------------------
FB        185.37    4.08     178.39        167.3%   Bullish      BLUE   .07    -.084
---------------------------------------------------------------------------------------------
NVDA     233.69    3.58      220.11        238.6%   Bullish      BLUE   .237    -.011
---------------------------------------------------------------------------------------------
BA        338    .27         335.16        26.3%    Bullish      BLUE   .136     .157
---------------------------------------------------------------------------------------------
GS        261.52    5.4      258.46        88%      Bearish      BLUE  -.024    -.022
---------------------------------------------------------------------------------------------
HD        204.46    3.13     196.31        202.6%   Bullish      BLUE   .072     .136
---------------------------------------------------------------------------------------------
CAT        170.89    .48     169.31        17.4%    Bullish      BLUE   .314     .118
|
Table 2
Count of Stocks in Key Tiger Directories
01/22
-------------------------
NEWHIGHS 865
NEWLOWS 51
MAXCP
289
MINCP
70
TTTNH
130
TTTNL
114
FASTUP
135
FASTDOWN 99
CPCROSSA 138
CPCROSSD 57
BIGVOLUP 5
BIGVODN 10 |
Table 3Count of Stocks and New Highs in Key Tiger Directories
Date = 180122
No. NHs Pct.
-------------------------------------------------------------------
BIGBANKS 7 5 71 %
ETFS 65 43 66 %
DJI-13 13 7 54 %
INDEXES 195 100 51 %
DOWJONES 30 14 47 %
MORNSTAR 238 101 42 %
NIFTY 30 12 40 %
SP-100 96 38 40 %
NASD-100 100 40 40 %
RETAIL 53 19 36 %
HOMEBLDG 17 6 35 %
FINANCE 93 31 33 %
SP500 485 148 31 %
GAMING 28 8 29 %
SOFTWARE 66 18 27 %
CHINA 64 16 25 %
TRANSP 20 5 25 %
RUS-1000 837 199 24 %
COMPUTER 23 5 22 %
REGBANKS 33 7 21 %
INSURANC 32 6 19 %
BIOTECH 387 61 16 %
SEMI 130 19 15 %
=====================================================
INFRA 35 5 14 %
EDU 7 1 14 %
AUTO 40 5 13 %
FOOD 15 2 13 %
ELECTRON 178 22 12 %
OILGAS 141 17 12 %
JETS 9 1 11 %
GREEN 31 3 10 %
COMODITY 70 7 10 %
BEVERAGE 20 2 10 %
HACKERS 25 2 8 %
INDMATER 90 5 6 %
CHEM 64 3 5 %
SOLAR 21 1 5 %
MILITARY 38 1 3 %
GOLD 51 1 2 %
UTILITY 43 1 2 %
BONDFUND 111 1 1 %
====================================================
None: BIGMIL COAL REIT PIPELINE HOSPITAL
|
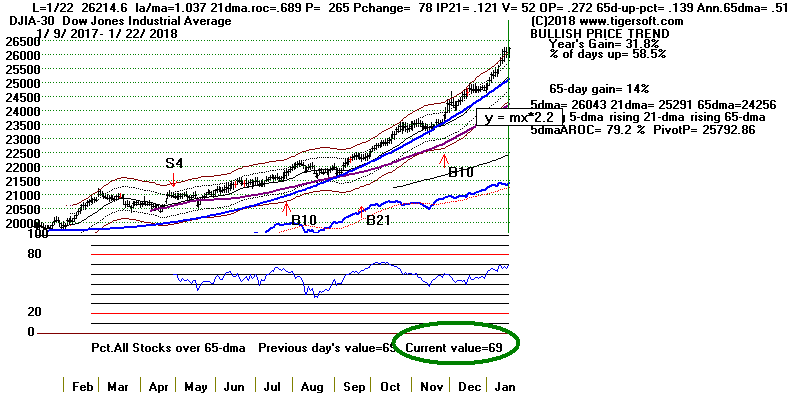 |
Table 4
 RANKING OF KEY DIRECTORIES BASED PCT.OF STOCKS ABOVE 65-DMA
              1/22/18
 Bullish = 41
 Bearish = 5
---------------------------------------------------------------------------------------
Directory     Current       day-1         day-2         day-3         day-4         day-5
----------------------------------------------------------------------------------------
BIGBANKS       1             1             1             .857          .857          1
BIGMIL         1             1             1             1             1             1
DJI-13         1             1             1             1             1             1
DOWJONES       .966          .966          .966          .966          .933          .9
ETFS           .953          .969          .953          .953          .938          .938
SP-100         .947          .947          .937          .906          .895          .916
AUTO           .925          .9            .9            .875          .9            .925
MORNSTAR       .915          .924          .903          .915          .903          .903
REGBANKS       .909          .939          .787          .787          .757          .878
INDEXES        .902          .897          .902          .907          .917          .851
TRANSP         .9            .9            .9            .95           .95           1
INFRA          .885          .885          .914          .914          .914          .942
HOMEBLDG       .882          .823          .823          .823          .764          .823
FINANCE        .881          .903          .881          .924          .881          .913
HOSPITAL       .875          .875          .875          .875          .75           1
NASD-100       .87           .87           .87           .87           .84           .84
RETAIL         .867          .886          .83           .811          .83           .849
NIFTY          .866          .866          .866          .833          .8            .8
GOLD           .862          .843          .764          .882          .882          .862
GAMING         .857          .821          .857          .857          .857          .857
BEVERAGE       .85           .8            .7            .75           .7            .75
INDMATER       .833          .822          .777          .8            .8            .833
SP500          .832          .814          .802          .812          .797          .802
COMPUTER       .826          .826          .782          .869          .869          .826
OILGAS         .815          .808          .787          .836          .815          .836
COAL           .8            .8            .8            .8            .8            .9
RUS-1000       .798          .782          .762          .77           .755          .776
CHINA          .796          .796          .765          .828          .812          .781
MILITARY       .789          .842          .842          .842          .815          .868
SOFTWARE       .787          .803          .757          .757          .742          .757
JETS           .777          .777          .777          .888          .888          1
GREEN          .741          .774          .774          .741          .741          .709
HACKERS        .72           .72           .68           .68           .76           .72
EDU            .714          .714          .571          .571          .571          .714
PIPELINE       .714          .714          .714          .714          .714          .714
COMODITY       .7            .685          .7            .714          .685          .685
BIOTECH        .671          .622          .583          .599          .578          .64
CHEM           .671          .703          .64           .703          .703          .75
INSURANC       .656          .625          .562          .625          .531          .562
ELECTRON       .64           .696          .657          .696          .589          .629
SEMI           .623          .669          .653          .669          .538          .584
N= 41
=========================================================================================
SOLAR          .428          .476          .428          .571          .571          .571
FOOD           .266          .2            .266          .266          .133          .133
REIT           .168          .157          .123          .174          .146          .151
UTILITY        .116          .093          .093          .093          .116          .139
BONDFUND       .081          .063          .072          .09           .099          .126
N=5
|
=============================================================================
1/19/2018 The
September Peerless
Buy B21 still operates and predicts
higher prices.
The stalemate over the terms of a raise in the
Debt Limit continues, quite predictably,
with both parties more interested in blaming the other than producing a
workable compromise.
Conceivably, it may take a lowering of the US credit or decline by Wall
Street to get them|
to work together. But right now, there is still no Peerless Sell.
The current Peerless key values historically match with 3 past cases.
In 2 of the 3, a January
top was quickly fell and the DJI fell 3% and 6%. The drop in the V-I
Indicator to +26 on
Friday from +101 on Wednesday is what has now technically tilted the odds in
favor of
another shallow decline. Short-term, much will depend on the
negotiations between the
Democrats and Republicans, who I can't believe want to risk even a week-long
government
shut-down. Trump is the rogue element here. He has said that the
bureaucrats in Washington
"could use a good shut-down". But the key consideration here remains
the extreme
corporate profitability of this new year. That will not change and
historically profitability is
the single most important factor that vectors the market's moves.
Some weakness here is also suggested by seasonality.
Going back to 1965, we find that the
DJI has risen only 46.2% of the time over the two weeks following January
21st and only
48.1% of the time over the next four weeks. The average decline was
0.9% over the next
month.
I doubt if the strongest stocks will be much affected
but selling short some of the Bearish
MINCP stocks as a short-term hedge
might give some peace of mind while we wait to see
what happens in Washington. Traders of the key ETFs should probably
just hold their
positions. DIA,
SPY, QQQ,
COMPQX and IWM all show rising Closing
Powers and
5-day moving averages. See Table 1 below. Let's see if a weak
Monday opening can
be turned around by the end of the day. That would be bullish.
Table A
               Key Values Use in screen here:
               January
               LA/MA is between 1.032 and 1.036
               P-I >15
               IP21 is between .067 and .087
               VI is between 0 and +36


NOW          20180119
      1.034  .605   187 -13 .077 +26  .168  .135 .49
       la/ma   21dAROC    P-I PI-ch IP21   VI    OBVPct  65-upPct 65dAROC
-------------------------------------------------------------------------------------
1            19720107       910.37        1.032         246.9         .069
      1.032  .752   246  0  .069  2  .495  .01  .04
      la/ma   21dAROC    P-I PI-ch IP21   VI    OBVPct  65-upPct 65dAROC
      DJI fell from 910.37 to 889.15 on 1/26 (3% decline).
      It then rose to 966.96 on 4/12 S9/S15
--------------------------------------------------------------------------------------
 2            19790126
      1.033  .734   234  50 .087  4  .278  .032
      la/ma   21dAROC    P-I PI-ch IP21   VI    OBVPct  65-upPct 65dAROC

      DJI fell from 859.75 to 807.00 on 2/27 (a 6% decline). No Peerless Sell.
      It then rose to a NH, 878.72 on 4/10 (S12).
--------------------------------------------------------------------------------------
 3           19850122
      1.037  .552   264  26 .081  10 .153  .027 .10
      la/ma   21dAROC    P-I PI-ch IP21   VI    OBVPct  65-upPct 65dAROC
      DJI rose to 1299.36 (+3.5%) on 3/1/1985 (S4).
      It then fell 4.5% before advancing strongly.
|
Charts 1/19/2018
PEERLESS
DJI, Signals, Indicators Daily
DJI Volume 10-DayUp/Down Vol
V-Indicator
Hourly DJIA
A/D Line for All
Stocks
NASDAQ
S&P
OEX
NYSE COMPQX
DJI-15 DJI-20
DJI-30
DIA
SPY
QQQ MDY
IWM
TNA
CrudeOil
FAS
GLD
BBH
IBB
JETS
JNUG
KOL
NUGT
OIH
OIL
RSX
RETL
SDS
SLV
SOXL
TECL
TMF
TNA UGA
(gasoline)
XIV
YINN
Commodities:
JJC, NIB,
CHOC
CORN,
WEAT
UUP
(Dollar)
AAPL ADBE
ALXN
AMAT
AMGN AMD
AMZN
BA BABA BAC
BIDU
CAT
CVX
DE
FB
GOOG
GS HD
IBM JPM M
(Macy's)
MSFT NFLX
NVDA
QCOM TSLA
TXN
XOM
WMT
ANDV (refinery),
CMG (Chipotle), LRCX,
SWKS,
TOWN
Also SPPI WATT
SQ (Square)
1/19/2018
Bullish MAXCPs Bearish
MINCPs |
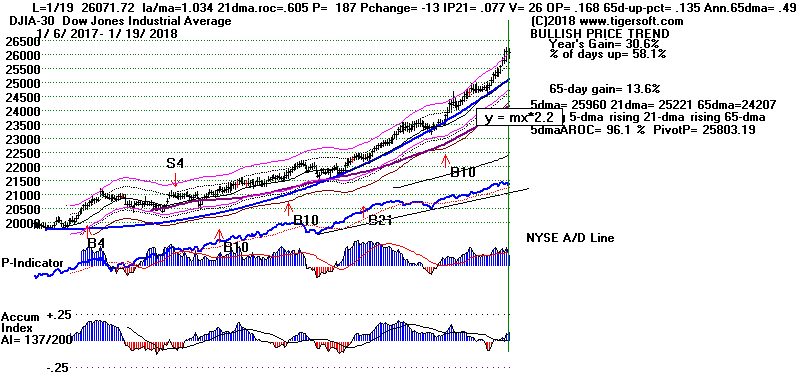
 |
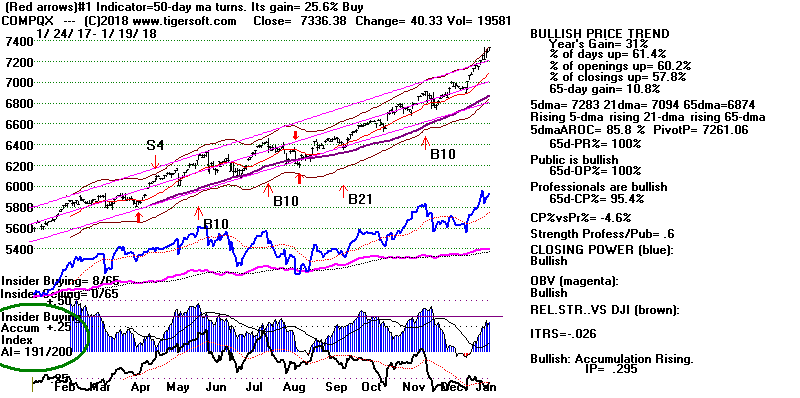 |
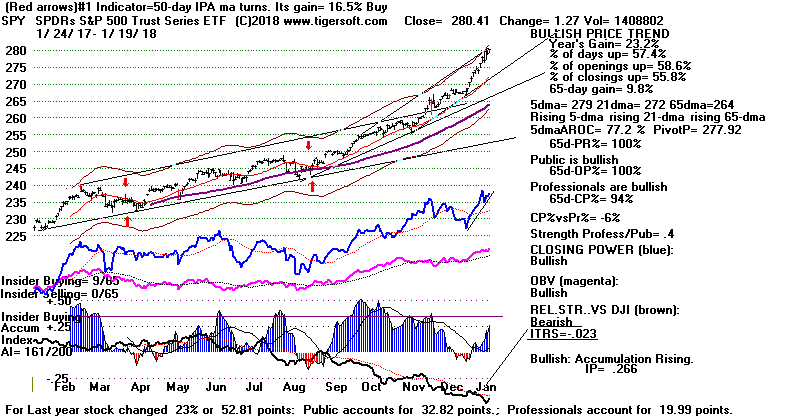 |
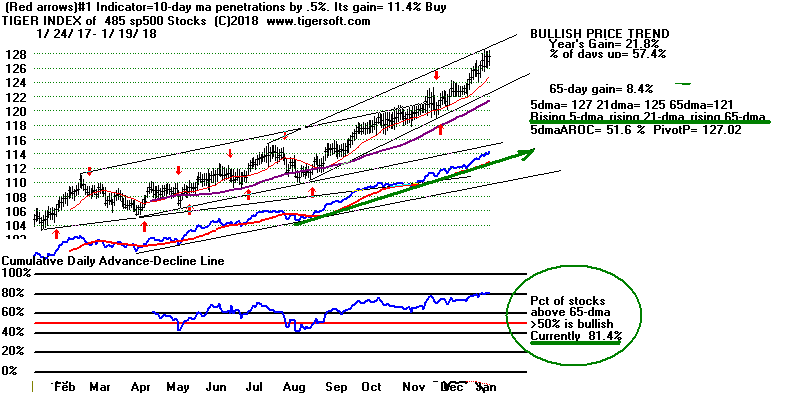 |
| Table 1
QuickSilver
Documentation
This is for short-term trading
leveraged ETFs.
It also provides a useful short-term outlook
of these sectors ETF's and the sectors they represewnt
Blue is
Bullish and
Red is Bearish.
1 Candle-Stick color is shortest-term. This
changes when close vis-a-vis opening changes.
So, in stocks or ETFs that advanced a long
ways, traders should sell when a higher
opening gives way to a decline that brings
a drop below the previous day's close.
2 5-dma AROC and Close-versus- pivot point is
next most short-term.
W = warning. Close is below
PIVOT-Point.
3 Closing Power trend-direction vs. its 21-dma
is next most short-term.
4 IP21 is used to spot divergences and to
estimate underlying support.
5 > IP21 falling and below +.15 and its 21-dma
is bearish in an over-extended ETF, especially
when its Closing Power is falling and is
below its 21-dma.
> IP21 below 07 with AROC below .07 is less
likely to bring a rally back up from 21-dma.
6 Note price trend-lines, support/resistance
and price patterns on charts. ZZZ
QUICKSILVER on ETFS - 01/19/18
ETF      CLOSE   CHANGE     PIVOT-PT   5-dma AROC   CL-PWR   CANDLE     IP21   ITRS
---------------------------------------------------------------------------------------------
DIA       260.54    .38      257.91        95.4%    Bullish      BLUE   .266    ----
---------------------------------------------------------------------------------------------
COMPQX    7336.38    40.33   7261.06       85.8%    Bullish      BLUE   .296    -.026
---------------------------------------------------------------------------------------------
SPY       280.41    1.27     277.92        77.2%    Bullish      BLUE   .267    -.023
---------------------------------------------------------------------------------------------
QQQ       166.34    .52      164.49        92.6%    Bullish      ----   .25     -.025
---------------------------------------------------------------------------------------------
MDY       359.6    3.7       357.2         46.3%    Bullish      BLUE   .126    -.034
---------------------------------------------------------------------------------------------
IWM       158.6    2.06      158.16        35%      ----         BLUE   .1      -.041
---------------------------------------------------------------------------------------------
FAS       76.89    1.56      74.51         238.5%   ----         BLUE   .118     .135
---------------------------------------------------------------------------------------------
RETL      43.84    2.36      42.68         323.4%   Bullish      BLUE   .294     .632
---------------------------------------------------------------------------------------------
SOXL      179.11    .48      160.45        631.8%   Bullish      RED    .285    -.009
---------------------------------------------------------------------------------------------
TECL      133.14    .51      127.74        284.8%   Bullish      RED    .242     .093
---------------------------------------------------------------------------------------------
IBB       112    .73         111.98        34.6%    Bullish      BLUE   .143    -.042
---------------------------------------------------------------------------------------------
GLD       126.42    .56     W126.96        38.8%    Bullish      RED    .242    -.068
---------------------------------------------------------------------------------------------
OIL       7.05   -.03       W7.15          0%       Bullish      ----   .262     .034
---------------------------------------------------------------------------------------------
OIH       28.49    .26      W29.17        -87.1%    Bullish      BLUE   .399    -.008
---------------------------------------------------------------------------------------------
GASL      28.29   -.37      W30.96        -367.9%   ----         RED    .147    -.046
---------------------------------------------------------------------------------------------
UGA       33.11   -.31       32.92         57.6%    Bullish       ----   .156    -.1
---------------------------------------------------------------------------------------------
UUP       23.65    .04      W23.71        -65.4%    Bearish       ----  -.079    -.147
---------------------------------------------------------------------------------------------
IEF       103.79   -.27     W104.57       -40.7%    Bearish       RED   -.083    -.132
---------------------------------------------------------------------------------------------
XLU      49.99   -.15       W50.26        -55.7%    Bearish       RED   -.321    -.198
---------------------------------------------------------------------------------------------
WEAT      5.97   -.02        5.92         -92.2%    ----          ----   .181    -.162
---------------------------------------------------------------------------------------------
YINN      48.12    2.29      42.57         891.1%   Bullish       BLUE   .293     .321
---------------------------------------------------------------------------------------------
RSX       23.3   -.18      W23.31         34.5%    Bullish       ----    .329    -.061
---------------------------------------------------------------------------------------------
AAPL      178.46   -.8       177.09        89.6%    Bullish       RED    .103    -.083
---------------------------------------------------------------------------------------------
GOOG      1137.51    7.72    1122.26       142.5%   Bullish       BLUE   .188     .002
---------------------------------------------------------------------------------------------
MSFT      90   -.1           89.6          107.6%   ----          RED    .078    -.041
---------------------------------------------------------------------------------------------
AMZN      1294.58    1.26   W1305.2        69.1%    Bullish       RED    .151     .048
---------------------------------------------------------------------------------------------
FB        181.29    1.49     179.37       -179.4%   Bullish       BLUE   .033    -.101
---------------------------------------------------------------------------------------------
NVDA     230.11    5.67      222.98        135%     Bullish       BLUE   .181    -.009
---------------------------------------------------------------------------------------------
BA        337.73   -2.43     336.21        142.1%   Bullish       RED    .145     .172
---------------------------------------------------------------------------------------------
GS        256.12    5.15    W257.03        19.4%    Bearish       BLUE  -.11     -.055
---------------------------------------------------------------------------------------------
HD        201.33    3        196.42        168.7%   Bullish       BLUE   .035     .119
---------------------------------------------------------------------------------------------
CAT        170.41    1.58    170.3         35.8%    Bullish       BLUE   .309     .131
|
Table 2
COMPARISONS OF BULLISH AND BEARISH
GROUPS
1/16 1/15
1/14 1/13 1/12 1/11
1/10 1/9 1/8
1/5 1/4 1/3
1/2 12/29 12/28 12/27 12/26
12/22 12/21 12/20 12/19
NEWHIGHS 820
340 121 267 905
824 313 516 651
683 610 548 479
166 336 253
308 262 317 247
210
NEWLOWS 52 78 61 67 90 67 78 76 51 51 61 61 39 32 28
21 26 32
45 50
45
------------------------------------------------------------------------------------------------------------------------------------------------------------------------------------------
MAXCPs
151
91 92
48 293
239 111
112 154
118 108 113
107 157 86
97 105
70 81
60 60
MINCPs
70
177
100
188 122 87 146 162 189
92 113 97
108 37
35 74
70 74
81 127 117
------------------------------------------------------------------------------------------------------------------------------------------------------------------------------------------
TTTNHs 112
71 49
79 162 154
75 92 89 82 84 100 107 70 102
97 103
72 89
65 71
TTTNLs
148
229
93 219
157 139 240 207 169 162 141 129 193
238 108
93 114 147
121 187 129
------------------------------------------------------------------------------------------------------------------------------------------------------------------------------------------
FASTUP
119
132 113 135 190 188 137 165 297
264 264 199 177 117 166 179
195
222 238
143
FASTDOWN
97 58
126 92 90
99 101 72
52 42 36
35 58
48 56
70 60
63 78
183
|
Table 3
Count of Stocks and New Highs in Key Tiger Directories
Date = 180119
               No.           NHs           Pct
-------------------------------------------------------------------
FOR.ETFS       65            38            58 %
BIGBANKS       7             4             57 %
DJI-13         13            7             54 %
MORNSTAR       238           100           42 %
INDEXES        195           80            41 %
HOMEBLDG       17            6             35 %
FINANCE        93            33            35 %
GAMING         28            9             32 %
DOWJONES       30            9             30 %
CHINA          64            19            30 %
NIFTY          30            8             27 %
SP500          485           129           27 %
SP-100         96            25            26 %
INSURANC       32            8             25 %
TRANSP         20            5             25 %
RETAIL         53            13            25 %
REGBANKS       33            8             24 %
RUS-1000       837           199           24 %
INFRA          35            8             23 %
NASD-100       100           22            22 %
SOFTWARE       66            14            21 %
ELECTRON       178           36            20 %
MILITARY       38            6             16 %
SEMI           130           21            16 %
AUTO           40            6             15 %
=====================================================
HOSPITAL       8             1             13 %
INDMATER       90            11            12 %
CHEM           64            7             11 %
BIOTECH        389           41            11 %
JETS           9             1             11 %
GREEN          31            3             10 %
COMPUTER       23            2             9 %
HACKERS        25            2             8 %
COMODITY       70            5             7 %
FOOD           15            1             7 %
SOLAR          21            1             5 %
BEVERAGE       20            1             5 %
OILGAS         141           6             4 %
GOLD           51            1             2 %
UTILITY        43            1             2 %
REIT           178           1             1 %
BONDFUND       111           1             1 %
====================================================
None
BIGMIL  COAL   EDU    PIPELINE
|
 |
Table 4
 RANKING OF KEY DIRECTORIES BASED PCT.OF STOCKS ABOVE 65-DMA
               1/19/18
Very Bullish = 28
Bullish = 13
Bearish = 5
---------------------------------------------------------------------------------------
Directory     Current       day-1         day-2         day-3         day-4         day-5
----------------------------------------------------------------------------------------
BIGBANKS       1             1             .857          .857          1             1
BIGMIL         1             1             1             1             1             1
DJI-13         1             1             1             1             1             .923
ETFS           .969          .953          .953          .938          .938          .907
DOWJONES       .966          .966          .966          .933          .9            .9
SP-100         .947          .937          .906          .895          .916          .916
REGBANKS       .939          .787          .787          .757          .878          .818
MORNSTAR       .924          .903          .915          .903          .903          .911
FINANCE        .903          .881          .924          .881          .913          .913
AUTO           .9            .9            .875          .9            .925          .925
TRANSP         .9            .9            .95           .95           1             1
INDEXES        .897          .902          .907          .917          .851          .841
RETAIL         .886          .83           .811          .83           .849          .849
INFRA          .885          .914          .914          .914          .942          .914
HOSPITAL       .875          .875          .875          .75           1             .875
NASD-100       .87           .87           .87           .84           .84           .84
NIFTY          .866          .866          .833          .8            .8            .8
GOLD           .843          .764          .882          .882          .862          .784
MILITARY       .842          .842          .842          .815          .868          .815
COMPUTER       .826          .782          .869          .869          .826          .739
HOMEBLDG       .823          .823          .823          .764          .823          .882
INDMATER       .822          .777          .8            .8            .822          .822
GAMING         .821          .857          .857          .857          .857          .892
SP500          .814          .802          .812          .797          .802          .804
OILGAS         .808          .787          .836          .815          .836          .836
SOFTWARE       .803          .757          .757          .742          .757          .727
BEVERAGE       .8            .7            .75           .7            .75           .7
COAL           .8            .8            .8            .8            .9            .9
N=28
================================================================================================
CHINA          .796          .765          .828          .812          .781          .812
RUS-1000       .782          .762          .77           .755          .776          .771
JETS           .777          .777          .888          .888          1             1
GREEN          .774          .774          .741          .741          .709          .741
HACKERS        .72           .68           .68           .76           .72           .72
EDU            .714          .571          .571          .571          .714          .571
PIPELINE       .714          .714          .714          .714          .714          .714
CHEM           .703          .64           .703          .703          .734          .734
ELECTRON       .696          .657          .696          .589          .612          .629
COMODITY       .685          .7            .714          .685          .685          .7
SEMI           .669          .653          .669          .538          .561          .592
INSURANC       .625          .562          .625          .531          .562          .5
BIOTECH        .624          .586          .601          .58           .642          .642
N=13
=============================================================================================
SOLAR          .476          .428          .571          .571          .571          .619
FOOD           .2            .266          .266          .133          .133          .2
REIT           .157          .123          .174          .146          .151          .179
UTILITY        .093          .093          .093          .116          .139          .139
BONDFUND       .063          .072          .09           .099          .117          .18
B=5
|
==============================================================================
1/18/2018 Why Does It Take 60
Votes in the Senate To Get A Federal Budget?
That Constitutional Issue again Overhangs the stock market and will almost
certainly bring a government shut-down. This has grabbed the news now
and
traders took more juicy profits today. But I would argue against
doing that,
at least for now.
The
September Peerless
Buy B21 still operates and predicts
higher prices.
Given the key values we saw yesterday and today, the odds are 3:1 that the
DJI will make new highs before it peaks preparatory to a decline to the
lower band. See
tonight's Table A and Table B. But the Debt Limit lessons
of 2011 and 2013-2014 do suggest that ultimately it may take a market
sell-off
in a few months to cause our political leaders to finally forge a compromise
that
avoids a US Government default on its debt and a lowering of its credit
rating.
Note that does not mean the stock market will not reach more new highs first
even though there are some lay-offs and suspensions of Federal benefits in
the
next month.
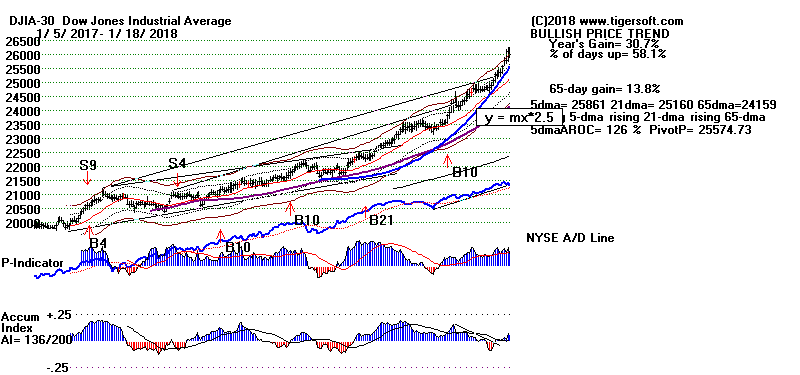

The news will be dominated by the Budget Crisis for
the next few days, weeks
and possibly months. The history of the last Budget Crisis, 2013-2014
suggests there
may have to be a sell-off to the lower band before the politicians are then
forced to
reach agreement and the Federal Debt limit is raised. But before the
brinksmanship
reaches this level of a crisis, the DJI may make more new highs. That
was the primary
lesson from the last Crisis. As long as the V-Indicator remained
positive, the market
at end of 2013 was reasonably safe and ours should be safe, too.
In the 2011 Debt Limit crisis, the top occurred in August after the V-I
turned negative
with the DJI at the upper band and the credit rating of US debt instruments
were about to be lowered. This caused the timely Peerless S9V then.
2011
See
https://en.wikipedia.org/wiki/United_States_debt-ceiling_crisis_of_2011
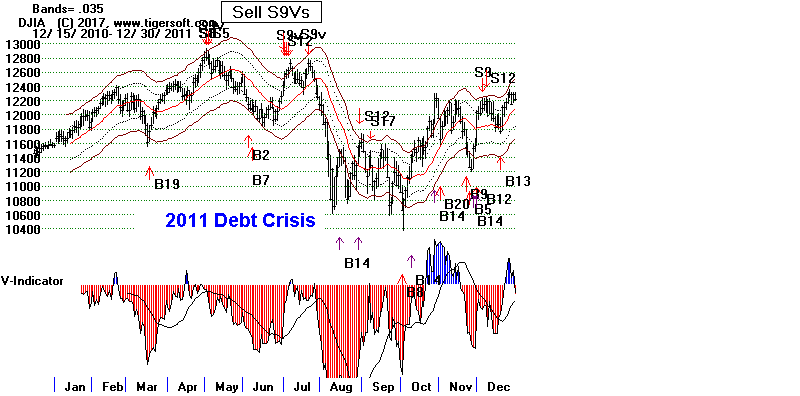
2013-2014
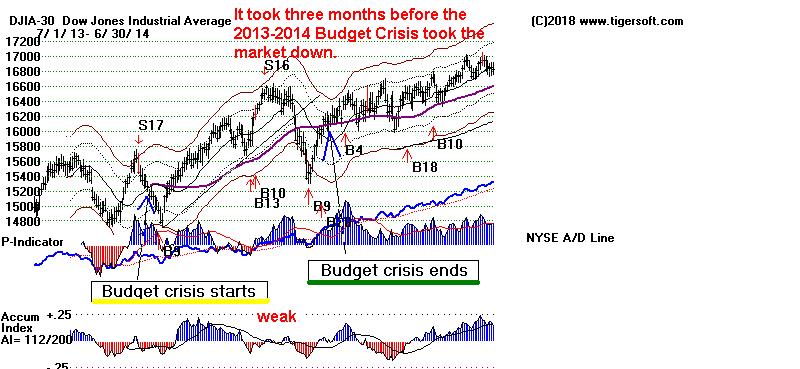

Who Do The Politicians Listen Most
Closely to?
The 2011 and 2014 Experiences Suggest Wall Street Is The Answer.
(Of course, this is also the lesson
of 2009-2010 as well as the lesson
of December 1913 when the Federal Reserve was first established.)
Currently the DJI is 3.4% above the upper band.
It appears not to have escaped
the gravity of the 3.5% upper band. The reason is the looming
shut-down of
the federal US Government because our two dominant political parties cannot
agree on what to do about the children of illegal immigrants and present law
requires Congress to approve an increase in the limit on Federal Debt which
has now been reached. The Democrats are tying this issue to the
raising of the
Deficit Limit just as Republicans attempted to do the same in 2013 by
demanding
a reduction in food stamps and an increase the age of retirement for Social
Security
recipients before voting to increase the Deficit Limit back then. There was
no
agreement for months. The Treasury furloughed non-essential employees.
Five months later, a separate bill was passed by Congress to increase the
Debt Limit high enough so that this would not be an issue for two years.
The
rating of US government securities was not effected. It took a sharp
sell-off by
the DJI to get the politicians to compromise.
Why would it be any different now?
Possibly because the Republicans view
a rising stock market to be essential to their political success.
During this 5-month standoff, the DJI rallied 10%, from 15000 to 165500
before selling off in January after a feeble Santa Claus rally (S16) and
a negative V-I reading. The quick decline in January took it down to
the 5.1% lower
band from the 3% upper band on 12/31/2013. Note that it took 3 months of
Budget Crisis and temporary furloughs before the DJI declined seriously.
Apparently, it was the falling stock market that most motivated
Congress
and the President to reach agreement. This
may be the way the crisis is
finally solved now, but I doubt it. I suspect the Republicans will
"blink" first.
(See
https://en.wikipedia.org/wiki/United_States_debt-ceiling_crisis_of_2013
)
Table A
What has happened in past when key values
were like those of 1/17/2018?
Namely:
It was January,
the DJI was is a bull market,
the DJI closed between the 3.7% and 4.3% upper band,
showed a positive V-I,
had a P-I above +15
and IP21 was between .057 and .077.
Date
DJI cl/ma P-I
IP21 Outcome
------------------------------------------------------------------------
Our Case now: 20180117 26115.65 1.041 +317
+.067
Only 1 case: 19850124
1270.43 1.04 +296.5
+.073
DJI rallied to 3/1/1985 @1299.36 and
then fell back to 1242.05 on 5/1/85
|
Table B
What has happened in past when key values
were like those of 1/18/2018?
Namely:
It was January,
the DJI was is a bull market,
the DJI closed between the 3.% and 3.9% upper band,
showed a positive V-I,
had a P-I above +15
and IP21 was between .038 and .058.
Date
DJI cl/ma P-I
IP21 Outcome
------------------------------------------------------------------------
Our Case now: 20180118 26017.81 1.034 +199
+.048
3 earlier cases:
19800115 868.6
1.03 +85.4 +.053
DJI rallied to 2/13/1980 @903.84 (Sell
S9,S15) and then fell back to 759.13 on
4/21/80
---------------------------------------------------------------------------------------
19970113 6709.18 1.033
+189.6 +.042
DJI rallied to 3/10/1997 @1299.36
(S4,S9) and then fell back to 6391.69 on
4/11/97
----------------------------------------------------------------------------------------
19990105 9311.19 1.03
+82.2 + .047
DJI rallied only to 1/8/1999 @9643.32
and then fell back to 9133.03 on 2/9/99
|
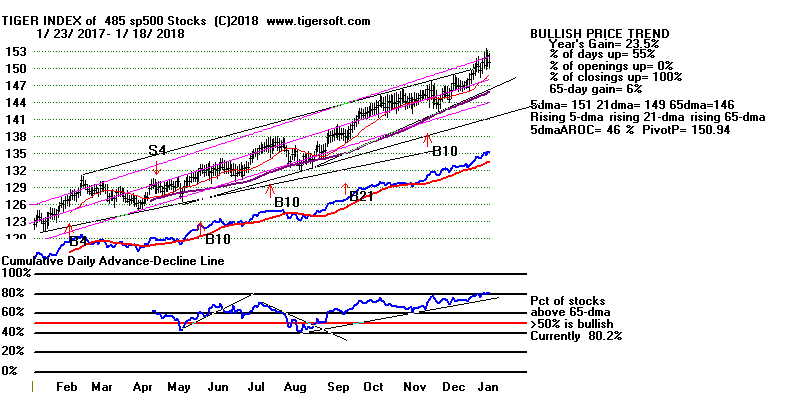 |
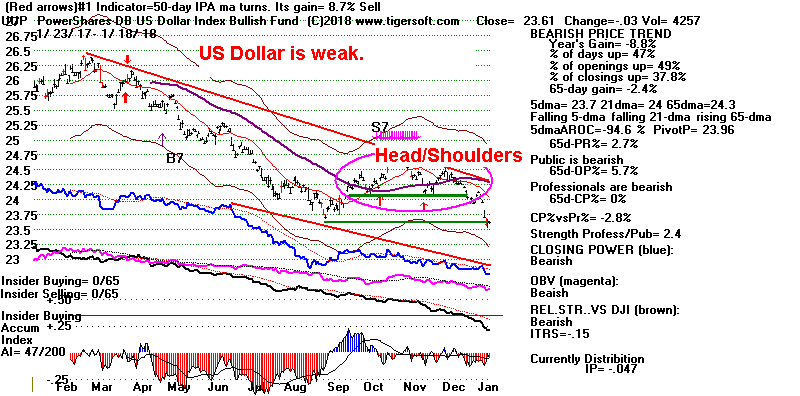 |
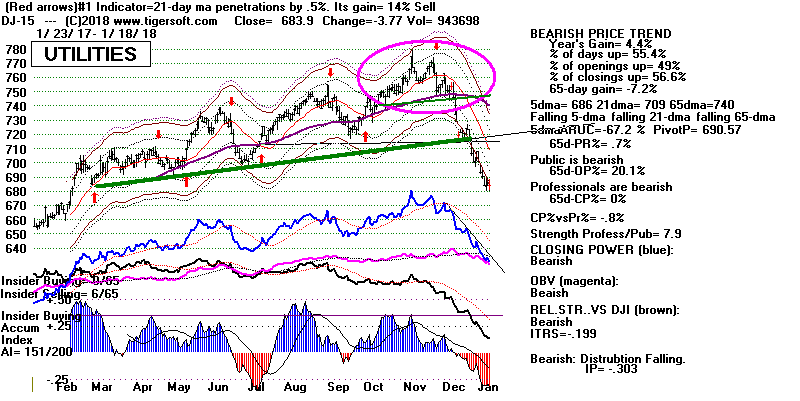 |
Table 1
QuickSilver
Documentation
This is for short-term trading
leveraged ETFs.
It also provides a useful short-term outlook
of these sectors ETF's and the sectors they represewnt
Blue is
Bullish and
Red is Bearish.
1 Candle-Stick color is shortest-term. This
changes when close vis-a-vis opening changes.
So, in stocks or ETFs that advanced a long
ways, traders should sell when a higher
opening gives way to a decline that brings
a drop below the previous day's close.
2 5-dma AROC and Close-versus- pivot point is
next most short-term.
W = warning. Close is below
PIVOT-Point.
3 Closing Power trend-direction vs. its 21-dma
is next most short-term.
4 IP21 is used to spot divergences and to
estimate underlying support.
5 > IP21 falling and below +.15 and its 21-dma
is bearish in an over-extended ETF, especially
when its Closing Power is falling and is
below its 21-dma.
> IP21 below 07 with AROC below .07 is less
likely to bring a rally back up from 21-dma.
6 Note price trend-lines, support/resistance
and price patterns on charts.
Charts 1/18/2018
QUICKSILVER on ETFS - 01/18/18
ETF      CLOSE   CHANGE     PIVOT-PT    5-dma AROC   CL-PWR     CANDLE   IP21    ITRS
---------------------------------------------------------------------------------------------
DIA       260.16   -.92      255.61        127.1%    Bullish      RED    .198    -----
---------------------------------------------------------------------------------------------
COMPQX    7296.05   -2.23    7211.78       98.5%     Bullish      BLUE   .264    -.028
---------------------------------------------------------------------------------------------
SPY       279.14   -.47      276.12        90.6%     Bullish      RED    .175    -.026
---------------------------------------------------------------------------------------------
QQQ       165.82    .03      163.29        111%      Bullish      BLUE   .251    -.024
---------------------------------------------------------------------------------------------
MDY       355.9   -1.22     W356.3         65%       Bullish      RED    .116    -.04
---------------------------------------------------------------------------------------------
IWM       156.54   -1.08    W157.5         54.2%     Bearish      RED    .05    -.053
---------------------------------------------------------------------------------------------
FAS       75.33   -.55       73.33         191.1%    Bearish      RED    .056     .119
---------------------------------------------------------------------------------------------
RETL      41.48    .44       41.17         405%      Bullish      BLUE   .291     .542
---------------------------------------------------------------------------------------------
SOXL      178.63    2.51     158           719.8%    Bullish      BLUE   .357     .036
---------------------------------------------------------------------------------------------
TECL      132.63    .67      125.8         339.8%    Bullish      BLUE   .252     .096
---------------------------------------------------------------------------------------------
IBB       111.27   -.14      111.23        16.2%     Bullish      RED    .079    -.053
---------------------------------------------------------------------------------------------
GLD       125.86   -.28      125.44        32.9%     Bullish      RED    .288    -.063
---------------------------------------------------------------------------------------------
OIL       7.08   -.01        7.05          42.4%     Bullish      ----   .238     .09
---------------------------------------------------------------------------------------------
OIH       28.23   -.46      W28.99        -8.7%      Bullish      RED    .385     .034
---------------------------------------------------------------------------------------------
GASL      28.66   -1.2      W30.49         40.2%     ----         RED    .137     .089
---------------------------------------------------------------------------------------------
UGA       33.42    .26       32.73         106.5%    Bullish      BLUE   .148    -.07
---------------------------------------------------------------------------------------------
UUP       23.61   -.03      W23.96        -94.6%     Bearish      ----  -.046    -.15
---------------------------------------------------------------------------------------------
IEF       104.06   -.33     W104.64       -24.4%     Bearish      ----  -.075    -.128
---------------------------------------------------------------------------------------------
XLU      50.14   -.32       W50.55        -59.5%     Bearish      RED   -.325    -.198
---------------------------------------------------------------------------------------------
WEAT      5.99    .04       W6.08         -100.2%    ----         ----   .158    -.152
---------------------------------------------------------------------------------------------
YINN      45.83    .88       40.41         732.8%    Bullish      BLUE   .2     .266
---------------------------------------------------------------------------------------------
RSX       23.48    .31       23.14         138.8%    Bullish      BLUE   .348    -.028
---------------------------------------------------------------------------------------------
AAPL      179.26    .16      175.28        140.9%    Bullish      RED    .124    -.067
---------------------------------------------------------------------------------------------
GOOG      1129.79   -2.19    1105.52       121.7%    Bullish      RED    .187    -.012
---------------------------------------------------------------------------------------------
MSFT      90.1   -.04        88.08         128.4%    ----         BLUE   .065    -.035
---------------------------------------------------------------------------------------------
AMZN      1293.32   -1.68    1276.68       151.5%    Bullish      RED    .227     .057
---------------------------------------------------------------------------------------------
FB        179.8    2.2      W187.77       -220.6%    Bullish      BLUE   .049    -.101
---------------------------------------------------------------------------------------------
NVDA     224.44   -.28       224.08        17%       Bullish      BLUE   .198    -.031
---------------------------------------------------------------------------------------------
BA        340.16   -10.85    328.12        297.8%    Bullish      RED    .199     .193
---------------------------------------------------------------------------------------------
GS        250.97   -2.68    W255.13       -65.7%     Bearish      RED   -.206    -.079
---------------------------------------------------------------------------------------------
HD        198.33   -1.49     194.68        166.7%    Bullish      RED   -.014     .1
---------------------------------------------------------------------------------------------
CAT        168.83    .33     169.2         87.8%     Bullish      RED    .293     .129
|
Table 2
COMPARISONS OF BULLISH AND BEARISH
GROUPS
1/15
1/14 1/13 1/12 1/11
1/10 1/9 1/8
1/5 1/4 1/3
1/2 12/29 12/28 12/27 12/26
12/22 12/21 12/20 12/19
NEWHIGHS
340 121 267 905
824 313 516 651
683 610 548 479
166 336 253
308 262 317 247
210
NEWLOWS 78 61 67 90 67 78 76 51 51 61 61 39 32 28
21 26 32
45 50
45
------------------------------------------------------------------------------------------------------------------------------------------------------------------------------------------
MAXCPs
91 92
48 293
239 111
112 154
118 108 113
107 157 86
97 105
70 81
60 60
MINCPs
177
100
188 122 87 146 162 189
92 113 97
108 37
35 74
70 74
81 127 117
------------------------------------------------------------------------------------------------------------------------------------------------------------------------------------------
TTTNHs
71 49
79 162 154
75 92 89 82 84 100 107 70 102
97 103
72 89
65 71
TTTNLs
229
93 219
157 139 240 207 169 162 141 129 193
238 108
93 114 147
121 187 129
------------------------------------------------------------------------------------------------------------------------------------------------------------------------------------------
FASTUP
132 113 135 190 188 137 165 297
264 264 199 177 117 166 179
195
222 238
143 172
FASTDOWN
97 58 126 92 90 99 101
72 52 42
36 35
58 48
56 70
60 63
78 183
|
Table 3
Count of Stocks and New Highs in Key Tiger Directories
Date = 180118
              No.            NHs           Pct.
-------------------------------------------------------------------
BIGBANKS       7             4             57 %
ETFS           65            26            40 %
DOWJONES       30            8             27 %
DJI-13         13            3             23 %
CHINA          64            15            23 %
SP-100         96            15            16 %
INSURANC       32            5             16 %
FINANCE        93            14            15 %
MORNSTAR       238           35            15 %
SOFTWARE       66            10            15 %
TRANSP         20            3             15 %
==================================================================
INDEXES        195           28            14 %
SP500          485           67            14 %
NASD-100       100           14            14 %
HACKERS        25            3             12 %
SEMI           131           16            12 %
GAMING         28            3             11 %
ELECTRON       179           20            11 %
RUS-1000       837           96            11 %
NIFTY          30            3             10 %
COMPUTER       23            2             9 %
RETAIL         53            5             9 %
COMODITY       70            5             7 %
REGBANKS       33            2             6 %
HOMEBLDG       17            1             6 %
INFRA          35            2             6 %
MILITARY       38            2             5 %
BIOTECH        387           21            5 %
INDMATER       90            4             4 %
GREEN          31            1             3 %
AUTO           40            1             3 %
OILGAS         141           3             2 %
UTILITY        43            1             2 %
===================================================
BIGMIL    CHEM     SOLAR    COAL   GOLD     REIT
EDU  PIPELINE BEVERAGE FOOD   BONDFUND HOSPITAL JETS
|
Table 4
 RANKING OF KEY DIRECTORIES BASED PCT.OF STOCKS ABOVE 65-DMA
              1/18/18
---------------------------------------------------------------------------------------
Directory     Current       day-1         day-2         day-3         day-4         day-5
----------------------------------------------------------------------------------------
BIGBANKS       100%          .857          .857          1             1             1
BIGMIL         1             1             1             1             1             1
DJI-13         1             1             1             1             .923          .923
DOWJONES       .966          .966          .933          .9            .9            .866
ETFS           .953          .953          .938          .938          .923          .892
SP-100         .937          .906          .895          .916          .916          .875
INFRA          .914          .914          .914          .942          .914          .828
INDEXES        .907          .907          .917          .851          .841          .841
MORNSTAR       .903          .915          .903          .903          .911          .878
AUTO           .9            .875          .9            .925          .925          .85
TRANSP         .9            .95           .95           1             1             .9
FINANCE        .881          .924          .881          .913          .913          .86
HOSPITAL       .875          .875          .75           1             .875          .625
NASD-100       .87           .87           .84           .84           .83           .82
NIFTY          .866          .833          .8            .8            .8            .8
GAMING         .857          .857          .857          .857          .892          .785
MILITARY       .842          .842          .815          .868          .815          .789
RETAIL         .83           .811          .83           .849          .849          .792
HOMEBLDG       .823          .823          .764          .823          .882          .823
SP500          .802          .812          .797          .802          .804          .769
COAL           .8            .8            .8            .9            .9            .8
N=21
==============================================================================================
OILGAS         .787          .836          .815          .836          .829          .78
REGBANKS       .787          .787          .757          .878          .848          .696
COMPUTER       .782          .869          .869          .826          .739          .695
INDMATER       .777          .8            .8            .822          .822          .744
JETS           .777          .888          .888          1             1             .888
GREEN          .774          .741          .741          .709          .741          .645
CHINA          .765          .828          .812          .781          .812          .812
GOLD           .764          .882          .882          .862          .784          .764
RUS-1000       .762          .77           .755          .776          .771          .729
SOFTWARE       .757          .757          .742          .757          .727          .681
PIPELINE       .714          .714          .714          .714          .714          .714
BEVERAGE       .7            .75           .7            .75           .7            .75
COMODITY       .7            .714          .685          .685          .7            .685
HACKERS        .68           .68           .76           .72           .72           .68
ELECTRON       .653          .692          .586          .614          .631          .564
SEMI           .648          .664          .534          .564          .595          .541
CHEM           .64           .703          .703          .734          .734          .64
BIOTECH        .583          .599          .578          .64           .635          .602
EDU            .571          .571          .571          .714          .571          .571
INSURANC       .562          .625          .531          .562          .5            .468
N=20
=============================================================================================
SOLAR          .428          .571          .571          .571          .619          .571
FOOD           .266          .266          .133          .133          .2            .266
REIT           .123          .174          .146          .151          .179          .134
UTILITY        .093          .093          .116          .139          .139          .116
BONDFUND       .072          .09           .099          .117          .171          .207
N=5
|
==============================================================================
1/17/2018 The
September
Buy B21 still operates and predicts
higher prices.
The DJI's
accelerating uptrend will likely angle up at an even faster rate. But
a breather
and some profit-taking now would come as no surprise. The ratio of new
highs to
new lows has slipped quite a bit over the last two days and the percent of
all stocks
above their 65-dma actually fell 3% today.
But don't look for much of a decline. The thing about parabolic
up-trends is that
all the declines are usually shallow and short-lived until the market or
stock goes
truly vertical. By this I mean, we should expect a 500-point or
1000-point DJI
up-day. This is not a random-walk market anymore. This is a
market whose
"animal spirits" have been awakened and starting to run wild.
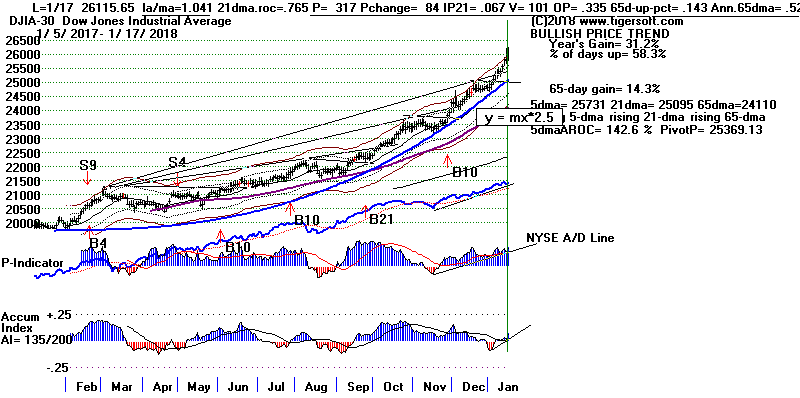
The DJI, of course, is led by Boeing (BA) which is
rising in its own accelerating uptrend.
Like the DJI it has come a long way without a single correction. It
appears to be very
tightly held. No one knows where to sell and everyone of its
shareholders wishes
they had bought more. Until it announces a stock split, it should go
higher. Note
how the optimized lower band for BA is just 2.5% while its upper band is
8.5%.
The ratio of the optimized upper band to the lower band will be made into a
TigerSoft
screening tool. More on this tomorrow night.

TigerSoft's "Rocket Ratio"
for Boeing = 8.5/2.5 or 3.4
In aerospace engineering, the rocket ratio is
a measure of the efficiency
of a rocket when the weight of more or less propellant is
added. Our
ratio shows efficiency, too. A stock that pulls back very little and
rises
much more should usually be favored, especially if the marginal rocket
ratio is increasing.
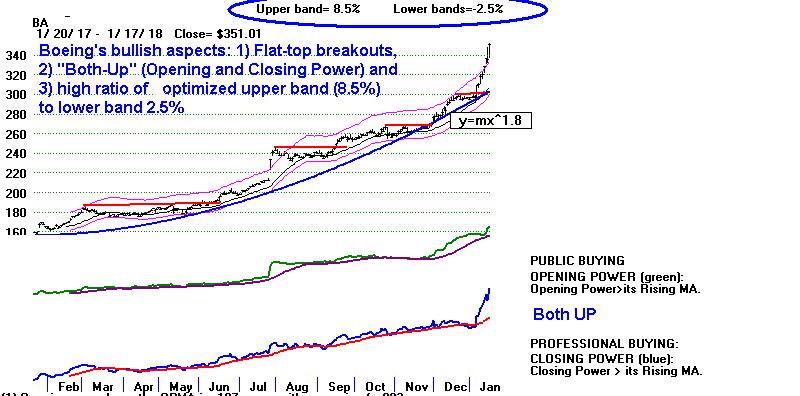
And lest you think the DJI can't go much higher, look at AAPL. If it
can breakout
above its flat-top and then above the top of its price-channel, it will
easily surpass
200 and then much higher.
Apple, Capitalizing on New Tax Law, Plans to Bring Billions in Cash Back to
U.S.
See NY Times article tonight:
https://www.nytimes.com/2018/01/17/technology/apple-tax-bill-repatriate-cash.html?emc=edit_th_180118&nl=todaysheadlines&nlid=58223894
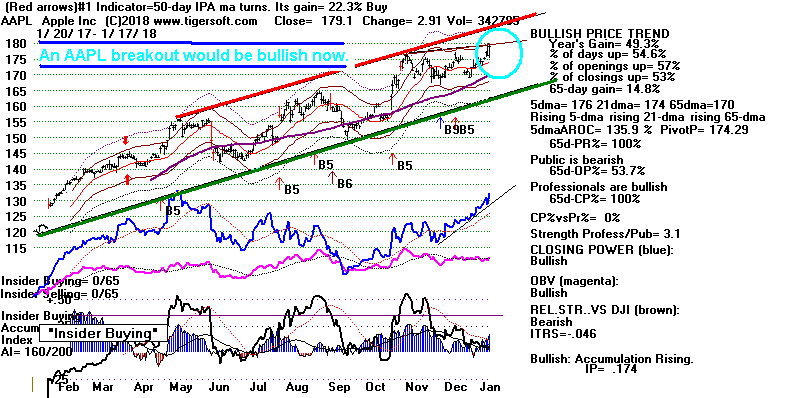
.
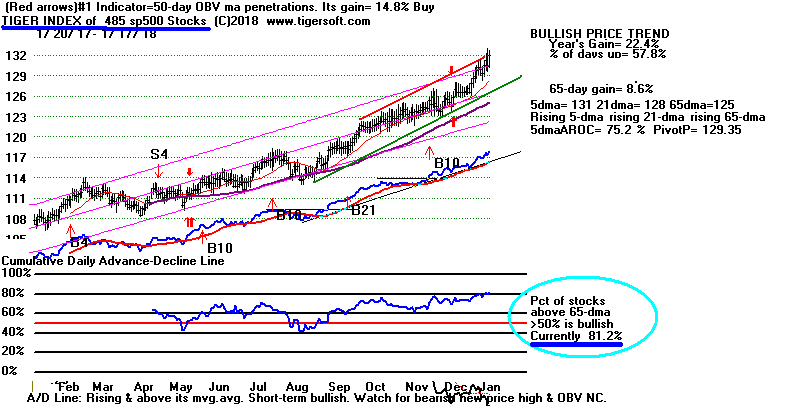
Charts 1/17/2018
PEERLESS
DJI, Signals, Indicators Daily
DJI Volume 10-DayUp/Down Vol
V-Indicator
Hourly DJIA
A/D Line for All
Stocks
NASDAQ
S&P
OEX
NYSE COMPQX
DJI-15 DJI-20
DJI-30
DIA
SPY
QQQ MDY
IWM
TNA
CrudeOil
FAS
GLD
BBH
IBB
JETS
JNUG
KOL
NUGT
OIH
OIL
RSX
RETL
SDS
SLV
SOXL
TECL
TMF
TNA UGA
(gasoline)
XIV
YINN
Commodities:
JJC, NIB,
CHOC
CORN,
WEAT
UUP
(Dollar)
AAPL ADBE
ALXN
AMAT
AMGN AMD
AMZN
BA BABA BAC
BIDU
CAT
CVX
DE
FB
GOOG
GS HD
IBM JPM M
(Macy's)
MSFT NFLX
NVDA
QCOM TSLA
TXN
XOM
WMT
ANDV (refinery),
CMG (Chipotle), LRCX,
SWKS,
TOWN
Also SPPI WATT
SQ (Square)
1/17/2018
Bullish MAXCPs Bearish
MINCPs |
Table 1
QUICKSILVER on ETFS - 01/17/18
ETF      CLOSE   CHANGE     PIVOT-PT   5-dma AROC   CL-PWR      CANDLE  IP21   ITRS
---------------------------------------------------------------------------------------------
DIA       261.08    3.27     253.62        141.9%   Bullish      BLUE   .205    ----
---------------------------------------------------------------------------------------------
COMPQX    7298.28    74.59   7153.57       93.5%    Bullish      BLUE   .313    -.024
---------------------------------------------------------------------------------------------
SPY       279.61    2.64     274.12        91.9%    Bullish      BLUE   .212    -.026
---------------------------------------------------------------------------------------------
QQQ       165.79    1.77     162.18        98.9%    Bullish      BLUE   .292    -.019
---------------------------------------------------------------------------------------------
MDY       357.12    2.59     351.28        59.5%    Bullish      BLUE   .133    -.039
---------------------------------------------------------------------------------------------
IWM       157.62    1.48     154.84        89.6%    Bullish      BLUE   .102    -.051
---------------------------------------------------------------------------------------------
FAS       75.88    1.82      72.5          279.2%   ----         BLUE   .085     .115
---------------------------------------------------------------------------------------------
RETL      41.04    1.04      38.19         438.4%   Bullish      BLUE   .294     .503
---------------------------------------------------------------------------------------------
SOXL      176.12    13.95    155.25        467.6%   Bullish      BLUE   .383     .075
---------------------------------------------------------------------------------------------
TECL      131.96    5.69     123.99        261.5%   Bullish      BLUE   .299     .112
---------------------------------------------------------------------------------------------
IBB       111.41    .81      110.91        45%      Bullish      ----   .117    -.04
---------------------------------------------------------------------------------------------
GLD       126.14   -1.03     125.03        56%      Bullish      RED    .312    -.07
---------------------------------------------------------------------------------------------
OIL       7.09    .01        7.02          106.4%   Bullish      ----   .258     .111
---------------------------------------------------------------------------------------------
OIH       28.69    .18       28.28         89.1%    Bullish      BLUE   .394     .059
---------------------------------------------------------------------------------------------
GASL      29.86    .34       28.42         148.3%   Bullish      RED    .134     .176
---------------------------------------------------------------------------------------------
UGA       33.16    .36       32.72         70.2%    Bullish      BLUE   .095    -.079
---------------------------------------------------------------------------------------------
UUP       23.64    .06      W24.06        -100.5%   Bearish      ----  -.003    -.151
---------------------------------------------------------------------------------------------
IEF       104.39   -.23     W104.57       -10%      Bearish      RED   -.038    -.128
---------------------------------------------------------------------------------------------
XLU      50.46    .31       W50.74        -83%      Bearish      BLUE  -.327    -.194
---------------------------------------------------------------------------------------------
|
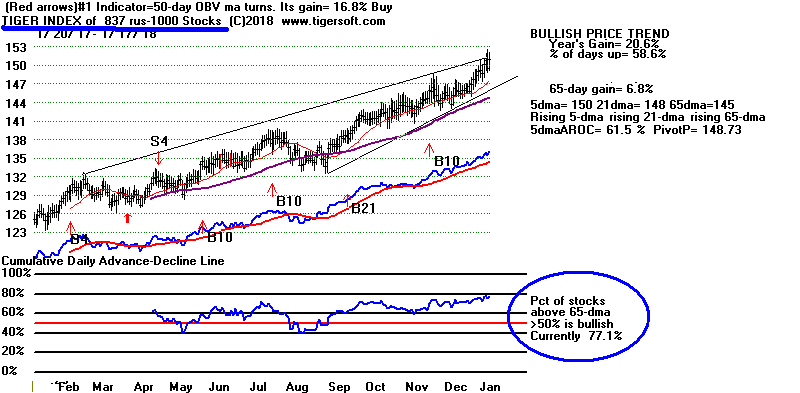 |
Table 2
COMPARISONS OF BULLISH AND BEARISH
GROUPS
1/14
1/13 1/12 1/11 1/10
1/9 1/8 1/5
1/4 1/3 1/2
12/29 12/28 12/27 12/26 12/22
12/21 12/20 12/19 12/18 12/15
NEWHIGHS 121 267 905 824 313 516 651
683 610 548 479
166 336 253
308 262 317 247
210 553 309
NEWLOWS 61 67 90 67 78 76 51 51 61 61 39 32 28
21 26 32
45 50
45 43
49
---------------------------------------------------------------------------------------------------------------------------------------------------------------------------------------------
MAXCPs
92
48 293
239 111
112 154
118 108 113
107 157 86
97 105
70 81
60 60
133 122
MINCPs
100
188
122 87 146 162 189
92 113 97
108 37
35 74
70 74
81 127 117
76 65
--------------------------------------------------------------------------------------------------------------------------------------------------------------------------------------------
TTTNHs 49
79 162 154
75 92 89 82 84 100 107 70 102
97 103
72 89
65 71
146 118
TTTNLs
93 219
157 139 240 207 169 162 141 129 193
238 108
93 114 147
121 187 129
90 98
--------------------------------------------------------------------------------------------------------------------------------------------------------------------------------------------
FASTUP 113 135 190 188 137 165 297
264 264 199 177 117 166 179
195
222 238
143 172 166 126
FASTDOWN 58 126 92 90 99 101
72 52 42
36 35
58 48
56 70
60 63
78 183
96 125
|
Table 3
Count of Stocks and New Highs in Key Tiger Directories
Date = 180117
               No.           NHs           Pct.
-------------------------------------------------------------------
DJI-13         13            8             62 %
ETFS           65            38            58 %
BIGBANKS       7             4             57 %
DOWJONES       30            15            50 %
NIFTY          30            14            47 %
INDEXES        195           80            41 %
MORNSTAR       238           82            34 %
BIGMIL         6             2             33 %
GAMING         28            9             32 %
NASD-100       100           31            31 %
HOMEBLDG       17            5             29 %
SP-100         96            28            29 %
FINANCE        93            25            27 %
SP500          485           130           27 %
COMPUTER       23            6             26 %
AUTO           39            8             21 %
MILITARY       38            8             21 %
SOFTWARE       66            14            21 %
RUS-1000       837           177           21 %
CHINA          64            13            20 %
INSURANC       32            6             19 %
SEMI           131           22            17 %
RETAIL         53            9             17 %
ELECTRON       179           28            16 %
------------------------------------------------------
REGBANKS       33            4             12 %
HACKERS        25            3             12 %
INFRA          35            4             11 %
BEVERAGE       20            2             10 %
OILGAS         141           12            9 %
INDMATER       90            7             8 %
BIOTECH        386           31            8 %
GREEN          31            2             6 %
CHEM           64            2             3 %
COMODITY       69            2             3 %
REIT           178           3             2 %
UTILITY        43            1             2 %
===================================================
None
TRANSP  SOLAR   COAL   GOLD   EDU   PIPELINE   FOOD
BONDFUND  HOSPITAL   JETS
|
Table 4
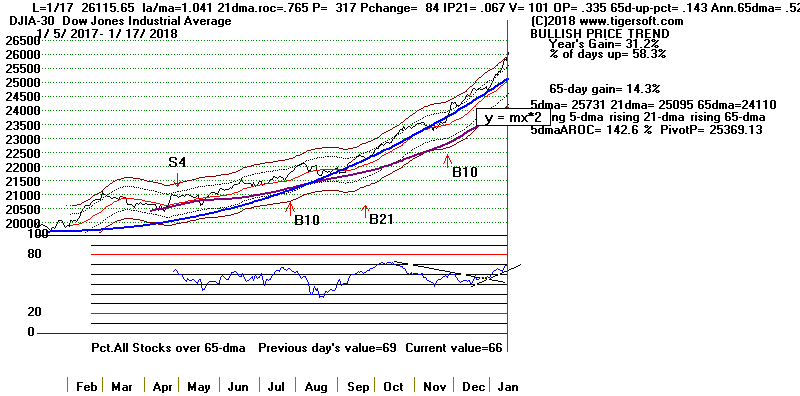 RANKING OF KEY DIRECTORIES BASED PCT.OF STOCKS ABOVE 65-DMA
1/17/18
Bullish = 42
Bearish = 4
---------------------------------------------------------------------------------------
Directory Current day-1 day-2 day-3 day-4 day-5
----------------------------------------------------------------------------------------
BIGMIL 1 1 1 1 1 1
DJI-13 1 1 1 .923 .923 .923
DOWJONES .966 .933 .9 .9 .866 .866
ETFS .953 .938 .938 .923 .892 .923
TRANSP .95 .95 1 1 .9 .9
FINANCE .924 .881 .913 .913 .86 .774
MORNSTAR .915 .903 .903 .911 .878 .894
INFRA .914 .914 .942 .914 .828 .857
INDEXES .907 .917 .851 .841 .841 .851
SP-100 .906 .895 .916 .916 .875 .895
JETS .888 .888 1 1 .888 .777
GOLD .882 .882 .862 .784 .764 .705
HOSPITAL .875 .75 1 .875 .625 .625
AUTO .871 .897 .923 .923 .846 .871
NASD-100 .87 .84 .84 .83 .81 .87
COMPUTER .869 .869 .826 .739 .695 .652
BIGBANKS .857 .857 1 1 1 .857
GAMING .857 .857 .857 .892 .785 .821
MILITARY .842 .815 .868 .815 .763 .763
OILGAS .836 .815 .836 .829 .78 .808
NIFTY .833 .8 .8 .8 .8 .833
CHINA .828 .812 .781 .812 .796 .812
HOMEBLDG .823 .764 .823 .882 .823 .764
SP500 .812 .797 .802 .804 .769 .793
RETAIL .811 .83 .849 .849 .792 .792
COAL .8 .8 .9 .9 .8 .9
INDMATER .8 .8 .822 .822 .755 .744
REGBANKS .787 .757 .878 .848 .696 .666
RUS-1000 .77 .755 .776 .771 .728 .753
SOFTWARE .757 .742 .757 .727 .666 .727
BEVERAGE .75 .7 .75 .7 .75 .75
GREEN .741 .741 .709 .741 .645 .677
PIPELINE .714 .714 .714 .714 .714 .857
COMODITY .71 .681 .681 .695 .681 .695
CHEM .703 .703 .734 .734 .656 .656
ELECTRON .692 .586 .614 .631 .564 .586
HACKERS .68 .76 .72 .72 .64 .72
SEMI .664 .534 .564 .595 .541 .587
INSURANC .625 .531 .562 .5 .468 .437
BIOTECH .601 .58 .642 .637 .601 .593
EDU .571 .571 .714 .571 .571 .571
SOLAR .571 .571 .571 .619 .571 .571
===============================================================================================
FOOD .266 .133 .133 .2 .266 .333
REIT .174 .146 .151 .179 .134 .129
UTILITY .093 .116 .139 .139 .116 .116
BONDFUND .09 .099 .117 .171 .207 .261
|
==============================================================================
1/16/2018 The
September
Buy B21 still operates and predicts
higher prices. Short-term
traders will no doubt have noted today's big reversal and how the DJI is
now doing
much better than any of the other major indexes, even the
NASDAQ. See the
column of ITRS numbers in Table 1. ITRS is the difference between
the stock's
ETF's, or index's 50-day rate of change and the DJIs.
To guard our flanks, we should probably do some selling short in tonight's
bearish
MINCP offerings. The
Dollar's continuing weakness makes a Fed hike seem likely soon
even though the posted CPI is only 2.1% above last year. But, hold
DIA, SPY,
QQQ and TECL.
We will need to see a new Peerless Sell, a head/shoulders top
or a serious A/D Line non-confirmation before we can expect a decline that
will
break the DJI's rising 21-dma.
The two hundred point jump at the opening to the DJI's 26000 level was just
too
much for lots of folks not to take profits. But did you notice that
the DJI could not
go much below its previous close? There were too many lagging buy
orders from
folks who understand how bullish the political economy (tax cuts,
de-regulation,
military spending and infrastructure re-building) is for the market's
leaders, most
of whom are in the DJI-30.
One reversal day is not enough to stop this bull market.
I remain optimistic, first, because of the Buy B21's average +17% gain has
not yet been
reached. So far, the DJI's September-B21 is up "only" +15.7%.
Secondly, because
accelerating DJI uptrends are very bullish and because the NASDAQ shows a
nearly
perfect A/I-200 score, it will probably take a truly flagrant A/D Line
non-confirmation of
a DJI new high plus a Sell S9 to stop such our powerful uptrend. Low
IP21 numbers are
not enough.
Third, I would stay bullish because talk of a Government shut-down is very
likely premature and, in any case, the 1995 and 2013 earlier experiences
with such
shut-downs show how an on-going bull market all but ignores them. Only
when the V-I
was negative in 2011 (The V-I is now + 71.), did the DJI peak with a
government
shutdown dominating the news. I believe the cause then was a lowering
of government
bond's credit ratings. News of this would hurt the market, I will
admit. But there is no
talk
of lower the bonds' credit rating now by Moody's or Standard & Poor's.
An April Top This Year Would Be The Most
Typical
There is a fourth reason for believing that we will see still higher DJI
prices. It is
that we only infrequently see tradable tops early in the year following a
powerful DJI
advance. See the table just below.
There were
33 cases to study. Only one saw a
January top after the 10th of that month. That was at the end of
January 1994 when
Greenspan raised short-term rates unexpectedly.
Otherwise, consider the frequency distribution of tops in the year following
a big upswing
in the DJI. There were 3 tops in January, 4 in February, all in the
first half, and 6 in both
March and April. By my calculations, a mid
April DJI top this year would be the
most typical given this chronological distribution.
Tops in The Year Following A
Very Strong Bull Market
Top
Peerless Signal at Top Size of Next DJI Decline
----------- ------------------------------
---------------------------------
2/11/1926 Head/shoulders
(H/S) 162.30 to 135.20 (17%)
5/31/1927 uptrend-break @170
172.90 to 165.70
5/14/1928 H/S
220.9 to 211.9
2/5/1929 S9V,
S12
322.1 to 300.4
4/6/1936 S12, S15,S9
161.9 to 143.7
3/10/1937 S9, S15
194.4 to 165.5
7/14/1943 S8, S19
145.8 to 134.0
7/13/1944 None
150.3 to 143.6
3/6/1945 None
H/S
161.5 to 152.3
6/12/1950 S8,S5, H/S
228.4 to 197.6
8/3/1954 None
349.6 to 335.8
3/4/1955 None
419.7 to 391.4
5/29/1959 S7
643.8 to 617.6
1964 no
retreats to lower band
2/9/1966 S4,
S12
Bear Market started.
4/21/1976 S7, S15
1011.02 to 958.09
1/10/1983 S12
1092.35 to 1030.17
la/ma=1.052 P=105 IP21= .002 V=4 OP=.122
1/9/1984 S12
Bear Market started.
la/ma=1.021 P=36 IP21=
.007 V= -2 OP= -.169
3/27/1986 None
1821.72 to 1735.51
6/23/1989 S14
2531.87 to 2440.06
6/1/1992 S9, S15
3413.21 to 3176.03
1993 no
retreats to lower band in 1993.
1/31/1994 S4 Rate Hike, H/S
3978.36 to 3593.35
1995 no
retreats to lower band in 1995.
3/18/1996 S1
5683.60 to 5420.95
3/10/1997 S4, S9V
7079.39 to 6391.69
4/21/1998 S9,S15
9184.94 to 8627.93
2/11/2004 S19
10737.7 to 9906.91
5/10/2006 S9, S8
11642.65 to 10706.14
4/23/2010 S11, H/S
11204.28 to 9686.48
4/02/2012 S1
13264.49 to 12101.46
5/28/2013 S19
15409.39 to 14659.56
2017
no retreats to lower band in 2017.
===============================================================================
1/12/2018 The
September
Buy B21 still operates and predicts
higher prices.
When the lower support is accelerating up and prices breakout above
flat or rising resistance, we often see swift vertical ascents. This is
rare for the DJIA. 1915 shows this most clearly. (See its chart
further below.)
And that produced the single best year for the DJI ever.
Usually
we see such
moves in commodities or in the climactic blow-offs in
smaller, speculative stocks.
The major market ETFs, led by the DJI-30 (DIA) is running away from
anyone
who hesitates. Many Trump haters are being left behind. Our people
should
separate politics and the stock market enough to take advantage of the
trends no
matter what you think of the President's lies and vulgarity. There are
still a lot of
people, even Professionals, who are still not aboard this bull market
because they
cannot make this distinction. That's one more reason for thinking it
has much further to
go on the upside.
Boeing and Caterpillar, representing Big Military and Infrastructure
Spending, are
the leaders. They are up a lot, true. But the lesson of
1921-1929 is that they can
go much higher unless the FED tightens money for Wall Street speculation,
something
which they very rarely do. As it is, higher performance money must play
these leaders
and DIA, in particular. Relax and enjoy the ride. Peerless
teaches us that we will
see obvious divergences and an obvious top formation when the top is
reached.
If you are a Republican, I would not worry about the Democrats taking all
the
fun away in November Elections. That is far away, number one.
The rising market
is helping a lot of workers' 401Ks and mutual funds, number two.
People vote their
pocket book. And finally, even if Trump were impeached, a President
Pence
would change nothing regarding De-Regulation, Taxation, Off-Shore Leasing,
Privatization or Infrastructure Spending. My advise is do not listen
to CNN. They
thrive on drama. We should focus on the market's technicals. This
seems to be
a once-in-a-generation MELT-UP. This is the 1920s! If I'm right,
expect to see
the fashions from then make a return, too! .

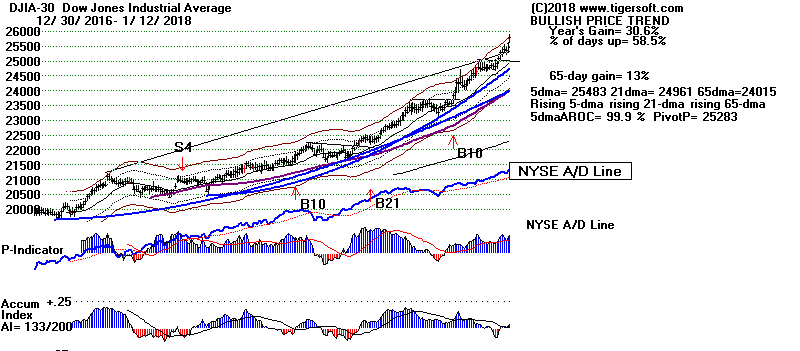

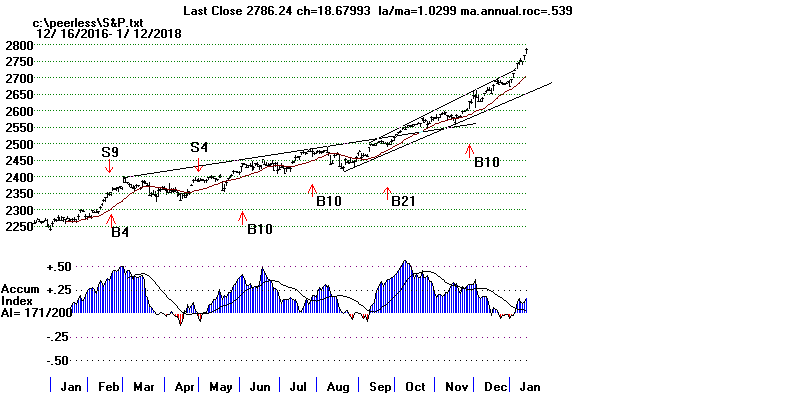
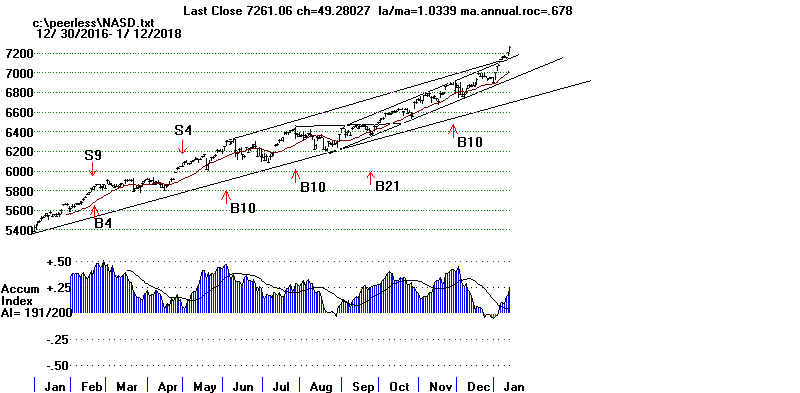
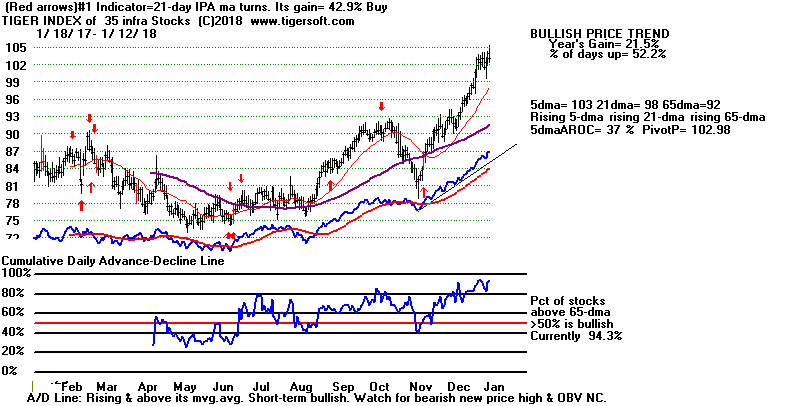
These are the
INFRASRUCTURE STOCKS NOW in our Tiger Download for this.
Any additional
suggestions would be welcome:
AA, ACM, AKS, AWI,
BHP, BIP, CAT, CBI, CLF, CX, DE, ENB, EXP, FLR
GVA, IGF, JEC, MIC, MLM,
MSB, NUE, PWR, RIO, SLM, STLD, TEX, TPC
TOLZ, URI, USCR, UTF,
VALE, VMC, X, ZEUS
==============================================================================
1/11/2018 The
September
Buy B21 still operates and predicts
higher prices.
There were 1610 more up than down on the NYSE. This is the best
breadth since September 11th last year when the DJI began the big
advance that is continuing full force now. What lifted the market so
much today, I believe, was its move past the expected resistance at
12500 and the Labor Department's report. just before the market opened,
that December's Producer Price Index fell by 0.1 over November's. This
gives bulls hopes that tomorrow's CPI annual change will continue to be
well below the +3.2% rate that past history suggests we should worry
about.
(
https://www.bls.gov/news.release/ppi.nr0.htm )
Monday is our national celebration of civil rights' martyr Martin Luther
King's
birthday. Trading the day before a holiday typically beings an
advance.
Enjoy the three day weekend. I've matched the Peerless key values with
those most similar in the past. As you can see from Table A tonight,
the DJI
should keep rising so long as the V-I is in an uptrend. The momentum
of
the DJI's hyperbolic uptrend is accelerating.
We could see some
spectacular
DJI gains soon if the parallel hyperbolic uptrend shown in the DJI chart is
violated to the upside. The NASDAQ
has broken above its year-long upper
channel boundary, as have the SP-500,
NYSE, OEX and
QQQ. Foreign ETFs
are also very strong.
The falling Bond market, Utilities and REITs
reflect the
flight of fixed income investors
into equities with growth prospects
that
can
protect them, they trust, from the increasing
likelihood of Inflation.
These three groups and falling Food Commodities are the
only sectors that have more stocks below their 65-dma than above. This
is now
a very broad advance even though its leaders in the DJI-30 are making the
biggest,
gawdiest advances.
What moves the market these days? More than technological and
scientific
breakthroughs, I would bet on those sectors and stocks that look like they
will soon be the beneficiaries of a lot more Government Spending . This translates
into
BA
and CAT
in the DJI-30.
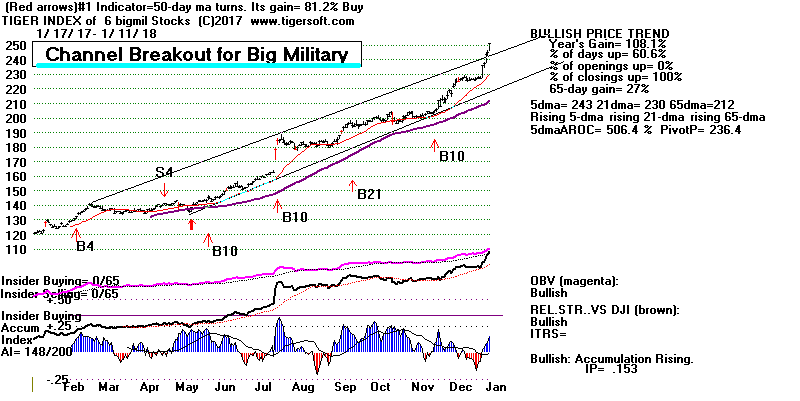
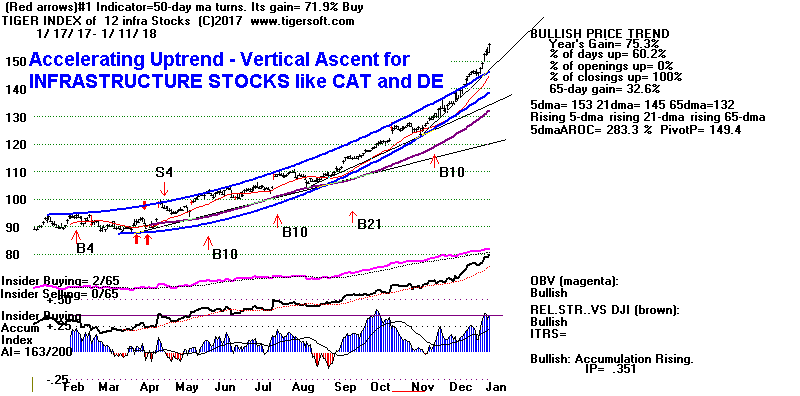

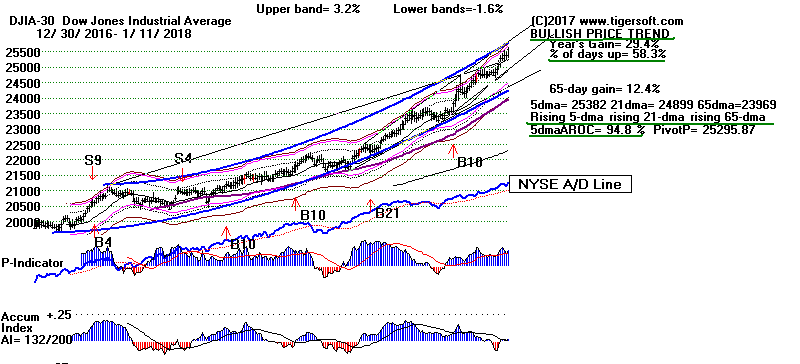

Table
A Is A Weak IP21 A Problem at This Time of
Year with DJI 2.7% over 21-dma
and the
P-I positive?
There were
only 4 year-cases. Trouble only developed when there was a
Sell S12 and/or after
the
V-Indicator fell below its 21-dma and is much closer to 0. In
the other 3 cases, the DJI kept
rising for at
least a month and sometimes much more. Screener:
lama 1.025-1.030
PI >29
PI-change <-20
IP21 .03 to -.03
Only Januaries
-------------------------------------------------------------------------------------
Date DJI LA/MA P-I IP21 V-I
Now 20180111 25574.73 1.027 277 .017 +76
-----------------------------------------------------------------------------------
1 19360113 146.5 1.027 59.5 .025 +44
DJI fell to 21-dma @143.5 0n 1/21 and then rose to 161.9 on 4/6/1936.
---------------------------------------------------------------------------------
2 19800121 872.78 1.029 97.6 .005 +2
3 19800125 876.11 1.025 109.3 -.011 +3
4 19800128 878.5 1.025 123.3 -.004 +3
5 19800130 881.91 1.025 113 .016 +3
DJI rose to 903.84 on 2/13/1980. (S9/S15 Silver bubble). DJI then fell 16% in 5 wks.
---------------------------------------------------------------------------------
6 Sell S12 19830113 1073.95 1.025 147.8 -.008 +7
7 19830114 1080.85 1.028 213 .023 +10
8 19830117 1084.81 1.027 241.2 .023 +11
DJI fell to lower band @1030.17 on 1/24 and then rallied strongly.
---------------------------------------------------------------------------------
9 19910128 2654.46 1.03 80.2 .028 +2
DJI rose to 3004.46 on 4/17/1991.
|
Charts 1/11/2018
PEERLESS
DJI, Signals, Indicators Daily
DJI Volume 10-DayUp/Down Vol
V-Indicator
Hourly DJIA
A/D Line for All
Stocks
NASDAQ
S&P
OEX
NYSE COMPQX
DJI-15 DJI-20
DJI-30
DIA
SPY
QQQ MDY
IWM
TNA
CrudeOil
FAS
GLD
BBH
IBB
JETS
JNUG
KOL
NUGT
OIH
OIL
RSX
RETL
SDS
SLV
SOXL
TECL
TMF
TNA UGA
(gasoline)
XIV
YINN
Commodities:
JJC, NIB,
CHOC
CORN,
WEAT
UUP
(Dollar)
AAPL ADBE
ALXN
AMAT
AMGN AMD
AMZN
BA BABA BAC
BIDU
CAT
CVX
DE
FB
GOOG
GS HD
IBM JPM M
(Macy's)
MSFT NFLX
NVDA
QCOM TSLA
TXN
XOM
WMT
ANDV (refinery),
CMG (Chipotle), LRCX,
SWKS,
TOWN
Also SPPI WATT
SQ (Square)
1/11/2018
Bullish MAXCPs
Bearish
MINCPs |
QuickSilver
Documentation
This is for short-term trading
leveraged ETFs.
It also provides a useful short-term outlook
of these sectors ETF's and the sectors they represewnt
Blue is
Bullish and
Red is Bearish.
1 Candle-Stick color is shortest-term. This
changes when close vis-a-vis opening changes.
So, in stocks or ETFs that advanced a long
ways, traders should sell when a higher
opening gives way to a decline that brings
a drop below the previous day's close.
2 5-dma AROC and Close-versus- pivot point is
next most short-term.
W = warning. Close is below
PIVOT-Point.
3 Closing Power trend-direction vs. its 21-dma
is next most short-term.
4 IP21 is used to spot divergences and to
estimate underlying support.
5 > IP21 falling and below +.15 and its 21-dma
is bearish in an over-extended ETF, especially
when its Closing Power is falling and is
below its 21-dma.
> IP21 below 07 with AROC below .07 is less
likely to bring a rally back up from 21-dma.
6 Note price trend-lines, support/resistance
and price patterns on charts.
QUICKSILVER on ETFS - 01/11/18
ETF      CLOSE   CHANGE     PIVOT-PT  5-dma AROC   CL-PWR   CANDLE  IP21   ITRS
---------------------------------------------------------------------------------------------
DIA       255.61    1.99     252.72        99.1%   Bullish      BLUE   .109    ----
---------------------------------------------------------------------------------------------
COMPQX    7211.78    58.21   7136.56       93.8%   Bullish      BLUE   .18    -.019
---------------------------------------------------------------------------------------------
SPY       276.12    2        273.42        82.4%   Bullish      BLUE   .049    -.02
---------------------------------------------------------------------------------------------
QQQ       163.29    1.11     161.92        92%     Bullish      BLUE   .215    -.018
---------------------------------------------------------------------------------------------
MDY       356.3    5.02      351.52        85.1%   Bullish      BLUE   .014    -.022
---------------------------------------------------------------------------------------------
IWM       157.5    2.66      154.79        97.9%   Bullish      BLUE   .024    -.033
---------------------------------------------------------------------------------------------
FAS       73.33    .83       70.94         239.3%  Bearish      BLUE  -.031     .117
---------------------------------------------------------------------------------------------
RETL      41.17    2.98      38.21         514.6%  Bullish      BLUE   .273     .592
---------------------------------------------------------------------------------------------
SOXL      158      2.75     W162.33       -45.1%   Bullish      BLUE   .279    -.004
---------------------------------------------------------------------------------------------
TECL      125.8    1.81      125.13        182.8%  Bullish      BLUE   .224     .086
---------------------------------------------------------------------------------------------
IBB       111.23    .32      109.83        57.3%   Bullish      ----   .14     -.042
---------------------------------------------------------------------------------------------
GLD       125.44    .41      125.33       -.8%     Bullish      BLUE   .35    -.06
---------------------------------------------------------------------------------------------
OIL       7.05    .03        6.75          182.2%  Bullish      ----   .233     .139
---------------------------------------------------------------------------------------------
OIH       28.99    .71       27.88         206.3%  Bullish      BLUE   .351     .109
---------------------------------------------------------------------------------------------
GASL      30.49    2.07      28.1          267.1%  Bullish      BLUE   .118     .307
---------------------------------------------------------------------------------------------
UGA       32.73    .01       31.93         86.6%   Bullish      ----   .093    -.034
---------------------------------------------------------------------------------------------
UUP       23.96   -.1       *23.96         4.2%    ----         ----  -.084    -.12
---------------------------------------------------------------------------------------------
IEF       104.64    .07     W105.15       -30.5%   Bullish      BLUE   .044    -.11
---------------------------------------------------------------------------------------------
XLU      50.55   -.19       W51.33        -78%     Bearish      RED   -.397    -.177
---------------------------------------------------------------------------------------------
WEAT      6.08   -.03        6.02          8.3%    Bullish      ----   .246    -.126
---------------------------------------------------------------------------------------------
YINN      40.41    .74       39.38         181.1%  Bullish      BLUE   .15     .154
---------------------------------------------------------------------------------------------
RSX       23.14    .3        22.66         112.1%  Bullish      BLUE   .312    -.046
---------------------------------------------------------------------------------------------
AAPL      175.28    .99      175           64.6%   Bullish      BLUE   .085    -.044
---------------------------------------------------------------------------------------------
GOOG      1105.52    2.91    1102.23       86.8%   Bullish      RED    .122    -.009
---------------------------------------------------------------------------------------------
MSFT      88.08    .26      W88.19         55.2%   Bearish      ----   .082    -.046
---------------------------------------------------------------------------------------------
AMZN      1276.68    22.35   1229.14       270.8%  Bullish      BLUE   .288     .054
---------------------------------------------------------------------------------------------
FB        187.77   -.07      186.85        92%     Bullish      RED    .149    -.052
---------------------------------------------------------------------------------------------
NVDA     224.08    .4        215.4         239.1%  Bullish      RED    .148     .004
---------------------------------------------------------------------------------------------
BA        328.12    7.86     308.84        505.8%  Bullish      BLUE   .155     .17
---------------------------------------------------------------------------------------------
GS        255.13    .8      W255.52       -33.4%   Bearish      RED   -.178    -.036
---------------------------------------------------------------------------------------------
HD        194.68    2.88     192.5         108.6%  Bullish      BLUE  -.057     .082
---------------------------------------------------------------------------------------------
CAT        169.2    3.33     161.96        297.7%  Bullish      BLUE   .39     .144
|
Table 2
COMPARISONS OF BULLISH AND BEARISH
GROUPS
1/11 1/10 1/9
1/8 1/5 1/4
1/3 1/2 12/29 12/28 12/27
12/26 12/22 12/21 12/20
12/19 12/18 12/15 12/14 12/13
NEWHIGHS
824 313 516 651
683 610 548 479
166 336 253
308 262 317 247
210 553 309
103 268
NEWLOWS 67 78 76 51 51 61 61 39 32 28
21 26 32
45 50
45 43
49 56
25
-------------------------------------------------------------------------------------------------------------------------------------------------------------------------------------
MAXCPs
239 111
112
154 118
108 113 107
157 86
97 105
70 81
60 60
133 122 53
123
MINCPs
87 146
162 189
92 113 97
108 37
35 74
70 74
81 127 117
76 65
142 67
-------------------------------------------------------------------------------------------------------------------------------------------------------------------------------------
TTTNHs
154
75 92 89 82 84 100 107 70 102
97 103
72 89
65 71
146 118 75 110
TTTNLs
139 240 207 169 162 141 129 193
238 108
93 114 147
121 187 129
90 98
192 99
------------------------------------------------------------------------------------------------------------------------------------------------------------------------------------
FASTUP
188 137 165 297
264 264 199 177 117 166 179
195
222 238
143 172 166 126 123
FASTDOWN
90 99 101 72 52 42 36 35 58 48 56 70 60
63 78 183 96 125 109
|
Table 3
Count of Stocks and New Highs in Key Tiger Directories
Date = 2018.01.11
-------------------------------------------------------------------
INFRA          12            7             58 %
TRANSP         20            11            55 %
BIGMIL         6             3             50 %
INDEXES        195           92            47 %
MORNSTAR       238           111           47 %
DJI-13         13            6             46 %
BIGBANKS       7             3             43 %
ETFS           65            26            40 %
GAMING         28            11            39 %
FINANCE        93            31            33 %
NIFTY          30            10            33 %
RETAIL         53            17            32 %
DOWJONES       30            9             30 %
COAL           10            3             30 %
SP-100         96            28            29 %
INDMATER       90            25            28 %
SP500          485           137           28 %
MILITARY       38            10            26 %
HOMEBLDG       17            4             24 %
RUS-1000       837           193           23 %
CHINA          64            15            23 %
COMODITY       70            16            23 %
AUTO           39            8             21 %
OILGAS         141           27            19 %
NASD-100       100           19            19 %
REGBANKS       33            6             18 %
CHEM           64            11            17 %
COMPUTER       23            4             17 %
GREEN          31            5             16 %
===================================================
FOOD           15            2             13 %
SOFTWARE       66            8             12 %
JETS           9             1             11 %
SOLAR          21            2             10 %
HACKERS        25            2             8 %
SEMI           130           11            8 %
BIOTECH        386           30            8 %
ELECTRON       178           13            7 %
INSURANC       32            2             6 %
GOLD           51            2             4 %
REIT           178           1             1 %
-----------------------------------------------------
None:  EDU  UTILITY  PIPELINE  BEVERAGE  BONDFUND   HOSPITAL
|
 |
Table 4 RANKING OF KEY DIRECTORIES BASED PCT.OF STOCKS ABOVE 65-DMA
1/11/18
Bullish = 41
Bearish = 4
---------------------------------------------------------------------------------------
Directory Current day-1 day-2 day-3 day-4 day-5
----------------------------------------------------------------------------------------
BIGBANKS 1 1 .857 .857 .857 .857
BIGMIL 1 1 1 1 1 1
INFRA 1 1 1 1 1 1
JETS 1 .888 .777 1 1 1
TRANSP 1 .9 .9 1 1 1
AUTO .923 .846 .871 .846 .923 .82
DJI-13 .923 .923 .923 .923 .923 1
ETFS .923 .892 .923 .938 .938 .907
SP-100 .916 .875 .895 .885 .875 .875
FINANCE .913 .86 .774 .741 .731 .698
MORNSTAR .911 .878 .89 .915 .911 .882
COAL .9 .8 .9 .9 .9 .9
DOWJONES .9 .866 .866 .9 .9 .933
GAMING .892 .785 .821 .892 .857 .714
HOMEBLDG .882 .823 .764 .764 .882 .764
HOSPITAL .875 .625 .625 .625 .625 .625
RETAIL .849 .792 .792 .792 .792 .83
REGBANKS .848 .696 .666 .484 .484 .454
INDEXES .841 .841 .851 .81 .805 .841
NASD-100 .83 .81 .87 .84 .82 .77
OILGAS .829 .78 .808 .794 .794 .815
INDMATER .822 .755 .744 .788 .755 .755
MILITARY .815 .763 .763 .71 .763 .736
CHINA .812 .796 .812 .812 .812 .75
SP500 .804 .769 .791 .797 .783 .773
NIFTY .8 .8 .833 .866 .833 .766
GOLD .784 .764 .686 .764 .784 .784
RUS-1000 .771 .728 .752 .759 .749 .739
GREEN .741 .645 .677 .709 .645 .645
COMPUTER .739 .695 .652 .782 .695 .652
CHEM .734 .656 .656 .656 .656 .64
SOFTWARE .727 .666 .712 .727 .712 .681
HACKERS .72 .64 .72 .68 .72 .64
PIPELINE .714 .714 .857 .714 .714 .714
BEVERAGE .7 .75 .8 .7 .75 .75
COMODITY .7 .685 .7 .685 .742 .742
BIOTECH .637 .601 .59 .567 .59 .593
ELECTRON .634 .567 .595 .679 .679 .612
SOLAR .619 .571 .571 .619 .619 .523
SEMI .6 .546 .592 .7 .684 .623
EDU .571 .571 .571 .571 .428 .428
=============================================================================================
INSURANC .5 .468 .437 .437 .5 .562
=============================================================================================
FOOD .2 .266 .333 .266 .4 .466
REIT .179 .134 .129 .23 .202 .213
BONDFUND .171 .207 .252 .369 .333 .387
UTILITY .139 .116 .116 .139 .162 .162
|
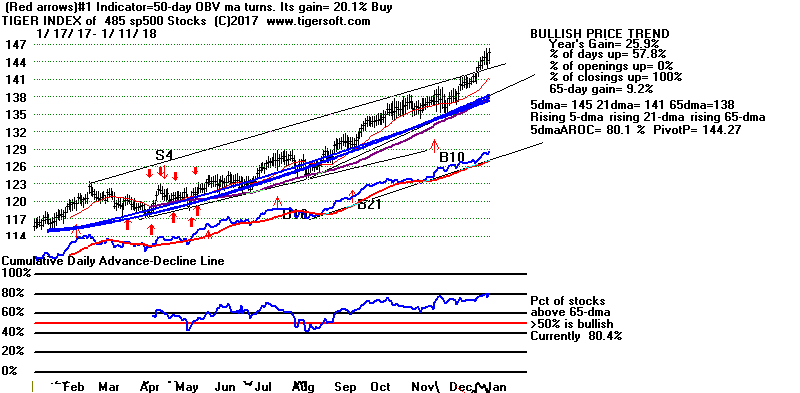 |
==============================================================================|
==============================================================================
1/10/2018 The
September
Buy B21 still operates and predicts
higher prices. Once
again, the market sold off at the opening and then steadily climbed back to
even. This shows Public Selling and Professional Buying. That
has to be
bullishly interpreted. Minor declines are typical of hyperbolic
uptrends until
there has been a violent vertical rise and a buying climax. I checked
the
past record of weak IP21s in January with the DJI 2.0% to 2.5% over
the 21-day ma. There were only 3 past instances of this, but the DJI
kept
rallying in each case for more than TWO months more.
See tonight's Table A below
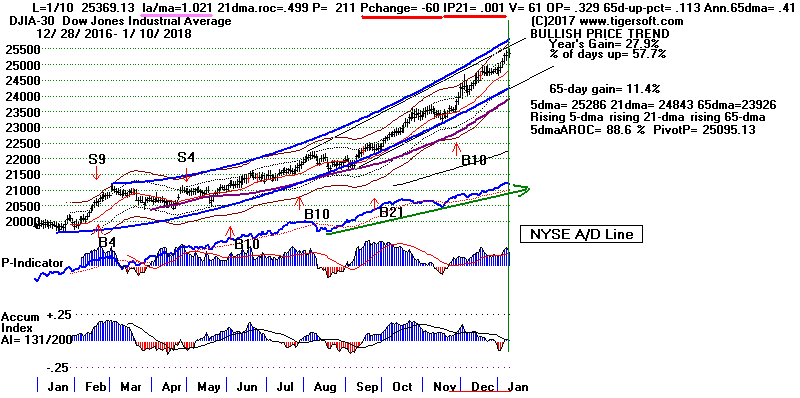
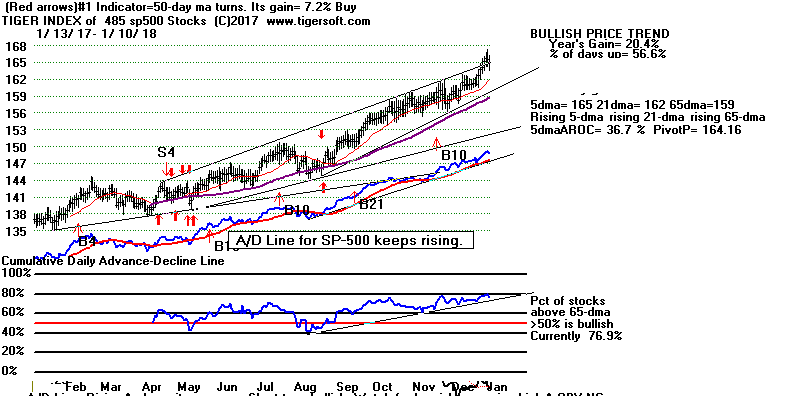
Bonds, Utilities and REITs got still weaker today,
as reports spread that China
may hold back on buy US Treasuries or even become a net Seller. China
has
been a huge buyer of Treasuries for some time. Predictably, the
Chinese
Government said the rumors were "false" Read the article in NY Times
tonight.
https://www.nytimes.com/2018/01/10/business/bond-market-central-bank.html?emc=edit_th_20180111&nl=todaysheadlines&nlid=58223894
True or not, the Chinese could be sending a message to
the Americans that
the size of the US Debt is starting to alarm them and the Trump
Administration
should not go down the path of Protectionism.
On Friday, we learn the latest CPI-Inflation
numbers. These will be the most
important factor, I believe, in the FED's calculations about how fast to
raise
interest rates.
The biggest contributor to the CPI is the Price of
Crude Oil.
The second biggest, or to close to the second, is the level of interest
rates themselves.
With the current 12-month CPI figure at 2.1%, there would still seem to
plenty of room
for the stock market to continue to rally before Inflation pushes the Fed's
to raise rates
so high that they hurt the blue chips in the DJI-30. Until then, some
of the money that
comes out of bonds will surely go into stocks.
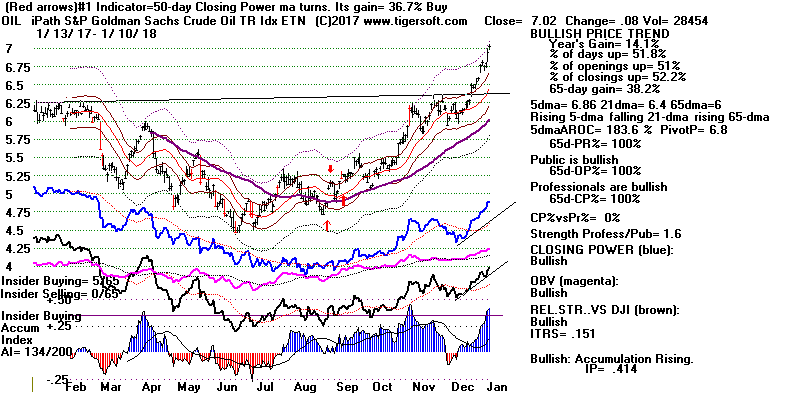
Table
A Is A Weak IP21 A Problem at This Time of
Year with DJI 2.1% over 21-dma
and the
P-I positive but falling on last trading day?
There were
only 3 cases. In both, the DJI kept rising for more than a
month.
 Screener:
 lama    1.02-1.025
         PI >29
         PI-change <-20
         IP21 .03 to -.03
         Only Januaries
             DJI    la/ma  P-I    PI ch. IP21 V-I  OPct  65dUppct 65dAROC
 1 19970109 6625.67 1.024  113.1  -31      0  -13  .311   .108   .39
 Rising to all-time-high.
   DJI rose to 7085.16 on 3/11/97 and then fell below lower band to 6391.89 (149-dma)
   S9V @ 7020.13 on 2/19/1997 (la/ma=1.026 P=94,IP21=.073,VI=-6, OP=-.059
---------------------------------------------------------------------------------
 2 20120105 12415.7 1.023  161.8  -51   -.006 -26  .005   .165   .57
 Rising to all-time-high.
   DJI rose to 13279.32 on 5/1/12 and then fell below lower band to 12101.46 (200-dma)
---------------------------------------------------------------------------------
 3 20120111 12449.45 1.021 275.3  -87   -.019 +8   -.088  .121   .43
 Rising to all-time-high.
   DJI rose to 13279.32 on 5/1/12 and then fell below lower band to 12101.46 (200-dma)
---------------------------------------------------------------------------------
|
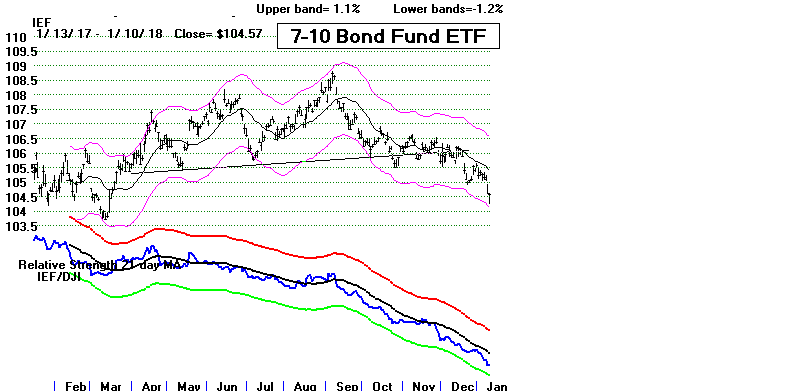
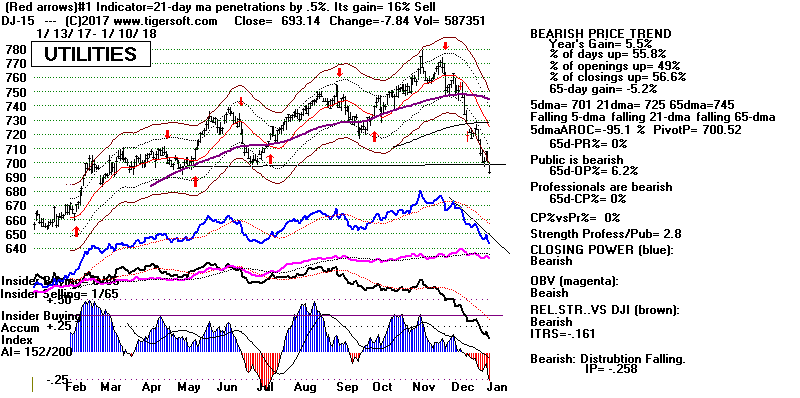
|
Table 1 QUICKSILVER on ETFS - 01/10/18
ETF      CLOSE   CHANGE     PIVOT-PT   5-dma AROC  CL-PWR      CANDLE  IP21    ITRS
---------------------------------------------------------------------------------------------
DIA       253.62   -.2       250.6         92.8%   Bullish      BLUE   .096     ---
---------------------------------------------------------------------------------------------
COMPQX    7153.57   -10.01   7077.91       61.8%   Bullish      BLUE   .164    -.016
---------------------------------------------------------------------------------------------
SPY       274.12   -.42      271.61        66.9%   Bullish      BLUE   .053    -.019
---------------------------------------------------------------------------------------------
QQQ       162.18   -.38      160.31        66.6%   Bullish      BLUE   .213    -.011
---------------------------------------------------------------------------------------------
MDY       351.28   -1.62     350.31        28.6%   ----         RED   -.043    -.032
---------------------------------------------------------------------------------------------
IWM       154.84    .02      154.47        25.2%   Bearish      BLUE  -.053    -.049
---------------------------------------------------------------------------------------------
FAS       72.5    .71        69.92         258.1%  Bearish      BLUE  -.095     .105
---------------------------------------------------------------------------------------------
RETL      38.19    .65       37.26         22.4%   ----         BLUE   .211     .405
---------------------------------------------------------------------------------------------
SOXL      155.25   -5.96    W159.45       -45%     Bullish      RED    .264     0
---------------------------------------------------------------------------------------------
TECL      123.99   -1.39     121.25        193.9%  Bullish      BLUE   .235     .094
---------------------------------------------------------------------------------------------
IBB       110.91    .5       109.97        1.4%    Bullish      BLUE   .094    -.03
---------------------------------------------------------------------------------------------
GLD       125.03    .3      W125.46        8.4%    Bullish      RED    .343    -.049
---------------------------------------------------------------------------------------------
OIL       7.02    .08        6.8           183.6%  Bullish      ----   .415     .151
---------------------------------------------------------------------------------------------
OIH       28.28    .1        27.83         190%    Bullish      ----   .35     .112
---------------------------------------------------------------------------------------------
GASL      28.42   -.56      W28.96         3.5%    Bullish      RED    .105     .251
---------------------------------------------------------------------------------------------
UGA       32.72    .02       32.17         105.6%  Bullish      ----   .149    -.025
---------------------------------------------------------------------------------------------
UUP       24.06   -.06       23.94         8.3%    ----         BLUE  -.068    -.108
---------------------------------------------------------------------------------------------
IEF       104.57   -.03     W105.28       -36.2%   ----         BLUE   .019    -.095
---------------------------------------------------------------------------------------------
XLU      50.74   -.56       W51.35        -100.9%  Bearish      RED   -.334    -.161
---------------------------------------------------------------------------------------------
WEAT      6.11    .05        6.07          16.5%   Bullish      ----   .207    -.113
---------------------------------------------------------------------------------------------
YINN      39.67    .13       38.98         145.2%  Bullish      BLUE   .107     .089
---------------------------------------------------------------------------------------------
RSX       22.84    .09       22.63         166%    Bullish      BLUE   .301    -.044
---------------------------------------------------------------------------------------------
AAPL      174.29   -.04      173.03        59.3%   Bullish      BLUE   .12    -.014
---------------------------------------------------------------------------------------------
GOOG      1102.61   -3.65    1086.4        91.8%   Bullish      BLUE   .119    -.001
---------------------------------------------------------------------------------------------
MSFT      87.82   -.4        87.11         83.9%   Bearish      BLUE   .083    -.035
---------------------------------------------------------------------------------------------
AMZN      1254.33    1.63    1209.59       204%    Bullish      BLUE   .273     .056
---------------------------------------------------------------------------------------------
FB        187.84   -.03      184.33        85%     Bullish      BLUE   .126    -.027
---------------------------------------------------------------------------------------------
NVDA     223.68     1.74     213.59        258.2%  Bullish      BLUE   .201     .025
---------------------------------------------------------------------------------------------
BA        320.26    1.83     296.67        366.5%  Bullish      BLUE   .1      .166
---------------------------------------------------------------------------------------------
GS        254.33    .39     W256.83        20.5%   Bearish      RED   -.202    -.031
---------------------------------------------------------------------------------------------
HD        191.8   -1.3       190.51        72.9%   Bullish      RED   -.082     .063
---------------------------------------------------------------------------------------------
CAT        165.87   -.56     159.44        264.8%  Bullish      ----   .348     .121
|
Table 2
COMPARISONS OF BULLISH AND BEARISH
GROUPS
1/10 1/9 1/8
1/5 1/4 1/3
1/2 12/29 12/28 12/27 12/26 12/22
12/21 12/20 12/19 12/18 12/15 12/14
12/13 12/12
NEWHIGHS
313 516 651 683 610
548 479 166 336 253 308 262 317
247 210 553 309 103 268 223
NEWLOWS 78 76 51 51 61 61 39 32 28
21 26 32
45 50
45 43
49 56
25 52
-------------------------------------------------------------------------------------------------------------------------------------------------------------------------------------
MAXCPs
111
112
154 118
108 113 107 157 86 97
105 70 81 60 60 133 122
53 123 83
MINCPs
146
162 189 92 113 97 108 37 35 74 70 74 81 127 117
76 65 142
67 99
-------------------------------------------------------------------------------------------------------------------------------------------------------------------------------------
TTTNHs
75 92 89 82 84 100 107 70 102 97 103
72 89 65 71
146 118 75 110
72
TTTNLs
240 207 169 162 141 129 193
238 108
93 114 147 121
187 129 90 98 192 99 161
------------------------------------------------------------------------------------------------------------------------------------------------------------------------------------
FASTUP
137 165 297
264 264 199 177 117 166 179
195
222 238
143 172 166 126 123 175 101
FASTDOWN 99 101 72 52 42 36 35 58 48 56 70 60 63 78 183 96 125 109 91
132
|
Table 3
 Count of Stocks and New Highs in Key Tiger Directories
Date = 2018.01.10
               No.          NHs            Pct.
-------------------------------------------------------------------
BIGBANKS       7             4             57 %
BIGMIL         6             3             50 %
NIFTY          30            8             27 %
FINANCE        93            24            26 %
DJI-13         13            3             23 %
MILITARY       38            8             21 %
SP-100         96            17            18 %
GAMING         28            5             18 %
DOWJONES       30            5             17 %
INFRA          12            2             17 %
COMODITY       69            11            16 %
REGBANKS       33            5             15 %
SP500          485           74            15 %
===================================================
MORNSTAR       238           34            14 %
INDEXES        195           25            13 %
HOMEBLDG       17            2             12 %
ETFS           65            8             12 %
RUS-1000       837           92            11 %
CHINA          64            7             11 %
TRANSP         20            2             10 %
COAL           10            1             10 %
NASD-100       100           9             9 %
RETAIL         53            5             9 %
AUTO           40            3             7 %
INDMATER       90            6             7 %
OILGAS         141           9             6 %
BIOTECH        387           23            6 %
INSURANC       32            2             6 %
SOFTWARE       66            3             5 %
BEVERAGE       20            1             5 %
COMPUTER       23            1             4 %
GREEN          31            1             3 %
CHEM           64            2             3 %
SEMI           131           4             3 %
ELECTRON       179           3             2 %
GOLD           51            1             2 %
REIT           178           1             1 %
==================================================
None:  HACKERS  SOLAR  EDU   UTILITY  PIPELINE
FOOD  BONDFUND  HOSPITAL    JETS
|
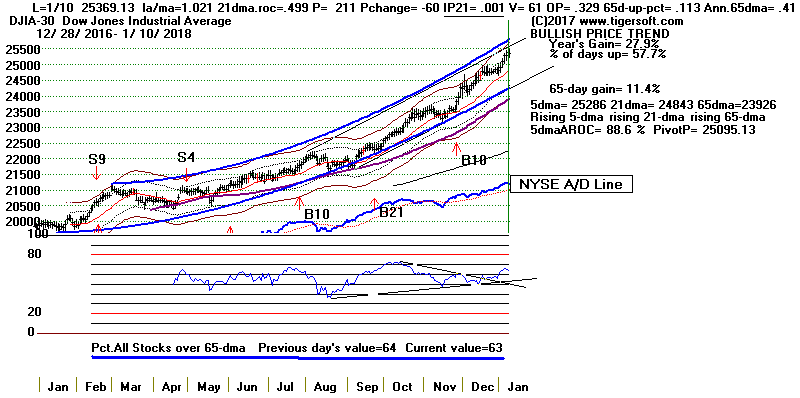 |
Table 4
 RANKING OF KEY DIRECTORIES BASED PCT.OF STOCKS ABOVE 65-DMA
               1/10/18
 Bullish = 41
 Bearish = 5
---------------------------------------------------------------------------------------
Directory     Current       day-1         day-2         day-3         day-4         day-5
----------------------------------------------------------------------------------------
BIGBANKS       1             .857          .857          .857          .857          .857
BIGMIL         1             1             1             1             1             .833
INFRA          1             1             1             1             1             1
DJI-13         .923          .923          .923          .923          1             1
TRANSP         .9            .9            1             1             1             1
ETFS           .892          .923          .938          .938          .907          .815
JETS           .888          .777          1             1             1             1
MORNSTAR       .878          .89           .915          .911          .882          .886
SP-100         .875          .895          .885          .875          .875          .843
DOWJONES       .866          .866          .9            .9            .933          .9
FINANCE        .86           .774          .741          .731          .698          .698
AUTO           .85           .875          .85           .925          .825          .725
INDEXES        .841          .851          .81           .805          .841          .83
HOMEBLDG       .823          .764          .764          .882          .764          .823
NASD-100       .81           .87           .84           .82           .77           .78
COAL           .8            .9            .9            .9            .9            .9
NIFTY          .8            .833          .866          .833          .766          .766
--------------------------------------------------------------------------------------------
CHINA          .796          .812          .812          .812          .75           .765
RETAIL         .792          .792          .792          .792          .83           .886
GAMING         .785          .821          .892          .857          .714          .75
OILGAS         .78           .808          .794          .794          .815          .822
SP500          .769          .791          .797          .783          .771          .773
GOLD           .764          .686          .764          .784          .784          .784
MILITARY       .763          .763          .71           .763          .736          .657
INDMATER       .755          .744          .788          .755          .755          .777
BEVERAGE       .75           .8            .7            .75           .75           .75
RUS-1000       .728          .752          .759          .749          .741          .747
PIPELINE       .714          .857          .714          .714          .714          .714
REGBANKS       .696          .666          .484          .484          .424          .363
COMODITY       .695          .71           .695          .753          .753          .768
COMPUTER       .695          .652          .782          .695          .652          .695
SOFTWARE       .666          .712          .727          .712          .696          .666
CHEM           .656          .656          .656          .656          .656          .656
GREEN          .645          .677          .709          .645          .645          .612
HACKERS        .64           .72           .68           .72           .64           .64
HOSPITAL       .625          .625          .625          .625          .625          .5
BIOTECH        .599          .589          .565          .589          .591          .594
EDU            .571          .571          .571          .428          .428          .428
SOLAR          .571          .571          .619          .619          .523          .428
ELECTRON       .564          .592          .675          .675          .608          .592
SEMI           .541          .587          .694          .679          .618          .603
============================================================================================
INSURANC       .468          .437          .437          .5            .562          .5
FOOD           .266          .333          .266          .4            .466          .533
BONDFUND       .207          .252          .369          .333          .387          .396
REIT           .134          .129          .23           .202          .213          .325
UTILITY        .116          .116          .139          .162          .162          .186
Bearish = 5
|
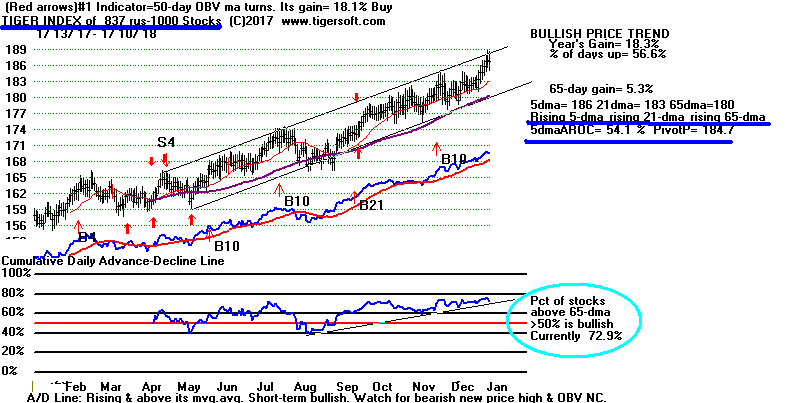 |
| |
==============================================================================
==============================================================================
1/9/2018 The
September
Buy B21 still operates and predicts
higher prices. But today's
market looked quite "sloppy", to use a word showing that there was too much
heavy lifting done by mostly high-priced DJI-30 stocks. Despite the
DJI's 100
point gain, there were 500 more down than up. Not surprisingly,
another early pullback
is shaping up for tomorrow. But without a Peerless Sell, today's "bad
breadth"
is likely only to bring a shallow retreat by the major indexes. Such is the
underlying
support gained from the DJI's hyperbolic rising support line and its
shallow, optimized
1.6% lower band. See also Table 1 below.
The key major market ETFs' 5-day moving
averages and Closing Powers are all still above their 21-day ma.
I suspect that there will be no important market top until Congress passes a
new
Infrastructure Spending Program or, perhaps, fails to despite its need and
popularity.
My studies of past markets also suggest a top will only become likely when
the CPI
(rate of Inflation) surpasses 3.1% or short-term interest rates rise above
3.5%.
Note that big gains made today by all five of the DJI stocks over $190.
These five
accounted for $97 of the $102 point gain made by the DJIA:
BA 318.43 + 8.28,
GS 253.94 + 2.13,
MMM 241.28 + 1.49, UNH
225.88 +1.06 and HD 193.10 +.06.
Gains like this just draw more money to the leading DJI-30 stocks. Big
money, I predict,
will NOT
soon abandon these high priced blue-chips. Nor will it
start selling the hot
Infrastructure stocks before Congress gets a chance to produce its big new
subsidy for
the group. Now John Deere (JD) is getting hot. Tomorrow it may
be CAT again.
I expect Democrats and Republicans in Congress to climb all over each other
in
pushing for
much needed infrastructure Federal aid. This is much needed and should
get
bi-partisan
support.
(See the hyperbolic rise in the TigerSoft
Infrastructure chart further below.)
Short-Term Resistance Is Likely at 25500.
Above that, prices could "go vertical" upwards.
It's not clear where traders can thereafter bunch their sell orders.

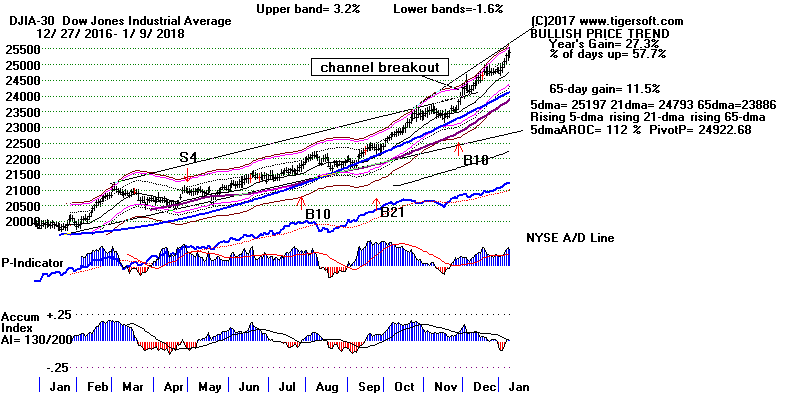
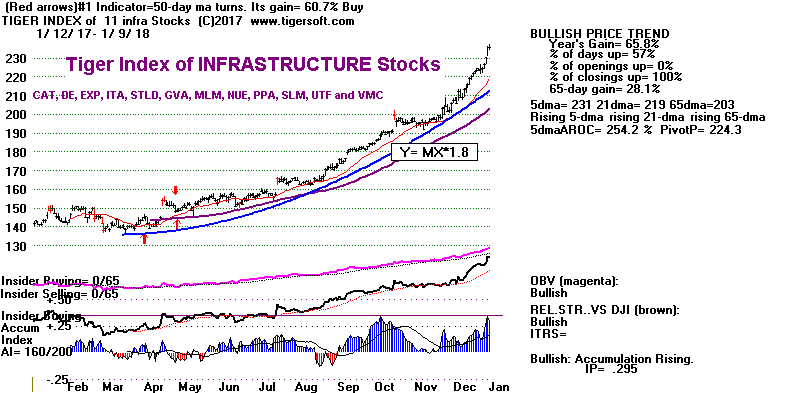
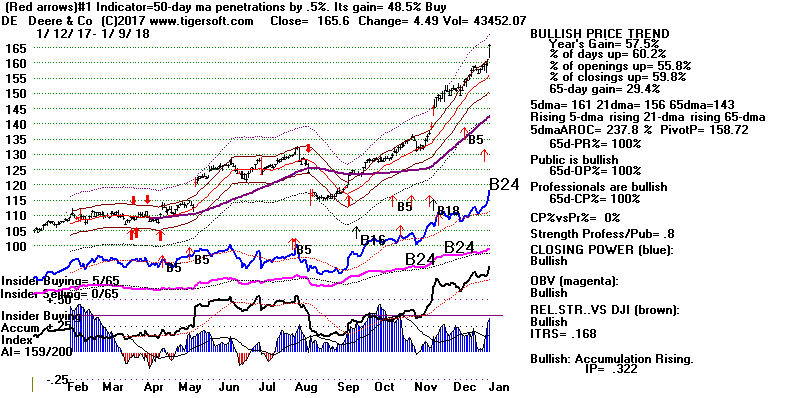
500 More Down than
Up Today on NYSE Warns of Higher Interest Rates
More dangerous than the leading DJI stocks
going up faster and faster is the other story
today that was largely concealed by the DJI's nice-looking gain. This
is the story of
how Interest Rates are definitely on the rise. If you are a cynic like
I am, I think we can
safely bet that insiders at the FED (which remains a privately run bank
despite the
word "Federal") are already starting to shake up big hedge fund managers
about the
risks of holding dividend stocks with advance information about how the Fed
is planning
to raise rates this month or next when Powell takes over as Fed Chairman.
(If you think I exaggerate, Google "SAC, insider trading, youtube"
or listen to
FRONTLINE - "To Catch a Trader 2017"
)
That, at least, is how I would interpret the fact that there were 500 more
down than
up on the NYSE and big declines occurred in Utilities, REITS and Bond Funds.
If a
marginal 12-month new high by short-term rates can cause this much damage to
the
group, how much more hurt will be caused by the FED announcement this month
or next
of another rate hike? Watch the Dollar (UUP).
As Oil prices rise, so must the CPI.
And it is the CPI more than anything else which moves the FED to raise
rates.


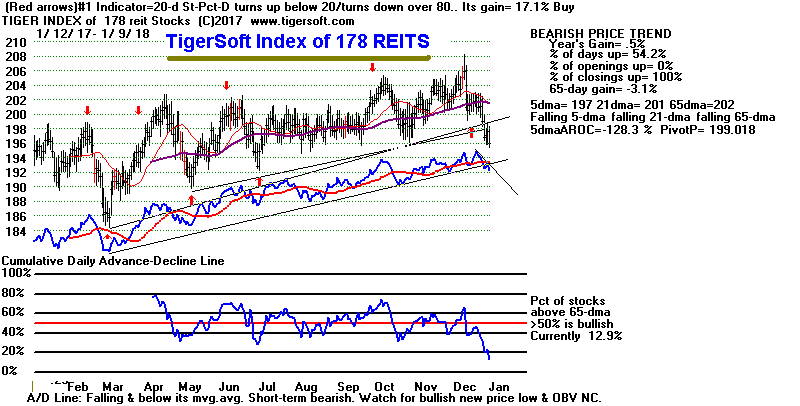
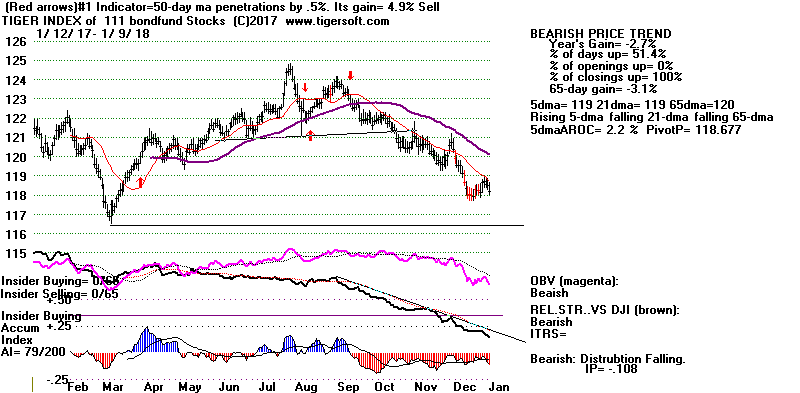
Charts 1/9/2018
PEERLESS
DJI, Signals, Indicators Daily
DJI Volume 10-DayUp/Down Vol
V-Indicator
Hourly DJIA
A/D Line for All
Stocks
NASDAQ
S&P
OEX
NYSE COMPQX
DJI-15 DJI-20
DJI-30
DIA
SPY
QQQ MDY
IWM
TNA
CrudeOil
FAS
GLD
BBH
IBB
JETS
JNUG
KOL
NUGT
OIH
OIL
RSX
RETL
SDS
SLV
SOXL
TECL
TMF
TNA UGA
(gasoline)
XIV
YINN
Commodities:
JJC, NIB,
CHOC
CORN,
WEAT
UUP
(Dollar)
AAPL ADBE
ALXN
AMAT
AMGN AMD
AMZN
BA BABA BAC
BIDU
CAT
CVX
FB
GOOG
GS
HD
IBM JPM M
(Macy's)
MSFT NFLX
NVDA
QCOM TSLA
TXN
XOM
WMT
ANDV (refinery),
CMG (Chipotle), LRCX,
SWKS,
TOWN
New SPPI WATT
SQ (Square)
1/9/2018
Bullish MAXCPs
Bearish
MINCPs |
QUICKSILVER on ETFS - 01/09/18
ETF      CLOSE   CHANGE     PIVOT-PT   5-dma AROC   CL-PWR   CANDLE     IP21   ITRS
---------------------------------------------------------------------------------------------
DIA       253.82    1.23     248.95        115.7%   Bullish      BLUE   .113    -----
---------------------------------------------------------------------------------------------
COMPQX    7163.58    6.19    7065.53       110.5%   Bullish      RED    .089     .007
---------------------------------------------------------------------------------------------
SPY       274.54    .62      270.47        106.2%   Bullish      BLUE   .073    -.011
---------------------------------------------------------------------------------------------
QQQ       162.56    .01      160.03        126.7%   Bullish      RED    .132     .021
---------------------------------------------------------------------------------------------
MDY       352.9   -.55       349.27        59.9%    ----         RED   -.038    -.024
---------------------------------------------------------------------------------------------
IWM       154.82   -.21      154.06        29.8%    Bearish      RED   -.107    -.045
---------------------------------------------------------------------------------------------
FAS       71.79    .74       68.86         276%     Bearish      BLUE  -.087     .094
---------------------------------------------------------------------------------------------
RETL      37.54   -1.23     W38.02        -65.7%    ----         RED    .249     .31
---------------------------------------------------------------------------------------------
SOXL      161.21   -4.77     156.7         376.1%   Bullish      RED    .186     .108
---------------------------------------------------------------------------------------------
TECL      125.38   -1.09     119.2         371.5%   Bullish      RED    .18     .198
---------------------------------------------------------------------------------------------
IBB       110.41    2.04    W110.88        48.8%    Bullish      BLUE   .092    -.03
---------------------------------------------------------------------------------------------
GLD       124.73   -.58     W124.82       -16.8%    Bullish      BLUE   .343    -.049
---------------------------------------------------------------------------------------------
OIL       6.94    .15        6.77          267.1%   Bullish      BLUE   .392     .176
---------------------------------------------------------------------------------------------
OIH       28.18   -.2        27.22         293.8%   Bullish      RED    .366     .121
---------------------------------------------------------------------------------------------
GASL      28.98    .24       28.4          241.5%   Bullish      RED    .123     .411
---------------------------------------------------------------------------------------------
UGA       32.7    .63        32.04         203.6%   Bullish      BLUE   .106    -.017
---------------------------------------------------------------------------------------------
UUP       24.12    .05       24.02         39.6%    Bearish      ----  -.077    -.106
---------------------------------------------------------------------------------------------
IEF       104.6   -.5       W105.33       -29.5%    Bearish      RED   -.018    -.094
---------------------------------------------------------------------------------------------
XLU      51.3   -.51        W51.78        -86.1%    Bearish      RED   -.284    -.148
---------------------------------------------------------------------------------------------
WEAT      6.06    .06       W6.09         -16.5%    Bullish      BLUE   .078    -.133
---------------------------------------------------------------------------------------------
YINN      39.54   -.34       38.53         259.9%   Bullish      RED    .141     .144
---------------------------------------------------------------------------------------------
RSX       22.75   -.07       22.09         257.2%   Bullish      ----   .295    -.041
---------------------------------------------------------------------------------------------
AAPL      174.33   -.02      172.23        59.7%    Bullish      RED    .053     .022
---------------------------------------------------------------------------------------------
GOOG      1106.26   -.68     1082.48       189.5%   Bullish      RED    .095     .052
---------------------------------------------------------------------------------------------
MSFT      88.22   -.06       86.35         130.2%   ----         RED    .097     .035
---------------------------------------------------------------------------------------------
AMZN      1252.7    5.83     1204.2        261.9%   Bullish      RED    .207     .203
---------------------------------------------------------------------------------------------
FB        187.87   -.41      184.67        174.2%   Bullish      RED    .034     .016
---------------------------------------------------------------------------------------------
NVDA     221.94   -.06       212.47        531.4%   Bullish      RED    .108     .049
---------------------------------------------------------------------------------------------
BA        318.43    8.28     297.8         357.4%   Bullish      BLUE   .089     .143
---------------------------------------------------------------------------------------------
GS        253.94    2.13     253.29       -34%      Bearish      BLUE  -.199    -.035
---------------------------------------------------------------------------------------------
HD        193.1    1.06      189.01        133.1%   Bullish      BLUE  -.032     .066
---------------------------------------------------------------------------------------------
CAT        166.43    .4      157.28        292.8%   Bullish      BLUE   .376     .13
|
Table 2
COMPARISONS OF BULLISH AND BEARISH
GROUPS
1/9 1/8 1/5
1/4 1/3 1/2
12/29 12/28 12/27 12/26 12/22 12/21
12/20 12/19 12/18 12/15 12/14
12/13 12/12 12/11
NEWHIGHS
516 651 683 610
548 479 166 336 253 308 262 317
247 210 553 309 103 268 223 234
NEWLOWS 76 51 51 61 61 39 32 28
21 26 32
45 50
45 43
49 56
25 52
41
-------------------------------------------------------------------------------------------------------------------------------------------------------------------------------------
MAXCPs
112
154
118
108 113
107
157 86 97
105 70 81 60 60 133
122
53 123
83 84
MINCPs
162 189 92
113
97 108 37 35 74 70 74
81 127 117
76 65 142
67 99
75
-------------------------------------------------------------------------------------------------------------------------------------------------------------------------------------
TTTNHs
92
89
82 84 100 107 70 102 97 103
72
89 65 71
146 118
75
110
72 73
TTTNLs
207 169 162 141 129 193
238 108
93 114 147 121
187 129 90 98 192 99 161 155
------------------------------------------------------------------------------------------------------------------------------------------------------------------------------------
FASTUP
165
297
264
264 199 177 117 166 179
195
222 238
143 172
166 126 123 175
101 108
FASTDOWN101 72 52 42 36 35 58 48 56 70 60
63 78 183 96 125 109 91
132 134
|
 Table 3

Count of Stocks and New Highs in Key Tiger Directories
       Date = 2018.01.09
               No.          NHs            Pct
-------------------------------------------------------------------
BIGMIL         6             4             67 %
INFRA          12            5             42 %
DJI-13         13            5             38 %
HOMEBLDG       17            6             35 %
TRANSP         20            7             35 %
INDEXES        195           58            30 %
NIFTY          30            8             27 %
MILITARY       38            9             24 %
MORNSTAR       238           55            23 %
FINANCE        93            20            22 %
ETFS           65            14            22 %
SP500          485           105           22 %
SP-100         96            20            21 %
DOWJONES       30            6             20 %
COMODITY       69            14            20 %
CHINA          64            12            19 %
RUS-1000       837           144           17 %
====================================================
BIGBANKS       7             1             14 %
SOFTWARE       66            9             14 %
NASD-100       100           14            14 %
RETAIL         53            7             13 %
REGBANKS       33            4             12 %
INDMATER       90            10            11 %
COAL           10            1             10 %
CHEM           64            6             9 %
INSURANC       32            3             9 %
HACKERS        25            2             8 %
BIOTECH        387           26            7 %
FOOD           15            1             7 %
GREEN          31            2             6 %
ELECTRON       179           11            6 %
SEMI           131           8             6 %
OILGAS         141           9             6 %
AUTO           39            2             5 %
BEVERAGE       20            1             5 %
GAMING         28            1             4 %
COMPUTER       23            1             4 %
GOLD           50            1             2 %
===================================================
None:  SOLAR  REIT  EDU  UTILITY PIPELINE  BONDFUND
HOSPITAL   JETS
|
 |
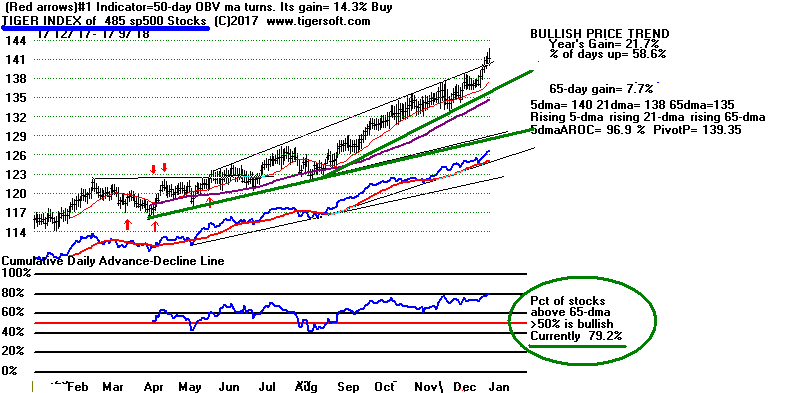 |
Table 5
 RANKING OF KEY DIRECTORIES BASED PCT.OF STOCKS ABOVE 65-DMA
             1/9/18
 Bullish = 41
 Bearish =  5
---------------------------------------------------------------------------------------
Directory     Current       day-1         day-2         day-3         day-4         day-5
----------------------------------------------------------------------------------------
BIGMIL         1             1             1             1             .833          .666
INFRA          1             1             1             1             1             1
DJI-13         .923          .923          .923          1             1             .923
ETFS           .923          .938          .938          .907          .815          .753
COAL           .9            .9            .9            .9            .9            .9
TRANSP         .9            1             1             1             1             1
SP-100         .895          .885          .875          .875          .843          .802
MORNSTAR       .89           .915          .911          .882          .882          .899
AUTO           .871          .846          .923          .82           .717          .615
NASD-100       .87           .84           .82           .77           .77           .72
DOWJONES       .866          .9            .9            .933          .9            .866
BIGBANKS       .857          .857          .857          .857          .857          .857
PIPELINE       .857          .714          .714          .714          .714          .428
INDEXES        .851          .81           .805          .841          .83           .866
NIFTY          .833          .866          .833          .766          .766          .666
GAMING         .821          .892          .857          .714          .75           .714
CHINA          .812          .812          .812          .75           .765          .734
OILGAS         .808          .794          .794          .815          .822          .751
BEVERAGE       .8            .7            .75           .75           .7            .65
RETAIL         .792          .792          .792          .83           .886          .886
SP500          .791          .797          .783          .771          .773          .75
JETS           .777          1             1             1             1             1
FINANCE        .774          .741          .731          .698          .698          .688
HOMEBLDG       .764          .764          .882          .764          .823          .705
MILITARY       .763          .71           .763          .736          .657          .631
RUS-1000       .752          .759          .749          .741          .747          .72
INDMATER       .744          .788          .755          .755          .777          .744
HACKERS        .72           .68           .72           .64           .64           .6
SOFTWARE       .712          .727          .712          .696          .651          .575
COMODITY       .71           .695          .753          .753          .768          .768
GOLD           .68           .76           .78           .78           .78           .82
GREEN          .677          .709          .645          .645          .612          .58
REGBANKS       .666          .484          .484          .424          .363          .424
CHEM           .656          .656          .656          .656          .656          .625
COMPUTER       .652          .782          .695          .652          .695          .565
HOSPITAL       .625          .625          .625          .625          .5            .75
ELECTRON       .592          .675          .675          .608          .592          .513
BIOTECH        .589          .565          .589          .591          .583          .545
SEMI           .587          .694          .679          .618          .595          .511
EDU            .571          .571          .428          .428          .428          .428
SOLAR          .571          .619          .619          .523          .428          .428
N= 41
==============================================================================================
INSURANC       .437          .437          .5            .562          .5            .5
FOOD           .333          .266          .4            .466          .533          .533
BONDFUND       .252          .369          .333          .387          .396          .216
REIT           .129          .23           .202          .213          .325          .365
UTILITY        .116          .139          .162          .162          .209          .255
N= 5
|
==============================================================================
1/8/2018 The
September
Buy B21 still operates and predicts
higher prices. We now
see breakouts by DIA, SPY, NYSE, QQQ and TECL above the top of 6mo and
1 yr. price channels. These indexes are entering the exciting vertical
up-phases
of hyperbolic markets, I believe Note that the DJI's monthly chart
shown just below
going back to 2009 does not yet show this. To me, this suggests there
is a lot more
upside potential. (I purloined this chart tonight from TC-2000 using
the ever-handy
commands Shift + PrintScreen and PaintBrush to save it as a file.).
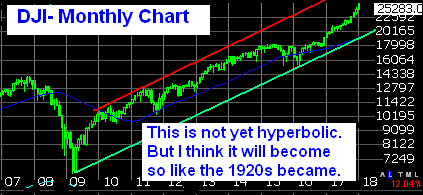
In any case, without a Peerless Sell signal, we have to hold tight the long
positions
we now hold. In addition, I suggest thinking about the logic/the
dynamics of the current
political economy in the context of accelerating inequality and
de-Regulation as they
reinforce what seems to be an inexorable and self-reinforcing drive for
higher and higher
stock prices. See tonight's Table A.
In the 1920s, the DJI rose from 63.90 on August 21st, 1921 to 381.2 on
September 3, 1929. This was an 8 year and two weeks' gain of
496.5%.
In our case, the DJI bottomed of March 9, 2009 at 6547.05. It is now up
286.1% in 8 years and about 10 months. Yes, this an aging bull market,
but
by the standards of Harding and Coolidge, there is much more head-room.
And by the standards of Bill Clinton's 8 years as President applied to the
NASDAQ, we should expect still higher prices for the NASDAQ, too. On
January 20th, 1992 the NASDAQ was at 619.38. Eight years later, by the
time
he left office it closed at 4189.51 and had risen 576.4%. The NASDAQ's
gain since March 9, 2009 is now 464.2%%. On this basis, too, there is
more
upside potential and even more, if we consider that the NASDAQ did not peak
until 6 weeks after Clinton left office and by then it had risen another
20.5%.
The DJI in 1929 topped out just before the Fed raised the Discount Rate to
6.0%
The NASDAQ hit its final high in 2000 a month after Greenpan's FED lifted
rates to 5.25%. (See
http://www.tigersoft.com/Tiger-Blogs/8-18-2003/index.htm )
The rates now are way below this level and CPI measured Inflation is still
one percent
below the levels that have caused problems for the market in the past since
World War II.
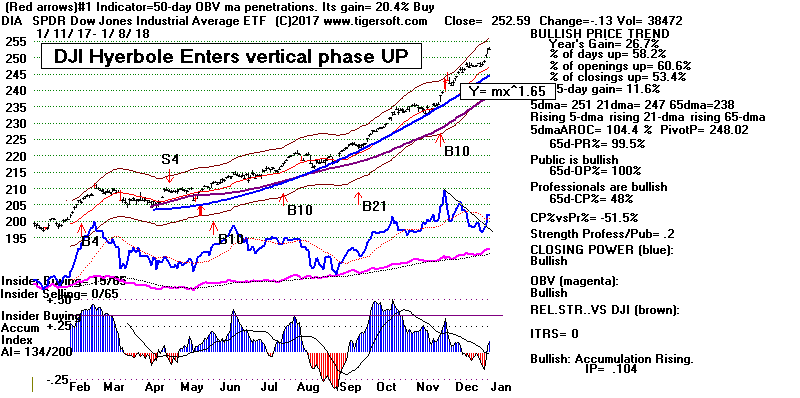
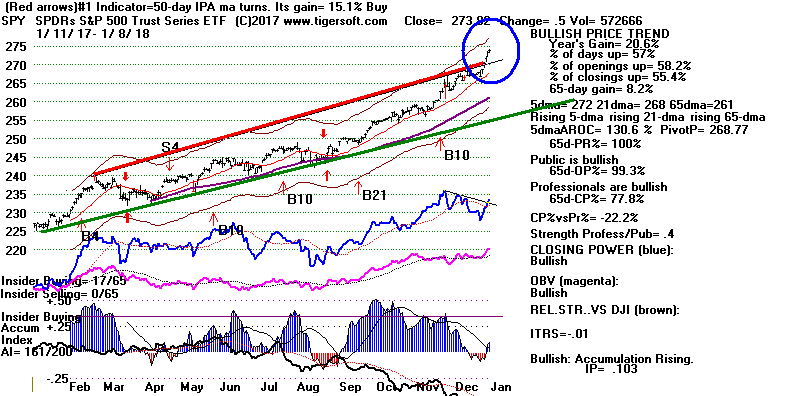
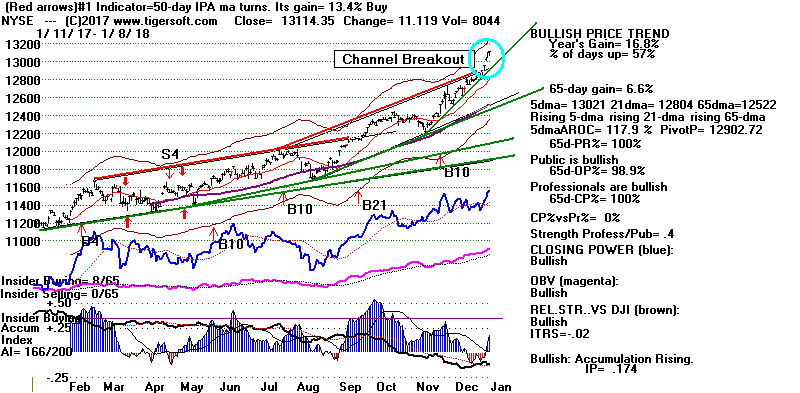
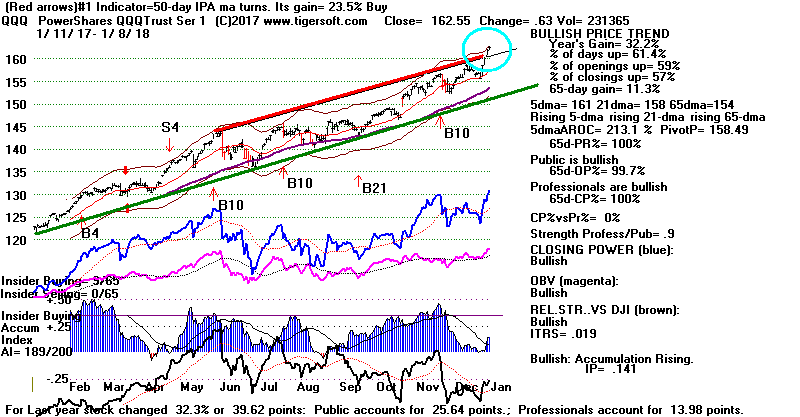
Table A
The Dynamics of Hyperbolic Stock
Markets
The stock market's key indexes, DJIA, NYSE, NASDAQ, SP-500, all now
show channel breakouts. These
are the first signs of a developing hyperbolic curves. Such
trends are not sustainable. But for a while the rally
feeds on itself. It is best game in town. It attracts the
gamblers and the economically hard-pressed. It draws in
the desperate middle class. It also attracts the money of the
super-rich, who are richer than ever now and
cannot keep on buying more homes, boats and cars, so they must buy
Boeing and Caterpillar, etc.
The growing Wealth Inequality is a world-wide phenomenon. The
more wealth is concentrated, the more
political power is acquired by those who want Government not to
regulate markets and allow markets to go to
their logical extreme. As a consequence, the stock market will
go hyperbolic in our era, I believe. In this
environment, Corporations know that they can't just produce more
goods because the average consumer
is running out of money and credit. So, they buy back their own
stock or buy other companies' stocks and
create bigger and bigger trusts, conglomerates and monopolies,
instead. Mutual fund managers who should
know better, can't resist the trend. They are judged by
whether they can match the major indexes'
performances. So, instead of being prudent, they chase the leading
stocks and indexes and up the leading
stocks do, higher and higher until the Bubble is finally pierced.
You might think that the FED might try to
stop this "asset-inflation", but they don't and won't. Such is
their history apart from 1936-1937 and
half-heartedly in 1929. Their Wall Street and political
masters won't let them. So, in my judgment,
the model of the 1920s seems the best parallel. But that was
long ago and no one alive has a personal
memory of the hyperbolic trend then and what drove it higher and higher
until the market collapsed.
I will publish electronically my History of
the US Stock Market, 1915-1932 in a few weeks for those who
want to read more about this topic that I find so timely.
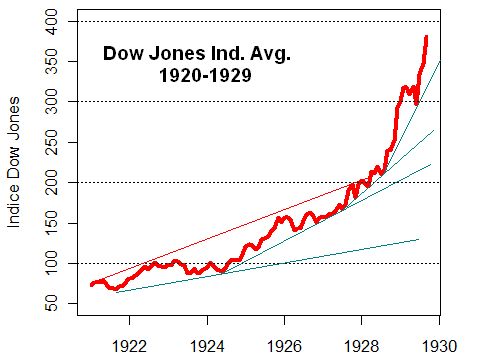
 Other tulip-markets: Google Silver 1975-1980. BitCoin 2012-2018
 |
Table 1
QUICKSILVER on ETFS - 01/08/18
ETF        CLOSE   CHANGE    PIVOT-PT  5-dma AROC   CL-PWR      CANDLE  IP21   ITRS
---------------------------------------------------------------------------------------------
---------------------------------------------------------------------------------------------
DIA       252.59   -.13      248.02        104.4%   Bullish      RED    .105     ----
---------------------------------------------------------------------------------------------
COMPQX    7157.39    20.83   7006.9        180.4%   Bullish      BLUE   .111     .007
---------------------------------------------------------------------------------------------
SPY       273.92    .5       268.77        130.6%   Bullish      BLUE   .103    -.01
---------------------------------------------------------------------------------------------
QQQ       162.55    .63      158.49        213.1%   Bullish      BLUE   .142     .019
---------------------------------------------------------------------------------------------
MDY       353.45    1.93     348.7         115.2%   Bullish      BLUE   .014    -.016
---------------------------------------------------------------------------------------------
IWM       155.03    .24      153.9         83.5%    Bearish      BLUE  -.057    -.039
---------------------------------------------------------------------------------------------
FAS       71.05    .11       67.94         192.9%   Bearish      BLUE  -.05      .097
---------------------------------------------------------------------------------------------
RETL      38.77    .56       38.04         363.9%   Bullish      BLUE   .248     .371
---------------------------------------------------------------------------------------------
SOXL      165.98    3.65     149.27        916.9%   Bullish      BLUE   .252     .167
---------------------------------------------------------------------------------------------
TECL      126.47    1.34     116.34        601.8%   Bullish      BLUE   .243     .225
---------------------------------------------------------------------------------------------
IBB       108.37   -1.46    W109.34        73.2%    ----         RED    .072    -.072
---------------------------------------------------------------------------------------------
GLD       125.31   -.02      125.15        66.5%    Bullish      BLUE   .268    -.051
---------------------------------------------------------------------------------------------
OIL       6.79    .04        6.58          186.9%   Bullish      ----   .379     .167
---------------------------------------------------------------------------------------------
OIH       28.38    .5        26.56         429.8%   Bullish      BLUE   .379     .132
---------------------------------------------------------------------------------------------
GASL      28.74    .64       27.61         604.9%   Bullish      BLUE   .141     .421
---------------------------------------------------------------------------------------------
UGA       32.07    .14       31.4          34.5%    Bullish      BLUE   .116    -.027
---------------------------------------------------------------------------------------------
UUP       24.07    .11       23.93         8.3%     Bearish      ----  -.062    -.095
---------------------------------------------------------------------------------------------
IEF       105.1   -.05      W105.22       -22.3%    ----         RED    .08    -.089
---------------------------------------------------------------------------------------------
XLU      51.81    .48       W52.19        -83.9%    Bearish      BLUE  -.214    -.136
---------------------------------------------------------------------------------------------
WEAT      6   -.02          W6.08          0%       Bullish      ----   .062    -.147
---------------------------------------------------------------------------------------------
YINN      39.88    .5        37.52         777.5%   Bullish      BLUE   .183     .153
---------------------------------------------------------------------------------------------
RSX       22.82    .16       21.6          365.3%   Bullish      BLUE   .287    -.035
---------------------------------------------------------------------------------------------
AAPL      174.35   -.65      172.26        148.5%   Bullish      ----   .025     .031
---------------------------------------------------------------------------------------------
GOOG      1106.94    4.71    1065          281.2%   Bullish      BLUE   .122     .054
---------------------------------------------------------------------------------------------
MSFT      88.28    .09       85.95         158.1%   Bullish      BLUE   .115     .039
---------------------------------------------------------------------------------------------
AMZN      1246.87    17.73   1189.01       322.4%   Bullish      BLUE   .215     .198
---------------------------------------------------------------------------------------------
FB        188.28    1.43     181.42        323.4%   Bullish      BLUE   .095     .02
---------------------------------------------------------------------------------------------
NVDA      222       6.6      199.35        688.9%   Bullish      BLUE   .098     .063
---------------------------------------------------------------------------------------------
BA        310.15    1.31     296.84        254.8%   Bullish      BLUE   .051     .117
---------------------------------------------------------------------------------------------
GS        251.81   -3.71    W255.67       -57.8%    Bearish      RED   -.161    -.042
---------------------------------------------------------------------------------------------
HD        192.04   -.46      188.03        66.1%    Bullish      BLUE  -.017     .073
---------------------------------------------------------------------------------------------
CAT       166.03    4.07     157.04        266.3%   Bullish      BLUE   .409     .13
|
Table 2
COMPARISONS OF BULLISH AND BEARISH
GROUPS
1/8 1/5 1/4
1/3 1/2 12/29 12/28 12/27
12/26 12/22 12/21 12/20 12/19
12/18 12/15 12/14 12/13 12/12
12/11 12/8
NEWHIGHS 651 683 610
548 479 166 336 253 308 262 317
247 210 553 309 103 268 223 234
288
NEWLOWS 51 51 61 61 39 32 28
21 26 32
45 50
45 43
49 56
25 52
41 37
-------------------------------------------------------------------------------------------------------------------------------------------------------------------------------------
MAXCPs
154
118
108 113
107
157 86 97
105 70 81 60 60 133
122
53 123
83 84
90
MINCPs
189 92
113
97 108 37 35 74 70 74
81 127 117
76 65 142
67 99
75 93
-------------------------------------------------------------------------------------------------------------------------------------------------------------------------------------
TTTNHs
89
82 84 100 107 70 102 97 103
72
89 65 71
146 118
75
110
72 73 76
TTTNLs
169 162 141 129 193
238 108
93 114 147 121
187 129 90 98 192 99 161 155 177
------------------------------------------------------------------------------------------------------------------------------------------------------------------------------------
FASTUP
297
264
264 199 177
117 166 179
195
222 238
143 172
166 126 123 175
101 108
96
FASTDOWN 72 52 42 36 35 58 48 56 70 60
63 78 183 96 125 109 91
132 134 169
|
Table 3Count of Stocks and New Highs in Key Tiger Directories
Date = 180108
No. NHs Pct.
-------------------------------------------------------------------
INFRA 11 7 64 %
BIGMIL 6 3 50 %
TRANSP 20 9 45 %
INDEXES 195 78 40 %
ETFS 65 26 40 %
MORNSTAR 238 90 38 %
NIFTY 30 11 37 %
HOMEBLDG 17 6 35 %
DJI-13 13 4 31 %
DOWJONES 30 8 27 %
CHINA 64 17 27 %
SP-100 96 25 26 %
MILITARY 38 9 24 %
HACKERS 25 6 24 %
SOFTWARE 66 15 23 %
SP500 485 110 23 %
INDMATER 90 19 21 %
NASD-100 100 21 21 %
RUS-1000 837 170 20 %
RETAIL 53 9 17 %
=======================================================
CHEM 64 9 14 %
FINANCE 93 13 14 %
OILGAS 141 20 14 %
COMODITY 70 10 14 %
GREEN 31 4 13 %
AUTO 39 5 13 %
COMPUTER 23 3 13 %
GAMING 28 3 11 %
ELECTRON 179 19 11 %
SEMI 131 15 11 %
COAL 10 1 10 %
REGBANKS 33 3 9 %
INSURANC 32 3 9 %
BIOTECH 387 15 4 %
GOLD 50 1 2 %
REIT 178 1 1 %
----------------------------------------------------
None: BIGBANKS SOLAR EDU UTILITY PIPELINE
BEVERAGE FOOD BONDFUND HOSPITAL JETS
|
| |
 |
Table 5
 RANKING OF KEY DIRECTORIES BASED PCT.OF STOCKS ABOVE 65-DMA
               1/8/18
 Bullish = 39
 Bearish = 7
---------------------------------------------------------------------------------------
Directory     Current       day-1         day-2         day-3         day-4         day-5
----------------------------------------------------------------------------------------
BIGMIL         100%          1             1             .833          .666          .833
INFRA          100%          1             1             1             1             1
JETS           100%          1             1             1             1             1
TRANSP         100%          1             1             1             1             .95
ETFS           .938          .938          .907          .815          .738          .63
DJI-13         .923          .923          1             1             1             1
MORNSTAR       .915          .911          .882          .882          .894          .819
COAL           .9            .9            .9            .9            .9            .9
DOWJONES       .9            .9            .933          .9            .9            .9
GAMING         .892          .857          .714          .75           .714          .678
SP-100         .885          .875          .875          .843          .812          .77
NIFTY          .866          .833          .766          .766          .7            .566
BIGBANKS       .857          .857          .857          .857          .857          .857
AUTO           .846          .923          .82           .717          .615          .564
NASD-100       .84           .82           .77           .77           .73           .61
CHINA          .812          .812          .75           .765          .734          .546
INDEXES        .81           .805          .841          .83           .861          .846
--------------------------------------------------------------------------------------------
SP500          .797          .783          .771          .773          .754          .729
OILGAS         .794          .794          .815          .822          .751          .702
RETAIL         .792          .792          .83           .886          .886          .811
INDMATER       .788          .755          .755          .777          .744          .644
COMPUTER       .782          .695          .652          .695          .565          .478
HOMEBLDG       .764          .882          .764          .823          .764          .764
GOLD           .76           .78           .78           .78           .82           .66
RUS-1000       .759          .749          .741          .747          .724          .708
FINANCE        .741          .731          .698          .698          .688          .677
SOFTWARE       .727          .712          .696          .651          .575          .515
PIPELINE       .714          .714          .714          .714          .428          .285
MILITARY       .71           .763          .736          .657          .631          .684
GREEN          .709          .645          .645          .612          .58           .645
BEVERAGE       .7            .75           .75           .7            .7            .6
SEMI           .694          .679          .618          .595          .519          .389
COMODITY       .685          .742          .742          .757          .757          .671
HACKERS        .68           .72           .64           .64           .6            .52
ELECTRON       .675          .675          .608          .592          .525          .418
CHEM           .656          .656          .656          .656          .625          .531
HOSPITAL       .625          .625          .625          .5            .75           .5
SOLAR          .619          .619          .523          .428          .428          .428
EDU            .571          .428          .428          .428          .428          .285
BIOTECH        .565          .589          .591          .583          .54           .459
N=39
---------------------------------------------------------------------------------------------
REGBANKS       .484          .484          .424          .363          .424          .424
INSURANC       .437          .5            .562          .5            .5            .562
BONDFUND       .369          .333          .387          .396          .216          .225
FOOD           .266          .4            .466          .533          .533          .266
REIT           .23           .202          .213          .325          .365          .421
UTILITY        .139          .162          .162          .209          .255          .279
N=7
|
==============================================================================
1/5/2018 The
September
Buy B21 still operates and predicts
higher prices.
We are living in Wall Street's New Utopia.
We should go higher, quite possibly much
higher. Look at how all the key Indexes are not only making new highs
together, but
breaking out above the top of their price channels. We have a "Goldilocks"
financial environment.
Overseas' markets are strong. Inflation is not a problem, yet.
And interest rates are still quite low.
What's more? Now rich people will have a lot more money to invest.
And so will corporations.
And then there's De-Regulation and Privatization, too. The only thing
left would be the
privatization of Social Security. Wall Street wants this, too.
What better way to set the
stage for another crack at the golden eggs of the retirement goose, than a
straight-up stock
market now? Main Street needs to re-discover Wall Street, its boosters
know.
It's true the DJI is now at the 2.5% upper band and the DJI has risen 4
straight
days.
A small retreat should not come as a surprise and will give us a chance to
buy more at better prices. I have to think that the IP21-Accumulation Index turning
positive
is constructive. We appear
to be
in the midst of a January take-off into
all-time high territory. 25500
looks like the last logical place where sell-orders might be
concentrated. So,
give the market more chance to run.
The big
NASDAQ stocks, like
GOOG, remain favored.
In
the DJI-30, I would
think
CAT and MSFT (the DJI's highest AI/200 stock) will do well.
Oil service stocks
should go much higher now that the Trump
Administration has declared it wants to open
up all of America's shore-lines for exploration as well as
Alaska.
Eventually
inflation will become a problem. So, interest rates are bound to rise as the
size of the Federal
deficits gets more and more attention. Stay away from Utilities, REITs
and pure
dividend plays. Gold and Silver will go higher, too, but they are defensive
plays. This is a time when speculative
animal spirits will take over. This will bring bounty
to lesser known biotechs making flat top breakouts. Now is
the time of the year when
high (intense) Accumulation shows
which stocks are having new positions being taken
by institutions. I've tried to put some of the most promising-looking
high IP21
in the MAXCP group tonight. And last but not least, foreign ETFs like JOF
are
gathering exceptional momentum. No fewer than 63% of the foreign ETFs
we
track made 12-month highs on Friday. See Table 3.


I would not worry about the FED yet.
Only when short-term interest rates rose above 3%
in 1957, did the 1950's long bull market fall 19%.
A Sell S9 signal finally stopped the bull market in July 1957.
But before that, in 1954 and 1955, the NYSE A/D Line
and the DJI rose together to one new high after another.
That seems the closest past parallel and model for
us to study. Note that before interest rates rose to 3.5% in
July 1957, the CPI (Inflation's Annual Rate of Change)
had to rise above 3% a few months earlier. Right now,
that number is only 2.2%.
Table A below
shows that it will be difficult to get a Sell S12 signal soon unless the
P-I breadth
and V-I worsens abruptly. Table B shows that until the Inflation's
(CPI)
12-month rate of
change rises above +3.1%, it is unlikely the FED will raise rates to levels
where the
stock market becomes vulnerable.
The
connection between the level of Inflation (CPI) and
interest rates is clear enough.
If the CPI were to jump above the
prevailing interest rates on government
bonds, it would
become very difficult for the government to finance its debt.
Right now, the published 1
2-month rate of change in the newly created
"urban" CPI is rising
at a 2.2% clip. So, on
this basis, too, the market does not look
vulnerable.
Stock market inflation does not count. Not since the
mid-1930s has the FED worried
much about about inflation in stock prices
(asset-bubble). Their 1936-1937 fear about a
stock market
bubble grew out of
their complete failure to protect the country against the
1929 stock
market bubble. Like Generals who re-play the last war, they obsessed
about
about
allowing another stock market bubble and crash.
This active focus on asset-bubbles pretty much ended
after these
concerns led the Fed
to tighten
credit and margin requirements in 1937 with the result
that the stock
market crashed
by more than 40% in 1937 and early 1938. So, though
some Fed members
may talk about
excessive stock market speculation, I would not count on the Fed to
try to arrest it. Of much
more concern is Inflation and also a very weak
Dollar. Right now the
Dollar looks weak, but
this is also what President Trump says he wants to
see. It remains to
be seen if the new Fed Chairman
Powell will take his marching orders from the
President or Wall Street's bond houses and international
banks.
Yes, we have no Sell S12 yet.
No Sell S12 here. The V-I is too high and the LA/MA is
too low. Though based on
negative non-confirmations by the IP21-Accumulation Index,
the code for the Sell S12 looks
at many other key variables besides IP21; the result is that
we must see much lower P-I, V-I
and AROC, or else the DJI will have to get much closer to the
full 3.5% band. I have just
finished going through all the January Sell S12s' key values,
one by one. See them here.
I think you'll see that pattern. I also dummied in
hypothetical numbers and could not easily get
a Sell. The reason the code is this way is that there are
quite a few take-offs in January and
this is the best way I could distinguish the reversals from
the take-offs. As you can see from this
table, much of the time the Sell S12s do not bring immediate
reversals in January.
23 January S12s since 1929
>All but the one in 1930 would have been profitable if DJIA shorted
and then covered on the next Buy signal.
>16 of the 23 would have dropped the DJI by 8% or more at the time
of the next Peerless Buy.
>But only 9 of the 23 would have called the January top perfectly.
If we consider only the post 1965 cases, then only 3 of these 13
would have led to a paper loss of more than 2%, the biggest being
3.3% in January 1981.
> There are lots of S12s that occur with
the DJI's "la/ma" less than 1.035, but they
all have additional low key values other than having a negative
IP21.
----------------------------------------------------------------------
  Date                   DJI       Gain       Subseq.High Paper Loss
19290130      S12        312.6    +.039       322.1       -.0303   2/5
        1.023 .492  -22 -.006  -415  .191  .218  .75
        la/ma   21-AROC  P-I   PI-ch. IP21  V-I    OPct    65pct   65-d
                                                                          Pct change
------------------------------------------------------------------------
19300110      S12        250.00   -.014      253.5        -.014    1/23
Also S9 1.023 -.593 -57  +7    -.047 -547 -.011 -.243 -1.16
------------------------------------------------------------------------
19310105      S12        170.7    +.046      173          -.0134   1/8
        1.016 -.946 -75  +11   -.059 -443  .033 -.180 -.79
------------------------------------------------------------------------
19320108      S12        81.8     +.049      85.9        -.0501   1/15
        1.056 -.721 -76  +30   -.047 -390 -.116 -.156 -.62
------------------------------------------------------------------------
19330106      S12        62.9   +.183(big)   64.4        -.0238   1/10
        1.048  .656  -4   +2   -.002 -55   .205 -.122 -.55
------------------------------------------------------------------------
19330117      S12        61.8   +.168(big)  64.4         -.042    1/10
        1.019 .118  -22   -2   -.110  -92   .065  .001  ???
------------------------------------------------------------------------
19350104      S12       104.7   +.067       107.2       -.0238    2/18
        1.027 .246  +16  -12   -.046  -32   .079  .120  .440
------------------------------------------------------------------------
19380106      S12       128.9   +.044       134.4       -.0426   1/11
Also S9 1.032-.086  -74   +12  -.104  -224 -.017 -.163 -.75
------------------------------------------------------------------------
19380114      S12       131.8   +.065       none         0
        1.039 .564  +13   -11 -.015   -89  .030  -.051 -.22
------------------------------------------------------------------------
19410103      S12       132     +.092(big)  133.6       -.0121   1/3
H/S     1.012 .11   -1    +16 -.049   -44  .299  .001   ?
------------------------------------------------------------------------
19410110      S12       133.6   +.103(big)   perfect      0
H/S     1.02  .20   +45   +11 -.068   +7   .472 -.002  -.01
------------------------------------------------------------------------
19420107      S12       113.1   +.134(big)  none         0
H/S     1.034-.291  -59   -11  .022 -249  -.147 -.097  -.41
------------------------------------------------------------------------
19490106      S12       180.2   +.083       181.3       -.0061   1/7
        1.020 .263   -6   +45 -.016 -101   .104  .001   ?
------------------------------------------------------------------------
19490124      S12       180.8   +.086(big)  none
        1.011 .300   +64  -4  +.047 -10    .206 -.028   -.12
------------------------------------------------------------------------
19600105      S12       685.5   +.107(big)  none
        1.018 .400   +4   +6  -.038 -170   .099  .085    .31
------------------------------------------------------------------------------
19660106      S12       985.46  +.213(big)   994.2      -.0088   1/18
        1.021 .443   +37  +4  -.010  +6    .392  .051    .19
------------------------------------------------------------------------------
19680108      S12       908.92  +.086(big)   perfect     0
        1.020 .222   +68 +21  -.019  +6    .170 -.017   -.07
------------------------------------------------------------------------------
19700102      S12       809.7   +.056        811.31     -.0019   1/05
Also S9 1.027 .271   -15 +72  -.034  -1    .090  .005    .02
------------------------------------------------------------------------------
19730111      S12      1051.7   +.108 (big)  none
Also S9 1.024 .215   -96 +9    .002  -2    .059  .117    .42
------------------------------------------------------------------------------
19740102      S12       855.32  +.040        880.23     -.0291   1/4
        1.038 .292   -86 +38  -.008  -2   -.076 -.103   -.43
------------------------------------------------------------------------------
19810102      S12       972.78  +.042        1004.69    -.0328   1/6
        1.03 -.02    -29 +50  -.039  -4    .091  .055    .20
------------------------------------------------------------------------------
19820129      S12       871.1   +.069        none        0
        1.02 -.028   -87 +26   .005  -5    .050  .039    .140
------------------------------------------------------------------------------
19830106      S12      1070.92  +.038        1092.35    -.02     1/10
        1.022 .152   +34 +28  -.035  -1   -.162  .044    .16
------------------------------------------------------------------------------
19840105      S12      1282.24 +.108(big)   1286.22    -.0031   1/9
        1.022 .152   +34 +28  -.035  -1   -.162  .044    .16
------------------------------------------------------------------------------
20000111      S12      11511.08 +.13(big)   11722.9     -.0184   1/14
S4,S15  1.017 .301   -30 -57  -.060 -68    .249  .080    .30
------------------------------------------------------------------------------
20010104      S12      10912.41 +.129(big)   10983.6    -.0065   2/1
        1.020 .392   +347 +12 -.007 -36    .094  .019    .07
------------------------------------------------------------------------------
20030106      S12      8773.57  +.137(big)  8842.62     -.0078   1/14
        1.031 -.05   +184 +83  +.034 -67   -.065    .131  +.46
------------------------------------------------------------------------------
20090106      S12      9015.1   +.087(big)   none         0
Also S4 1.037  .878  +562 +155 +.028 97    -.006   -.141  -.65
------------------------------------------------------------------------------
|
Table B Market
Tops When CPI 12-Mo Rate of Change Rises to/above 3.1%
(Red shows 3.1% or higher rate of change)
When CPI rises
to or above 3.1%, the DJI was most often either at a top, near a top or
a bear market
had started. This took place on 12 different occasions since 1944.
Only
three times
in the Greenspan era between 1993 and 1996 did a rise of the CPI to 3.1%
fail to bring
a significant market top.
Date
CPI DJI's Subsequent Movement
---------------------------------------------------------------------
April 1946
.033 Peak - May 29, 1946. DJI then fell 24%.
October 1950 .037
Peak - Nov. 24, 1946. DJI fell only to the
lower band. Korean War.
February 1957 .037
Peak - July 12, 1957. DJI then fell 19%.
August 1966 .034
on going bear market. Peak - September 15, 1966. DJI
then fell 9%
January 1968 .036
Peak - January 8, 1968. DJI then fell 9%.
October 1972 .034
Peak - January 11, 1973. 23-month bear market began.
November 1983 .032 Peak - January
9, 1984. DJI then fell 15.5%.
April 1987
.037 Peak - August 15, 1987. DJI
then fell 37%.
March 1992 .031
Peak - June 1, 1992. DJI then fell 8%.
January 1993 .032
DJI kept rallying.
May 1995
.031 DJI kept rallying.
November 1996 .032
DJI kept rallying until March 11, 1997.
DJI then fell 10%.
February 2000 .032
Peak - April 11, 2000. Long bear market began.
April 2004
.034 Peak - June 23, 2004. DJI then fell
7%.
March 2005 .031
Peak - March 7, 2005. DJI then fell 8.5%.
October 2007 .035
Peak - October 9, 2007. Long bear market began.
April 2011
.031 Peak - May 2, 2010. DJI then
fell 17%.
Jan Feb Mar Apr
May June July Aug Sept
Oct Nov Dec For year
1944
.029 .029 .011 .005 0
.005 .017 .023 .017 .017 .017
.022 .017
1945
.022 .022 .022 .017 .022
.028 .022 .022 .022 .022 .022
.022 .022
1946
.022 .016 .028 .033 .033
.033 .093 .116 .127 .149 .176
.181 .083
1947
.181 .187 .196 .19
.183 .176 .121 .113 .127 .105
.084 .088 .143
1948
.102 .093 .068 .086 .091
.095 .099 .088 .065 .06
.047 .029 .08
1949
.012 .012 .017 .004 -.005 -.009 -.029
-.029 -.025 -.029 -.017 -.021 -.013
1950 -.021
-.013 -.009 -.013 -.005 -.005 .016 .021
.02 .037 .037 .059
.012
1951
.08 .093 .093 .093 .092
.088 .074 .065 .069 .065
.068 .059 .078
1952
.043 .023 .019 .023 .019
.023 .03 .03
.022
.019 .011 .007 .019
1953 .003 .007
.011 .007 .011 .011 .003 .007
.007 .011 .007 .007 .007
1954
.011 .015 .011 .007 .007
.003 .003 0 -.004
-.008 -.004 -.008 .007
1955 -.008
-.008 -.008 -.004 -.008 -.008 -.004 -.004 .003
.003 .003 .003 -.004
1956 .003
.003 .003 .007 .011 .018 .022
.018 .018 .022 .022 .029
.014
1957 .029
.033 .037 .037 .037 .033 .032
.036 .032 .029
.032 .028
.033
1958
.036
.032 .035 .035 .032 .028 .024
.021 .021 .021 .021 .017
.028
1959 .013
.01 .003 .003 .003 .006
.006 .01 .013 .017
.013 .017 .006
1960 .01
.017 .017 .017 .017 .017 .013
.013 .01 .013 .013
.013 .017
1961 .017
.013 .013 .01 .01
.006 .013 .01 .013
.006 .006 .006 .01
1962 .006
.01 .01 .013 .013
.013 .01 .013 .013
.013 .013 .013 .01
1963 .013
.009 .013 .009 .009 .013 .013
.013 .009 .013 .013 .016
.013
1964 .016
.016 .013 .013 .013 .013 .013
.009 .013 .009 .012 .009
.013
1965 .009
.009 .012 .016 .016 .019 .016
.019 .016 .019 .016 .019
.016
1966 .019
.025 .025 .028 .028 .025 .028
.034 .034 .037 .037 .034
.028
1967
.034
.028 .028 .024 .027 .027 .027
.024 .027 .024 .027 .03
.03
1968 .036
.039 .039 .039 .039 .042 .044
.044 .044 .047 .047 .047
.041
1969
.043
.046 .052 .055 .055 .054 .054
.057 .056 .056 .059 .061
.054
1970 .061
.061 .058 .06 .06
.06 .059 .054 .056
.056 .056 .055 .057
1971
.052
.049 .047 .041 .044 .046 .043
.046 .04 .038 .032
.032 .043
1972 .032
.035 .034 .034 .032 .027 .029
.029 .031 .034
.036 .034 .032
1973
.036
.038 .045 .05 .055 .059
.057 .073 .073 .078 .082
.087 .062
1974
.093
.100 .103 .100 .107 .108 .115
.108 .119 .120 .122 .123
.110
1975
.118
.112 .102 .102 .094 .093
.097 .085 .079 .074 .073
.069 .091
- 1976 .067 .062 .06 .06 .062
.059 .053 .057 .054 .054
.048 .048
1977 .052 .059 .064 .069 .067 .068
.068 .066 .065 .063 .067
.067
1978 .068 .064 .065 .064 .069 .074
.077 .078 .083 .089 .088
.099
- 1979 .092 .098 .100 .104 .108 .108
.112 .118 .121 .120
.126 .132 rose
every month.
1980 .139 .141 .147 .147
.144
.143 .131
.128 .126 .127 .126 .125
1981
.118 .114 .104 .099 .097 .095
.107 .108 .109 .101
.095 .089
1982
.083 .076 .067 .065 .066 .070
.064 .058 .05 .051
.045 .038
1983
.037 .034 .035 .038 .035
.025 .024 .025 .028 .028
.032 .037
1984
.041 .045 .048 .045 .042
.042 .042 .042 .042
.042 .040 .039
1985 .035 .035 .037 .036 .037
.037 .035 .033 .031
.032 .035 .037
1986
.038 .031 .022 .015 .014 .017 .015 .015 .017 .014 .012
.01
1987 .014 .021 .03
.037 .038 .036 .039
.042 .043 .045 .045 .044
1988 .04 .039 .039 .039 .038 .039 .041
.04 .041 .042 .042
.044
1989 .046 .048 .049 .051
.053 .051 .049 .047
.043 .044 .046 .046
1990 .052 .052 .052 .047
.043 .046 .048 .056
.061 .062 .062 .061
1991 .056 .053 .048 .048
.049 .046 .044 .037
.033 .029 .029
.03
1992 .026 .028 .031
.031 .03
.03 .031
.031 .029 .032
.030 .029
1993 .032 .032 .03
.032 .032 .029 .027 .027
.026 .027 .026 .027
1994 .025 .025 .025 .023
.022 .024 .027 .029
.029 .026 .026 .026 .025
1995 .028 .028 .028 .03
.031 .03
.027 .026 .025 .028 .026
.025 .028
1996 .027 .026 .028 .028
.028 .027 .029 .028
.03 .029 .032
.033 .029
1997 .03 .03 .027
.024 .022 .022 .022
.022 .021 .02 .018
.017 .022
1998 .015 .014 .013 .014
.016 .016 .016 .016
.014 .014 .015 .016 .015
1999 .016 .016 .017 .022
.02 .019 .021
.022 .026 .025 .026 .026
.022
2000 .027 .032 .037
.03 .031
.037 .036 .034 .034 .034
.034 .033 .033
2001 .037
.035 .029 .032 .036 .032
.027 .027 .026 .021
.018 .015 .028
2002 .011 .011 .014 .016
.011 .010 .014 .018
.015 .020 .021 .023 .015
2003 .025 .029 .03
.022 .02 .021 .021
.021 .023 .020 .017 .018
.022
2004 .019 .016 .017 .022
.03 .032
.029 .026 .025
.031 .035 .032 .026
2005 .029 .03
.031 .035
.028 .025 .031
.036 .046 .043
.034 .034 .033
2006 .039
.035 .033 .035 .041 .043
.041 .038 .020 .013
.019 .025 .032
2007 .020
.024 .027 .025 .026 .026
.023 .019 .027 .035
.043 .04 .028
2008 .042 .04
.039 .039 .041 .050
.056 .053 .049 .036 .01
.00 .038
2009 .000
.002-.004 -.008-.013 -.015 -.021
-.015-.013 -.002 .018 .027 -.004
2010 .026 .021 .023 .022
.020 .010 .012 .011
.011 .011 .011 .014 .016
2011 .016 .021 .026 .031
.035 .035 .036 .037
.038 .035 .033 .029
.031
2012 .029
.028 .026 .023 .017 .016
.014 .016 .019 .021 .017
.017 .02
2013 .015 .019 .014 .01
.013 .017 .019 .015
.011 .009 .012 .015 .014
2014 .015 .011 .015 .019
.021 .020 .019 .016
.016 .016 .013 .007 .016
2015 -.001 -.001 -.001 -.002 -.001 .001
.001 .001 -.001 .001 .005 .007
.001
2016 .013 .01 .008
.011 .01 .010 .008
.01 .014 .016 .016 .02
.012
2017 .025 .028 .024 .022
.019 .016 .017 .019
.022 .020 .022 not released.
(2017 data is
CP-All Urban Consumers from Dept. of Labor
https://data.bls.gov/pdq/SurveyOutputServlet )
|
Table 1
QUICKSILVER on ETFS - 01/05/18
ETF      CLOSE   CHANGE     PIVOT-PT   5-dma AROC   CL-PWR      CANDLE  IP21   ITRS
---------------------------------------------------------------------------------------------
DIA       252.72    2.12     247.38         92.3%   Bullish      BLUE   .057   ----
---------------------------------------------------------------------------------------------
COMPQX    7136.56  58.65    6903.39        133.1%   Bullish      BLUE   .098     .003
---------------------------------------------------------------------------------------------
SPY       273.42    1.81     266.86        103.1%   Bullish      BLUE   .081    -.013
---------------------------------------------------------------------------------------------
QQQ       161.92    1.61     155.76        164%     Bullish      BLUE   .144     .015
---------------------------------------------------------------------------------------------
MDY       351.52    1.21     345.41        61.2%    ----         BLUE  -.067    -.023
---------------------------------------------------------------------------------------------
IWM       154.79    .32      152.46        34.5%    Bearish      RED   -.112    -.041
---------------------------------------------------------------------------------------------
FAS       70.94    1.02      68.38         122%     Bearish      BLUE  -.082     .088
---------------------------------------------------------------------------------------------
RETL      38.21    .95       36.04         178.5%   Bullish      BLUE   .198     .326
---------------------------------------------------------------------------------------------
SOXL      162.33    2.88     137.9         676.4%   Bullish      BLUE   .279     .097
---------------------------------------------------------------------------------------------
TECL      125.13    3.88     112.17        470.3%   Bullish      BLUE   .249     .198
---------------------------------------------------------------------------------------------
IBB       109.83   -.14      106.77        93.6%    Bullish      RED    .102    -.065
---------------------------------------------------------------------------------------------
GLD       125.33   -.13      123.65        99.7%    Bullish      BLUE   .227    -.046
---------------------------------------------------------------------------------------------
OIL       6.75   -.05        6.54          188.3%   Bullish      ----   .277     .158
---------------------------------------------------------------------------------------------
OIH       27.88    .05       26.05         368.7%   Bullish      BLUE   .314     .113
---------------------------------------------------------------------------------------------
GASL      28.1   -.86        25.39         355.3%   Bullish      RED    .039     .334
---------------------------------------------------------------------------------------------
UGA       31.93   -.24       31.85        -11%      ----         ----   .056    -.02
---------------------------------------------------------------------------------------------
UUP       23.96    .02      W24.03        -35.4%    Bearish      ----  -.088    -.098
---------------------------------------------------------------------------------------------
IEF       105.15   -.13     W105.57       -11.9%    Bullish      RED    .065    -.085
---------------------------------------------------------------------------------------------
XLU      51.33   -.02       W52.68        -126.6%   Bearish      RED   -.242    -.144
---------------------------------------------------------------------------------------------
WEAT      6.02   -.05        6             16.5%    ----         ----   .05    -.144
---------------------------------------------------------------------------------------------
YINN      39.38    .4        34.02         764.3%   Bullish      BLUE   .226     .149
---------------------------------------------------------------------------------------------
RSX       22.66    .03       21.21         338%     Bullish      BLUE   .228    -.051
---------------------------------------------------------------------------------------------
AAPL      175    1.97        169.23        114.2%   Bullish      BLUE   .063     .035
---------------------------------------------------------------------------------------------
GOOG      1102.23    15.83   1046.4        253.8%   Bullish      BLUE   .138     .057
---------------------------------------------------------------------------------------------
MSFT      88.19    1.08      85.54         143.4%   Bullish      BLUE   .127     .04
---------------------------------------------------------------------------------------------
AMZN      1229.14    19.55   1169.47       180.6%   Bullish      BLUE   .221     .181
---------------------------------------------------------------------------------------------
FB        186.85    2.52     176.46        246.7%   Bullish      BLUE   .11     .009
---------------------------------------------------------------------------------------------
NVDA     215.4    1.81       193.5         442.8%   Bullish      BLUE   .129     .005
---------------------------------------------------------------------------------------------
BA        308.84    12.17    294.91        210.6%   Bullish      BLUE   .035     .082
---------------------------------------------------------------------------------------------
GS        255.52   -1.31     254.76       -19.2%    Bearish      RED   -.132    -.035
---------------------------------------------------------------------------------------------
HD        192.5    1.99      189.53        71.8%    Bullish      BLUE   .018     .081
---------------------------------------------------------------------------------------------
CAT       161.96   2.52      157.58        112.1%   Bullish      BLUE   .366     .093
|
Table 2 COMPARISONS OF BULLISH AND
BEARISH GROUPS
1/5 1/4 1/3
1/2 12/29 12/28 12/27 12/26 12/22
12/21 12/20 12/19 12/18 12/15 12/14
12/13 12/12 12/11 12/8 12/7
NEWHIGHS 683 610
548 479 166 336 253 308 262 317
247 210 553 309 103 268 223 234
288 159
NEWLOWS 51 61 61 39 32 28
21 26 32
45 50
45 43
49 56
25 52
41 37
50
-------------------------------------------------------------------------------------------------------------------------------------------------------------------------------------
MAXCPs
118 108 113
107
157 86 97
105 70 81 60 60 133
122
53 123
83 84
90 90
MINCPs
92 113
97 108 37 35 74 70 74
81 127 117
76 65 142
67 99
75 93
73
-------------------------------------------------------------------------------------------------------------------------------------------------------------------------------------
TTTNHs
82 84 100 107 70 102 97 103
72
89 65 71
146 118
75
110
72 73 76 75
TTTNLs
162 141 129 193
238 108
93 114 147 121
187 129 90 98 192 99 161 155 177 109
------------------------------------------------------------------------------------------------------------------------------------------------------------------------------------
FASTUP
264
264 199 177
117 166 179
195
222 238
143 172
166 126 123 175
101 108
96
80
FASTDOWN 52 42 36 35 58 48 56 70 60
63 78 183 96 125 109 91
132 134 169 195 |
Table 3
Count of Stocks and New Highs in Key Tiger Directories
Date = 2018.01.05
              No             NHs
-------------------------------------------------------------------
ETFS           65            41            63 %  very high
INFRA          11            6             55 %
BIGMIL         6             3             50 %
INDEXES        195           88            45 %
MORNSTAR       238           99            42 %
DJI-13         13            5             38 %
DOWJONES       30            11            37 %
HOMEBLDG       17            6             35 %
SP-100         96            33            34 %
NIFTY          30            10            33 %
CHINA          64            19            30 %
BIGBANKS       7             2             29 %
CHEM           64            16            25 %
INDMATER       91            23            25 %
SP500          485           113           23 %
NASD-100       100           22            22 %
JETS           9             2             22 %
AUTO           39            8             21 %
MILITARY       38            8             21 %
TRANSP         20            4             20 %
FINANCE        93            18            19 %
RUS-1000       837           156           19 %
RETAIL         53            8             15 %
====================================================
SOFTWARE       66            9             14 %
OILGAS         142           19            13 %
INSURANC       32            4             13 %
COMPUTER       23            3             13 %
FOOD           15            2             13 %
GAMING         28            3             11 %
GREEN          31            3             10 %
COAL           10            1             10 %
REGBANKS       33            3             9 %
HACKERS        25            2             8 %
ELECTRON       179           12            7 %
COMODITY       70            5             7 %
BIOTECH        389           25            6 %
SEMI           131           7             5 %
SOLAR          21            1             5 %
GOLD           50            1             2 %
BONDFUND       111           1             1 %
====================================================
None: REIT  EDU UTILITY  PIPELINE BEVERAGE  HOSPITAL
|
Table 4
 RANKING OF KEY DIRECTORIES BASED PCT.OF STOCKS ABOVE 65-DMA
               1/5/18
 Bullish = 39
 Bearish = 6
---------------------------------------------------------------------------------------
Directory     Current       day-1         day-2         day-3         day-4         day-5
----------------------------------------------------------------------------------------
BIGMIL         100%          1             .833          .666          .833          .833
INFRA          1             1             1             1             1             1
JETS           1             1             1             1             1             1
TRANSP         1             1             1             1             .95           .95
ETFS           .938          .907          .815          .738          .63           .584
AUTO           .923          .82           .717          .615          .564          .615
DJI-13         .923          1             1             1             1             1
MORNSTAR       .911          .882          .882          .894          .819          .848
COAL           .9            .9            .9            .9            .9            .6
DOWJONES       .9            .933          .9            .9            .9            .9
HOMEBLDG       .882          .764          .823          .764          .764          .764
SP-100         .875          .875          .843          .812          .77           .802
BIGBANKS       .857          .857          .857          .857          .857          .857
GAMING         .857          .714          .75           .714          .678          .678
NIFTY          .833          .766          .766          .7            .566          .666
NASD-100       .82           .77           .77           .73           .61           .67
CHINA          .812          .75           .765          .734          .578          .531
INDEXES        .805          .841          .83           .861          .846          .825
OILGAS         .795          .816          .823          .753          .704          .69
RETAIL         .792          .83           .886          .886          .811          .849
SP500          .783          .771          .773          .754          .727          .75
GOLD           .78           .78           .78           .82           .66           .68
MILITARY       .763          .736          .657          .631          .684          .684
INDMATER       .758          .758          .78           .747          .648          .604
BEVERAGE       .75           .75           .7            .7            .65           .7
RUS-1000       .749          .741          .747          .724          .704          .733
COMODITY       .742          .742          .757          .757          .685          .685
FINANCE        .731          .698          .698          .688          .677          .72
HACKERS        .72           .64           .64           .6            .52           .56
PIPELINE       .714          .714          .714          .428          .285          .285
SOFTWARE       .712          .696          .651          .575          .515          .575
COMPUTER       .695          .652          .695          .565          .478          .478
SEMI           .679          .618          .595          .519          .389          .419
ELECTRON       .675          .608          .592          .525          .418          .463
CHEM           .656          .656          .656          .625          .531          .609
GREEN          .645          .645          .612          .58           .645          .612
HOSPITAL       .625          .625          .5            .75           .5            .5
SOLAR          .619          .523          .428          .428          .428          .38
BIOTECH        .588          .591          .583          .539          .462          .498
INSURANC       .5            .562          .5            .5            .562          .562
============================================================================================
REGBANKS       .484          .424          .363          .424          .424          .575
EDU            .428          .428          .428          .428          .285          .428
FOOD           .4            .466          .533          .533          .333          .333
BONDFUND       .333          .387          .396          .216          .216          .189
REIT           .202          .213          .325          .365          .421          .477
UTILITY        .162          .162          .209          .255          .279          .232
N=6
|
| |
==============================================================================
1/4/2018 The
September
Buy B21 still operates and predicts
higher prices. Almost
all industry groups and sectors funds are rising except dividend plays like
REITs and
Utilities. When all the key indexes are simultaneously making new
all-time highs, it
is very difficult for the bears to concentrate enough sell orders to stop
the bull market.
They are trying. Yahoo regularly gives space to bearish forecasters
who have been
wrong for a long time. And our Tiger Accumulation Index for the DJI is
still negative.
But Peerless refuses to give a Sell signal and remains steadfastly bullish.
Keep in mind
that most September
Buy B21s do not bring a meaningful
reversal until after January.
Over-night orders keep pushing the markets higher and subsequent sell-offs
are minimal.
We will need to see new evidence to not just trust this bullish momentum.
Wall Street has
gotten from Trump and Congress nearly everything it could realistically wish
for. In return, a
bull market is expected and needed now to boost the "real" economy. I
don't think Wall Street
will fail to produce its part of the bargain, at least not for a while and
probably not until
interest rates go over 3%. Too much is at stake for Wall Street to
fail to deliver.
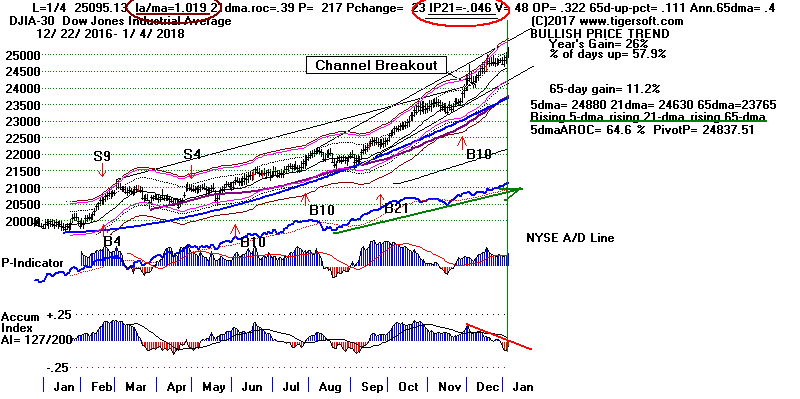
The DJI is not close enough to the 3.5% band
to produce
a Sell S12 with the key values we now have.
It is possible to get a Sell S12 signal (IP21 negative and the DJI at the
upper 3.5% band)
but shy of that level, it will be difficult. Should we get a Sell S12,
the odds of it producing
a significant decline are very good. There have been 23 January S12s
since 1929. All but
the one in 1930 would have been profitable if the DJIA was shorted and then
covered on
the next Buy signal. 16 of the 23 January S12s
would have dropped the DJI by 8% or more
at the time of the next Peerless Buy. But only 9 of the 23 would have called
the January top
perfectly. If we consider only the post-1965
cases, then only 3 of these 13 would have led to
a paper loss of more than 2%, the biggest being 3.3% in January 1981. I will
post this study
over the weekend so that you can compare the key values in these signals
with the present
ones. Right now, it will be difficult for Peerless to give a Sell S12
tomorrow. In addition,
I expect the Accumulation Index to turn positive next week if the DJI keeps
moving up
the way it has this week.
In Table 1, you can see the favored (blue) groups are
TECL (techs) and the
oil sector.
Utilities and the
Dollar remain in bearish (red) category. There is little reason to
believe
that these trends will continue. The big tax cut is inflationary.
Not surprisingly foreign
ETFs for China,
Russia and Asian and European small caps are now on the rise. See
below that SMH (semi-conductors) and CH (Chile) show particularly high
levels of IP21
(current Accumulation) among the top power-ranked sector ETFs and foreign
ETFs.
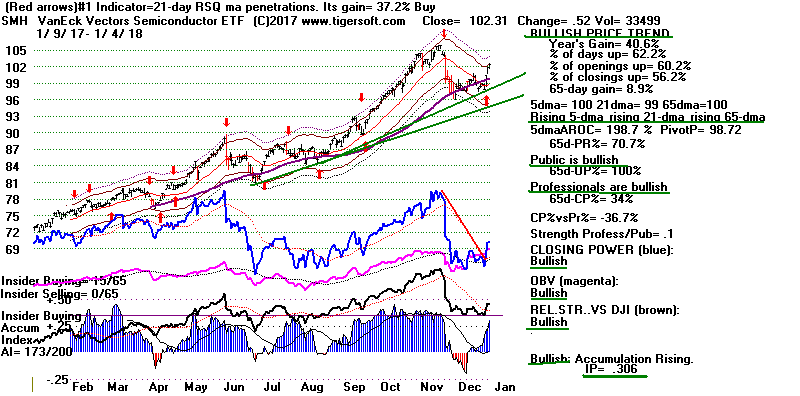 |
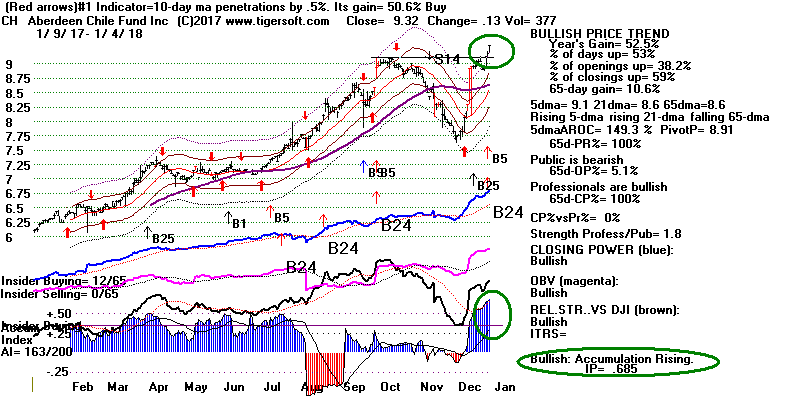 |
Charts 1/4/2018
PEERLESS
DJI, Signals, Indicators Daily
DJI Volume 10-DayUp/Down Vol
V-Indicator
Hourly DJIA
A/D Line for All
Stocks
NASDAQ
S&P
OEX
NYSE COMPQX
DJI-15 DJI-20
DJI-30
DIA
SPY
QQQ MDY
IWM
TNA
CrudeOil
FAS
GLD
BBH
IBB
JETS
JNUG
KOL
NUGT
OIH
OIL
RSX
RETL
SDS
SLV
SOXL
TECL
TMF
TNA UGA
(gasoline)
XIV
YINN
Commodities:
JJC, NIB,
CHOC
CORN,
WEAT
UUP
(Dollar)
AAPL ADBE
ALXN
AMAT
AMGN AMD
AMZN
BA BABA BAC
BIDU
CAT
CVX
FB
GOOG
GS
HD
IBM JPM M
(Macy's)
MSFT NFLX
NVDA
QCOM TSLA
TXN
XOM
WMT
ANDV (refinery),
CMG (Chipotle), LRCX,
SWKS,
TOWN
New SPPI WATT
SQ (Square)
1/4/2018
Bullish MAXCPs
Bearish
MINCPs |
Table 1
QUICKSILVER on ETFS - 01/04/18
ETF      CLOSE   CHANGE     PIVOT-PT      5-dma AROC   CL-PWR      CANDLE  IP21   ITRS
---------------------------------------------------------------------------------------------
DIA       250.6    1.65      248.13        62.9%       Bearish      BLUE  -.036     0
---------------------------------------------------------------------------------------------
COMPQX    7077.91    12.38   6950.16       99.4%       Bullish      RED    .008    -.003
---------------------------------------------------------------------------------------------
SPY       271.61    1.14     267.87        80%         ----         BLUE   .002    -.017
---------------------------------------------------------------------------------------------
QQQ       160.31    .28      156.73        119.7%      Bullish      RED    .075     .008
---------------------------------------------------------------------------------------------
MDY       350.31    1.04     347.26        62.3%       Bearish      RED   -.14    -.021
---------------------------------------------------------------------------------------------
IWM       154.47    .41      153.73        43.7%       Bearish      RED   -.199    -.039
---------------------------------------------------------------------------------------------
FAS       69.92    1.06      69.26         111.6%      Bearish      BLUE  -.188     .087
---------------------------------------------------------------------------------------------
RETL      37.26   -.76       36.88         39%         Bearish      RED    .118     .304
---------------------------------------------------------------------------------------------
SOXL      159.45    2.75     142.16        625.3%      Bullish      RED    .234     .101
---------------------------------------------------------------------------------------------
TECL      121.25    2.05     114.16        325.7%      Bullish      BLUE   .176     .169
---------------------------------------------------------------------------------------------
IBB       109.97   -.91      107.79        109.7%      Bullish      RED    .055    -.07
---------------------------------------------------------------------------------------------
GLD       125.46    .64      122.85        130.5%      Bullish      BLUE   .235    -.047
---------------------------------------------------------------------------------------------
OIL       6.8       .03      6.5           258.8%      Bullish      ----   .264     .184
---------------------------------------------------------------------------------------------
OIH       27.83    .61       25.91         337.7%      Bullish      BLUE   .235     .113
---------------------------------------------------------------------------------------------
GASL      28.96    .56       26.16         682.9%      Bullish      BLUE   .019     .36
---------------------------------------------------------------------------------------------
UGA       32.17    .13       32            37.7%       ----         BLUE   .064     .016
---------------------------------------------------------------------------------------------
UUP       23.94   -.08      W24.13        -54%         Bearish      ----  -.073    -.095
Dollar
---------------------------------------------------------------------------------------------
IEF       105.28   -.05     W105.4        -11.9%       Bullish      BLUE   .11     -.085
---------------------------------------------------------------------------------------------
XLU       51.35   -.43      W52.65        -96.5%       Bearish      RED   -.276    -.142
Utilities
---------------------------------------------------------------------------------------------
WEAT      6.07    -.02       6.0           74.6%       ----         ----   .083    -.132
---------------------------------------------------------------------------------------------
YINN      38.98    .45       33.79         820.5%      Bullish      RED    .159     .138
---------------------------------------------------------------------------------------------
RSX       22.63    .54       21.19         333.2%      Bullish      BLUE   .188    -.047
---------------------------------------------------------------------------------------------
AAPL      173.03    .8       171.08        71%         Bullish      BLUE   .022     .031
---------------------------------------------------------------------------------------------
GOOG      1086.4    3.92     1048.14       175%        Bullish      RED    .107     .045
---------------------------------------------------------------------------------------------
MSFT      87.11    .76       85.72         81.5%       ----         BLUE   .083     .028
---------------------------------------------------------------------------------------------
AMZN      1209.59    5.39    1186.1        115.2%      Bullish      BLUE   .154     .175
---------------------------------------------------------------------------------------------
FB        184.33   -.34      177.92        186.8%      Bullish      RED    .08     -.001
---------------------------------------------------------------------------------------------
NVDA     213.59    1.12      197.4         410.5%      Bullish      RED    .114     .009
---------------------------------------------------------------------------------------------
BA        296.67   -1.13     296.35        17.7%       Bearish      RED   -.076     .054
---------------------------------------------------------------------------------------------
GS        256.83    3.54     256.5         17.2%       Bearish      BLUE  -.156    -.016
---------------------------------------------------------------------------------------------
HD        190.51    1.5      189.78        8.5%        ----         BLUE  -.054     .079
---------------------------------------------------------------------------------------------
CAT        159.44    2.16    158.42        60.9%       Bullish      BLUE   .287     .134
|
Table 2 COMPARISONS OF BULLISH AND
BEARISH GROUPS
1/4 1/3 1/2
12/29 12/28 12/27 12/26 12/22 12/21
12/20 12/19 12/18 12/15 12/14
12/13 12/12 12/11 12/8 12/7 12/6
NEWHIGHS 610
548 479 166 336 253 308 262 317
247 210 553 309 103 268 223 234
288 159 91
NEWLOWS 61 61 39 32 28
21 26 32
45 50
45 43
49 56
25 52
41 37
50 65
-------------------------------------------------------------------------------------------------------------------------------------------------------------------------------------
MAXCPs 108 113
107
157 86 97
105 70 81 60 60 133
122
53 123
83 84
90 90 50
MINCPs
113
97 108 37 35 74 70 74
81 127 117
76 65 142
67 99
75 93
73 141
-------------------------------------------------------------------------------------------------------------------------------------------------------------------------------------
TTTNHs 84 100 107 70 102 97 103
72
89 65 71
146 118
75
110
72 73 76 75 46
TTTNLs 141 129 193
238 108
93 114 147 121
187 129 90 98 192 99 161 155 177 109 219
------------------------------------------------------------------------------------------------------------------------------------------------------------------------------------
FASTUP
264 199 177
117 166 179
195
222 238
143 172
166 126 123 175
101 108
96
80
79
FASTDOWN 42 36 35 58 48 56 70 60
63 78 183 96 125 109 91 132 134 169 195 233 |
Table 3Count of Stocks and New Highs in Key Tiger Directories
Date = 2018.01.04
-------------------------------------------------------------------
ETFS 65 34 52 %
INFRA 11 5 45 %
BIGBANKS 7 3 43 %
INDEXES 195 83 43 %
BIGMIL 6 2 33 %
MORNSTAR 238 78 33 %
DOWJONES 30 8 27 %
SP-100 96 25 26 %
DJI-13 13 3 23 %
NIFTY 30 7 23 %
COMODITY 70 16 23 %
INDMATER 91 20 22 %
FINANCE 93 19 20 %
CHINA 64 13 20 %
TRANSP 20 4 20 %
SP500 486 86 18 %
CHEM 64 10 16 %
AUTO 39 6 15 %
OILGAS 141 21 15 %
NASD-100 100 15 15 %
======================================================
RUS-1000 838 116 14 %
GREEN 31 4 13 %
FOOD 15 2 13 %
MILITARY 38 4 11 %
RETAIL 53 6 11 %
JETS 9 1 11 %
SOFTWARE 66 6 9 %
HACKERS 25 2 8 %
GOLD 50 4 8 %
REGBANKS 33 2 6 %
HOMEBLDG 17 1 6 %
BIOTECH 391 22 6 %
ELECTRON 179 7 4 %
SEMI 131 5 4 %
COMPUTER 23 1 4 %
INSURANC 32 1 3 %
BONDFUND 111 1 1 %
===============================================
None: GAMING SOLAR COAL REIT EDU UTILITY
PIPELINE BEVERAGE HOSPITAL
|
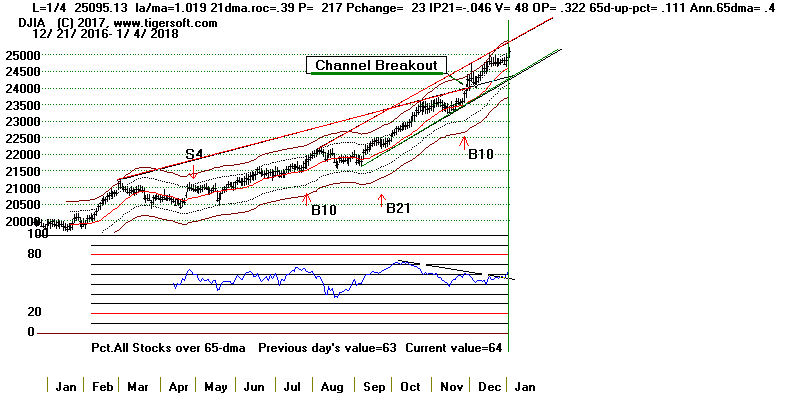 |
Table 4
 RANKING OF KEY DIRECTORIES BASED PCT.OF STOCKS ABOVE 65-DMA
              1/4/18
 Bullish = 40
 Bearish = 6
---------------------------------------------------------------------------------------
Directory     Current       day-1         day-2         day-3         day-4         day-5
----------------------------------------------------------------------------------------
BIGMIL         1             .833          .666          .833          .833          .833
DJI-13         1             1             1             1             1             1
INFRA          1             1             1             1             1             1
JETS           1             1             1             1             1             1
TRANSP         1             1             1             .95           .95           1
DOWJONES       .933          .9            .9            .9            .9            .933
ETFS           .907          .815          .738          .63           .6            .569
COAL           .9            .9            .9            .9            .6            .6
MORNSTAR       .882          .882          .894          .819          .848          .848
SP-100         .875          .843          .812          .77           .791          .822
BIGBANKS       .857          .857          .857          .857          .857          .857
INDEXES        .841          .83           .861          .846          .825          .83
RETAIL         .83           .886          .886          .811          .83           .811
AUTO           .82           .717          .615          .564          .615          .538
OILGAS         .815          .822          .751          .702          .687          .652
N=15
==========================================================================================
GOLD           .78           .78           .82           .66           .68           .7
SP500          .771          .773          .755          .728          .748          .734
NASD-100       .77           .77           .73           .61           .67           .63
NIFTY          .766          .766          .7            .566          .666          .6
HOMEBLDG       .764          .823          .764          .764          .764          .764
INDMATER       .758          .78           .747          .648          .604          .615
BEVERAGE       .75           .7            .7            .65           .7            .75
CHINA          .75           .765          .734          .578          .546          .484
COMODITY       .742          .757          .757          .685          .685          .585
RUS-1000       .742          .748          .724          .705          .732          .714
MILITARY       .736          .657          .631          .684          .684          .684
GAMING         .714          .75           .714          .678          .678          .642
PIPELINE       .714          .714          .428          .285          .285          .142
FINANCE        .698          .698          .688          .677          .72           .709
SOFTWARE       .696          .651          .575          .515          .56           .575
CHEM           .656          .656          .625          .531          .609          .562
COMPUTER       .652          .695          .565          .478          .478          .521
GREEN          .645          .612          .58           .645          .612          .58
HACKERS        .64           .64           .6            .52           .56           .6
HOSPITAL       .625          .5            .75           .5            .5            .5
SEMI           .618          .595          .519          .389          .419          .396
ELECTRON       .608          .592          .525          .418          .469          .446
BIOTECH        .59           .583          .539          .462          .491          .485
INSURANC       .562          .5            .5            .562          .562          .562
SOLAR          .523          .428          .428          .428          .38           .428
N=25
=============================================================================================
FOOD           .466          .533          .533          .333          .333          .266
EDU            .428          .428          .428          .285          .428          .571
REGBANKS       .424          .363          .424          .424          .575          .515
BONDFUND       .387          .396          .216          .216          .189          .198
REIT           .213          .325          .365          .421          .471          .46
UTILITY        .162          .209          .255          .279          .232          .209
N=46
|
| |
| |
| |
==============================================================================
1/3/2018 The
September
Buy B21 still operates and predicts
higher prices. The
advances today in leading techs,
semi-conductors, the NASDAQ and QQQ are
encouraging.
This
shows continuing confidence in Growth stocks. More military spending,
smarter robotics
and lower taxes, especially on repatriated earnings, seem to more than
offset any profit-taking.
We should also see them historically as a favored
group when Inflation Fears begin to worry
investors.
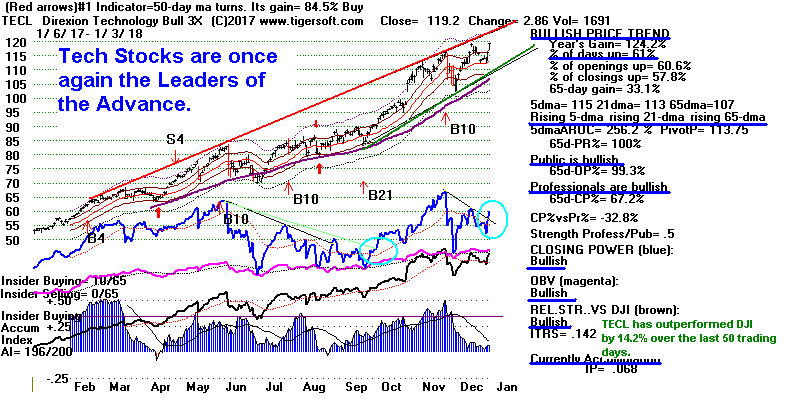
Oppositely, the continuing weakness in the Dollar,
Banks and Utilities
reflects a
widening belief that Inflation
must surely make a return this year given the huge
cuts in Federal taxes. As a result, the fall in
Utilities shows no sign of relenting and
Gold, Silver,
Oil and commodities, generally, remain favored.
Utilities have
under-performed the DJI by even more than TECL (3x tech stocks) have
outperformed it.
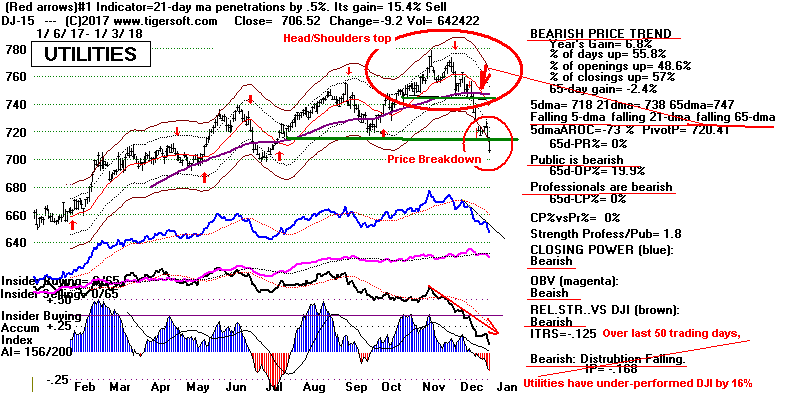
Impressively, the leading Indexes are all simultaneously advancing into
all-time high territory.
This is very unusual. Such congruence is ordinarily bullish. See
the charts of
DJI,
SP-500,
NASDAQ,
NYSE
and the OEX.
Negative IP21s Are Not
Consistent with January Take-Offs.
A new January take-off is clearly being attempted. It is worth looking
back at earlier January
"take-offs" to be reminded of the upside-potential this presents. But
when do this and also
look at the internals and key values, we find that nearly all
successful
January take-offs showed
much higher IP21 readings than the -.09
we now see on the DJIA. Moreover, when the IP21 was
below -.01, the success-rate fell for these attempted January takeoffs.
When the IP21 was
below -.01, there were 3 January declines in 5 cases and one February peak
before a decline
to the lower band. This means we
should still be looking for a January top and must
watch the uptrends of the Closing Powers, as was suggested last night.
Early Jan.DJI High
P-I IP21
---------------------------------------------
1/4/1943
+61 +.145
1/3/1945
+94 +.245
1/3/1955
+137 +.131
1/2/1959
+47 +.05
1/4/1963
+30 +.03
1/8/1964
+33 -.003
No pullback
1/12/1971
+235 +.109
1/2/1975
-72 +.017
This was at end of long bear market
1/5/1976
+201 +.148
1
1/6/1983
+36
-.092 A
few days later, DJI advanced to upper
band where S12 appeared. Then fell to lower band.
1/7/1986
+164 +.035
1/5/1986
-88
+.094
No pullback
1/5/1989
+87 +.076
1/3/1992
+206 +.156
1/8/1997
+143
-.001
No top until 3/11/1997
1/6/1999
+80 +.065
Peak on 1/8/99. DJI fell to lower band.
2
1/9/2006
+376 -.021
DJI peaked on 1/11/2006 and
then fell to
lower 1.75% lower band.
1/12/2007
+133 +.041
1/11/2010
+533 +.017
Peak on 1/14/2010. DJI fell to lower band.
3
1/4/2011
+203
-.017
DJI peaked on 2/18/2011 and then fell to
lower 1.75% lower band.
4
1/3/2012
+246
-.09 No top until
4/1/2012
1/17/2013
+429 +.191
5
1/16/2014
+222 -.016
Immediate decline 7%
decline.
There are two other problems. Though the DJI rose an impressive 98
points today and made
a new high closing, there were only 446 more up than down on the NYSE and
many dividend-
paying bond funds, REITS and bank stocks, including even Goldman Sachs, are
not doing
well. The Closing Power for GS even made a 12-month low today. The
main problem now is
a fear of a return to Inflation and a quick rise in interest rates if the
Dollar starts falling.
But this is not the 1980s. But Inflation is still much lower than in
the 1980s; so are interest rates.
The Republicans in Congress may even choose to move in the direction of a
national sales' tax
to prevent a big deficit if the new round in "supply-side"/"trickle-down"
economics does
not produce enough national growth to shore up Federal revenue.
Table 1
QUICKSILVER on
ETFS - 01/03/18
ETF      CLOSE   CHANGE     PIVOT-PT      5-dma AROC   CL-PWR   CANDLE  IP21   ITRS
---------------------------------------------------------------------------------------------
DIA       248.95    .93      247.48        34.3%       Bearish   BLUE  -.155     0
---------------------------------------------------------------------------------------------
COMPQX    7065.53    58.63   6939.34       93%         ----      BLUE  -.018    -.002
---------------------------------------------------------------------------------------------
SPY       270.47    1.7      267.32        61.3%       Bearish   BLUE  -.065    -.016
---------------------------------------------------------------------------------------------
QQQ       160.03    1.54     156.54        111.9%      Bullish   BLUE   .011     .008
---------------------------------------------------------------------------------------------
MDY       349.27    .57      345.98        45.6%       Bearish   BLUE  -.15    -.021
---------------------------------------------------------------------------------------------
IWM       154.06    .16      153.13        25.4%       Bearish   BLUE  -.251    -.041
---------------------------------------------------------------------------------------------
FAS       68.86    .92       68.39         55.5%       Bearish   BLUE  -.238     .07
---------------------------------------------------------------------------------------------
RETL      38.02   -.02       36.97        -47%         Bearish   BLUE   .113     .352
---------------------------------------------------------------------------------------------
SOXL      156.7    7.43      141.26        592.9%      ----      BLUE   .102     .109
---------------------------------------------------------------------------------------------
TECL      119.2    2.86      113.75        256.2%      Bullish   BLUE   .069     .142
---------------------------------------------------------------------------------------------
IBB       110.88    1.54     107.59        159.6%      Bullish   BLUE   .037    -.065
---------------------------------------------------------------------------------------------
GLD       124.82   -.33      122.23        123.9%      Bullish   RED    .262    -.041
---------------------------------------------------------------------------------------------
OIL       6.77    .19        6.46          214.9%      Bullish   BLUE   .243     .188
---------------------------------------------------------------------------------------------
OIH       27.22    .66       26.05         220.1%      Bullish   BLUE   .13     .075
---------------------------------------------------------------------------------------------
GASL      28.4    .79        25.33         498.9%      ----      BLUE  -.057     .265
---------------------------------------------------------------------------------------------
UGA       32.04    .64       31.93         29.9%       ----      BLUE   .005     .013
---------------------------------------------------------------------------------------------
UUP       24.02    .09      W24.2         -47.7%       Bearish   ----  -.108    -.081
---------------------------------------------------------------------------------------------
IEF       105.33    .11     W105.53        11.9%       Bullish   ----   .113    -.075
---------------------------------------------------------------------------------------------
CORN      16.84    0        W16.86         11.9%       ----      RED   -.123    -.088
---------------------------------------------------------------------------------------------
WEAT      6.09    .01        5.98          133.4%      ----      ----   .06    -.101
---------------------------------------------------------------------------------------------
YINN      38.53    1.01      33.17         713.2%      Bullish   BLUE   .11     .093
---------------------------------------------------------------------------------------------
RSX       22.09    .49       21.2          183.1%      Bullish   BLUE   .095    -.07
---------------------------------------------------------------------------------------------
AAPL      172.23   -.03      170.6         48.6%       Bullish   RED   -.046     .034
---------------------------------------------------------------------------------------------
GOOG      1082.48    17.48   1049.37       122.2%      Bullish   BLUE   .075     .028
---------------------------------------------------------------------------------------------
MSFT      86.35    .4        85.71         55.4%       Bearish   BLUE   .016     .028
---------------------------------------------------------------------------------------------
AMZN      1204.2    15.19    1182.26       116.2%      ----      BLUE   .077     .157
---------------------------------------------------------------------------------------------
FB        184.67    3.25     177.62        244%        Bullish   BLUE   .054    -.012
---------------------------------------------------------------------------------------------
NVDA     212.47    13.12     197.17        381.5%      Bullish   BLUE   .058     .011
---------------------------------------------------------------------------------------------
BA        297.8    .96       295.62        41.2%       ----      BLUE  -.089     .057
---------------------------------------------------------------------------------------------
GS        253.29   -2.38    W255.95       -86.5%       Bearish   RED   -.197    -.033
---------------------------------------------------------------------------------------------
HD        189.01    .98     W190.19       -35.6%       ----      BLUE  -.073     .089
---------------------------------------------------------------------------------------------
CAT        157.28    .24    W157.52        26.7%       Bullish   BLUE   .171     .129
|
Table 2 COMPARISONS OF BULLISH AND
BEARISH GROUPS
1/3 1/2 12/29 12/28 12/27 12/26 12/22
12/21 12/20 12/19 12/18 12/15 12/14
12/13 12/12 12/11 12/8 12/7 12/6
12/5
NEWHIGHS
548 479 166 336 253 308 262 317
247 210 553 309 103 268 223 234
288 159 91 107
NEWLOWS 61 39 32 28
21 26 32
45 50
45 43
49 56
25 52
41 37
50 65 53
--------------------------------------------------------------------------------------------------------------------------------------------------------------------------------------
MAXCPs 113
107
157 86 97
105 70 81 60 60 133
122
53 123
83 84
90 90 50 42
MINCPs
97 108 37 35 74 70 74
81 127 117
76 65 142
67 99
75 93
73 141 135
--------------------------------------------------------------------------------------------------------------------------------------------------------------------------------------
TTTNHs 100 107 70 102 97 103
72
89 65 71
146 118
75
110
72 73 76 75 46
44
TTTNLs
129 193
238 108
93 114 147 121
187 129 90 98 192 99 161 155 177 109 219 248
--------------------------------------------------------------------------------------------------------------------------------------------------------------------------------------
FASTUP
199 177
117 166 179
195
222 238
143 172
166 126 123 175
101 108
96
80
79
95
FASTDOWN
36 35 58 48 56 70 60
63 78 183 96 125 109 91
132 134 169 195 233 248 |
 Table 3
   Count of Stocks and New Highs in Key Tiger Directories
                       Date = 180103
               No.           NHs           Pct.
-------------------------------------------------------------------
INDEXES        195           80            41 %
INFRA          11            4             36 %
ETFS           65            21            32 %
MORNSTAR       238           73            31 %
HOMEBLDG       17            5             29 %
TRANSP         20            5             25 %
SP-100         96            23            24 %
COMODITY       70            17            24 %
INDMATER       91            19            21 %
CHEM           64            12            19 %
BIGMIL         6             1             17 %
DOWJONES       30            5             17 %
OILGAS         141           23            16 %
CHINA          64            10            16 %
DJI-13         13            2             15 %
SP500          486           74            15 %
NASD-100       100           15            15 %
--------------------------------------------------------
BIGBANKS       7             1             14 %
NIFTY          30            4             13 %
MILITARY       38            5             13 %
RUS-1000       838           110           13 %
FOOD           15            2             13 %
JETS           9             1             11 %
SOLAR          21            2             10 %
FINANCE        93            8             9 %
BIOTECH        392           35            9 %
HACKERS        25            2             8 %
RETAIL         53            4             8 %
GREEN          31            2             6 %
ELECTRON       179           10            6 %
SOFTWARE       66            4             6 %
AUTO           39            2             5 %
SEMI           131           7             5 %
COMPUTER       23            1             4 %
REGBANKS       33            1             3 %
GOLD           50            1             2 %
REIT           178           1             1 %
BONDFUND       111           1             1 %
==================================================
None: GAMING INSURANC COAL EDU UTILITY PIPELINE BEVERAGE  HOSPITAL                                  0 %
|
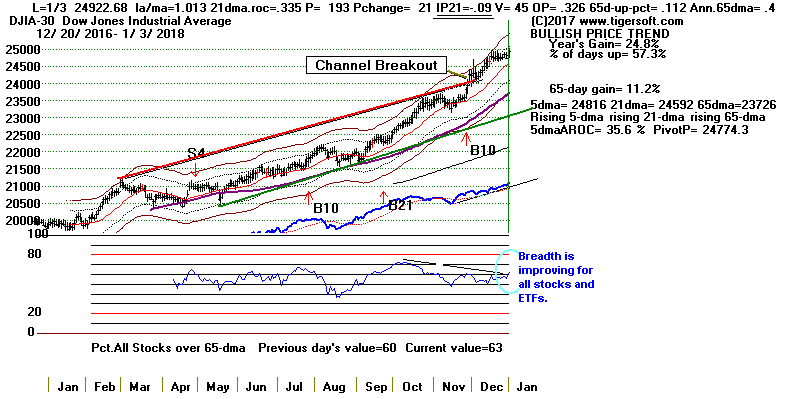 |
 Table 4
   RANKING OF KEY DIRECTORIES BASED PCT.OF STOCKS ABOVE 65-DMA
               1/3/18
 Bullish = 38
 Bearish = 6
---------------------------------------------------------------------------------------
Directory     Current       day-1         day-2         day-3         day-4         day-5
----------------------------------------------------------------------------------------
DJI-13         100%          1             1             1             1             1
INFRA          100%           1             1             1             1             1
JETS           100%           1             1             1             1             1
TRANSP         100%           1             .95           .95           1             1
COAL           .9            .9            .9            .6            .6            .6
DOWJONES       .9            .9            .9            .9            .933          .9
RETAIL         .886          .886          .811          .83           .811          .867
MORNSTAR       .882          .894          .819          .848          .844          .831
BIGBANKS       .857          .857          .857          .857          .857          .857
SP-100         .843          .812          .77           .791          .822          .802
BIGMIL         .833          .666          .833          .833          .833          .833
INDEXES        .83           .861          .846          .825          .83           .774
HOMEBLDG       .823          .764          .764          .764          .764          .705
OILGAS         .822          .751          .702          .687          .652          .673
ETFS           .815          .738          .63           .6            .584          .584
N=15
============================================================================================
GOLD           .78           .82           .66           .68           .7            .68
INDMATER       .78           .747          .648          .604          .626          .604
SP500          .773          .755          .728          .748          .732          .73
NASD-100       .77           .73           .61           .67           .64           .63
NIFTY          .766          .7            .566          .666          .633          .566
CHINA          .765          .734          .578          .546          .5            .531
COMODITY       .757          .757          .685          .685          .585          .6
GAMING         .75           .714          .678          .678          .642          .678
RUS-1000       .748          .724          .705          .732          .714          .708
AUTO           .717          .615          .564          .615          .538          .564
PIPELINE       .714          .428          .285          .285          .142          .285
BEVERAGE       .7            .7            .65           .7            .75           .7
FINANCE        .698          .688          .677          .72           .709          .752
COMPUTER       .695          .565          .478          .478          .521          .521
MILITARY       .657          .631          .684          .684          .684          .71
CHEM           .656          .625          .531          .609          .593          .562
SOFTWARE       .651          .575          .515          .56           .575          .56
HACKERS        .64           .6            .52           .56           .6            .6
GREEN          .612          .58           .645          .612          .58           .58
SEMI           .595          .519          .389          .419          .404          .381
ELECTRON       .592          .525          .418          .469          .458          .446
BIOTECH        .584          .54           .464          .492          .489          .474
FOOD           .533          .533          .333          .333          .266          .333
N=23
===============================================================================================
HOSPITAL       .5            .75           .5            .5            .5            .5
INSURANC       .5            .5            .562          .562          .531          .531
===============================================================================================
EDU            .428          .428          .285          .428          .571          .571
SOLAR          .428          .428          .428          .38           .428          .428
BONDFUND       .396          .216          .216          .189          .18           .09
REGBANKS       .363          .424          .424          .575          .545          .575
REIT           .325          .365          .421          .471          .46           .443
UTILITY        .209          .255          .279          .232          .209          .186
N=6
|
=============================================================================
1/2/2018 The
September
Buy B21 still operates and predicts
higher prices. The
advance today in leading techs, semi-conductors and the NASDAQ is
encouraging. This
shows continuing confidence in Growth stocks. (They are a favored
group when Inflation
fears begin to gather forces.) The continuing weakness in the Dollar,
Banks and Utilities
reflects a widening belief that Inflation will make a return this year.
Accordingly, Gold,
Silver and Oil are favored.
But lets consider the major ETFs, DIA,
SPY as well as the
NASDAQ. As long as Peerless
does not give a Sell signal, we are probably safe. But just to be
sure, if the DJI's IP21 continues
to be negative and the key ETFs' Closing Power remain below their recent
highs, I think we
should review some of our Closing Power rules for traders.
How worried should we be that the DJI's
IP21-Accumulation is now -.086.
So far, my answer
has been to wait for Peerless to give a Sell signal. But let me revise
that below. When the
Accumulation Index remains negative for a week or more and the Closing Power
is lagging,
it may be a good idea to draw the best Closing Power we can with the SP-500
and Sell if
the CP breaks that uptrend-line. I will start posting this chart along
with SPY's and DIA's.
SP-500 now show shows a falling Closing Power
and a negative IP21. This can still be repaired. It must
not worsen. That would likely be bearish and mean
one of January sell-off scenarios we have recently shown
might start to play out.
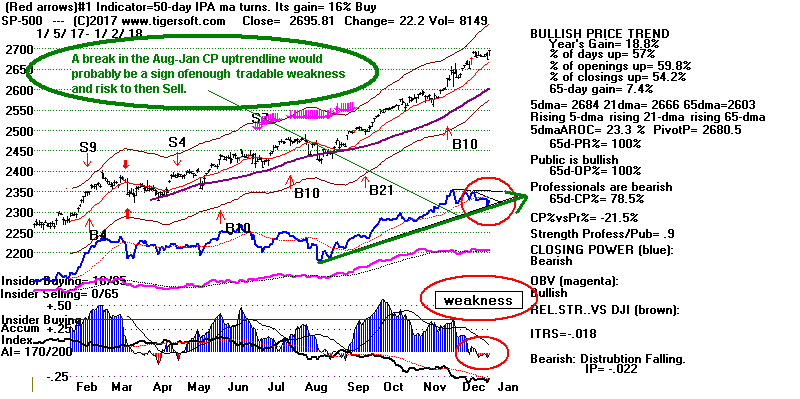
Rules for Closing Power and Closing Power Weakness
Applied to SP-500.
1) It is usually very bullish when the Accumulation Index (IP21) has been
consistently positive
and then dips below zero for less than a week and then turns positive again.
Examples below occurred within a year of bull market peak in 2000.
Even so it is bullish.
This concept would seem to apply to the NASDAQ now. But another week's
delay
would make rule #3 apply.
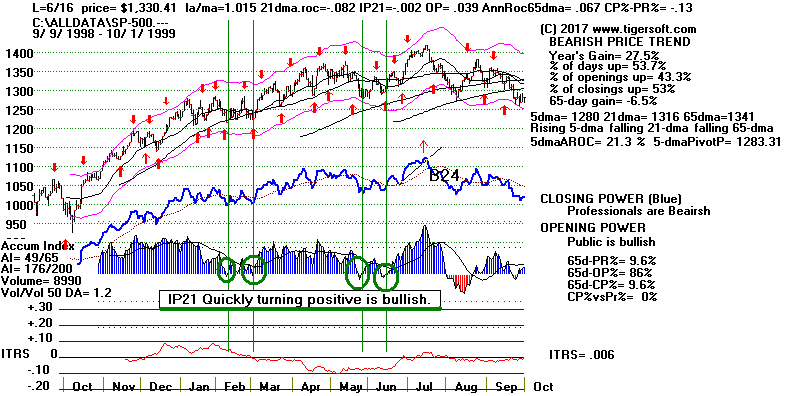
2) An extended flat-top pattern followed by a breakout which is soon
abundantly
confirmed by IP21 is very bullish. Examples: SP-500- 1994-1995 and
1998-1999.
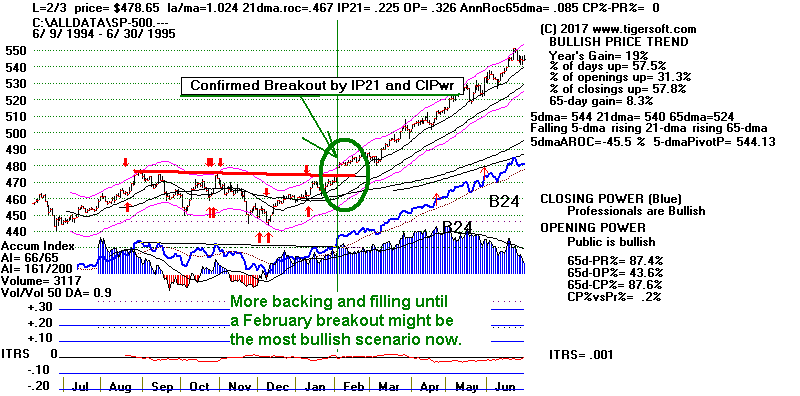
3) When IP21 and Closing Power are lagging, prices can still go higher for a
while,
but it is advisable to sell when the SP-500's Closing Power then breaks its
uptrendline.
This commonly occurs at a very tradable market top.
Examples: SP-500: 1996, 1997, 2000, 2011, 2013-2014, 2014-2105.
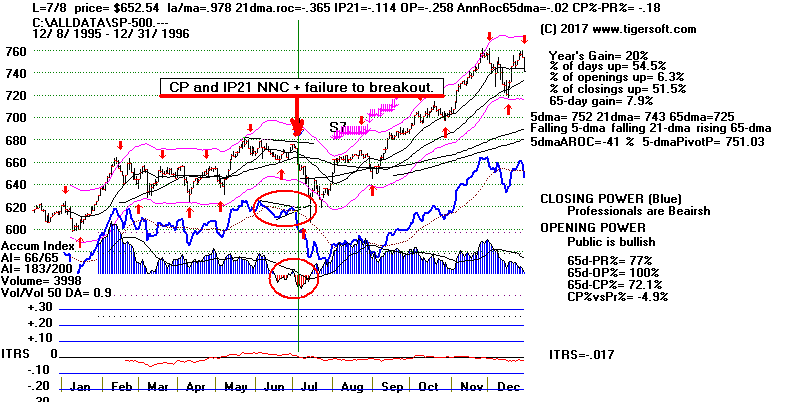
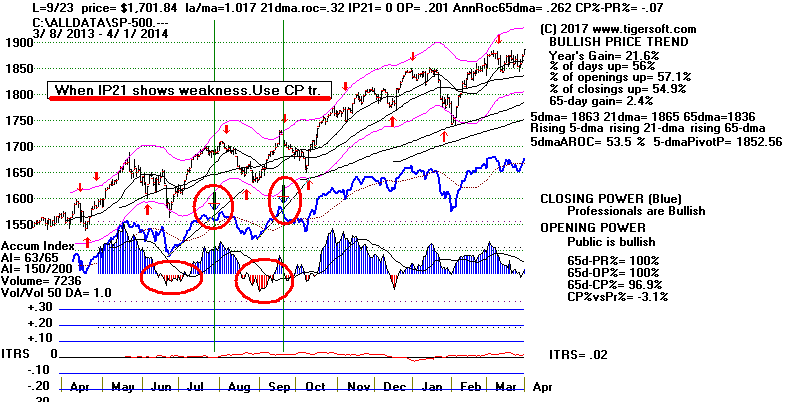
4) Expect a sell-off as soon as Closing Power uptrend is broken following a
Peerless
S12 or after the SP-500 forms a head/shoulders pattern:
Examples: Oct-2008 and May 2010.
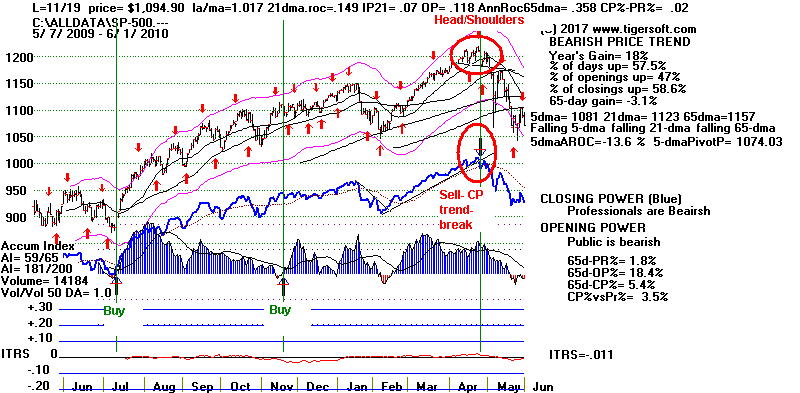
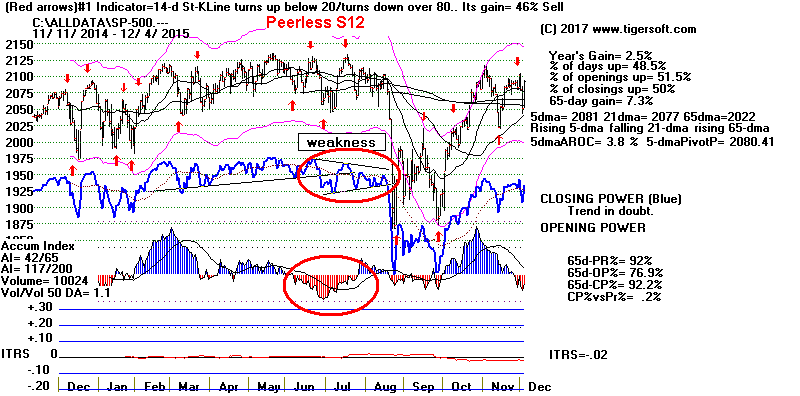
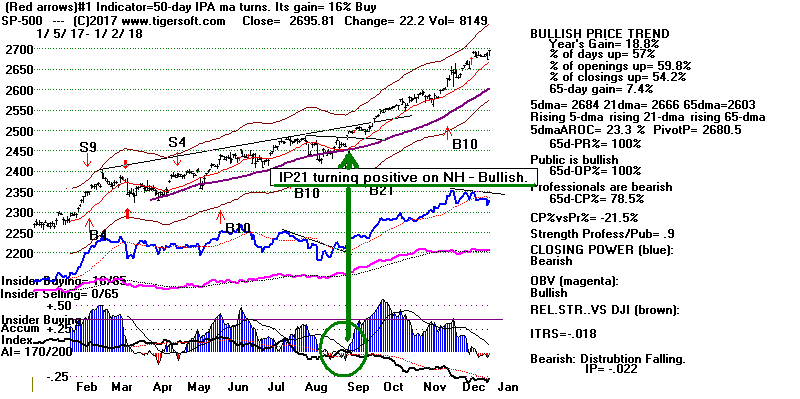
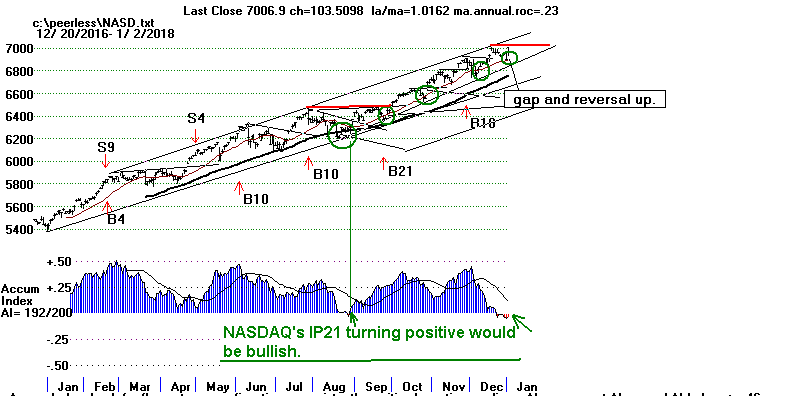
Charts 1/2/2018
PEERLESS
DJI, Signals, Indicators Daily
DJI Volume 10-DayUp/Down Vol
V-Indicator
Hourly DJIA
A/D Line for All
Stocks
NASDAQ
S&P
OEX
NYSE COMPQX
DJI-15 DJI-20
DJI-30
DIA
SPY
QQQ MDY
IWM
TNA
CrudeOil
FAS
GLD
BBH
IBB
JETS
JNUG
KOL
NUGT
OIH
OIL
RSX
RETL
SDS
SLV
SOXL
TECL
TMF
TNA UGA
(gasoline)
XIV
YINN
Commodities:
JJC, NIB,
CHOC
CORN,
WEAT
UUP
(Dollar)
AAPL ADBE
ALXN
AMAT
AMGN AMD
AMZN
BA BABA BAC
BIDU
CAT
CVX
FB
GOOG
GS
HD
IBM JPM M
(Macy's)
MSFT NFLX
NVDA
QCOM TSLA
TXN
XOM
WMT
ANDV (refinery),
CMG (Chipotle), LRCX,
SWKS,
TOWN
New SPPI WATT
SQ (Square)
1/2/2018
Bullish MAXCPs
Bearish
MINCPs
|
 Table 1
                 QuickSilver Documentation  This is for short-term trading
			leveraged ETFs.


			                      It also provides a useful short-term outlook
			of these sectors ETF's and the sectors they represewnt


			                     Blue is
			Bullish and Red is Bearish.

			                    1    Candle-Stick color is shortest-term. This
			changes when close vis-a-vis opening changes.

			                          So, in stocks or ETFs that advanced a long
			ways, traders should sell when a higher

			                          opening gives way to a decline that brings
			a drop below the previous day's close.

			                    2    5-dma AROC and Close-versus- pivot point is
			next most  short-term.

			                                       W = warning.  Close is below
			PIVOT-Point.

			                    3   Closing Power trend-direction vs. its 21-dma
			is next most short-term.

			                    4   IP21 is used to spot divergences and to
			estimate underlying support.

			                    5  > IP21 falling and below +.15 and its 21-dma
			is bearish in an over-extended ETF, especially

			                           when its Closing Power is falling and is
			below its 21-dma.

			                        > IP21 below 07 with AROC below .07 is less
			likely to bring a rally back up from 21-dma.

			                    6   Note price trend-lines, support/resistance
			and price patterns on charts.

            QUICKSILVER on ETFS - 01/02/18
ETF      CLOSE   CHANGE     PIVOT-PT   5-dma AROC   CL-PWR    CANDLE  IP21   ITRS
---------------------------------------------------------------------------------------------
DIA       248.02    .64      247.25        12.5%    Bearish    RED   -.12     ----
---------------------------------------------------------------------------------------------
COMPQX    7006.9    103.51   6936.25       33.8%    ----       BLUE  -.027    -.01
---------------------------------------------------------------------------------------------
SPY       268.77    1.91     267.19        23.6%    Bearish    BLUE  -.045    -.02
---------------------------------------------------------------------------------------------
QQQ       158.49    2.73     156.52        35.8%    ----       BLUE   .019    -.002
---------------------------------------------------------------------------------------------
MDY       348.7    3.29      346.11        39.9%    Bearish    BLUE  -.114    -.019
---------------------------------------------------------------------------------------------
IWM       153.9    1.44      153.28        23.2%    Bearish    BLUE  -.152    -.04
---------------------------------------------------------------------------------------------
FAS       67.94   -.44      W68.1         -32.1%    Bearish    RED   -.2       .081
---------------------------------------------------------------------------------------------
RETL      38.04    2        W38.37         155.3%   Bearish    BLUE   .152     .407
---------------------------------------------------------------------------------------------
SOXL      149.27    11.37    139.85        186.5%   ----       BLUE   .111     .066
---------------------------------------------------------------------------------------------
TECL      116.34    4.17     113.36        29%      ----       BLUE   .074     .133
---------------------------------------------------------------------------------------------
IBB       109.34    2.57     107.44        111.8%   Bullish    BLUE   .02     -.092
---------------------------------------------------------------------------------------------
GLD       125.15    1.5      121.77        172.1%   Bullish    BLUE   .231    -.048
---------------------------------------------------------------------------------------------
OIL       6.58    .04        6.49          232.4%   Bullish    ----   .155     .159
---------------------------------------------------------------------------------------------
OIH       26.56    .51       26.07         161.8%   Bullish    BLUE   .142     .036
---------------------------------------------------------------------------------------------
GASL      27.61    2.22      25.8          653.7%   ----       BLUE  -.06      .232
---------------------------------------------------------------------------------------------
UGA       31.4   -.45       W31.85         14.2%    Bearish    RED   -.062     .012
---------------------------------------------------------------------------------------------
UUP       23.93   -.1       W24.25        -70.3%    Bearish    ----  -.132    -.082
---------------------------------------------------------------------------------------------
IEF       105.22   -.35      105.08        8.5%     Bullish    RED    .101    -.083
---------------------------------------------------------------------------------------------
CORN      16.84    .07       16.8          8.9%     ----       BLUE  -.08    -.1
---------------------------------------------------------------------------------------------
WEAT      6.08    .08        5.93          117.3%   ----       BLUE   .067    -.119
---------------------------------------------------------------------------------------------
YINN      37.52    3.5       33.62         570.5%   Bullish    BLUE   .1       .102
---------------------------------------------------------------------------------------------
RSX       21.6    .39        21.31         115.5%   ----       ----  -.005    -.097
---------------------------------------------------------------------------------------------
AAPL      172.26    3.03     170.57       -80.3%    Bullish    BLUE   .04     .034
---------------------------------------------------------------------------------------------
GOOG      1065    18.6       1056.74       23.2%    Bullish    BLUE   .027     .011
---------------------------------------------------------------------------------------------
MSFT      85.95    .41       85.4          25.7%    Bearish    RED    .012     .033
---------------------------------------------------------------------------------------------
AMZN      1189.01    19.54   1176.76       87.8%    Bearish    BLUE   .015     .134
---------------------------------------------------------------------------------------------
FB        181.42    4.96     175.99        119.2%   Bullish    BLUE   .01     -.031
---------------------------------------------------------------------------------------------
NVDA     199.35    5.85      197.44        104%     ----       BLUE   .02     -.063
---------------------------------------------------------------------------------------------
BA        296.84    1.93     295.36        29.4%    Bearish    BLUE  -.16      .075
---------------------------------------------------------------------------------------------
GS        255.67    .91     W257.72       -64.3%    Bearish    RED   -.097    -.005
---------------------------------------------------------------------------------------------
HD        188.03   -1.5     W190.36       -2.6%     ----       RED   -.058     .081
---------------------------------------------------------------------------------------------
CAT        157.04   -.54     156.44        41%      Bullish    RED    .165     .123
|
Table 2
COMPARISONS OF BULLISH AND
BEARISH GROUPS
1/2 12/29 12/28 12/27 12/26 12/22
12/21 12/20 12/19 12/18 12/15 12/14
12/13 12/12 12/11 12/8 12/7 12/6
12/5
NEWHIGHS 479 166 336 253 308 262 317
247 210 553 309 103 268 223 234
288 159 91 107
NEWLOWS 39 32 28
21 26 32
45 50
45 43
49 56
25 52
41 37
50 65 53
--------------------------------------------------------------------------------------------------------------------------------------------------------------------------------------
MAXCPs 107
157 86 97
105 70 81 60 60 133
122
53 123
83 84
90 90 50 42
MINCPs 108 37 35 74 70 74
81 127 117
76 65 142
67 99
75 93
73 141 135
--------------------------------------------------------------------------------------------------------------------------------------------------------------------------------------
TTTNHs 107 70 102 97 103
72
89 65 71
146 118
75
110
72 73 76 75 46
44
TTTNLs
193
238 108
93 114 147 121
187 129 90 98 192 99 161 155 177 109 219 248
--------------------------------------------------------------------------------------------------------------------------------------------------------------------------------------
FASTUP
177
117 166 179
195
222 238
143 172
166 126 123 175
101 108
96
80
79
95
FASTDOWN
35 58 48 56 70 60
63 78 183 96 125 109 91
132 134 169 195 233 248 |
Table 3
Count of Stocks and New Highs in Key Tiger Directories
                   Date = 2018.01.02
               No.           NHs           Pct.
-------------------------------------------------------------------
TRANSP         20            7             35 %
INDEXES        195           66            34 %
BIGBANKS       7             2             29 %
ETFS           65            19            29 %
INFRA          11            3             27 %
MORNSTAR       238           60            25 %
COMODITY       70            17            24 %
JETS           9             2             22 %
INDMATER       91            19            21 %
BIGMIL         6             1             17 %
DOWJONES       30            5             17 %
SP-100         96            16            17 %
CHEM           64            10            16 %
DJI-13         13            2             15 %
====================================================
OILGAS         141           20            14 %
CHINA          64            9             14 %
RETAIL         53            7             13 %
FOOD           15            2             13 %
HOMEBLDG       17            2             12 %
FINANCE        93            11            12 %
SP500          486           52            11 %
GREEN          31            3             10 %
RUS-1000       838           82            10 %
SOLAR          21            2             10 %
COAL           10            1             10 %
BEVERAGE       20            2             10 %
COMPUTER       23            2             9 %
AUTO           39            3             8 %
MILITARY       38            3             8 %
HACKERS        25            2             8 %
BIOTECH        385           29            8 %
NASD-100       100           8             8 %
NIFTY          30            2             7 %
SOFTWARE       66            4             6 %
SEMI           131           7             5 %
GAMING         28            1             4 %
ELECTRON       179           7             4 %
GOLD           50            2             4 %
UTILITY        43            1             2 %
REIT           178           1             1 %
None: REGBANKS INSURANC EDU PIPELINE BONDFUND HOSPITAL
|
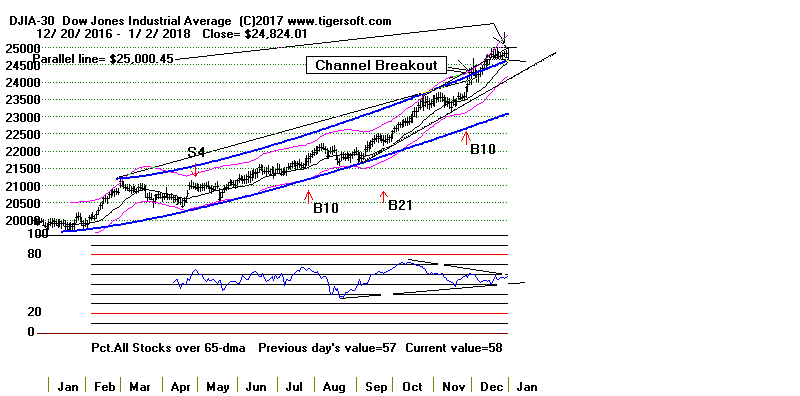 |
Table 4 RANKING OF KEY DIRECTORIES BASED PCT.OF STOCKS ABOVE 65-DMA
1/2/18
Bullish = 38
Bearish = 7
---------------------------------------------------------------------------------------
Directory Current day-1 day-2 day-3 day-4 day-5
----------------------------------------------------------------------------------------
DJI-13 1 1 1 1 1 1
INFRA 1 1 1 1 1 1
JETS 1 1 1 1 1 1
TRANSP 1 .95 .95 1 1 1
COAL .9 .9 .6 .6 .6 .6
DOWJONES .9 .9 .9 .933 .9 .9
MORNSTAR .894 .819 .848 .844 .836 .831
RETAIL .886 .811 .83 .811 .849 .83
INDEXES .861 .846 .825 .83 .774 .753
BIGBANKS .857 .857 .857 .857 .857 .857
GOLD .82 .66 .68 .7 .66 .54
SP-100 .812 .77 .791 .822 .812 .812
-------------------------------------------------------------------------------------------
HOMEBLDG .764 .764 .764 .764 .705 .705
COMODITY .757 .685 .685 .585 .585 .528
SP500 .755 .728 .748 .732 .734 .738
OILGAS .751 .702 .687 .652 .673 .631
HOSPITAL .75 .5 .5 .5 .5 .5
INDMATER .747 .648 .604 .626 .615 .615
ETFS .738 .63 .6 .584 .584 .615
CHINA .734 .578 .546 .5 .531 .593
NASD-100 .73 .61 .67 .64 .64 .65
RUS-1000 .724 .705 .732 .714 .71 .71
GAMING .714 .678 .678 .642 .678 .678
BEVERAGE .7 .65 .7 .75 .7 .65
NIFTY .7 .566 .666 .633 .6 .633
N=25
=============================================================================================
FINANCE .688 .677 .72 .709 .774 .795
BIGMIL .666 .833 .833 .833 .833 .833
MILITARY .631 .684 .684 .684 .71 .736
CHEM .625 .531 .609 .593 .593 .546
AUTO .615 .564 .615 .538 .564 .512
HACKERS .6 .52 .56 .6 .6 .6
GREEN .58 .645 .612 .58 .58 .645
SOFTWARE .575 .515 .56 .575 .575 .59
COMPUTER .565 .478 .478 .521 .521 .565
BIOTECH .537 .459 .488 .488 .467 .47
FOOD .533 .333 .333 .266 .333 .2
ELECTRON .525 .418 .469 .458 .452 .508
SEMI .519 .389 .419 .404 .389 .48
N=13
=============================================================================================
INSURANC .5 .562 .562 .531 .531 .5
=============================================================================================
EDU .428 .285 .428 .571 .714 .714
PIPELINE .428 .285 .285 .142 .285 .142
SOLAR .428 .428 .38 .428 .428 .476
REGBANKS .424 .424 .575 .545 .606 .666
REIT .365 .421 .471 .46 .443 .393
UTILITY .255 .279 .232 .209 .186 .186
BONDFUND .216 .216 .189 .18 .09 .081
N= 7
|
==============================================================================
H A P P Y N E W Y E A R
12/29/2017 The September
Buy B21 still operates and predicts
higher prices. However,
traders have to stay vigilant. The DJI's Accumulation Index (IP21) is
now negative, a -.041, the
major ETFs' Closing Powers are all falling and the NASDAQ is significantly
underperforming.
the DJI. Only
Gold, Silver,
Oil and Oil Drilling
show blue Quicksilver strength. This is the result
of a weakening Dollar and the likelihood of a
much higher rate of Inflation in 2018.
All the major market ETFs show mostly or all negative (red) Quicksilver
values:
DIA, SPY,
QQQ, IWM,
TECL, SOXL and
even FAS. See Table 1. Fortunately, the
upwards
price and breadth momentum should limit any decline.
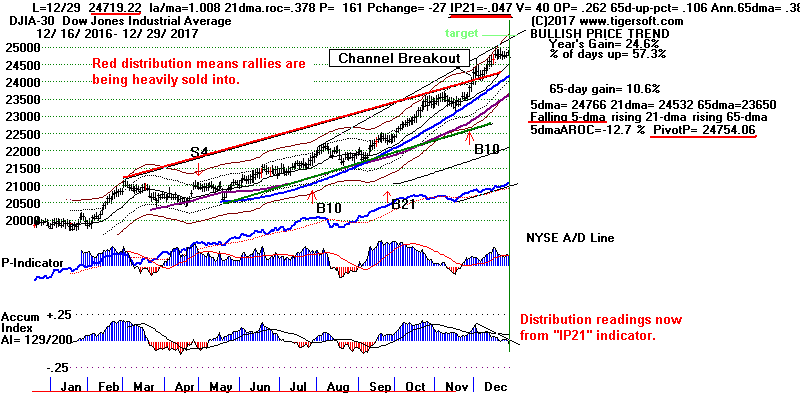
The temptation now will be strong for many to take profits in
high flying tech stocks due
to the much lower taxes this year and switch to infrastructure stocks
because of the
likelihood of new federal legislation which will focus on "rebuilding our
crumbling" bridges, roads,
railroads, airports, schools...". All we have to do to see this is to
compare CAT's accelerating
uptrend with the NASDAQ and its numerous signs of weakness.
If the V-I, now +40, turns negative and the DJI hovers where it is now, we
could still get a
Sell S16 until Thursday. See the recent example below. That
seems an unlikely development.
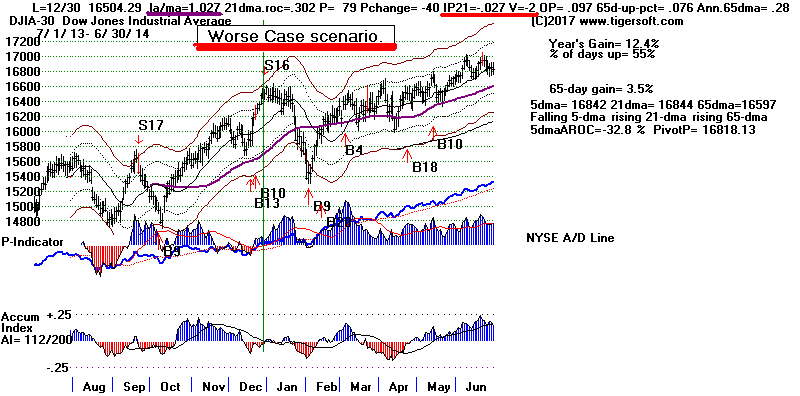
Traders should appreciate that a very low or negative IP21 in the DJI now does
not
mean that we will next see a quick
decline to the lower band. In 4 of the 9 past cases
where the
IP21 was very low like it was on
December 28th, there was no January decline
much below the 21-day ma
and even in the four cases where there was a
January peak,
the DJI typically advanced 2.1% from the end of December before
making its top.
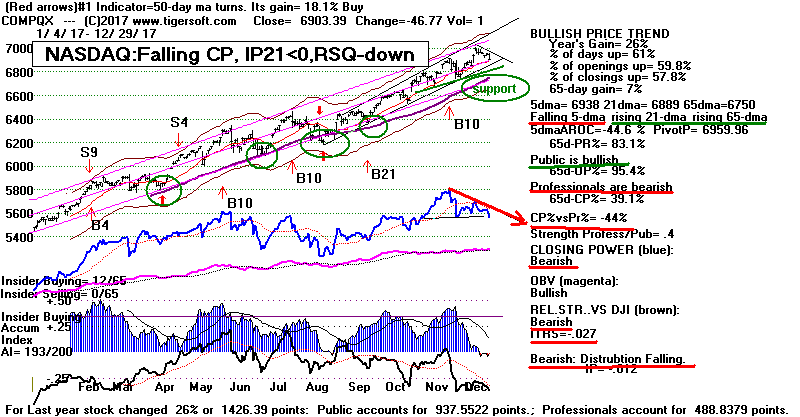 |
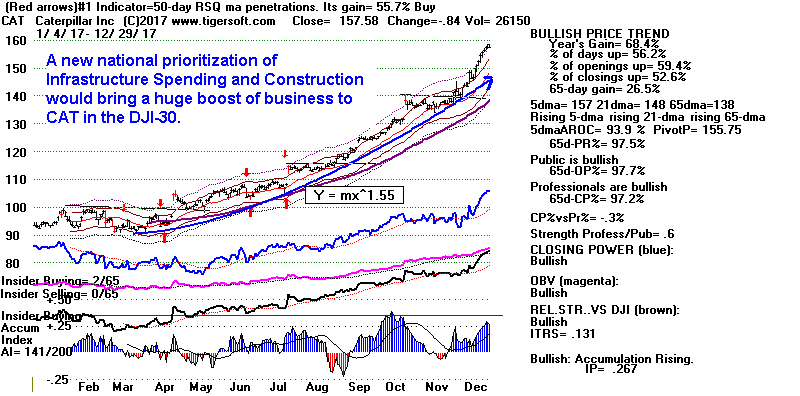 |
The Big Picture Remains Very Bullish
Barring war, we are in the midst of a tremendously important fiscal
experiment/gamble. The
Trump tax cuts for corporations and the wealthy plus the bullishness of a
big, mostly privatized
Infrastructure program are setting up for Wall Street and stocks for what could
be an almost
"perfect"
new year. Just so long as interest rates do not shoot up past 3%, the
history of the
1950s, from 1954
to 1957 suggests that we should remain very bullish. If we compare this,
the
second year of the
Trump Administration, with the second year of the Eisenhower bull market
in
the1950s, we could
see another very good year, perhaps, like 1954-1955 was back then.
(These
years' DJI charts are
shown below.)
Of course, such an outcome will require the current red Distribution in the
DJI chart soon drying up.
After that, we should expect to see a late January price breakout and a surge to new
highs, all
confirmed
by the NYSE A/D Line. But first, the markets must deal with the
cross-currents of
profit-taking and accentuated tax-based selling.
January Seasonality and Short-Term Traders
If this were a more typical year, we could not be so bullish. But as a
trained Keynesian,
I have to view tax cuts and additional federal spending as a powerfully
bullish combination
for two or three years.
Overall since 1929, Januaries are the fourth most bullish month of the year.
But this is
misleading. If we only look at Januaries
in the second year of the Presidential Election,
then this month has only a 54.5% probability of rising and the average gain
in the DJI is
just 0.2%. As I have said a dozen times
since Trump's election, these statistics give no
weight to his tremendously bullish economic growth program. Note that
Trump even says more
inflation should be viewed as a positive force. (So, I can't wait to
see how he treats his new
Fed chairman when the latter starts talking about inflation and the need for
higher interest rates.)
The Negative IP21 Is Short-Term Bearish
Early Januaries (before the 10th) have produced tradable declines in 10 of
the 24 second
years in the Presidential cycle. (1918, 1942, 1962, 1970, 1974, 1978, 1982,
1990, 2002
and 14). When the Accum. Index is negative but the P-I is positive at
the end of the year
and the DJI has closed more than 1% over the 21-day ma, as it did on
December 28th,
the odds are 4/9 (44.4%) that we shall see a tradable January top but still
55.6% that we shall
not see a stop until at least February. Looking at those cases closer,
we see that the
DJI rises 2.1% from the end of December to these 4 January peaks. See
my study here.
And all these January peaks gave a Peerless sell signal. So, for
traders, the conclusion I have
to reach now is that we should still give the market more of a chance
to run.
Charts 12/29/2017
PEERLESS
DJI, Signals, Indicators Daily
DJI Volume 10-DayUp/Down Vol
V-Indicator
Hourly DJIA
A/D Line for All
Stocks
NASDAQ
S&P
OEX
NYSE COMPQX
DJI-15 DJI-20
DJI-30
DIA
SPY
QQQ MDY
IWM
TNA
CrudeOil
FAS
GLD
BBH
IBB
JETS
JNUG
KOL
NUGT
OIH
OIL
RSX
RETL
SDS
SLV
SOXL
TECL
TMF
TNA UGA
(gasoline)
XIV
YINN
Commodities:
JJC, NIB,
CHOC
CORN,
WEAT
UUP
(Dollar)
AAPL ADBE
ALXN
AMAT
AMGN AMD
AMZN
BA BABA BAC
BIDU
CAT
CVX
FB
GOOG
GS
HD
IBM JPM M
(Macy's)
MSFT NFLX
NVDA
QCOM TSLA
TXN
XOM
WMT
ANDV (refinery),
CMG (Chipotle), LRCX,
SWKS,
TOWN
New SPPI WATT
SQ
12/29/2017
Bullish MAXCPs
Bearish
MINCPs
|
Table 1 Only Gold,
Silver, Oil and Oil Drilling show blue Quicksilver strength.
This is the result
of a weakening Dollar and the likelihood of a much higher rate of
Inflation in 2018.
All the major ETFs show mostly or all negative (red) Quicksilver
values.
QUICKSILVER on ETFS - 12/29/17
ETF      CLOSE   CHANGE     PIVOT-PT  5-dma AROC   CL-PWR   CANDLE    IP21     ITRS
---------------------------------------------------------------------------------------------
DIA       247.38   -.75      W247.4       -5.7%    Bearish      RED   -.085    -----
---------------------------------------------------------------------------------------------
COMPQX    6903.39   -46.77  W6959.96      -44.6%   Bearish      RED   -.011    -.027
---------------------------------------------------------------------------------------------
SPY       266.86   -1.01    W267.51       -13.5%   Bearish      RED   -.08     -.025
---------------------------------------------------------------------------------------------
QQQ       155.76   -.97      157.37       -57%     Bearish      RED    .016    -.022
---------------------------------------------------------------------------------------------
MDY       345.41   -1.85    W345.94       -7.5%    Bearish      RED   -.219    -.026
---------------------------------------------------------------------------------------------
IWM       152.46   -1.27    W153.19       -32.9%   Bearish      RED   -.207    -.049
---------------------------------------------------------------------------------------------
FAS       68.38   -.88       68.38        -7.3%    Bearish      RED   -.208     .093
---------------------------------------------------------------------------------------------
RETL      36.04   -.84      W36.89        -86.1%   Bearish      RED    .039     .317
---------------------------------------------------------------------------------------------
SOXL      137.9   -4.26     W144.01       -228%    Bearish      RED    .046    -.028
---------------------------------------------------------------------------------------------
TECL      112.17   -1.99    W115.68       -168.4%  Bearish      RED    .065     .081
---------------------------------------------------------------------------------------------
IBB       106.77   -1.02    W106.94       -1.4%    ----         RED   -.002    -.115
---------------------------------------------------------------------------------------------
GLD       123.65    .8       120.94        137.3%  Bullish      ----   .16     -.053
---------------------------------------------------------------------------------------------
OIL       6.54    .04        6.28          210.9%  Bullish      ----   .121     .138
---------------------------------------------------------------------------------------------
OIH       26.05    .14       25.72         52.1%   Bullish      BLUE   .072     .001
---------------------------------------------------------------------------------------------
GASL      25.39   -.77       24.29         288.8%  ----         RED   -.097     .108
---------------------------------------------------------------------------------------------
UGA       31.85   -.15       31.31         101.1%  ----         RED   -.022     .019
---------------------------------------------------------------------------------------------
UUP       24.03   -.1       W24.27        -47.5%   Bearish      ----  -.076    -.079
---------------------------------------------------------------------------------------------
IEF       105.57    .17      105.04        27.1%   Bullish      BLUE   .094    -.076
---------------------------------------------------------------------------------------------
CORN      16.77    0        W16.81         3%      ----         ----  -.058    -.101
---------------------------------------------------------------------------------------------
WEAT      6    0             5.94          33.5%   ----         ----  -.036    -.125
---------------------------------------------------------------------------------------------
YINN      34.02    .23       33.68         138.9%  Bearish      RED    .017    -.068
---------------------------------------------------------------------------------------------
RSX       21.21    .02       21.11         92.3%   ----         ----  -.101    -.124
---------------------------------------------------------------------------------------------
AAPL      169.23   -1.85    W175.01       -167.6%  Bullish      RED    .057    -.01
---------------------------------------------------------------------------------------------
GOOG      1046.4   -1.74    W1060.12      -81.6%   ----         RED   -.01    -.015
---------------------------------------------------------------------------------------------
MSFT      85.54   -.18       85.51         2.3%    Bearish      ----   .034     .033
---------------------------------------------------------------------------------------------
AMZN      1169.47   -16.63   1168.36      -22.5%   Bearish      RED    .034     .104
---------------------------------------------------------------------------------------------
FB        176.46   -1.46    W177.2        -27.9%   Bearish      RED   -.017    -.066
---------------------------------------------------------------------------------------------
NVDA     193.5   -3.9       W195.27       -60.8%   Bearish      RED    .016    -.089
---------------------------------------------------------------------------------------------
BA        294.91   -1.44    W295.1        -2%      Bearish      RED   -.129     .065
---------------------------------------------------------------------------------------------
GS        254.76   -1.74    W258.97       -121.1%  Bearish      RED   -.078    -.016
---------------------------------------------------------------------------------------------
HD        189.53   -.25      188.13        38.3%   Bullish      RED    .025     .091
---------------------------------------------------------------------------------------------
CAT        157.58   -.84     155.75        93.9%   Bullish      RED    .267     .131
|
Table 2
COMPARISONS OF BULLISH AND
BEARISH GROUPS
12/29
12/28 12/27 12/26 12/22 12/21 12/20
12/19 12/18 12/15 12/14
12/13 12/12 12/11 12/8
12/7 12/6 12/5 12/4 12/1
NEWHIGHS 166 336 253 308
262 317
247 210 553 309 103 268 223 234
288 159 91 107 340 197
NEWLOWS 32 28
21 26 32
45 50
45 43
49 56
25 52
41 37
50 65 53
37 16
--------------------------------------------------------------------------------------------------------------------------------------------------------------------------------------
MAXCPs
157 86 97
105 70 81 60 60 133
122
53 123
83
84
90 90 50 42 92 105
MINCPs
37 35 74 70 74
81 127 117
76
65 142
67 99
75 93
73 141 135 152
93
--------------------------------------------------------------------------------------------------------------------------------------------------------------------------------------
TTTNHs
70 102 97 103
72
89 65 71
146 118
75
110
72 73 76 75 46
44
72
53
TTTNLs
238 108
93 114
147 121
187 129 90 98 192 99
161 155 177 109 219 248
402 286
--------------------------------------------------------------------------------------------------------------------------------------------------------------------------------------
FASTUP
117 166 179
195
222 238
143 172
166 126 123 175
101 108
96
80
79
95
180 126
FASTDOWN
58 48 56 70 60
63 78 183 96 125 109 91
132 134 169 195 233 248 210 156 |
Table 3Count of Stocks and New Highs in Key Tiger Directories
Date = 171229
No. NHs Pct.
-------------------------------------------------------------------
COMODITY 70 15 21 % (Includes mostly Oil ETFs)
BEVERAGE 20 4 20 %
ETFS 65 10 15 %
----------------------------------------------------
EDU 7 1 14 %
JETS 9 1 11 %
INFRA 11 1 9 %
FOOD 15 1 7 %
HOMEBLDG 17 1 6 %
CHINA 64 4 6 %
OILGAS 141 7 5 %
COMPUTER 22 1 5 %
FINANCE 93 4 4 %
HACKERS 25 1 4 %
RETAIL 53 2 4 %
GREEN 31 1 3 %
CHEM 64 2 3 %
MILITARY 38 1 3 %
MORNSTAR 238 6 3 %
SOFTWARE 66 2 3 %
INDMATER 92 2 2 %
INDEXES 195 3 2 %
ELECTRON 179 4 2 %
SEMI 130 3 2 %
RUS-1000 838 15 2 %
SP-100 96 1 1 %
BIOTECH 386 3 1 %
SP500 486 7 1 %
REIT 178 1 1 %
--------------------------------------------------
The rest have none:
BIGBANKS BIGMIL REGBANKS AUTO DJI-13 DOWJONES
NIFTY GAMING INSURANC NASD-100 TRANSP SOLAR
COAL GOLD UTILITY PIPELINE BONDFUND HOSPITAL
|
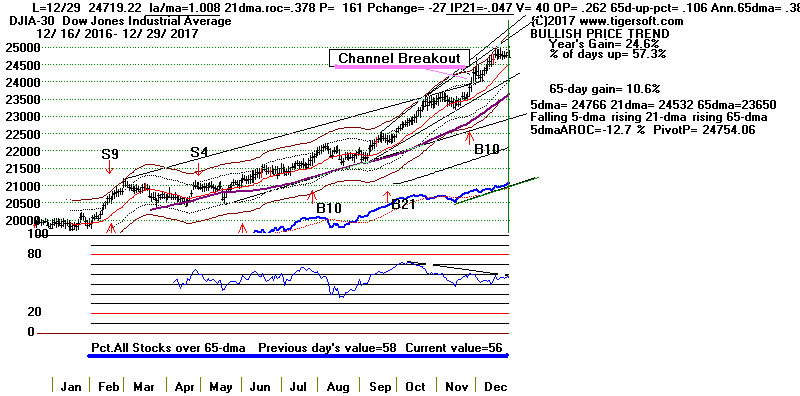 |
 Table 4
              RANKING OF KEY DIRECTORIES BASED PCT.OF STOCKS ABOVE 65-DMA
              12/29/17
 Bullish = 33
 Bearish = 12
---------------------------------------------------------------------------------------
Directory     Current       day-1         day-2         day-3         day-4         day-5
----------------------------------------------------------------------------------------
DJI-13         100%          1             1             1             1             1
INFRA          100%          1             1             1             1             .909
JETS           100%          1             1             1             1             1
TRANSP         .95           .95           1             1             1             1
COAL           .9            .6            .6            .6            .6            .6
DOWJONES       .9            .9            .933          .9            .9            .9
BIGBANKS       .857          .857          .857          .857          .857          .857
INDEXES        .846          .825          .83           .774          .753          .733
BIGMIL         .833          .833          .833          .833          .833          .833
MORNSTAR       .819          .848          .844          .836          .836          .836
RETAIL         .811          .83           .811          .849          .811          .792
SP-100         .77           .791          .822          .812          .812          .833
HOMEBLDG       .764          .764          .764          .705          .705          .764
SP500          .728          .748          .732          .734          .738          .74
RUS-1000       .705          .732          .714          .71           .71           .713
OILGAS         .702          .687          .652          .673          .638          .638
COMODITY       .685          .685          .585          .585          .528          .5
MILITARY       .684          .684          .684          .71           .736          .736
GAMING         .678          .678          .642          .678          .678          .642
FINANCE        .677          .72           .709          .774          .795          .849
GOLD           .66           .68           .7            .66           .54           .38
INDMATER       .652          .608          .63           .619          .608          .586
BEVERAGE       .65           .7            .75           .7            .65           .7
GREEN          .645          .612          .58           .58           .645          .645
ETFS           .63           .6            .584          .584          .63           .584
NASD-100       .61           .67           .64           .64           .65           .68
CHINA          .578          .546          .5            .531          .609          .562
NIFTY          .566          .666          .633          .6            .633          .666
AUTO           .564          .615          .538          .564          .512          .641
INSURANC       .562          .562          .531          .531          .5            .5
CHEM           .531          .609          .593          .593          .562          .593
HACKERS        .52           .56           .6            .6            .6            .6
SOFTWARE       .515          .56           .575          .575          .59           .621
N=33
=============================================================================================
HOSPITAL       .5            .5            .5            .5            .5            .5
=============================================================================================
BIOTECH        .458          .487          .487          .466          .474          .458
COMPUTER       .454          .454          .5            .5            .545          .545
SOLAR          .428          .38           .428          .428          .476          .476
REGBANKS       .424          .575          .545          .606          .666          .757
REIT           .421          .471          .46           .443          .393          .382
ELECTRON       .418          .469          .458          .452          .508          .541
SEMI           .384          .415          .4            .384          .476          .492
FOOD           .333          .333          .266          .333          .2            .266
EDU            .285          .428          .571          .714          .714          .714
PIPELINE       .285          .285          .142          .285          .142          .142
UTILITY        .279          .232          .209          .186          .186          .186
BONDFUND       .216          .189          .18           .09           .081          .099
N=12
|
==============================================================================
12/28/2017.
The September
Buy B21 still operates and predicts
higher prices. The DJI's
narrow price pattern looks like a FLAG.
This is usually a continuation
pattern. And bullishly the
NYSE A/D Line made a 12-month high. But our IP21 remains negative.
The conclusion I reach is
that until Peerless gives a Sell signal, we should not sell. I should
add, though, that all
major ETFs now show falling Closing Powers. (See Table 1). This is a
warning not to
expect a big January take-off; at least not until we see some gains extended
significantly
after the openings.
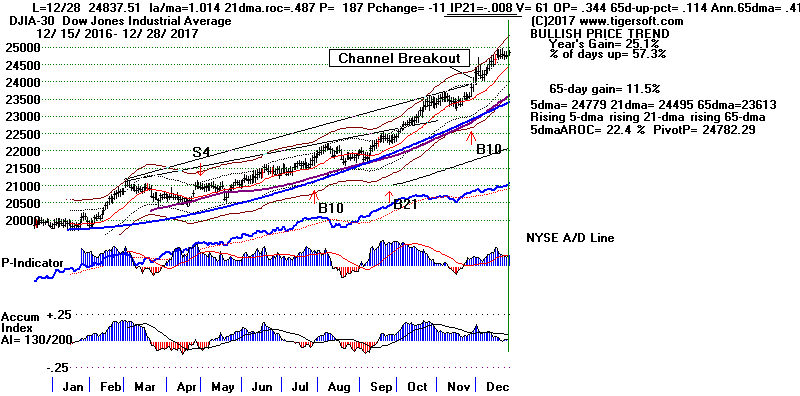
In reaching that conclusion, I have looked back at all
the past cases where the DJI closed 1.01%
above the 21-dma and showed a negative IP21and a positive P-I, as now, on
December 28th.
Only in one cases should Peerless ideally have given a Sell. That was
in 2009. After a quick
decline to the lower band in January 2010, the DJI then rallied to new
highs. Table A below shows
all these cases.
I also reviewed the data for all 16 cases where the NYSE A/D Line was making
a new high at the
end of December. In 7 of the 16 cases, the DJI moved up after January 10th
to significant new
highs. But in 4 cases, the DJI quickly topped out and fell. In 5
more cases, the DJI peaked before
January 10th. Note that in only 2 of these cases did the DJI fall more
than 2.5% below lower band
before running up to new highs. In 13 of the 16 cases, the DJI made
significant new highs after
whatever January mischief it needed to deal with.
Today Nicolas Tesla's Dream of A Wireless World
Seems A Lot More Real.2
Energous (WATT) is company that builds chargers that can power electronics
through the air.
The Federal Communications Commission (FCC) granted its first approval for
remote wireless-
charging technology, its “WattUp” system, yesterday. That’s a big step
closer to commercial
viability for wireless charging. There would be a huge market for
this. Many other applications
are sure to be developed. As a caution, note that we do not know how long it
takes to charge,
say, a cell phone and today the US Patent & Trademark Office
published a pair of patent applications
from Apple relating to wireless charging. WATT
should go much higher.
So should AAPL.
Worldwide-interest in this could be huge.
(I
will add it to the stocks that are graphed each night.)
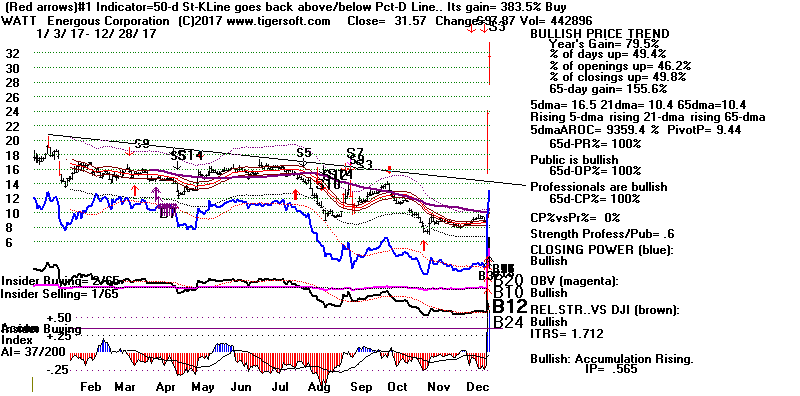
Consider A Short Sale on Square
Financial Services (SQ)
It has a big bet on Bitcoins. But
the real reason, I think, that it now shows a bearish
head/shoulders pattern is because it is unexpectedly freezing merchants' moneys without
warning
after they have run a customer's credit card through its slick processing
system. More and
more complaints
about SQ's arbitrary seizure of this money and the difficulty that
merchants are
having
getting their moneys unfrozen. This we can see from the on-line reviews
of SQ. Since
trust and confidence are the keys to any financial services business, SQ is
burning a
lot of bridges
and getting the worst kind of
publicity. Well, not the worst. That may lie ahead. This
is a story
that is only beginning to play out.
SQ is a San Francisco company. The number of complaints
against it will surely lead to the State of California launching
an investigation into what appears to
be a form of financial theft and
racketeering. News of
such an investigation will really hurt. This is
a company that depends
entirely on
businessmen's confidence in it. (I will add SQ the stocks
that are graphed each night
and we will see if
this story develops into a full-blown scandal.)
"Top
66 Reviews and Complaints about Square - ConsumerAffairs.com
"Rating:
1.6 - 66 votes
Original review: Nov.
9, 2017. I used to rave about Square as I thought that they
were the wave of the future and recommended them to so many people. However,
suddenly my account is
frozen, funds
not deposited and I can't get in touch
with anyone for days. Since,
they don't have a phone number that works, or you can't ..."
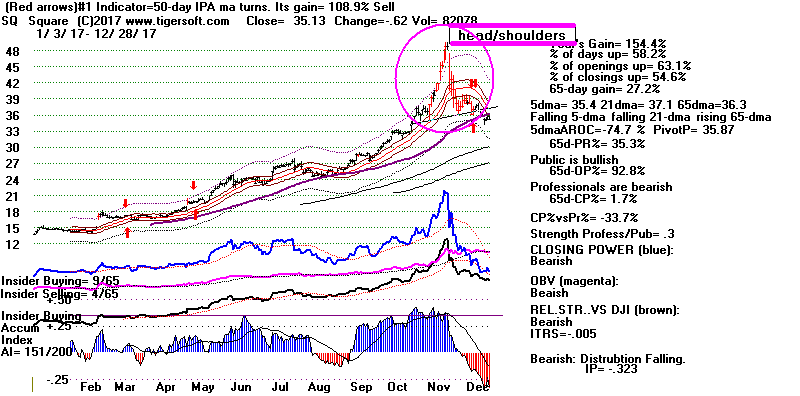
Table A
  DJI above 1.01% Band with a Positive P-I and a Negative IP21.
  =============================================================

  In only 1 case did Peerless fail to give a Sell before the DJI fell
  to the lower band.
 1            19341228       103.2         1.016         .7           -.062
              DJI peaked on 1/7/1934 @105.9 (S16/S9/S12 )
              and fell to lower 1.9% band @100.2
--------------------------------------------------------------------------------
 2            19351231       144.1         1.016         15.9         -.132
              DJI rallied until 3/4 @156.7 before Peerless gave a Sell.
--------------------------------------------------------------------------------
 3            19821228       1058.87       1.028         17.3         -.114
              DJI rallied until 1/12 @1083.61 (S12).  DJI then fell to lower band.
--------------------------------------------------------------------------------
 4            19961230       6549.37       1.017         35.9         -.003
              DJI rallied until 2/18 @7067.46 (S4,S12), DJI then fell below lower band.
--------------------------------------------------------------------------------
 5            20001229       10786.85      1.013         282.7        -.023
              DJI rallied until 1/4/2001 (S12)@10912.41.  DJI then fell tolower band.
--------------------------------------------------------------------------------
 6           20091228       10547.08       1.012         410.7        -.018
              DJI rallied until 1/19/2009 (no Sell) @10725.43.
              DJI then fell 7.5% and below lower band before rallying to new highs.
--------------------------------------------------------------------------------
 7           20111230       12217.56       1.011         136.6        -.096
              DJI rallied until 3/21/2012 (S1)@13124.62.  DJI then fell to lower band.
--------------------------------------------------------------------------------
 8           20131230       16504.29       1.026         79.7         -.028
             DJI rallied until 12/30/2013 (S16) @16504.29.  DJI then fell to below lower band.
--------------------------------------------------------------------------------
 9           20141229       18038.23       1.016         39.6         -.013
             DJI rallied until 5/19/2015 (S12) @18312.39. DJI then fell to lower band.
|
Table B 16 Past Cases where
A/D Line Makes New Highs at End of December:
4 cases - DJI immediately fell.
1976, 1992 and 2004 (All Election
Years) and 2013.
5 cases -
DJI peaked in January before the 10th. 1943,
1949, 1952, 1954 and 1995
- 1943 - shallow decline to 2.3% lower band and then new highs.
- 1949 - very shallow decline to 1.2% lower band and then new highs.
- 1952 - Decline to 4.1% lower band.
- 1954 - shallow decline to 2.6% lower band and then new highs.
- 1995 - shallow decline to 2.0% lower band and then new highs.
7
cases -
DJI peaked after 1/10 of next year.
-----------------------------------------------------------------------------------------------------------------------------
1 case like ours now - IP21 was negative.
On 12/31 the DJI peaked and fell to lower
5.1% band on 2/3 @ 15372.80.
12/28
Next Peak before Decline to Lower Band
DJI
2017
24837.51
PI= 187
IP21=-.008 V=61
OP=.344
-------------------------------------------------------------------------------------------------------
1943-4
135.00 DJI
rallied to 138.7 on 1/5.
It then fell back to 2.3% lower band on 2/7 @134.2
and then rose to 150.2 on 7/11
PI = 84 IP21 = .075 V= 43
OP=.264
-----------------------------------------------------------------------------------------------------------------------------------------
1949-50
199.6
DJI rallied to 201.9 on 1/9/50.
It fell back to 1.2% lower band on 1/13 @196.8.
then rose 228.4 on 6/12/1950.
PI=33 IP21=.176 V=56 OP=.136
----------------------------------------------------------------------------------------------------------------------------------------
1950-1951 235.3
DJI rallied to 255.7 on 2/13/1951.
It then fell back to 3.2% lower band @243.9
on 3/14/1951
PI=173 IP21=.076 V=280 OP=.158
----------------------------------------------------------------------------------------------------------------------------------------
1952-1953 288.2
DJI rallied to 293.8 on 1/5/1953. Then fell
back to 4.1% lower band @274.1 on 4/6/1953.
PI=52 IP21=.132
V=-28 OP=.327
----------------------------------------------------------------------------------------------------------------------------------------
1954-1955 398.5
DJI rallied to 408.9 on 1/3/55.
Then fell back to 2.6% lower band @ 388.2 on
1/17/1955.
It then rose to 418.3 on 3/3/1955 before falling to 4.7% lower
band.
PI=87 IP21=.068
V=67 OP=.193
----------------------------------------------------------------------------------------------------------------------------------------
1958-1959 577.3
DJI rallied to 597.7 on 1/23.
DJI then fell back to 2.9% lower band @ 574.5
It then rose to July.
PI=86 IP21=.084 V=86
OP=.382
----------------------------------------------------------------------------------------------------------------------------------------
1976
1000.08 DJI rallied only to
1004.65 on 12/31. DJI then started a year-long bear market.
PI=228 IP21=.091
V=2
OP=.398
----------------------------------------------------------------------------------------------------------------------------------------
1992-1993 3333.26
DJI immediately fell to
lower 1.5% band on 1/20/1993 @ 3241.95. It
then rose erratically
to June and beyond.
PI=78 IP21=.107
----------------------------------------------------------------------------------------------------------------------------------------
1995-1996 5095.8
DJI rose to 5194 on 1/3. It then fell to
lower 2% band on 1/10 @5032.94.
Next it advanced until 4/3 to 5689.74.
PI=178
IP21=.037 V=-4
OP=.125
----------------------------------------------------------------------------------------------------------------------------------------
1996-1997 6560.91
DJI rose to 7085.16 on 3/11. It
then fell to lower 4.8% band on 4/11 @ 6391.69
PI=31
IP21=.003 V=-25
OP=.236
----------------------------------------------------------------------------------------------------------------------------------------
2003-2004 10324.67
DJI rose to 10737.7 on 2/11. It then
fell to lower 3.1% band on 3/24 @ 10048.13
PI=463 IP21=.113 V=53
OP=.424
----------------------------------------------------------------------------------------------------------------------------------------
2004
10854.54 DJI immediately
fell to 10392.99 at 2.5% lower band on 1/21.
It then rose back to 10940.85 on 3/4
PI=255 IP21=.104 V=34
OP=.252
----------------------------------------------------------------------------------------------------------------------------------------
2005-2006 10796.26
DJI rose to 11043.44
on 1/11. It then
fell to 1.9% lower band on 1/20 @ 10667.39.
It then rose to 11642.65 on 5/11.
PI=171 IP21=.193
V=-62 OP=-.244
----------------------------------------------------------------------------------------------------------------------------------------
2010-11
11575.54 DJI rose to 12391.25 on 2/18.
It then fell to 4.2% lower band
on 3/16 @ 11613.3
PI=225 IP21=.105 V=131
OP=.043
----------------------------------------------------------------------------------------------------------------------------------------
2013
16478.41 DJI rose to 16576.66 on 12/31.
It then fell to to lower 5.1% band on 2/3 @ 15372.80.
It then ran back into July and made a new high in May.
PI=119 IP21=-.031
V=5 OP=.102
----------------------------------------------------------------------------------------------------------------------------------------
2016-2017. 19833.68
DJI rose to 21115.55 on 3/1. It then fell to to lower 1.1%
band on 4/19 @ 20404.49,
After that, it resumed current bull market..
PI=146 IP21=.008
V=-14
OP=.376
----------------------------------------------------------------------------------------------------------------------------------------
| |
Table 1
QUICKSILVER on ETFS - 12/28/17
ETF      CLOSE   CHANGE     PIVOT-PT      5-dma AROC   CL-PWR     CANDLE  IP21    ITRS
---------------------------------------------------------------------------------------------
DIA       248.13    .65      247.66        21.4%       Bearish      BLUE   -.038    ---
---------------------------------------------------------------------------------------------
COMPQX    6950.16    10.82  W6965.36      -7.8%        Bearish       RED   -.056    -.03
---------------------------------------------------------------------------------------------
SPY       267.87    .55      267.58        15.7%       Bearish       ----  -.052    -.031
---------------------------------------------------------------------------------------------
QQQ       156.73    .19     W157.55       -25.5%       Bearish      RED    .001    -.028
---------------------------------------------------------------------------------------------
MDY       347.26    1.28     345.93        30.4%       Bearish      BLUE  -.145    -.028
---------------------------------------------------------------------------------------------
IWM       153.73    .6       153.47        11.4%       Bearish      BLUE  -.19    -.046
---------------------------------------------------------------------------------------------
FAS       69.26    .87       68.48         129.1%      Bearish      BLUE  -.164     .111
---------------------------------------------------------------------------------------------
RETL      36.88   -.09       36.68         58%         Bearish      RED    .129     .364
---------------------------------------------------------------------------------------------
SOXL      142.16    .9      W144.39       -245.6%      Bearish      RED   -.045     .004
---------------------------------------------------------------------------------------------
TECL      114.16    .41     W116.03       -112.5%      ----         RED    .027     .1
---------------------------------------------------------------------------------------------
IBB       107.79    .2       106.8         52.8%       Bullish      BLUE   .016    -.123
---------------------------------------------------------------------------------------------
GLD       122.85    .62      120.31        111.9%      Bullish      ----   .183    -.074
---------------------------------------------------------------------------------------------
OIL       6.5    .04         6.27          212.7%      Bullish      ----   .122     .118
---------------------------------------------------------------------------------------------
OIH       25.91   -.14       25.78         176.9%      Bullish      RED    .045    -.035
---------------------------------------------------------------------------------------------
GASL      26.16    .83       23.94         805.9%      Bullish      BLUE  -.066     .104
---------------------------------------------------------------------------------------------
UGA       32    .07          31.21         141.4%      ----         BLUE  -.015     .021
---------------------------------------------------------------------------------------------
UUP       24.13   -.07      W24.26        -28.9%       Bearish      ----  -.122    -.087
---------------------------------------------------------------------------------------------
IEF       105.4   -.13       105           14.7%       Bullish      ----   .117    -.091
---------------------------------------------------------------------------------------------
CORN      16.77   -.09       16.76         29.8%       Bullish      RED   -.063    -.116
---------------------------------------------------------------------------------------------
WEAT      6    .02           5.96          50.4%       ----         ----  -.048    -.143
---------------------------------------------------------------------------------------------
YINN      33.79    .62       33.09         360.7%      ----         RED    .007    -.056
---------------------------------------------------------------------------------------------
RSX       21.19   -.01       20.82         97.4%       ----         ----  -.117    -.134
---------------------------------------------------------------------------------------------
AAPL      171.08    .48     W175.01       -94.4%       Bullish      BLUE   .085    -.013
---------------------------------------------------------------------------------------------
GOOG      1048.14   -1.23   W1063.63      -79.4%       Bearish       RED   -.044    -.023
---------------------------------------------------------------------------------------------
MSFT      85.72    .01       85.5          11.7%       Bearish       RED    .021     .025
---------------------------------------------------------------------------------------------
AMZN      1186.1    3.84     1174.76       36.1%       Bearish       RED    .013     .096
---------------------------------------------------------------------------------------------
FB        177.92    .3       177.45        .8%         Bearish     ----  -.069    -.069
---------------------------------------------------------------------------------------------
NVDA     197.4    .23        195.89        15.3%       ----         RED   -.015    -.081
---------------------------------------------------------------------------------------------
BA        296.35    .73      295.03       -26.2%       Bearish       ----  -.074     .066
---------------------------------------------------------------------------------------------
GS        256.5    .55      W261.01        25.6%       Bearish       RED   -.114     .007
---------------------------------------------------------------------------------------------
HD        189.78   -.41      188.08        65.4%       Bullish      RED    .072     .082
---------------------------------------------------------------------------------------------
CAT        158.42    .9      154.64        189.9%      Bullish      BLUE   .288     .134
|
Table 2
COMPARISONS OF BULLISH AND
BEARISH GROUPS
12/28
12/27 12/26 12/22 12/21 12/20
12/19 12/18 12/15 12/14
12/13 12/12 12/11 12/8
12/7 12/6 12/5 12/4
12/1 11/30
NEWHIGHS 336 253 308
262 317
247 210 553 309 103 268 223 234
288 159 91 107 340 197 536
NEWLOWS 28
21 26 32
45 50
45 43
49 56
25 52
41 37
50 65 53
37 16 31
--------------------------------------------------------------------------------------------------------------------------------------------------------------------------------------
MAXCPs
86 97
105 70 81 60 60 133
122
53 123
83
84
90 90 50 42 92 105
266
MINCPs
35 74 70 74
81 127 117
76
65 142
67 99
75 93
73 141 135 152
93 80
--------------------------------------------------------------------------------------------------------------------------------------------------------------------------------------
TTTNHs 102 97 103
72
89
65 71
146 118
75
110
72 73 76 75 46
44
72
53 139
TTTNLs
108
93 114
147 121
187 129 90 98 192 99
161 155 177 109 219 248
402 286 162
--------------------------------------------------------------------------------------------------------------------------------------------------------------------------------------
FASTUP
166 179
195
222 238
143 172
166 126 123 175
101 108
96
80
79
95
180 126
128
FASTDOWN
48 56 70 60
63 78 183 96 125 109 91
132 134 169 195 233 248 210 156
123 |
Table 3Count of Stocks and New Highs in Key Tiger Directories
Date = 171228
No. NHs Pct.
-------------------------------------------------------------------
COMODITY 70 21 30 %
INFRA 11 3 27 %
INDEXES 195 44 23 %
COAL 10 2 20 %
BEVERAGE 20 4 20 %
HOMEBLDG 17 3 18 %
BIGMIL 6 1 17 %
DJI-13 13 2 15 %
MORNSTAR 238 35 15 %
===================================================
EDU 7 1 14 %
DOWJONES 30 4 13 %
FOOD 15 2 13 %
SP-100 96 11 11 %
GREEN 31 3 10 %
INDMATER 92 9 10 %
CHEM 64 6 9 %
FINANCE 93 8 9 %
ETFS 65 6 9 %
SP500 485 42 9 %
INSURANC 32 3 9 %
MILITARY 38 3 8 %
OILGAS 142 11 8 %
RUS-1000 837 69 8 %
RETAIL 53 4 8 %
NIFTY 30 2 7 %
NASD-100 100 7 7 %
GOLD 50 3 6 %
BIOTECH 386 18 5 %
TRANSP 20 1 5 %
SOLAR 21 1 5 %
COMPUTER 22 1 5 %
GAMING 28 1 4 %
SEMI 130 5 4 %
REGBANKS 33 1 3 %
ELECTRON 178 6 3 %
SOFTWARE 66 2 3 %
CHINA 64 2 3 %
REIT 178 3 2 %
------Others no new highs -----------------
BIGBANKS AUTO HACKERS UTILITY PIPELINE BONDFUND
HOSPITAL JETS
|
| |
 |
Table 4
 RANKING OF KEY DIRECTORIES BASED PCT.OF STOCKS ABOVE 65-DMA
              12/28/17
---------------------------------------------------------------------------------------
Directory     Current       day-1         day-2         day-3         day-4         day-5
----------------------------------------------------------------------------------------
DJI-13         1             1             1             1             1             1
INFRA          1             1             1             1             .909          .727
JETS           1             1             1             1             1             1
TRANSP         .95           1             1             1             1             1
DOWJONES       .9            .933          .9            .9            .9            .933
BIGBANKS       .857          .857          .857          .857          .857          .857
MORNSTAR       .848          .844          .836          .836          .836          .81
BIGMIL         .833          .833          .833          .833          .833          .833
RETAIL         .83           .811          .849          .811          .792          .811
INDEXES        .825          .83           .774          .753          .723          .692
N=10
===========================================================================================
SP-100         .791          .822          .812          .812          .833          .833
HOMEBLDG       .764          .764          .705          .705          .764          .647
SP500          .748          .731          .734          .738          .74           .729
RUS-1000       .732          .714          .709          .709          .714          .712
FINANCE        .72           .709          .774          .795          .86           .752
BEVERAGE       .7            .75           .7            .65           .7            .75
COMODITY       .685          .585          .585          .528          .5            .485
MILITARY       .684          .684          .71           .736          .736          .71
OILGAS         .683          .647          .669          .633          .633          .514
GOLD           .68           .7            .66           .54           .38           .36
GAMING         .678          .642          .678          .678          .642          .714
NASD-100       .67           .64           .64           .65           .68           .68
NIFTY          .666          .633          .6            .633          .666          .666
AUTO           .615          .538          .564          .512          .641          .769
GREEN          .612          .58           .58           .645          .645          .612
CHEM           .609          .593          .593          .562          .593          .593
INDMATER       .608          .63           .619          .608          .586          .597
COAL           .6            .6            .6            .6            .6            .5
ETFS           .6            .584          .584          .63           .569          .492
REGBANKS       .575          .545          .606          .666          .757          .696
INSURANC       .562          .531          .531          .5            .531          .5
HACKERS        .56           .6            .6            .6            .6            .64
SOFTWARE       .56           .575          .575          .59           .636          .636
CHINA          .546          .5            .531          .609          .562          .5
N=24
==============================================================================================
HOSPITAL       .5            .5            .5            .5            .5            .5
==============================================================================================
BIOTECH        .487          .487          .466          .474          .458          .427
REIT           .471          .46           .443          .393          .382          .376
ELECTRON       .466          .455          .455          .511          .544          .561
COMPUTER       .454          .5            .5            .545          .545          .59
EDU            .428          .571          .714          .714          .714          .714
SEMI           .415          .4            .384          .476          .492          .515
SOLAR          .38           .428          .428          .476          .476          .523
FOOD           .333          .266          .333          .2            .266          .2
PIPELINE       .285          .142          .285          .142          .142          .142
UTILITY        .232          .209          .186          .186          .209          .209
BONDFUND       .189          .18           .09           .081          .09           .036
Bearish = 11
|
===============================================================================
12/27/2017.
The September
Buy B21 still operates and predicts
higher prices. The DJI's
narrow price pattern looks like a FLAG.
This is usually a continuation
pattern. And bullishly the
NYSE A/D Line made a 12-month high. Except in
1976, 2004 and 2013, a
a strong A/D Line making new highs at this time of the year is usually quite
bullish for
the start of the new year. This is seen in the DJI and A/D
Line charts of 1943-4, 1949-50,
1950-1951, 1952-1953, 1954-1955, 1958-1959, 1992-1993, 1995-1996, 1996-1997,
2003-2004, 2005-2006, 2010-11 and 2016-2017. So, on 13 occasions late
December
NYSE A/D Line new highs led to the bull markets extending into March or
longer. Only thrice,
did a strong A/D Line at the end of December produce a tradable January
decline. (More
on this tomorrow night.)
We do have several bearish concerns. First, short-term rates rose
sharply today. But the markets
largely ignored this. Secondly, the NASDAQ continues to lag the DJI.
But one could also say
that it is short-term oversold. And third, most of key ETFs we follow
still have falling Closing
Powers. See Table 2.
Without a Peerless sell signal, we should continue
to trust the bullish seasonality.
Since 1965, the DJI has risen 64.7% of the time over the next ten trading
days and averaged
a gain of 0.7%. A month from now the DJI has a 2/3 probability of
being higher if we only
consider its track record since 1965. The average gain over the next
month is an impressive +1.3%
I would avoid shorting equities now.
Even the most bearish looking stocks can rally in January
when tax-loss selling comes to an abrupt end. Gold is tempting.
It has shown a pattern of rallying
in January when it has previously been weak. But with interest rates
on the rise, its upside
may be more limited.
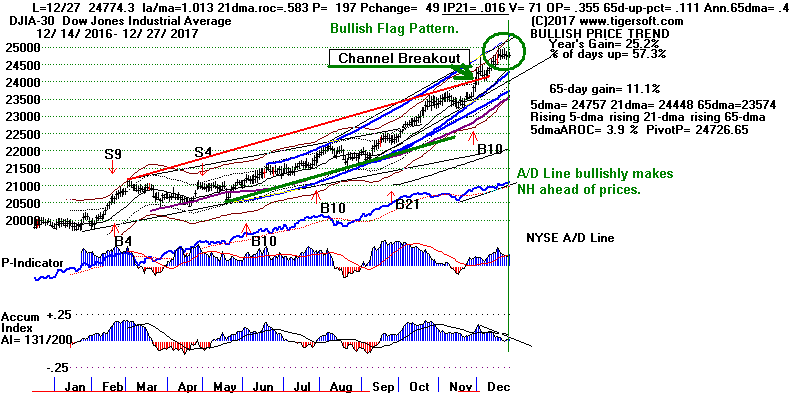
Rising Short Term Rates
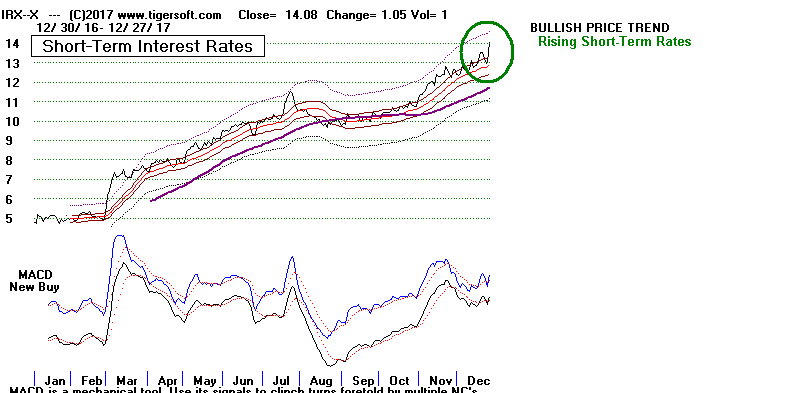
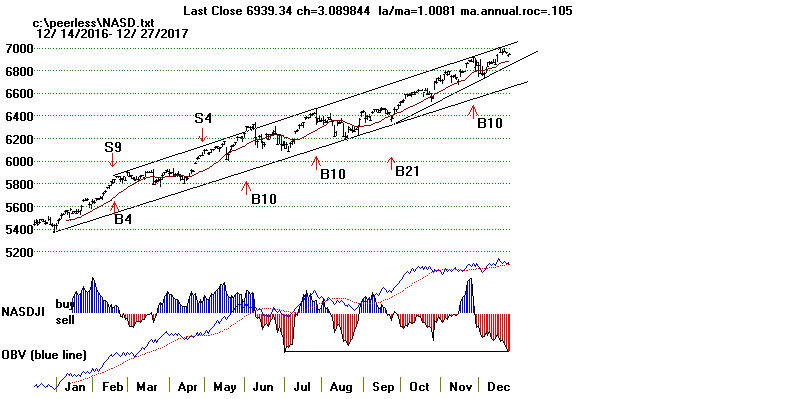
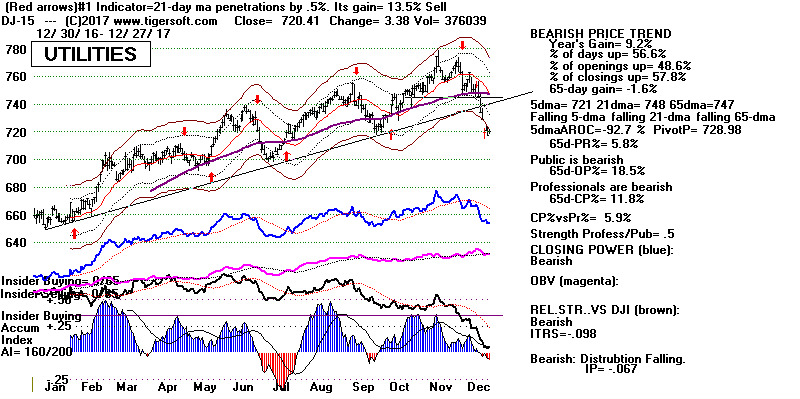
Charts 12/27/2017
PEERLESS
DJI, Signals, Indicators Daily
DJI Volume 10-DayUp/Down Vol
V-Indicator
Hourly DJIA
A/D Line for All
Stocks
NASDAQ
S&P
OEX
NYSE COMPQX
DJI-15 DJI-20
DJI-30
DIA
SPY
QQQ MDY
IWM
TNA
CrudeOil
FAS
GLD
BBH
IBB
JETS
JNUG
KOL
NUGT
OIH
OIL
RSX
RETL
SDS
SLV
SOXL
TECL
TMF
TNA UGA
(gasoline)
XIV
YINN
Commodities:
JJC, NIB,
CHOC
CORN,
WEAT
UUP
(Dollar)
AAPL ADBE
ALXN
AMAT
AMGN AMD
AMZN
BA BABA BAC
BIDU
CAT
CVX
FB
GOOG
GS
HD
IBM JPM M
(Macy's)
MSFT NFLX
NVDA
QCOM TSLA
TXN
XOM
WMT
ANDV (refinery),
CMG (Chipotle), LRCX,
SWKS,
TOWN
New SPPI
(small Biotech)
12/27/2017
Bullish MAXCPs
Bearish
MINCPs
|
TABLE 1 QUICKSILVER on ETFS - 12/27/17
ETF      CLOSE     CHANGE    PIVOT-PT    5-dma AROC  CLOS-PWR    CANDLE  IP21     ITRS
---------------------------------------------------------------------------------------------
---------------------------------------------------------------------------------------------
DIA       247.48    .23      247.07        1.6%      Bearish      BLUE  -.008     0
---------------------------------------------------------------------------------------------
COMPQX    6939.34    3.09   W6960.96      -17.6%     Bearish      RED   -.027    -.031
---------------------------------------------------------------------------------------------
SPY       267.32    .13      267.03        2.8%      Bearish      ----  -.018    -.031
---------------------------------------------------------------------------------------------
QQQ       156.54    .02      157.53       -36.9%     Bearish       ----   .039    -.027
---------------------------------------------------------------------------------------------
MDY       345.98   -.13      345.16        20%       Bearish      BLUE  -.151    -.032
---------------------------------------------------------------------------------------------
IWM       153.13   -.15     W153.38        1.6%      Bearish      RED   -.142    -.053
---------------------------------------------------------------------------------------------
FAS       68.39    .29       67.5          10.3%     Bearish      BLUE  -.101     .083
---------------------------------------------------------------------------------------------
RETL      36.97   -1.4       36.45         116.5%    ----         RED    .392     .395
---------------------------------------------------------------------------------------------
SOXL      141.26    1.41     149.22       -169.3%    Bearish      BLUE  -.034    -.004
---------------------------------------------------------------------------------------------
TECL      113.75    .39     -116.75       -129.6%    ----         BLUE   .055     .095
---------------------------------------------------------------------------------------------
IBB       107.59    .15      106.66        69.3%     Bullish      BLUE   .051    -.12
---------------------------------------------------------------------------------------------
GLD       122.23    .46      120.14        99.9%     Bullish      BLUE   .155    -.085
---------------------------------------------------------------------------------------------
OIL       6.46   -.03        6.23          238.6%    ----         ----   .092     .113
---------------------------------------------------------------------------------------------
OIH       26.05   -.02       25            324.9%    Bullish      ----   .091    -.037
---------------------------------------------------------------------------------------------
GASL      25.33   -.47       22.24         918.7%    Bullish      RED   -.091     .068
---------------------------------------------------------------------------------------------
UGA       31.93    .08       31.11         230.8%    ----         BLUE  -.115     .03
---------------------------------------------------------------------------------------------
UUP       24.2   -.05       W24.27        -20.6%     Bearish      ----  -.062    -.08
---------------------------------------------------------------------------------------------
IEF       105.53    .45      105.09        6.2%      Bullish      BLUE   .113    -.089
---------------------------------------------------------------------------------------------
CORN      16.86    .06       16.67         71.7%     Bullish      BLUE  -.086    -.112
---------------------------------------------------------------------------------------------
WEAT      5.98    .05        5.94          59%       ----         ----  -.106    -.147
---------------------------------------------------------------------------------------------
YINN      33.17   -.45       31.41         243.3%    ----         ----   .057    -.093
---------------------------------------------------------------------------------------------
RSX       21.2   -.11        20.78         95.4%     ----         RED   -.126    -.138
---------------------------------------------------------------------------------------------
AAPL      170.6    .03      W174.35       -113.3%    Bullish      BLUE   .079    -.012
---------------------------------------------------------------------------------------------
GOOG      1049.37   -7.37   W1064.95      -100.2%    ----         RED   -.05    -.021
---------------------------------------------------------------------------------------------
MSFT      85.71    .31       85.52        -7%        Bearish      BLUE   .051     .025
---------------------------------------------------------------------------------------------
AMZN      1182.26    5.5     1177.62      -21.8%     Bearish      BLUE  -.003     .096
---------------------------------------------------------------------------------------------
FB        177.62    1.63    W177.89       -53.2%     Bearish      BLUE  -.075    -.061
---------------------------------------------------------------------------------------------
NVDA     197.17   -.27       196.8         27%       ----         BLUE  -.009    -.082
---------------------------------------------------------------------------------------------
BA        295.62    .26     W297.9        -27.5%     ----         RED   -.052     .06
---------------------------------------------------------------------------------------------
GS        255.95   -1.77     255.18       -10.3%     Bearish      RED   -.08    -.023
---------------------------------------------------------------------------------------------
HD        190.19   -.17      187.31        112%      Bullish      RED    .139     .08
---------------------------------------------------------------------------------------------
CAT        157.52    1.08    152.52        214.5%    Bullish      BLUE   .291     .12
|
Table 2
COMPARISONS OF BULLISH AND
BEARISH GROUPS
12/27 12/26 12/22 12/21 12/20
12/19 12/18 12/15 12/14
12/13 12/12 12/11 12/8
12/7 12/6 12/5 12/4
12/1 11/30 11/29
NEWHIGHS 253 308
262 317
247 210 553 309 103 268 223 234
288 159 91 107 340 197 536
500
NEWLOWS 21 26 32 45 50 45 43 49 56 25 52 41 37 50
65 53 37 16 31 57
------------------------------------------------------------------------------------------------------------------------------------------------------------------------------------------------
MAXCPs
97
105 70 81 60 60 133
122
53 123
83
84
90 90 50 42 92 105
266 262
MINCPs 74 70 74
81 127 117
76
65 142
67 99
75 93
73 141 135 152
93 80 110
------------------------------------------------------------------------------------------------------------------------------------------------------------------------------------------------
TTTNHs
97 103
72
89
65 71
146 118
75
110
72 73 76 75 46
44
72
53 139
161
TTTNLs
93 114
147 121
187 129 90 98 192 99
161 155 177 109 219 248
402 286 162 230
-------------------------------------------------------------------------------------------------------------------------------------------------------------------------------------------------
FASTUP
179
195
222 238
143 172
166 126 123 175
101 108
96
80
79
95
180 126
128 130
FASTDOWN
56 70 60
63 78 183 96 125 109 91
132 134 169 195 233 248 210 156
123 97 |
Table 3
Count of Stocks and New Highs in Key Tiger Directories
Date = 171227
               No.          NHs            Pct
-------------------------------------------------------------------
-------------------------------------------------------------------
TRANSP         20            6             30 %
BEVERAGE       20            5             25 %
INFRA          11            2             18 %
BIGMIL         6             1             17 %
COMODITY       70            12            17 %
DJI-13         13            2             15 %
INDEXES        195           30            15 %
-------------------------------------------------------
EDU            7             1             14 %
INSURANC       32            4             13 %
FOOD           15            2             13 %
HOMEBLDG       17            2             12 %
INDMATER       92            10            11 %
DOWJONES       30            3             10 %
SP-100         96            10            10 %
MORNSTAR       238           21            9 %
OILGAS         142           12            8 %
BIOTECH        386           27            7 %
SP500          485           36            7 %
RUS-1000       837           61            7 %
CHEM           64            4             6 %
RETAIL         53            3             6 %
MILITARY       38            2             5 %
NASD-100       100           5             5 %
CHINA          64            3             5 %
SOLAR          21            1             5 %
GAMING         28            1             4 %
GOLD           50            2             4 %
GREEN          31            1             3 %
FINANCE        93            3             3 %
NIFTY          30            1             3 %
ETFS           65            2             3 %
SEMI           130           2             2 %
SOFTWARE       66            1             2 %
ELECTRON       178           2             1 %
REIT           178           2             1 %
BONDFUND       111           1             1 %
|
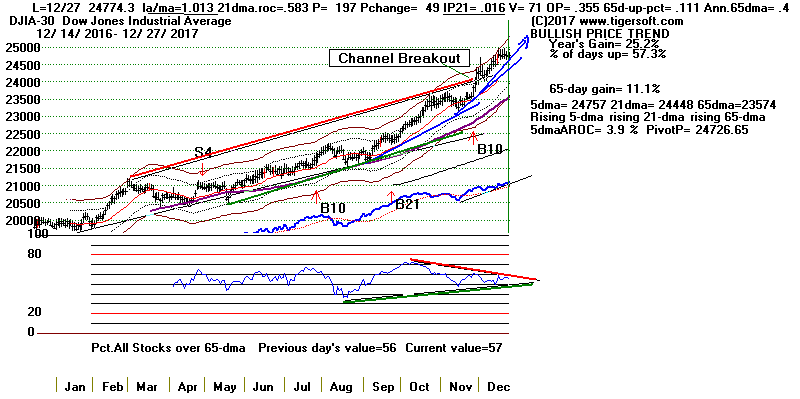 |
Table 4 RANKING OF KEY DIRECTORIES BASED PCT.OF STOCKS ABOVE 65-DMA
             12/27/17
---------------------------------------------------------------------------------------
Directory     Current       day-1         day-2         day-3         day-4         day-5
----------------------------------------------------------------------------------------
DJI-13         1             1             1             1             1             1
INFRASTRUCTURE 1             1             1             .909          .727          .727
JETS           1             1             1             1             1             1
TRANSP         1             1             1             1             1             1
DOWJONES       .933          .9            .9            .9            .933          .933
BIGBANKS       .857          .857          .857          .857          .857          .857
MORNSTAR       .844          .836          .836          .836          .81           .806
BIGMIL         .833          .833          .833          .833          .833          .833
INDEXES        .83           .774          .753          .723          .692          .676
SP-100         .822          .812          .812          .833          .822          .812
RETAIL         .811          .849          .811          .792          .792          .792
N = 11
--------------------------------------------------------------------------------------------
HOMEBLDG       .764          .705          .705          .764          .647          .647
BEVERAGE       .75           .7            .65           .7            .75           .75
SP500          .731          .734          .738          .74           .727          .725
RUS-1000       .714          .709          .709          .714          .71           .706
FINANCE        .709          .774          .795          .86           .763          .806
GOLD           .7            .66           .54           .38           .36           .26
MILITARY       .684          .71           .736          .736          .71           .736
OILGAS         .647          .669          .633          .633          .521          .464
GAMING         .642          .678          .678          .642          .714          .678
NASD-100       .64           .64           .65           .68           .68           .66
NIFTY          .633          .6            .633          .666          .666          .666
INDMATER       .63           .619          .608          .586          .608          .597
COAL           .6            .6            .6            .6            .5            .6
HACKERS        .6            .6            .6            .6            .64           .68
CHEM           .593          .593          .562          .593          .593          .578
COMODITY       .585          .585          .528          .5            .485          .428
ETFS           .584          .584          .63           .569          .492          .523
GREEN          .58           .58           .645          .645          .645          .612
SOFTWARE       .575          .575          .59           .636          .636          .651
EDU            .571          .714          .714          .714          .714          .714
REGBANKS       .545          .606          .666          .757          .696          .696
AUTO           .538          .564          .512          .641          .769          .589
INSURANC       .531          .531          .5            .531          .5            .562
N = 23
============================================================================================
CHINA          .5            .531          .609          .562          .5            .484
COMPUTER       .5            .5            .545          .545          .59           .545
HOSPITAL       .5            .5            .5            .5            .5            .5
============================================================================================
BIOTECH        .487          .466          .474          .458          .43           .424
REIT           .46           .443          .393          .382          .376          .421
ELECTRON       .455          .455          .511          .544          .567          .539
SOLAR          .428          .428          .476          .476          .523          .476
SEMI           .4            .384          .476          .492          .523          .492
FOOD           .266          .333          .2            .266          .2            .133
UTILITY        .209          .186          .186          .209          .209          .255
BONDFUND       .18           .09           .081          .09           .036          .081
PIPELINE       .142          .285          .142          .142          .142          .142
N=9
|
==============================================================================
==============================================================================
12/26/2017.
A lot of shifting in and out of sectors is taking
place while the market
appears to be quietly sitting still in slow holiday trading. The shift
out of tech stocks will probably increase as we go into the new year.
Infrastructure, Mining, Metals and Heavy Industry Stocks are winning
new favor. The Trump Administration may be preparing a new plan
to spur infrastructure investment and spending.
The September
Buy B21 still operates and predicts
higher prices. The DJI's
narrow price pattern looks like a FLAG. The low volume today fits that
interpretation.
So, despite the falling 5-day moving averages and Closing Powers for
DIA, SPY, FAS,
TECL and SOXL,
there may soon be an upside surprise. But first these ETFs need to
close above their 5-day ma pivot-points. And to go significantly
higher, Professionals
will have to show themselves to be buyers by having any price breakout be
extended.
We will need to see that happen to become bullish for January.
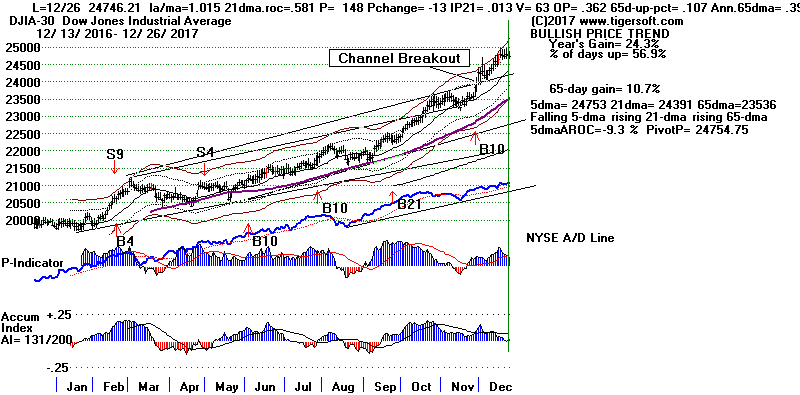
Interest Rates are almost certain to rise. Perhaps, much faster
than the Fed and stock investors want. This is the message the
Utilities' head/shoulders offers us now.
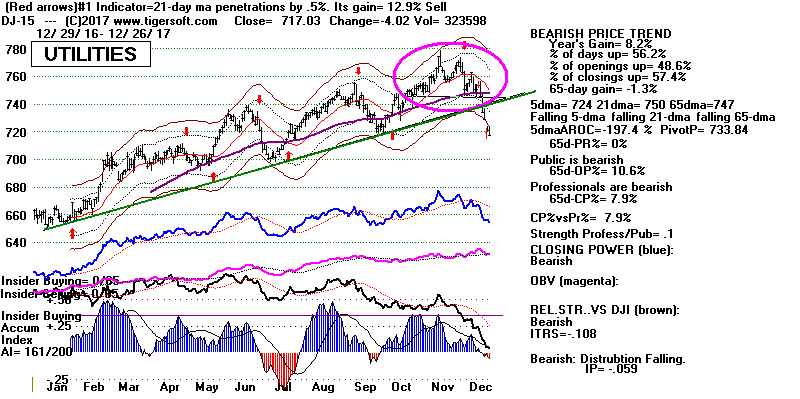
The Dollar is now below its 65-dma and seems to
be trying to digest what will happen
if the Federal deficit mushrooms because of the huge tax-cut. The
weakness in Utilities reflects
this, as does the new highs made by Oil and Gold's rising back above its
65-dma. The
big winners today were Infrastructure stocks like
CAT and DE. But note below, too, the new
highs made by the Dow Jones Coal and Morningside Sectors: Iron Ore and Steel
and
Copper Sectors. Next year Congress and the President will turn to
Infrastructure spending.
The President knows very well that he owes his election to folks in the
rust-belt states, West Va.
PA, Ohio, Michigan and Wisconsin. I would expect a lot more
investment funds to be put to work
in much neglected heavy industry and infrastructure sectors. Some of
the money will surely will
come out of the investment sectors that have been leading the long advance,
especially high techs
and the nifty-30 stocks. Profit-taking in TECL and
SOXL stocks must be
expected in the new year,
at least, for so long as their Closing Powers are falling. Further
below, see the head and shoulders
patterns in Fidelity's Computer Sector Fund and in Morningside' Electronic
Equipment Fund. These
are warnings that we must be flexible and recognize trend-changes as they
develop.
(I am having trouble identifying the components for this Coal Index. It must
be
ARCH and
BTU, which I have added to the
MAXCPs tonight.)
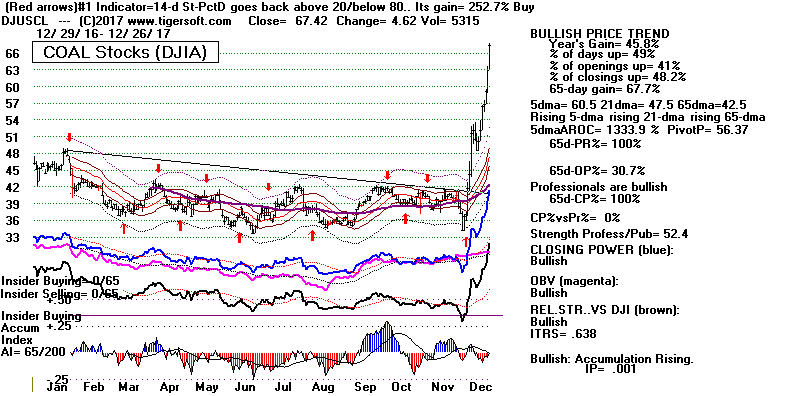
Charts 12/26/2017
PEERLESS
DJI, Signals, Indicators Daily
DJI Volume 10-DayUp/Down Vol
V-Indicator
Hourly DJIA
A/D Line for All
Stocks
NASDAQ
S&P
OEX
NYSE COMPQX
DJI-15 DJI-20
DJI-30
DIA
SPY
QQQ MDY
IWM
TNA
CrudeOil
FAS
GLD
BBH
IBB
JETS
JNUG
KOL
NUGT
OIH
OIL
RSX
RETL
SDS
SLV
SOXL
TECL
TMF
TNA UGA
(gasoline)
XIV
YINN
Commodities:
JJC, NIB,
CHOC
CORN,
WEAT
UUP
(Dollar)
AAPL ADBE
ALXN
AMAT
AMGN AMD
AMZN
BA BABA BAC
BIDU
CAT
CVX
FB
GOOG
GS
HD
IBM JPM M
(Macy's)
MSFT NFLX
NVDA
QCOM TSLA
TXN
XOM
WMT
ANDV (refinery),
CMG (Chipotle), LRCX,
SWKS,
TOWN
New DE SPPI
(small Biotech)
12/26/2017
Bullish MAXCPs
Bearish
MINCPs
|
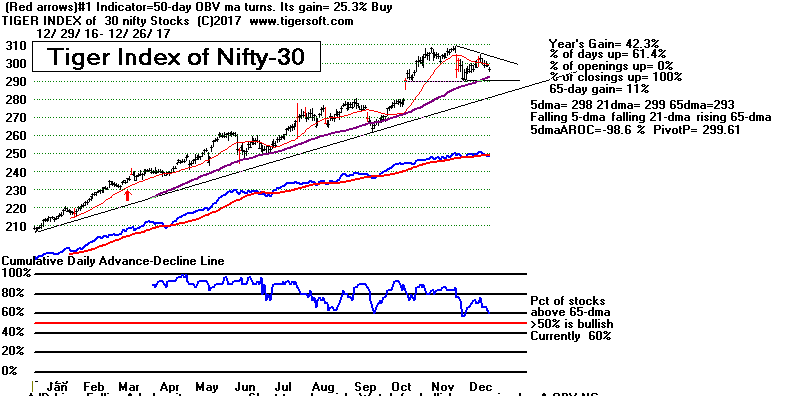 |
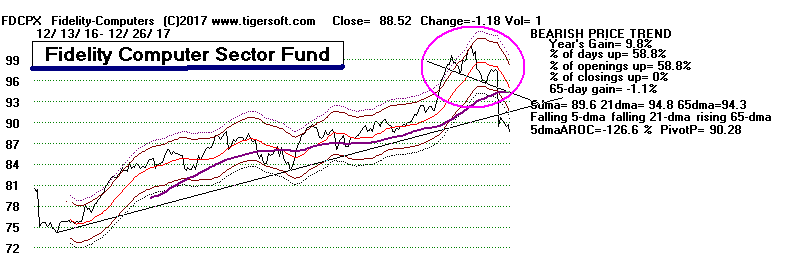
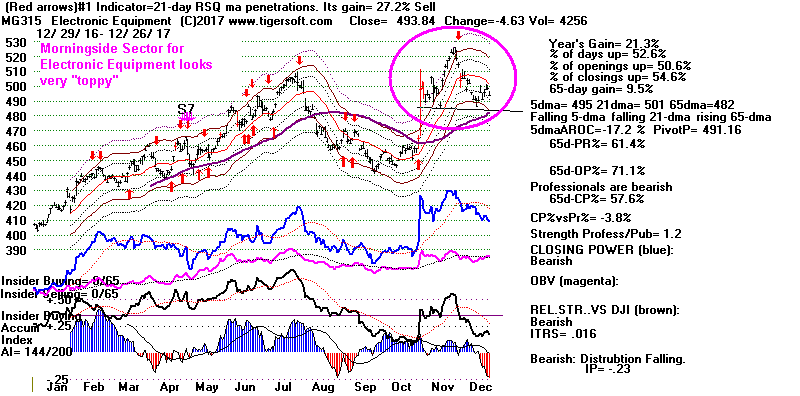 |
Table 1
QuickSilver
Documentation
This is for short-term trading
leveraged ETFs.
It also provides a useful short-term outlook
of these sectors ETF's and the sectors they represewnt
Blue is
Bullish and
Red is Bearish.
1 Candle-Stick color is shortest-term. This
changes when close vis-a-vis opening changes.
So, in stocks or ETFs that advanced a long
ways, traders should sell when a higher
opening gives way to a decline that brings
a drop below the previous day's close.
2 5-dma AROC and Close-versus- pivot point is
next most short-term.
W = warning. Close is below
PIVOT-Point.
3 Closing Power trend-direction vs. its 21-dma
is next most short-term.
4 IP21 is used to spot divergences and to
estimate underlying support.
5 > IP21 falling and below +.15 and its 21-dma
is bearish in an over-extended ETF, especially
when its Closing Power is falling and is
below its 21-dma.
> IP21 below 07 with AROC below .07 is less
likely to bring a rally back up from 21-dma.
6 Note price trend-lines, support/resistance
and price patterns on charts.
QUICKSILVER on ETFS - 12/26/17
ETF      CLOSE   CHANGE     PIVOT-PT   5-dma AROC  CLOS-PWR    CANDLE  IP21     ITRS
---------------------------------------------------------------------------------------------
---------------------------------------------------------------------------------------------
DIA       247.25   -.15     W247.4        -10.9%   Bearish      BLUE  -.026     0
---------------------------------------------------------------------------------------------
COMPQX    6936.25   -23.71  W6963.85      -42%     Bearish      BLUE  -.009    -.031
---------------------------------------------------------------------------------------------
SPY       267.19   -.32      267.17       -18.9%   Bearish       BLUE  -.025    -.033
---------------------------------------------------------------------------------------------
QQQ       156.52   -.85     W157.7        -67.2%   Bearish       ----   .054    -.026
---------------------------------------------------------------------------------------------
MDY       346.11    .17      344.6         1.2%    Bearish      BLUE  -.164    -.034
---------------------------------------------------------------------------------------------
IWM       153.28    .09      153.08       -33.2%   Bearish      BLUE  -.158    -.055
---------------------------------------------------------------------------------------------
FAS       68.1   -.28       W68.25        -123.4%  Bearish       RED   -.135     .084
---------------------------------------------------------------------------------------------
RETL      38.37    1.48      36.11         204.9%  Bullish      BLUE   .378     .42
---------------------------------------------------------------------------------------------
SOXL      139.85   -4.16    W146.16       -238.2%  Bearish       BLUE  -.06    -.002
---------------------------------------------------------------------------------------------
TECL      113.36   -2.32    W116.75       -245.6%  Bearish       BLUE   .067     .101
---------------------------------------------------------------------------------------------
IBB       107.44    .5       106.11        50.7%   Bullish      BLUE   .027    -.123
---------------------------------------------------------------------------------------------
GLD       121.77    .83      119.82        84.9%   Bullish      BLUE   .118    -.098
---------------------------------------------------------------------------------------------
OIL       6.49    .21        6.16          297.8%   ----        BLUE   .089     .132
---------------------------------------------------------------------------------------------
OIH       26.07    .35       24.4          347.4%  Bullish      BLUE   .081    -.041
---------------------------------------------------------------------------------------------
GASL      25.8    1.51       21.02         1076%   ----         BLUE  -.113     .085
---------------------------------------------------------------------------------------------
UGA       31.85    .54       30.49         282%    ----         BLUE  -.119     .023
---------------------------------------------------------------------------------------------
UUP       24.25   -.02      W24.3         -24.7%   Bearish      ----  -.013    -.078
---------------------------------------------------------------------------------------------
IEF       105.08    .04     W105.4        -38%     Bullish      ----   .09    -.098
---------------------------------------------------------------------------------------------
CORN      16.8   -.01        16.62         65.9%   ----         ----  -.118    -.122
---------------------------------------------------------------------------------------------
WEAT      5.93   -.01        5.91          25.3%   Bearish       ----  -.179    -.166
---------------------------------------------------------------------------------------------
YINN      33.62   -.06        ER   -.076
---------------------------------------------------------------------------------------------
RSX       21.31    .2        20.8          52.6%    ----        BLUE  -.148    -.136
---------------------------------------------------------------------------------------------
AAPL      170.57   -4.44    W174.54       -167.1%  Bullish      RED    .05     .006
---------------------------------------------------------------------------------------------
GOOG      1056.74   -3.38   W1070.68      -95.6%   Bullish      RED    .015    -.013
---------------------------------------------------------------------------------------------
MSFT      85.4   -.11       W85.83        -57.1%   Bearish       BLUE   .065     .021
---------------------------------------------------------------------------------------------
AMZN      1176.76    8.4    W1187.38      -58.6%   Bearish       BLUE  -.057     .092
---------------------------------------------------------------------------------------------
FB        175.99   -1.21    W179.51       -135.2%  Bearish      RED   -.074    -.068
---------------------------------------------------------------------------------------------
NVDA     197.44    2.17      196.11       -11.7%   ----         BLUE  -.027    -.066
---------------------------------------------------------------------------------------------
BA        295.36    .26     W297.25       -13.2%   ----         RED   -.053     .052
---------------------------------------------------------------------------------------------
GS        257.72   -1.25     256.48       -44.5%   Bearish      RED   -.085    -.001
---------------------------------------------------------------------------------------------
CAT        156.44    .69     150.91        218.4%  Bullish      BLUE   .25     .116
|
Table 2
COMPARISONS OF BULLISH AND
BEARISH GROUPS
12/26 12/22 12/21 12/20 12/19
12/18 12/15 12/14 12/13
12/12 12/11 12/8
12/7 12/6 12/5 12/4
12/1 11/30 11/29 11/28
NEWHIGHS
308
262 317
247 210 553 309 103 268 223 234
288 159 91 107 340 197 536
500 582
NEWLOWS
26 32 45 50 45 43 49 56 25 52 41 37 50
65 53 37 16 31 57 265
------------------------------------------------------------------------------------------------------------------------------------------------------------------------------------------------
MAXCPs
105 70 81 60 60 133
122
53 123
83
84
90 90 50 42 92 105
266 262 320
MINCPs
70 74
81 127 117
76
65 142
67 99
75 93
73 141 135 152
93 80 110 93
------------------------------------------------------------------------------------------------------------------------------------------------------------------------------------------------
TTTNHs
103
72
89
65 71
146 118
75
110
72 73 76 75 46
44
72
53 139
161
143
TTTNLs
114
147 121
187 129 90 98 192 99
161 155 177 109 219 248
402 286 162 230
124
-------------------------------------------------------------------------------------------------------------------------------------------------------------------------------------------------
FASTUP
195
222 238
143 172
166 126 123 175
101 108
96
80
79
95
180 126
128 130
141
FASTDOWN
70 60
63 78 183 96 125 109 91
132 134 169 195 233 248 210 156
123 97 74
|
Table 3
Count of Stocks and New Highs in Key Tiger
Directories
Date = 171226
No. NHs
Pct
-------------------------------------------------------------------
-------------------------------------------------------------------
JETS
9
3
33 %
COAL
10
3
30%
INFRA
11
3
27 %
COMODITY
70
19
27 %
RETAIL
53
14
26 %
DJI-13
13
3
23 %
TRANSP
20
4
20 %
HOMEBLDG 17
3
18 %
INDMATER
92
17
18 %
OILGAS
142 22
15 %
BEVERAGE
20
3
15 %
--------------------------------------------------------
MORNSTAR 238
33
14 %
INDEXES
195 22
11 %
DOWJONES
30
3
10 %
CHEM
64
6
9 %
INSURANC
32
3
9 %
SP500
485 40
8 %
RUS-1000
837 68
8 %
BIOTECH
386 28
7 %
FOOD
15
1
7 %
SP-100
96
6
6 %
CHINA
64
4
6 %
MILITARY
38
2
5 %
ETFS
65
3
5 %
FINANCE
93
4
4 %
HACKERS
25
1
4 %
NASD-100 100
4
4 %
GOLD
49
2
4 %
GREEN
31
1
3 %
AUTO
40
1
3 %
NIFTY
30
1
3 %
ELECTRON 178
4
2 %
SEMI
130 2
2 %
SOFTWARE 66
1
2 %
REIT
178 3
2 %
-------------------------------------------------------
None: BIGBANKS BIGMIL
REGBANKS GAMING
SOLAR COMPUTER EDU
UTILITY PIPELINE
BONDFUND HOSPITAL |
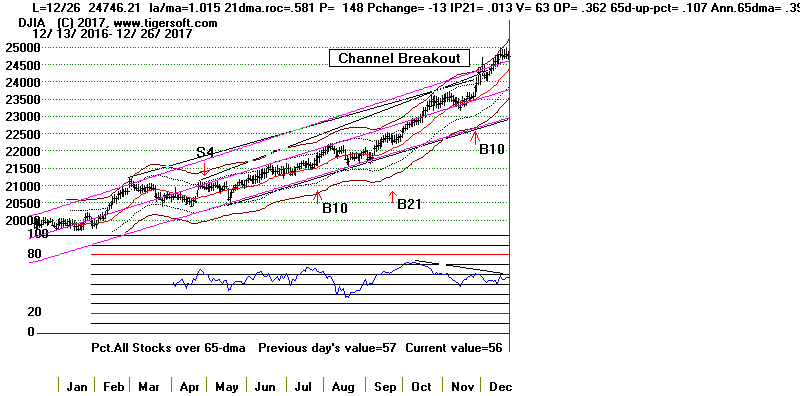 |
Table 5 RANKING OF KEY DIRECTORIES BASED PCT.OF STOCKS ABOVE 65-DMA
12/26/17
Bullish = 32
Bearish = 9
---------------------------------------------------------------------------------------
Directory Current day-1 day-2 day-3 day-4 day-5
----------------------------------------------------------------------------------------
DJI-13 1 1 1 1 1 1
INFRA 1 1 .909 .727 .727 .909
JETS 1 1 1 1 1 1
TRANSP 1 1 1 1 1 1
DOWJONES .9 .9 .9 .933 .933 .933
BIGBANKS .857 .857 .857 .857 .857 .857
RETAIL .849 .811 .792 .792 .792 .792
MORNSTAR .836 .836 .836 .81 .806 .852
BIGMIL .833 .833 .833 .833 .833 .833
SP-100 .812 .812 .833 .822 .812 .812
N=10
================================================================================================
FINANCE .774 .795 .86 .763 .817 .838
INDEXES .774 .753 .723 .692 .682 .702
SP500 .734 .738 .74 .727 .725 .756
EDU .714 .714 .714 .714 .714 .714
MILITARY .71 .736 .736 .71 .736 .736
RUS-1000 .709 .709 .714 .71 .708 .74
HOMEBLDG .705 .705 .764 .647 .647 .705
BEVERAGE .7 .65 .7 .75 .75 .7
GAMING .678 .678 .642 .714 .678 .714
OILGAS .669 .633 .633 .521 .464 .464
GOLD .653 .53 .367 .346 .244 .204
N=11
================================================================================================
NASD-100 .64 .65 .68 .68 .66 .69
INDMATER .619 .608 .586 .608 .597 .586
REGBANKS .606 .666 .757 .696 .696 .787
HACKERS .6 .6 .6 .64 .68 .68
NIFTY .6 .633 .666 .666 .666 .733
CHEM .593 .562 .593 .593 .578 .593
COMODITY .585 .528 .5 .485 .428 .4
ETFS .584 .63 .569 .492 .523 .63
GREEN .58 .645 .645 .645 .612 .645
AUTO .575 .525 .65 .775 .675 .65
SOFTWARE .575 .59 .636 .636 .651 .651
CHINA .531 .609 .562 .5 .484 .437
INSURANC .531 .5 .531 .5 .562 .593
N=13
===============================================================================================
COAL .5 .5 .5 .375 .5 .5
COMPUTER .5 .545 .545 .59 .545 .59
HOSPITAL .5 .5 .5 .5 .5 .5
===============================================================================================
BIOTECH .466 .474 .458 .43 .419 .406
ELECTRON .455 .511 .544 .567 .55 .606
REIT .443 .393 .382 .376 .415 .674
SOLAR .428 .476 .476 .523 .523 .523
SEMI .384 .476 .492 .523 .5 .576
FOOD .333 .2 .266 .2 .133 .133
PIPELINE .285 .142 .142 .142 .142 .142
UTILITY .186 .186 .209 .209 .255 .465
BONDFUND .09 .081 .09 .036 .081 .153
N=9
|
==============================================================================
12/22/2017. The September
Buy B21 still operates and predicts
higher prices. The
main ETFs' Closing Powers, however, are not rising and their IP21s
(Accumulation
Index) are mostly negative. From Table 1 below, you can also see that
most of the major ETFs, higher priced DJI-30 and tech stocks are also below
their 5-dma
pivot points. This would seem to put a limit on the potential of the market
to rally just
now despite the
bullishness normally associated
with this time of the year.
Note that we are not likely to get a Sell S16 later this weak even though
Santa Claus appears
a wee bit tired. This is because the V-Indicator would need to drop
back to +4. The V-I is
now +60. Any sell in here is very
likely to come on strength in January.
What has happened in the past when the DJI
was 1.7%-1.9% over the
21-dma and showed a
low IP21?
The IP21 now is only .012. The answer is that only once did it quickly
turn down.
That was the most recent case in 2014. In 6 cases, the DJI peaked in
January, 3 times the rally
stopped in March and once the DJI got to April before falling back to the
lower band. So,
without a Peerless Sell signal, it seems reasonable to expect a rally beyond
the year's end. While
there no doubt will be new money coming into the market with the start of
the year, I would
expect considerable profit-taking because the new tax bill makes that more
advantageous. So,
we have to be on guard if the market's internals do not improve.
       What has happened in the past when the DJI was 1.7%-1.9%
       over the 21-dma and showed a low IP21, as now?

               Date          DJI           LA/MA        P-I            IP21
              --------       ----          -----        -----          ----
 1            19321230       60.3          1.018        -31.6          .011
              DJI rallied to 64.4 on 1/10/1933 and then fell sharply to 50.2 on 2/27/32.
----------------------------------------------------------------------------------
 2            19341228       103.2         1.016         .7           -.062
              DJI rallied to 105.9 on 1/7/1935 and then fell back to LB,at 100.7
on 2/5/1935.
----------------------------------------------------------------------------------
 3            19351231       144.1         1.016         15.9         -.132
              DJI rallied to 161.9 on 4/6/1936 and then fell back below LB to 143.7
on 4/29/1936
----------------------------------------------------------------------------------
 4            19731226       837.56        1.019        -147.9        -.014
              DJI rallied to 880.69 on 1/3/1974 and then fell back to 803.9 on
2/11/1974
----------------------------------------------------------------------------------
 5            19801226       966.38        1.019        -121.9        -.049
              DJI rallied to 1004.69 on 1/6/1981 and then fell back to 932.25 on
2/2/1981
----------------------------------------------------------------------------------
 6            19841226       1208.92       1.016        -5.8          -.019
              DJI rallied to 1299.36 on 3/1/1985 and then fell back to 1242.05
on 5/1/1985.
----------------------------------------------------------------------------------
 7            19961226       6546.68       1.017        -10.4         -.009
              DJI rallied to 7079.39 on 3/10/1996 and then fell back to 6391.69
on 4/11/1997.
----------------------------------------------------------------------------------
 8            19991230       11452.86      1.019        -193.1        -.056
              DJI rallied to 11722.98 on 1/14/1999 and then fell back to 9796.03
on 3/7/2000.
----------------------------------------------------------------------------------
 9            20001227       10803.16      1.017         201.3        -.009
              DJI rallied to 10945.75 on 1/3/2001 and then fell back to 9389.48
on 3/22/2001.
----------------------------------------------------------------------------------
 10           20111229       12287.04      1.018         253.7         .011
              DJI rallied to 13252.76 on 3/15/2012 and then fell back to 12118.57
on 6/1/2012.
----------------------------------------------------------------------------------
 11           20141226       18053.71      1.018         50.5         -.004
              DJI rallied no further despite there being no Peerless Sell signal.
              It fell back to 17154.95 on 1/30/2015.
              After that, it then rallied to 18288.63 on 3/2/2015.
----------------------------------------------------------------------------------
Now           20121222       24754.06      1.017         160           .012
|
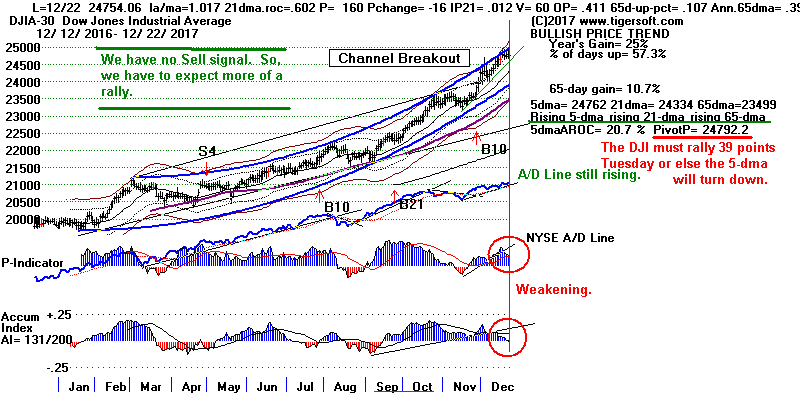
Charts 12/22/2017
PEERLESS
DJI, Signals, Indicators Daily
DJI Volume 10-DayUp/Down Vol
V-Indicator
Hourly DJIA
A/D Line for All
Stocks
NASDAQ
S&P
OEX
NYSE COMPQX
DJI-15 DJI-20
DJI-30
DIA
SPY
QQQ MDY
IWM
TNA
CrudeOil
FAS
GLD
BBH
IBB
JETS
JNUG
KOL
NUGT
OIH
OIL
RSX
RETL
SDS
SLV
SOXL
TECL
TMF
TNA UGA
(gasoline)
XIV
YINN
Commodities:
JJC, NIB,
CHOC
CORN,
WEAT
UUP
(Dollar)
AAPL ADBE
ALXN
AMAT
AMGN AMD
AMZN
BA BABA BAC
BIDU
CAT
CVX
FB
GOOG
GS
HD
IBM JPM M
(Macy's)
MSFT NFLX
NVDA
QCOM TSLA
TXN
XOM
WMT
ANDV (refinery),
CMG (Chipotle), LRCX,
SWKS,
TOWN
New - SPPI
(small Biotech)
12/22/2017
Bullish MAXCPs
Bearish
MINCPs
|
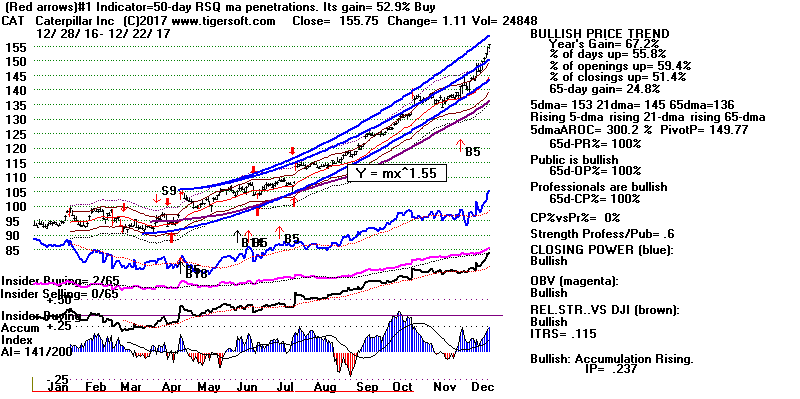 |
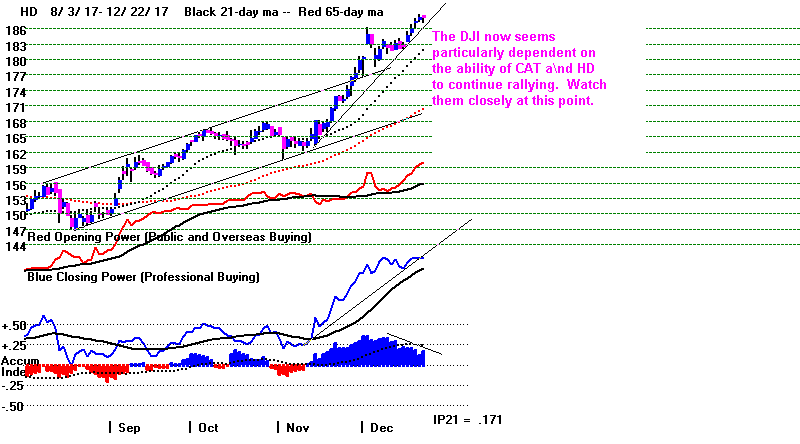 |
Table 1
QuickSilver
Documentation
This is for short-term trading
leveraged ETFs.
It also provides a useful short-term outlook
of these sectors ETF's and the sectors they represewnt
Blue is
Bullish and
Red is Bearish.
1 Candle-Stick color is shortest-term. This
changes when close vis-a-vis opening changes.
So, in stocks or ETFs that advanced a long
ways, traders should sell when a higher
opening gives way to a decline that brings
a drop below the previous day's close.
2 5-dma AROC and Close-versus- pivot point is
next most short-term.
W = warning. Close is below
PIVOT-Point.
3 Closing Power trend-direction vs. its 21-dma
is next most short-term.
4 IP21 is used to spot divergences and to
estimate underlying support.
5 > IP21 falling and below +.15 and its 21-dma
is bearish in an over-extended ETF, especially
when its Closing Power is falling and is
below its 21-dma.
> IP21 below 07 with AROC below .07 is less
likely to bring a rally back up from 21-dma.
6 Note price trend-lines, support/resistance
and price patterns on charts.
QUICKSILVER on ETFS - 12/22/17
ETF      CLOSE   CHANGE     PIVOT-PT   5-dma AROC  CLOS-PWR    CANDLE  IP21     ITRS
---------------------------------------------------------------------------------------------
---------------------------------------------------------------------------------------------
DIA       247.4   -.26      W247.79        23.3%   Bearish      RED   -.041     ----
---------------------------------------------------------------------------------------------
COMPQX    6959.96   -5.4    W6994.76       16.8%   Bearish      BLUE  -.008    -.028
---------------------------------------------------------------------------------------------
SPY       267.51   -.07     W268.2         18.7%   Bearish      RED   -.023    -.033
---------------------------------------------------------------------------------------------
QQQ       157.37   -.18     W158.64       -8.9%    Bearish      BLUE   .05    -.019
---------------------------------------------------------------------------------------------
MDY       345.94    .01     W346.03        50.3%   Bearish      BLUE  -.171    -.038
---------------------------------------------------------------------------------------------
IWM       153.19   -.28     W154.3         31%     Bearish      RED   -.173    -.06
---------------------------------------------------------------------------------------------
FAS       68.38   -.1       W69.79         1.5%    Bearish      RED   -.139     .088
---------------------------------------------------------------------------------------------
RETL      36.89    .21       36.87         388.5%   ----        BLUE   .158     .368
---------------------------------------------------------------------------------------------
SOXL      144.01   -.38     W146.81        223.4%  Bearish      BLUE  -.053     .05
---------------------------------------------------------------------------------------------
TECL      115.68   -.35     W119.1        -18.4%   Bearish      BLUE   .063     .139
---------------------------------------------------------------------------------------------
IBB       106.94    .14      106.36        16%     ----         BLUE   .01     -.132
---------------------------------------------------------------------------------------------
GLD       120.94    .63      119.73        73.4%   Bullish      BLUE   .091    -.099
---------------------------------------------------------------------------------------------
OIL       6.28    .01        6.12          113.2%   ----        BLUE   .056     .11
---------------------------------------------------------------------------------------------
OIH       25.72   -.06       24.33         262.2%  Bullish      RED    .054    -.053
---------------------------------------------------------------------------------------------
GASL      24.29    .35       20.96       1034.9% ----         BLUE  -.179     .005
---------------------------------------------------------------------------------------------
UGA       31.31    .1        30.11         235.6%  Bearish      BLUE  -.037     .029
---------------------------------------------------------------------------------------------
UUP       24.27    .01      W24.37        -32.9%   Bearish      ----   .005    -.08
---------------------------------------------------------------------------------------------
IEF       105.04    .04     W105.88       -51.2%   Bullish      ----   .115    -.097
---------------------------------------------------------------------------------------------
CORN      16.81    .05       16.58         72.1%   ----         BLUE  -.132    -.115
---------------------------------------------------------------------------------------------
WEAT      5.94    -.02        5.9           42.2%   Bearish      ----  -.189    -.147
---------------------------------------------------------------------------------------------
YINN      33.68    .59       32.2          304.7%  ----         BLUE   .028     -.054
---------------------------------------------------------------------------------------------
RSX       21.11    .29       21.09        -194.5%  ----         BLUE  -.166     -.137
---------------------------------------------------------------------------------------------
AAPL      175.01    0       W176.42        29.7%   Bullish      BLUE   .046     .038
---------------------------------------------------------------------------------------------
GOOG      1060.12   -3.51   W1077.14      -19.1%   Bullish      RED    .013    -.01
---------------------------------------------------------------------------------------------
MSFT      85.51    .01      W86.38        -77.9%   Bearish      BLUE   .063     .025
---------------------------------------------------------------------------------------------
AMZN      1168.36   -6.4    W1190.58      -45.6%   Bearish      RED   -.035     .084
---------------------------------------------------------------------------------------------
FB        177.2   -.25      W180.82       -83.2%   Bearish      BLUE  -.059    -.057
---------------------------------------------------------------------------------------------
NVDA     195.27   -.62      W197.9         94.8%   Bearish      BLUE  -.039    -.061
---------------------------------------------------------------------------------------------
BA        295.1    .07      W296.14        19.6%   ----         RED   -.041     .043
---------------------------------------------------------------------------------------------
GS        258.97   -2.04    W260.02        34.9%   Bearish      RED   -.101    -.004
---------------------------------------------------------------------------------------------
HS        188.13    .05     184.73         149.4%  Bullish      RED    .171     .06
---------------------------------------------------------------------------------------------
CAT       155.75   1.11     149.77         300.2%   Bullish     BLUE   .238     .115
|
Table 2 COMPARISONS OF BULLISH AND
BEARISH GROUPS
12/22 12/21 12/20 12/19 12/18
12/15 12/14 12/13 12/12
12/11 12/8 12/7 12/6
12/5 12/4 12/1 11/30 11/29
11/28 11/27
NEWHIGHS
262 317
247 210 553 309 103 268 223 234
288 159 91 107 340 197 536
500 582
209
NEWLOWS 32 45 50 45 43 49 56 25 52 41 37 50
65 53 37 16 31 57 265
59
--------------------------------------------------------------------------------------------------------------------------------------------------------------------------------------------
MAXCPs
70 81 60 60 133
122
53 123
83
84
90 90 50 42 92 105
266 262 320
101
MINCPs 74
81 127 117
76
65 142
67 99
75 93
73 141 135 152
93 80 110 93
94
--------------------------------------------------------------------------------------------------------------------------------------------------------------------------------------------
TTTNHs 72
89
65 71
146 118
75
110
72 73 76 75 46
44
72
53 139
161
143 79
TTTNLs
147 121
187 129 90 98 192 99
161 155 177 109 219 248
402
286 162 230
124 144
-------------------------------------------------------------------------------------------------------------------------------------------------------------------------------------
FASTUP
222 238
143 172
166 126 123 175
101 108
96
80
79
95
180 126
128 130
141 205
FASTDOWN
60
63 78 183 96 125 109 91
132 134 169 195 233 248 210 156
123 97 74
64
|
Table 3
Count of Stocks and New Highs in Key Tiger Directories
Date = 171222
               No.          NHs            Pct
-------------------------------------------------------------------
DJI-13         13            3             23 %
JETS           9             2             22 %
HOMEBLDG       17            3             18 %
RETAIL         53            9             17 %
TRANSP         20            3             15 %
=====================================================
BIGBANKS       7             1             14 %
MORNSTAR       238           31            13 %
COAL           8             1             13 %
FINANCE        92            10            11 %
DOWJONES       30            3             10 %
BEVERAGE       20            2             10 %
SP-100         96            9             9 %
INDMATER       92            8             9 %
INFRA          11            1             9 %
CHEM           64            5             8 %
INDEXES        195           16            8 %
SP500          485           41            8 %
NASD-100       100           8             8 %
COMODITY       71            6             8 %
RUS-1000       837           61            7 %
FOOD           15            1             7 %
REGBANKS       33            2             6 %
ETFS           65            4             6 %
OILGAS         142           8             6 %
INSURANC       32            2             6 %
AUTO           40            2             5 %
BIOTECH        386           21            5 %
CHINA          64            3             5 %
GREEN          31            1             3 %
NIFTY          30            1             3 %
MILITARY       38            1             3 %
ELECTRON       178           4             2 %
SOFTWARE       66            1             2 %
SEMI           130           1             1 %
=================================================
None BIGMIL        GAMING       HACKERS     SOLAR
COMPUTER     GOLD   REIT   EDU     UTILITY   PIPELINE
BONDFUND   HOSPITAL
|
 |
Table 4   RANKING OF KEY DIRECTORIES BASED PCT.OF STOCKS ABOVE 65-DMA
             12/22/17
Bullish = 35
Bearish = 8
---------------------------------------------------------------------------------------
Directory     Current       day-1         day-2         day-3         day-4         day-5
----------------------------------------------------------------------------------------
DJI-13         100%          1             1             1             1             1
INFRA          100%          .909          .727          .727          1             .818
JETS           100%          1             1             1             1             .888
TRANSP         100%          1             1             1             1             .9
DOWJONES       .9            .9            .933          .933          .933          .9
BIGBANKS       .857          .857          .857          .857          .857          .857
MORNSTAR       .836          .836          .81           .806          .852          .798
BIGMIL         .833          .833          .833          .833          .833          .833
SP-100         .812          .833          .822          .812          .822          .802
RETAIL         .811          .792          .792          .792          .792          .773
FINANCE        .804          .858          .771          .815          .847          .76
N=11
--------------------------------------------------------------------------------------------
INDEXES        .753          .723          .692          .682          .697          .646
SP500          .738          .74           .727          .725          .76           .729
MILITARY       .736          .736          .71           .736          .736          .71
EDU            .714          .714          .714          .714          .714          .571
RUS-1000       .709          .714          .71           .708          .743          .7
HOMEBLDG       .705          .764          .647          .647          .705          .647
GAMING         .678          .642          .714          .678          .714          .678
REGBANKS       .666          .757          .696          .696          .787          .696
BEVERAGE       .65           .7            .75           .75           .7            .65
NASD-100       .65           .68           .68           .66           .69           .67
GREEN          .645          .645          .645          .612          .645          .548
NIFTY          .633          .666          .666          .666          .766          .7
OILGAS         .633          .633          .521          .464          .471          .38
ETFS           .63           .569          .492          .523          .63           .446
CHINA          .609          .562          .5            .484          .453          .39
INDMATER       .608          .586          .608          .597          .586          .554
HACKERS        .6            .6            .64           .68           .68           .68
SOFTWARE       .59           .636          .636          .651          .651          .606
CHEM           .562          .593          .593          .578          .593          .5
COMPUTER       .545          .545          .59           .545          .59           .59
GOLD           .53           .367          .346          .244          .204          .183
AUTO           .525          .65           .775          .675          .65           .55
COMODITY       .521          .492          .478          .422          .394          .352
ELECTRON       .511          .544          .567          .55           .606          .516
N=24
=============================================================================================
COAL           .5            .5            .375          .5            .5            .375
HOSPITAL       .5            .5            .5            .5            .5            .5
INSURANC       .5            .531          .5            .562          .593          .593
=============================================================================================
SEMI           .476          .492          .523          .5            .576          .446
SOLAR          .476          .476          .523          .523          .523          .476
BIOTECH        .474          .458          .43           .419          .406          .409
REIT           .393          .382          .376          .415          .662          .617
FOOD           .2            .266          .2            .133          .133          .133
UTILITY        .186          .209          .209          .255          .465          .581
PIPELINE       .142          .142          .142          .142          .142          .142
BONDFUND       .081          .09           .036          .081          .153          .171
N = 8
|
==============================================================================
==============================================================================
12/21/2017 The September
Buy B21 still operates and predicts
higher prices. Only
small gains are likely. The Closing Powers are not rising for the
major market ETFs
shown at the top of Table 1.
New highs have a commanding lead over new lows. So any weakness should
be
limited. The
primary source of weakness now is in Utilities
(because of fears of rising rates),
Natural Gas and food commodities. Hopes of big infra-structure
spending is making CAT
go vertical. Chevron in the
DJI-30 is celebrating the opening of the Artic
wilderness to drilling
by bursting to new highs.
We shouldn't see much trading tomorrow. Typically, the market does
rise on the last trading day
before Christmas and the next day afterwards. The Accumulation Index
for the DJI
has turned negative. This may cause a Sell S12 on December 28th. But
no Peerless
Sell is expected until then.

Instead of a normal Hotline, let me offer this
present. It's something that we all might want to
do. Namely, going through stocks in the Tiger download-letter, like
"17-A", one by one,
and pick out the salient technical lessons from each. I hope you find
this useful. Go
here.
Attention will mostly be turned to BitCoin's bursting bubble tomorrow.
Notice the bearish false
breakout over $17000. Let's hope their is no spread effect.
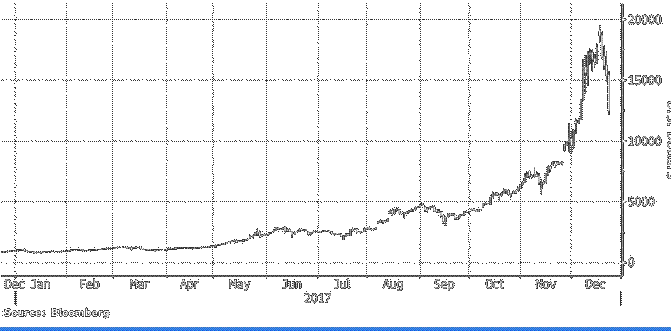
Charts 12/21/2017
PEERLESS
DJI, Signals, Indicators Daily
DJI Volume 10-DayUp/Down Vol
V-Indicator
Hourly DJIA
A/D Line for All
Stocks
NASDAQ
S&P
OEX
NYSE COMPQX
DJI-15 DJI-20
DJI-30
DIA
SPY
QQQ MDY
IWM
TNA
CrudeOil
FAS
GLD
BBH
IBB
JETS
JNUG
KOL
NUGT
OIH
OIL
RSX
RETL
SDS
SLV
SOXL
TECL
TMF
TNA UGA
(gasoline)
XIV
YINN
Commodities:
JJC, NIB,
CHOC
CORN,
WEAT
UUP
(Dollar)
AAPL ADBE
ALXN
AMAT
AMGN AMD
AMZN
BA BABA BAC
BIDU
CAT
CVX
FB
GOOG
GS
HD
IBM JPM M
(Macy's)
MSFT NFLX
NVDA
QCOM TSLA
TXN
XOM
WMT
ANDV (refinery),
CMG (Chipotle), LRCX,
SWKS,
TOWN
New - SPPI
(small Biotech)
12/21/2017
Bullish MAXCPs Bearish
MINCPs
Table 1
QuickSilver
Documentation
This is for short-term trading
leveraged ETFs.
It also provides a useful short-term outlook
of these sectors ETF's and the sectors they represewnt
Blue is
Bullish and
Red is Bearish.
1 Candle-Stick color is shortest-term. This
changes when close vis-a-vis opening changes.
So, in stocks or ETFs that advanced a long
ways, traders should sell when a higher
opening gives way to a decline that brings
a drop below the previous day's close.
2 5-dma AROC and Close-versus- pivot point is
next most short-term.
W = warning. Close is below
PIVOT-Point.
3 Closing Power trend-direction vs. its 21-dma
is next most short-term.
4 IP21 is used to spot divergences and to
estimate underlying support.
5 > IP21 falling and below +.15 and its 21-dma
is bearish in an over-extended ETF, especially
when its Closing Power is falling and is
below its 21-dma.
> IP21 below 07 with AROC below .07 is less
likely to bring a rally back up from 21-dma.
6 Note price trend-lines, support/resistance
and price patterns on charts.
Table 1
QUICKSILVER on ETFS - 12/21/17
ETF      CLOSE   CHANGE     PIVOT-PT   5-dma AROC  CLOS-PWR    CANDLE  IP21     ITRS
---------------------------------------------------------------------------------------------
---------------------------------------------------------------------------------------------
DIA       247.66    .59      246.25        42.3%   Bearish      RED   -.069    -----
---------------------------------------------------------------------------------------------
COMPQX    6965.36    4.4     6936.58       78.4%   Bearish      RED   -.033    -.029
---------------------------------------------------------------------------------------------
SPY       267.58    .55      266.51        36%     Bearish      RED   -.06     -.034
---------------------------------------------------------------------------------------------
QQQ       157.55    .02     W157.65        53%     Bearish      RED    .035    -.019
---------------------------------------------------------------------------------------------
MDY       345.93    .77      342.47        80.7%   Bearish      BLUE  -.227    -.038
---------------------------------------------------------------------------------------------
IWM       153.47    .09      152.24        110.4%  Bearish      BLUE  -.203    -.058
---------------------------------------------------------------------------------------------
FAS       68.48    .98       68.36         136.6%  Bearish      BLUE  -.173     .076
---------------------------------------------------------------------------------------------
RETL      36.68    .23       34.09        592.2%   ----        RED    .14     .306
---------------------------------------------------------------------------------------------
SOXL      144.39   -4.83     137.54        446.6%  Bearish      RED   -.086     .041
---------------------------------------------------------------------------------------------
TECL      116.03   -.72     W116.11        165.3%  Bearish      RED    .046     .134
---------------------------------------------------------------------------------------------
IBB       106.8    .14       106.6         76.8%   Bearish      BLUE   .023    -.138
---------------------------------------------------------------------------------------------
GLD       120.31    .17      119.18        57.7%   Bullish      BLUE   .086    -.104
---------------------------------------------------------------------------------------------
OIL       6.27    .04        6.14          138.2%  Bearish      BLUE   .104     .091
---------------------------------------------------------------------------------------------
OIH       25.78    .78       24.42         260.9%  Bullish      BLUE   .058    -.068
---------------------------------------------------------------------------------------------
GASL      23.94    1.7       19.82        729.1%   ----       BLUE   -.19    -.03
---------------------------------------------------------------------------------------------
UGA       31.21    .1        29.87         168%    Bearish      BLUE  -.031     .008
---------------------------------------------------------------------------------------------
UUP       24.26   -.01      W24.43        -14.4%   Bearish      ----  -.046    -.078
---------------------------------------------------------------------------------------------
IEF       105   -.09        W106.12       -53.9%   Bullish      BLUE   .123    -.096
---------------------------------------------------------------------------------------------
CORN      16.76    .09       16.57         27.1%   Bearish      BLUE  -.159    -.109
---------------------------------------------------------------------------------------------
WEAT      5.96    .02        5.89          50.8%   Bearish      ----  -.182    -.149
---------------------------------------------------------------------------------------------
YINN      33.09    1.68      31.73         124%     ----        BLUE   .036    -.073
---------------------------------------------------------------------------------------------
RSX       20.82    .04      W21.93        -279.1%  Bearish      BLUE  -.156    -.156
---------------------------------------------------------------------------------------------
AAPL      175.01    .66      173.97        80%     Bullish      BLUE   .084     .035
---------------------------------------------------------------------------------------------
GOOG      1063.63   -1.32   W1064.19       68%     Bullish      RED    .033    -.008
---------------------------------------------------------------------------------------------
MSFT      85.5   -.02       W86.85         47.2%   Bearish      RED    .011     .035
---------------------------------------------------------------------------------------------
AMZN      1174.76   -2.86   W1179.14       2.1%    Bearish      RED    .009     .097
---------------------------------------------------------------------------------------------
FB        177.45   -.44     W180.18       -26.2%   Bearish      RED   -.078    -.056
---------------------------------------------------------------------------------------------
NVDA     195.89   -.91       191.56        243.1%  Bearish      RED   -.077    -.057
---------------------------------------------------------------------------------------------
BA        295.03   -2.87     293.94        19.4%    ----        RED   -.058     .045
--------------------------------------------------------------------------------------------
GS        261.01    5.83     257.17        107.6%  Bearish      BLUE  -.119    -.007
|
Table 2 COMPARISONS OF BULLISH AND
BEARISH GROUPS
12/21 12/20 12/19 12/18 12/15
12/14 12/13 12/12 12/11
12/8 12/7 12/6 12/5
12/4 12/1 11/30 11/29 11/28
11/27 11/24
NEWHIGHS 317
247 210 553 309 103 268 223 234
288 159 91 107 340 197 536
500 582
209 439
NEWLOWS 45 50 45 43 49 56 25 52 41 37 50
65 53 37 16 31 57 265
59 31
--------------------------------------------------------------------------------------------------------------------------------------------------------------------------------------------
MAXCPs
81 60 60 133
122
53 123
83
84
90 90 50 42 92 105
266 262 320
101 166
MINCPs
81 127 117
76
65 142
67 99
75 93
73 141 135 152
93 80 110 93
94 42
--------------------------------------------------------------------------------------------------------------------------------------------------------------------------------------------
TTTNHs 89
65 71
146 118
75
110
72 73 76 75 46
44
72
53 139
161
143 79
110
TTTNLs 121
187 129 90 98 192 99
161 155 177 109 219 248
402
286 162 230
124 144
66
-------------------------------------------------------------------------------------------------------------------------------------------------------------------------------------
FASTUP
238
143 172
166 126 123 175
101 108
96
80
79
95
180 126
128 130
141 205
FASTDOWN
63 78 183 96 125 109 91
132 134 169 195 233 248 210 156
123 97 74 64 58
|
Table 3
Count of Stocks and New Highs in Key Tiger Directories
Date = 171221
               No           NHs            Pct
-------------------------------------------------------------------
BIGBANKS       7             4             57 %
DJI-13         13            5             38 %
HOMEBLDG       17            4             24 %
RETAIL         53            12            23 %
JETS           9             2             22 %
DOWJONES       30            6             20 %
MORNSTAR       238           47            20 %
INDEXES        195           37            19 %
FINANCE        92            17            18 %
INFRA          11            2             18 %
BIGMIL         6             1             17 %
--------------------------------------------------------
SP-100         96            14            15 %
BEVERAGE       20            3             15 %
EDU            7             1             14 %
MILITARY       38            5             13 %
INDMATER       92            11            12 %
GAMING         28            3             11 %
OILGAS         142           16            11 %
SP500          486           55            11 %
RUS-1000       838           92            11 %
REGBANKS       33            3             9 %
CHINA          64            5             8 %
AUTO           40            3             7 %
NIFTY          30            2             7 %
NASD-100       100           7             7 %
GREEN          31            2             6 %
CHEM           64            4             6 %
ETFS           65            3             5 %
HACKERS        25            1             4 %
ELECTRON       178           5             3 %
SOFTWARE       66            2             3 %
BIOTECH        386           12            3 %
INSURANC       32            1             3 %
COMODITY       71            2             3 %
SEMI           130           3             2 %
GOLD           49            1             2 %
=======================================================
None: TRANSP SOLAR  COMPUTER  COAL  REIT  UTILITY
PIPELINE FOOD   BONDFUND   HOSPITAL
|
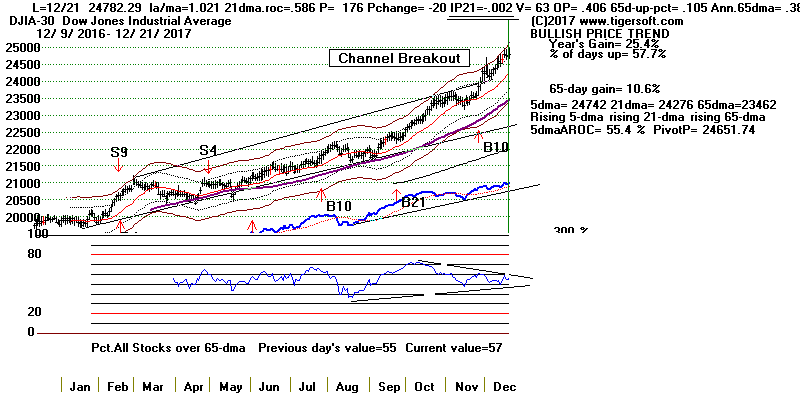 |
Table 4  RANKING OF KEY DIRECTORIES BASED PCT.OF STOCKS ABOVE 65-DMA
              12/21/17
Bullish = 34
Bearish = 10
---------------------------------------------------------------------------------------
Directory     Current       day-1         day-2         day-3         day-4         day-5
----------------------------------------------------------------------------------------
DJI-13         100%          1             1             1             1             1
JETS           100%          1             1             1             .888          .888
TRANSP         100%          1             1             1             .9            .8
INFRA          .909          .727          .727          1             .818          .818
DOWJONES       .9            .933          .933          .933          .9            .9
FINANCE        .858          .771          .815          .847          .76           .673
BIGBANKS       .857          .857          .857          .857          .857          .857
MORNSTAR       .836          .81           .806          .852          .806          .726
BIGMIL         .833          .833          .833          .833          .833          .833
SP-100         .833          .822          .812          .822          .802          .791
RETAIL         .792          .792          .792          .792          .754          .716
HOMEBLDG       .764          .647          .647          .705          .647          .647
REGBANKS       .757          .696          .696          .787          .696          .454
SP500          .74           .728          .726          .761          .728          .689
MILITARY       .736          .71           .736          .736          .71           .657
INDEXES        .723          .692          .682          .697          .646          .682
EDU            .714          .714          .714          .714          .571          .428
RUS-1000       .714          .711          .708          .743          .696          .655
BEVERAGE       .7            .75           .75           .7            .65           .65
N=19
============================================================================================
NASD-100       .68           .68           .66           .69           .66           .66
NIFTY          .666          .666          .666          .766          .7            .7
AUTO           .65           .775          .675          .65           .55           .45
GREEN          .645          .645          .612          .645          .548          .516
GAMING         .642          .714          .678          .714          .678          .678
SOFTWARE       .636          .636          .651          .651          .59           .575
OILGAS         .633          .521          .464          .471          .38           .387
HACKERS        .6            .64           .68           .68           .68           .68
CHEM           .593          .593          .578          .593          .5            .406
INDMATER       .586          .608          .597          .586          .565          .456
ETFS           .569          .492          .523          .63           .446          .523
CHINA          .562          .5            .484          .453          .406          .453
COMPUTER       .545          .59           .545          .59           .59           .5
ELECTRON       .544          .567          .55           .606          .533          .455
INSURANC       .531          .5            .562          .593          .625          .468
N=15
============================================================================================
COAL           .5            .375          .5            .5            .375          .375
HOSPITAL       .5            .5            .5            .5            .5            .375
============================================================================================
COMODITY       .492          .478          .422          .394          .352          .309
SEMI           .492          .523          .5            .576          .461          .384
SOLAR          .476          .523          .523          .523          .476          .476
BIOTECH        .458          .43           .419          .406          .409          .388
REIT           .382          .376          .415          .662          .617          .533
GOLD           .367          .346          .244          .204          .183          .142
FOOD           .266          .2            .133          .133          .133          .133
UTILITY        .209          .209          .255          .465          .581          .534
PIPELINE       .142          .142          .142          .142          .142          0
BONDFUND       .09           .036          .081          .153          .171          .243
N=10
============================================================================================
|
12/21/2017
Bullish MAXCPs
Bearish
MINCPs
==============================================================================
12/20/2017 The September
Buy B21 still operates and predicts
higher prices.
Any dip at this
time should be considered a buying opportunity. I doubt if the
DJI will fall as far back as to break its rising 21-dma in the next week.
Interest Rates May Rise Very Quickly Now?
The tax cuts will almost certainly increase the National Debt. George
"Read My Lips"
Bush Sr. found this out the hard way. The Fed will almost certainly
will not keep rates
low. So, I would short the bearish interest-rate sensitive issues
shown among the Bearish MINCPs.
The DJI-Utilities chart has broken its
year-long uptrend and shows a bearish head and shoulders.
The Trump tax could rapidly increase the Federal deficit and require much
more borrowing by
the US Treasury. Buy PST
(shown below). At this stage, I think the ETFS and high-caps
that will move up the most going into the new year will be those with the
highest IP21 readings
and rising Closing Powers. Interestingly, when we rank all the
Leveraged ETFs for IP21,
the highest (showing the most intense Accumulation) are DYY (Double Short
Commodities),
PST (Short 7-10 Yr Treasuries) and BZQ (3x Short on Brazilian Stocks).
BUY PST
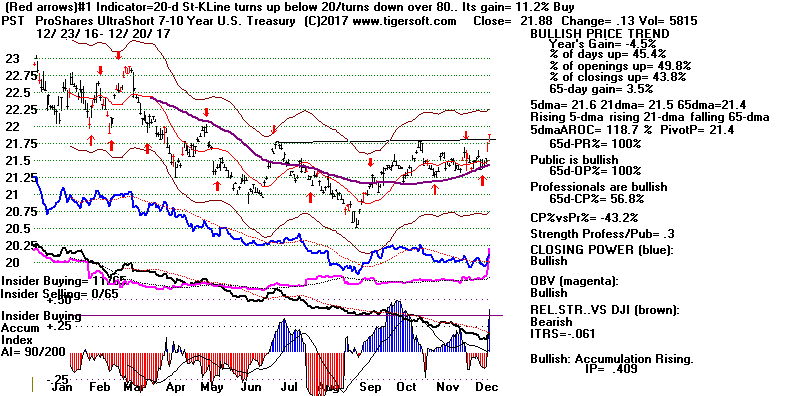
Does Santa Claus Have Any More
To Give?
It's only natural that some traders are taking profits
now that the new tax bill has
passed Congress. So, a short-term pullback has started. DIA,
COMPQX, SPY, QQQ, MDY
and FAS all show falling Closing Powers and Red candle-sticks. (See
Table 1 below).
Only a shallow decline is expected. The Peerless system cannot easily
give a Sell until the
28th of December because of the bullish seasonality now. In Table A
below, we show the
numerous cases since 1965 where the IP21-AI was near or below 0 with the DJI
more than
2.1% above the 21-day ma between December 17th and the end of the year.
What this
demonstrates is that even with a weakening IP21 and an "over-bought" DJI,
there
were no Sells until December 28th at the earliest. In every case, the
DJI continued higher
until at least December 28th. This is the "Santa Claus effect".
True, some may say that the Trump Rally has frequently
suspended the operation of ordinary
seasonality, so there may be no Christmas rally. Perhaps, but given
the special bullishness of the
Buy September B21, given the very bullish AI/200 score for the NASDAQ
and given how
shallow all pullbacks in the DJI have been for the last year, I would
not expect the DJI to stay
very long at its 21-dma support, if it does drop-back that far. There
are just to many buyers
"wanting in". The DJI's rising 21-day ma is now at 24219 and is rising
about 60 points a day.
Table 3
Count of Stocks and New Highs in Key Tiger Directories
Date = 171220
               No           NHs            Pct
-------------------------------------------------------------------
JETS           9             4             44 %
DJI-13         13            5             38 %
BIGMIL         6             2             33 %
TRANSP         20            5             25 %
DOWJONES       30            7             23 %
SP-100         96            17            18 %
INFRA          11            2             18 %
---------------------------------------------------------
BIGBANKS       7             1             14 %
GAMING         28            4             14 %
MORNSTAR       238           34            14 %
EDU            7             1             14 %
RETAIL         53            7             13 %
HOMEBLDG       17            2             12 %
MILITARY       38            4             11 %
INDMATER       92            10            11 %
SP500          486           47            10 %
CHEM           64            6             9 %
NASD-100       100           9             9 %
COMPUTER       22            2             9 %
FINANCE        92            7             8 %
INDEXES        195           16            8 %
ETFS           65            5             8 %
RUS-1000       838           69            8 %
NIFTY          30            2             7 %
OILGAS         142           8             6 %
INSURANC       32            2             6 %
AUTO           40            2             5 %
CHINA          64            3             5 %
HACKERS        25            1             4 %
GREEN          31            1             3 %
ELECTRON       178           6             3 %
SEMI           130           4             3 %
BIOTECH        386           10            3 %
SOFTWARE       66            1             2 %
--------------------------------------------------
|
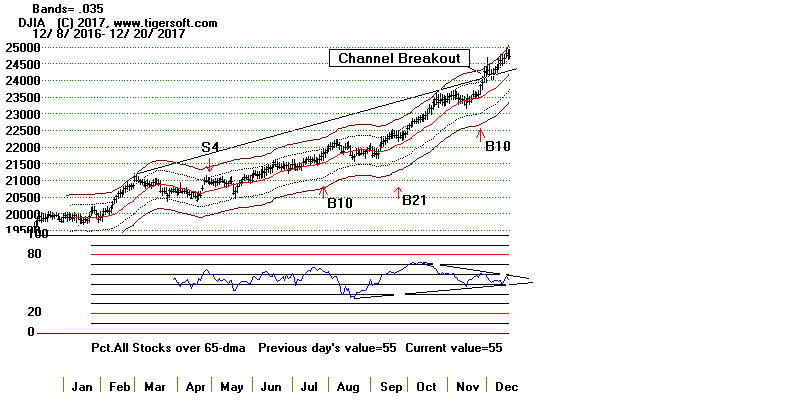
|
Table 4 RANKING OF KEY DIRECTORIES BASED PCT.OF STOCKS ABOVE 65-DMA
12/20/17
Bullish = 33
Bearish = 10
---------------------------------------------------------------------------------------
Directory Current day-1 day-2 day-3 day-4 day-5
----------------------------------------------------------------------------------------
DJI-13 1 1 1 1 1 1
JETS 1 1 1 .888 .888 .888
TRANSP 1 1 1 .9 .8 .9
DOWJONES .933 .933 .933 .9 .9 .866
BIGBANKS .857 .857 .857 .857 .857 1
BIGMIL .833 .833 .833 .833 .833 .833
SP-100 .822 .812 .822 .802 .791 .822
MORNSTAR .81 .806 .852 .806 .731 .789
RETAIL .792 .792 .792 .754 .716 .735
AUTO .775 .675 .65 .55 .45 .525
FINANCE .771 .815 .847 .76 .684 .695
BEVERAGE .75 .75 .7 .65 .65 .65
SP500 .728 .726 .761 .728 .693 .742
INFRA .727 .727 1 .818 .818 .909
EDU .714 .714 .714 .571 .428 .714
GAMING .714 .678 .714 .678 .678 .678
RUS-1000 .711 .708 .743 .696 .659 .712
MILITARY .71 .736 .736 .71 .657 .71
============================================================================================
REGBANKS .696 .696 .787 .696 .515 .696
INDEXES .682 .682 .697 .646 .676 .707
NASD-100 .68 .66 .69 .66 .66 .67
NIFTY .666 .666 .766 .7 .7 .733
HOMEBLDG .647 .647 .705 .647 .647 .705
GREEN .645 .612 .645 .548 .516 .612
HACKERS .64 .68 .68 .68 .68 .6
SOFTWARE .636 .651 .651 .59 .575 .606
INDMATER .608 .597 .586 .565 .456 .5
CHEM .593 .578 .593 .5 .406 .5
COMPUTER .59 .545 .59 .59 .5 .545
ELECTRON .567 .55 .606 .533 .455 .5
SEMI .523 .5 .576 .461 .384 .423
SOLAR .523 .523 .523 .476 .476 .476
OILGAS .521 .464 .471 .38 .394 .443
============================================================================================
CHINA .5 .484 .453 .406 .453 .546
HOSPITAL .5 .5 .5 .5 .375 .5
INSURANC .5 .562 .593 .625 .5 .593
=============================================================================================
ETFS .492 .523 .63 .446 .523 .584
COMODITY .478 .422 .394 .352 .323 .323
BIOTECH .43 .419 .406 .409 .391 .43
REIT .376 .415 .662 .617 .528 .55
COAL .375 .5 .5 .375 .375 .375
GOLD .346 .244 .204 .183 .142 .142
UTILITY .209 .255 .465 .581 .534 .581
FOOD .2 .133 .133 .133 .133 .133
PIPELINE .142 .142 .142 .142 0 0
BONDFUND .036 .081 .153 .171 .243 .234
N=10
|
=============================================================================
=============================================================================
12/19/2017
The September
Buy B21 still operates and predicts
higher prices. Any dip at this
time should be considered a buying opportunity.
A short-term decline after the DJI pushes up to the round-number 25,000 to
celebrate Congress's passing the biggest US tax cut since 1986 is certainly
a possibility. Grabbing profits when a long-expected bullish event
finally takes
place has a long tradition on Wall Street. And though
BA and CAT show no
signs of
slowing down in the DJI, the Hourly DJI's
DISI-OBV has recently widely failed to
confirm the recent run-up. We also see negative (red) distribution
when we look at the
key DIA ETF.
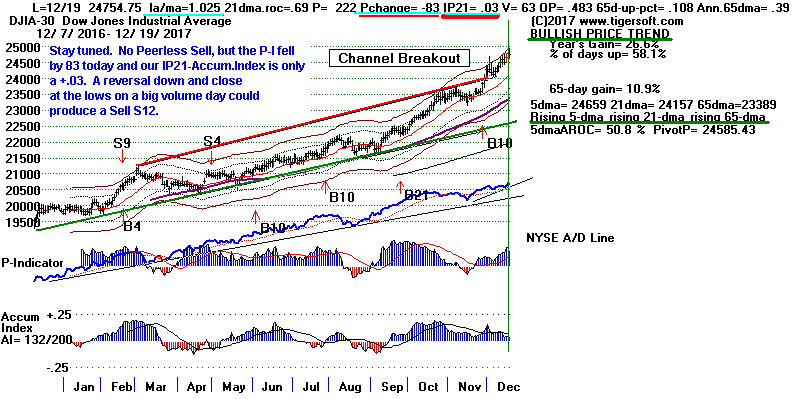
But such a sell-off now would be fighting the
bullish second-half December seasonality.
Since1965, the DJI has advanced 68.6% of the time over the next five trading
days and
has averaged a1% gain over the next ten trading days and 1.9% over the next
days. And
it would be fighting Peerless, which has yet to produce a Sell.
Going back to 1915,
I don't believe there have been any significant tops in on-going bull
markets that were
made in the week before Christmas even when the Accumulation Index is close
to 0,
as now. The biggest declines at this time were a 1% pullback in 1951
and 1959 and
a 2% retreat in 1953. There are many more cases of big advances from
now until
year-end and beyond.
Wall Street Will Not Allow This "Wager on The Rich"
To Fail
Working now is a much important consideration than the
bullish seasonality or any
technical warnings. Wall Street has a huge vested interest in keeping
the bull market
going. Just as when they punished Truman and Kennedy by dropping the
market
(and the economy) when these two Presidents began to threaten Corporate and
Wall Street power, now they must reward Trump and the Republican Congress.
I believe they understand very well that a sell-off now would work against
the whole
purpose behind the tax-cut, which is to pump up Wall Street, thereby
making big
shareholders and corporations oodles of money so that their spending and
investments
will spur on national economic growth and make the economy surge by the time
of the
Election next year. Now is not the time for Wall Street to grow
feint-hearted and
"fold". I believe Wall Street is very aware of their responsibility
now to make the stock
market go much higher. Too much is at stake for them to act like
short-term traders.
Charts 12/19/2017
PEERLESS
DJI, Signals, Indicators Daily
DJI Volume 10-DayUp/Down Vol
V-Indicator
Hourly DJIA
A/D Line for All
Stocks
NASDAQ
S&P
OEX
NYSE COMPQX
DJI-15 DJI-20
DJI-30
DIA
SPY
QQQ MDY
IWM
TNA
CrudeOil
FAS
GLD
BBH
IBB
JETS
JNUG
KOL
NUGT
OIH
OIL
RSX
RETL
SDS
SLV
SOXL
TECL
TMF
TNA UGA
(gasoline)
XIV
YINN
Commodities:
JJC, NIB,
CHOC
CORN,
WEAT
UUP
(Dollar)
AAPL ADBE
ALXN
AMAT
AMGN AMD
AMZN
BA BABA BAC
BIDU
CAT
CVX
FB
GOOG
GS
HD
IBM JPM M
(Macy's)
MSFT NFLX
NVDA
QCOM TSLA
TXN
XOM
WMT
ANDV (refinery),
CMG (Chipotle), LRCX,
SWKS,
TOWN
New - SPPI
(small Biotech)
12/19/2017
Bullish MAXCPs
Buyouts/Arbitraging
Bearish
MINCPs
Red Stoch.-Sells Today
Table 1
QuickSilver
Documentation
This is for short-term trading
leveraged ETFs.
It also provides a useful short-term outlook
of these sectors ETF's and the sectors they represewnt
Blue is
Bullish and
Red is Bearish.
1 Candle-Stick color is shortest-term. This
changes when close vis-a-vis opening changes.
So, in stocks or ETFs that advanced a long
ways, traders should sell when a higher
opening gives way to a decline that brings
a drop below the previous day's close.
2 5-dma AROC and Close-versus- pivot point is
next most short-term.
W = warning. Close is below
PIVOT-Point.
3 Closing Power trend-direction vs. its 21-dma
is next most short-term.
4 IP21 is used to spot divergences and to
estimate underlying support.
5 > IP21 falling and below +.15 and its 21-dma
is bearish in an over-extended ETF, especially
when its Closing Power is falling and is
below its 21-dma.
> IP21 below 07 with AROC below .07 is less
likely to bring a rally back up from 21-dma.
6 Note price trend-lines, support/resistance
and price patterns on charts.
                     QUICKSILVER on ETFS - 12/19/17

            Today's decline did not cause most ETFs 5-day moving averges
            to turn down.  The most bullish stocks below are BA and CAT.
ETF      CLOSE   CHANGE     PIVOT-PT   5-dma AROC  CLOS-PWR  CANDLE  IP21     ITRS
---------------------------------------------------------------------------------------------
---------------------------------------------------------------------------------------------
DIA       247.4    -.39      246.3         39.8%   ----      RED   -.009     ---
---------------------------------------------------------------------------------------------
COMPQX    6963.85 -30.91    6875.8         73.5%   Bearish   RED    .063    -.029
---------------------------------------------------------------------------------------------
SPY       267.17   -1.03     266.75        7.3%   ----       RED    .023    -.035
---------------------------------------------------------------------------------------------
QQQ       157.7   -.94       155.99        64.1%   ----      RED    .075    -.018
---------------------------------------------------------------------------------------------
MDY       344.6   -1.43      343.26        20.1%   Bearish   RED   -.182    -.042
---------------------------------------------------------------------------------------------
IWM       153.08   -1.22     151.78        72.4%   Bearish   RED   -.125    -.063
---------------------------------------------------------------------------------------------
FAS       68.25   -1.54      67.5         -83.4%   Bearish   RED   -.098     .084
---------------------------------------------------------------------------------------------
RETL      36.11   -.76       34.57         375.9%   ----     RED    .112     .235
---------------------------------------------------------------------------------------------
SOXL      146.16   -.65      131.98        520.6%  Bearish  ----  -.025     .096
---------------------------------------------------------------------------------------------
TECL      116.75   -2.35     112.68        188.2%   ----     RED    .103     .154
---------------------------------------------------------------------------------------------
IBB       106.11   -.25     W106.72        16.5%   Bearish   RED   -.01    -.15
---------------------------------------------------------------------------------------------
GLD       119.82    .09      119.17        70.1%   ----      BLUE  -.003    -.106
---------------------------------------------------------------------------------------------
OIL       6.16    .04        6.03          32.8%   Bearish   ----   .052     .118
---------------------------------------------------------------------------------------------
OIH       24.4    .07       W24.89        -170.2%  Bearish  ----  -.083    -.131
---------------------------------------------------------------------------------------------
GASL      21.02    .06      W21.44        -237.8%  Bearish  RED   -.303    -.152
---------------------------------------------------------------------------------------------
UGA       30.49    .38       29.78        -18.3%   Bearish   BLUE  -.011     .015
---------------------------------------------------------------------------------------------
UUP       24.3   -.07       W24.31        -36.9%   Bearish   RED    .037    -.089
---------------------------------------------------------------------------------------------
IEF       105.4   -.48      W106.18       -16.5%   Bullish   RED    .113    -.095
---------------------------------------------------------------------------------------------
CORN      16.62    .04      W16.68          -9.0%  Bearish   ----  -.154    -.132
---------------------------------------------------------------------------------------------
WEAT      5.91    .01        5.87          85.1%   Bearish   ----  -.211    -.171
---------------------------------------------------------------------------------------------
YINN      31.58   -.62      W33.22         49.8%   Bearish   RED    .043    -.107
---------------------------------------------------------------------------------------------
RSX       20.8   -.29       W22.1         -256.8%  Bearish   RED   -.137    -.147
---------------------------------------------------------------------------------------------
AAPL      174.54   -1.88     172.27        81.9%   Bullish   RED    .108     .033
---------------------------------------------------------------------------------------------
GOOG      1070.68   -6.46   1040.61       143.2%   Bullish   RED    .077     .009
---------------------------------------------------------------------------------------------
MSFT      85.83   -.55       85.35         14.6%   ----      RED    .087     .038
---------------------------------------------------------------------------------------------
AMZN      1187.38   -3.2     1164.13       94.9%   Bearish   RED    .046     .111
---------------------------------------------------------------------------------------------
FB        179.51   -1.31     178.3         71.3%   Bearish   RED   -.011    -.047
---------------------------------------------------------------------------------------------
NVDA     196.11   -1.79      186.18        138.3%  Bearish   RED   -.023    -.03
---------------------------------------------------------------------------------------------
BA        297.25    1.11     291.84        124.7%  Bullish   BLUE   .032     .063
---------------------------------------------------------------------------------------------
GS        256.48   -3.54     255.56       -23.3%   Bearish   RED   -.143    -.031
Table 2 COMPARISONS OF
BULLISH AND BEARISH GROUPS
12/19 12/18 12/15
12/14 12/13 12/12 12/11 12/8 12/7 12/6 12/5
12/4 12/1 11/30 11/29 11/28 11/27 11/24 11/21
11/20
NEWHIGHS
210 553 309 103 268 223 234
288 159 91 107 340 197 536
500 582 209 439 615 363
NEWLOWS 45 43
49 56 25 52 41 37 50
65 53 37 16 31 57 265
59 31 62 50
-----------------------------------------------------------------------------------------------------------------------------------------------------------------------------------------
MAXCPs
60
133
122
53 123
83
84
90 90
50 42 92 105
266 262 320
101 166 406 339
MINCPs 117
76
65 142
67 99
75 93
73 141 135 152
93 80 110 93
94 42 63 52
----------------------------------------------------------------------------------------------------------------------------------------------------------------------------------------
TTTNHs
71 146 118
75
110
72 73 76 75 46
44
72
53 139
161
143 79
110 196
172
TTTNLs
129 90 98
192 99
161 155 177 109 219 248
402
286 162 230
124 144
66 186
184
-----------------------------------------------------------------------------------------------------------------------------------------------------------------------------------------
FASTUP
172
166 126 123 175
101 108
96
80
79
95
180 126
128 130 141 143
205 245 189
FASTDOWN
183
96 125 109 91
132 134 169 195 233 248 210 156
123 97 74 64 58 72 100
|
Table 3Count of Stocks and New Highs in Key Tiger Directories
Date = 171219
No NHs Pct
-------------------------------------------------------------------
BIGMIL 6 2 33 %
DJI-13 13 4 31 %
GAMING 28 5 18 %
INFRA 11 2 18 %
TRANSP 20 3 15 %
RETAIL 53 8 15 %
BEVERAGE 20 3 15 %
==================================================
EDU 7 1 14 %
DOWJONES 30 4 13 %
HOMEBLDG 17 2 12 %
HACKERS 25 3 12 %
MILITARY 38 4 11 %
SP-100 96 11 11 %
MORNSTAR 238 26 11 %
JETS 9 1 11 %
NASD-100 100 10 10 %
FINANCE 92 8 9 %
INDMATER 92 8 9 %
SP500 486 42 9 %
RUS-1000 838 62 7 %
CHEM 64 4 6 %
INSURANC 32 2 6 %
AUTO 40 2 5 %
INDEXES 195 9 5 %
SOFTWARE 66 3 5 %
CHINA 64 3 5 %
COMPUTER 23 1 4 %
GREEN 31 1 3 %
NIFTY 30 1 3 %
ETFS 65 2 3 %
BIOTECH 386 12 3 %
ELECTRON 179 4 2 %
SEMI 131 2 2 %
REIT 178 4 2 %
UTILITY 43 1 2 %
----------------------------------------------------
Warning: BIGBANKS REGBANKS OILGAS SOLAR
COAL GOLD PIPELINE COMODITY
FOOD BONDFUND HOSPITAL
|

|
Table 4
 RANKING OF KEY DIRECTORIES BASED PCT.OF STOCKS ABOVE 65-DMA
             12/19/17
 Bullish = 34
 Bearish = 10
---------------------------------------------------------------------------------------
Directory     Current       day-1         day-2         day-3         day-4         day-5
----------------------------------------------------------------------------------------
DJI-13         100%          1             1             1             1             1
JETS           1             1             .888          .888          .888          .888
TRANSP         1             1             .9            .8            .9            .9
DOWJONES       .933          .933          .9            .9            .866          .833
BIGBANKS       .857          .857          .857          .857          1             1
BIGMIL         .833          .833          .833          .833          .833          .833
FINANCE        .815          .847          .76           .684          .695          .684
SP-100         .812          .822          .802          .791          .822          .812
MORNSTAR       .806          .852          .806          .731          .794          .81
N=9
============================================================================================
RETAIL         .792          .792          .754          .716          .735          .754
BEVERAGE       .75           .7            .65           .65           .6            .6
MILITARY       .736          .736          .71           .657          .71           .71
INFRA          .727          1             .818          .818          .909          .909
SP500          .726          .761          .728          .693          .738          .746
EDU            .714          .714          .571          .428          .714          .714
RUS-1000       .708          .743          .696          .659          .71           .719
REGBANKS       .696          .787          .696          .515          .696          .666
INDEXES        .682          .697          .646          .676          .707          .687
HACKERS        .68           .68           .68           .68           .6            .6
GAMING         .678          .714          .678          .678          .678          .75
AUTO           .675          .65           .55           .45           .525          .55
NIFTY          .666          .766          .7            .7            .733          .7
NASD-100       .66           .69           .66           .66           .67           .66
SOFTWARE       .651          .651          .59           .575          .606          .59
HOMEBLDG       .647          .705          .647          .647          .705          .705
GREEN          .612          .645          .548          .516          .612          .612
INDMATER       .597          .586          .565          .456          .5            .521
CHEM           .578          .593          .5            .406          .5            .468
COMPUTER       .565          .608          .608          .521          .565          .565
INSURANC       .562          .593          .625          .5            .593          .656
ELECTRON       .553          .608          .536          .458          .502          .502
ETFS           .523          .63           .446          .523          .584          .507
SOLAR          .523          .523          .476          .476          .476          .428
SEMI           .503          .58           .465          .389          .427          .412
----------------------------------------------------------------------------------------------
COAL           .5            .5            .375          .375          .375          .375
HOSPITAL       .5            .5            .5            .375          .5            .5
----------------------------------------------------------------------------------------------
CHINA          .484          .453          .406          .453          .546          .406
OILGAS         .464          .471          .38           .394          .45           .5
COMODITY       .422          .394          .352          .323          .323          .352
BIOTECH        .419          .406          .409          .391          .432          .383
REIT           .415          .662          .617          .528          .539          .528
UTILITY        .255          .465          .581          .534          .581          .581
GOLD           .244          .204          .183          .142          .142          .122
PIPELINE       .142          .142          .142          0             0             0
FOOD           .133          .133          .133          .133          .133          .133
BONDFUND       .081          .153          .171          .243          .216          .171
N= 10
|
|



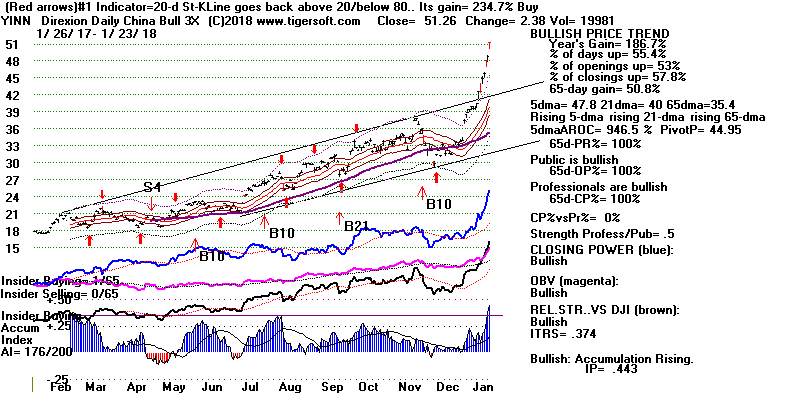


 Other tulip-markets: Google Silver 1975-1980. BitCoin 2012-2018
