PEERLESS/TIGERSOFT HOTLINE

(C) 1985-2017 William Schmidt, Ph.D. www.tigersoft.com
All rights strictly reserved.
Tiger Software 858-273-5900 PO Box
22784 San Diego, CA 92192 Email
william_schmidt@hotmail.com
-------------------------------------------------------------------------------------------------------------
---------------------------- IMPORTANT
---------------------------------------
You are here:
www.tigersoft.com/HHH517/INDEX.htm
Earlier Hotlines
www.tigersoft.com/HHH517/OLDER.html
www.tigersoft.com/HH747/INDEX.html
www.tigersoft.com/HHLL217/INDEX.html
PREINDEX.html
www.tigersoftware.com/HL/INDEX.html
Most Recent Hotlines: 2/4/2017 -
2/15/2017
These have somehow become corrupted. Their graphs are missing.
http://www.tigersoft.com/345HLN12/ZINDEX.html
http://www.tigersoft.com/333HLLL/INDEX.html
http://www.tigersoft.com/444HL444/INDEX.html
www.tigersoft.com/119HLPAZ/INDEX.html
http://www.tigersoft.com/888HLAZ/INDEX.html
www.tigersoft.com/821-HL/INDEX.html
http://www.tigersoft.com/816-HLN/INDEX.html
http://www.tigersoft.com/77HL7778/INDEX.html
http://www.tigersoft.com/64HRL/INDEX.html
http://www.tigersoft.com/55HL55/INDEX.html
HELP
A
Guide To Profitably Using The Tiger Nightly HOTLINE
Introduction
to Tiger/Peerless Buys and Sells.
Peerless
Buy and Sell Signals: 1928-2016
Individual Peerless signals explained:
http://tigersoftware.com/PeerlessStudies/Signals-Res/index.htm
http://www.tigersoft.com/PeerInst-2012-2013/
Explanation of each Peerless signal.
http://www.tigersoft.com/PeerInst-2012-2013/
Different
Types of TigerSoft/Peerless CHARTS, Signals and Indicators
Peerless Signals and DJI
Charts - version 7/4/2013
1965
1965-6 1966
1966-7
1967
1967-8
1968
1968-9
1969
1969-70 1970
1970-1
1971
1971-2 1972
1972-3
1973 1973-4
1974
1974-5 1975
1975-6
1976 1976-7
1977
1977-1978
1978
1978-79
1979
1979-80
1980
1980-1
1981
1981-2
1982
1982-1983
1983 1983-1984
1984
1984-1985
1985
1985-1986
1986
1986-1987
1987
1987-8
1988
1988-9 1989
1989-90
1990
1990-1 1991
1991-2
1992
1992-3
1993
1993-4
1994
1994-5
1995
1995-1996 1996
1996-7
1997
1997-8 1998
1998-1999
1999
1999-2000
2000
2000-1 2001
2001-2
2002
2002-3
2003
2003-4
2004
2004-5
2005 2005-6
2006
2006-7
2007
2007-8
2008
2008-9
2009
2009-10
2010
2010-11
2011
2011-12
2012 2012-2013
2013
2013-2014
2014
2014-2015
2015
2015-2016
-----> More HELP LINKS
Documentation for
TigerSoft Automatic and Optimized Signals.
How reliable
support is the DJI's rising 200-day ma?
SPY
Charts since 1994: Advisory Closing Power S7s, Accum. Index, 65-dma, Optimized
Signals.
^^^^^^^^^^^^^^^^^^^^^^^^^^^^^^^^^^^^^^^^^^^^^^^^
1/19/2016 --->
Corrections,Deeper Declines and Bear Markets since 1945.
1/21/2016
--->
High Velocity Declines since 1929
2/12/2016 --->
Presidential Elections Years and Bullish IP21 Positive Non-Confirmations at
Lower Band.
2/12/2016 --->
OBV NNCs on
DJI's Rally to 2.7% Upper Band when DJI's 65-dma is falling.
11/6/2016 --->
Killer Short Selling Techniques:
===>
Order
Here
($42.50)
It's As Easy as 1,2,3
TigerSoft "Combination" Short-Selling...
Easy as 1-2-3 Short Sales
Earlier Q-Answers
QuickSilver
Documentation (1/11/2016)
Our Different Signals
Better
understand the difference between Peerless DJI-based signals,
the one-year optimized red Signals and
the fixed signals based
on technical developments.
Introduction to
Tiger/Peerless Buys and Sells.
Different Types of TigerSoft/Peerless
CHARTS, Signals and Indicators
New
TigerPeerless
Installation and Basic Uses' Instruction
(11/25/2016)
See
the re-written materials on TigerSoft Buys and Sells.
A few more pages will be added. But users could print
this
main Installation and Uses' Page for reference.
NEW - 5/7/2017
Trading SPY WITHOUT Peerless - Some Guidelines.
When completed this will be a new Tiger Trading E-Book.
NEW - 5/10/2017
Examples of "Hands
above the Head" top patterns.
===> Please report any broken or
out-of-date links.
william_schmidt@hotmail.com
====================================================================================
5/11/2017
For the DJI and
the majority of stocks, the Operative Peerless
signal remains a Sell S4.
Tech ETFs and stocks like AAPL, ADBE,
and NVDA are little heeding the DJI's hesitation here. I've suggested
traders stay short DIA but long the high tech ETFs while their 5-day ma
keep rising.
Remaining Strong ETFs
5/11 Close 5/12 Pivot-Point
IP21
-----------------------------------------------------------------------------------
TECL
74.85 -.25
73.08
+.257
QQQ
138.29 -.11 137.54
+.262
COMPQX
6129.14 +8.55 6075.34
+.259
.....
SOXL
84.94 + .85 77.61
+.203
THE HEAD/SHOULDERS IN BIG BANKS AND
TRANSPORTS
ARE CONFOUNDING THE TRUMP BULL MARKET.
And these patterns are bearish...Sometimes very bearish.
We see the market's technical problem most clearly
in the impending
bearish head/shoulders patterns that DJI-bank stocks GS and JPM seem
to be performing. We also see it in the head/shoulders patterns of
our
DJI-13 (high priced stocks), FAS and the DJI-20 (Transports).
As long as these ETFS and stocks do not rally above the apex of their
right shoulder to destroy these pattern, there is a good chance that they
will experience the full and sudden effects of price-gravity via their own
trap-doors. In this connection, keep in mind that the appearance of
head and shoulders patterns seems to be the best predictor or precursor
for trap-door declines.
5/11/17 Index and ETF Charts:
PEERLESS DJI, Signals, Indicators Daily DJI Split Volume 10-Day Up/Down Vol
Hourly DJIA A/D Line for All Stocks.
S&P OEX NYSE NASDAQ COMPQX with CP
DIA SPY QQQ MDY IWM-TNA
Short Term Interest Rates DJI-Utilities DJI-Transp A/D Line-6000 Stocks
CrudeOil FAS GLD BBH IBB JETS JNUG KOL NUGT OIH OIL
RSX RETL SLV SOXL TECL TMF TNA
XIV YINN
To STOCKS' CHARTS
AAPL AMAT AMGN AMZN BIDU CAT FB GOOG GS IBM JPM
MASI MSFT NVDA QCOM
TSLA
Others REN, JJC, NIB, WEAT UUP (Dollar)
5/11/17 Bullish MAXCPs
Bearish MINCPS incl
TRAPDOORS (7)
(208 stocks/ETFs) (of
121 stocks/ETFs)
 RANKING OF KEY DIRECTORIES BASED PCT.OF STOCKS ABOVE 65-DMA
              5/11/17
---------------------------------------------------------------------------------------
Directory     Current       day-1         day-2         day-3         day-4         day-5
----------------------------------------------------------------------------------------
EDU            1             1             1             1             1             1
ETFS           .926          .911          .823          .823          .852          .808
NIFTY          .896          .931          .931          .862          .896          .896
HOMEBLDG       .888          .888          .833          .777          .777          .777
BEVERAGE       .85           .85           .85           .85           .85           .85
HACKERS        .833          .777          .777          .777          .777          .777
SOFTWARE       .796          .781          .75           .812          .812          .75
SOLAR          .789          .736          .684          .578          .578          .421
JETS           .777          .777          .777          .777          .777          .777
BONDFUND       .776          .803          .866          .919          .937          .91
GAMING         .733          .733          .7            .666          .733          .666
SEMI-COND      .732          .715          .698          .646          .672          .629
ELECTRON       .67           .659          .659          .634          .644          .613
MORNSTAR       .668          .697          .663          .672          .71           .676
N=14
=============================================================================================
GREEN          .645          .612          .677          .677          .709          .677
INFRA          .636          .636          .636          .636          .727          .909
NASD-100       .626          .626          .648          .626          .626          .637
COMPUTER       .6            .64           .64           .6            .6            .56
MILITARY       .6            .577          .577          .577          .577          .6
HOSPITAL       .571          .714          .571          .428          .571          .571
INDEXES        .567          .596          .596          .588          .634          .605
SP500          .558          .585          .573          .566          .587          .56
UTILITY        .555          .6            .555          .622          .622          .644
DJI-13         .538          .538          .692          .615          .769          .615
RUS-1000       .532          .564          .535          .536          .564          .529
RETAIL         .517          .678          .589          .517          .517          .5
CHINA          .516          .516          .516          .435          .483          .467
N=13
=============================================================================================
CHEM           .5            .527          .513          .5            .611          .486
DOWJONES       .5            .466          .6            .566          .6            .5
BIOTECH        .471          .487          .471          .439          .504          .512
INSURANC       .47           .5            .441          .558          .617          .617
SP-100         .453          .484          .536          .525          .546          .515
COAL           .444          .444          .333          .444          .333          .333
FINANCE        .413          .489          .445          .489          .521          .532
TRANSP         .4            .4            .45           .5            .6            .55
REIT           .398          .404          .347          .424          .466          .398
INDMATER       .387          .377          .336          .387          .418          .357
AUTO           .375          .4            .4            .35           .4            .325
N=11
=============================================================================================
BIGBANKS       .285          .285          .285          .428          .142          .142
OILGAS         .274          .3            .241          .254          .228          .176
REGBANKS       .25           .388          .444          .5            .472          .527
GOLD           .245          .15           .15           .132          .113          .037
COMODITY       .214          .214          .2            .214          .2            .2
PIPELINE       .111          .222          .111          .222          .222          .111
FOOD           0             .142          .071          .142          .071          0
N=7
====================================================================================
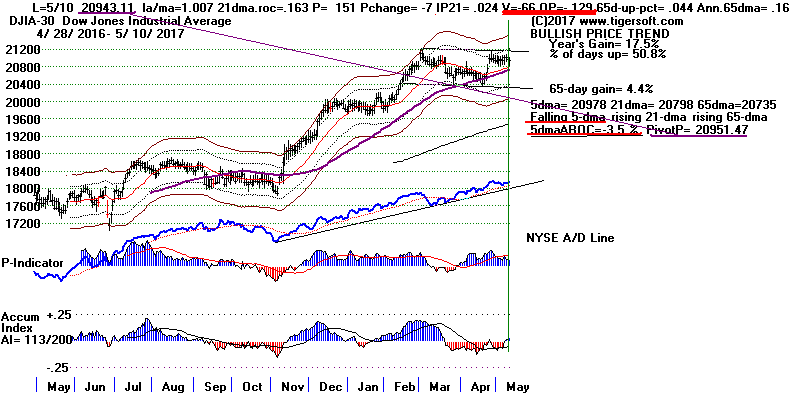
5/10/2017 For the DJI and
the majority of stocks, the Operative Peerless
signal remains a Sell S4.
For these stocks, what happens to the DJI-30
is quite significant. So, it is important that Sell S4 signals have
historically
been quite reliable. For them, even if there is a 2% DJI rally, considerable
risk may lie ahead because Peerless will probably generate a
Sell S9-V
on the DJI. A DJI retest of its rising 65-dma appears to be necessary now.
More likely, the DJI may need to test the support at its lower band and the
round number 20000.
Recently,
the DJI's ups and downs have mattered less and less for the
bravest and boldest tech stocks. But let's be safe. Traders should
probably
sell TECL, QQQ and the
NASDAQ if these close below their pivot
points.
Remaining Strong ETFs
5/10 Close 5/11 Pivot-Point
IP21
-----------------------------------------------------------------------------------
TECL
75.10 +.87
72.74
+.252
QQQ
138.4 +.08 137.04
+.215
COMPQX
6129.14 +8.55 6075.34
+.259
.....
SOXL
84.09 +5.01
76.79
+.221
THE CASE FOR CONSIDERING NVDA
THE
DECADE'S
MOST IMPORTANT TECH STOCK.
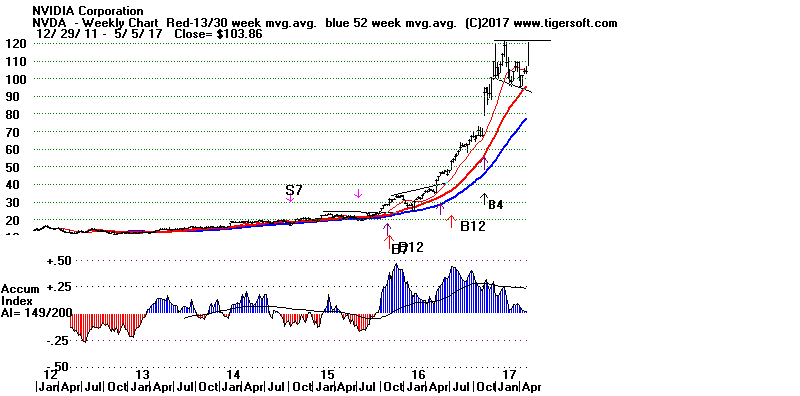
I would argue that the most important technology stock now is not
AAPL, GOOG,
AMZN, MSFT or
FB, it is Nividia, NVDA.
If it breaks out above 121, buy it.
NVDA's Graphics and Deep Learning software and chips are training the
machines and neural networks that control 3-D visualizations used in games,
automobiles, visual recognition, medical imaging, virtual reality as well as
professional data usage and storage. Surely, these fields offer huge
growth
potential for investors, especially because they are still their infancy.
For us,
it's important to appreciate that NVDA is at the center of this revolution in
graphics,
machine neural net-working and "deep learning" programming. Want to know
more about the future in these fields? NVDA's applications' Blog is well
worth
studying. See
https://blogs.nvidia.com/
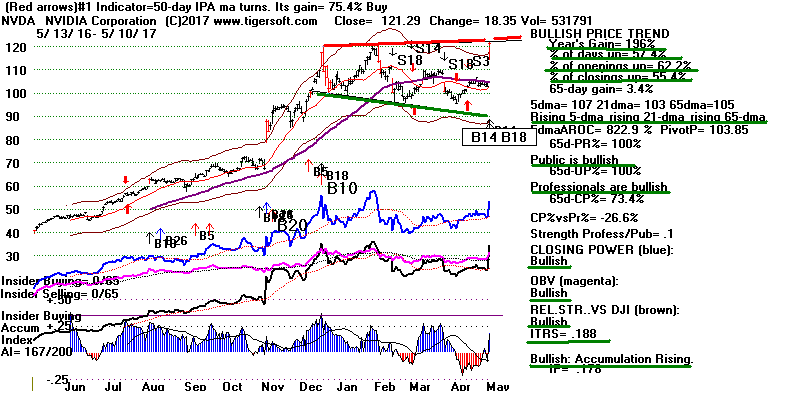
Today, NVDA reported much better earnings and revenue that was expected.
It rose 17.8% and destroyed what looked like a head/shoulders pattern.
Now it seems ready to breakout to new highs. See the daily and weekly
charts.
A new high here will put enormous pressure on the shorts to cover.
It could also set the stock loose to start
another monster-advance. If this
occurs, we should be aboard it despite the Peerless Sell S4.
A breakout by
NVDA will allow etfs like SOXL and
TECL make more big gains even as
the DJI lags or falls back to 10000. Big NVDA gains will benefit its
biggest
shareholders. Institutions own 73.4% of its stock. They are listed
by Yahoo.
See further below.
Too high priced? The head of Fidelity Semiconductors' Select Fund said in
February
that he wanted to buy more NVDA as their earnings' growth should accelerate in
2017.
(See
https://www.fidelity.com/bin-public/060_www_fidelity_com/documents/SHDOCS/FSELX/hosts/sh_comm_pmqa.000008.RETAIL_pdf.pdf
)
| |
Top
Institutional Holders in NVDA
|
Holder |
Shares |
Date
Reported |
% Out |
Value |
|
|
5/10/17 Index and ETF Charts:
PEERLESS DJI, Signals, Indicators Daily DJI Split Volume 10-Day Up/Down Vol
Hourly DJIA A/D Line for All Stocks.
S&P OEX NYSE NASDAQ COMPQX with CP
DIA SPY QQQ MDY IWM-TNA
Short Term Interest Rates DJI-Utilities DJI-Transp A/D Line-6000 Stocks
CrudeOil FAS GLD BBH IBB JETS JNUG KOL NUGT OIH OIL
RSX RETL SLV SOXL TECL TMF TNA
XIV YINN
To STOCKS' CHARTS
AAPL AMAT AMGN AMZN BIDU CAT FB GOOG GS IBM JPM
MASI MSFT NVDA QCOM
TSLA
Others REN, JJC, NIB, WEAT UUP (Dollar)
5/10/17 Bullish MAXCPs
Bearish MINCPS
TRAP-DOORS
(197 stocks/ETFs) (of
100 stocks/ETFs)
 RANKING OF KEY DIRECTORIES BASED PCT.OF STOCKS ABOVE 65-DMA
               5/10/17
---------------------------------------------------------------------------------------
Directory     Current       day-1         day-2         day-3         day-4         day-5
----------------------------------------------------------------------------------------
EDU            1             1             1             1             1             1
NIFTY          .931          .931          .862          .896          .896          .862
ETFS           .911          .823          .823          .852          .808          .852
HOMEBLDG       .888          .833          .777          .777          .777          .666
BEVERAGE       .85           .85           .85           .85           .85           .75
BONDFUND       .803          .866          .919          .937          .901          .937
SOFTWARE       .781          .75           .812          .812          .75           .781
HACKERS        .777          .777          .777          .777          .777          .722
JETS           .777          .777          .777          .777          .777          .777
SOLAR          .736          .684          .578          .578          .421          .631
GAMING         .733          .7            .666          .733          .666          .8
SEMI           .715          .698          .646          .672          .629          .629
HOSPITAL       .714          .571          .428          .571          .571          .571
MORNSTAR       .697          .663          .672          .71           .676          .689
RETAIL         .678          .589          .517          .517          .5            .5
N=15
============================================================================================
ELECTRON       .659          .659          .639          .644          .613          .603
COMPUTER       .64           .64           .6            .6            .52           .48
INFRA          .636          .636          .636          .727          .909          .818
NASD-100       .626          .648          .626          .626          .637          .593
GREEN          .612          .677          .677          .709          .677          .677
UTILITY        .6            .555          .622          .622          .644          .666
INDEXES        .596          .596          .588          .634          .605          .592
SP500          .585          .573          .566          .587          .564          .541
MILITARY       .577          .577          .577          .577          .6            .577
RUS-1000       .559          .53           .531          .559          .527          .521
DJI-13         .538          .692          .615          .769          .615          .615
CHEM           .527          .513          .5            .611          .5            .541
CHINA          .516          .516          .435          .483          .467          .467
N=13
===========================================================================================
INSURANC       .5            .441          .558          .617          .617          .558
===========================================================================================
FINANCE        .489          .445          .489          .521          .543          .5
BIOTECH        .487          .471          .439          .504          .512          .512
SP-100         .484          .536          .525          .546          .525          .484
DOWJONES       .466          .6            .566          .6            .5            .566
COAL           .444          .333          .444          .333          .333          .333
REIT           .404          .347          .424          .466          .398          .445
AUTO           .4            .4            .35           .4            .35           .275
TRANSP         .4            .45           .5            .6            .55           .45
REGBANKS       .388          .444          .5            .472          .527          .5
INDMATER       .377          .336          .387          .418          .357          .367
N=10
===========================================================================================
OILGAS         .297          .24           .253          .227          .177          .221
BIGBANKS       .285          .285          .428          .142          .285          .142
PIPELINE       .222          .111          .222          .222          .111          .222
COMODITY       .214          .2            .214          .2            .2            .214
GOLD           .15           .132          .15           .113          .037          .094
FOOD           .142          .071          .142          .071          0             .142
N=6
====================================================================================
5/9/2017
The Operative Peerless signal remains a Sell S4.
Sell S4 signals are
reliable. Even if there is a 2% rally, Peerless will probably generate a
Sell S9-V.
The DJI's Volume and Accumulation that TigerSoft uses look quite weak.
See the many bearish warnings being given now by the charts of the DJI
and DIA.
TECL, QQQ and the NASDAQ continue to be the main havens
of remaining strength. It is not uncommon for the best of the tech growth
stocks
to keep rising, sometimes spectacularly, for a month or so after the DJI tops
out.
2000 is the best example of this. See the DJI-NASDAQ chart just below.
FOR 8 WEEKS, THE DJI FELL AND NASDAQ ROSE in JAN & FEB 2000.
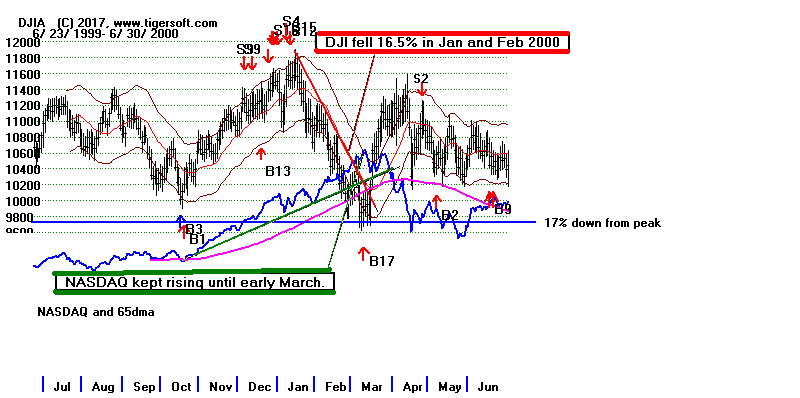
But even the best of the tech stocks can only advance for just so long in
splendid isolation. Sell these if they close below their 5-dma
pivot-points.
Remaining Strong ETFs
5/9 Close 5/10 Pivot-Point
---------------------------------------------------------
TECL
74.23 72.3
QQQ
138.32 136.99
COMPQX
6120.59 6072.55
TOO MANY NEGATIVES FOR DJI NOW.
Already, I have note that the market must cope with the rising probability
of higher short-term interest rates and a much
tighter monetary policy over
the next couple of years. I've also warned that it is far from certain
that
there will be a big tax cut this year. In addition, the danger of a
nuclear
war in Korea has not disappeared. Now, the market has another negative
development to ponder.
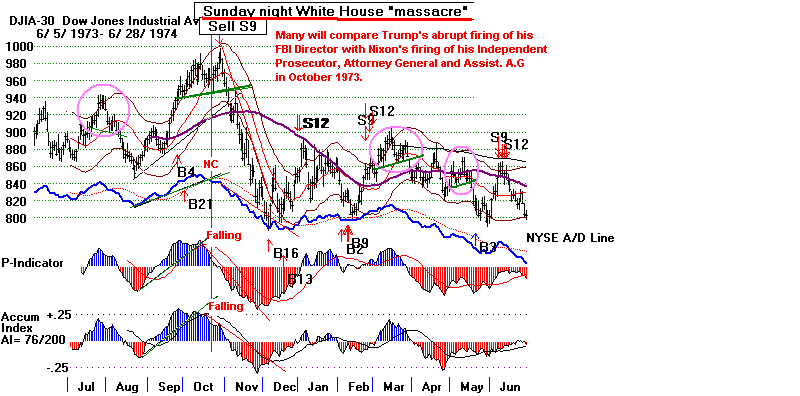
Pres. Trump today abruptly fired James Comey, his FBI Director. It can not
be a coincidence that Comey told Congress that he was intent on conducting
a thorough and independent investigation into the Trump organization's collusion
with Russians last year. What is Trump so desperate to hide? This
eerily reminds
me of Nixon's firing of the Watergate Special Prosecutor and his Attorney
General.
This coincided with a very bad time for the stock market. Are we in for a
repeat?
See tonight's NY Times article:
https://www.nytimes.com/2017/05/09/us/politics/james-comey-fired-fbi.html?emc=edit_th_20170510&nl=todaysheadlines&nlid=58223894
Nixon Forces Firing
of Cox; Richardson, Ruckelshaus Quit
President Abolishes Prosecutor's Office; FBI Seals
Records
By Carroll Kilpatrick
Washington Post Staff Writer
Sunday, October 21, 1973;
Page A01
"In the most traumatic government upheaval of the Watergate crisis,
President Nixon yesterday discharged Special Prosecutor Archibald Cox
and accepted the resignations of Attorney General Elliot L. Richardson
and Deputy Attorney General William D. Ruckelshaus.
The President also abolished the office of the special prosecutor and
turned over to the Justice Department the entire responsibility for
further investigation and prosecution of suspects and defendants in
Watergate and related cases."
(
http://www.washingtonpost.com/wp-srv/national/longterm/watergate/articles/102173-2.htm
)
|
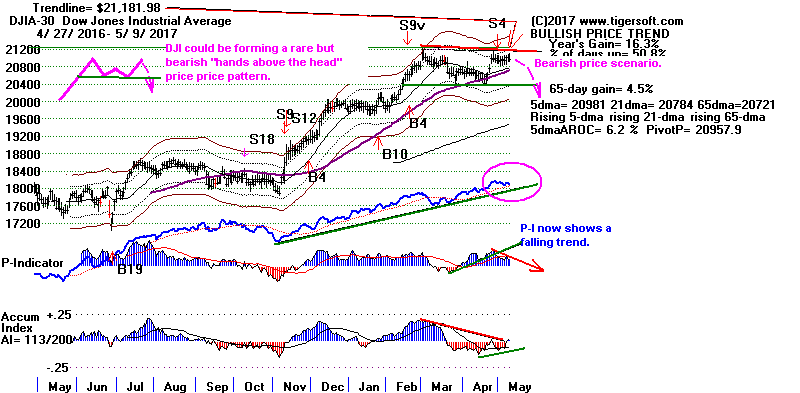
The TigerSoft DJI and DIA Charts
Now Are Emitting A Number of Bearish Warnings.
DJIA could be forming a rare, but
bearish "hands above the head" price pattern.
That it is unable to string together 3 straight up-days shows very
steady Big Money
distribution on strength.

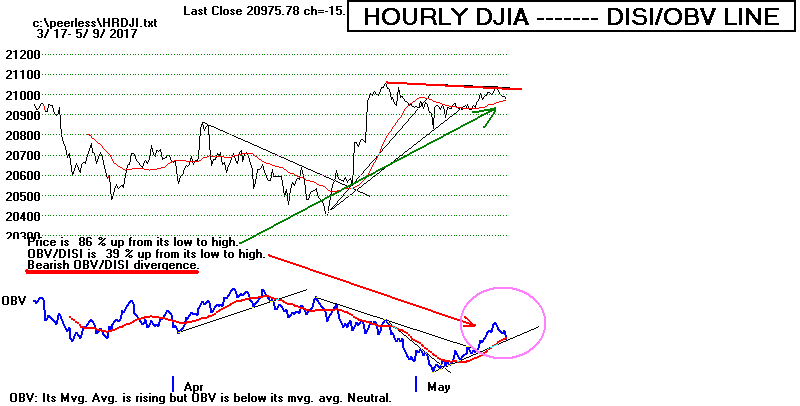
|
HOURLY DJIA shows Down-Hour again
picking up. This is short-term bearish.
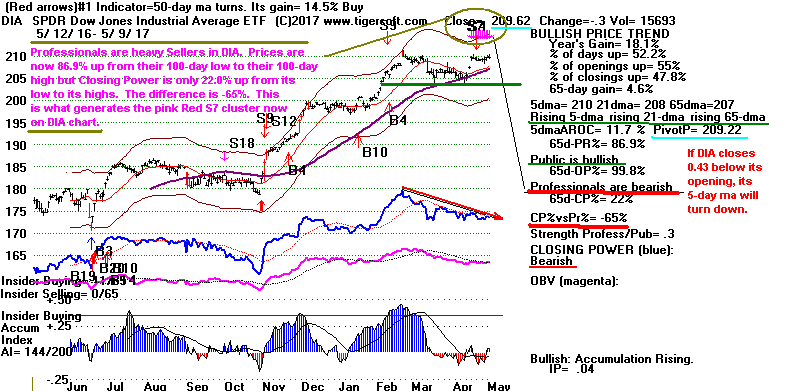
 |
DIA shows significant and steady
Professional Selling to the general public.
 |
5/9/17 Index and ETF Charts:
PEERLESS DJI, Signals, Indicators Daily DJI Split Volume 10-Day Up/Down Vol
Hourly DJIA A/D Line for All Stocks.
S&P OEX NYSE NASDAQ COMPQX with CP
DIA SPY QQQ MDY IWM-TNA
Short Term Interest Rates DJI-Utilities DJI-Transp A/D Line-6000 Stocks
CrudeOil FAS GLD BBH IBB JETS JNUG KOL NUGT OIH OIL
RSX RETL SLV SOXL TECL TMF TNA XIV YINN
To STOCKS' CHARTS
AAPL AMAT AMGN AMZN BIDU CAT FB GOOG GS IBM JPM
MASI MSFT NVDA QCOM
TSLA
Others REN, JJC, NIB, WEAT UUP (Dollar)
5/9/17 Bullish MAXCPs
Bearish MINCPS
incl "TRAPDOORS" (5)
5/8/2017 High Priced stocks Breaking Badly Down: 7
 RANKING OF KEY DIRECTORIES BASED PCT.OF STOCKS ABOVE 65-DMA
               5/9/17
---------------------------------------------------------------------------------------
Directory     Current       day-1         day-2         day-3         day-4         day-5
----------------------------------------------------------------------------------------
EDU            1             1             1             1             1             1
NIFTY          .931          .862          .896          .896          .896          .965
BONDFUND       .866          .919          .937          .901          .937          .91
BEVERAGE       .85           .85           .85           .85           .75           .75
HOMEBLDG       .833          .777          .777          .777          .722          .722
ETFS           .823          .823          .852          .808          .852          .926
HACKERS        .777          .777          .777          .777          .722          .666
JETS           .777          .777          .777          .777          .777          .777
SOFTWARE       .75           .812          .812          .75           .781          .765
GAMING         .7            .666          .733          .666          .8            .766
SEMI           .698          .646          .672          .629          .637          .672
DJI-13         .692          .615          .769          .615          .615          .692
SOLAR          .684          .578          .578          .421          .631          .578
GREEN          .677          .677          .709          .677          .677          .645
N=14
=============================================================================================
MORNSTAR       .663          .672          .71           .676          .689          .739
ELECTRON       .659          .639          .649          .613          .608          .644
NASD-100       .655          .634          .634          .645          .602          .666
COMPUTER       .64           .6            .6            .52           .48           .64
INFRA          .636          .636          .727          .909          .818          .909
DOWJONES       .6            .566          .6            .5            .566          .6
INDEXES        .596          .588          .634          .605          .596          .634
RETAIL         .589          .517          .517          .5            .517          .5
MILITARY       .577          .577          .577          .6            .577          .622
SP500          .573          .566          .587          .564          .543          .581
HOSPITAL       .571          .428          .571          .571          .571          .857
UTILITY        .555          .622          .622          .644          .666          .666
SP-100         .536          .525          .546          .525          .484          .505
RUS-1000       .535          .536          .564          .532          .527          .569
CHINA          .516          .435          .483          .467          .467          .516
CHEM           .513          .5            .611          .5            .541          .583
N=16
==========================================================================================
BIOTECH        .474          .438          .501          .517          .517          .565
TRANSP         .45           .5            .6            .55           .45           .55
FINANCE        .445          .489          .521          .543          .51           .5
REGBANKS       .444          .5            .472          .527          .5            .416
INSURANC       .441          .558          .617          .617          .558          .5
AUTO           .4            .35           .4            .35           .275          .325
REIT           .347          .424          .466          .398          .445          .569
INDMATER       .336          .387          .418          .357          .367          .428
N=8
============================================================================================
COAL           .333          .444          .333          .333          .333          .333
BIGBANKS       .285          .428          .142          .285          .142          .142
OILGAS         .24           .253          .227          .177          .221          .259
COMODITY       .197          .211          .197          .197          .211          .281
GOLD           .132          .132          .132          .037          .094          .169
PIPELINE       .111          .222          .222          .111          .222          .444
FOOD           .071          .142          .071          0             .142          .214
N=7
====================================================================================
5/8/2017
The Operative Peerless signal remains a
Sell S4.
The
DJI, however,
wants to keep us in suspense a while longer, neither falling back or breaking
out. SPY,
IWM and
MDY also seem stuck in
their trading ranges. What
should we do?
Performance investors are not sitting still. They
are jumping aboard the best
performing bigger high tech stocks. I think we should, too.
Now more and more of these big tech stocks, led by
AAPL, are preparing
for swift and possibly climactic vertical ascents where they surpass the top of
their price channel. AAPL today made such a
breakout. TECL and QQQ
have
also done the same. The advances that follow breakouts above the top of
price
channels are often spectacular. Our Tiger tools allow us to play these
with
reasonable safety.
Because of the very high Power Ranking, too, and despite the Peerless S4,
I think we should buy
TECL and
QQQ, provided we
work with steep uptrendlines
and stop-sells underneath them or use closes below their pivot-points to sell,
they
are worth going long. We will follow them
nightly here.
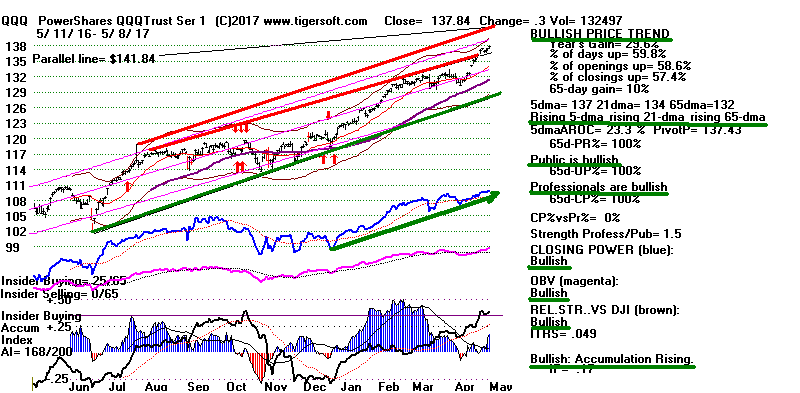
Consider the current Accumulation Index Ranking for
the DJI-30 stocks and the
biggest, most important ETFs. TECL is at the top of this AI/200, Power
Ranking,
IP21, is in the very bullish "BOTHUP" condition and has outperformed DJI by
a whopping 14.5% over the last 50 trading days.
HIGHEST POWER RANKED
in DJI-30 Download from Tiger Data base.
Symbol AI/200 Power OBV% IPA%
IP21 Up% OpenPwr ClosPwr ITRS
---------------------------------------------------------------------------------------------------------
TECL
182 584
-1% 0% +.23
59% Up Up
+.145
Close = 73.98 5-dma pivot point = 72.75
SOXL
180 511 -10%
+15% +.15 56.6% Up
Down! +.086
XIV
171 438
-33%
-3% +.06 61% Up
? +.22
QQQ
168 448
0 0%
+.17 59.8% Up Up
+.049
Close = 137.84 5-dma pivot point = 137.43
DD
165 344
-19% +17%
+.02 50.6% Up
Down -.004
AAPL
163 483 -4%
0% +.15 55.4% Up
Up +.144
 |
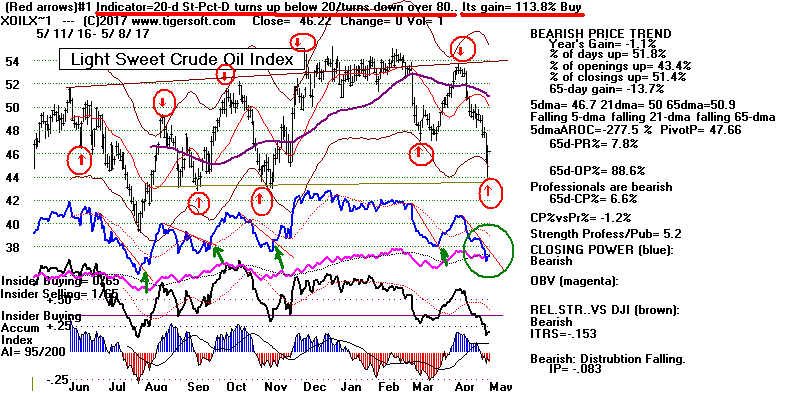
Another Buy recommendation is
OIL as soon as its Closing Power
downtrend is broken. See just below how its action has just produced a red
Stochastic buy signal and these signals have gained more than 100% over
the last year.
5/8/17 Index and ETF Charts:
PEERLESS DJI, Signals, Indicators Daily DJI Split Volume 10-Day Up/Down Vol
Hourly DJIA A/D Line for All Stocks.
S&P OEX NYSE NASDAQ COMPQX with CP
DIA SPY QQQ MDY IWM-TNA
Short Term Interest Rates DJI-Utilities DJI-Transp A/D Line-6000 Stocks
CrudeOil FAS GLD BBH IBB JETS JNUG KOL NUGT OIH OIL
RSX RETL SLV SOXL TECL TMF TNA XIV YINN
To STOCKS' CHARTS
AAPL AMAT AMGN AMZN BIDU CAT FB GOOG GS IBM JPM
MASI MSFT NVDA QCOM
Others REN, JJC, NIB, WEAT UUP (Dollar)
5/8/17 Bullish MAXCPs
Bearish MINCPS
High Priced stocks Breaking Badly Down: 7
 RANKING OF KEY DIRECTORIES BASED PCT.OF STOCKS ABOVE 65-DMA
              5/8/17
---------------------------------------------------------------------------------------
Directory     Current       day-1         day-2         day-3         day-4         day-5
----------------------------------------------------------------------------------------
EDU            1             1             1             1             1             1
BONDFUND       .919          .937          .901          .937          .91           .937
NIFTY          .862          .896          .896          .896          .965          1
BEVERAGE       .85           .85           .85           .75           .75           .75
ETFS           .823          .852          .808          .852          .926          .882
SOFTWARE       .812          .812          .75           .781          .765          .765
HACKERS        .777          .777          .777          .722          .666          .722
HOMEBLDG       .777          .777          .777          .722          .722          .777
JETS           .777          .777          .777          .777          .777          .555
GREEN          .677          .709          .677          .677          .645          .612
MORNSTAR       .672          .71           .676          .689          .739          .743
N=11
GAMING         .666          .733          .666          .8            .766          .8
SEMI           .646          .672          .629          .637          .681          .698
ELECTRON       .639          .649          .618          .608          .649          .659
INFRA          .636          .727          .909          .818          .909          .909
NASD-100       .626          .626          .637          .593          .659          .67
UTILITY        .622          .622          .644          .666          .666          .644
DJI-13         .615          .769          .615          .615          .692          .769
COMPUTER       .6            .6            .52           .48           .64           .6
INDEXES        .588          .634          .605          .596          .638          .634
SOLAR          .578          .578          .421          .631          .578          .526
MILITARY       .577          .577          .6            .577          .622          .622
SP500          .568          .589          .566          .545          .585          .583
DOWJONES       .566          .6            .5            .566          .6            .666
INSURANC       .558          .617          .617          .558          .529          .647
RUS-1000       .536          .564          .532          .527          .57           .581
SP-100         .525          .546          .525          .484          .505          .505
RETAIL         .517          .517          .5            .517          .517          .464
CHEM           .507          .623          .507          .55           .594          .623
N=18
===========================================================================================
REGBANKS       .5            .472          .527          .5            .388          .444
TRANSP         .5            .6            .55           .45           .55           .45
FINANCE        .489          .521          .543          .51           .5            .532
COAL           .444          .333          .333          .333          .333          .333
BIOTECH        .442          .501          .509          .521          .565          .584
CHINA          .435          .483          .467          .467          .532          .548
BIGBANKS       .428          .142          .285          .142          .142          .142
HOSPITAL       .428          .571          .571          .571          .857          .428
REIT           .424          .466          .398          .445          .564          .616
INDMATER       .387          .418          .357          .367          .428          .469
AUTO           .35           .4            .35           .275          .325          .375
N=11
-------------------------------------------------------------------------------------------
OILGAS         .253          .227          .177          .221          .259          .259
PIPELINE       .222          .222          .111          .222          .444          .444
COMODITY       .211          .197          .197          .211          .281          .295
FOOD           .142          .071          0             .142          .214          .285
GOLD           .132          .113          .056          .094          .169          .15
N=5
====================================================================================
5/5/2017
The Operative Peerless signal remains a
Sell S4.
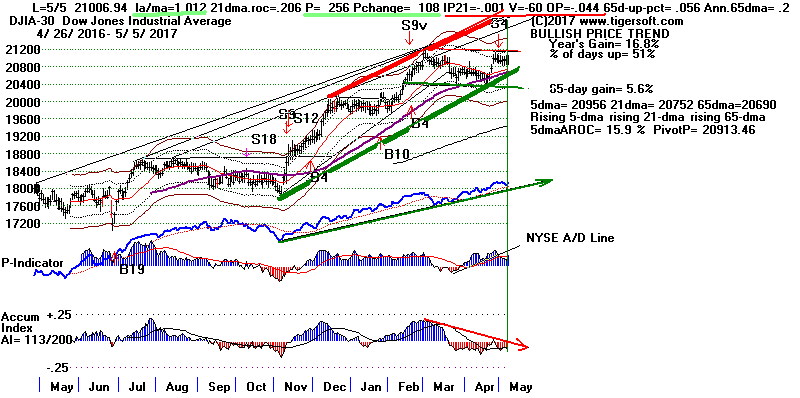
This has been
a reliable Sell signal. There have only been two cases since 1945
when there was a paper loss greater than 2%, about 400 points
here. The DJI might still make a flat-top breakout above 21200,
but our volume indicators are quite negative and the Accum. Index
is only +.001. So, another 1.2% rally will likely bring a Sell S9-V
and possibly a S12 also. Our DIA chart also offers us a clear
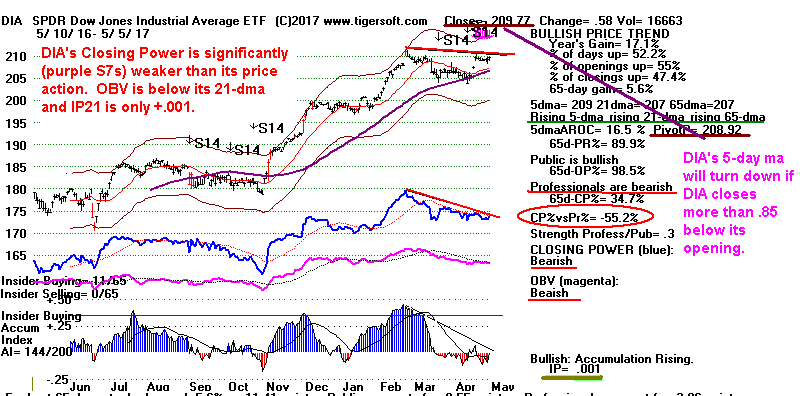
warning:
Professionals are outright bearish. We see this from the purple
Tiger S7s. Our Tiger Closing Power is badly lagging prices. So, is
the
Hourly DJI's DISI-OBV.
Of course, the DJI could just be much weaker than the other averages
because it is made up of older and more irrelevant blue-chips, but that
is not what Peerless Stock Market Timing teaches. Much more likely,
the NASDAQ, QQQ and TECL (tech stocks' 3x ETF) will not be able
to rally too much longer just by themselves. Surely, their new highs
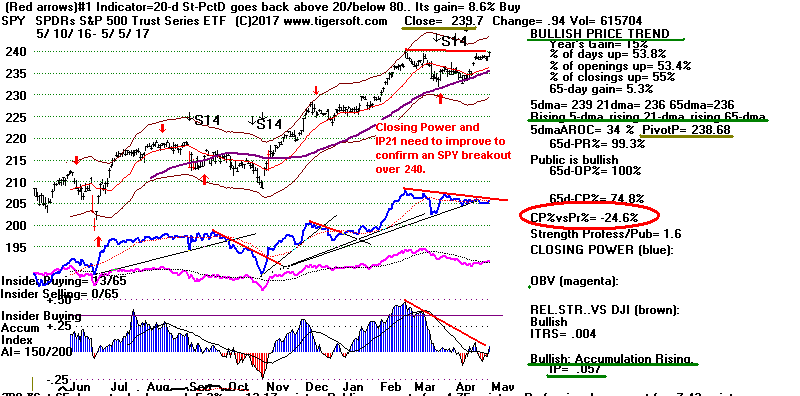
will need to be matched, at least, by the SP-500. As you can see below
in the SPY chart, Professionals are still cautious here. Perhaps, they
are simply waiting for a clear SPY breakout.
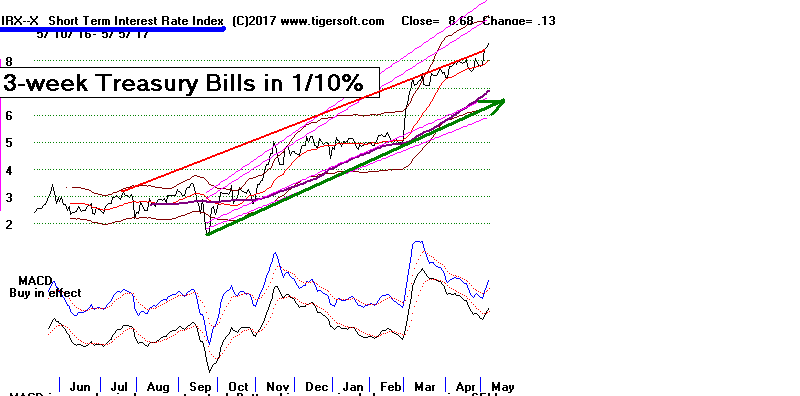
The expected victory by the French center coalition is, I think, less important
the warning now seen in the
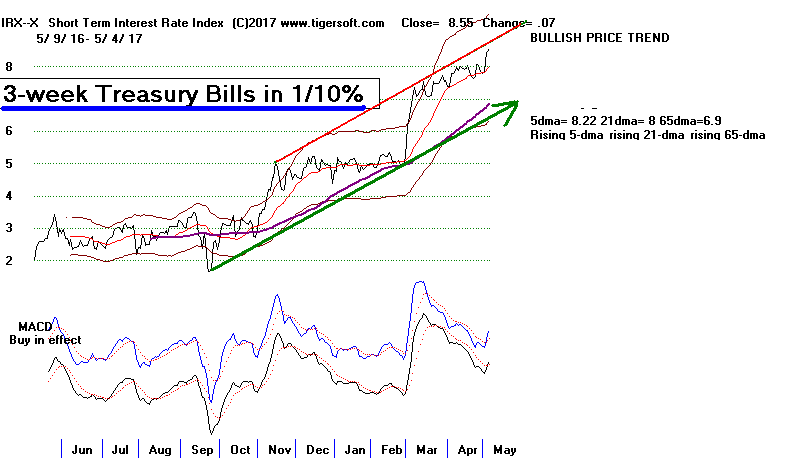
rising Short-Term Interest rates' chart below.
With April's Job Report showing 210,000 new jobs and Unemployment
making new lows, the stage would seem to be set for the FED to raise
short-term rates again. This would make the third increase in the last
year. Rising rates are apt to be troublesome for the market, especially if
the FED starts to sell some of the huge $5 trillion debt portfolio that it
bought up
to inflate stock and bond prices between 2009 and 2013. Unless Congress
can reach agreement on a big tax decrease AND an Infrastructure spending
increase, stock prices will likely plateau and may even fall back to retest the
18000
level.
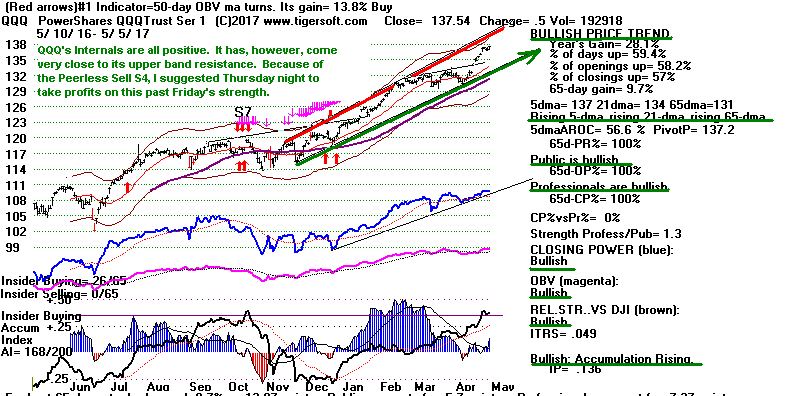
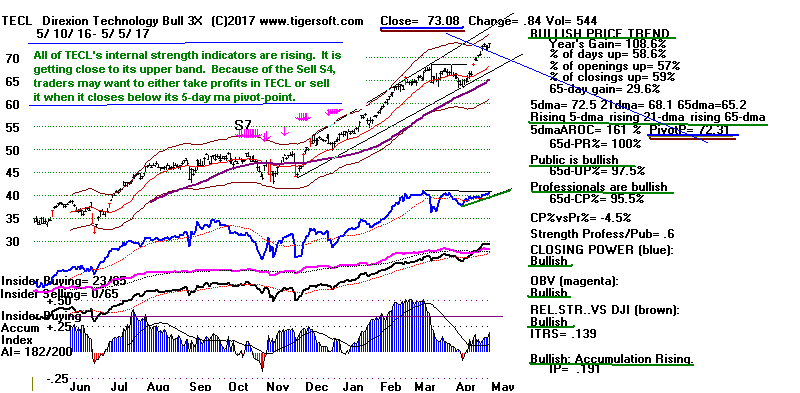
I think taking profits in QQQ or TECL when their 5-day ma turn down
if you still have them still is reasonable. Hold DIA short now out of respect
for the Sell S4. SPY might start a quick spurt upwards tomorrow.
Very
short-term traders may choose to play the flat-top breakout long. But
do not hold if it closes below its 5-day ma "pivot-point". This would
mean selling it if it closes down more than 1.02 from its Monday opening.
DJIA
SHORT-TERM INTEREST RATES
DIA
SPY
may still achieve a flat-topped breakout.
However, SPY's weak internals do not yet
show the marginal new closing high can be trusted.
QQQ is very close to its upper band
resistance.
This should limit its upside potential.
TECL
need only close 0.78 below its close to have its 5-dma turn down Monday.
5/5/17 Index and ETF Charts:
PEERLESS DJI, Signals, Indicators Daily DJI Split Volume 10-Day Up/Down Vol
Hourly DJIA A/D Line for All Stocks.
S&P OEX NYSE NASDAQ COMPQX with CP
DIA SPY QQQ MDY IWM-TNA
Short Term Interest Rates DJI-Utilities DJI-Transp A/D Line-6000 Stocks
CrudeOil FAS GLD BBH IBB JETS JNUG KOL NUGT OIH OIL
RSX RETL SLV SOXL TECL TMF TNA XIV YINN
To STOCKS' CHARTS
AAPL AMAT AMGN AMZN BIDU CAT FB GOOG GS IBM JPM
MASI MSFT NVDA QCOM
Others REN, JJC, NIB, WEAT UUP (Dollar)
5/5/17 Bullish MAXCPs
Bearish MINCPS
High Priced stocks Breaking Badly Down: 10
 RANKING OF KEY DIRECTORIES BASED PCT.OF STOCKS ABOVE 65-DMA
              5/5/17
---------------------------------------------------------------------------------------
Directory     Current       day-1         day-2         day-3         day-4         day-5
----------------------------------------------------------------------------------------
EDU            1             1             1             1             1             1
BONDFUND       .937          .901          .937          .91           .937          .892
NIFTY          .896          .896          .896          .965          1             1
ETFS           .852          .808          .852          .926          .882          .852
BEVERAGE       .85           .85           .75           .75           .75           .8
SOFTWARE       .812          .75           .781          .765          .765          .75
HACKERS        .777          .777          .722          .666          .722          .777
HOMEBLDG       .777          .777          .722          .722          .777          .777
JETS           .777          .777          .777          .777          .555          .555
DJI-13         .769          .615          .615          .692          .769          .769
GAMING         .733          .666          .8            .766          .8            .7
INFRA          .727          .909          .818          .909          .909          .909
MORNSTAR       .71           .676          .689          .739          .743          .747
GREEN          .709          .677          .677          .645          .612          .645
SEMI           .672          .629          .637          .681          .706          .689
N=15
---------------------------------------------------------------------------------------------
ELECTRON       .649          .618          .613          .649          .664          .675
INDEXES        .634          .605          .596          .638          .638          .617
NASD-100       .634          .645          .602          .666          .677          .709
UTILITY        .622          .644          .666          .666          .644          .711
INSURANC       .617          .617          .558          .529          .647          .676
CHEM           .605          .507          .549          .577          .591          .647
COMPUTER       .6            .52           .48           .64           .6            .64
DOWJONES       .6            .5            .566          .6            .666          .666
TRANSP         .6            .55           .45           .55           .45           .45
SP500          .589          .566          .545          .585          .585          .6
SOLAR          .578          .421          .631          .578          .526          .578
MILITARY       .577          .6            .577          .622          .622          .644
HOSPITAL       .571          .571          .571          .857          .428          .428
RUS-1000       .564          .532          .527          .57           .581          .586
SP-100         .546          .525          .484          .505          .505          .556
FINANCE        .521          .543          .51           .5            .532          .478
RETAIL         .517          .5            .517          .517          .464          .482
BIOTECH        .505          .509          .513          .569          .588          .592
N=18
-------------------------------------------------------------------------------------------
CHINA          .483          .467          .467          .532          .532          .516
REGBANKS       .472          .527          .5            .388          .444          .416
REIT           .466          .398          .445          .564          .621          .569
INDMATER       .418          .357          .367          .428          .489          .479
AUTO           .4            .35           .275          .325          .35           .375
N=5
-------------------------------------------------------------------------------------------
COAL           .333          .333          .333          .333          .333          .111
OILGAS         .227          .177          .221          .259          .259          .221
PIPELINE       .222          .111          .222          .444          .444          .333
COMODITY       .197          .197          .211          .281          .295          .281
BIGBANKS       .142          .285          .142          .142          .142          0
GOLD           .113          .037          .113          .169          .15           .188
FOOD           .071          0             .142          .214          .285          .142
N=7
====================================================================================
====================================================================================
5/4/2017
The operative Peerless signal is a
Sell S4.
The DJI stands 1.1% over
its 21-day ma but shows Accum/Distribution and volume indicators
that are quite negative. Our
"IP21" is -.068, the
V-I is -99 and our
OBVPct for the DJI chart below is -.141.
As a result, it would not take much of
a rally from here, about +1.2%, to bring about a Peerless Sell S12 or Sell S15
of both. A very positive Jobs' number tomorrow, over +250,000, could cause
such a pop upwards in the DJI.
We should sell into that strength
many of our long positions. A number over
+250,000 would eclipse
last month's weak 98,000 new jobs' report. I think a very positive number
is
expected tomorrow. Yellen said as much. But the truth is that a very
"good"
number is bound to give the Fed more reason to raise short-term rates and
even start selling off some of the massive $5 trillion of its inventory of
debt
that it has bought in recent years to prop the market up.
Non Agric.
New Jobs
in 1000s.
(Labor Dept) |
| Year |
Jan |
Feb |
Mar |
Apr |
May |
Jun |
Jul |
Aug |
Sep |
Oct |
Nov |
Dec |
| 2007 |
240 |
89 |
190 |
80 |
143 |
75 |
-34 |
-20 |
88 |
84 |
114 |
98 |
| 2008 |
17 |
-84 |
-78 |
-210 |
-186 |
-162 |
-213 |
-267 |
-450 |
-474 |
-766 |
-694 |
| 2009 |
-793 |
-702 |
-823 |
-687 |
-349 |
-471 |
-329 |
-213 |
-220 |
-204 |
-2 |
-275 |
| 2010 |
23 |
-68 |
164 |
243 |
524 |
-137 |
-68 |
-36 |
-52 |
262 |
119 |
87 |
| 2011 |
43 |
189 |
225 |
346 |
77 |
225 |
69 |
110 |
248 |
209 |
141 |
209 |
| 2012 |
358 |
237 |
233 |
78 |
115 |
76 |
143 |
177 |
203 |
146 |
132 |
244 |
| 2013 |
211 |
286 |
130 |
197 |
226 |
162 |
122 |
261 |
190 |
212 |
258 |
47 |
| 2014 |
190 |
151 |
272 |
329 |
246 |
304 |
202 |
230 |
280 |
227 |
312 |
255 |
| 2015 |
234 |
238 |
86 |
262 |
344 |
206 |
254 |
157 |
100 |
321 |
272 |
239 |
| 2016 |
126 |
237 |
225 |
153 |
43 |
297 |
291 |
176 |
249 |
124 |
164 |
155 |
| 2017 |
216 |
232(R) |
79(R) |
211(P) |
|
|
|
|
|
|
|
|
| P : preliminary |
https://data.bls.gov/timeseries/CES0000000001?output_view=net_1mth
|
|
Short Term Rates are already rising steeply. This hurts the NYSE A/D Line.
With Retailing weak and many Commodities and OIL falling, one
has to wonder will any FED tightening bring about serious economic
weakness and endanger the long bull market. The risks seem greater
than the rewards unless you think that Congress will actually vote
to lower taxes and provide a big Infrastructure stimulus plan. I doubt
if this will happen.
Technical Warning Signs in Peerless chart of DJIA
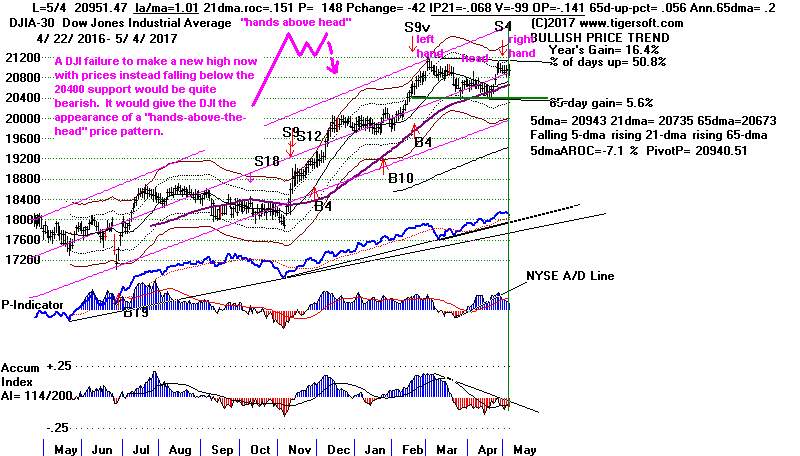
Today, by hovering just two hundred points from an all-time high,
the DJI-30 maintained the appearance that the stock market is
still healthy and safe after 8 years of rallying. Keeping up
such appearances to almost the "bitter end", after all, is the main function
of this "venerable" Blue-Chip average. But in actuality, today there
were 828 more down than up on the NYSE and we may now be seeing
an end to the era in which low interest rates keep the NYSE A/D Line
bullishly rising.
This is becoming a
scary
stock market. If you doubt it, look at today's
22
"TrapDoor" stocks.
Yesterday,
there were only 16. "Trap-doors"
suddenly drop 10% or more, sometimes simply because they break their
steep price-up-trends. Risk is becoming too great and traders are grabbing
profits while they still can. We should so the same, I think.
Sell TECL and QQQ.
Short some of Bearish MINCP stocks and others
completing head/shoulders
patterns.
We are already short DIA.

Many of these "trap-Door" stocks were until very
recently the
best performing big-gainers. An utter lack of bids is becoming
apparent in a good number of the stocks completing bearish
head/shoulders patterns or are breaking key support after
showing steady red distribution. As traders start noticing
these big breaks to the downside, they will become more and more
nervous about their own holdings. It does not look like a
good time to be long so-called high-performance "growth" stocks.
Reaching its upper band after a long advance was
the primary way, one might have judged MASI a sell.
HTGC's top was easier to spot. Note the weakening
Blue Closing Power and negative Accumulation Index
just before its big decline. Watch to see if GKOS completes
its bearish head/shoulders pattern and then see what happens
to it. We will be reviewing these "TrapDoor" stocks this
weekend to see if they can re-gain their footing. If not, it
will be a bad sign for this 8+ year old bull market, 2009-2017?
5/4/17 Index and ETF Charts:
PEERLESS DJI, Signals, Indicators Daily DJI Split Volume 10-Day Up/Down Vol
Hourly DJIA A/D Line for All Stocks.
S&P OEX NYSE NASDAQ COMPQX with CP
DIA SPY QQQ MDY IWM-TNA
Short Term Interest Rates DJI-Utilities DJI-Transp A/D Line-6000 Stocks
CrudeOil FAS GLD BBH IBB JETS JNUG KOL NUGT OIH OIL
RSX RETL SLV SOXL TECL TMF TNA XIV YINN
To STOCKS' CHARTS
AAPL AMAT AMGN AMZN BIDU CAT FB GOOG GS IBM JPM
MASI MSFT NVDA QCOM
Others REN, JJC, NIB, WEAT UUP (Dollar)
5/4/17 Bullish MAXCPs
Bearish MINCPS
====================================================================================
5/3/2017
The operative Peerless signal is an
Sell S4. The
FED said today
that they would hold off raising rates until they see more data. Yellen
warned, though, that last month's poor Jobs Report, which was under +100,000,
was most likely an aberration. If so, rates would probably then be going
up.
This statement makes this Friday's Jobs' number very significant.
Today, the DJI did turn up from an early loss.
An expected Trump victory in
Congress on repealing ObamaCare may be the reason. So, perhaps, the DJI
will
breakout above its flat top at 11200. If it does spurt upwards, a Sell
S12
or S15 seem likely given the DJI's negative IP21, V-I and OBVPct readings.
(See
https://www.nytimes.com/2017/05/03/us/politics/gop-eyes-8-billion-addition-to-win-a-crucial-vote-to-the-latest-health-bill.html?emc=edit_th_20170504&nl=todaysheadlines&nlid=58223894&_r=0
)
Today saw 556 more down than up on the NYSE and Down Volume was
150 million more than up volume. The NASDAQ,
QQQ and many tech stocks
like AAPL and FB did
back-off from their upper band resistance levels today.
I would think we will see more of that tomorrow. Sell
TECL if its Closing Power
turns down (a lower close than the opening) tomorrow.
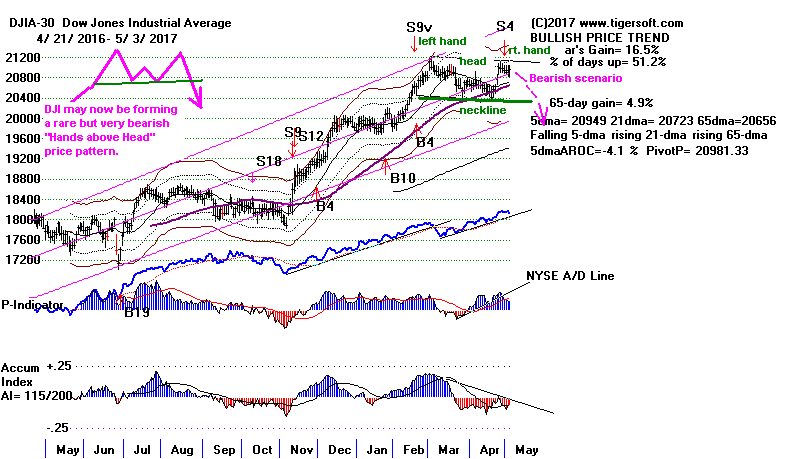
The DJI is stuck between a "rock and a hard place."
If it rallies, its
negative volume internals will likely produce new red Peerless Sells.
If it falls and breaks its neckline support, it will
complete a rare, but
very bearish "hands above the head" price pattern.
Similarly,
if the Jobs' numbers are good on Friday, the Fed will probably be
raising rates. But if the Jobs numbers are poor on Friday, it will
show that stocks have probably over-reached the economy unless
Congress can cuts taxes and launch an infrastructure spending
program to make up for the weakening economic growth.


The Number of one-day "Trap-Door" Stocks Is
Increasing.
... 16 today....
Download TRAPDOOR.exe stocks from our Data page.
These are
higher priced stocks down more than 8% in one day. When the
number of "trap-door" stocks suddenly jumps up, it is a warning
that institutional confidence in the market is waning. It also serves
to un-nerve investors that their pet stocks may be next. Most often
we see typical early warnings with these stocks, such as key support
failures, head/shoulders patterns (FLT, IPHI-11%, NBL, OMI, PPLT, SNI,
AKAM -16%, GLT--11%) or breaks in 65-dma (BG-12%, BGFV, MBT,
RXDX, VRSX, KTCC, and S. But sometimes, and this is the scariest of all,
there are no clear technical warnings. See below AZPN-9%, NANO-15%,
TOWR -11%, HSKA. We will keep a running count of these stocks
each night. Download the stocks using TRAPDOOR.exe tomorrow.
5/3/17 Index and ETF Charts:
PEERLESS DJI, Signals, Indicators Daily DJI Split Volume 10-Day Up/Down Vol
Hourly DJIA A/D Line for All Stocks.
S&P OEX NYSE NASDAQ COMPQX with CP
DIA SPY QQQ MDY IWM-TNA
Short Term Interest Rates DJI-Utilities DJI-Transp A/D Line-6000 Stocks
CrudeOil FAS GLD BBH IBB JETS JNUG KOL NUGT OIH OIL
RSX RETL SLV SOXL TECL TMF TNA XIV YINN
To STOCKS' CHARTS
AAPL AMAT AMGN AMZN BIDU CAT FB GOOG GS IBM JPM
MASI MSFT NVDA QCOM
Others REN, JJC, NIB, WEAT UUP (Dollar)
5/3/17 Bullish MAXCPs
Bearish MINCPS
(of
148 (-37) stocks/ETFs) (of 196 (-34) stocks/ETFs)
 RANKING OF KEY DIRECTORIES BASED PCT.OF STOCKS ABOVE 65-DMA
   + 30 show more than 50% of their stocks are above the 65-dma.
   - 14 show more than 50% of their stocks are above the 65-dma.

               5/3/17
---------------------------------------------------------------------------------------
Directory     Current       day-1         day-2         day-3         day-4         day-5
----------------------------------------------------------------------------------------
EDU            1             1             1             1             1             1
BONDFUND       .937          .91           .937          .892          .875          .866
NIFTY          .896          .965          1             1             .965          .965
ETFS           .852          .926          .882          .852          .852          .867
INFRA          .818          .909          .909          .909          .909          .818
GAMING         .793          .758          .793          .689          .724          .827
SOFTWARE       .781          .765          .765          .75           .765          .734
JETS           .777          .777          .555          .555          .555          .555
BEVERAGE       .75           .75           .75           .8            .8            .8
HACKERS        .75           .687          .75           .812          .75           .75
HOMEBLDG       .722          .722          .777          .777          .888          .888
MORNSTAR       .689          .739          .743          .743          .777          .81
GREEN          .677          .645          .612          .645          .709          .806
N=13
--------------------------------------------------------------------------------------------
UTILITY        .666          .666          .644          .711          .666          .733
SEMI           .637          .681          .706          .689          .767          .715
SOLAR          .631          .578          .526          .578          .631          .578
HOSPITAL       .625          .875          .375          .375          .375          .375
DJI-13         .615          .692          .769          .769          .769          .769
ELECTRON       .604          .647          .663          .673          .711          .673
INDEXES        .596          .638          .638          .617          .651          .676
NASD-100       .593          .659          .67           .692          .703          .681
MILITARY       .577          .622          .622          .644          .644          .622
DOWJONES       .566          .6            .666          .666          .666          .7
INSURANC       .558          .529          .647          .676          .794          .764
CHEM           .549          .577          .591          .647          .676          .704
SP500          .543          .583          .583          .594          .619          .633
RUS-1000       .522          .566          .576          .58           .617          .639
RETAIL         .517          .517          .464          .482          .517          .535
BIOTECH        .516          .564          .588          .588          .584          .6
FINANCE        .51           .5            .532          .478          .597          .652
N=17
=============================================================================================
REGBANKS       .5            .388          .444          .416          .666          .805
=============================================================================================
SP-100         .484          .505          .505          .546          .567          .587
COMPUTER       .48           .64           .6            .64           .56           .6
CHINA          .467          .532          .532          .532          .564          .564
TRANSP         .45           .55           .45           .45           .6            .5
REIT           .447          .567          .625          .572          .64           .718
INDMATER       .367          .428          .489          .479          .469          .489
N=6
---------------------------------------------------------------------------------------------
AUTO           .275          .325          .35           .375          .45           .425
COAL           .25           .25           .25           0             .125          .125
PIPELINE       .222          .444          .444          .333          .333          .555
OILGAS         .221          .259          .259          .221          .208          .303
COMODITY       .211          .281          .295          .281          .267          .281
BIGBANKS       .142          .142          .142          0             .142          .571
FOOD           .142          .214          .285          .142          .142          .142
GOLD           .096          .173          .153          .192          .134          .211
N=8
====================================================================================
5/2/2017
The operative Peerless signal is an Sell S4. It
has not been joined by
a different Peerless Sell signal. That would probably occur on an
additional
200 point gain. Sell S4s are reliable bearish.
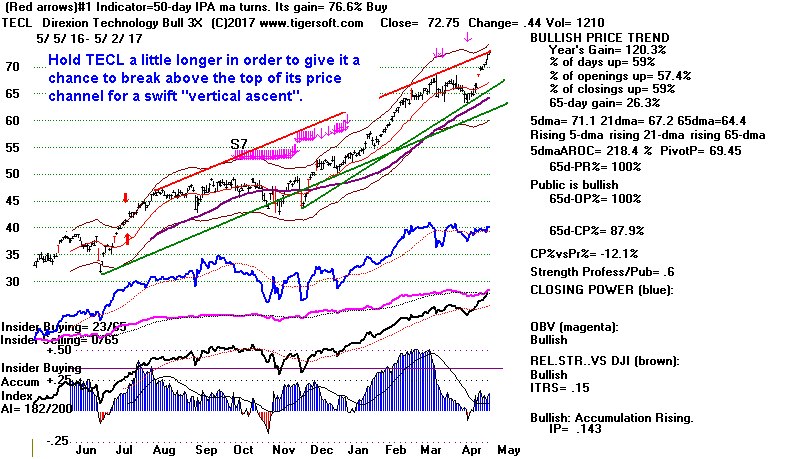
Take profits in QQQ, but hold TECL long in case it breaks out above top
of its price channel. DIA should have been shorted on Monday because
of the S4 and DIA's falling Closing power.
S4 Short Sale Results on DJI
Avg. Gain. Number of Cases
All S4s since 1929
11.0% 36
All S4s since 1945
8.8%
28
S4s when no other signal present since 1945 4.8%
14
"Type 1" S4s since 1945
7.0%
7
S4s since 1945 when P-I over +95
7.4%
17
S4s since 1945 when LA/MA<1.02
9.9%
9
S4s when IP21, V-I and OBVPct< 0
9.2%
2
Paper Losses on Sell S4s since 1945
None - 10 cases
0.1% to 1.0% - 10 cases
1.1% to 2.0% - 6 cases
2.1% to 3.0% - 1 case
3.1% to 3.4% - 1 case
(See the
latest study of all Peerless S4s here).

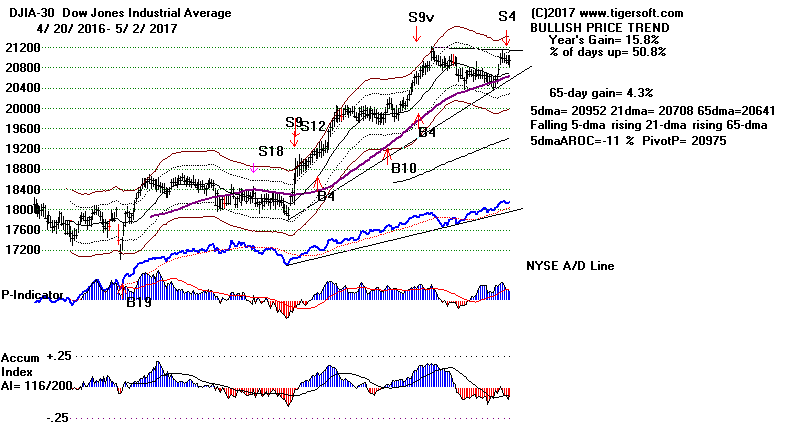

The DJI now stands
1.1% over the 21-day with a negative IP21, OBVPct and V-I.
DIA's Closing Power is in a clear downtrend.
The Hourly DISI is significantly weaker
than DJI prices have been for the last two months. See below. This is
reliably bearish.
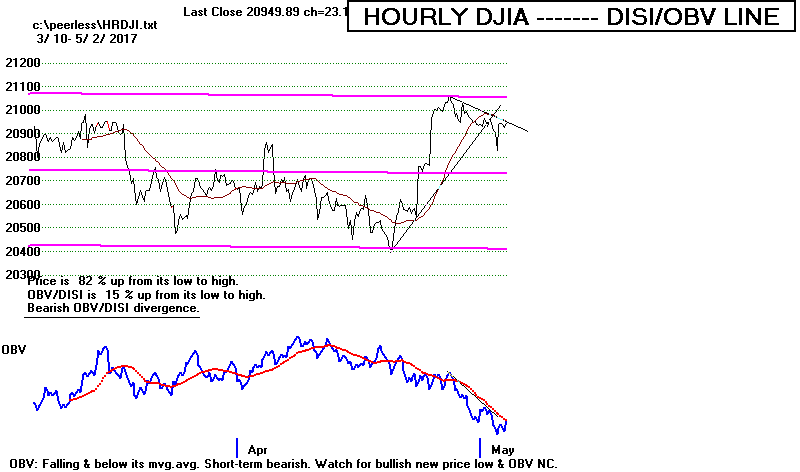
The DJI has not managed 3-straight up-days for more than
two months and only one
2-straight up-days' run since early March. This shows the upside is
limited in the
minds of big-Money and they are quickly distributing/selling shares on a regular
basis.
This can't be good after a bull market advance that has lasted 8 years and 2
months.
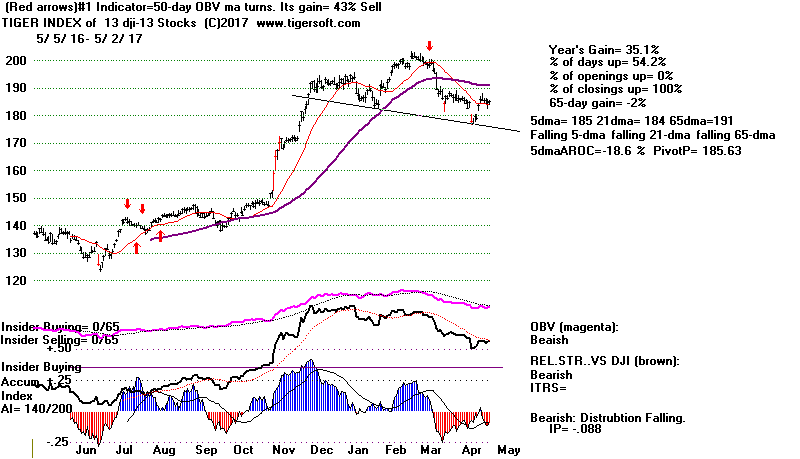
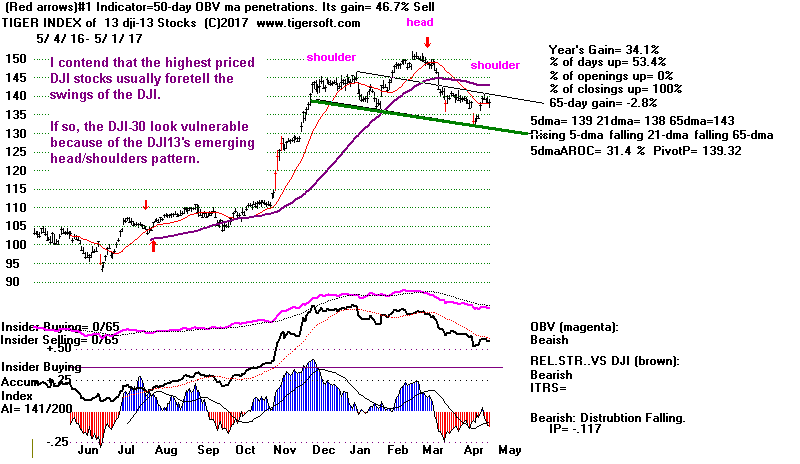
The leading 13 high-priced DJI stocks have formed a
bearish head/shoulders pattern.
The DJI-30 is weighted in such a way so that these 13 have great control on
where
the full DJIA can go. This is important, because the overall market hardly
ever rises
very far without the DJI-30 participating. And when we look back at when
the DJI
did lag the general market, a top was very near. This was definitely the
case in the
second half of 1976 and in the first quarter of 2000.
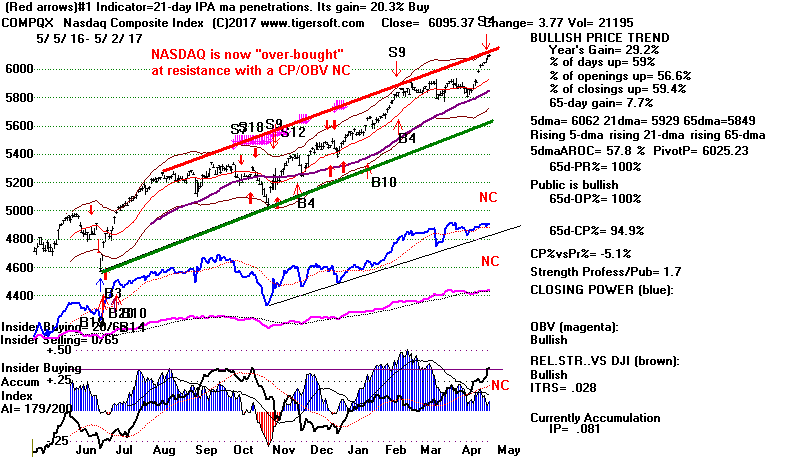
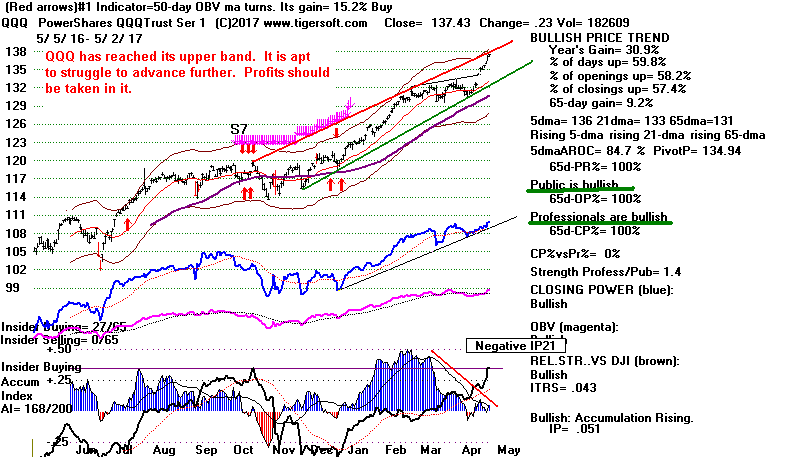
What could be worse? Today the previously strong
tech heavy QQQ, TECL and
SOXL ETFS mostly "spun their wheels".
They are very over-bought, having almost reached
their upper bands. Now Profit-taking in them will probably keep them from
rising.
What will now keep appearance that the US stock market is still very strong?
Will that
cause the Public to reconsider Trump's magic for stocks and reduce the numbers
of stock-purchasers at the opening? Watch the Opening Powers now and see
if they
start turning bearish.
So what's going on?
Traders have clearly started to think the upside is
limited for now.
Short-term rates are going up. See the Short-Term chart just below.
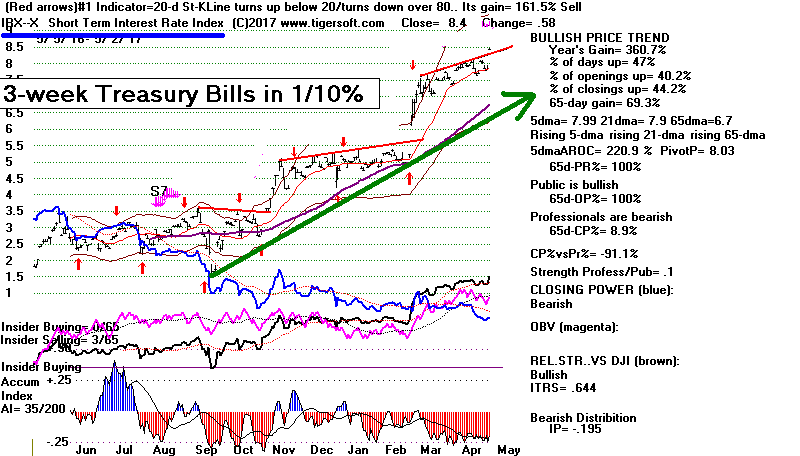
Only the FED knows for how long and how far rates will be rising. But one
thing is
clear, and it's pretty scary: the day's of the Fed's pumping of trillions into
the support
of stocks by maintaining very low interest rates and buying huge amount of
private
and government debt instruments are probably over and are going to be reversed
someday soon. What sent the market up taken away will surely send the
market down
unless there is a massive fiscal stimulus in the form of tax cuts AND
infrastructure spending.
But when will there be such stimulus? Trump's ability to produce a working
Congressional
majority and also overcome vetoes from the Senate now seems quite limited.
Not just
his critics are starting to count his many swift policy reversals and the
increasing numbers
of empty threats and bluffs. (See
All in all, there seems little reason for the market
not to pull-back and re-think what
lies ahead. I would, however, stay long TECL.
5/2/17 Index and ETF Charts:
PEERLESS DJI, Signals, Indicators Daily DJI Split Volume 10-Day Up/Down Vol
Hourly DJIA A/D Line for All Stocks.
S&P OEX NYSE NASDAQ COMPQX with CP
DIA SPY QQQ MDY IWM-TNA
Short Term Interest Rates DJI-Utilities DJI-Transp A/D Line-6000 Stocks
CrudeOil FAS GLD BBH IBB JETS JNUG KOL NUGT OIH OIL
RSX RETL SLV SOXL TECL TMF TNA XIV YINN
To STOCKS' CHARTS
AAPL AMAT AMGN AMZN BIDU CAT FB GOOG GS IBM JPM
MASI MSFT NVDA QCOM
Others REN, JJC, NIB, WEAT UUP (Dollar)
5/2/17 Bullish MAXCPs
Bearish MINCPS
(of
181 (-8) stocks/ETFs) (of 162 (+10) stocks/ETFs)
 RANKING OF KEY DIRECTORIES BASED PCT.OF STOCKS ABOVE 65-DMA
              5/2/17
---------------------------------------------------------------------------------------
Directory     Current       day-1         day-2         day-3         day-4         day-5
----------------------------------------------------------------------------------------
EDU            100%          1             1             1             1             1
NIFTY          .965          1             1             .965          .965          .965
ETFS           .926          .882          .852          .852          .867          .897
BONDFUND       .91           .937          .892          .875          .866          .776
INFRA          .909          .909          .909          .909          .818          .909
HOSPITAL       .857          .428          .428          .428          .428          .571
JETS           .777          .555          .555          .555          .555          .666
GAMING         .766          .8            .7            .733          .833          .766
SOFTWARE       .765          .765          .75           .765          .75           .75
BEVERAGE       .75           .75           .8            .8            .8            .85
MORNSTAR       .739          .743          .743          .777          .806          .798
HOMEBLDG       .722          .777          .777          .888          .888          .777
DJI-13         .692          .769          .769          .769          .769          .769
SEMI           .681          .706          .689          .767          .724          .732
N = 14
HACKERS .666 .722 .777 .722 .722 .722
UTILITY .666 .644 .711 .666 .733 .8
NASD-100 .659 .67 .692 .703 .681 .703
ELECTRON .654 .67 .68 .711 .68 .69
GREEN .645 .612 .645 .709 .806 .774
COMPUTER .64 .6 .64 .56 .64 .52
INDEXES .638 .638 .617 .651 .68 .659
MILITARY .622 .622 .644 .644 .622 .622
DOWJONES .6 .666 .666 .666 .7 .7
SP500 .583 .583 .594 .619 .629 .64
SOLAR .578 .526 .578 .631 .578 .526
CHEM .577 .591 .647 .676 .704 .69
REIT .567 .625 .572 .64 .718 .734
RUS-1000 .566 .576 .58 .617 .635 .638
BIOTECH .565 .584 .584 .588 .604 .581
TRANSP .55 .45 .45 .6 .5 .55
CHINA .532 .532 .532 .564 .564 .596
INSURANC .529 .647 .676 .794 .764 .735
RETAIL .517 .464 .482 .517 .535 .464
SP-100 .505 .505 .546 .567 .587 .577
N = 20
=========================================================================================
FINANCE .5 .532 .478 .597 .652 .619
PIPELINE .444 .444 .333 .333 .333 .666
INDMATER .428 .489 .479 .469 .479 .5
REGBANKS .388 .444 .416 .666 .805 .666
N = 4
-------------------------------------------------------------------------------------------
COAL .333 .333 .111 .222 .222 .222
AUTO .325 .35 .375 .45 .45 .35
COMODITY .285 .3 .285 .271 .285 .271
OILGAS .259 .259 .221 .208 .291 .284
FOOD .214 .285 .142 .142 .142 .142
GOLD .173 .153 .192 .134 .211 .192
BIGBANKS .142 .142 0 .142 .571 .428
N= 7
====================================================================================
5/1/2017 Friday's Sell S4 signal should keep
us away from DIA and SPY whose
Closing Powers are falling. Short sales on DIA would also seem appropriate
considering how reliable bearish Sell S4 signals are.
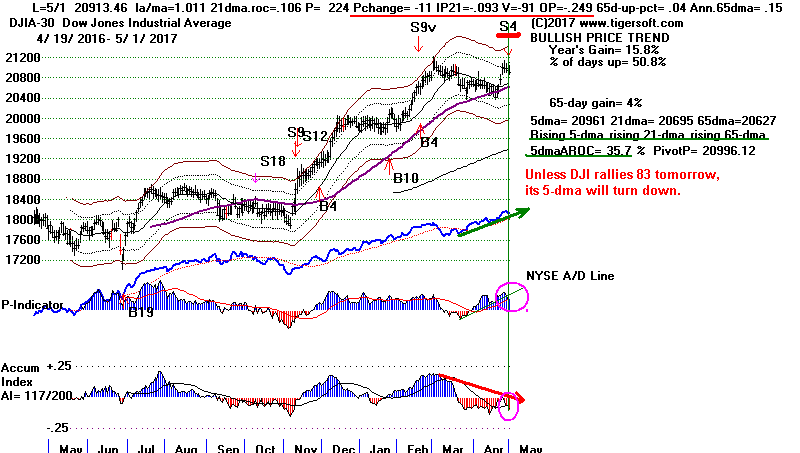
As I mentioned yesterday, the DJI's seasonality does not turn bearish for
another couple
of weeks, but we also want to consider how ugly the Hourly DISI-OBV looks now, breaking
to new lows ahead of the DJI and the how the two month long pattern in which the DJI
cannot achieve even two straight advances, so great is Big Money's quiet selling
of these
Blue Chips.
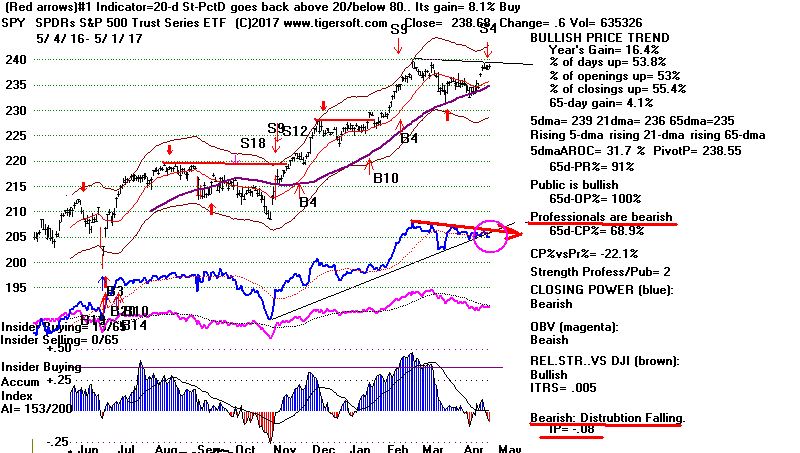
SPY may still manage a breakout above its flat resistance
at 240. This will probably send it quickly up another 5 points.
So, I would not short SPY.
QQQ, TECL and the NASDAQ are already running in all-time high
territory. They should be held long a little longer. They
have not yet reached
their upper bands. Taking long profits in them then seems to me a good
idea.
For now we remember how QQQ topped out 6 weeks after the DJI did in the
year 2000. But see how AAPL (now the highest
AI/200 stock in the DJI-30)
and QQQ are starting to show negative Accumulation on
their rallies. This produces
Tiger Sell S9s. These technology-growth favorites have kept rising
precisely because
of the way the blue chips in the DJI-30, OEX and even the SP-500 are lagging and
languishing; high performance money has no choice but to focus on the smaller
and
smaller group of stocks and ETFs that keep rising.
If the percentage of sectors showing more than 50% of
their stocks below the 65-dma
itself falls below 50%, it will confirm the bearishness of the Sell S4.
Below you see
that 32 groups still show a majority of their stocks above their 65-dma while
only 13
groups have most of their stocks below it. These weak groups include
two that are
very important: Big Banks and Oil/Gas.
Another sign that the Sell S4 will work out well
for the bears will be if the number of
MINCP stocks starts outpacing the number of MAXCPs. Presently,
there are 189 MAXCPs
and 152 MINCPs.
Finally, I think we can be very confident that
there will be a big drop in the DJI
if the big head/shoulders patterns in the DJI-13, FAS (Big Banks) and Transportation
(DJI-20) are completed. That has not happened yet but the
pattern's emergence explains
why traders are avoiding these groups.
                   5/1/17   Index and ETF Charts:
                                     PEERLESS DJI, Signals, Indicators    Daily DJI Split Volume   10-Day Up/Down Vol
                                     Hourly DJIA    A/D Line for All Stocks.
                                     S&P    OEX    NYSE    NASDAQ   COMPQX with CP
                                     DIA   SPY   QQQ    MDY   IWM-TNA
                                     Short Term Interest Rates    DJI-Utilities      DJI-Transp      A/D Line-6000 Stocks
                                     CrudeOil  FAS  GLD  BBH  IBB  JETS  JNUG  KOL  NUGT  OIH   OIL
                                     RSX   RETL   SLV   SOXL   TECL   TMF   TNA  XIV  YINN

                             To STOCKS' CHARTS
                                    AAPL   AMAT  AMGN  AMZN   BIDU   CAT    FB  GOOG   GS  IBM   JPM
                                    MASI  MSFT  NVDA  QCOM
                  Others REN, JJC,  NIB, WEAT  UUP (Dollar)

               5/1/17    Bullish MAXCPs    Bearish MINCPS
                             (of 189 stocks/ETFs)  (of 152 stocks/ETFs)

 RANKING OF KEY DIRECTORIES BASED PCT.OF STOCKS ABOVE 65-DMA
               5/1/17
---------------------------------------------------------------------------------------
Directory     Current       day-1         day-2         day-3         day-4         day-5
----------------------------------------------------------------------------------------
EDU            1             1             1             1             1             1
NIFTY          1             1             .965          .965          .965          .965
BONDFUND       .937          .892          .875          .866          .776          .901
INFRA          .909          .909          .909          .818          .909          .909
ETFS           .882          .852          .852          .867          .897          .882
GAMING         .8            .7            .733          .833          .766          .8
HOMEBLDG       .777          .777          .888          .888          .777          .833
DJI-13         .769          .769          .769          .769          .769          .692
SOFTWARE       .765          .75           .765          .75           .75           .734
BEVERAGE       .75           .8            .8            .8            .85           .85
MORNSTAR       .743          .743          .777          .806          .794          .76
HACKERS        .722          .777          .722          .722          .722          .611
SEMI           .706          .689          .767          .724          .741          .715
NASD-100       .677          .698          .709          .688          .709          .698
ELECTRON       .67           .68           .716          .68           .695          .659
N=15
DOWJONES       .666          .666          .666          .7            .733          .633
INSURANC       .647          .676          .794          .764          .764          .705
UTILITY        .644          .711          .666          .733          .8            .777
INDEXES        .642          .617          .651          .68           .659          .638
REIT           .625          .572          .64           .718          .734          .682
MILITARY       .622          .644          .644          .622          .622          .6
GREEN          .612          .645          .709          .806          .774          .677
COMPUTER       .6            .64           .56           .64           .52           .56
CHEM           .591          .647          .676          .704          .69           .661
BIOTECH        .588          .584          .581          .608          .581          .533
SP500          .585          .595          .62           .631          .643          .629
RUS-1000       .581          .584          .621          .639          .645          .618
JETS           .555          .555          .555          .555          .666          .666
CHINA          .532          .532          .564          .564          .596          .548
FINANCE        .532          .478          .597          .652          .63           .565
SOLAR          .526          .578          .631          .578          .526          .526
SP-100         .505          .546          .567          .587          .587          .525
N=17
===========================================================================================
INDMATER       .489          .479          .469          .479          .5            .51
RETAIL         .464          .482          .517          .535          .464          .517
TRANSP         .45           .45           .6            .5            .55           .55
PIPELINE       .444          .333          .333          .333          .666          .444
REGBANKS       .444          .416          .666          .805          .666          .611
HOSPITAL       .428          .428          .428          .428          .571          .571
AUTO           .35           .375          .45           .45           .35           .425
N=7
-------------------------------------------------------------------------------------------
COAL           .333          .111          .222          .222          .222          .222
COMODITY       .3            .285          .271          .285          .271          .285
FOOD           .266          .133          .133          .133          .133          .133
OILGAS         .259          .221          .208          .291          .291          .221
GOLD           .15           .188          .15           .207          .188          .339
BIGBANKS       .142          0             .142          .571          .571          .142
N=6
=================================================================================
4/28/2017
Finally we have a new
Peerless sell signal. It is a Sell S4. I,
for one, am glad
to have the Peerless signal finally coincide with, rather than fight, the bearish
looking DISI-OBV Line our Hourly DJI chart. At the very least, the
DJI is apt now to retest its 65-dma. A bigger decline is certainly a
possibility, too. The DJI continues to fail to
achieve two up-days in a row.
Clearly, big sellers are in a hurry to get out of the market.
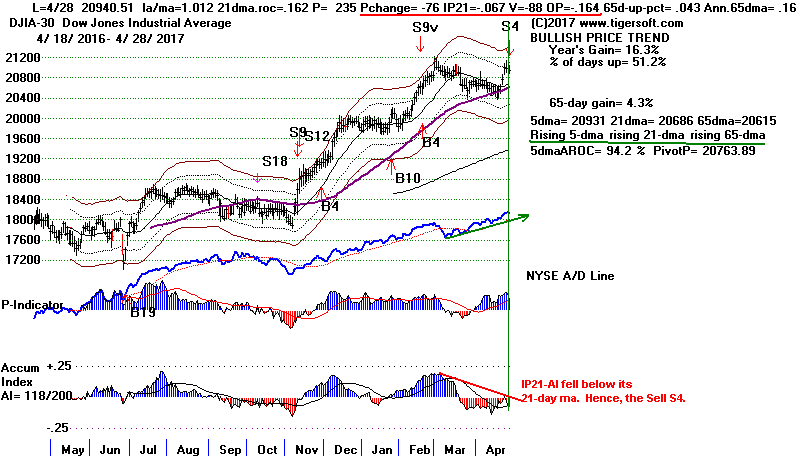
Remember the adage, "In May, go away". The DJI may be able to
eke out small gains over the next week or two. But Mays, Junes
Julys do not typically bring longs much to smile about. That at least is
what
our report for the DJI's behavior since 1965 shows. The type of action
we are seeing in which big stocks like FB and
GOOG get most of the
play will likely continue for a while longer. But when the "Remaining
Nifty"
stocks turn down, there may be little to hold the market up. See how
they steeply they have risen recently. More and more high-performance
money is being channeled into fewer and few stocks, those making new
highs
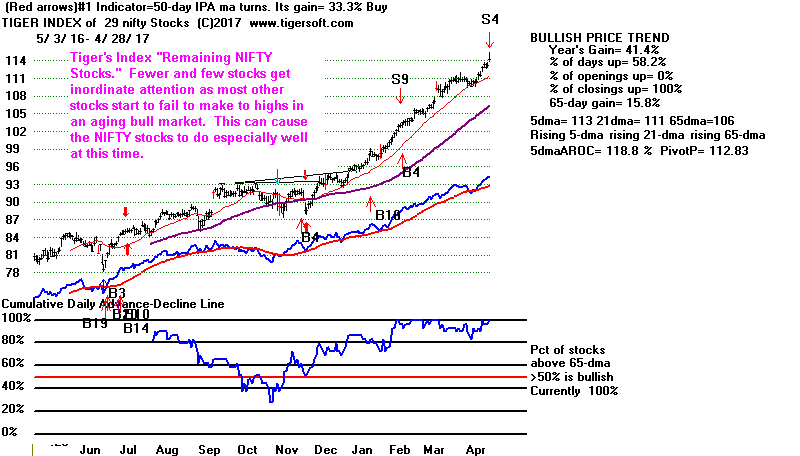
The 29 stocks now comrising our NIFTY-STOCKS' INDEX:
AAPL ADBE ADP ALGN AMT AMZN ATVI AVGO CHDN CPA CTAS EQIX EXPD FB FISV
GOOG HD HSKA JNPR LMT MSFT NVR PCLN PLUS PNRA REGN TSLA VRTX XLNX
|
What Happens To DJI after April 30th since 1965
Pct of Years
achieving a Gain
---------------------------------------------------------
After 5-trading days
52%
After 10-trading days
58%
After 21-trading days
50%
After 42 trading days
48%
After 65-trading days
46%
Friday, the
NASDAQ,
QQQ
and
TECL rose again. As long as their
steep Closing Powers are rising, traders may want to hold them still
longer. But I think it is significant that the
IWM
(Russell-2000) fell
sharply on Friday, thereby joining
FAS and
Bank Stocks, which closely
correlate with the
DJI
and
SP-500.
A Plunging Hourly DJI's DISI that makes new lows
far ahead of prices is definitely a bearish sign for the
overall market. The last three 10% declines have all
had this signature.
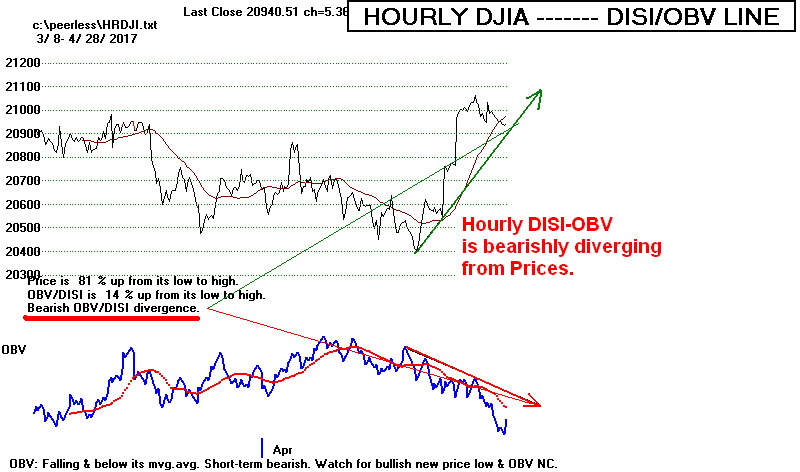
The Sell S4
occurs
when the current Accumulation Index (IP21) falls
below its 21-day ma
following a decent-sized rally, but with weakening internal
indicators.
You can see from the DJI chart below that the IP21, V-I and OBVPct are
all in negative territory and the P-Indicator is falling fast, dropping 76
on
Friday. This is a signal that should be trusted. There have been
numerous
Sell S4s. All would have been reversed at lower DJIA prices using the next
Peerless Buy signal. See the
latest study of all Peerless S4s.
The average gain
on short sales taken after a Sell S4 from 1945 to 2017 was 8.8%. Paper
losses
on these short s have been quite small.
Paper Losses on Sell S4s since 1945
None - 10 cases
0.1% to 1.0% - 10 cases
1.1% to 2.0% - 6 cases
2.1% to 3.0% - 1 case
3.1% to 3.4% - 1 case
The likely downside consequences for this signal can be gleaned from
the S4s past track record in general, but also by considering what the most
significant technical considerations are in the present case.
S4 Short Sale Results
Avg. Gain. Number of Cases
All S4s since 1929
11.0% 36
All S4s since 1945
8.8%
28
S4s when no other signal present since 1945 4.8%
14
"Type 1" S4s since 1945
7.0%
7
S4s since 1945 when P-I over +95
7.4%
17
S4s since 1945 when LA/MA<1.02
9.9%
9
S4s when IP21, V-I and OBVPct< 0
9.2%
2
This is an "isolated" Peerless Sell. There are no other Peerless Sells
yet along with it. Since 1945, the average drop for "isolated" S4s
was only 4.8%.
Our software has its own way of breaking down Sell S4s. This is a
"type 1" Sell S4. It has averaged a decline of 7.0% in 7 cases since
1965.
A positive "P"-Indicator has tended to slightly reduce the power of
a Sell S4 since 1945. But in the 17 cases where the P-I was above
+95, the DJI still fell 7.4% at the time of the next Peerless Buy signal.
That the DJI is now above the 21-dma by only 1.2% does not much
weaken the power of the Sell S4s. the opposite seems to be true.
When
the DJI gets a Sell S4 below the 2% upper band, the DJI tends to drop even
more than when it was above it: 9.5% versus 8.8%, again considering only
the cases since 1945.
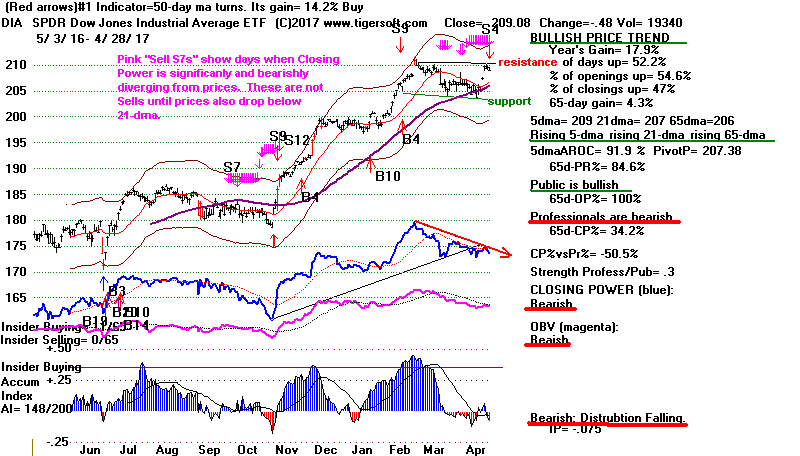
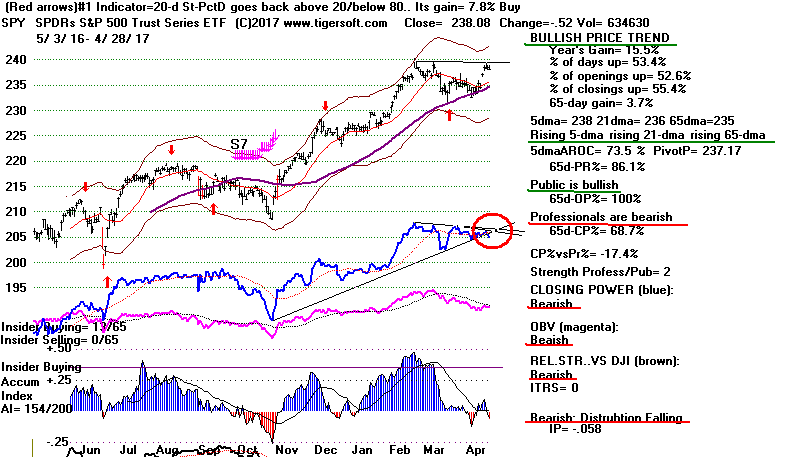
                   4/28/17   Index and ETF Charts:
                                     PEERLESS DJI, Signals, Indicators    Daily DJI Split Volume   10-Day Up/Down Vol
                                     Hourly DJIA    A/D Line for All Stocks.
                                     S&P    OEX    NYSE    NASDAQ   COMPQX with CP
                                     DIA   SPY   QQQ    MDY   IWM-TNA
                                     Short Term Interest Rates    DJI-Utilities      DJI-Transp      A/D Line-6000 Stocks
                                     CrudeOil  FAS  GLD  BBH  IBB  JETS  JNUG  KOL  NUGT  OIH   OIL
                                     RSX   RETL   SLV   SOXL   TECL   TMF   TNA  XIV  YINN

                             To STOCKS' CHARTS
                                    AAPL   AMAT  AMGN  AMZN   BIDU   CAT    FB  GOOG   GS  IBM   JPM
                                    MASI  MSFT  NVDA  QCOM
                  Others REN, JJC,  NIB, WEAT  UUP (Dollar)

              4/28/17    Bullish MAXCPs    Bearish MINCPS


RANKING OF KEY DIRECTORIES BASED PCT.OF STOCKS ABOVE 65-DMA
               4/28/17
---------------------------------------------------------------------------------------
Directory     Current       day-1         day-2         day-3         day-4         day-5
----------------------------------------------------------------------------------------
EDU            1             1             1             1             1             1
NIFTY          1             .965          .965          .965          1             .896
INFRA          .909          .909          .818          .909          .909          .454
BONDFUND       .892          .875          .866          .776          .892          .928
ETFS           .852          .852          .867          .897          .882          .823
BEVERAGE       .8            .8            .8            .85           .85           .8
HACKERS        .777          .722          .722          .722          .611          .666
HOMEBLDG       .777          .888          .888          .777          .833          .777
DJI-13         .769          .769          .769          .769          .692          .692
SOFTWARE       .75           .765          .75           .75           .718          .687
MORNSTAR       .743          .777          .806          .794          .764          .63
UTILITY        .711          .666          .733          .8            .777          .733
GAMING         .7            .733          .833          .766          .8            .766
NASD-100       .698          .709          .688          .709          .698          .645
SEMI           .689          .767          .724          .741          .715          .663
ELECTRON       .68           .716          .685          .695          .664          .582
INSURANC       .676          .794          .764          .764          .705          .5
N = 17
-----------------------------------------------------------------------------------------------
DOWJONES       .666          .666          .7            .733          .633          .566
CHEM           .647          .676          .704          .69           .661          .535
GREEN          .645          .709          .806          .774          .677          .612
MILITARY       .644          .644          .622          .622          .6            .555
COMPUTER       .64           .56           .64           .52           .56           .48
INDEXES        .617          .651          .68           .659          .647          .621
SP500          .595          .62           .631          .643          .629          .55
BIOTECH        .588          .581          .6            .584          .533          .434
RUS-1000       .584          .621          .639          .645          .618          .549
SOLAR          .578          .631          .578          .526          .526          .473
REIT           .572          .64           .718          .734          .682          .734
JETS           .555          .555          .555          .666          .666          .444
SP-100         .546          .567          .587          .587          .525          .463
CHINA          .532          .564          .564          .596          .548          .532
N= 14
-----------------------------------------------------------------------------------------------
RETAIL         .482          .517          .535          .464          .517          .5
INDMATER       .479          .469          .479          .5            .51           .387
FINANCE        .478          .597          .652          .63           .565          .456
TRANSP         .45           .6            .5            .55           .55           .4
HOSPITAL       .428          .428          .428          .571          .571          .285
REGBANKS       .416          .666          .805          .666          .611          .388
AUTO           .375          .45           .45           .35           .4            .275
N=7
-----------------------------------------------------------------------------------------------
PIPELINE       .333          .333          .333          .666          .444          .444
COMODITY       .285          .271          .285          .271          .285          .342
OILGAS         .221          .208          .291          .291          .221          .208
GOLD           .188          .132          .226          .188          .339          .452
FOOD           .133          .133          .133          .133          .133          0
COAL           .111          .222          .222          .222          .222          .222
BIGBANKS       0             .142          .571          .571          .142          0
N=7
=================================================================================
4/27/2017
We still have no Peerless sell signal on this rally.
Expect resistance to
come in at 21000. It should continue to be fierce until the
DJI breaks out above 21200. A rally with a close above 21120 will probably
bring a Sell S12 or Sell S15. For now, as long as the NYSE A/D Line
keeps making new highs, and it did so just barely today, I would
think we will see the rally continue.
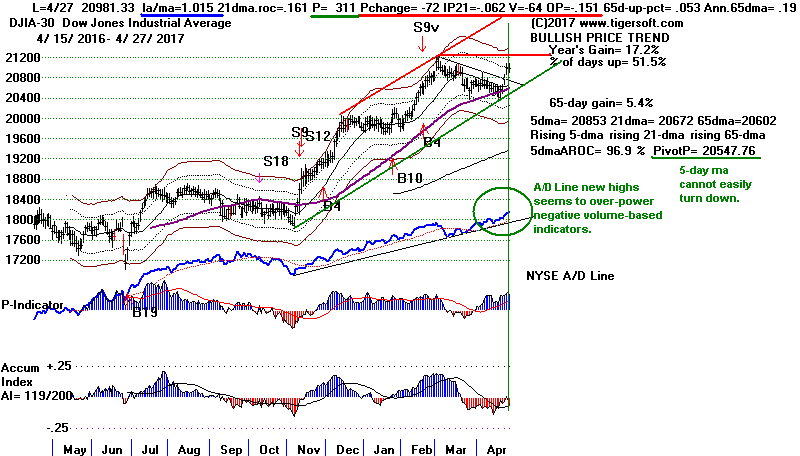
But not all stocks or indexes will participate.
Oil/gas stocks are clearly lagging
while the newer technology stocks keep making new highs. So, stick with
the
NASDAQ, QQQ and
TECL, as they run in all-time high territory. Much
now
depends now on how the IWM Russell-2000 and MDY do,
whether they
can clearly breakout into all-time high territory or choose to pulls back.
Despite their being no Peerless Sell, I would
prefer to sell DIA on
a DJI rally to 12100 but hold SPY.
The reasons for avoiding DIA are clear enough:
1) The Closing Powers for DIA and
SPY are now rated as "Bearish".
2) The Hourly DISI is diverging very badly from the
uptrend.
3) The current Accum. Index (IP21) is negative even as the DJI has
reached the 1.5% upper band. The last few years demonstrate that this is
usually high enough off the 21-dma to stop a rally. See these charts
with the experimental 1.75% upper band-tagged S12s further below.
4) The normally leading high-priced DJI-13 stocks
Index have not broken
above their developing H/S pattern's right shoulder.
5) We need to the Big Banks stocks,
GS and JPM destroy their
potential
head/shoulders patterns by rising above these patterns'
right shoulder apexes.
Recent
Experimental S12s
occurring with DJI tagging 1.75% upper
band over 21-dma and a negative IP21:
2009-2017
4 April-May Cases
2009 DJI goes 4% higher
2011 DJI goes 3% higher
2012 DJI falls 8% very quickly
2016 May - DJI starts eroding before falling 13%
See this New Study
Conclusion from this limited, but more recent data:
After the first few years of a new bull market, we can no longer expect
the DJI to make much more upside progress when this type of experimental
S12 occurs. Accordingly, it might be a good idea to take profits in
DIA on strength above 21000, especially the number of NYSE decliners
rises above advancers late in the trading day,
4/27/17
Index and ETF Charts:
PEERLESS DJI, Signals, Indicators Daily
DJI Split Volume 10-Day Up/Down Vol
Hourly DJIA
A/D Line for All Stocks.
S&P
OEX
NYSE
NASDAQ COMPQX with CP
DIA SPY
QQQ
MDY
IWM-TNA
Short Term Interest Rates
DJI-Utilities
DJI-Transp A/D Line-6000 Stocks
CrudeOil
FAS
GLD
BBH
IBB
JETS
JNUG
KOL
NUGT
OIH OIL
RSX
RETL SLV SOXL TECL TMF TNA XIV
YINN
To STOCKS' CHARTS
AAPL
AMAT AMGN
AMZN
BIDU
CAT
FB
GOOG
GS
IBM
JPM
MASI
MSFT
NVDA
QCOM
Others REN,
JJC,
NIB,
WEAT
UUP (Dollar)
4/27/17 Bullish MAXCPs
Bearish MINCPS
 RANKING OF KEY DIRECTORIES BASED PCT.OF STOCKS ABOVE 65-DMA
              4/27/17
---------------------------------------------------------------------------------------
Directory     Current       day-1         day-2         day-3         day-4         day-5
----------------------------------------------------------------------------------------
EDU            1             1             1             1             1             1
NIFTY          .965          .965          .965          1             .896          .931
INFRA          .909          .818          .909          .909          .454          .363
HOMEBLDG       .888          .888          .777          .833          .777          .777
BONDFUND       .875          .866          .776          .892          .928          .919
ETFS           .852          .867          .897          .882          .838          .808
BEVERAGE       .8            .8            .85           .85           .8            .85
INSURANC       .794          .764          .764          .705          .5            .647
MORNSTAR       .777          .806          .794          .764          .634          .655
DJI-13         .769          .769          .769          .692          .692          .692
SEMI           .767          .724          .741          .715          .672          .681
SOFTWARE       .765          .75           .75           .718          .671          .718
GAMING         .733          .833          .766          .8            .766          .766
HACKERS        .722          .722          .722          .611          .666          .611
ELECTRON       .716          .685          .701          .664          .597          .608
GREEN          .709          .806          .774          .677          .645          .645
NASD-100       .709          .688          .709          .698          .645          .677
CHEM           .676          .704          .69           .661          .549          .549
N=18
===========================================================================================
DOWJONES       .666          .7            .733          .633          .6            .6
REGBANKS       .666          .805          .666          .611          .388          .361
UTILITY        .666          .733          .8            .777          .733          .733
INDEXES        .651          .68           .659          .647          .638          .655
MILITARY       .644          .622          .622          .6            .555          .577
REIT           .64           .718          .734          .682          .734          .77
SOLAR          .631          .578          .526          .526          .473          .473
RUS-1000       .621          .639          .645          .618          .557          .59
SP500          .62           .631          .643          .629          .56           .583
TRANSP         .6            .5            .55           .55           .4            .4
FINANCE        .597          .652          .63           .565          .467          .467
BIOTECH        .584          .6            .577          .537          .442          .521
SP-100         .567          .587          .587          .525          .484          .494
CHINA          .564          .564          .596          .548          .532          .548
COMPUTER       .56           .64           .52           .56           .48           .52
JETS           .555          .555          .666          .666          .444          .555
RETAIL         .517          .535          .464          .517          .5            .535
N=17
===========================================================================================
INDMATER       .469          .479          .5            .51           .397          .397
AUTO           .45           .45           .35           .4            .275          .3
HOSPITAL       .428          .428          .571          .571          .428          .428
--------------------------------------------------------------------------------------------
PIPELINE       .333          .333          .666          .444          .444          .444
COMODITY       .271          .285          .271          .285          .342          .371
COAL           .222          .222          .222          .222          .222          .222
OILGAS         .208          .291          .291          .221          .208          .202
BIGBANKS       .142          .571          .571          .142          0             0
FOOD           .133          .133          .133          .133          0             0
GOLD           .132          .207          .207          .339          .452          .433
N=7
================================================================================
4/26/2017 There is probably more
to this rally. A deterioration in breadth
would be bearish. For now stay long the strongest ETFs and
most bullish MAXCPs. Favor those already making new highs.
Each rally since Trump was elected President has reached the|
full +3.5% band. We have yet to see a DJI decline below the 1.75%
lower band. The trend must be considered UP until Peerless gives
us a Sell or the DJI forms and completes a bearish H/Shoulders pattern.
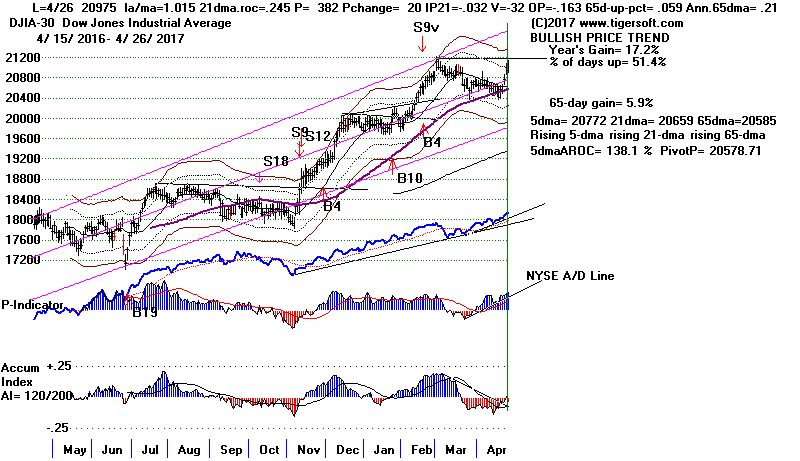
Traders sold semi-automatically on the release of the White House
tax proposals for Congress and the Closing Powers turned back
down for DIA and SPY. The Hourly OBV-DISI Line
does look increasingly
bearish. Without rising volume there appears to be limited upside
potential for
the DIA and SPY. But they are not likely to drop enough tomorrow to cause
their
5-day ma to turn back down and their Closing Powers are not likely
to switch from neutral to bearish tomorrow.
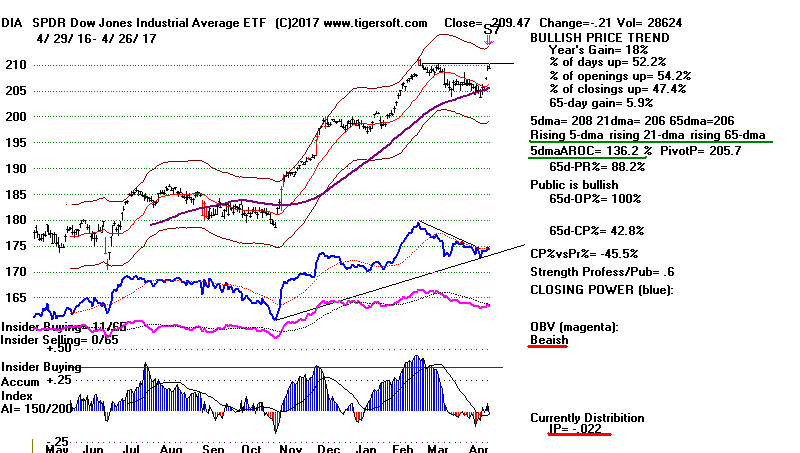
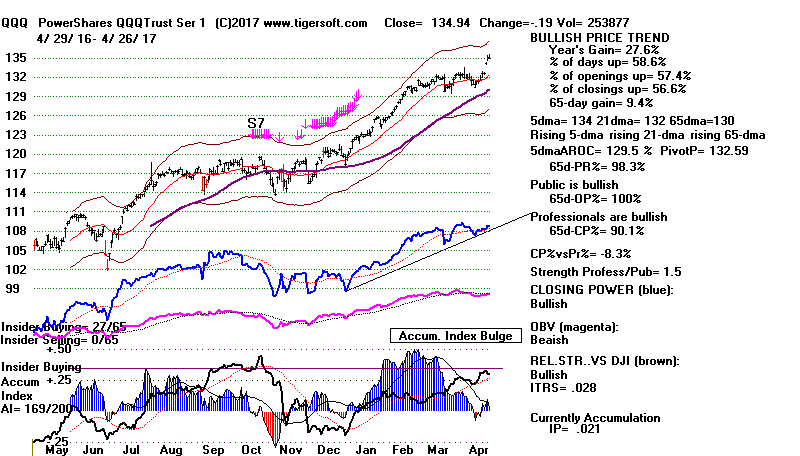
More should be expected from the NASDAQ,
QQQ and TECL. They
show rising Closing Powers, positive IP21s and rising 5-dma.
Seasonality is still bullish. Since 1965, the DJI has risen 66% of the
time and gained on 1/2% in the week after April 26.
New Research - We are close to A Sell S12 but the P-Indicator
is still too positive for a signal.
See the study.
S12 CASES SINCE 1929 WHERE P-I was OVER +200.
These are of interest to us on 4/26/2007
Only 5 of the 93 Sell S12s occurred with the P-Indicator above +200.
Good gains (assuming one went short on the signal) followed in all 5
of these cases.
They ranged from 5.4% to
+17.1%. Paper losses ranged from none to
3.2%.
This suggests that heavy distribution can defeat and thwart a rising market
enjoying good breadth, but does so rarely and often in rising markets only
after an additional 2% to 3% gain. This is also what the research on Sell
S15s
suggested last night.
There
were two 1997 cases where the DJI was making new highs and where
the A/D Line
was confirming the DJI strength, like now. In these cases, there
were
paper losses of 2.3% and 3.2%.
What is most interesting is that both of the 1997 cases occurred with the
DJI only 1.3% and 1.7% over the 21-day ma. The DJI closed
today just
1.5% over the 21-day ma with a negative IP21 (-.032). What has
prevented
a Sell S12 for us now
was first, the much more positive P-I reading (+382 )
and
second, the fact that these S12s took place in the often bearish month of September.
Looking at all
93 S12 cases, you will see that we can have had 5 Sell S12s
in April.
The gains were smaller, ranging from +1.5% to
+8.1%, but none of the paper
losses
were over 2.2%.
My conclusion from this is that we are most likely going to see the DJI
move a little higher before re-testing the 65-dma.
How Sincere Are Conservatives?
In the Conservatives' Hierarchy of Values
which is more important?
Tax Cuts for The Rich or Budget Balancing?
"The White House insists that economic growth will offset its
proposed tax cuts,
but many economists disagree, creating a moment of truth for conservatives."
Consider the coming weeks' discussion about the Budget a
view into
the heart of Fiscal Conservatives who have long advocated balancing budgets.
https://www.nytimes.com/2017/04/26/us/politics/trump-tax-plan-budget-deficit.html?emc=edit_th_20170427&nl=todaysheadlines&nlid=58223894&_r=0
My guess is that they will go along with the tax cuts and hope that
"Voo-Doo" economics has some economic magic. Stay tuned.
4/26/17
Index and ETF Charts:
PEERLESS DJI, Signals, Indicators Daily
DJI Split Volume 10-Day Up/Down Vol
Hourly DJIA
A/D Line for All Stocks.
S&P
OEX
NYSE
NASDAQ COMPQX with CP
DIA SPY
QQQ
MDY
IWM-TNA
Short Term Interest Rates
DJI-Utilities
DJI-Transp A/D Line-6000 Stocks
CrudeOil
FAS
GLD
BBH
IBB
JETS
JNUG
KOL
NUGT
OIH OIL
RSX
RETL SLV SOXL TECL TMF TNA XIV
YINN
To STOCKS' CHARTS
AAPL
AMAT AMGN
AMZN
BIDU
CAT
FB
GOOG
GS
IBM
JPM
MASI
MSFT
NVDA
QCOM
Others REN,
JJC,
NIB,
WEAT
UUP (Dollar)
4/26/17 Bullish MAXCPs
Bearish MINCPS
 RANKING OF KEY DIRECTORIES BASED PCT.OF STOCKS ABOVE 65-DMA
               4/26/17
---------------------------------------------------------------------------------------
Directory     Current       day-1         day-2         day-3         day-4         day-5
----------------------------------------------------------------------------------------
EDU            1             1             1             1             1             .875
NIFTY          .965          .965          1             .896          .931          .896
HOMEBLDG       .888          .777          .833          .777          .777          .777
ETFS           .867          .897          .882          .838          .838          .779
BONDFUND       .866          .776          .892          .928          .919          .928
GAMING         .833          .766          .8            .766          .766          .766
INFRA          .818          .909          .909          .454          .363          .272
GREEN          .806          .774          .677          .645          .677          .612
MORNSTAR       .806          .794          .764          .634          .672          .567
REGBANKS       .805          .666          .611          .388          .361          .083
BEVERAGE       .8            .85           .85           .8            .85           .85
DJI-13         .769          .769          .692          .692          .692          .692
INSURANC       .764          .764          .705          .5            .647          .588
SOFTWARE       .75           .75           .718          .671          .718          .718
UTILITY        .733          .8            .777          .733          .733          .777
SEMI           .724          .741          .715          .672          .689          .629
HACKERS        .722          .722          .611          .666          .611          .555
REIT           .718          .734          .682          .734          .776          .786
CHEM           .704          .69           .661          .549          .549          .478
DOWJONES       .7            .733          .633          .6            .6            .566
NASD-100       .688          .709          .698          .645          .677          .634
ELECTRON       .685          .701          .67           .597          .623          .551
INDEXES        .68           .659          .647          .638          .668          .521
N=23
---------------------------------------------------------------------------------------------
FINANCE        .652          .63           .565          .467          .467          .271
COMPUTER       .64           .52           .56           .48           .52           .44
RUS-1000       .639          .645          .618          .557          .588          .521
SP500          .631          .643          .629          .56           .581          .512
MILITARY       .622          .622          .6            .555          .577          .511
BIOTECH        .604          .577          .529          .446          .521          .478
SP-100         .587          .587          .525          .484          .494          .432
SOLAR          .578          .526          .526          .473          .526          .473
BIGBANKS       .571          .571          .142          0             0             0
CHINA          .564          .596          .548          .532          .564          .451
JETS           .555          .666          .666          .444          .555          .444
RETAIL         .535          .464          .517          .5            .535          .357
==========================================================================================
TRANSP         .5            .55           .55           .4            .4            .3
INDMATER       .479          .5            .51           .397          .397          .306
AUTO           .45           .35           .4            .275          .3            .225
HOSPITAL       .428          .571          .571          .428          .428          .428
------------------------------------------------------------------------------------------
PIPELINE       .333          .666          .444          .444          .444          .444
OILGAS         .291          .291          .221          .208          .196          .183
COMODITY       .281          .267          .281          .338          .366          .366
COAL           .222          .222          .222          .222          .222          .111
GOLD           .207          .188          .358          .452          .433          .358
FOOD           .133          .133          .133          0             0             0
N = 6
=================================================================================
4/25/2017 A Cut in
Corporate Taxes to 15% seems very likely to pass
Congress. Money talks and the market could not be happier.
The new highs by the NASDAQ,
QQQ and TECL seem about
be joined by the very broad-based Russell-2000 (IWM)
and MDY (mid-caps). See how they exploded today past
the potential
resistance in their nascent head/shoulders' patterns. Shorts
will be under great pressure now to cover these.
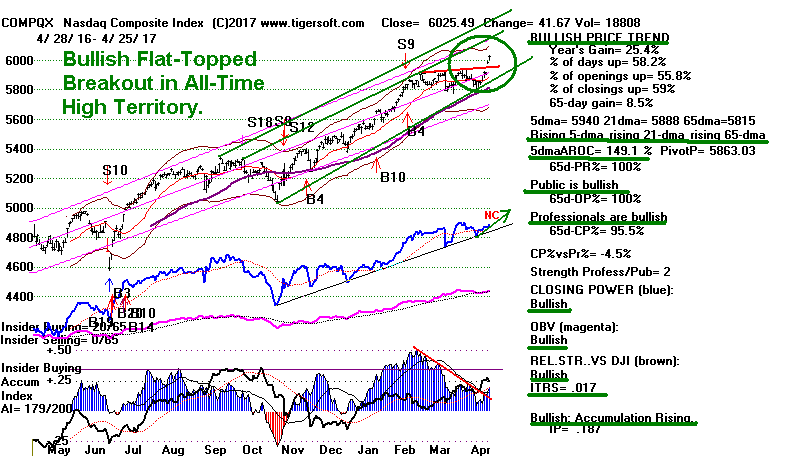
The DJI (see below) now stands 1.7% over the 21-dma. It has not yet
made a nominal new closing high. It's V-I and OBVPvt
remain negative. This suggests it may not be able to make
much more than a nominal new high above 21100 before
needing to back and fill a little.
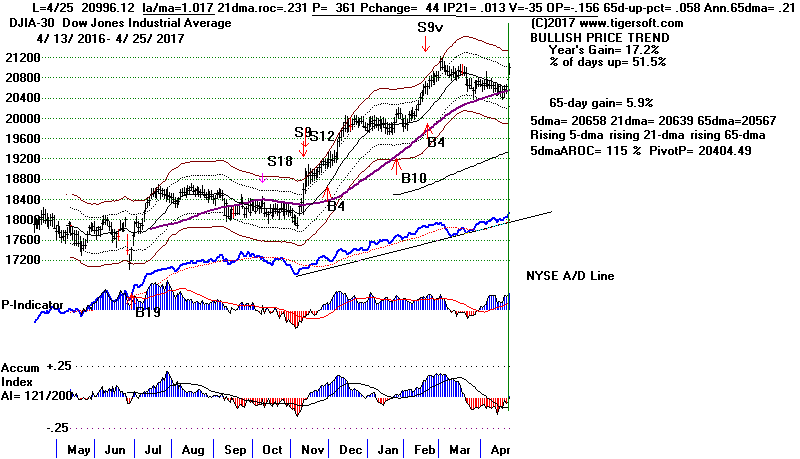
While it is certainly true that Up-Volume is lagging
and the
Hourly DJI's OBV-Line is pointing downwards,
breadth is almost
always a better predictor of the general stock market. It reflects both
speculative interest and interest rate expectations.
Another part of the puzzle now is what will happen in Korea.
I consider the tough talk from the leaders of N Korea and
the US to be belied by the bull market that the Korean ETF,
KEF, is enjoying. So, perhaps, the market is right not to
worry too much about WW III just yet! Let's hope!
New research tonight shows that we should not take a Peerless
Sell S15 signal this week. The Sell S15
is the signal that is most likely
to occur if the DJI rises above 21116 tomorrow or above 21120 later
this week. The new research shows, and I did not know this until tonight,
that all but one of the 19 previous Sell S15s occurred when the
NYSE A/D Line was FAILING to confirm a DJI new high. In the single
exception, 2002, there was a 5% paper loss on the Sell S15. This was by
far the biggest paper loss. See the revised
statistics for the Peerless S15 below.
Click on the Dates to see the charts and signals.
What also stands out from
this data is that in none of these cases was the P-Indicator so positive as now
(+361),
even allowing for the increasing number of stocks traded.
Key Values shown by second row for each date:
LA/MA 21-dma ANNROC P-I
Daily Change of P-I IP21 V-I OBVPct
65-dayPct Change 65-dma ANNROC
|
SELL S15s since 1928
DATE          Signal         DJI            Gain  Subsequent Action
==========================================================================
19360303      S15            156.2         .042 Hit 158.8, then 150.4
la/ma  annroc P-I       IP21   V-I OBVPct  65chan annroc of
                                                   65-dma
1.026  .525  +38  +13  +.014  -109  +.023  .089  .33
NYSE A/D NC
==========================================================================
19360401      S15            158.9         .058 Hit 160.4, then 149.7
1.024  .198  -37  -10  -.126  -250  +.097  .111  .40
NYSE A/D NC
==========================================================================
19370210      S15            189.4         .126  194.4  3/10
1.019  .391  -10  +12  +.034  -202  +.12   .038  .14
NYSE A/D NC
==========================================================================
19370305      S15            194.1         .147  194.4  3/10
1.028  .373  -15  +5   +.037  -231  +.094  .059  .22
NYSE A/D NC
==========================================================================
19600105      S15            685.5         .107   .107 Perfect!
1.018  .40    +4  +6   -.038  -170  +.099  +.085 +.31
NYSE A/D NC
==========================================================================
19700401      S15            792.04        .155   Perfect!
1.018  .181   -58 -3   -.014  -1    +.034  +.008 -.03
NYSE A/D NC
==========================================================================
19720406      S15            959.44        .025
1.02   .159   -70 15   +.036  -1    -.09   +.075 +.28
NYSE A/D NC
==========================================================================
19720525      S15            969.07
1.025  .279   -10 14   +.004  -1    +.235  +.061  +.23
NYSE A/D NC
==========================================================================
19730105      S15            1047.49       .114
1.023  .238   -77 -7   +.039  -2    +.055  +.098  +.36
NYSE A/D NC
==========================================================================
19760324      S15            1009.21       .048
1.024  .192   -64 +10  -.033  -1    +.261  +.195  +.66
NYSE A/D NC
==========================================================================
19760421      S15            1011.02
1.019  .345   -1  +15  +.038  -1    +.073  +.071  +.26
NYSE A/D NC
==========================================================================
19800213      S15            903.84        .14
1.028  .478   -26 +1   -.01   -1    +.212  +.12   +.44
NYSE A/D NC
==========================================================================
19900103      S15            2809.73       .074
1.027  .27    +36 -15  +.08   -4    +.097  +.043  +.16
NYSE A/D NC
==========================================================================
19940518      S15            3732.89       .026
1.017  .365   -13 +93  +.074  -6    +.042  -.042  -.17
NYSE A/D NC  FALLING 65 DMA
==========================================================================
19980422      S15            9176.72       .168
1.021  .478   +17 +4   +.057  -8    +.053  +.183  +.64
NYSE A/D NC
==========================================================================
20000107      S15            11522.56      .131
1.021  .48    -23 +103 -.028  -59   +.356  +.088  +.33
NYSE A/D NC
==========================================================================
20020226      S15            10115.26      .19  DJI rose to 10633.35 before falling.
1.027  .333   +68 +16  +.047  -160  -.064  +.021  +.09
A/D LINE DID CONFIRM!
=========================================================================
20080501      S15            13040         .127
1.029  .405   +178 +33 +.048  -28   +.082  +.044  +.17
           highest PI
NYSE A/D NC
=========================================================================
20120501      S15            13279.32      .087   Perfect.
1.018  .061   +78  +18 -.003  -87   +.037  +.048  +.18
NYSE A/D NC
--------------------------------------------------------------------
    No.=19  completed... All profitable.  Only one had a significant
    (>4%) paper loss and in its case the A/D Line was confirming the
    DJI's advance.  The highest P-I among these cases was in 2008.
|
4/25/17
Index and ETF Charts:
PEERLESS DJI, Signals, Indicators Daily
DJI Split Volume 10-Day Up/Down Vol
Hourly DJIA
A/D Line for All Stocks.
S&P
OEX
NYSE
NASDAQ COMPQX with CP
DIA SPY
QQQ
MDY
IWM-TNA
Short Term Interest Rates
DJI-Utilities
DJI-Transp A/D Line-6000 Stocks
CrudeOil
FAS
GLD
BBH
IBB
JETS
JNUG
KOL
NUGT
OIH OIL
RSX
RETL SLV SOXL TECL TMF TNA XIV
YINN
To STOCKS' CHARTS
AAPL
AMAT AMGN
AMZN
BIDU
CAT
FB
GOOG
GS
IBM
JPM
MASI
MSFT
NVDA
QCOM
Others REN,
JJC,
NIB,
WEAT
UUP (Dollar)
4/25/17 Bullish MAXCPs
Bearish MINCPS
 RANKING OF KEY DIRECTORIES BASED PCT.OF STOCKS ABOVE 65-DMA
              4/25/17
---------------------------------------------------------------------------------------
Directory     Current       day-1         day-2         day-3         day-4         day-5
----------------------------------------------------------------------------------------
EDU            1             1             1             1             .875          .875
NIFTY          .965          1             .896          .931          .896          .896
INFRA          .909          .909          .454          .363          .272          .272
ETFS           .897          .882          .838          .838          .794          .852
BEVERAGE       .85           .85           .8            .85           .85           .85
UTILITY        .8            .777          .733          .733          .755          .822
MORNSTAR       .794          .764          .634          .672          .575          .563
HOMEBLDG       .777          .833          .777          .777          .777          .833
BONDFUND       .776          .892          .928          .919          .928          .919
GREEN          .774          .677          .645          .677          .612          .612
DJI-13         .769          .692          .692          .692          .692          .769
GAMING         .766          .8            .766          .766          .766          .766
INSURANC       .764          .705          .5            .647          .588          .617
SOFTWARE       .75           .718          .671          .718          .718          .687
SEMI           .741          .715          .672          .689          .629          .603
REIT           .734          .682          .734          .776          .781          .776
DOWJONES       .733          .633          .6            .6            .566          .566
HACKERS        .722          .611          .666          .611          .555          .555
NASD-100       .709          .698          .645          .677          .634          .623
ELECTRON       .701          .67           .603          .623          .556          .494
CHEM           .69           .661          .549          .549          .492          .507
N=21
JETS           .666          .666          .444          .555          .444          .444
PIPELINE       .666          .444          .444          .444          .444          .333
REGBANKS       .666          .611          .388          .361          .083          .055
INDEXES        .659          .647          .638          .668          .55           .554
RUS-1000       .645          .618          .557          .588          .52           .52
SP500          .643          .629          .56           .581          .51           .522
FINANCE        .63           .565          .467          .467          .271          .282
MILITARY       .622          .6            .555          .577          .511          .466
CHINA          .596          .548          .532          .564          .483          .483
SP-100         .587          .525          .484          .494          .432          .443
BIOTECH        .581          .529          .438          .525          .486          .45
BIGBANKS       .571          .142          0             0             0             0
HOSPITAL       .571          .571          .428          .428          .428          .571
TRANSP         .55           .55           .4            .4            .3            .2
SOLAR          .526          .526          .473          .526          .473          .473
COMPUTER       .52           .56           .48           .52           .44           .44
N=16
=============================================================================================
INDMATER       .5            .51           .397          .397          .326          .316
RETAIL         .464          .517          .5            .535          .357          .357
AUTO           .35           .4            .275          .3            .225          .175
N=3

OILGAS         .291          .221          .208          .196          .183          .215
COMODITY       .267          .281          .338          .366          .352          .422
COAL           .222          .222          .222          .222          .111          .111
GOLD           .188          .339          .471          .433          .377          .584
FOOD           .133          .133          0             0             0             0
N=5
=================================================================================
4/24/2017
The DJIA jumped up more than 200 points at the opening.
Europeans says it
was part of a world-wide financial rally resulting from news that the French
Presidential Electoral runoff system may have turned back the populist
candidate,
Marine Le Pen, who wants France to leave the Euro zone. Americans sense
that the reason for the big gains was that Trump and the Republican Congress
seem headed
to cut corporate income taxes to 15%.

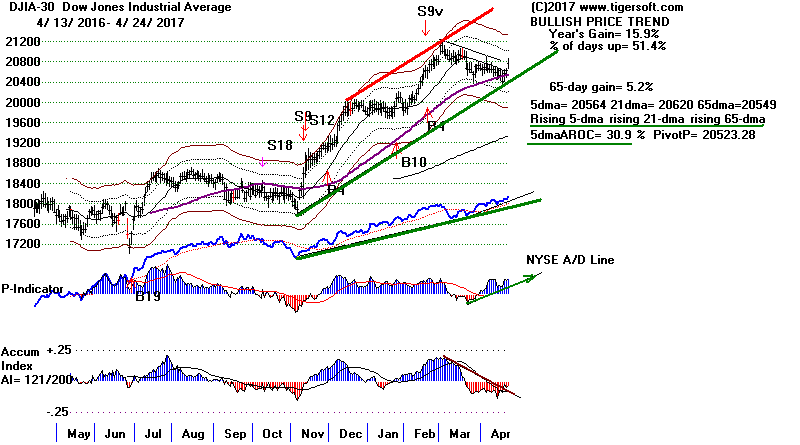
We who follow the charts and technical indicators will want to explain the
rally as being the result of a successful test by the DJI,
SP-500 and NASDAQ
of their rising 65-dma.
The DJI's crossing back above the 65-dma with a
NYSE A/D Line already at a new high has a very good record of quickly bringing
a further advance to new highs.
Since 1965, I can find only one case where
the DJI failed to make a new high after crossing back above a rising 65-dma
with the A/D Line making new highs. This was in
1997. In this
case, Sell S12s
warned of the 13% DJI decline that was coming a month later.
In this new study,
there were 6 cases where the DJI scored multiple new highs
in the aftermath of a super-breadth-confirmed crossover of a rising 65-dma
and 4 cases of the DJI making only a nominal new high before reversing.
So, the
odds look good for a rally by the DJI soon to new highs. But, it may be
only
a nominal new closing high. We
could get a Sell S12 or S15 if we get two
more up-days like today. A DJI close above 21116 (2.2% over the
21-dma)
would likely give us a new Peerless Sell
since even two more good breadth days like
today would still leave our "IP21", "V-I" and "OBVPct" Indicators in negative
territory.
We want, if possible, to be long those stocks and ETFs that have already
made new highs, like QQQ,
TECL or the NASDAQ.
SOXL did breakout
today above the apex of its theoretical right shoulder in a head/shoulders
pattern.
Shorts will be pressed to cover and drive up all the these tech indexes.
Elsewhere, we still see head/shoulders patterns where today's close is at or
just below
the apex of a hypothetical head/shoulders. It remains to be seen if we get
the
additional rises in these which will destroy their head/shoulders patterns by
having prices rise significantly above their potential right shoulder apexes.
See these charts: AAPL, CAT,
JPM, BBH,
IBB, MDY,
TNA and DJI-20.
DIA - Closing Power is still neutral.
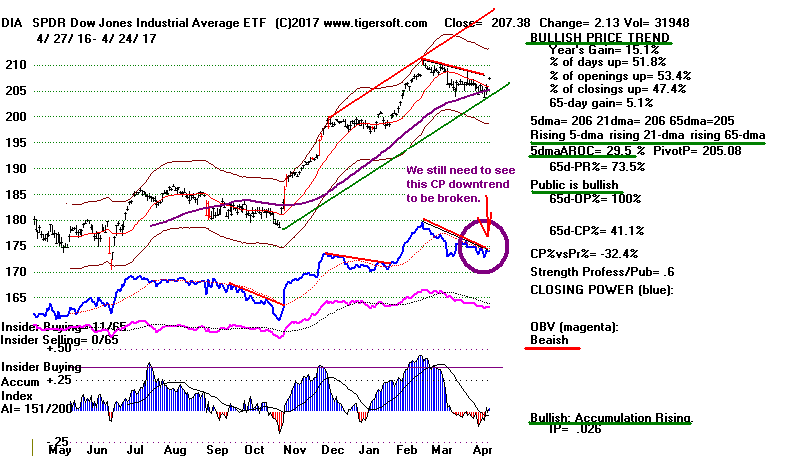
SPY - Closing Power is still neutral.
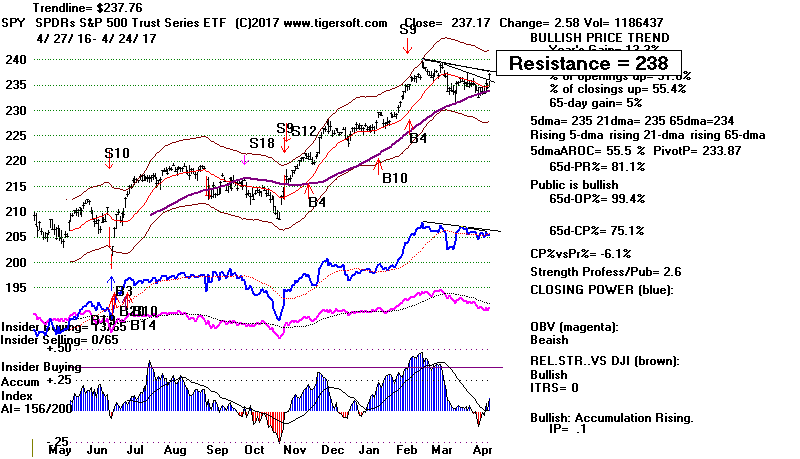
Ideally, we want to see prices continue to rise after tomorrow's opening.
Today, they did not. But, they also did not drop or fade. As you can
see
above, we still need to see our Closing Powers for DIA and SPY decisively
break their downtrends if the rally is going to keep going under the pressure
of Professional buying.
If the Professionals do turn bullish, and prices do rise significantly after the
openings this week, it will be quite bullish. We can see how breaks in the
CP downtrends for DIA and SPY this past year has set off excellent rallies.
Right now the upper band 2.5% to 3.5% bands look they are the target.
But more than that seems unlikely. Up-Day Volume needs to rise by a lot
more
than we are now seeing in the OEX, SP-500, NYSE (below).
The DJI's Hourly DISI-Volume looks weak. This
argues against us getting a
a big, broad rally with multiple new highs.
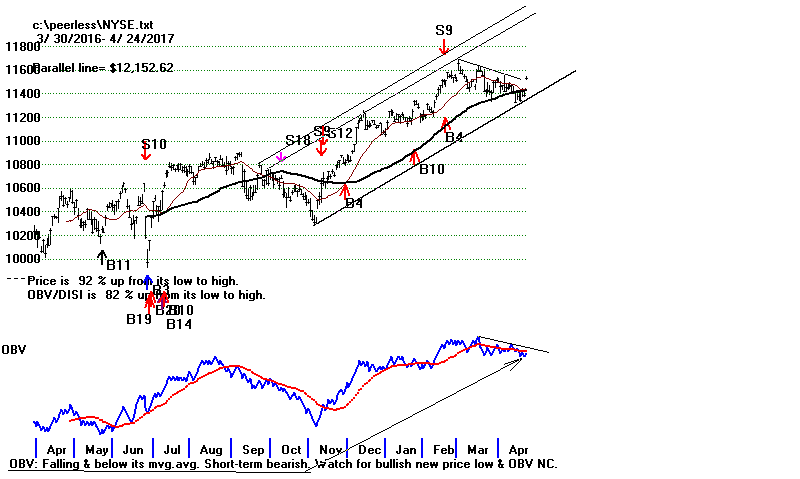
4/24/17
Index and ETF Charts:
PEERLESS DJI, Signals, Indicators Daily
DJI Split Volume 10-Day Up/Down Vol
Hourly DJIA
A/D Line for All Stocks.
S&P
OEX
NYSE
NASDAQ COMPQX with CP
DIA SPY
QQQ
MDY
IWM-TNA
Short Term Interest Rates
DJI-Utilities
DJI-Transp A/D Line-6000 Stocks
CrudeOil
FAS
GLD
BBH
IBB
JETS
JNUG
KOL
NUGT
OIH OIL
RSX
RETL SLV SOXL TECL TMF TNA XIV
YINN
To STOCKS' CHARTS
AAPL
AMAT AMGN
AMZN
BIDU
CAT
FB
GOOG
GS
IBM
JPM
MASI
MSFT
NVDA
QCOM
Others REN,
JJC,
NIB,
WEAT
UUP (Dollar)
4/24/17 Bullish MAXCPs
Bearish MINCPS
 RANKING OF KEY DIRECTORIES BASED PCT.OF STOCKS ABOVE 65-DMA
               4/24/17
---------------------------------------------------------------------------------------
Directory     Current       day-1         day-2         day-3         day-4         day-5
----------------------------------------------------------------------------------------
EDU            1             1             1             .875          .875          .875
NIFTY          1             .896          .931          .896          .896          .931
INFRA          .909          .454          .363          .272          .272          .272
BONDFUND       .892          .928          .919          .928          .919          .919
ETFS           .882          .838          .838          .794          .852          .882
BEVERAGE       .85           .8            .85           .85           .85           .85
HOMEBLDG       .833          .777          .777          .777          .833          .777
GAMING         .8            .766          .766          .766          .766          .733
UTILITY        .777          .733          .733          .755          .822          .844
MORNSTAR       .764          .634          .672          .575          .579          .605
SOFTWARE       .718          .671          .718          .718          .687          .64
SEMI           .715          .672          .689          .629          .62           .603
INSURANC       .705          .5            .647          .588          .617          .647
NASD-100       .698          .645          .677          .634          .623          .602
DJI-13         .692          .692          .692          .692          .769          .769
REIT           .682          .734          .776          .781          .776          .734
GREEN          .677          .645          .677          .612          .58           .612
ELECTRON       .67           .603          .628          .556          .515          .525
N = 18
JETS           .666          .444          .555          .444          .444          .444
CHEM           .661          .549          .549          .492          .507          .492
INDEXES        .647          .638          .668          .55           .554          .638
DOWJONES       .633          .6            .6            .566          .566          .566
SP500          .629          .56           .581          .51           .522          .527
RUS-1000       .618          .557          .588          .52           .522          .517
HACKERS        .611          .666          .611          .555          .555          .5
REGBANKS       .611          .388          .361          .083          .055          .083
MILITARY       .6            .555          .577          .511          .466          .488
HOSPITAL       .571          .428          .428          .428          .571          .714
FINANCE        .565          .467          .467          .271          .282          .271
COMPUTER       .56           .48           .52           .44           .44           .44
TRANSP         .55           .4            .4            .3            .2            .25
CHINA          .548          .532          .564          .483          .483          .564
BIOTECH        .533          .438          .517          .49           .458          .529
SOLAR          .526          .473          .526          .473          .473          .526
SP-100         .525          .484          .494          .432          .443          .453
RETAIL         .517          .5            .535          .357          .339          .339
INDMATER       .51           .397          .397          .326          .316          .306
N = 19
===========================================================================================
PIPELINE       .444          .444          .444          .444          .333          .333
AUTO           .4            .275          .3            .225          .175          .175
GOLD           .339          .452          .452          .377          .584          .584
n=3
-------------------------------------------------------------------------------------------
COMODITY       .281          .338          .366          .352          .422          .507
COAL           .222          .222          .222          .111          .111          .111
OILGAS         .221          .208          .196          .183          .215          .227
BIGBANKS       .142          0             0             0             0             0
FOOD           .142          0             0             0             0             0
N= 5
=================================================================================
4/21/2017 Expect Good Rallies This Week.
The DJI seems to have successfully tested its 65-dma.
The renewed White House focus on the Budget will help the
DJIA. It's hard to overstate how eagerly Wall Street quietly wants
and expects tax cuts. The markets refused to sell off on Friday despite
the dangers of a World War beginning in Korea. That's pretty amazing,
it seems to me.
Instead, the NYSE A/D Line made a new high far ahead
of the DJI itself. Even so, volume will have to
expand on this week's
rally if the resistance overhead is to be overcome.
A strong A/D Line making 40 day new highs when the DJI is below its 21-day
ma, as has been true a lot recently, is generally bullish, but by no means
all the time. See
the new study. There were 29 earlier cases going back
to 1965. 12 brought rallies. 8 soon saw declines. In 9
instances the DJI
went sidewise for 10 weeks. As long, as the DJI stays above its
65-dma but does not rise too quickly to the upper band, expect the uptrend
to stay intact.
Perhaps more bullish, the downtrend-line for our Accumulation Index
on the DJI was broken. This is important: with Accumulation
now replacing Distribution, rallies now are likely not to encounter so
much selling on strength and are apt not to be faded so much towards the
day's close. If this interpretation is correct, then our Tiger Closing
Power for
the DIA and SPY should soon break their downtrends even if the
|
DJI opens up strongly. That has a history of being quite bullish.
See the charts of the DJI and DIA just below.
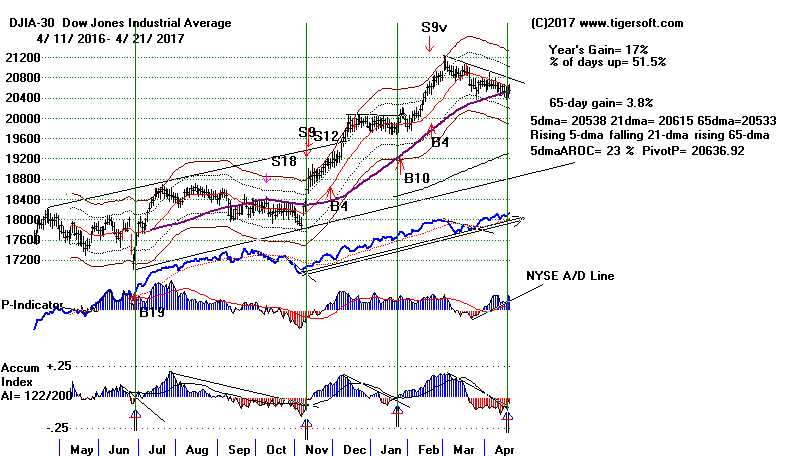
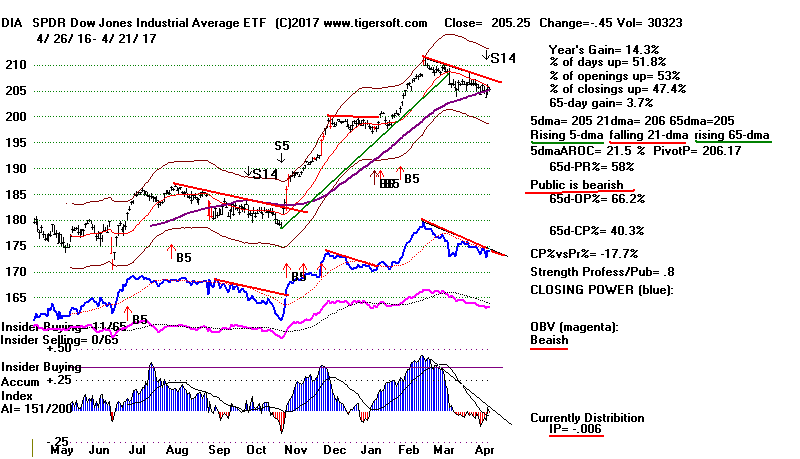
The Closing Power for QQQ and the NASDAQ are already rising.
They should next challenge the resistance lines shown just below.
The main technical problems for QQQ and the NASDAQ
are:
(1) their broadening patterns are not particularly bullish and
(2) their upside potential up to their resistance lines is limited.
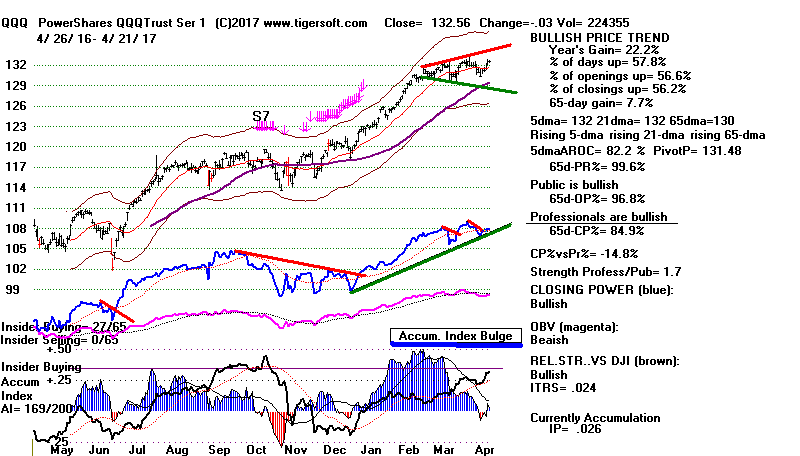
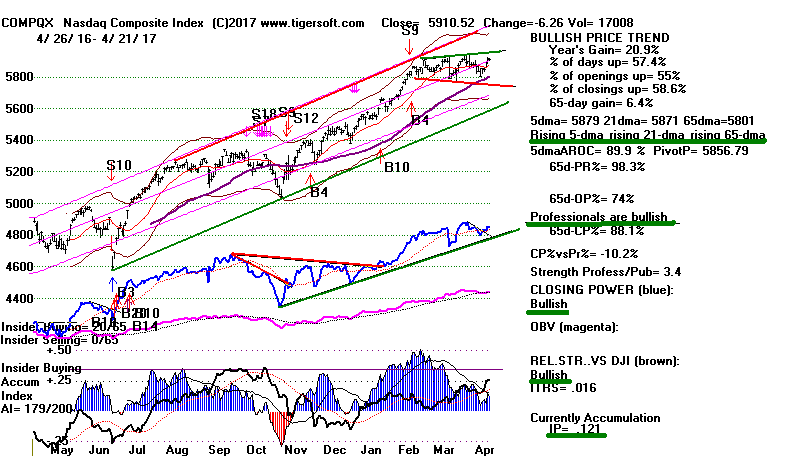
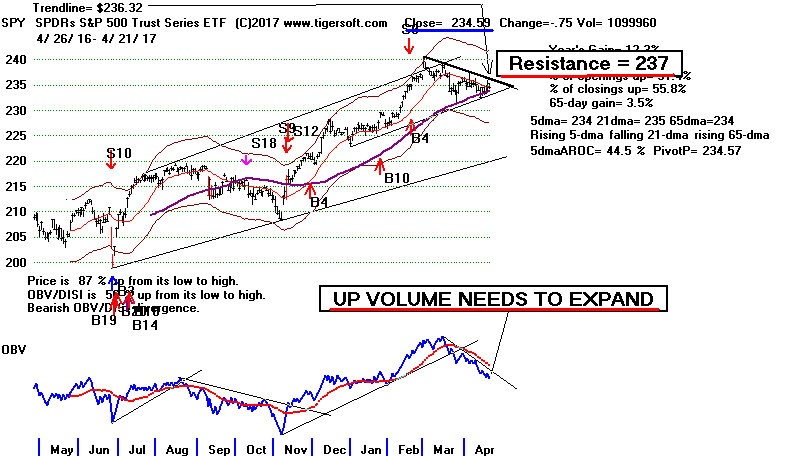
4/21/17
Index and ETF Charts:
PEERLESS DJI, Signals, Indicators Daily
DJI Split Volume 10-Day Up/Down Vol
Hourly DJIA
A/D Line for All Stocks.
S&P
OEX
NYSE
NASDAQ COMPQX with CP
DIA SPY
QQQ
MDY
IWM-TNA
Short Term Interest Rates
DJI-Utilities
DJI-Transp A/D Line-6000 Stocks
CrudeOil
FAS
GLD
BBH
IBB
JETS
JNUG
KOL
NUGT
OIH OIL
RSX
RETL SLV SOXL TECL TMF TNA XIV
YINN
To STOCKS' CHARTS
AAPL
AMAT AMGN
AMZN
BIDU
CAT
FB
GOOG
GS
IBM
JPM
MASI
MSFT
NVDA
QCOM
Others REN,
JJC,
NIB,
WEAT
UUP (Dollar)
4/21/17 Bullish MAXCPs
Bearish MINCPS
 RANKING OF KEY DIRECTORIES BASED PCT.OF STOCKS ABOVE 65-DMA
                            4/21/17
---------------------------------------------------------------------------------------
Directory     Current       day-1         day-2         day-3         day-4         day-5
----------------------------------------------------------------------------------------
EDU            1             1             .875          .875          .875          .75
BONDFUND       .928          .919          .928          .919          .919          .928
NIFTY          .896          .931          .896          .896          .931          .827
ETFS           .838          .838          .794          .852          .882          .823
BEVERAGE       .8            .85           .85           .85           .85           .85
HOMEBLDG       .777          .777          .777          .833          .777          .777
GAMING         .766          .766          .766          .766          .733          .666
REIT           .734          .776          .781          .776          .734          .682
UTILITY        .733          .733          .755          .822          .844          .755
DJI-13         .692          .692          .692          .769          .769          .769
SEMI           .672          .689          .629          .62           .603          .551
SOFTWARE       .671          .718          .718          .687          .64           .562
HACKERS        .666          .611          .555          .555          .5            .444
N=13
GREEN          .645          .677          .612          .58           .612          .516
NASD-100       .645          .677          .634          .623          .602          .537
INDEXES        .638          .668          .55           .554          .638          .495
MORNSTAR       .634          .672          .575          .579          .609          .462
ELECTRON       .603          .628          .561          .515          .525          .479
DOWJONES       .6            .6            .566          .566          .566          .533
SP500          .56           .581          .51           .522          .533          .464
RUS-1000       .557          .588          .52           .522          .52           .449
CHEM           .549          .549          .492          .507          .492          .436
MILITARY       .533          .555          .488          .466          .488          .377
CHINA          .532          .564          .483          .483          .58           .596
N=11
===========================================================================================
INSURANC       .5            .647          .588          .617          .647          .529
RETAIL         .5            .535          .357          .339          .339          .285
===========================================================================================
SP-100         .484          .494          .432          .443          .453          .391
COMPUTER       .48           .52           .44           .44           .44           .36
SOLAR          .473          .526          .473          .473          .526          .421
FINANCE        .467          .467          .271          .282          .271          .228
INFRA          .454          .363          .272          .272          .272          .09
GOLD           .452          .433          .396          .584          .584          .622
JETS           .444          .555          .444          .444          .444          .444
PIPELINE       .444          .444          .444          .333          .333          .333
BIOTECH        .442          .517          .482          .462          .529          .478
HOSPITAL       .428          .428          .428          .571          .714          .714
TRANSP         .4            .4            .3            .2            .25           .2
INDMATER       .397          .397          .326          .316          .316          .295
REGBANKS       .388          .361          .083          .055          .083          .055
COMODITY       .338          .366          .352          .422          .507          .478
N=15
AUTO           .275          .3            .225          .175          .175          .15
COAL           .222          .222          .111          .111          .111          .111
OILGAS         .208          .196          .183          .215          .227          .221
BIGBANKS       0             0             0             0             0             0
FOOD           0             0             0             0             0             0
n=5
=================================================================================
4/20/2017
Peerless has not given a new Buy signal, but the Closing Power
for DIA seems about to bullishly break its downtrend.
SPY and
QQQ
show rising Closing Powers now. Another good day for the market will
make it seem that the 65-day ma has been successfully tested. On the
other hand, another reversal downward after a one-day rally would
show that a lot of big holders of stocks are still anxiously selling
into just one day's strength. If that happens, we must again ask what are
they afraid of. And what will it take for them to regain their confidence in
the market.
Because of the possibility of international developments regarding Korea
taking place over there weekend, there may be more selling into strength
tomorrow. That would mean we may not see the market make a meaningful
advance until next week.
Watch SOX (Semi-conductors below), FAS and
MDY to see if these key ETFs
can rally enough from here to destroy their potential head/shoulders patterns.
I would consider this quite bullish in the short-run, because of all the
short-covering
that should then follow. A failure to achieve breakouts, on the other
hand,
would probably mean more backing and filling while a lengthier right shoulder
is developed.
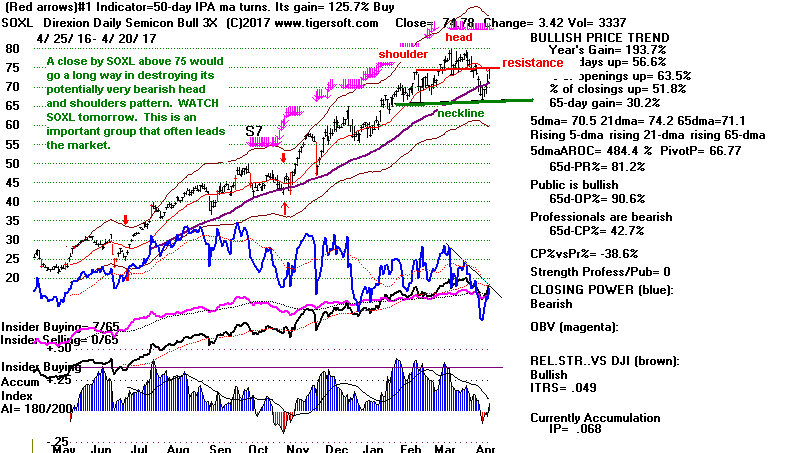
Volume rose and SPY's Closing Power
is now slightly above its now rising
CP-21-day ma and so is rated as "bullish" by TigerSoft. The SPY chart
seems
to show what appears now to have been a successful test of its rising 65-dma.
This should now allow it to test its highs at 240. Unfortunately, without more
volume, a price-breakout above that level seems unlikely.
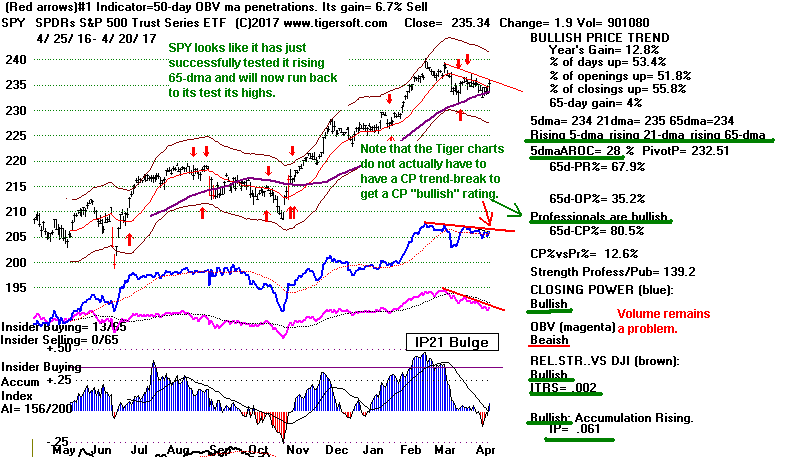
DIA, which must cope "with the weakened and high-priced GS and IBM,
has not yet had its Closing Power become rated "bullish". Its Closing
Power
is still in a downtrend and DIA is still slightly below the resistance of its
falling 21-day ma. A bullish break by DIA's Closing Power of its downtrend
looks
imminent. Apparently, the market expects Congress still to rewrite
ObamaCare
which will allow Republicans to pass big tax cut legislation before too long
just as
many on Wall Street dismiss as rhetoric all the war talk regarding North Korea.
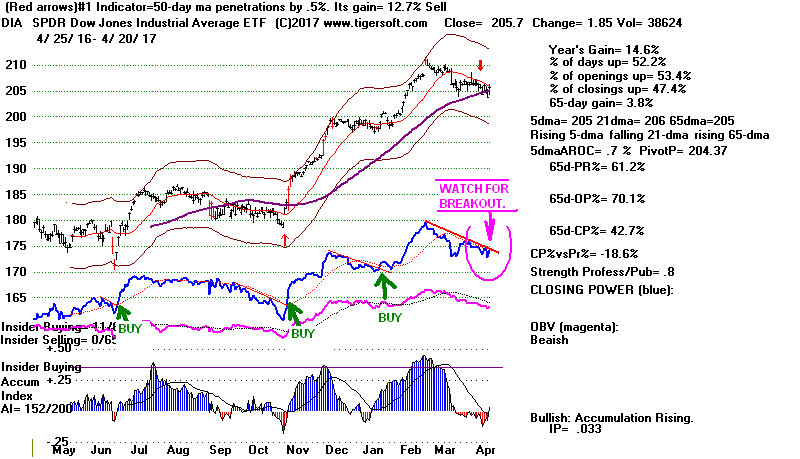
Interestingly, if one simply builds a DJI-30 weighted by average price
times
average volume, the Tiger-DJI-30, one sees a bullish looking Index. See
the
chart below. Barring a big new sell-off in GS, IBM or Oil (which would
hurt
XOM and CVX in the DJI-30, it appears that DIA has seen its lows on
this minor correction. However, we still need to see another solid
advance,
one where the DJI closes convincingly above its opening. Otherwise, the
bearish pattern of the DJI only making isolated one-day advances will still
be present and DIA's Closing Power will not yet have broken its downtrend.
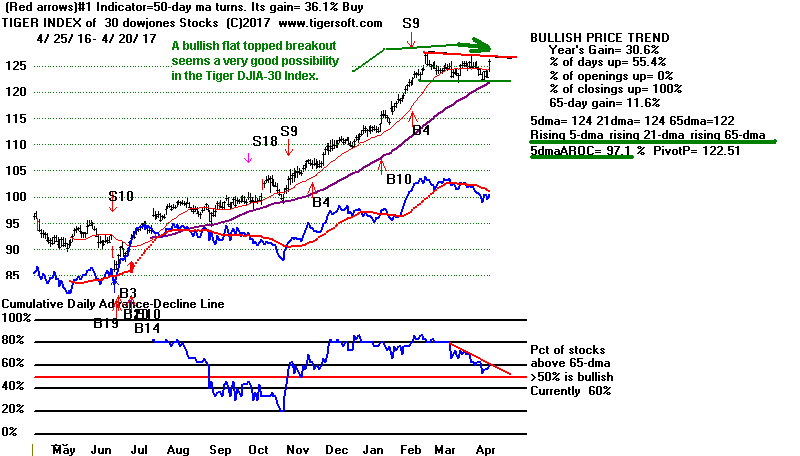
QQQ rates Buying. Its Opening and Closing
Power are both rising.
It was so much stronger than the DJI that it did not even have to test
its 65-dma. Its "ITRS" shows that it has outperformed DIA by 2%
over the last 50-trading days.
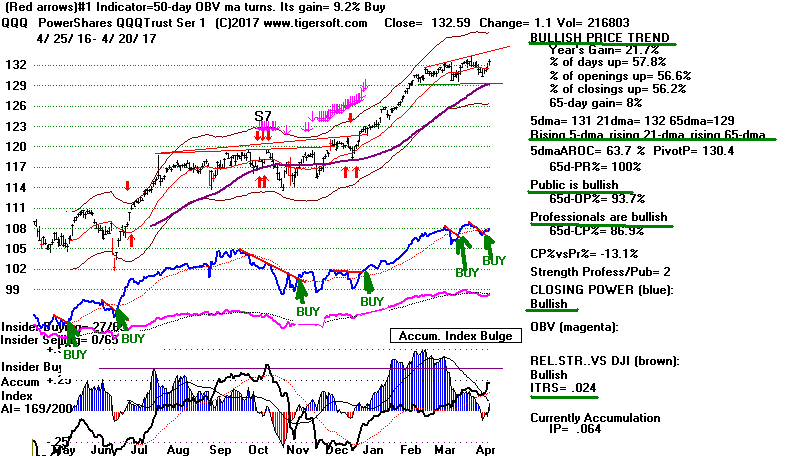
If the market really wants to do something
impressive, it will rise so much in
the next week that the various potential head/shoulders patterns will be
destroyed. FAS will need to close above 45 for its head/shoulders
pattern
to look like it has failed. Similarly a close by TNA above 110 would
destroy
its head/shoulders pattern and thereby invite more buying in the smaller
Russell-2000
stocks.
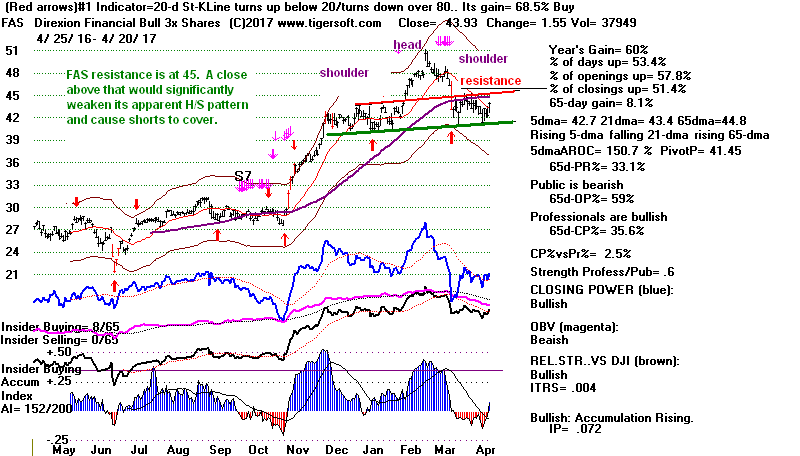
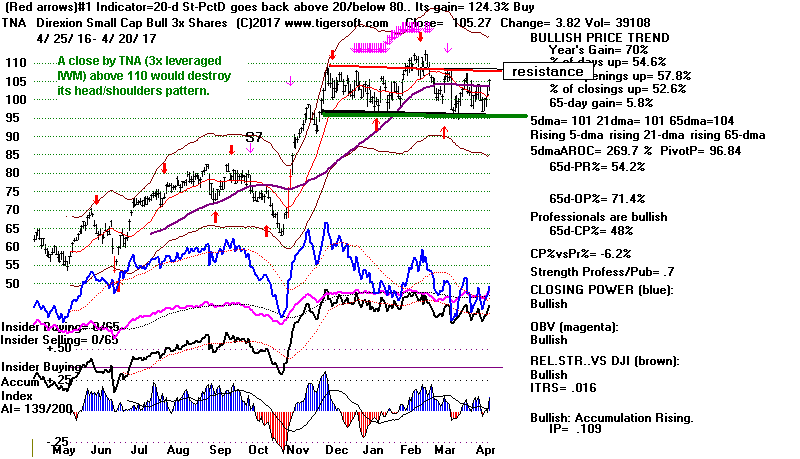
4/20/17
Index and ETF Charts:
PEERLESS DJI, Signals, Indicators Daily
DJI Split Volume 10-Day Up/Down Vol
Hourly DJIA
A/D Line for All Stocks.
S&P
OEX
NYSE
NASDAQ COMPQX with CP
DIA SPY
QQQ
MDY
IWM-TNA
Short Term Interest Rates
DJI-Utilities
DJI-Transp A/D Line-6000 Stocks
CrudeOil
FAS
GLD
BBH
IBB
JETS
JNUG
KOL
NUGT
OIH OIL
RSX
RETL SLV SOXL TECL TMF TNA XIV
YINN
To STOCKS' CHARTS
AAPL
AMAT AMGN
AMZN
BIDU
CAT
FB
GOOG
GS
IBM
JPM
MASI
MSFT
NVDA
QCOM
Others REN,
JJC,
NIB,
WEAT
UUP (Dollar)
4/20/17 Bullish MAXCPs Bearish MINCPS
 RANKING OF KEY DIRECTORIES BASED PCT.OF STOCKS ABOVE 65-DMA
               4/20/17
---------------------------------------------------------------------------------------
Directory     Current       day-1         day-2         day-3         day-4         day-5
----------------------------------------------------------------------------------------
EDU            100%          .875          .875          .875          .75           .625
NIFTY          .931          .896          .896          .931          .827          .862
BONDFUND       .919          .928          .919          .919          .928          .919
BEVERAGE       .85           .85           .85           .85           .85           .85
ETFS           .838          .794          .852          .882          .823          .882
HOMEBLDG       .777          .777          .833          .777          .777          .722
REIT           .776          .781          .776          .734          .682          .734
GAMING         .766          .766          .766          .733          .666          .7
UTILITY        .733          .755          .822          .844          .755          .866
SOFTWARE       .718          .718          .687          .64           .578          .687
DJI-13         .692          .692          .769          .769          .769          .769
SEMI           .689          .629          .62           .603          .543          .577
GREEN          .677          .612          .58           .612          .516          .58
NASD-100       .677          .634          .623          .602          .537          .602
MORNSTAR       .672          .575          .579          .609          .466          .592
N=15
INDEXES        .663          .55           .554          .638          .495          .63
INSURANC       .647          .588          .617          .647          .558          .647
ELECTRON       .628          .561          .52           .525          .474          .5
HACKERS        .611          .555          .555          .5            .444          .555
DOWJONES       .6            .566          .566          .566          .533          .666
RUS-1000       .588          .52           .522          .52           .454          .514
SP500          .581          .51           .522          .533          .468          .529
CHINA          .564          .483          .483          .58           .596          .629
JETS           .555          .444          .444          .444          .444          .444
MILITARY       .555          .488          .466          .488          .377          .466
CHEM           .549          .492          .507          .492          .45           .577
RETAIL         .535          .357          .339          .339          .285          .392
SOLAR          .526          .473          .473          .526          .421          .421
BIOTECH        .521          .482          .454          .533          .478          .43
COMPUTER       .52           .44           .44           .44           .4            .44
N=15
===========================================================================================
SP-100         .494          .432          .443          .453          .391          .505
FINANCE        .467          .271          .282          .271          .228          .239
PIPELINE       .444          .444          .333          .333          .333          .444
GOLD           .433          .377          .603          .584          .622          .622
HOSPITAL       .428          .428          .571          .714          .714          .714
TRANSP         .4            .3            .2            .25           .2            .2
INDMATER       .397          .326          .316          .316          .295          .377
COMODITY       .366          .352          .422          .507          .464          .464
INFRA          .363          .272          .272          .272          .181          .454
REGBANKS       .361          .083          .055          .083          .055          .083
N=10
---------------------------------------------------------------------------------------------
AUTO           .3            .225          .175          .175          .15           .2
COAL           .222          .111          .111          .111          .111          .111
OILGAS         .196          .183          .215          .227          .221          .278
BIGBANKS       0             0             0             0             0             0
FOOD           0             0             0             0             0             0
N=5
=================================================================================


