------------ TIGERSOFT/PEERLESS HOTLINE ----------------
-->
Click Refresh twice or thrice to be sure to
get last version.

(C) 1985-2017 William Schmidt, Ph.D.
www.tigersoft.com
All rights strictly reserved.
Tiger Software 858-273-5900 PO Box
22784 San Diego, CA 92192 Email
william_schmidt@hotmail.com
-------------------------------------------------------------------------------------------------------------
===> You are here:
www.tigersoft.com/HH9911/INDEX.htm
Earlier Hotlines
http://www.tigersoft.com/HHH517/INDEX.htm
www.tigersoft.com/HHH517/XXXIndex.htm
www.tigersoft.com/HHH517/INDEX6917.htm
www.tigersoft.com/HHH517/OLDER.html
www.tigersoft.com/HH747/INDEX.html
www.tigersoft.com/HHLL217/INDEX.html
PREINDEX.html
www.tigersoftware.com/HL/INDEX.html
Most
Recent Hotlines: 2/4/2017 - 2/15/2017
These have somehow become corrupted. Their graphs are missing.
http://www.tigersoft.com/345HLN12/ZINDEX.html
http://www.tigersoft.com/333HLLL/INDEX.html
http://www.tigersoft.com/444HL444/INDEX.html
www.tigersoft.com/119HLPAZ/INDEX.html
http://www.tigersoft.com/888HLAZ/INDEX.html
www.tigersoft.com/821-HL/INDEX.html
http://www.tigersoft.com/816-HLN/INDEX.html
http://www.tigersoft.com/77HL7778/INDEX.html
http://www.tigersoft.com/64HRL/INDEX.html
http://www.tigersoft.com/55HL55/INDEX.html
HELP
A
Guide To Profitably Using The Tiger Nightly HOTLINE
Introduction
to Tiger/Peerless Buys and Sells.
Peerless
Buy and Sell Signals: 1928-2016
Individual Peerless signals explained:
http://tigersoftware.com/PeerlessStudies/Signals-Res/index.htm
http://www.tigersoft.com/PeerInst-2012-2013/
Explanation of each Peerless signal.
http://www.tigersoft.com/PeerInst-2012-2013/
Different
Types of TigerSoft/Peerless CHARTS, Signals and Indicators
Peerless Signals and DJI
Charts - version 7/4/2013
1965
1965-6 1966
1966-7
1967
1967-8
1968
1968-9
1969
1969-70 1970
1970-1
1971
1971-2 1972
1972-3
1973 1973-4
1974
1974-5 1975
1975-6
1976 1976-7
1977
1977-1978
1978
1978-79
1979
1979-80
1980
1980-1
1981
1981-2
1982
1982-1983
1983 1983-1984
1984
1984-1985
1985
1985-1986
1986
1986-1987
1987
1987-8
1988
1988-9 1989
1989-90
1990
1990-1 1991
1991-2
1992
1992-3
1993
1993-4
1994
1994-5
1995
1995-1996 1996
1996-7
1997
1997-8 1998
1998-1999
1999
1999-2000
2000
2000-1 2001
2001-2
2002
2002-3
2003
2003-4
2004
2004-5
2005 2005-6
2006
2006-7
2007
2007-8
2008
2008-9
2009
2009-10
2010
2010-11
2011
2011-12
2012 2012-2013
2013
2013-2014
2014
2014-2015
2015
2015-2016
----->
More HELP LINKS
Documentation for
TigerSoft Automatic and Optimized Signals.
How
reliable support is the DJI's rising 200-day ma?
SPY
Charts since 1994: Advisory Closing Power S7s, Accum. Index, 65-dma, Optimized
Signals.
^^^^^^^^^^^^^^^^^^^^^^^^^^^^^^^^^^^^^^^^^^^^^^^^
1/19/2016 --->
Corrections,Deeper Declines and Bear Markets since 1945.
1/21/2016
--->
High Velocity Declines since 1929
2/12/2016 --->
Presidential Elections Years and Bullish IP21 Positive Non-Confirmations at
Lower Band.
2/12/2016 --->
OBV NNCs on
DJI's Rally to 2.7% Upper Band when DJI's 65-dma is falling.
11/6/2016 --->
Killer Short Selling Techniques:
===>
Order
Here
($42.50)
It's As Easy as 1,2,3
TigerSoft "Combination" Short-Selling...
Easy as 1-2-3 Short Sales
Earlier Q-Answers
QuickSilver
Documentation (1/11/2016)
Our Different Signals
Better
understand the difference between Peerless DJI-based signals,
the one-year optimized red Signals and
the fixed signals based
on technical developments.
Introduction to
Tiger/Peerless Buys and Sells.
Different Types of TigerSoft/Peerless CHARTS, Signals and Indicators
New
TigerPeerless
Installation and Basic Uses' Instruction
(11/25/2016)
See
the re-written materials on TigerSoft Buys and Sells.
A few more pages will be added. But users could print
this
main Installation and Uses' Page for reference.
Study-
Trading SPY WITHOUT Peerless - Some Guidelines.
When completed this will be a
new Tiger Trading E-Book.
Study-
Examples of "Hands above the Head" top patterns.
Study-
9/3/2017
TigerSoft (not
Peerless) charts of Major Tops as they occurred.
===> Please report any broken or
out-of-date links. william_schmidt@hotmail.com
==============================================================================
NEW- 8/23/2017 -Tiger's Elite Service Professional Page has a new Peerless
update today.
Use the NEW TIGER RANKER (see instructions there) to
produce a
graph-able list of all the new B24s, new Closing Power highs/lows and
Tiger Traders' Tool high and lows.
The B24 occurs when a stock has had an IP21 above +.375 in the previous
40 trading days and then makes a fresh new high with the current IP21 above +.23
(These parameters seem reasonably tight. Let me know if you think
differently.)
=================================================================================
=================================================================================
===============================================================================
9/11/2017
Breadth was excellent on today's big 1% advance in the DJI and SP-500.
The recent DJI's price action can be viewed as a bullish inverted and
shoulders. SDS bearishly failed again at its falling 65-dma and today
made a new low. The NASDAQ shows an even clearer example of
an inverted head/shoulders pattern.|
But important technical problems persist:
1) This has been a defensive stocks' advance.
2) Big banks are suspiciously lagging.
3) The gains are being made mostly in thinner over-night trading.
4) Volume is not increasing much on advances.
5) Red distribution prevails over Blue Accumulation.
Yes, this is a manic market. In one day of trading, it has gone from testing
key support to looking very much it might make a run in new high ground.
The reason: the markets are now focusing on the way Hurricanes Harvey and
Irma
will bring about billions of dollars worth of re-building. In this,
they could have
have the same effect for stocks as the ever-vaunted, but never passed,
legislation for a huge nation-wide infrastructure makeover. But will
the Republican
majority set aside their budget-balancing priorities? They still want
a big tax cut.
These priorities would seem to be inconsistent. Again, the market may
be turning
unrealistically optimistic. Much depends on whether Congress behaves as it
did
after the Miami hurricane of 1926 or whether it acts on a new infrastructure
scheme as it did in the Fall of 1954 with Eisenhower's championing.
Meanwhile, the DJI's price action has setup a
short-term bullish inverted
head/shoulders price pattern. These are normally reliable and should be
trusted.
A close above its neckline (22400) should be judged as a Buy B10. This
would have the effect of nullifying an S9-v (negative V-I) at the 1.8% upper
band or an S12 (negative IP21) at the upper 2.4% band). A clear
breakout
should allow the DJI to reach 22800-23000. But for the markets to stay
at this
level for very long, history suggests that the DJI's bullish inverted
head and
shoulders pattern will need to see a noticeable rise in volume on the NYSE.
Today's increase was modest. But, as we know, lots of institutional
trading is
occurring away from the NYSE and prices can be manipulated by using the
thinner futures market before official trading starts in New York.
A Big New Advance?
The task for us now is to see if the internals of the
market can support
a big new leg up in this aged bull market. Historically, we could see
a
sell-off like the one occurred after the Miami hurricane of 1926. Or
we could see a renewed bull market if Congress passes a big
infrastructure re-building program, like Eisenhower's inter-state highways
scheme in the mid 1950s?
1926-1927
 |
1954-1955
 |
Watch The Markets Internals
Volume should be higher, but the Peerless V-Indicator rose enough
to give us hope that it will be positive enough tomorrow to avert a new
S9-V occurring provided we get another big-up day. Watch the NYSE Down
Volume number tomorrow. It fell to only 148 million today.
Another day of
low Down Volume like today's would be bullish.
Daily volume must rise to eat up the overhead supply of stock. The
lagging
Hourly DJI's DISI-OBV Line warns us that too much of the rally is occurring
in the pre-market thinner-trading market. That is the same
message the still falling
Closing Powers give.
Unfortunately, the Accumulation Index remains negative. Still a
reasonably
clear DJI breakout above its flat, well-tested resistance into all-time high
territory should be treated as a judged Buy B10. This will have the
practical
effect of reversing the Sell S9-V from last month and ought to allow the DJI to
come close to its upper 3.5% band or 12800.
INFRASTRUCTURE SPENDING ON THE WAY?
Charts
PEERLESS DJI, Signals, Indicators Daily DJI Split Volume 10-DayUp/Down Vol
Hourly DJIA A/D Line for All Stocks
DJIA S&P OEX NYSE NASDAQ COMPQX with CP
DIA SPY QQQ MDY IWM-TNA
Short Term Interest Rates DJI-Utilities DJI-Transp
Nifty-30 Index
CrudeOil FAS GLD BBH IBB JETS JNUG KOL NUGT OIH OIL
RSX RETL SDS SLV SOXL TECL TMF TNA
UGA
(gasoline) XIV YINN
Commodities: JJC, NIB, CORN, WEAT UUP
(Dollar)
AAPL ADBE ALXN AMAT AMGN AMZN BA BABA BIDU CAT FB GOOG GS
HD IBM JPM M (Macy's) MASI MSFT NVDA QCOM TSLA TXN
ANDV, CMG (Chipotle), LRCX, SWKS, TOWN
Others REN, CVE and SWN (very low AI/200 stocks)
9/11/2017
Bullish MINCPs Bearish
MINCPs
56% of all stocks/ETFs are above their 65-dma and this
trend is rising.
 RANKING OF KEY DIRECTORIES BASED PCT.OF STOCKS ABOVE 65-DMA
9/11/17
Bullish = 33
Bearish = 12
---------------------------------------------------------------------------------------
Directory Current day-1 day-2 day-3 day-4 day-5
----------------------------------------------------------------------------------------
BIGMIL 1 .8 .8 .8 .8 .8
ETFS .924 .863 .863 .818 .757 .909
UTILITY .911 .866 .866 .844 .844 .844
BONDFUND .866 .866 .901 .866 .848 .848
NIFTY .8 .633 .666 .7 .733 .766
SOLAR .8 .733 .866 .8 .733 .933
GOLD .773 .849 .905 .83 .83 .849
HACKERS .722 .666 .666 .555 .555 .611
GAMING .7 .666 .7 .633 .733 .733
CHINA .698 .682 .682 .65 .666 .73
INDMATER .683 .673 .673 .663 .632 .663
INDEXES .677 .64 .626 .649 .602 .644
COMODITY .676 .661 .69 .69 .69 .69
MORNSTAR .668 .55 .558 .563 .516 .626
 RANKING OF KEY DIRECTORIES BASED PCT.OF STOCKS ABOVE 65-DMA
              9/11/17
Bullish = 33
Bearish = 12
---------------------------------------------------------------------------------------
Directory     Current       day-1         day-2         day-3         day-4         day-5
----------------------------------------------------------------------------------------
BIGMIL         1             .8            .8            .8            .8            .8
ETFS           .924          .863          .863          .818          .757          .909
UTILITY        .911          .866          .866          .844          .844          .844
BONDFUND       .866          .866          .901          .866          .848          .848
NIFTY          .8            .633          .666          .7            .733          .766
SOLAR          .8            .733          .866          .8            .733          .933
GOLD           .773          .849          .905          .83           .83           .849
HACKERS        .722          .666          .666          .555          .555          .611
GAMING         .7            .666          .7            .633          .733          .733
CHINA          .698          .682          .682          .65           .666          .73
INDMATER       .683          .673          .673          .663          .632          .663
INDEXES        .677          .64           .626          .649          .602          .644
COMODITY       .676          .661          .69           .69           .69           .69
MORNSTAR       .668          .55           .558          .563          .516          .626
N=14
--------------------------------------------------------------------------------------------
DOWJONES       .666          .533          .6            .633          .6            .666
HOMEBLDG       .666          .666          .611          .611          .555          .5
AUTO           .65           .625          .6            .525          .55           .625
BEVERAGE       .65           .6            .65           .7            .65           .75
BIOTECH        .641          .614          .59           .578          .578          .578
SP-100         .625          .51           .572          .593          .541          .562
NASD-100       .617          .539          .561          .55           .528          .573
DJI-13         .615          .461          .461          .461          .461          .461
GREEN          .612          .58           .58           .516          .483          .58
SOFTWARE       .609          .562          .578          .5            .484          .546
REIT           .606          .538          .538          .544          .492          .58
TRANSP         .6            .5            .5            .45           .4            .45
SP500          .596          .512          .512          .522          .497          .545
SEMI           .59           .49           .527          .518          .5            .6
ELECTRON       .587          .505          .546          .515          .52           .592
RUS-1000       .567          .487          .485          .492          .484          .536
CHEM           .555          .458          .388          .416          .43           .486
MILITARY       .555          .533          .555          .555          .577          .555
INFRA          .545          .545          .545          .545          .545          .545
N=19
--------------------------------------------------------------------------------------------
EDU            .5            .5            .625          .5            .5            .5
--------------------------------------------------------------------------------------------
RETAIL         .448          .396          .431          .431          .396          .379
COMPUTER       .44           .32           .44           .44           .4            .52
OILGAS         .43           .392          .417          .405          .367          .386
INSURANC       .382          .264          .117          .205          .176          .382
FOOD           .357          .357          .357          .357          .428          .214
FINANCE        .347          .271          .26           .304          .326          .489
JETS           .333          .333          .222          .111          .111          .111
PIPELINE       .333          .333          .222          .222          .222          .222
COAL           .222          .222          .222          .222          .222          .222
REGBANKS       .194          .055          .027          .055          .055          .333
BIGBANKS       .142          0             0             .142          .142          .714
HOSPITAL       .142          .142          .142          .142          .285          .285
N=12
==================================================================================
9/8/2017
The DJI and SP-500, having tested their 50-dma
and 65-dma supports,
now want to rally. But the Closing Powers for DIA and SPY are still
declining; so most likely, the recovery this coming week will not make
more than nominal new highs. The Sell S9-V still is operative.
Hurricane Irma was a monster, but it could have
been bigger and could have
hit Miami directly. So, there is a certain amount of relief now and
the futures
suggest a rally up from the DJI's rising 65-dma. I have studied the
DJI back to
1929 to see if a case can be made for believing a Buy B11 should have been
rendered this September and we should be buyers now. Only in 36% of the
cases would buying on a test within 1% of the 65-dma have worked out
well, while in 16 (64%) of the cases it would have been better to wait for
lower prices.
Should we have had a Peerless Buy
B11 on the DJI's test of its 65-dma?
Our software did not give one on the recent test because its rules require
the DJI to close nearer to the rising 21-dma and do not allow a Buy B11
when the V-I is so negative. To show the reason for these two
qualifiers
look at the cases in September if we do allow a Buy B11 in September
when the DJI closes simply within 1% of its rising 65-dma and we
disregard
the level of the V-I.
There are 2/3 more failures of such Buy B11s than successes. A V-I
reading
below -45, as is true now, occurred more often with the failures of buying at
the rising
65-dma. Only 2 of the 9 cases that showed such a low V-I in the
September B11
successes while 9 of the 15 failures had a V-I below -45. See all the
cases:
Successes (9)
9/7/1933 - DJI rallied back
to its highs
and
then fell through 65dma, from 105 to 85.
VI =-44
9/16/1936 - DJI rallied
from 166 to 183
in November - despite a VI = -62
9/1/1942 -
DJI rallied
from 106.3 to120 at end of year - VI
= +1
9/1/1954 - DJI rallied
from 338.1 to 407 at end of year -
VI =-275
9/26/1980 - DJI rallied
from 940.1 to 970 a week later - VI
=-1
9/1/1995 - DJI rallied
from 4647.54 to 5200 in December. -
VI =-6
9/1/1996 - DJI rallied
from 5648.39 to 6500 in December. -
VI =-8
9/24/1997 - DJI rallied
from 7906.71 to 8200 in two weeks. -
VI =-1 It then fell
to 7200 in October
9/25/2003 -
DJI rallied
from 9343.96 to 9750 in three weeks. - VI =-29
Failures (16)
9/20/1938 - DJI fell from 138.4
(VI=-124) to 130 a week later where a better buy occurred.
9/24/1941 - DJI fell from 127.5
(VI=-4) to 107 in December. Pearl Harbor.
9/2/1947 -
DJI fell from 179.8 (VI=-65) to 175 a week
later . In October it turned up.
9/2/1952 -
DJI fell from 276.4(VI=-55) to 264 seven
weeks later.
9/27/1955 -
DJI fell from 465.9(VI=-220) to 440 two weeks
later.
9/4/1956 -
DJI fell from 507.7 (VI=-326) to 470 four
weeks later.
9/4/1959 - DJI fell from 652.1
(VI=-387) to 617 three weeks later.
9/18/1961 - DJI fell from 711.2
(VI=-440) to 693 one week later.
9/22/1971 - DJI
fell from 893.55 (VI=-1)
to 800 in late November.
9/12/1972 - DJI
fell from 946.04 (VI=-2)
to 922 six weeks later.
9/3/1985 - DJI
fell from 1329.15 (VI=-6)
to 1300 two weeks later and
then rallied strongly.
9/23/1991 - DJI
fell from 3010.51 (VI=-12)
to 2850 in December.
9/9/1992 - DJI
fell from 3589.48 (VI=-2)
to 3530 in two weeks and
then rallied strongly.
9/15/2000 -
DJI fell from 10927.06 (VI=-48) to
10000 in October.
9/25/2013 - DJI
fell from 12273.26 (VI=-36)
to 14800 in two weeks.
9/25/2014 - DJI fell from 16945.8
(VI=-122) to 15900 in six weeks.
Null
9/12/2016 -
DJI went sidewise for two months. (VI=-43)
PEERLESS DJI, Signals, Indicators Daily DJI Split Volume 10-DayUp/Down Vol
Hourly DJIA A/D Line for All Stocks
DJIA S&P OEX NYSE NASDAQ COMPQX with CP
DIA SPY QQQ MDY IWM-TNA
Short Term Interest Rates DJI-Utilities DJI-Transp
Nifty-30 Index
CrudeOil FAS GLD BBH IBB JETS JNUG KOL NUGT OIH OIL
RSX RETL SDS SLV SOXL TECL TMF TNA
UGA
(gasoline) XIV YINN
Commodities: JJC, NIB, CORN, WEAT UUP
(Dollar)
To STOCKS' CHARTS
AAPL ADBE ALXN AMAT AMGN AMZN BA BABA BIDU CAT FB GOOG GS
HD IBM JPM M (Macy's) MASI MSFT NVDA QCOM TSLA TXN
ANDV, CMG (Chipotle), LRCX, SWKS, TOWN
Others REN, CVE and SWN (very low AI/200 stocks)
9/8/2017
Bullish MINCPs Bearish
MINCPs
          RANKING OF KEY DIRECTORIES BASED PCT.OF STOCKS ABOVE 65-DMA
               9/8/17
Bullish = 29
Bearish = 18
---------------------------------------------------------------------------------------
Directory     Current       day-1         day-2         day-3         day-4         day-5
----------------------------------------------------------------------------------------
BONDFUND       .866          .901          .866          .848          .848          .875
UTILITY        .866          .866          .844          .844          .844          .8
ETFS           .863          .863          .818          .757          .909          .878
GOLD           .83           .905          .849          .849          .83           .867
BIGMIL         .8            .8            .8            .8            .8            1
SOLAR          .684          .789          .736          .684          .842          .736
CHINA          .682          .682          .65           .666          .714          .65
INDMATER       .673          .673          .663          .632          .663          .632
N=8
---------------------------------------------------------------------------------------------
GAMING         .666          .7            .633          .733          .733          .7
HACKERS        .666          .666          .555          .555          .611          .555
HOMEBLDG       .666          .611          .611          .555          .5            .555
COMODITY       .661          .69           .69           .69           .69           .69
INDEXES        .64           .626          .649          .602          .644          .649
NIFTY          .633          .666          .7            .733          .766          .8
AUTO           .625          .6            .525          .55           .65           .475
BIOTECH        .618          .59           .57           .586          .574          .582
BEVERAGE       .6            .65           .7            .65           .75           .65
GREEN          .58           .58           .516          .483          .58           .58
SOFTWARE       .562          .578          .5            .484          .546          .515
MORNSTAR       .55           .558          .563          .516          .626          .571
INFRA          .545          .545          .545          .545          .545          .545
NASD-100       .539          .561          .55           .528          .584          .584
REIT           .538          .538          .544          .492          .575          .523
DOWJONES       .533          .6            .633          .6            .666          .633
MILITARY       .533          .555          .555          .577          .555          .577
SEMI           .517          .551          .543          .525          .62           .586
SP500          .512          .512          .522          .497          .549          .516
SP-100         .51           .572          .593          .541          .562          .531
ELECTRON       .505          .546          .52           .52           .597          .541
N=21
---------------------------------------------------------------------------------------------
EDU            .5            .625          .5            .5            .5            .5
TRANSP         .5            .5            .45           .4            .45           .45
RUS-1000       .497          .495          .501          .494          .545          .518
DJI-13         .461          .461          .461          .461          .461          .461
CHEM           .458          .402          .402          .43           .486          .458
OILGAS         .398          .424          .405          .367          .373          .348
RETAIL         .396          .431          .431          .396          .379          .344
FOOD           .357          .357          .357          .428          .214          .285
N=9
---------------------------------------------------------------------------------------------
JETS           .333          .222          .111          .111          .111          .111
PIPELINE       .333          .333          .222          .222          .222          .222
COMPUTER       .32           .44           .44           .4            .52           .48
INSURANC       .285          .142          .228          .2            .4            .457
FINANCE        .271          .26           .304          .326          .478          .434
COAL           .222          .222          .222          .222          .222          .222
HOSPITAL       .142          .142          .142          .285          .285          .142
REGBANKS       .055          .027          .055          .055          .333          .277
BIGBANKS       0             0             .142          .142          .714          .428
N=18
--------------------------------------------------------------------------------------------------------------
9/7/2017 The Peerless S9-V
stands as a warning now. The DJI looks particularly
vulnerable if it finally breaks its 65-dma which is 133 points below today's
close.
I noted a few nights ago how rapidly our IP21 (current Accumulation Index)
deteriorated in 1940 just before the start of WWII in Western Europe and in
early 1962 before the Cuban crisis.
SPY is also only +1.87 above its key 65-dma. Not for nothing have I
suggested buying SDS, the inverse
of
SPY. See all the Buy B7s on the SPY
chart. These show heavy
professional
buying. The rising Tiger Day Traders' Tool
is also predicting a
breakout above
the 65-dma.
Today, the Big Bank stocks completed new head/shoulders patterns after
showing
heavy red Distribution on the right shoulder. This internal weakness
adds to the
likelihood of a decline this month and into the climactic month of October.
See GS, JPM, BAC and FAS.
Some pundits claim that the Bank de-regulation will go now no further
because of
Wells Fargo's opening of thousands of accounts without customers' knowledge
or
approval. Politics being what is, the Big Banks look pretty safe to
me. I think the
bigger problem for bank stocks lies in the falling Dollar. It fell to
new lows today.
A weak Dollar hurts Wall Street's ability to keep hot international funds in
US securities and bonds. Eventually, the FED may be moved to defend
the Dollar
by raising rates.
This will hurt the market.
The second danger that looms large is the awful destruction that may soon
happen
if Florida is hit directly this weekend by monster hurricane Irma.
$200 billion in
damages is not outside the realm of nightmarish possibilities.
Insurance companies,
businesses and individuals will all have to sell a lot of stock to rebuild.
It may even
be that some insurance companies will become insolvent. That will be
very unsettling
for Wall Street. With the market in an 8 1/2 year-old bull market, it
may not take much
to bring about a panic if low-lying Florida takes a direct hit from Irma.
Tech stocks, particularly biotechs, have seemingly paid no attention to the
DJI's
growing weakness. I would suggest that
Biotechs are getting an inflow
of aggressive
funds because the other outlets for speculation on the long side are
dwindling. In
any case, in 2000 and 2008, biotechs topped out after the DJI did. But
it did not
prevent their ultimately selling off in synch with a bigger decline.
Looking at Biotech IBB in August 2008, one would have
had no reason to think a Crash was just ahead.
9/6/2017 Charts
PEERLESS DJI, Signals, Indicators Daily DJI Split Volume 10-DayUp/Down Vol
Hourly DJIA A/D Line for All Stocks
DJIA S&P OEX NYSE NASDAQ COMPQX with CP
DIA SPY QQQ MDY IWM-TNA
Short Term Interest Rates DJI-Utilities DJI-Transp
Nifty-30 Index
CrudeOil FAS GLD BBH IBB JETS JNUG KOL NUGT OIH OIL
RSX RETL SDS SLV SOXL TECL TMF TNA
UGA
(gasoline) XIV YINN
Commodities: JJC, NIB, CORN, WEAT UUP
(Dollar)
To STOCKS' CHARTS
AAPL ADBE ALXN AMAT AMGN AMZN BA BABA BIDU CAT FB GOOG GS
HD IBM JPM M (Macy's) MASI MSFT NVDA QCOM TSLA TXN
ANDV, CMG (Chipotle), LRCX, SWKS, TOWN
Others REN, CVE and SWN (very low AI/200 stocks)
9/7/2017
Bullish MINCPs Bearish
MINCPs
 RANKING OF KEY DIRECTORIES BASED PCT.OF STOCKS ABOVE 65-DMA
               9/7/17
Bullish = 30
Bearish = 15
---------------------------------------------------------------------------------------
Directory     Current       day-1         day-2         day-3         day-4         day-5
----------------------------------------------------------------------------------------
BONDFUND       .901          .866          .848          .848          .875          .883
GOLD           .886          .849          .867          .849          .849          .773
UTILITY        .866          .844          .844          .844          .8            .822
ETFS           .863          .818          .757          .909          .878          .863
BIGMIL         .8            .8            .8            .8            1             1
SOLAR          .789          .736          .684          .842          .736          .736
GAMING         .7            .633          .733          .733          .666          .6
COMODITY       .69           .69           .69           .69           .69           .577
CHINA          .682          .65           .666          .714          .65           .619
INDMATER       .673          .663          .632          .663          .632          .622
N=10
--------------------------------------------------------------------------------------------
HACKERS        .666          .555          .555          .611          .555          .444
NIFTY          .666          .7            .733          .766          .8            .7
BEVERAGE       .65           .7            .65           .75           .65           .7
INDEXES        .626          .649          .602          .644          .654          .537
EDU            .625          .5            .5            .5            .5            .5
HOMEBLDG       .611          .611          .555          .5            .555          .5
AUTO           .6            .525          .55           .65           .475          .375
BIOTECH        .594          .57           .578          .582          .574          .515
DOWJONES       .586          .62           .586          .655          .62           .551
GREEN          .58           .516          .483          .58           .58           .516
SOFTWARE       .578          .5            .484          .546          .515          .453
SP-100         .572          .593          .531          .562          .531          .489
NASD-100       .561          .55           .528          .584          .584          .561
MORNSTAR       .558          .563          .516          .626          .571          .5
MILITARY       .555          .555          .577          .555          .577          .6
SEMI           .551          .543          .525          .62           .594          .568
ELECTRON       .546          .52           .525          .597          .541          .525
INFRA          .545          .545          .545          .545          .545          .545
REIT           .538          .544          .492          .575          .538          .466
SP500          .519          .525          .498          .551          .519          .488
N=  20
-------------------------------------------------------------------------------------------
TRANSP         .5            .45           .4            .45           .45           .4
-------------------------------------------------------------------------------------------
RUS-1000       .496          .502          .493          .545          .513          .462
DJI-13         .461          .461          .461          .461          .461          .384
COMPUTER       .44           .44           .4            .52           .48           .44
RETAIL         .431          .431          .396          .379          .344          .327
OILGAS         .43           .411          .367          .373          .335          .265
CHEM           .402          .416          .416          .486          .458          .43
FOOD           .357          .357          .428          .214          .285          .142
PIPELINE       .333          .333          .222          .222          .222          .222
FINANCE        .252          .296          .318          .472          .428          .384
COAL           .222          .222          .222          .222          .222          .222
JETS           .222          .111          .111          .111          .111          .111
HOSPITAL       .142          .142          .285          .285          .142          .142
INSURANC       .142          .228          .2            .4            .457          .4
REGBANKS       .027          .055          .055          .333          .305          .138
BIGBANKS       0             .142          .142          .714          .428          .428
N=15
==================================================================================
9/6/2017
The Peerless S9-V still operates. The markets remain locked in their
trading ranges.
Given the growing crisis with North Korea and the
threat
posed by another monster hurricane, it is amazing that there is not more
hasty profit-taking in the over-extended DJI and SP-500. True there is
mounting red Distribution, but the DJI does not want to break down
below its 50-day ma and the SP-500 is still sitting atop its 65-dma.
QQQ's upward momentum is waning. See how its 65-dma is flattening.
Professionals have been net sellers for some time, hence the purple S7s.
But every dip back to the 65-dma has found support. The high level of
the Accum. Index has shown this. But now our Accum. Index is
weakening.
It's not clear that another swift decline down to 141 would find sufficient
support
to hold it up there.
It is important now that the most important ETFs not fall below their key
supports.
DIA's negative and falling IP21 and Closing Power warn that it may lead the
market down just as it has often led it up. That so many big banks show
bearish
head/shoulders patterns cannot be ignored. The greater relative
strength in
the biggest tech stocks and the NASDAQ is noted but we have seen this year
how
quickly they fall back to their support-levels when the DJI and SPY fall
back.
If the SPY were to turn down sharply now, chartists would see
a bearish head/shoulders pattern there. Going into the spooky month
of October, this would be bad news for the bulls.
I fear the DJI and SP-500 will soon give way to all
the pressures on it.
I have suggested buying SDS, the ETF
that is a short on the SP-500. It is the
good breadth and the rising NYSE A/D Line, born of very low interest rates,
which has been the bedrock of this bull market. The Fed has not wanted
to run
the risk of a stock market sell-off, fearing that that the stock market's
strength is
more than anything else the main fuel for the general economy. But now
the FED's
second-in-command, Stanley Fischer, has said he will resign next month.
This will leave
only 3 members on the all-important Fed's Open Market Committee, the group
that determines the Fed's monetary policy. This means that President
Trump is now in a
position to appoint a majority of the FOMC. Trump said in the
Presidential
Campaign that he thought interest rates should go up faster. This could be
bearish for the market, assuming he appoints more conservative-minded hawks.
That remains to be seen, of course. But one clue here might be gleaned
from
the way short-term interest rates turned up after Fisher's announcement
yesterday.
(
https://www.nytimes.com/2017/09/06/business/economy/fed-stanley-fischer.html
)
9/6/2017 Charts
PEERLESS DJI, Signals, Indicators Daily DJI Split Volume 10-DayUp/Down Vol
Hourly DJIA A/D Line for All Stocks
DJIA S&P OEX NYSE NASDAQ COMPQX with CP
DIA SPY QQQ MDY IWM-TNA
Short Term Interest Rates DJI-Utilities DJI-Transp
Nifty-30 Index
CrudeOil FAS GLD BBH IBB JETS JNUG KOL NUGT OIH OIL
RSX RETL SDS SLV SOXL TECL TMF TNA
UGA
(gasoline) XIV YINN
Commodities: JJC, NIB, CORN, WEAT UUP
(Dollar)
To STOCKS' CHARTS
AAPL ADBE ALXN AMAT AMGN AMZN BA BABA BIDU CAT FB GOOG GS
HD IBM JPM M (Macy's) MASI MSFT NVDA QCOM TSLA TXN
ANDV, CMG (Chipotle), LRCX, SWKS, TOWN
Others REN, CVE and SWN (very low AI/200 stocks)
9/6/2017
Bullish MINCPs Bearish
MINCPs
RANKING OF KEY DIRECTORIES BASED
PCT.OF STOCKS ABOVE 65-DMA
9/6/17
 Bullish = 30
 Bearish = 15
---------------------------------------------------------------------------------------
Directory     Current       day-1         day-2         day-3         day-4         day-5
----------------------------------------------------------------------------------------
BONDFUND       .866          .848          .848          .875          .883          .883
UTILITY        .844          .844          .844          .8            .822          .822
GOLD           .83           .867          .867          .867          .754          .83
ETFS           .818          .757          .909          .878          .863          .863
BIGMIL         .8            .8            .8            1             1             1
SOLAR          .736          .684          .842          .736          .736          .631
BEVERAGE       .7            .65           .75           .65           .7            .75
COMODITY       .7            .7            .7            .7            .571          .628
NIFTY          .7            .733          .766          .8            .7            .633
N=9
----------------------------------------------------------------------------------------------
INDMATER       .663          .632          .663          .632          .622          .591
CHINA          .65           .666          .714          .65           .619          .619
INDEXES        .649          .602          .644          .654          .542          .476
DOWJONES       .633          .6            .666          .633          .566          .5
GAMING         .633          .733          .733          .666          .6            .533
HOMEBLDG       .611          .555          .5            .555          .5            .5
SP-100         .593          .541          .562          .531          .489          .458
BIOTECH        .574          .578          .574          .582          .507          .5
MORNSTAR       .563          .516          .626          .571          .504          .432
HACKERS        .555          .555          .611          .555          .444          .388
MILITARY       .555          .577          .555          .577          .6            .555
NASD-100       .55           .528          .584          .584          .561          .449
INFRA          .545          .545          .545          .545          .545          .454
REIT           .544          .492          .575          .538          .466          .398
SEMI           .543          .525          .62           .594          .568          .456
SP500          .526          .5            .548          .518          .489          .465
AUTO           .525          .55           .65           .475          .425          .35
ELECTRON       .52           .525          .603          .541          .53           .443
GREEN          .516          .483          .58           .58           .516          .419
RUS-1000       .503          .494          .544          .513          .464          .439
N=21
--------------------------------------------------------------------------------------------
EDU            .5            .5            .5            .5            .5            .5
SOFTWARE       .5            .484          .546          .515          .453          .39
--------------------------------------------------------------------------------------------
DJI-13         .461          .461          .461          .461          .384          .384
TRANSP         .45           .4            .45           .45           .4            .45
COMPUTER       .44           .4            .52           .48           .44           .36
RETAIL         .431          .396          .379          .344          .31           .362
OILGAS         .417          .373          .373          .335          .265          .253
CHEM           .416          .43           .472          .458          .444          .416
FOOD           .357          .428          .214          .285          .071          .071
PIPELINE       .333          .333          .222          .222          .222          .222
FINANCE        .296          .318          .472          .428          .395          .351
COAL           .222          .222          .222          .222          .222          .222
INSURANC       .205          .176          .382          .441          .382          .382
BIGBANKS       .142          .142          .714          .428          .428          .285
HOSPITAL       .142          .285          .285          .142          .142          .285
JETS           .111          .111          .111          .111          .111          .111
REGBANKS       .055          .055          .333          .305          .166          .138
N=15
==================================================================================
9/5/2017
The Peerless S9-V has kept the markets locked in their trading ranges.
Any breakout run is expected to produce a new Peerless S9-v or S12.
Each decline by the DJI towards the 65-dma keeps finding support; the
belief among traders is apparently that Fed Chairwoman Yellen wants to
hold the stock market up until her term ends in January. Does she have
that capability? So far, she has. But Septembers often bring
market tops
and the hopes for a big tax cut are being dashed by war preparations
and the unexpected costs of this years' record hurricane season.
Look at all the CP Divergence B7s on SDS
I would suggest that the key chart to watch now is SDS. This is the
inverted
(short) ETF on SPY. Each rally in it for a long time has been turned
back
by its falling 65-dma. I don't think that can continue much longer.
See how
strong the Tiger Closing Power and Day Traders' Tools are.
I think we should
buy SDS in expectation that it will break out. Typically any stock or
ETF
showing a long string of Closing Power divergence Buy B7s is a reliable buy
when that stock closes above the 65-dma.
See some examples here.
(Commodity
traders should appreciate the first set of examples.)
How will there be any money left for a tax
cut?
I believe the biggest specific factor allowing the
market to rise since Trump was elected
has been the hope that wealthy individuals and corporations would have their
taxes significantly reduced. That may not happen. The stock
market will
not like this.
Preparing for a war with North Korea does not come
cheap! What's worse?
Fears about the escalating tensions with North Korea are not the only source
of
anxiety for the financial markets now. No one knows for sure how the
legislation to raise
the debt ceiling by the end of this month and then to lower business taxes
will play
out. On the one hand, conservative legislators want to contain
government spending,
but on the other hand, Texas and Florida will need massive federal aid.
The two
hurricanes, Harvey and Irma, could do a colossal $300+ billion in damage if
Florida is hit like Texas was. What's worse? The actual toll
could go still higher;
the hurricane season is just beginning. It is not over until November.
What's worse?
The warmer ocean temperature is apparently fueling more and bigger
hurricanes. All
the destruction this year has happened with ocean water temperatures rising
just a
single degree or two. What if water temperatures rise by 5 degrees
over the next
fifty to one hundred years? Nowhere is this shown more clearly
than in the falling
property insurance stocks.
The insurance stocks will surely have to sell a lot of stock to raise the
money they will
need to pay out claims this hurricane season.
Sharp Declines Today in Insurance Stocks
RNR -7.14% 376 employees
RE -6.92% 1121 employees
RLI - 4.38% 907 employees
TRV -3.73% 30,900 employees.
9/5/2017 Charts
PEERLESS DJI, Signals, Indicators Daily DJI Split Volume 10-DayUp/Down Vol
Hourly DJIA A/D Line for All Stocks
DJIA S&P OEX NYSE NASDAQ COMPQX with CP
DIA SPY QQQ MDY IWM-TNA
Short Term Interest Rates DJI-Utilities DJI-Transp
Nifty-30 Index
CrudeOil FAS GLD BBH IBB JETS JNUG KOL NUGT OIH OIL
RSX RETL SDS SLV SOXL TECL TMF TNA
UGA
(gasoline) XIV YINN
Commodities: JJC, NIB, CORN, WEAT UUP
(Dollar)
To STOCKS' CHARTS
AAPL ADBE ALXN AMAT AMGN AMZN BA BABA BIDU CAT FB GOOG GS
HD IBM JPM M (Macy's) MASI MSFT NVDA QCOM TSLA TXN
ANDV, CMG (Chipotle), LRCX, SWKS, TOWN
Others REN, CVE and SWN (very low AI/200 stocks)
9/5/2017
Bullish MINCPs Bearish
MINCPs
 RANKING OF KEY DIRECTORIES BASED PCT.OF STOCKS ABOVE 65-DMA
               9/5/17
Bullish = 24
Bearish = 21
---------------------------------------------------------------------------------------
Directory     Current       day-1         day-2         day-3         day-4         day-5
----------------------------------------------------------------------------------------
GOLD           .877          .877          .897          .795          .877          .877
BONDFUND       .848          .848          .875          .883          .883          .803
UTILITY        .844          .844          .8            .822          .822          .822
BIGMIL         .8            .8            1             1             1             .8
ETFS           .757          .909          .878          .863          .863          .893
GAMING         .733          .733          .666          .6            .533          .533
NIFTY          .733          .766          .8            .7            .633          .6
SOLAR          .733          .933          .8            .8            .666          .6
COMODITY       .69           .69           .69           .563          .605          .605
N=9
--------------------------------------------------------------------------------------------
CHINA          .666          .714          .65           .619          .619          .65
BEVERAGE       .65           .75           .65           .7            .75           .65
INDMATER       .632          .663          .632          .622          .591          .602
INDEXES        .602          .644          .654          .542          .481          .481
DOWJONES       .6            .666          .633          .566          .5            .5
MILITARY       .589          .564          .589          .615          .564          .512
BIOTECH        .582          .574          .574          .515          .5            .507
HACKERS        .555          .611          .555          .444          .388          .388
HOMEBLDG       .555          .5            .555          .5            .5            .5
AUTO           .55           .65           .475          .425          .35           .325
INFRA          .545          .545          .545          .545          .454          .454
SP-100         .541          .562          .531          .489          .458          .437
NASD-100       .528          .584          .584          .561          .449          .471
MORNSTAR       .516          .626          .571          .504          .453          .449
ELECTRON       .502          .584          .524          .513          .42           .415
N=15
--------------------------------------------------------------------------------------------
SEMI           .5            .6            .572          .545          .427          .418

SP500          .497          .549          .516          .487          .459          .452
RUS-1000       .485          .538          .505          .454          .427          .425
GREEN          .483          .58           .58           .516          .419          .419
REIT           .478          .565          .527          .451          .385          .429
SOFTWARE       .476          .539          .507          .444          .38           .396
DJI-13         .461          .461          .461          .384          .384          .384
CHEM           .43           .486          .444          .444          .416          .444
FOOD           .428          .214          .285          .071          0             .357
COMPUTER       .4            .52           .48           .44           .36           .36
TRANSP         .4            .45           .45           .4            .45           .35
RETAIL         .396          .379          .344          .31           .362          .344
OILGAS         .37           .377          .337          .264          .251          .231
N=12
----------------------------------------------------------------------------------------------
EDU            .333          .333          .333          .333          .333          .333
FINANCE        .318          .472          .428          .395          .362          .439
HOSPITAL       .285          .285          .142          .142          .285          .142
INSURANC       .205          .411          .47           .411          .411          .441
BIGBANKS       .142          .714          .428          .428          .285          .428
PIPELINE       .142          .142          .142          .142          .142          .142
COAL           .125          .125          .125          .125          .125          .125
JETS           .111          .111          .111          .111          .111          .111
REGBANKS       .057          .342          .314          .171          .142          .2
N=9
=================================================================================
September 1, 2017
The DJI's Negative
Accumulation Shows Big Money Is Getting Anxious
Tensions with North Korea are scaring overseas traders
more than in the US. So, we'll
see tomorrow if the Professionals here once more bid up prices after a weak
opening. The
Peerless system remains on a Sell S9-V and would likely give a new Sell if
the DJI rallies
to the 2.4% band. The tech leadership has been re-established.
But its sudden down-
drafts in the last six months may again be a problem. Meanwhile,
GLD and the
gasoline ETF,
UGA, are rising,
as was expected. They may be safer bets at this stage.
I think
we have to be quite concerned
that the DIA's IP21 (current AI) is so negative despite
the DJI's recent rally. It was in the rapid deterioration of the Tiger
Accumulation Index and its
cumulative variation, IPA, that a Tiger software user back in
May 1940 would have foreseen
the imminent start of World War II in Western Europe and then in
May 1962 the imminent start
of the Cuban Missile crisis. Let's us hope the current deep negativity
of the IP21 passes or presages
something else far less dire and catastrophic.
(One way out of the crisis
would be a military
coup in North Korea. Back in 1938, there were
German Generals who were
ready to
kill Hitler if Britain and France had said "NO" instead of "YES" to
the
annexation of the German Sudetenland of Czechoslovakia. The British Prime
Minister was informed of
this plot against Hitler, but chose what turned out to be the wrong path.
Appeasement of a ruthless, war-bent
dictator is highly risky. But then mere talking is not appeasement.
It is common sense.)
https://en.wikipedia.org/wiki/Oster_Conspiracy
ETFs and Their Current Internal Strength Readings
In the table below, the Pivot Point shows the point where a lower close Monday will turn
the
5-dma down. AROC is the annualized rate of change, in this case of the 5-dma.
Trading
with the
Closing
Power trends is generally advised, but pick the ETFs with the highest IP21s
(current Accum.Index) and Relative Strength versus the DJI for the last 50 trading days (ITRS).
9/1 Pivot
5-day ma Closing Power IP21
ITRS
Price
Point AROC
Trend
---------------------------------------------------------------------------
DIA 219.92 217.94
43%
Bearish
-.271
--
(bearish)
SPY 247.84 244.57
67% ?
-.090
-.008
QQQ 146.00 142.41
140%
Bullish
+.061 +.009
IWM 140.52 137.46
132% Bullish
+.081
-.025
MDY 316.8 311.46
83% Bullish
-.107
-.026 at
falling 65 dma resistance
TECL 87.8 83.69
284%
Bullish
+.107
+.111 NH
SOXL 101.36 91.84
541%
Bullish
+.131 -.049
IBB 335.84 316.89
387%
Bullish
+.154 +.02
Gasoline UGA 30.27
27.5
608%
Bullish
+.442 +.299
GLD 126.06 124.69
133%
Bullish
+.306
+.031
Copper JCC 35.65
35.38 109%
Bullish
+.007
+.181
YINN 29.76 29.8
3%
Bullish
+.083
+.324

======
September
often brings tops and October panics.
In the table
below, I show that there
were 24 September tops in the last 52 years. 16 of the 24 showed an
IP21 reading of under
+.05.
At -.05,
our IP21 now shows considerable risk just by itself. But mix in the
deeply
negative V-I level of -57 and I would judge it would be time to go short
DIA and SPY
if they can rally and close 2.4% over their 21-dma.
The DJI's historical data from 1965 to 2016 for the
year after a Presidential
Election shows the following DJI changes after September 3rd:
Avg Gain Pct.Advances
after 5-trading days +0.1%
42.9%
after 10-trading days +0.3%
50.0%
after 21-trading days +1.1%
57.1%
after 42-trading days -0.3%
57.1%
In re-doing these numbers, I have just added 1965, 2015 and 2016.
.
September Tops' Study
Since 1965, there have been ten (10) September peaks that were quickly
followed
by declines of 10% or more. Only four of these occurred after 1965.
These recent
cases are probably the ones we should look at now in order to see what are
the signs
of a top that we should be looking for. Peerless
signals occurred at each case. The
DJI closed, at least 1.7% over the 21-dma. And the IP21 (current AI)
was not more
than +.06 as any of these tops were made.
No bell is sounded, of course, when a top is made. So, looking at the
charts of these
tops as of the day that top was made should serve to make us appreciate how
important
it is to look at our Peerless charts daily since we are entering the
frequently bearish month
of September and since we have not had an economic downturn or bear market
for 7 1/2
years.
DJI
la/ma P-I IP21
V-I Peerless Signals Subsequent Action
----------------------------------------------------------------------------
9/25/1967 1.03 +78
+.06 8 S2/S7 10% decline to
11/8/1967
(Peerless chart as of 9/25/1967)
DJI
la/ma P-I IP21
V-I Peerless Signals Subsequent Action
----------------------------------------------------------------------------
9/7/1971 1.034 +209 .00
1
S9/S12 13.5% decline to
11/23/1971 Peerless Chart
(Peerless chart as
of 9/7/1971)
DJI
la/ma P-I IP21
V-I Peerless Signals Subsequent Action
----------------------------------------------------------------------------
9/21/1979 1.017 -69 +.049
-1 S9
11.0% decline to 11/7/1979
(Peerless chart as of 9/21/1979)
DJI
la/ma P-I IP21
V-I Peerless Signals Subsequent Action
----------------------------------------------------------------------------
9/6/2000 1.017 +103 +.013
-6 S2/S4 12% decline
to 10/18/2000
(
Peerless Chart as of 9/6/2000)
---------------------------------------------------------------------------------------------------------------
9/1/2017 Charts
PEERLESS DJI, Signals, Indicators Daily DJI Split Volume 10-DayUp/Down Vol
Hourly DJIA A/D Line for All Stocks
DJIA S&P OEX NYSE NASDAQ COMPQX with CP
DIA SPY QQQ MDY IWM-TNA
Short Term Interest Rates DJI-Utilities DJI-Transp
Nifty-30 Index
CrudeOil FAS GLD BBH IBB JETS JNUG KOL NUGT OIH OIL
RSX RETL SDS SLV SOXL TECL TMF TNA XIV YINN
Commodities: JJC, NIB, CORN, WEAT UUP (Dollar)
To STOCKS' CHARTS
AAPL ADBE ALXN AMAT AMGN AMZN BA BABA BIDU CAT FB GOOG GS
HD IBM JPM M (Macy's) MASI MSFT NVDA QCOM TSLA TXN
CMG (Chipotle), LRCX, SWKS, TOWN
Others REN, CVE and SWN (very low AI/200 stocks)
9/1/2017 Bullish MINCPs Bearish MINCPs
RANKING OF KEY DIRECTORIES BASED PCT.OF STOCKS ABOVE 65-DMA
9/1/17
Bullish = 32
Bearish = 13
---------------------------------------------------------------------------------------
Directory Current day-1 day-2 day-3 day-4 day-5
----------------------------------------------------------------------------------------
ETFS .909 .878 .863 .863 .893 .878
GOLD .849 .886 .792 .849 .83 .716
BONDFUND .848 .875 .883 .883 .812 .723
UTILITY .844 .8 .822 .822 .844 .866
SOLAR .842 .736 .736 .631 .631 .631
BIGMIL .8 1 1 1 .8 .8
NIFTY .766 .8 .7 .633 .6 .566
BEVERAGE .75 .65 .7 .75 .65 .75
GAMING .733 .666 .6 .533 .533 .566
BIGBANKS .714 .428 .428 .285 .428 .571
CHINA .714 .65 .619 .619 .65 .666
COMODITY .69 .69 .563 .605 .591 .605
N= 13
--------------------------------------------------------------------------------------------
INDMATER .663 .632 .622 .591 .602 .581
DOWJONES .655 .62 .551 .517 .482 .517
AUTO .65 .475 .425 .35 .35 .35
INDEXES .644 .654 .542 .481 .5 .485
MORNSTAR .626 .571 .504 .453 .453 .432
HACKERS .611 .555 .444 .388 .388 .388
ELECTRON .603 .546 .536 .443 .443 .412
SEMI .6 .572 .545 .427 .427 .372
GREEN .58 .58 .516 .419 .451 .451
NASD-100 .579 .579 .556 .443 .465 .409
BIOTECH .578 .574 .507 .507 .5 .425
REIT .575 .538 .466 .404 .45 .512
SP-100 .562 .531 .489 .458 .437 .468
MILITARY .555 .577 .6 .555 .511 .511
SP500 .548 .515 .486 .457 .451 .472
RUS-1000 .546 .513 .463 .438 .437 .455
INFRA .545 .545 .545 .454 .454 .454
SOFTWARE .539 .507 .444 .38 .396 .365
COMPUTER .52 .48 .44 .36 .36 .32
N= 19
--------------------------------------------------------------------------------------------
EDU .5 .5 .5 .5 .5 .5
HOMEBLDG .5 .555 .5 .5 .5 .555
--------------------------------------------------------------------------------------------
CHEM           .486          .458          .43           .416          .444          .43
FINANCE        .472          .428          .395          .362          .45           .483
DJI-13         .461          .461          .384          .384          .384          .384
TRANSP         .45           .45           .4            .45           .35           .3
INSURANC       .411          .47           .411          .411          .47           .529
OILGAS         .386          .341          .265          .253          .234          .246
RETAIL         .379          .344          .31           .362          .344          .379
REGBANKS       .333          .305          .166          .138          .194          .277
HOSPITAL       .285          .142          .142          .285          .142          .142
COAL           .222          .222          .222          .222          .222          .222
FOOD           .214          .285          .071          0             .357          .214
PIPELINE       .142          .142          .142          .142          .142          .142
JETS           .111          .111          .111          .111          .111          .111
N= 13
---------------------------------------------------------------------------------------------------------------
September Tops
Top
la/ma P-I
IP21 V-I Peerless Signals
Subsequent Action
------------------------------------------------------------------
9/3/1929 1.052 -14
-.126 -351 S9 S12 1929 Crash! 47% decline to 11/13
9/10/1930 1.073
44 .124 26 S9 1930
Bear Mkt 35% decline to 12/16
1931 peak was on 8/14 - S9 - 40% decline followed to 10/5
9/7/1932 1.118 +129 +.056 +464 S12
27% decline to 10/10/1932
9/19/1933 1.03 -20 +.154
-180 S9/S17 20% decline to 10/20/1933
1934 peak was on 8/24 - S9/S12 - 9% decline followed to
9/14
9/18/1935 1.031 +47 +.085
-6 S2
5% decline to LB on 10/3/1935
9/8/1936 1.021 +11
-.126 -51 no signal only a quick decline to
21-dma
1937 peak was on 8/13 - S9/S8 - Bear market followed.
9/7/1938
1.019 -39 +.079 -102 S12 9% decline to LB on 9/26/1938
9/12/1939 1.113 -30 +.206
+77 S9 7%
decline to 11/30/1932
9/5/1940 1.065 +83 +.224
+66 no signal only a quick decline to
21-dma
9/17/1941 1.017 +67 +.051
+25 S17 18% decline
to 12/23/1941
1942 No Sept peak.
9/20/1943 1.033 +70 +.100 +39
S2 8% decline to
11/30/1943
1944,
1945 No Sept peak.
1946 bear market
1947,
1948 No Sept peak.
9/13/1949 1.019 +76 +.122
+67 no signal only a quick 3% decline and renewed rally.
1950 No Sept peak.
9/7/1951 1.027 +134 +.184 +134 S4
7% decline on 11/7/1951
1952 peak was on 8/11 -no
Sell - 7% decline followed to 10/22/1952.
1953 peak was on 8/13 -no Sell - 7% decline followed to 9/14/1952.
1954 No Sept peak.
9/23/1955 1.024 84 +.094 +14
S8 10% decline to
10/11/1955
1956 peak was on 8/1 - S2 -
10% correction followed.
1957 peak was on
7/12 - S4/S7 - bear market followed.
1958 No Sept peak.
1959
peak was on 8/3 - S9 - 9% correction followed.
1960
peak was on 8/23 - S1 - 12% correction followed.
1961 No Sept peak.
1962 peak was on 8/23 -no Sell - 9% decline followed to 10/23/1962.
1963 No Sept peak.
1964 No Sept peak.
----------------------------------------------------------------------------------------------------------------
Top
la/ma P-I
IP21 V-I Peerless Signals
Subsequent Action
------------------------------------------------------------------
1965 No Sept peak.
9/15/1966 1.029 -174 -.078
-13
S9 8% decline to
10/7/1966
------
9/25/1967 1.03 +78 +.06 8
S2/S7 10% decline to
11/8/1967
1968 No Sept peak.
1969 No Sept peak.
1970 No Sept peak.
9/7/1971 1.034 +209 .00 1
S9/S12 13.5% decline to
11/23/1971
-------
1972 peak was on 8/14 S9/S12 - 9% decline followed to 10/16/1972.
1973 peak was on 7/27 S9 - 9% decline followed to 10/16/1973.
1974 peak was on 8/27 S9 - 27% decline followed to 8/7/1974.
9/4/1975 1.026 -61 -.023 -2
S9/S12 7.0% decline to
10/1/1975
------
9/21/1976
1.033 178 .181 2 S1 9.0% decline to
11/10/1976
(high)
1977 steady bear market decline.
9/8/1978 1.019 +109 -.062
3 S12 6.0% decline to 9/20/1978
-------
9/21/1979 1.017 -69 +.049 -1 S9 11.0%
decline to 11/7/1979
--------
9/22/1980 1.03 +98 +.026
3 no signal 5.0% decline to 9/29/1980
------
1981 steady bear market decline.
9/21/1982 1.029 +261 +.063
11 S17 4.0% decline to 9/30/1982
1983 No Sept peak.
9/14/1984 1.014 +127 +.031 8 none 5.0%
decline to 12/7/1984
------
9/9/1985 1.012 -22 +.038 -4 S12 3.0%
decline to 9/17/1985
-----
9/4/1986 1.032 214 +.260 20
S9 9.0% decline to 9/29/1986
(10/1/1987) 1.026 -98 -.009
-12 S9/S12 34% decline to 10/19/1987
(10/21/1988) 1.027 59 .253 13 S1
6.3% decline to 11/16/1988
(10/9/1989)
1.032 -13 -.049 4 S9 8% decline to
10/13/1988
9/12/1990 1.002 -156 -.05
-28 S9 9% decline to 10/11/1990
-----
1991 peak was on 8/28 S1 - 6% decline followed to 12/10/1991.
9/14/1992 1.028 46 .028 0 S2 7% decline to 10/9/1992
-----
1993 peak was on 8/26 no signal - 3% decline followed to 9/21/1993.
9/15/1994 1.024 79
.084 9 S1 7% decline to 11/23/1994
1995 No Sept peak.
1996 No Sept peak.
(10/7/1997) 1.033 349
.017 25 S12 12% decline to 10/27/1997
9/23/1998 1.026 -201
.018 -90 S9 6% decline to 10/1/1998
------
(8/25/1999) 1.039 -265 .085 -74
S9/S12 12% decline to 10/15/1999
9/6/2000 1.017 103
.013 -6 S2/S4 12% decline to 10/18/2000
------
2001 No Sept peak.
2002 peak was on 8/22 S9 - 20% decline followed to 10/9/2002.
9/19/2003 1.018 405
.079 no signal 4% decline to 9/30/2003
9/7/2004
1.027 550 .17 107 S2 6%
decline to 10/18/2000
9/12/2005 1.014 90 .044 -86 no signal 4.5% decline to 10/12/2005
-----
2006 No Sept peak. Rising market
(10/9/1997) 1.027 408
.119 140 ES4 10% decline to 11/26/1997
2007 peak was on 7/17 S9/S12 - 19% decline followed to 10/1/2007.
2008 peak was on 8/11 S9 - 36% decline followed to 10/1/2007.
2009 No Sept peak... DJI rallied.
2010 peak was on 8/9 S9 - 7% decline followed to 8/30/2010.
(8/31/2011) 1.031 194
.015 -151 S12 8% decline to 10/3/2011
9/20/2012 1.024 276 .08 29 S4/S8
7.5% decline to 11/15/2012
9/18/2013 1.04 479 .046 62
ES12/S17 5.5% decline to 10/8/2013
-----
9/19/2014 1.011 -69 .014 -54 S17
6.7% decline to 10/16/2014
----
9/16/2015 1.016 -194 .024 -167 no
signal 4% decline to 9/28/2015
----
2016 peak was on 8/15 no sell - 4% decline followed to 11/3/20016.
==================================================================================
Aug 31, 2017 #1 Happy
Labor Day. Give some thought to all those who built the
America we often take for granted. Labor's real story is largely untold.
https://www.goodreads.com/book/show/187725.Labor_s_Untold_Story

The
Jobs report
for August was down from year ago. This makes it
more
unlikely the Feds will raise interest rates unless the CPI numbers jump up
hugely
because of Hurricane Harvey and the higher gasoline prices. Some Fed Governors
like Volcker and Greenspan would used a jump in higher oil prices which drove up
the CPI numbers to move up or keep high interest rates, especially if the Dollar
was
weak. So, we have to keep watching the Dollar now.
Below I have highlighted in red those months where the Jobs number was down from
a year ago. A long series of Red numbers warns of an impending or on-going
recession.
In 2007, 10 of the 12 numbers were red and all 12 Jobs' numbers were red in
2008.
Seven straight red months of Jobs' numbers last occurred
in May 2008; this was a very
good time to sell. We have seen only 3 straight red
numbers here.
Monthly Jobs' Numbers (Labor Dept.)
(
http://data.bls.gov/timeseries/CES0000000001?output_view=net_1mth )
| |
| Year |
Jan |
Feb |
Mar |
Apr |
May |
Jun |
Jul |
Aug |
Sep |
Oct |
Nov |
Dec |
| 2007 |
240 |
89 |
190 |
80 |
143 |
75 |
-34 |
-20 |
88 |
84 |
114 |
98 |
| 2008 |
17 |
-84 |
-78 |
-210 |
-186 |
-162 |
-213 |
-267 |
-450 |
-474 |
-766 |
-694 |
| 2009 |
-793 |
-702 |
-823 |
-687 |
-349 |
-471 |
-329 |
-213 |
-220 |
-204 |
-2 |
-275 |
| 2010 |
23 |
-68 |
164 |
243 |
524 |
-137 |
-68 |
-36 |
-52 |
262 |
119 |
87 |
| 2011 |
43 |
189 |
225 |
346 |
77 |
225 |
69 |
110 |
248 |
209 |
141 |
209 |
| 2012 |
358 |
237 |
233 |
78 |
115 |
76 |
143 |
177 |
203 |
146 |
132 |
244 |
| 2013 |
211 |
286 |
130 |
197 |
226 |
162 |
122 |
261 |
190 |
212 |
258 |
47 |
| 2014 |
190 |
151 |
272 |
329 |
246 |
304 |
202 |
230 |
280 |
227 |
312 |
255 |
| 2015 |
234 |
238 |
86 |
262 |
344 |
206 |
254 |
157 |
100 |
321 |
272 |
239 |
| 2016 |
126 |
237 |
225 |
153 |
43 |
297 |
291 |
176 |
249 |
124 |
164 |
155 |
| 2017 |
216 |
232 |
50 |
207 |
145 |
210 |
189(P) |
156(P) |
|
|
|
|
| P : preliminary |
|
|
#2 The rally back to
the recent highs continued today. It will probably
advance some more on Friday. September, however, is a month to
look for signs of another top.
September
Tops: As we begin the sometimes dangerous month of September,
further below, look at the past September tops to see how often they were made,
how we would recognized them in the past, what damage they did to stock prices
and how
long the subsequent decline lasted. First, I want to set out the history
of
September declines. This is shown below. It will be completed in the next
day
or two.
#3 New Peerless chart explained. I have almost
finished a Peerless update
which will let you use TC-2000's historical data base. It goes back to
before
1990 for many stocks now trading with same symbol. You can subscribe
to TC-2000 for $30/month and use it for current data, but of course it will not
have the Peerless DJI Index data we need and it will not have the specialized
downloads that TigerSoft's web-page offer for just $200/12 months, about
$17/month. You can get the historical data on a CD from us as well as the
Peerless update for $110. ESP subscribers can download the new Peerless
program early next week, but you will need the historical data from us for $30
or get a subscription to TC-2000. Instructions for using TC-2000 will be
posted
here next week.
Sample Current Chart
Sample Historical Chart
------------------------------------------------------------------------------------------------------------------
8/31/2017 Charts
PEERLESS DJI, Signals, Indicators Daily DJI Split Volume 10-DayUp/Down Vol
Hourly DJIA A/D Line for All Stocks
DJIA S&P OEX NYSE NASDAQ COMPQX with CP
DIA SPY QQQ MDY IWM-TNA
Short Term Interest Rates DJI-Utilities DJI-Transp
Nifty-30 Index
CrudeOil FAS GLD BBH IBB JETS JNUG KOL NUGT OIH OIL
RSX RETL SDS SLV SOXL TECL TMF TNA XIV YINN
Commodities: JJC, NIB,
CORN, WEAT UUP (Dollar)
To STOCKS' CHARTS
AAPL ADBE ALXN AMAT AMGN AMZN BA BABA BIDU CAT FB GOOG GS
HD IBM JPM M (Macy's) MASI MSFT NVDA QCOM TSLA TXN
CMG (Chipotle), LRCX, SWKS, TOWN
Others REN, CVE and SWN (very low AI/200 stocks)
8/31/2017
Bullish MINCPs Bearish MINCPs
 RANKING OF KEY DIRECTORIES BASED PCT.OF STOCKS ABOVE 65-DMA
              8/31/17
Bullish= 29
Bearish= 17
---------------------------------------------------------------------------------------
Directory     Current       day-1         day-2         day-3         day-4         day-5
----------------------------------------------------------------------------------------
BIGMIL         1             1             1             .8            .8            .8
ETFS           .878          .863          .863          .893          .878          .848
BONDFUND       .875          .883          .883          .812          .75           .767
GOLD           .867          .792          .867          .849          .716          .735
NIFTY          .8            .7            .633          .6            .6            .6
UTILITY        .8            .822          .822          .844          .866          .866
SOLAR          .736          .736          .631          .631          .631          .631
COMODITY       .69           .563          .605          .591          .605          .619
N = 8
--------------------------------------------------------------------------------------------
GAMING         .666          .6            .533          .533          .566          .633
BEVERAGE       .65           .7            .75           .65           .75           .75
CHINA          .65           .619          .619          .65           .65           .666
INDEXES        .649          .542          .481          .5            .485          .448
DOWJONES       .633          .566          .5            .5            .533          .566
INDMATER       .632          .622          .591          .602          .581          .581
SEMI           .594          .568          .456          .456          .413          .396
NASD-100       .584          .561          .449          .471          .426          .415
GREEN          .58           .516          .419          .451          .451          .387
BIOTECH        .577          .506          .497          .497          .418          .447
MILITARY       .577          .6            .555          .511          .511          .511
MORNSTAR       .571          .504          .453          .453          .441          .407
HACKERS        .555          .444          .388          .388          .388          .333
HOMEBLDG       .555          .5            .5            .5            .555          .444
ELECTRON       .546          .536          .448          .443          .412          .371
INFRA          .545          .545          .454          .454          .454          .454
REIT           .538          .466          .404          .45           .512          .502
SP-100         .536          .494          .453          .443          .474          .453
SP500          .517          .488          .458          .453          .474          .439
SOFTWARE       .515          .453          .39           .406          .375          .343
RUS-1000       .514          .464          .437          .437          .455          .435
N = 21
=============================================================================================
EDU            .5            .5            .5            .5            .5            .5
COMPUTER       .48           .44           .36           .36           .32           .28
AUTO           .475          .425          .35           .35           .375          .325
INSURANC       .47           .411          .411          .47           .529          .529
DJI-13         .461          .384          .384          .384          .384          .461
CHEM           .458          .444          .402          .444          .43           .416
TRANSP         .45           .4            .45           .35           .3            .25
BIGBANKS       .428          .428          .285          .428          .571          .428
FINANCE        .428          .395          .362          .45           .483          .417
OILGAS         .348          .272          .253          .234          .24           .234
RETAIL         .344          .31           .362          .344          .379          .327
N=11
----------------------------------------------------------------------------------------------
PIPELINE       .333          .333          .222          .222          .222          .222
REGBANKS       .305          .166          .138          .194          .277          .222
FOOD           .285          .071          0             .357          .214          .142
COAL           .222          .222          .222          .222          .222          .222
HOSPITAL       .142          .142          .285          .142          .142          .142
JETS           .111          .111          .111          .111          .111          0
N=6
==================================================================================
==================================================================================
Aug 30, 2017 The markets are
advancing in hopes of Congress voting a big tax cut,
because of the seasonal bullishness just before labor day and because
the Sun finally came out in Houston! The announced 3% growth
helped the Dollar, but pushed up interest rates.
The Sell-S9-V needs another Peerless Sell to turn the
markets back down.
Most likely, the often bearish month of
September will probably produce one.
For now the Closing Powers have broken their downtrends and with the key
supports for DIA,
SPY, QQQ,
MDY and
IWM all holding, it looks like the DJI
will rally back to its old highs just above 21200. And led by high priced
AAPL, BA
and UNC, the DJI may zip up to the upper
2.4% band where we will probably get
another Sell S9v next month.
Expect the NASDAQ to be the strongest Index now. Its very high A/I/200
score
of 194 is associated with a further advance; so is the Closing Power downtrend
break and so is the well-controlled up-trending price channel. The very
high AI/200
score now is even higher than in Augusts in 1991,
1993, 1994,
1995 and 1999
These were the years showing the highest AI/200 scores in the past. Note
this
study was produced with the new Peerless historical data charts.
To produce old
charts like this, you will need a historical data CD from us ($25) and the new
Peerless,
which will posted soon on the Tiger ESP Page.
This is a story that will have legs.
Was 2013 Hurricane Sandy Relief Package 'Full of Pork'?
Texas lawmakers say they voted
against the 2013 aid bill because
it included spending unrelated to Sandy. There's a factual bone to pick
with this claim. (NY Times)
From tragedies like the one playing out in Houston may come greater
compassion
and a sense that we are all part of a larger community.
Perhaps, it will
help end the
political grid-lock in Washington.
8/31/2011
On Washington
Hurricane Harvey Shifts Political Winds in Washington
By CARL HULSE
The hurricane
has transformed the budget debate, turning Republican critics of federal
spending into proponents of billions of dollars of storm relief.
-------------------------------------------------------------------------------------------------------------------------------------------------------
A good gain is expected tomorrow. Assuming the DJI can surpass 21900,
the next target will then be its recent high just below 22200. Breadth was good.
There were 707 more up than down on the NYSE.
A hedging strategy is preferred because this remains a
very divided market.
There were 99 new lows today and the Bearish
MINCPs show little ability to
rally. For example, Corn, which was suggested
for shorting, declined more today.
Gasoline prices and California oil refiner ANDV rose again on very high volume.
.
Stocks To Buy
There are
number of interesting tech MAXCPs that
look quite bullish. Military
spending is rising. See
KEM,
VMW and
AVAV
have compelling stories.
My "Big Military" sector is the highest ranked sector based on the percentage
of stocks above their 65-dma.
A Breakout by TECL looks likely.
See how consistently positiveTECL's
AI/200 has been for the last year, how its
Closing Power downtrend has been broken and how in the past it has risen sharply
higher
after making breakouts above well-tested, flat-to-slightly-rising resistance.
 RANKING OF KEY DIRECTORIES BASED PCT.OF STOCKS ABOVE 65-DMA
               8/30/17
Bearish = 23
Bullish = 22
---------------------------------------------------------------------------------------
Directory     Current       day-1         day-2         day-3         day-4         day-5
----------------------------------------------------------------------------------------
BIGMIL         1             1             .8            .8            .8            .8
BONDFUND       .883          .883          .812          .75           .767          .821
ETFS           .863          .863          .893          .878          .848          .863
UTILITY        .822          .822          .844          .866          .866          .844
GOLD           .773          .867          .867          .735          .716          .698
SOLAR          .736          .631          .631          .631          .631          .526
BEVERAGE       .7            .75           .65           .75           .75           .8
NIFTY          .7            .633          .6            .6            .6            .633
INDMATER       .622          .591          .602          .581          .571          .561
CHINA          .619          .619          .65           .65           .666          .666
GAMING         .6            .533          .533          .566          .633          .566
MILITARY       .6            .555          .511          .511          .511          .466
COMODITY       .571          .614          .6            .614          .628          .628
SEMI           .568          .456          .456          .413          .405          .379
DOWJONES       .566          .5            .5            .533          .566          .6
NASD-100       .566          .455          .477          .433          .422          .411
INFRA          .545          .454          .454          .454          .454          .363
INDEXES        .542          .481          .5            .485          .476          .476
ELECTRON       .536          .448          .448          .412          .376          .376
GREEN          .516          .419          .451          .451          .387          .387
BIOTECH        .511          .5            .5            .433          .456          .417
MORNSTAR       .504          .453          .453          .441          .411          .42
N=22
==========================================================================================
HOMEBLDG       .5            .5            .5            .555          .444          .444
==========================================================================================
SP-100         .494          .453          .443          .474          .453          .474
SP500          .489          .459          .455          .475          .444          .459
REIT           .466          .404          .45           .512          .507          .512
RUS-1000       .465          .437          .437          .455          .438          .44
SOFTWARE       .453          .39           .406          .375          .343          .343
CHEM           .444          .402          .444          .43           .416          .43
HACKERS        .444          .388          .388          .388          .333          .333
COMPUTER       .44           .36           .36           .32           .28           .28
BIGBANKS       .428          .285          .428          .571          .428          .428
AUTO           .425          .35           .35           .375          .325          .35
INSURANC       .411          .411          .47           .529          .529          .588
TRANSP         .4            .45           .35           .3            .25           .25
FINANCE        .395          .362          .45           .483          .417          .439
DJI-13         .384          .384          .384          .384          .461          .538
EDU            .333          .333          .333          .333          .333          .166
PIPELINE       .333          .333          .222          .222          .222          .222
RETAIL         .31           .362          .344          .379          .327          .31
OILGAS         .278          .259          .234          .24           .221          .227
COAL           .222          .222          .222          .222          .111          .111
REGBANKS       .166          .138          .194          .277          .25           .222
HOSPITAL       .142          .285          .142          .142          .142          .142
JETS           .111          .111          .111          .111          0             0
FOOD           .071          0             .357          .214          .142          .071
N=23
==================================================================================
Aug 29, 2017
The DJI just will not sell off. In pre-market
trading today it was down
over 100, but then rose steadily all day long and closed up for the day.
This lifted the key ETFs' Closing Powers and now it looks like Professional
buying
may take over for the rest of the week. Of course, the Professional buying
could end sooner. But this is bullish action for the DJI short-term.
The NASDAQ's Closing Power downtrend has been bullishly broken.
If the DJI can rally to12400, we will almost certainly see a new Peerless Sell
which
will reinforce the current Peerless S9-V.
What might bring about the rally? The FED just does not want to risk a
decline.
And with that safety-net bolstering them and guaranteeing their long trades now,
traders can look forward to Congress passing legislation which will keep the
Government open for business next month. Congress also seems to moving
closer
to a tax cut for the the biggest holders of stocks. And of course, there is a
belief,
which is probably correct, that the Fed will not raise rates now because of the
need to rebuild after Hurricane Harvey.
But it remains unclear how much the broad market will be lifted since the
Closing Power
of each is below its falling 21-dma and the V-I for the DJI remains quite
negative. The latter fact shows that the buying is still limited mostly to
leading stocks.
Others are being steadily sold, presumably out of fear for the general market
in the face of the weak Fall seasonality. No big surprise here.
Peerless teaches that
it is quite common for the DJI to hold up longer than the A/D Line. In
fact, it is
this behavior that produced our Sell S9 signals at so many market tops.
If DIA can close above its 21-dma and flat resistance at
219-220,
it will likely sprint to a new high. A move much higher to the 2.4%
upper band of the DJI (22354 now) will bring a new sell S9-V/Sell S12.
Watch BA, AAPL and UNH
Boeing, the DJI-30's highest priced component, seems ready
to begin a new
surge. Others in that camp are high priced AAPL and UNH. Watch them
tomorrow. Big advances by them will inordinately make the DJI-30 rise.
But there there is a problem with their leadership now. While their
Closing
Powers show Professionals would be the main buyers, any move up may face
significant Big Money distribution, judging from the negative Accum. Index
readings for BA and UNH. See this in the 3 charts below.
SDS
Last night I suggested shorting and holding short
provided SDS (the ETF
short on the SP-500), but I added that any position should be closed
out if it closed back below its 65-dma.
8/29/2017 Charts
PEERLESS DJI, Signals, Indicators Daily DJI Split Volume 10-DayUp/Down Vol
Hourly DJIA A/D Line for All Stocks
DJIA S&P OEX NYSE NASDAQ COMPQX with CP
DIA SPY QQQ MDY IWM-TNA
Short Term Interest Rates DJI-Utilities DJI-Transp
Nifty-30 Index
CrudeOil FAS GLD BBH IBB JETS JNUG KOL NUGT OIH OIL
RSX RETL SDS SLV SOXL TECL TMF TNA XIV YINN
Commodities: JJC, NIB, CORN, WEAT UUP (Dollar)
To STOCKS' CHARTS
AAPL ADBE ALXN AMAT AMGN AMZN BA BABA BIDU CAT FB GOOG GS
HD IBM JPM M (Macy's) MASI MSFT NVDA QCOM TSLA TXN
CMG (Chipotle), LRCX, SWKS, TOWN
Others REN, CVE and SWN (very low AI/200 stocks)
8/29/2017
Bullish MINCPs Bearish MINCPs
 RANKING OF KEY DIRECTORIES BASED PCT.OF STOCKS ABOVE 65-DMA
              8/29/17
Bearish = 29
Bullish = 14
---------------------------------------------------------------------------------------
Directory     Current       day-1         day-2         day-3         day-4         day-5
----------------------------------------------------------------------------------------
BIGMIL          100%         .8            .8            .8            .8            1
  BIGMIL includes, BA,GD,LMT, NOC, RTN
BONDFUND       .883          .812          .75           .767          .821          .785
ETFS           .863          .893          .878          .848          .863          .863
GOLD           .849          .867          .754          .735          .679          .698
UTILITY        .822          .844          .866          .866          .844          .822
BEVERAGE       .75           .65           .75           .75           .8            .8
N=6
-------------------------------------------------------------------------------------------
NIFTY          .633          .6            .6            .6            .633          .633
SOLAR          .631          .631          .631          .631          .526          .526
CHINA          .619          .65           .65           .666          .666          .634
COMODITY       .614          .6            .614          .628          .628          .614
INDMATER       .591          .602          .581          .571          .551          .571
MILITARY       .555          .511          .511          .511          .466          .577
GAMING         .533          .533          .566          .633          .566          .6
BIOTECH        .503          .5            .425          .464          .413          .437
N=8
--------------------------------------------------------------------------------------------
DOWJONES       .5            .5            .533          .566          .6            .633
EDU            .5            .5            .5            .5            .375          .375
HOMEBLDG       .5            .5            .555          .444          .444          .555
---------------------------------------------------------------------------------------------
INDEXES        .481          .5            .485          .476          .481          .5
SP500          .459          .455          .475          .444          .461          .493
SEMI           .456          .456          .413          .405          .387          .387
NASD-100       .455          .477          .433          .422          .411          .422
INFRA          .454          .454          .454          .454          .363          .363
MORNSTAR       .453          .453          .441          .411          .42           .432
SP-100         .453          .443          .474          .453          .474          .536
TRANSP         .45           .35           .3            .25           .25           .35
ELECTRON       .448          .448          .417          .376          .381          .402
RUS-1000       .438          .437          .455          .438          .441          .459
GREEN          .419          .451          .451          .387          .387          .387
INSURANC       .411          .47           .529          .529          .588          .588
REIT           .404          .45           .512          .507          .512          .455
CHEM           .402          .444          .43           .416          .416          .43
SOFTWARE       .39           .406          .375          .343          .343          .359
HACKERS        .388          .388          .388          .333          .333          .333
DJI-13         .384          .384          .384          .461          .538          .615
FINANCE        .362          .45           .483          .417          .45           .439
RETAIL         .362          .344          .379          .327          .31           .275
COMPUTER       .36           .36           .32           .28           .28           .28
AUTO           .35           .35           .375          .325          .35           .375
N=21
---------------------------------------------------------------------------------------------
PIPELINE       .333          .333          .222          .222          .222          .222
BIGBANKS       .285          .428          .571          .428          .428          .571
HOSPITAL       .285          .142          .142          .142          .142          .142
OILGAS         .265          .24           .24           .221          .221          .215
COAL           .222          .222          .222          .111          .111          .111
REGBANKS       .138          .194          .277          .25           .222          .222
JETS           .111          .111          .111          0             0             .111
FOOD           0             .357          .214          .142          .071          .071
N=8
==============================================================================
August 28, 2017 The Peerless Sell
S9-v still operates. The key ETFs Closing
Powers are all falling. A test by the DJI of its rising 65-dma
seems probable. SPY seems
likely to break below its 65-dma.
SDS, which I mentioned last night, should
be bought and held
provided it does not close back below its 65-dma.
Buy SDS
"Find A New Trend and Ride It until It Ends"
New trends and stronger trends are becoming apparent. The
Dollar's weakness continues. UUP has
been a good short sale
and should be held. Gold has been
fairly steadily rising and NUGT
is now playing catch up. Copper has
proven that a month of
Professional buying just below the 65-dma was a good reason
us to buy. Corn and
Wheat have broken important support.
Another
leg down seems to have started.
We've done well the Chinese stocks. They got clipped with
profit-taking today as the world's markets weakened. Draw their
Closing Power uptrend-lines with these stocks and take profits when
they are broken: CO, CHN,
YINN. Take profits in CO.
Gasoline futures will must surely rise, now that 20% of the US oil
refining has been put off-line for two or three months. I would think
Crude Oil will also rise. So cover most Oil stock shorts is my suggestion.
Yahoo tells us that it is the added threat of war with North Korea
because of their missile test above and beyond Japan that has
taken the futures down 1/2% or more this morning. Rather, I
think it's the risk of a rapid rise in Oil and Gas prices. They hit
the markets very hard in October 1973 and several times later
on while Carter was President. There is a similar risk now that
I think the market cannot ignore. If the Fed were to raise rates,
the market's problems will worsen. But I don't expect this.
Buy Andeavor
                            8/28/2017  Charts

                            PEERLESS DJI, Signals, Indicators    Daily DJI Split Volume   10-DayUp/Down Vol
                                                   Hourly DJIA    A/D Line for All Stocks
                                                   DJIA    S&P    OEX    NYSE    NASDAQ   COMPQX with CP
                                                   DIA   SPY   QQQ    MDY   IWM-TNA
                                                   Short Term Interest Rates    DJI-Utilities      DJI-Transp
                                                   Nifty-30 Index
                                                   CrudeOil  FAS  GLD  BBH  IBB  JETS  JNUG  KOL  NUGT  OIH   OIL
                                                   RSX   RETL   SDS  SLV   SOXL   TECL   TMF   TNA   XIV  YINN

                   Commodities: JJC, NIB, CORN, WEAT  UUP (Dollar)

                                                                    To STOCKS' CHARTS
                                                   AAPL  ADBE  ALXN  AMAT  AMGN  AMZN  BA  BABA  BIDU   CAT    FB  GOOG   GS
                                                   HD   IBM   JPM  M (Macy's)  MASI   MSFT   NVDA   QCOM   TSLA  TXN
                   CMG (Chipotle), LRCX,  SWKS,   TOWN
                   Ohers REN,  CVE and SWN (very low AI/200 stocks)
                   8/28/2017   Bullish MINCPs    Bearish MINCPs

               RANKING OF KEY DIRECTORIES BASED PCT.OF STOCKS ABOVE 65-DMA
               8/28/17
Bearish = 29
Bullish = 14
---------------------------------------------------------------------------------------
Directory     Current       day-1         day-2         day-3         day-4         day-5
----------------------------------------------------------------------------------------
ETFS           .882          .867          .838          .852          .852          .794
GOLD           .849          .754          .754          .698          .679          .698
UTILITY        .844          .866          .866          .844          .822          .8
BONDFUND       .812          .75           .767          .821          .794          .767
BIGMIL         .8            .8            .8            .8            1             .8
BEVERAGE       .65           .75           .75           .8            .8            .8
CHINA          .65           .65           .666          .666          .634          .682
SOLAR          .631          .631          .631          .526          .526          .526
INDMATER       .602          .581          .571          .551          .561          .52
NIFTY          .6            .6            .6            .633          .633          .633
COMODITY       .594          .608          .623          .623          .608          .579
GAMING         .533          .566          .633          .566          .633          .466
MILITARY       .511          .511          .511          .466          .577          .466
BIOTECH        .503          .425          .456          .421          .433          .366
N=14
===========================================================================================
DOWJONES       .5            .533          .566          .6            .633          .5
EDU            .5            .5            .5            .375          .375          .375
HOMEBLDG       .5            .555          .444          .444          .555          .555
INDEXES        .5            .485          .476          .481          .504          .369
==============================================================================================
NASD-100       .494          .451          .44           .43           .44           .365
INSURANC       .47           .529          .529          .588          .617          .5
SP500          .458          .476          .446          .462          .498          .418
SEMI           .456          .413          .405          .387          .396          .301
INFRA          .454          .454          .454          .363          .363          .272
MORNSTAR       .453          .441          .411          .42           .436          .331
GREEN          .451          .451          .387          .387          .387          .29
FINANCE        .45           .483          .417          .45           .45           .362
REIT           .45           .512          .507          .512          .461          .466
ELECTRON       .448          .417          .381          .381          .407          .298
CHEM           .444          .43           .416          .416          .43           .347
SP-100         .443          .474          .453          .474          .546          .412
RUS-1000       .438          .455          .438          .441          .465          .408
BIGBANKS       .428          .571          .428          .428          .714          .285
SOFTWARE       .406          .375          .343          .343          .359          .343
HACKERS        .388          .388          .333          .333          .333          .333
DJI-13         .384          .384          .461          .538          .615          .461
COMPUTER       .36           .32           .28           .28           .28           .2
FOOD           .357          .214          .142          .071          .071          0
AUTO           .35           .375          .325          .35           .375          .325
TRANSP         .35           .3            .25           .25           .35           .25
RETAIL         .344          .379          .327          .31           .275          .241
N=23
============================================================================================
PIPELINE       .333          .333          .222          .222          .222          .222
OILGAS         .245          .245          .22           .22           .213          .176
COAL           .222          .222          .111          .111          .111          .111
REGBANKS       .2            .285          .257          .228          .228          .142
HOSPITAL       .142          .142          .142          .142          .142          .142
JETS           .111          .111          0             0             .111          .111
N=6
===============================================================================
August 25, 2017 The Peerless Sell
S9-v still operates. The key ETFs Closing
Powers are all falling. A test by the DJI of its rising 65-dma
seems probable. Yellen and the Fed may now delay raising rates.
That would bolster the market. It may even create new interest
in a handful of "explosive super stocks" showing "Augmented
B24s.
---------------------------------------------------------------------------------------------
See the separate Special
Report on these
explosive, super stocks I
started tonight. Read about the conditions that need to be added to
our screening process. And to make it easier for readers to more
comfortably jump aboard some of these stocks, I wrote
new Select-
Any-Date graphing software to show you their
charts as of the date
of the augmented B24 or any other date you select. Tiger ESP Folks will
only need a need a $30
CD from me to load up 20+ years
back data
on 6000 stocks.
More in the coming days.
www.tigersoft.com/TigerResearch/AUG-B24s/INDEX.htm
---------------------------------------------------------------------------------------------
The Sell S9-V now is guiding the DJI
and the market into a correction. Stay hedged
and consider Buying SDS if SPY breaks decisively
below its 65-dma.

8/25/2017 Charts
PEERLESS
DJI, Signals, Indicators Daily
DJI Split Volume 10-DayUp/Down
Vol
Hourly DJIA A/D Line
for All Stocks
DJIA
S&P
OEX
NYSE
NASDAQ
COMPQX
with CP
DIA
SPY
QQQ
MDY
IWM-TNA
Short Term Interest Rates
DJI-Utilities
DJI-Transp
Nifty-30 Index
CrudeOil FAS
GLD
BBH
IBB
JETS
JNUG
KOL
NUGT
OIH
OIL
RSX
RETL SDS
SLV
SOXL
TECL
TMF
TNA XIV YINN
Commodities: JJC, NIB,
WEAT UUP (Dollar)
To
STOCKS' CHARTS
AAPL ADBE
ALXN
AMAT
AMGN
AMZN BA
BABA
BIDU
CAT
FB
GOOG
GS
HD
IBM JPM M
(Macy's) MASI
MSFT
NVDA QCOM
TSLA
TXN
new
CMG (Chipotle),
LRCX,
SWKS,
TOWN
Ohers REN, CVE
and SWN (very low AI/200 stocks)
8/25/2017
Bullish MINCPs
Bearish
MINCPs
Most Natural disasters don't usually effect the stock
market except
in the very short-term. But the massive
flood damage in SE Texas this week
will be comparable to the destruction
of Hurricanes Katrina and Andrew, possibly
combined.
So, let's see how the market reacts. This coming
week's bullish seasonality will
bolster the market after a day or two day down is my guess. I suspect that the
huge size of the swirling storm shown the weather maps before Friday night's
landfall surely must have caused some clever folks on Wall Street to have
foresee
the coming disaster. This partly explains the sharp decline in the Tiger
Accumulation
Index
on Thursday and Friday.
Costliest Natural Disasters
1. Hurricane Katrina $108-149 Billion
August 29, 2005
2. Northridge Earthquake $65 Billion January 17, 1994
3. Hurricane Sandy $50-75 Billion October 29, 2012
4. Hurricane Ike $37 Billion September 13, 2008
Another bullish consideration: Janet Yellen would like to prevent the 8 1/2 year
bull market market from entering a bear market while she runs the FED. Her
term as Fed Chairman ends next January.
But Nature has delivered a powerful blow to the US economy. Strictly speaking,
History suggests
the market will be lower in six weeks, but since bad hurricanes
mostly hit
in the Fall season when the market is often weaker anyway, we can't be
sure. Moreover, the re-building will bring some businesses added profits
and the economic shock should keep interest rates in check, too.
The Peerless S9-V and falling closing powers have been
making it
hard for the DJI to get back above its 21-dma at 21915. Now SPY
is sitting on its 65-dma, ready to move down from this pivot point.
Will the selling start a big wave down?
It's a good bet that the aftermath of Hurricane Ike
will cause additional
stock selling, by those who need to raise money do cope
with its
consequences. Presumably,
private flood insurance carriers there
will do the same. But most home-owners and businesses do not have
it. An Emergency national fund will be used.
Ordinarily, the DJI
rises right before Labor day. Besides, watching the
Closing Powers and
support levels of DIA, SPY and QQQ, watch what happens
to the oil
stocks and gasoline prices. It's not clear how much of the nation's
oil refining
will be shut down? Will this delay
Trump's
plans to sell off 1/2 of the
Federal Emergency oil reserves?
Consider buying SDS if it clearly surpasses its 65-dma
Its 65-dma will have to turn up to become bullish.
But see the new Accumulation and how fast the Day Traders' Tool
is rising.
          RANKING OF KEY DIRECTORIES BASED PCT.OF STOCKS ABOVE 65-DMA
               8/25/17
 Bearish = 27
Bullish = 18
---------------------------------------------------------------------------------------
Directory Current day-1 day-2 day-3 day-4 day-5
----------------------------------------------------------------------------------------
ETFS .878 .848 .863 .863 .787 .742
UTILITY .866 .866 .844 .822 .8 .8
BIGMIL .8 .8 .8 1 .8 .8
BEVERAGE .75 .75 .8 .8 .8 .8
BONDFUND .75 .767 .821 .794 .767 .705
GOLD .735 .754 .716 .698 .679 .698
N=6
--------------------------------------------------------------------------------------------
CHINA .65 .666 .666 .634 .682 .65
SOLAR .631 .631 .526 .526 .526 .684
COMODITY .6 .614 .614 .6 .542 .6
NIFTY .6 .6 .633 .633 .633 .633
INDMATER .581 .571 .551 .561 .53 .489
BIGBANKS .571 .428 .428 .714 .285 .428
GAMING .566 .633 .566 .633 .466 .533
HOMEBLDG .555 .444 .444 .555 .555 .5
DOWJONES .533 .566 .6 .633 .533 .533
INSURANC .529 .529 .588 .617 .529 .588
REIT .512 .507 .512 .461 .466 .388
MILITARY .511 .511 .466 .577 .466 .444
N=12
-------------------------------------------------------------------------------------------
EDU .5 .5 .375 .375 .375 .375
-------------------------------------------------------------------------------------------
INDEXES .485 .476 .481 .504 .373 .378
FINANCE .483 .417 .45 .45 .373 .395
SP500 .475 .444 .461 .497 .422 .416
SP-100 .474 .453 .474 .546 .422 .402
RUS-1000 .456 .438 .441 .465 .414 .41
INFRA .454 .454 .363 .363 .272 .363
GREEN .451 .387 .387 .387 .322 .387
MORNSTAR .441 .411 .42 .436 .34 .344
NASD-100 .433 .422 .411 .422 .355 .377
CHEM .43 .416 .416 .43 .361 .333
BIOTECH .429 .456 .413 .44 .366 .358
ELECTRON .417 .381 .386 .407 .304 .355
SEMI .413 .405 .387 .396 .31 .362
HACKERS .388 .333 .333 .333 .333 .222
DJI-13 .384 .461 .538 .615 .461 .538
RETAIL .379 .327 .31 .275 .241 .241
AUTO .375 .325 .35 .375 .325 .3
SOFTWARE .375 .343 .343 .359 .343 .312
N=18
---------------------------------------------------------------------------------------------
PIPELINE .333 .333 .222 .222 .222 .222
COMPUTER .32 .28 .28 .28 .2 .28
TRANSP .3 .25 .25 .35 .25 .25
REGBANKS .277 .25 .222 .222 .138 .111
OILGAS .253 .227 .221 .215 .177 .189
COAL .222 .111 .111 .111 .111 .222
FOOD .214 .142 .071 .071 0 0
HOSPITAL .142 .142 .142 .142 .142 .142
JETS .111 0 0 .111 .111 .111
N=9
 Bearish = 27
 Bullish = 18
---------------------------------------------------------------------------------------
Directory     Current       day-1         day-2         day-3         day-4         day-5
----------------------------------------------------------------------------------------
ETFS           .878          .848          .863          .863          .787          .742
UTILITY        .866          .866          .844          .822          .8            .8
BIGMIL         .8            .8            .8            1             .8            .8
BEVERAGE       .75           .75           .8            .8            .8            .8
BONDFUND       .75           .767          .821          .794          .767          .705
GOLD           .735          .754          .716          .698          .679          .698
N=6
--------------------------------------------------------------------------------------------
CHINA          .65           .666          .666          .634          .682          .65
SOLAR          .631          .631          .526          .526          .526          .684
COMODITY       .6            .614          .614          .6            .542          .6
NIFTY          .6            .6            .633          .633          .633          .633
INDMATER       .581          .571          .551          .561          .53           .489
BIGBANKS       .571          .428          .428          .714          .285          .428
GAMING         .566          .633          .566          .633          .466          .533
HOMEBLDG       .555          .444          .444          .555          .555          .5
DOWJONES       .533          .566          .6            .633          .533          .533
INSURANC       .529          .529          .588          .617          .529          .588
REIT           .512          .507          .512          .461          .466          .388
MILITARY       .511          .511          .466          .577          .466          .444
N=12
-------------------------------------------------------------------------------------------
EDU            .5            .5            .375          .375          .375          .375
-------------------------------------------------------------------------------------------
INDEXES        .485          .476          .481          .504          .373          .378
FINANCE        .483          .417          .45           .45           .373          .395
SP500          .475          .444          .461          .497          .422          .416
SP-100         .474          .453          .474          .546          .422          .402
RUS-1000       .456          .438          .441          .465          .414          .41
INFRA          .454          .454          .363          .363          .272          .363
GREEN          .451          .387          .387          .387          .322          .387
MORNSTAR       .441          .411          .42           .436          .34           .344
NASD-100       .433          .422          .411          .422          .355          .377
CHEM           .43           .416          .416          .43           .361          .333
BIOTECH        .429          .456          .413          .44           .366          .358
ELECTRON       .417          .381          .386          .407          .304          .355
SEMI           .413          .405          .387          .396          .31           .362
HACKERS        .388          .333          .333          .333          .333          .222
DJI-13         .384          .461          .538          .615          .461          .538
RETAIL         .379          .327          .31           .275          .241          .241
AUTO           .375          .325          .35           .375          .325          .3
SOFTWARE       .375          .343          .343          .359          .343          .312
N=18
---------------------------------------------------------------------------------------------
PIPELINE       .333          .333          .222          .222          .222          .222
COMPUTER       .32           .28           .28           .28           .2            .28
TRANSP         .3            .25           .25           .35           .25           .25
REGBANKS       .277          .25           .222          .222          .138          .111
OILGAS         .253          .227          .221          .215          .177          .189
COAL           .222          .111          .111          .111          .111          .222
FOOD           .214          .142          .071          .071          0             0
HOSPITAL       .142          .142          .142          .142          .142          .142
JETS           .111          0             0             .111          .111          .111
N=9
==============================================================================
August 24, 2017 The Peerless Sell
S9-v still operates. But look for a small DJI
rally. Next week has a reliably positive upward bias. And recall
the study I did recently showing that twice as many topsoccur in
September as August. We should not be surprised if the DJI rallies.
With or without Trump, Republicans do firmly control Congress. They
should be able to get a big tax cut passed. That's what Wall Street is
really
looking forward, too. Everything else is secondary. But naturally,
there are
still doubts about what the President will do and so the market is only
creeping back upwards. Stay hedged. Lots of stocks and groups remain
in downtrends and show very heavy red Distribution. Remember that the
DJI usually tops out after most other indexes.
DIA's Closing Power and Tiger Traders' Tool are
both still falling. So, DIA needs now to get back above its
21-dma at 219 or else it will fall back to its rising
65-dma support at 215.

Hedging by playing shorts in our Bearish MINCPs against longs
among the strongest Chinese Bullish MAXCPs has worked well.
Nothing seems ready to change these profitable trends.
The DJIA Must Do Most of The Heavy-Lifting
The narrowing of the advance is most clearly seen not in the
NYSE A/D Line but in the falling percentage of all stocks above
their 65-dma and the rising percentage of stock sectors having
most of their stocks below their 65-dma. So, it's probably going
to be up to the blue-chips in the DJIA to try to launch a rally
and keep key stocks and ETFs from breaking their important
support levels.

The Closing Power for IWM (Russell-2000) only
broke its downtrend. Now IWM may next rally
back up to its flat 65-dma resistance. A failure their
to go higher should be shorted. So should a breaking
of its key horizontal support at 134.5
QQQ is at a pivot point. A move up
from here would get it
up past its 21-dma, but a decline would bearishly take it
below its 65-dma. Its Closing Power and TTT are both
still in downtrends. Despite QQQ's position being just
above its rising 65-dma and uptrend-line, Professionals
and Day Traders are not yet bullish.
Right now, Utilities and Chinese stocks make up most of the
Bullish MAXCPs. This reflects the defensiveness of the market
and the weakening Dollar as interest rates seem to remain on hold for
the next few months.
The Most Bullish Chinese Stocks.
8/24/2017 Charts
PEERLESS
DJI, Signals, Indicators Daily
DJI Split Volume 10-DayUp/Down
Vol
Hourly DJIA A/D Line
for All Stocks
DJIA
S&P
OEX
NYSE
NASDAQ
COMPQX
with CP
DIA
SPY
QQQ
MDY
IWM-TNA
Short Term Interest Rates
DJI-Utilities
DJI-Transp
Nifty-30 Index
CrudeOil FAS
GLD
BBH
IBB
JETS
JNUG
KOL
NUGT
OIH
OIL
RSX
RETL SDS
SLV
SOXL
TECL
TMF
TNA XIV YINN
Commodities: JJC, NIB,
WEAT UUP (Dollar)
To
STOCKS' CHARTS
AAPL ADBE
ALXN
AMAT
AMGN
AMZN BA
BABA
BIDU
CAT
FB
GOOG
GS
HD
IBM JPM M
(Macy's) MASI
MSFT
NVDA QCOM
TSLA
TXN
new
CMG (Chipotle),
LRCX,
SWKS,
TOWN
Ohers REN, CVE
and SWN (very low AI/200 stocks)
8/24/2017
Bullish MINCPs
Bearish
MINCPs
 RANKING OF KEY DIRECTORIES BASED PCT.OF STOCKS ABOVE 65-DMA
              8/24/17
Bearish = 30
Bullish = 15
---------------------------------------------------------------------------------------
Directory     Current       day-1         day-2         day-3         day-4         day-5
----------------------------------------------------------------------------------------
UTILITY        .866          .844          .822          .8            .8            .711
ETFS           .848          .863          .863          .787          .742          .727
BONDFUND       .767          .821          .794          .767          .714          .625
BEVERAGE       .75           .8            .8            .8            .8            .8
GOLD           .735          .716          .716          .698          .679          .698
N=5
--------------------------------------------------------------------------------------------
CHINA          .666          .666          .634          .682          .65           .634
GAMING         .633          .566          .633          .466          .533          .566
SOLAR          .631          .526          .526          .526          .684          .526
COMODITY       .619          .619          .605          .549          .605          .507
NIFTY          .6            .633          .633          .633          .633          .666
INDMATER       .571          .551          .561          .53           .5            .469
DOWJONES       .566          .6            .633          .533          .533          .566
INSURANC       .529          .588          .617          .529          .588          .558
MILITARY       .511          .466          .577          .466          .488          .511
REIT           .507          .512          .461          .466          .393          .455
N=10
--------------------------------------------------------------------------------------------
INDEXES        .471          .481          .504          .373          .378          .397
DJI-13         .461          .538          .615          .461          .538          .538
BIOTECH        .46           .413          .433          .374          .362          .377
INFRA          .454          .363          .363          .272          .363          .363
SP-100         .453          .474          .546          .422          .412          .432
HOMEBLDG       .444          .444          .555          .555          .5            .5
SP500          .444          .461          .497          .422          .42           .426
RUS-1000       .439          .441          .465          .414          .415          .416
BIGBANKS       .428          .428          .714          .285          .428          .285
NASD-100       .422          .411          .422          .355          .377          .366
FINANCE        .417          .45           .45           .373          .406          .395
CHEM           .416          .416          .43           .361          .347          .291
MORNSTAR       .411          .42           .436          .34           .352          .365
SEMI           .405          .387          .396          .31           .362          .31
GREEN          .387          .387          .387          .322          .387          .387
ELECTRON       .349          .355          .382          .273          .327          .295
SOFTWARE       .343          .343          .359          .343          .328          .312
N=17
--------------------------------------------------------------------------------------------
EDU            .333          .166          .166          .166          .166          .166
HACKERS        .333          .333          .333          .333          .277          .222
PIPELINE       .333          .333          .222          .222          .222          .222
RETAIL         .327          .31           .275          .241          .241          .241
AUTO           .325          .35           .375          .325          .325          .325
COMPUTER       .28           .28           .28           .2            .28           .32
REGBANKS       .25           .222          .222          .138          .111          .083
TRANSP         .25           .25           .35           .25           .25           .25
OILGAS         .234          .227          .215          .177          .189          .164
FOOD           .142          .071          .071          0             0             .071
HOSPITAL       .142          .142          .142          .142          .142          .142
COAL           .111          .111          .111          .111          .222          .111
JETS           0             0             .111          .111          .111          .111
N=13
================================================================================
August 23, 2017 The Peerless Sell S9-v still operates,
but I think the DJI wants to rally.
Having successfully tested its rising 50-day ma, a test of the resistance
at its highs would be a typical next move. A further rebound would also would be in
keeping with the tendency of the market to rally in the week before Labor
Day. Since 1965, the DJI has risen 61.2% of the time over the next
two weeks, but note that the average advance is only 0.3%. Breadth
(+181) today belied the declines in the major ETFs.
It is important that the DJI rallies now in hopes that
it brings along lot of other
stocks. Market makers, big banks, deal-makers and the Fed know this.
I do not think that they will let the market turn down significantly without
much more strain (and bearish divergences).
But internals still remain weak and negative. A 2.7% rally from here would
produce a new Sell S9-V. Overhanging everything, Septembers are often
quite bearish. Some will also tell you that President Trump poses the
biggest risk
by his much-faulted personality. His over-reactions, personal vendettas
with Republican Congressional leaders and Russia-Gate are all producing
a lack of focus that so far seems to be preventing Congress from cutting taxes
on and for the wealthy.
https://www.nytimes.com/2017/08/23/us/politics/trump-wall-flake.html?emc=edit_th_20170824&nl=todaysheadlines&nlid=58223894
For my part, I think Wall Street will be pleasantly surprised
by the outcome on
this.
Others must think the same. That is the real reason the market refuses to sell off.
All stock market history shows that such tax cuts if passed into law would be
quite bullish.
Being hedged now seems advisable.

The Closing Power downtrends for MDY and IWM have been broken.
I think these short sales should be covered. Their support levels held
and it's likely that they will now rally back up to their 65-day moving
averages. But the heaviest red distribution Oil and Retail stocks should
be held short. Chipotle (CMG) also looks like it will keep falling a long
ways.
Our Stocks' Hotline on the Tiger ESP page is long and short about the
same number of stocks. The best of the Chinese stocks in our MAXCPs
should keep rallying. At the time, the heaviest Red Distribution Oil and
Retail
stocks with falling Closing Powers should be held short. But they are down
a long ways. Cover any of them if their Closing Powers rises above its
21-dma.
8/23/2017 Charts
PEERLESS
DJI, Signals, Indicators Daily
DJI Split Volume 10-DayUp/Down
Vol
Hourly DJIA A/D Line
for All Stocks
DJIA
S&P
OEX
NYSE
NASDAQ
COMPQX
with CP
DIA
SPY
QQQ
MDY
IWM-TNA
Short Term Interest Rates
DJI-Utilities
DJI-Transp
Nifty-30 Index
CrudeOil FAS
GLD
BBH
IBB
JETS
JNUG
KOL
NUGT
OIH
OIL
RSX
RETL SDS
SLV
SOXL
TECL
TMF
TNA XIV YINN
Commodities: JJC, NIB,
WEAT UUP (Dollar)
To
STOCKS' CHARTS
AAPL ADBE
ALXN
AMAT
AMGN
AMZN BA
BABA
BIDU
CAT
FB
GOOG
GS
HD
IBM JPM M
(Macy's) MASI
MSFT
NVDA QCOM
TSLA
TXN
new
CMG (Chipotle),
LRCX,
SWKS,
TOWN
Ohers REN, CVE
and SWN (very low AI/200 stocks)
8/23/2017
Bullish MINCPs
Bearish
MINCPs
How To Use DIA's Tiger Day Traders' Tool (TTT) at This
Time
The trick with TTT is to understand that this indicator sees the ETF or stock
the way a day-trader would. It only measures what happens after each
day's
opening and it only shows the past cumulative upside potential
after the opening
less downside potential.
Here is the exact formula. Where i is a day of trading,
the
formula is TTT(i) = TTT(i-1) + (High(i)-Opening(i)) - (Opening-La(i))
Our formula only deals in absolute amounts, not percentages. This
actually
gives it a mild positive bias in lower priced stocks. Avoid using it with
stocks under $10.
Its trend-breaks are important. But it is not good at calling exact
bottoms. Often
there
is a quick reversals without much warning from TTT. But prices will
usually
not rally much without the downtrend of TTT first breaking.
Day traders will quickly
re-assess the
stock's or ETF's situation when the TTT breaks its
downtrend and
suddenly there is a lot more upside potential.
TTT Divergences from prices are less important. They can build up for
three or
months before there is a big breakdown in prices. There seems to be a
reliable
Summer pattern of TTT weakness relative to the DIA trend. If the TTT
finally
breaks its well-tested uptrend-line or flat support-line after such a bearish
divergence, expect a significant price move.
Since 1998, when DIA was first started, there have been 12 cases, as
I count
them it, where the TTT angled down in the Summer while the DIA held
up, like now. In 9 of these cases a breaking of well-tested DIA - TTT
support
between July and September led to significant decline general market declines.
See
==>
http://www.tigersoft.com/Peerless-Research/TigerDTT/INDEX.htm
In 3 of these 12 cases, prices moved higher. So, if the TTT downtrend is broken
or the TTT shows a series of rising bottoms in the ordinarily weak Summer
period, look for a DIA advance.
Still A Defensive and Blue Chip Market
Only 42% of all stocks and ETFs are above their 65-dma.
This number
must get back over 50% or else September will probably bring a sell-off.
 RANKING OF KEY DIRECTORIES BASED PCT.OF STOCKS ABOVE 65-DMA
                            8/23/17
               Bearish = 30
               Bullish = 14
---------------------------------------------------------------------------------------
Directory     Current       day-1         day-2         day-3         day-4         day-5
----------------------------------------------------------------------------------------
ETFS           .863          .863          .787          .742          .727          .863
UTILITY        .844          .822          .8            .8            .733          .822
BONDFUND       .821          .794          .767          .714          .642          .633
BEVERAGE       .8            .8            .8            .8            .8            .85
GOLD           .698          .716          .716          .698          .679          .698
CHINA          .666          .634          .682          .65           .634          .666
N=5
------------------------------------------------------------------------------------------
NIFTY          .633          .633          .633          .633          .666          .7
COMODITY       .619          .605          .549          .605          .507          .535
DOWJONES       .6            .633          .533          .533          .566          .766
INSURANC       .588          .617          .529          .588          .558          .676
GAMING         .566          .633          .466          .533          .6            .633
INDMATER       .551          .561          .53           .5            .469          .54
DJI-13         .538          .615          .461          .538          .538          .692
SOLAR          .526          .526          .526          .684          .578          .631
REIT           .512          .461          .466          .393          .455          .502
N=9
-------------------------------------------------------------------------------------------
INDEXES        .481          .504          .373          .378          .415          .579
SP-100         .474          .546          .422          .412          .453          .659
MILITARY       .466          .577          .466          .488          .533          .577
SP500          .461          .497          .422          .42           .434          .548
FINANCE        .45           .45           .373          .406          .428          .538
HOMEBLDG       .444          .555          .555          .5            .611          .722
RUS-1000       .442          .465          .414          .415          .424          .519
BIGBANKS       .428          .714          .285          .428          .428          .857
MORNSTAR       .42           .436          .34           .352          .365          .525
BIOTECH        .417          .433          .366          .37           .381          .437
CHEM           .416          .43           .361          .347          .291          .458
NASD-100       .411          .422          .355          .377          .377          .533
GREEN          .387          .387          .322          .387          .387          .548
SEMI           .387          .396          .31           .362          .318          .482
ELECTRON       .386          .412          .309          .355          .324          .458
EDU            .375          .375          .375          .375          .375          .375
INFRA          .363          .363          .272          .363          .363          .454
AUTO           .35           .375          .325          .325          .325          .325
SOFTWARE       .343          .359          .343          .328          .328          .437
N=19
-------------------------------------------------------------------------------------------
HACKERS        .333          .333          .333          .277          .222          .388
PIPELINE       .333          .333          .222          .222          .222          .222
RETAIL         .31           .275          .241          .241          .241          .275
COMPUTER       .28           .28           .2            .28           .32           .4
TRANSP         .25           .35           .25           .25           .25           .5
OILGAS         .234          .221          .177          .189          .164          .202
REGBANKS       .222          .222          .138          .111          .111          .305
HOSPITAL       .125          .125          .125          .125          .125          .125
COAL           .111          .111          .111          .222          .111          .111
FOOD           .071          .071          0             0             .071          .142
JETS           0             .111          .111          .111          .111          .222
N=11
====================================================================================

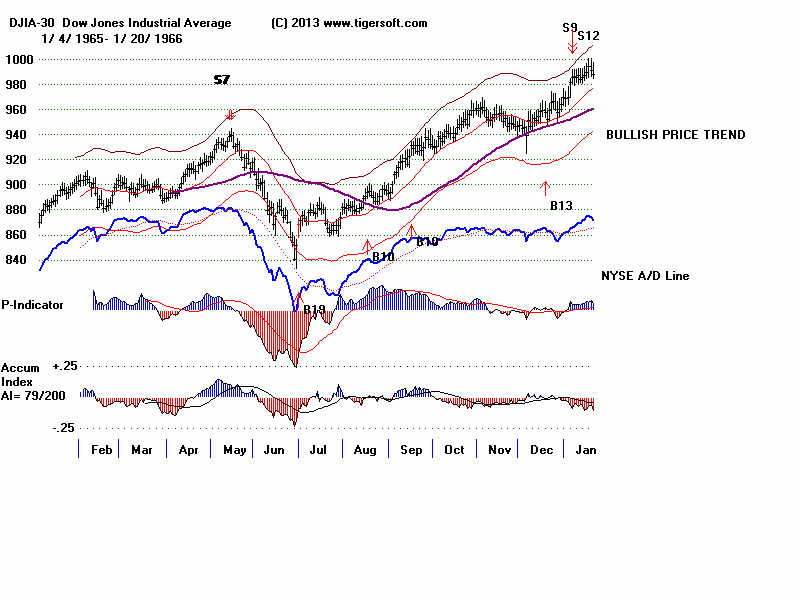
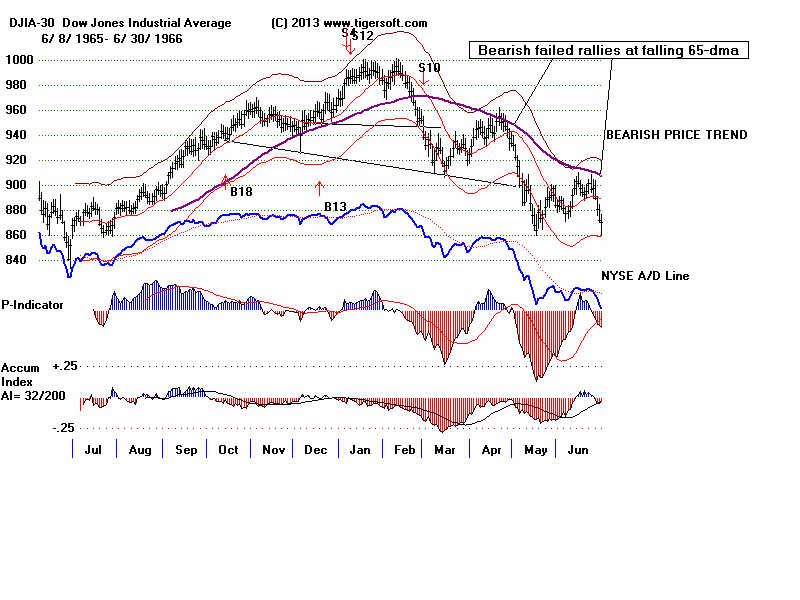
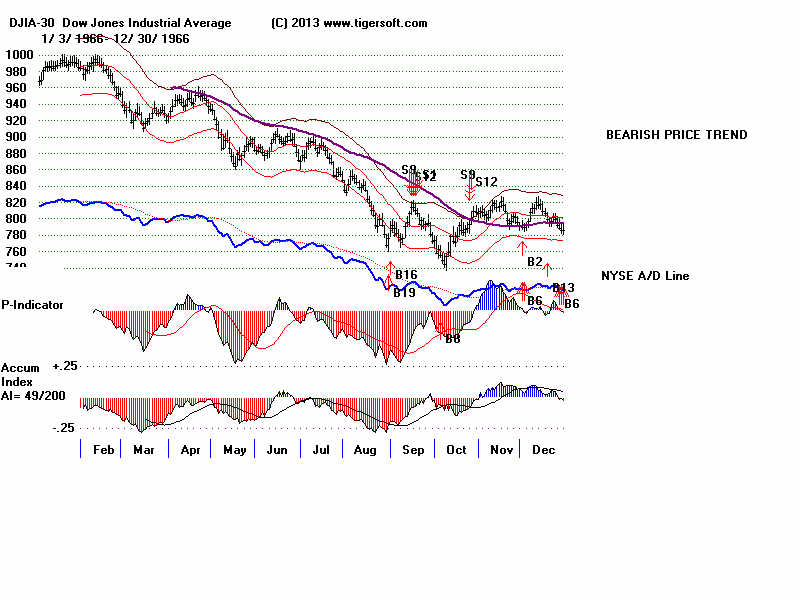
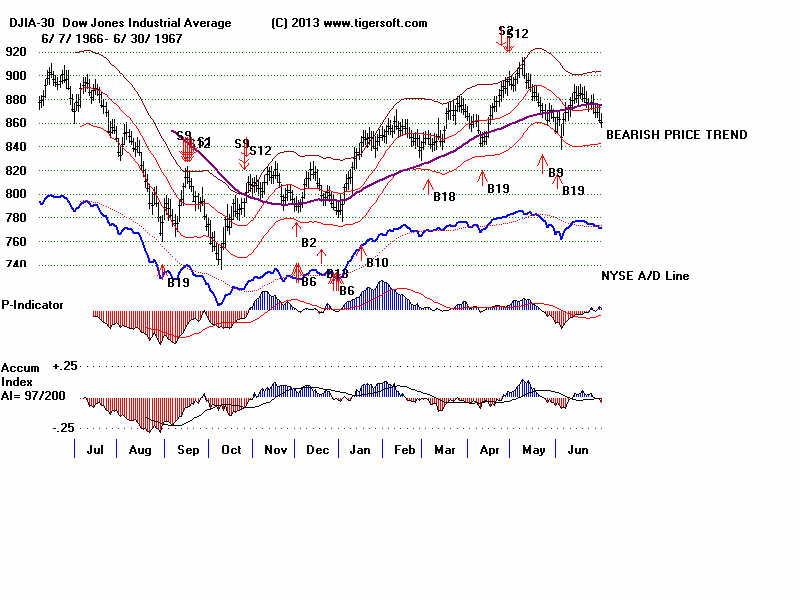
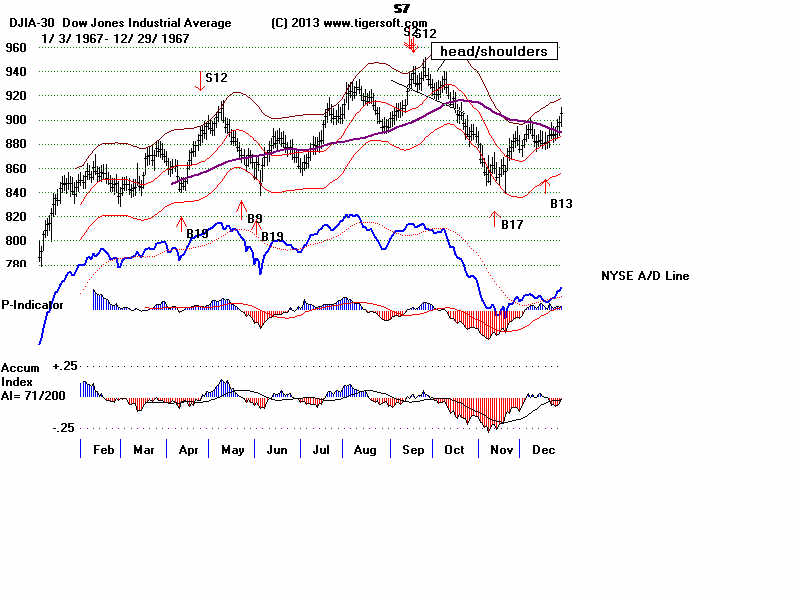
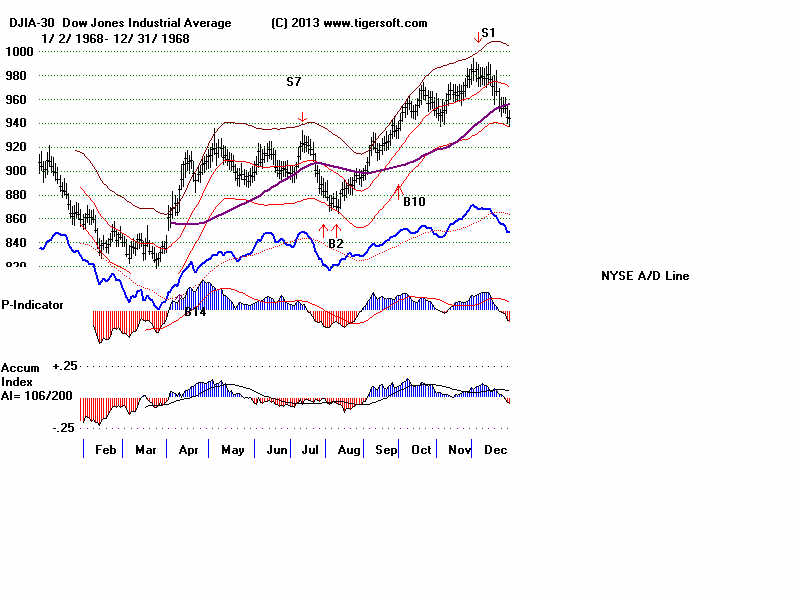
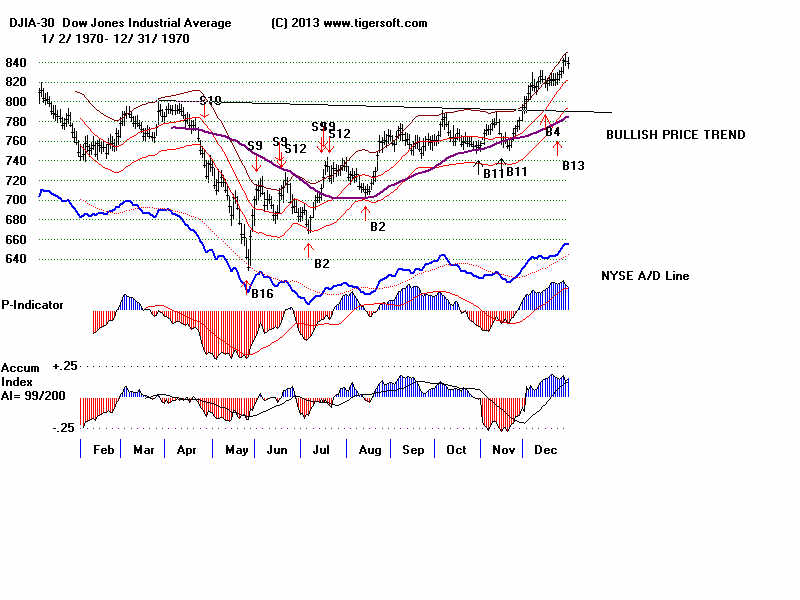
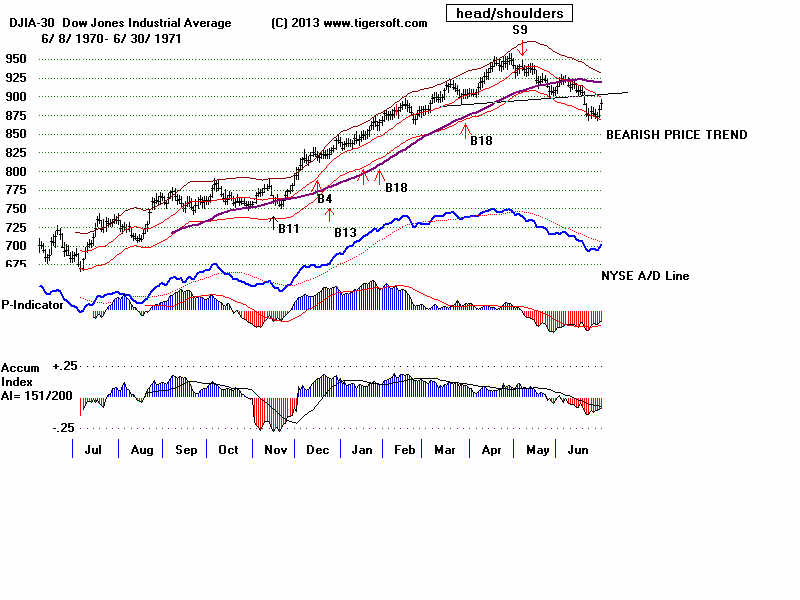
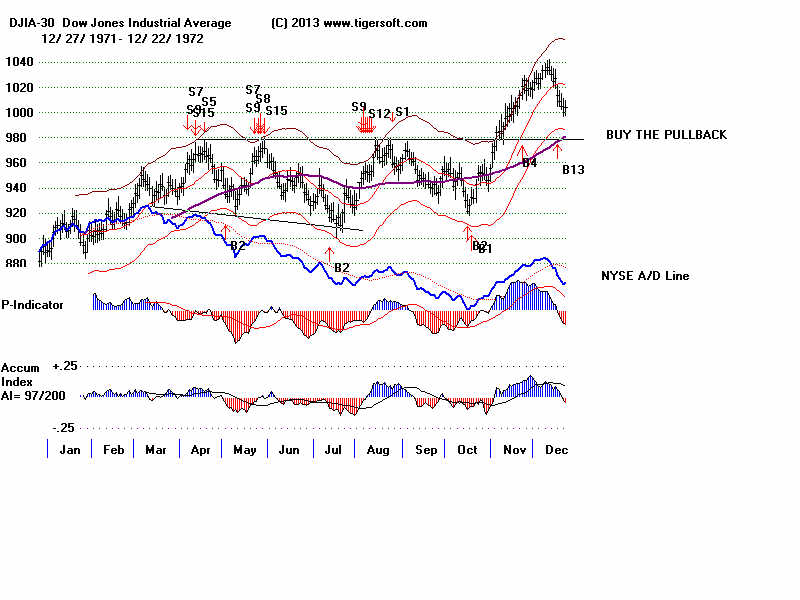
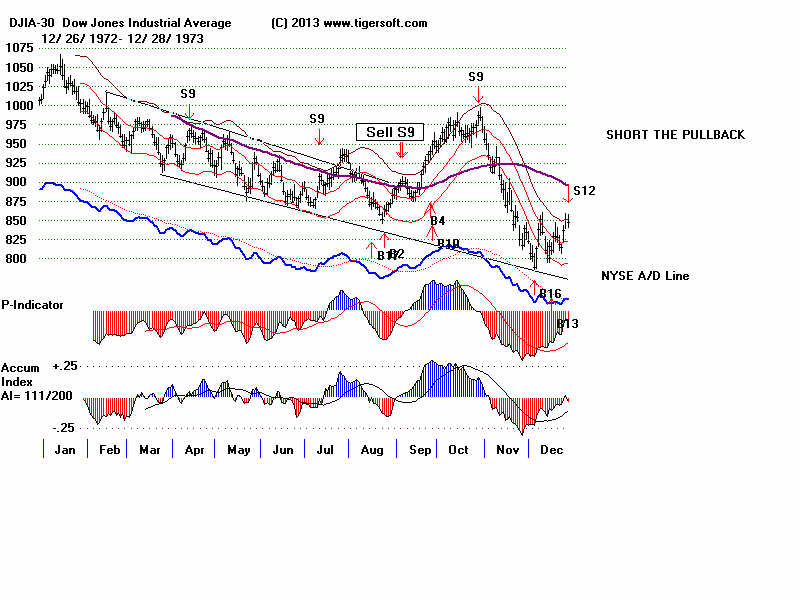
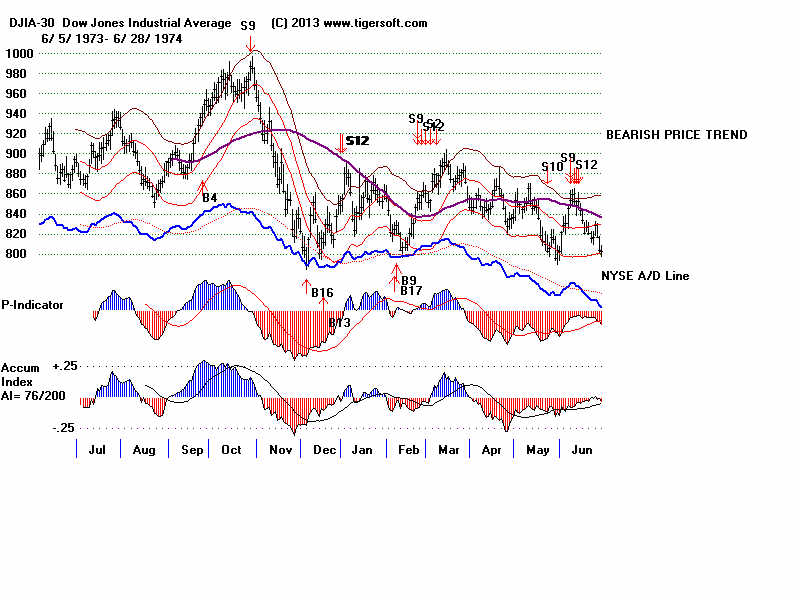
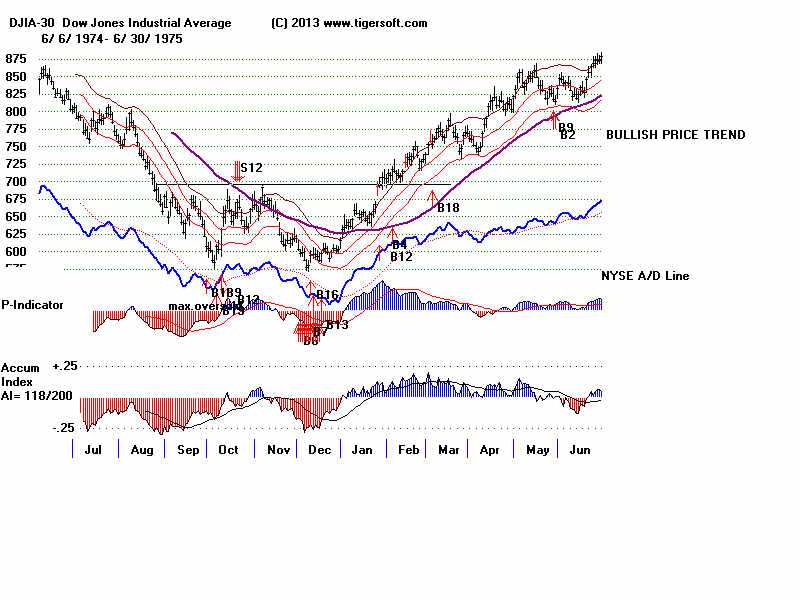
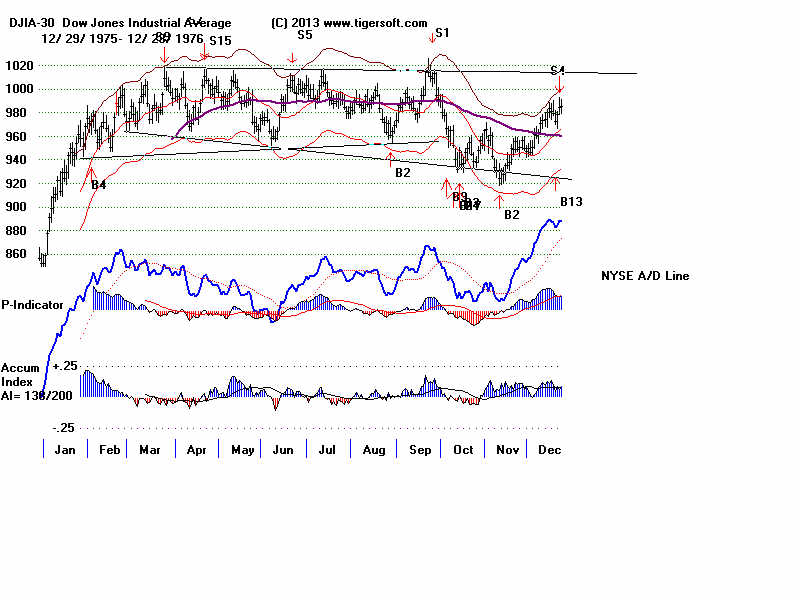
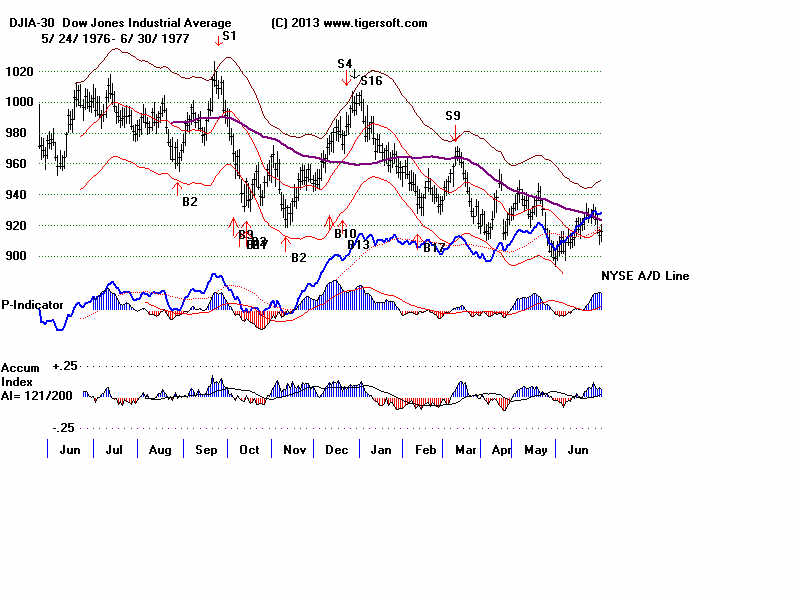
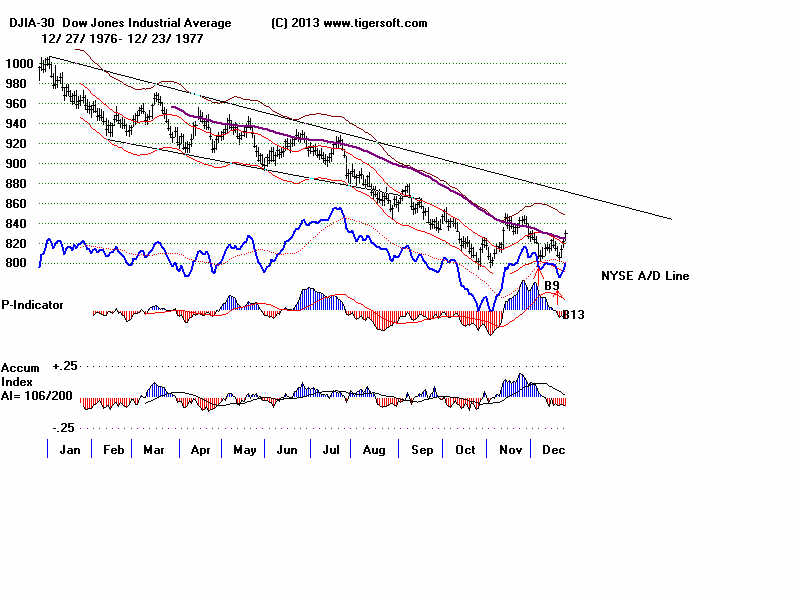
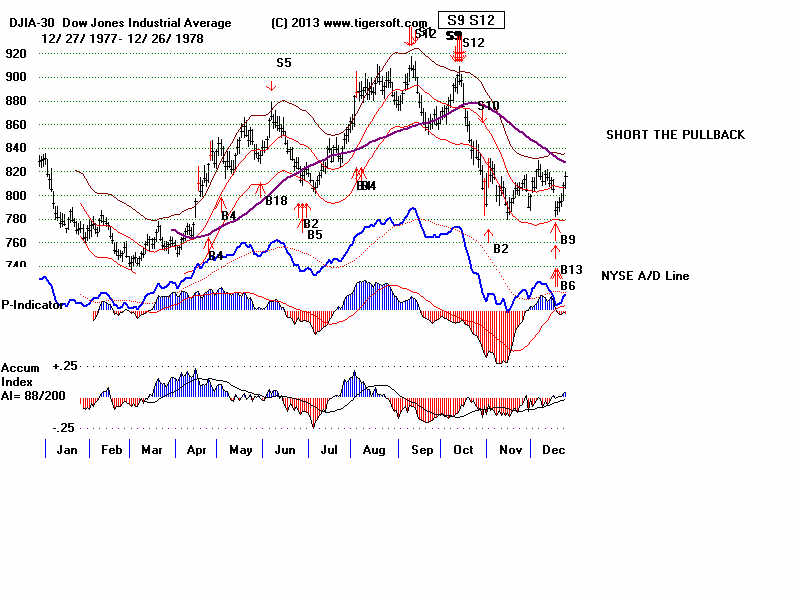
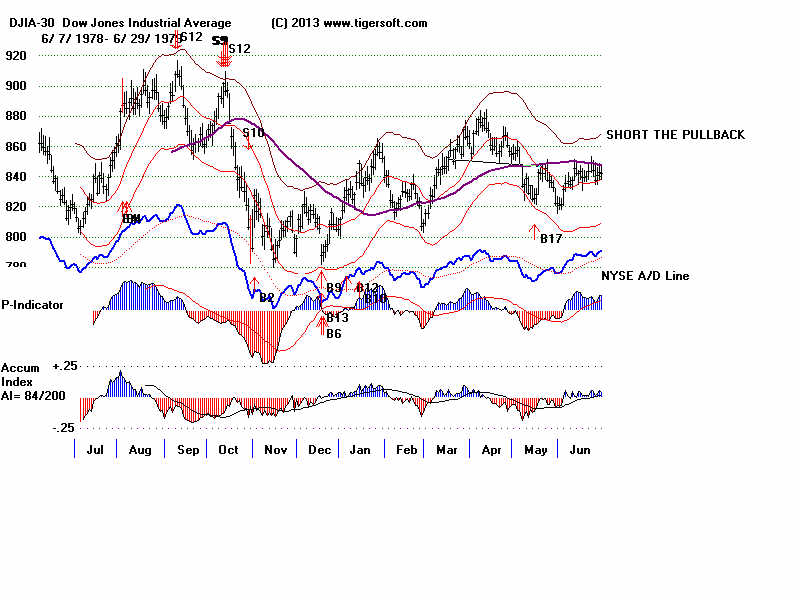
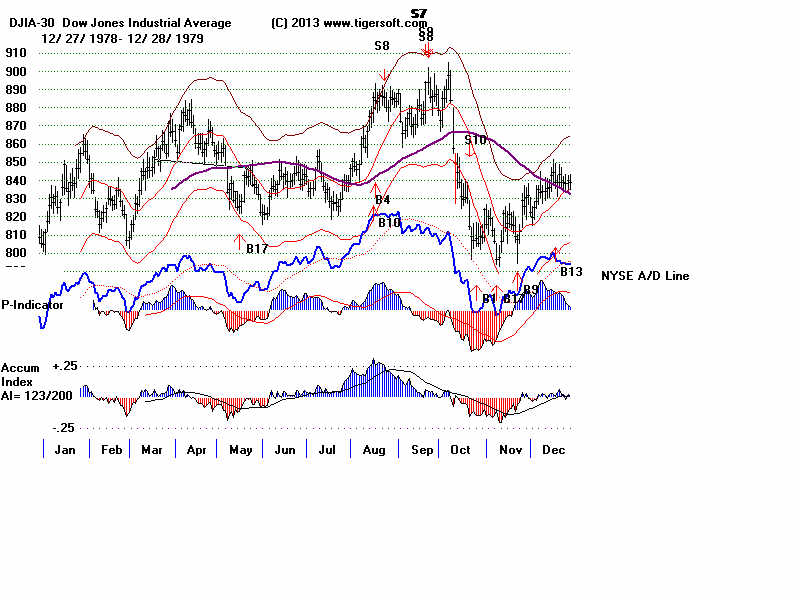
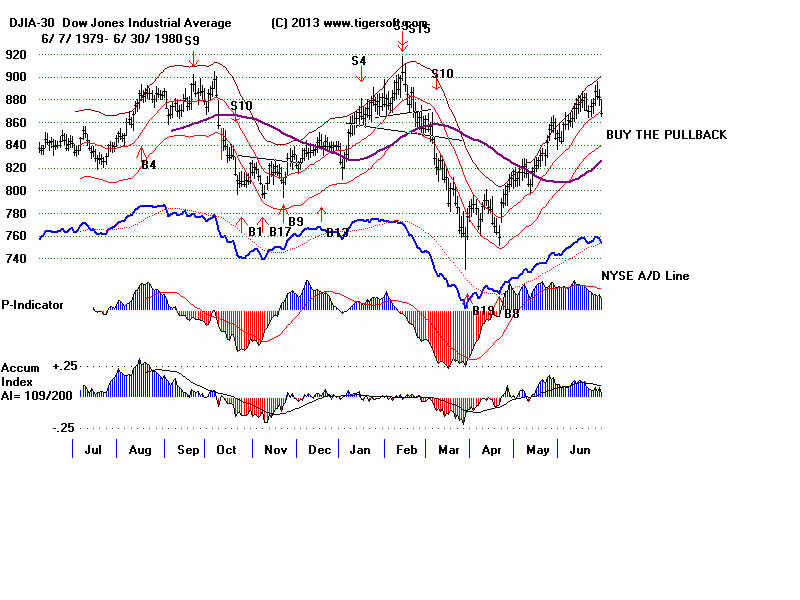
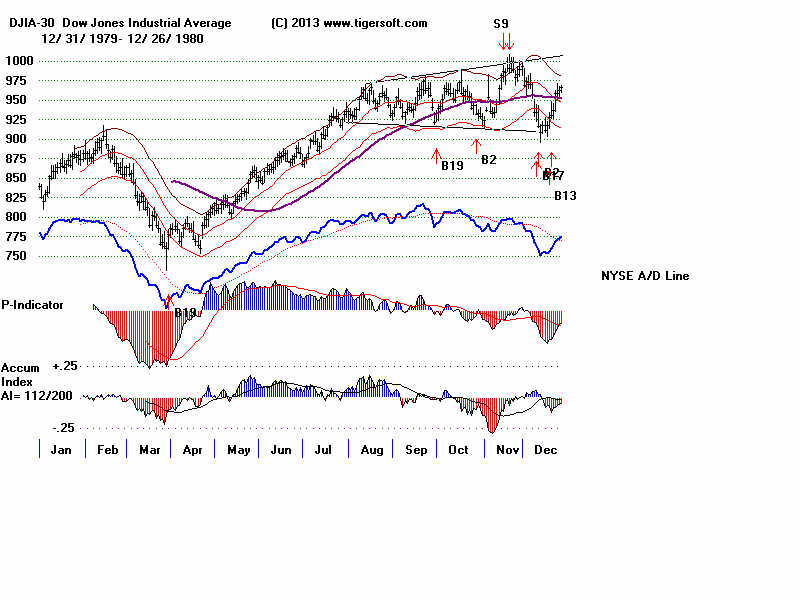
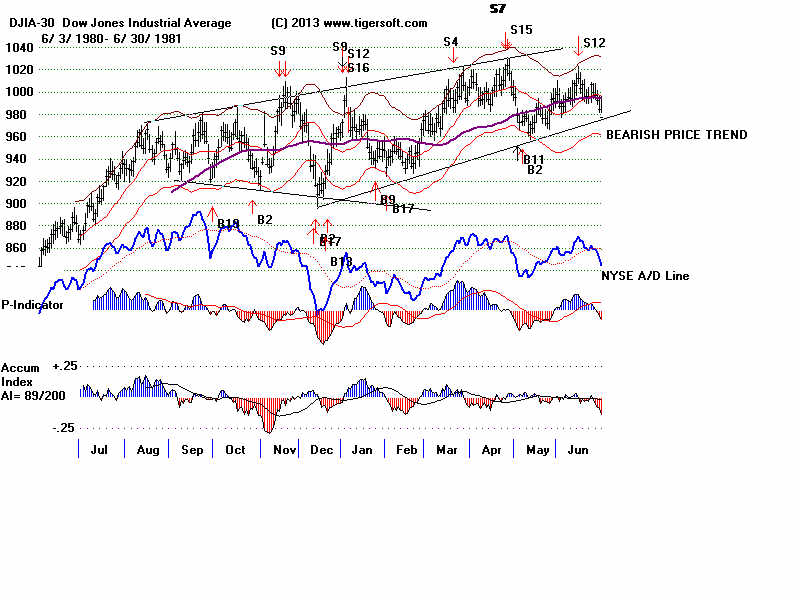
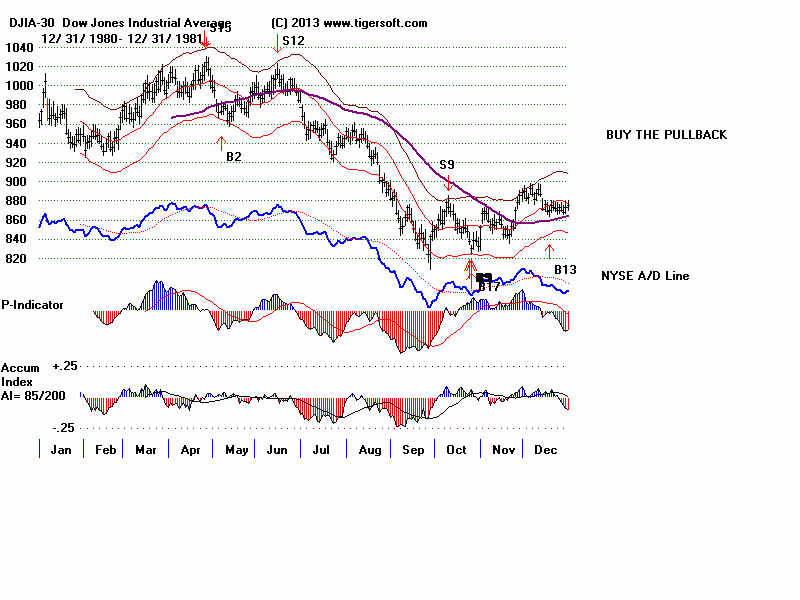
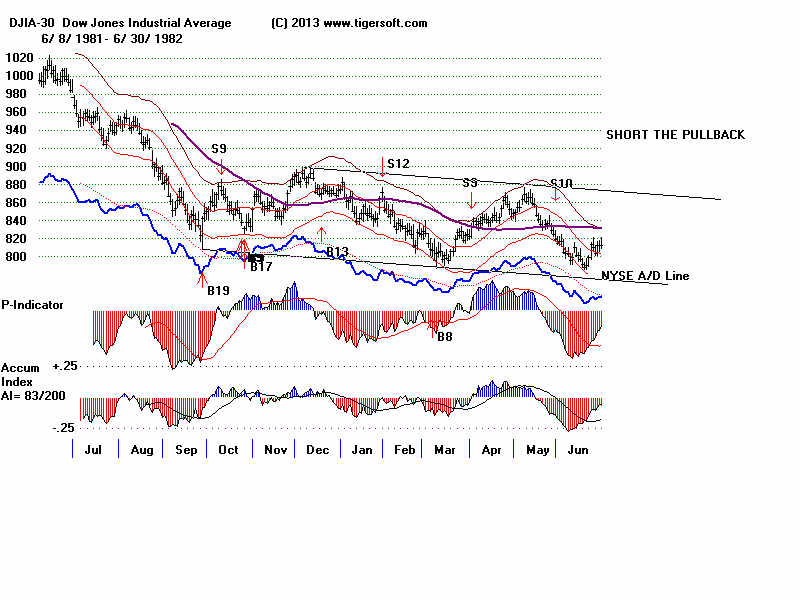
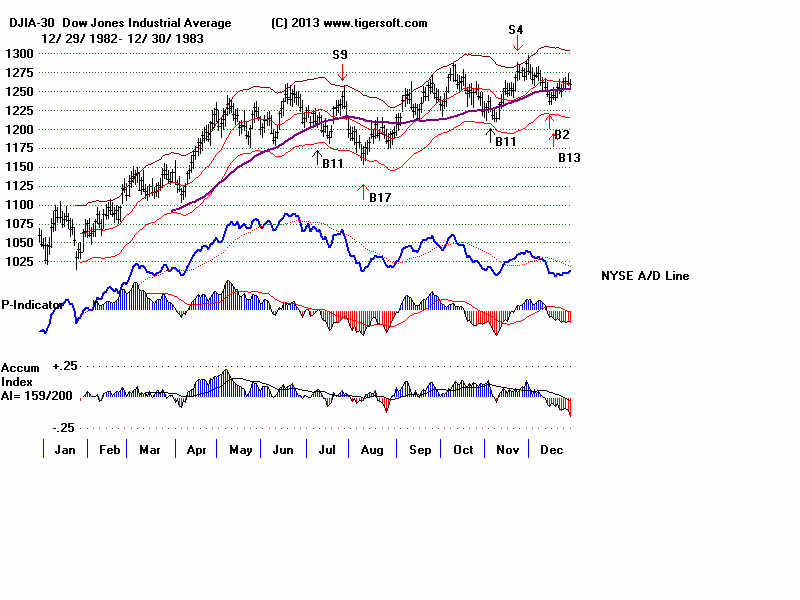
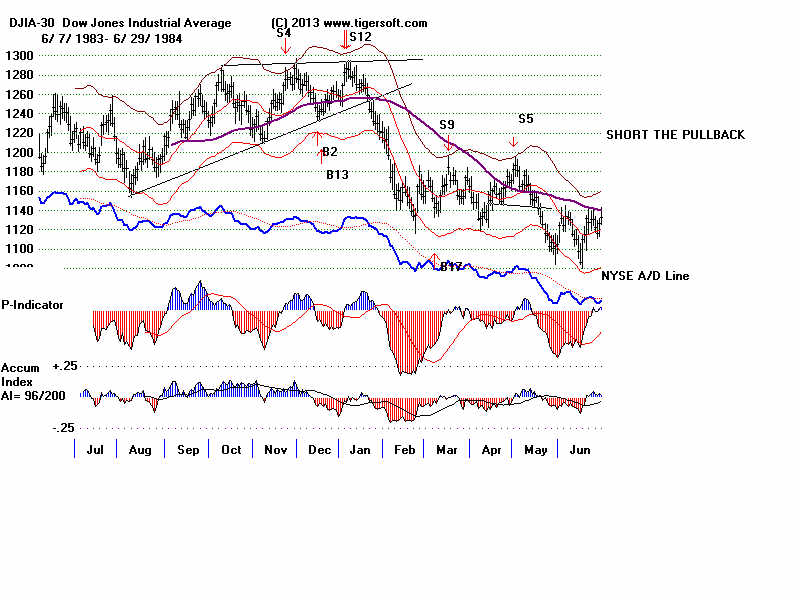
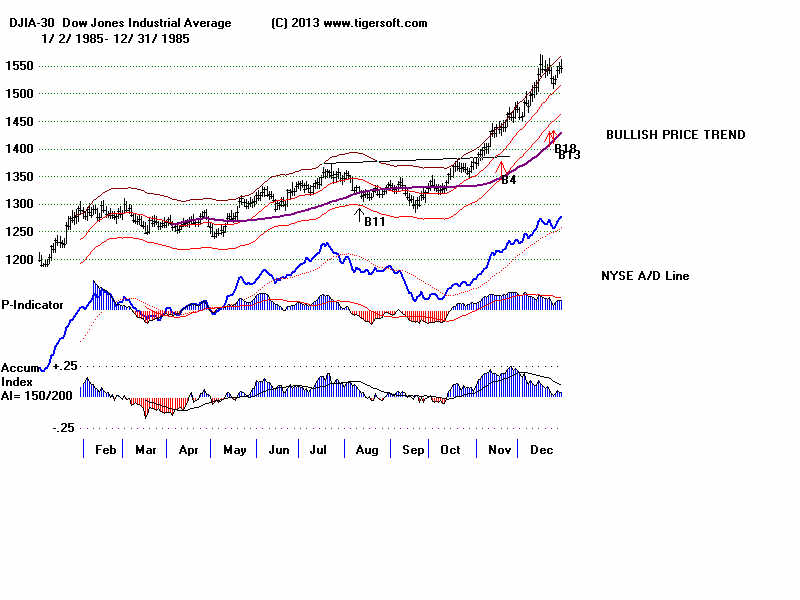
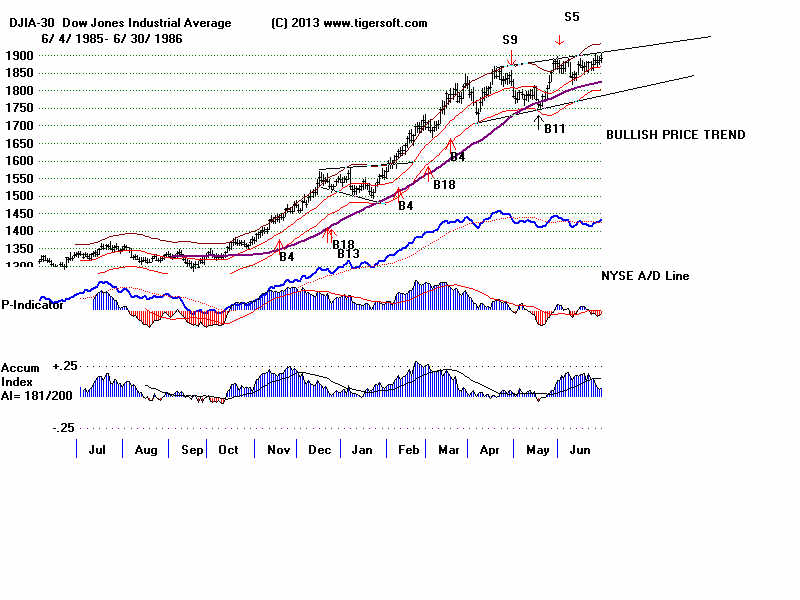
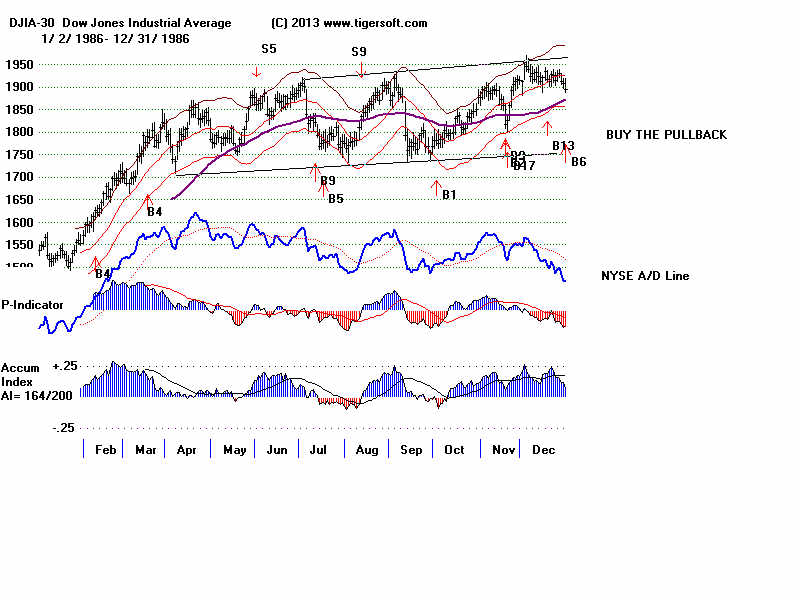
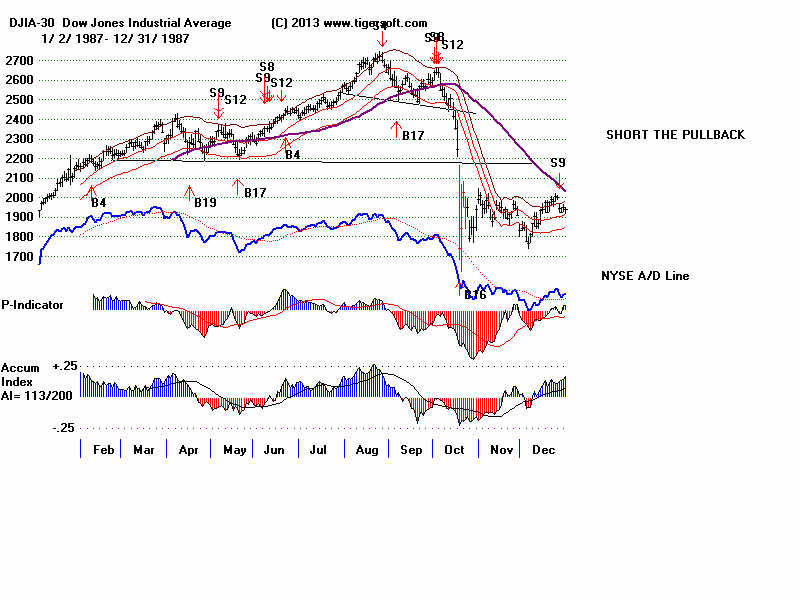
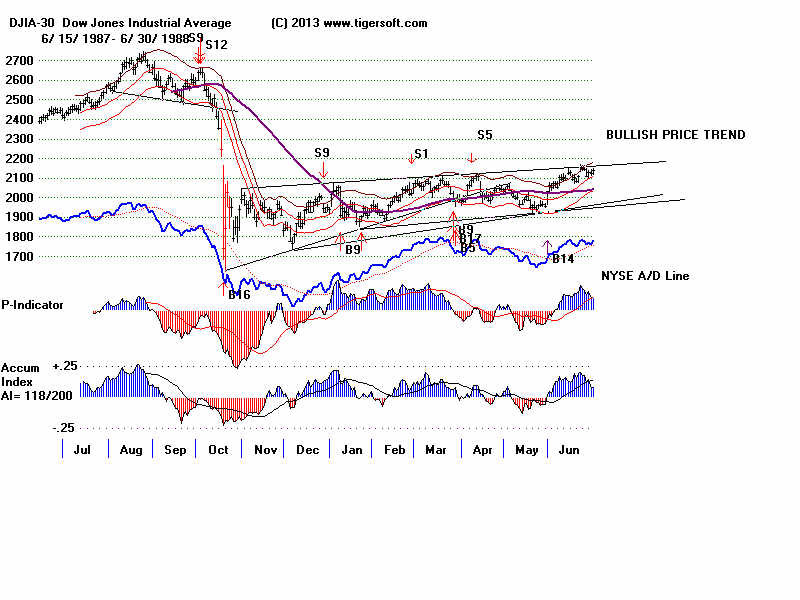
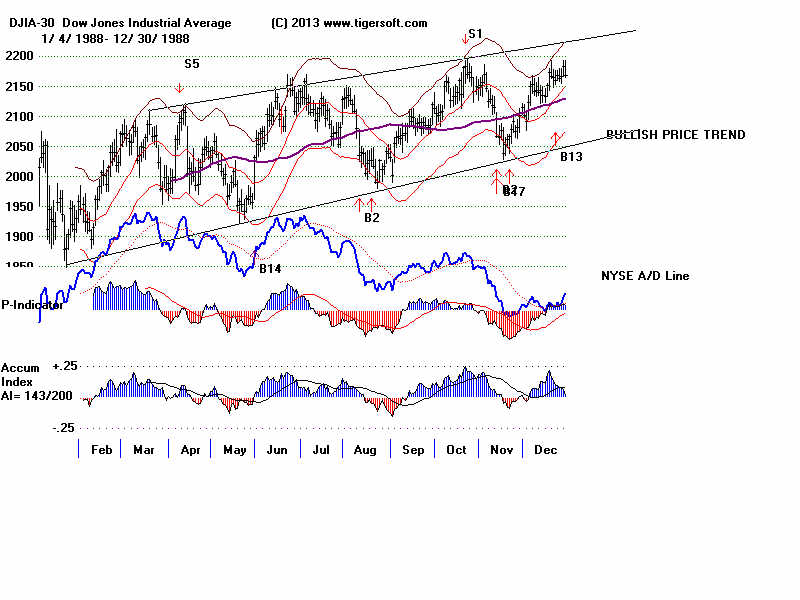
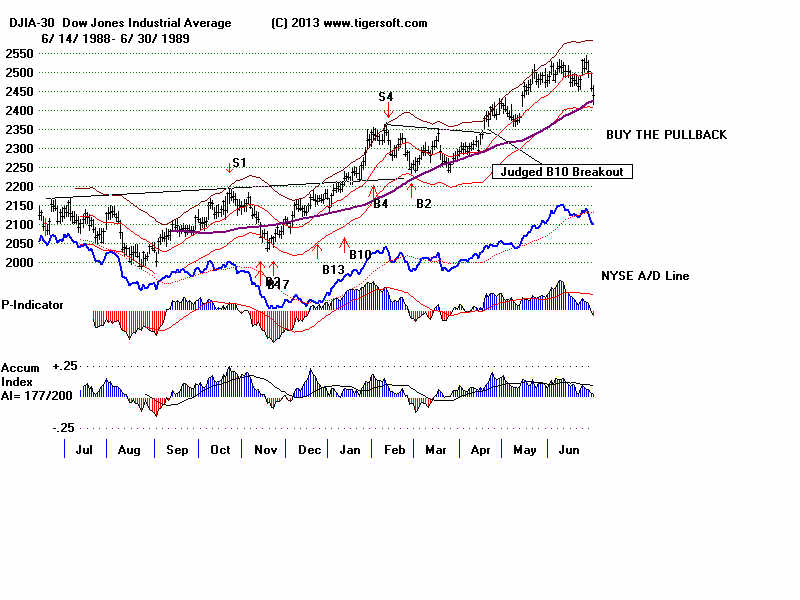
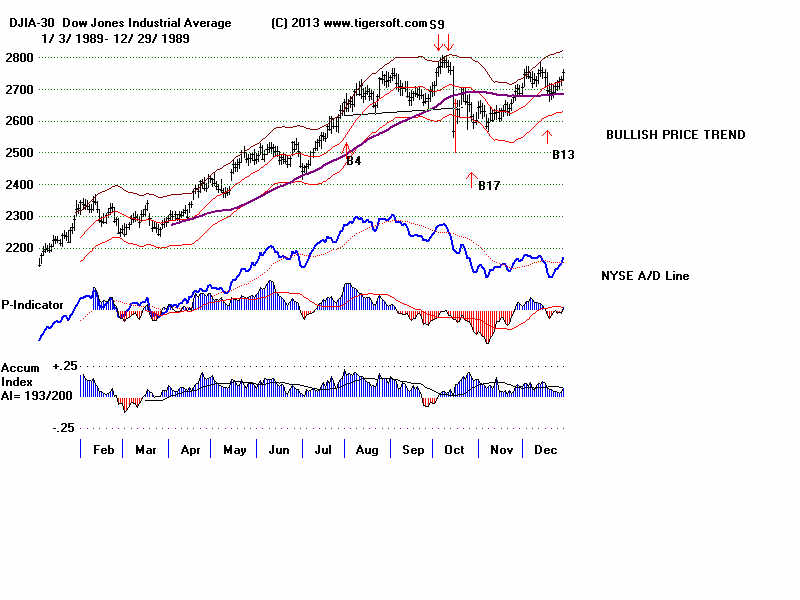
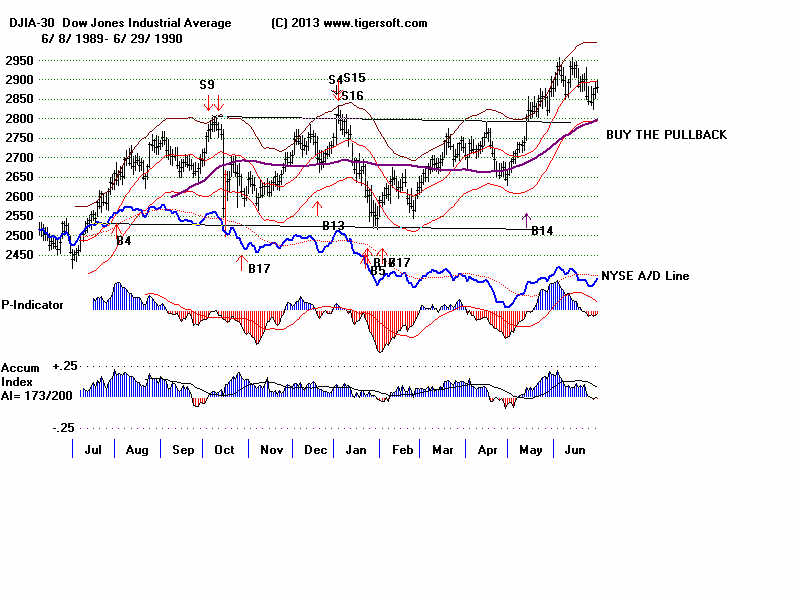
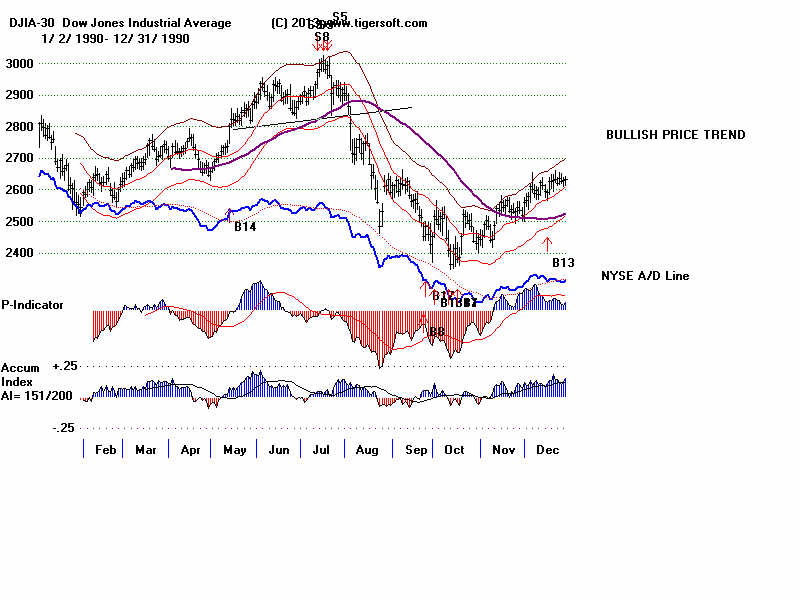
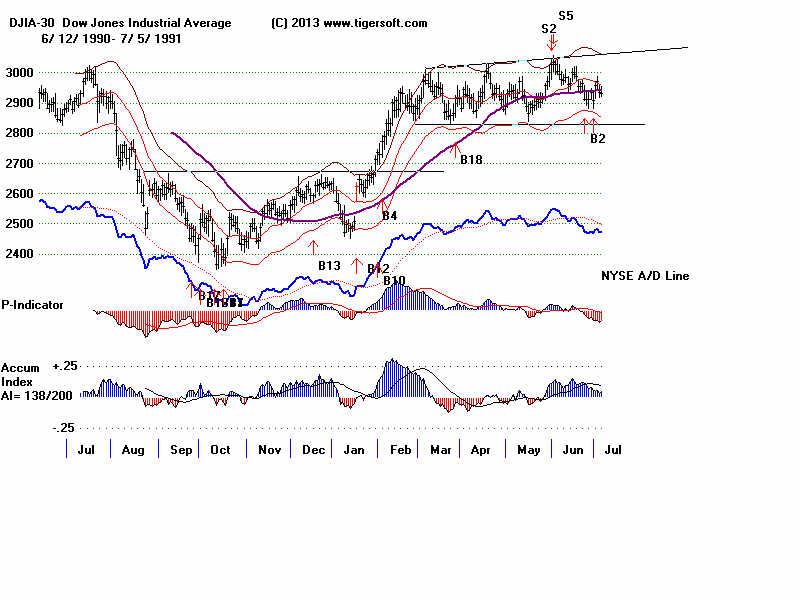
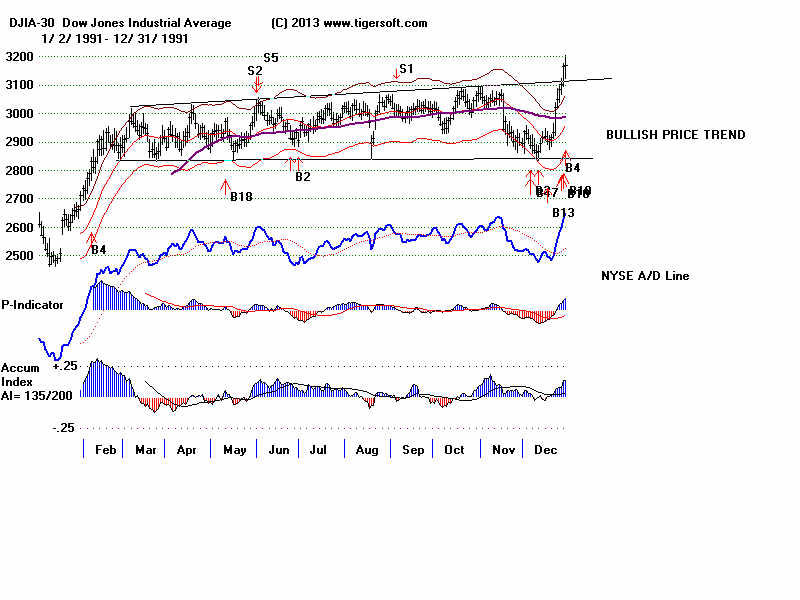
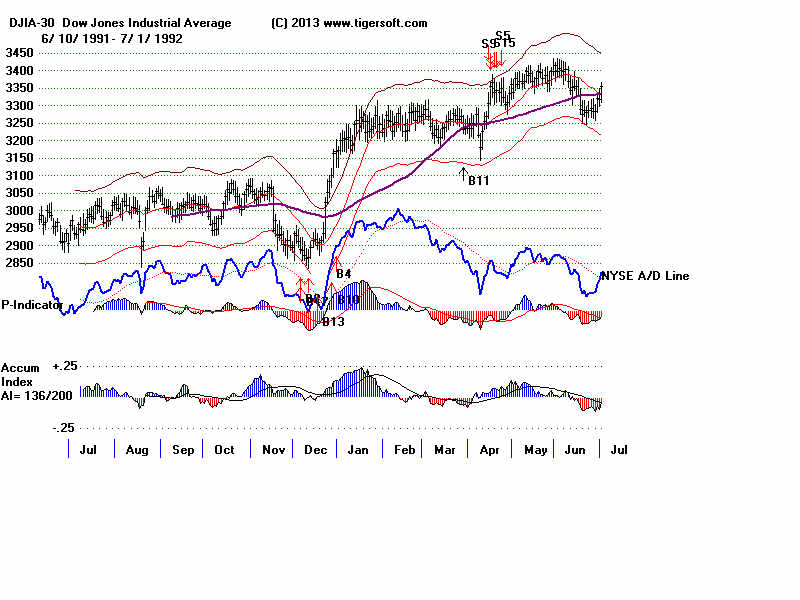
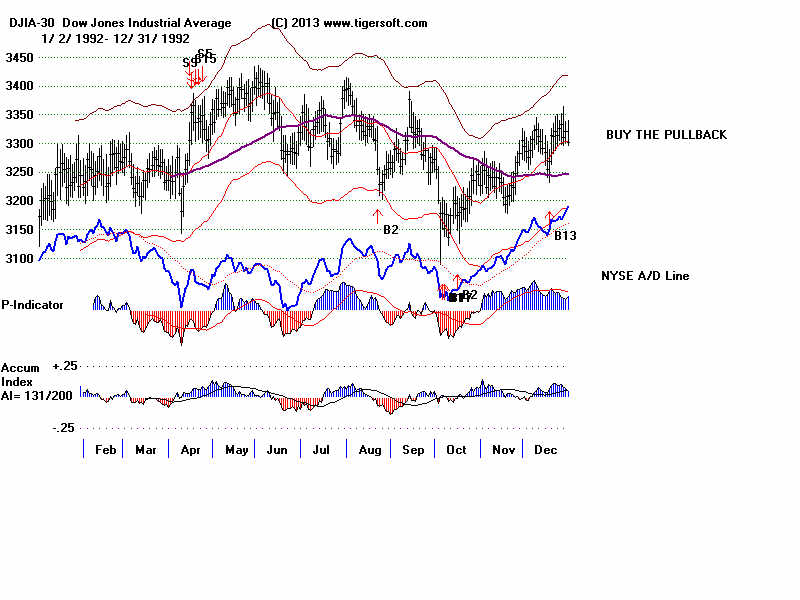
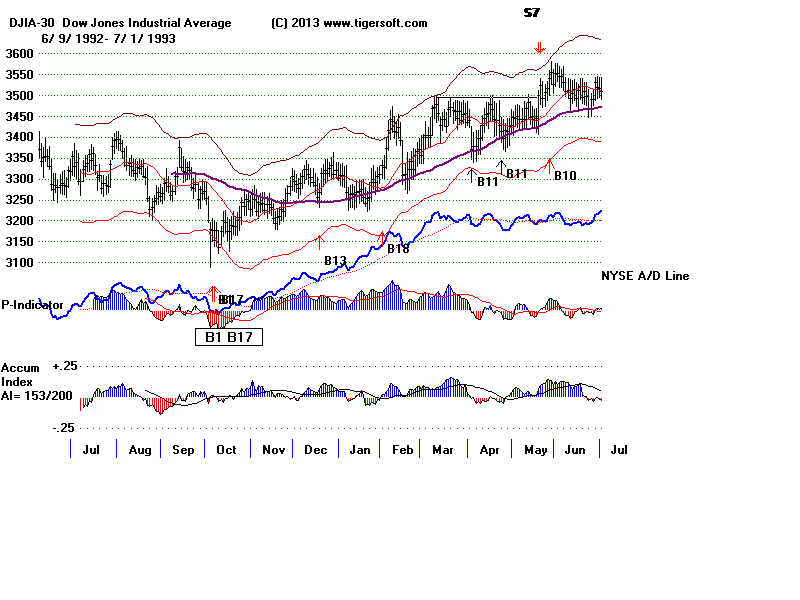
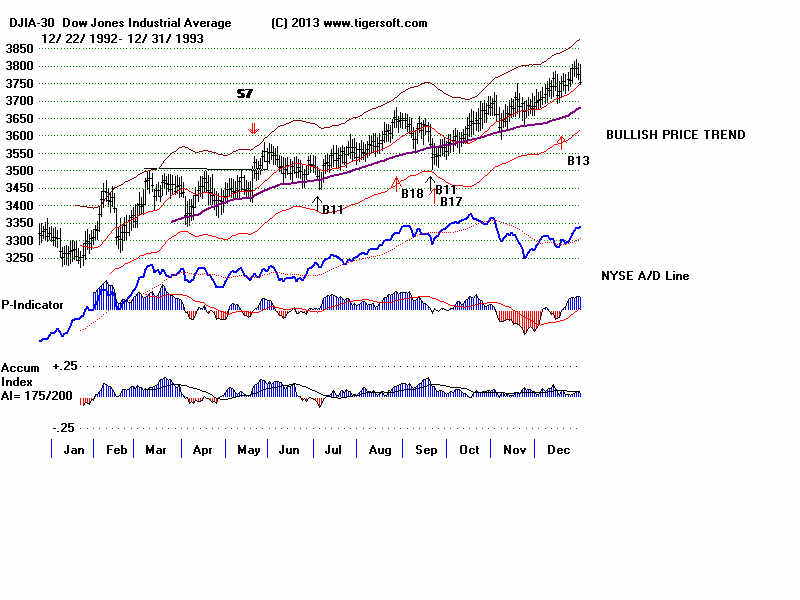
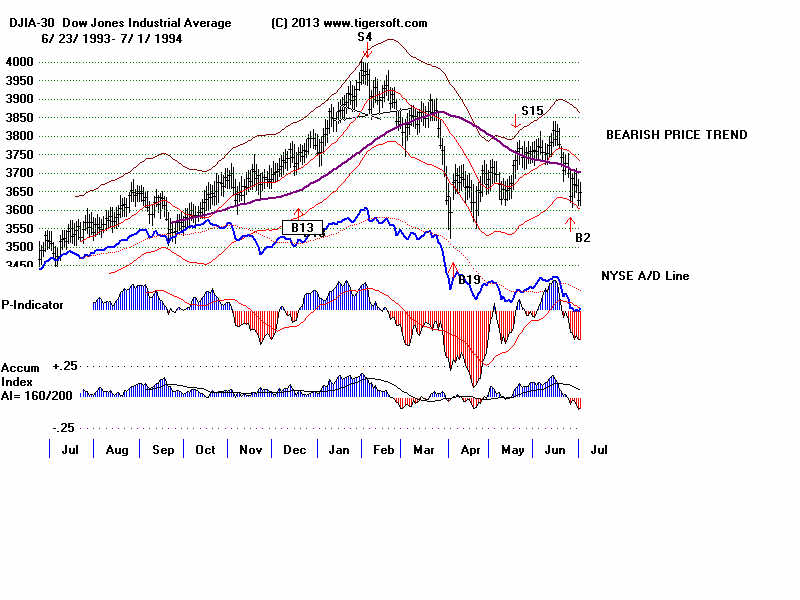
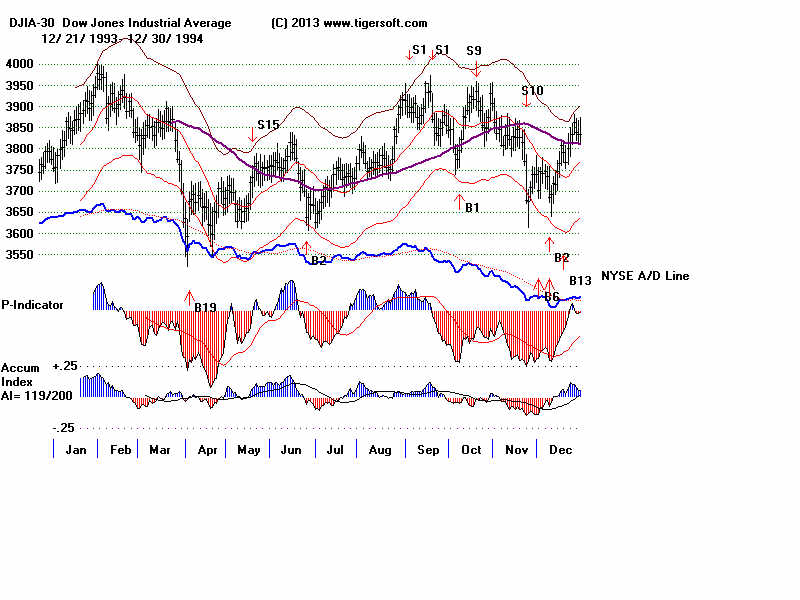
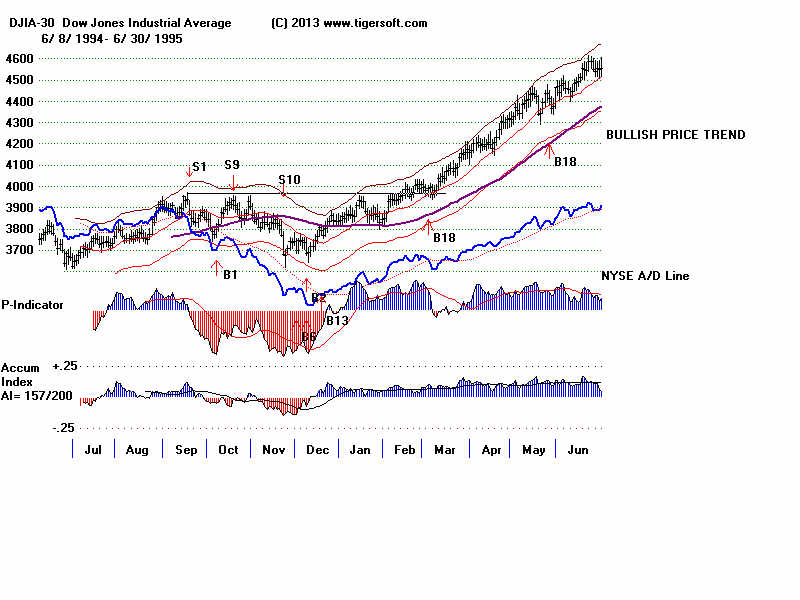
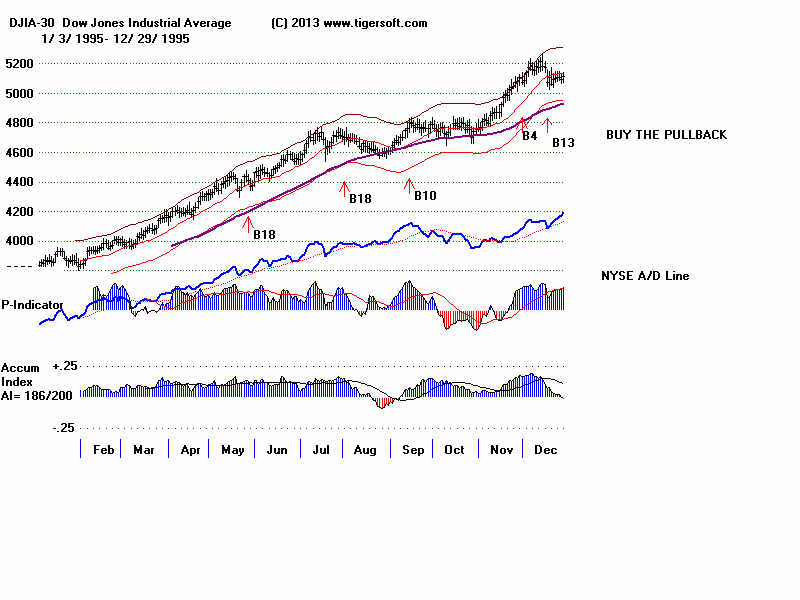
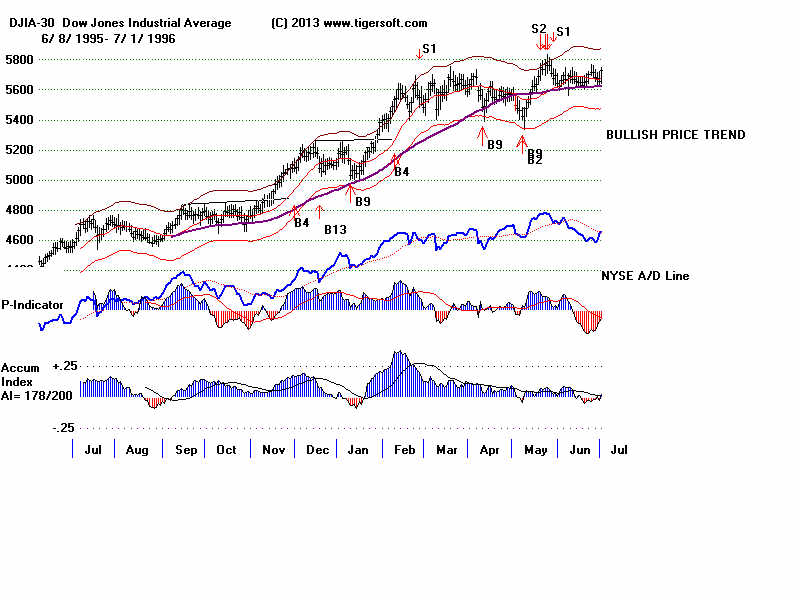
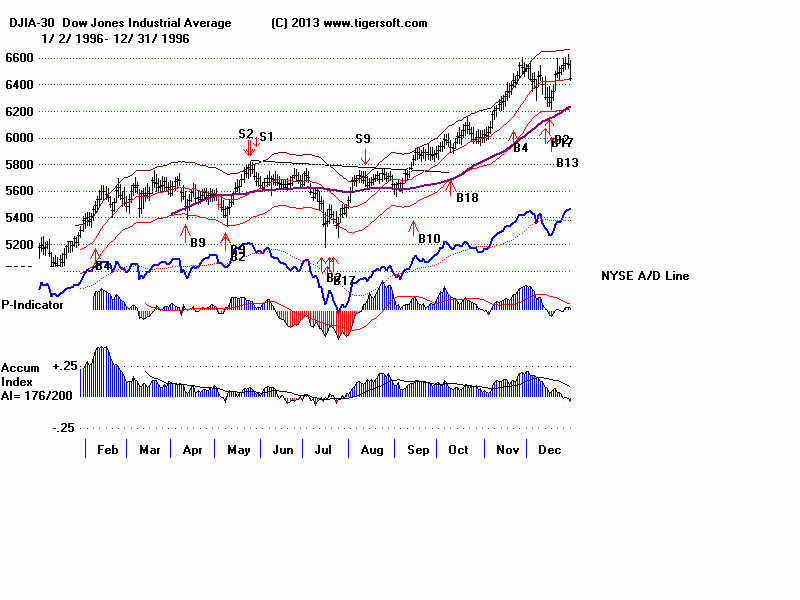
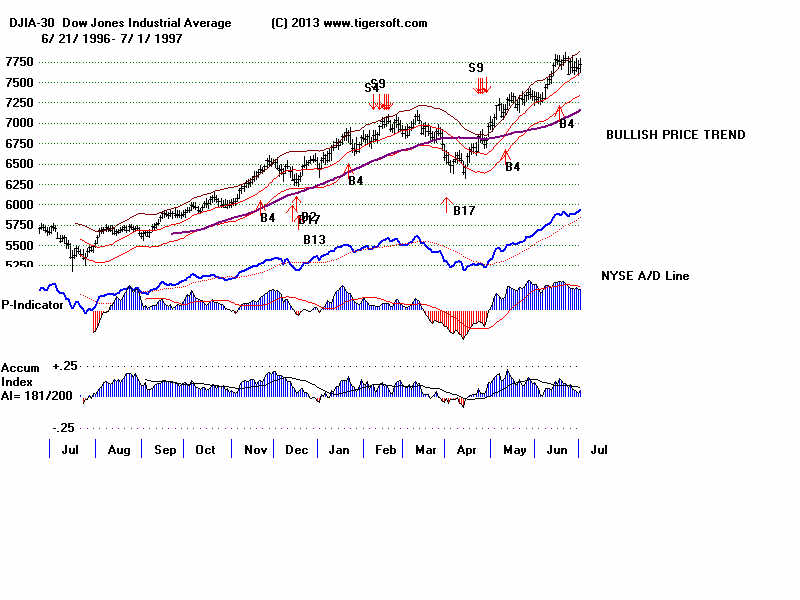
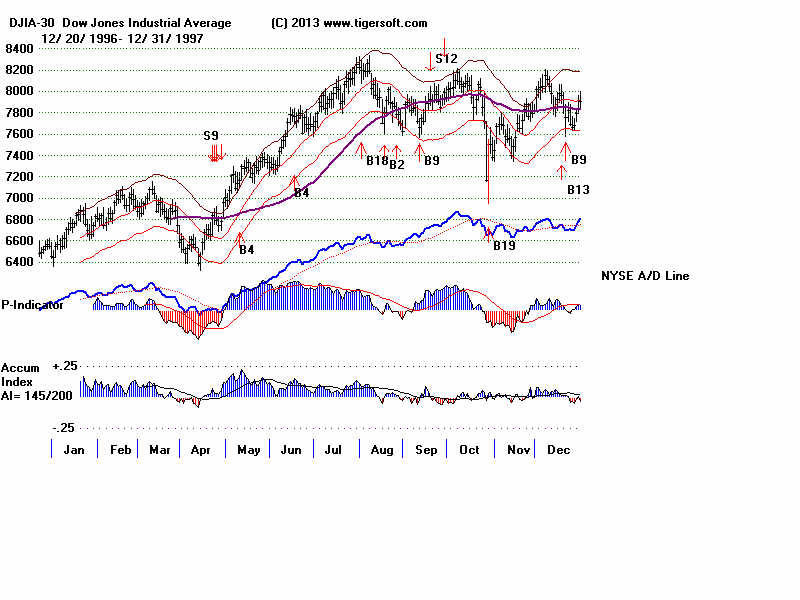
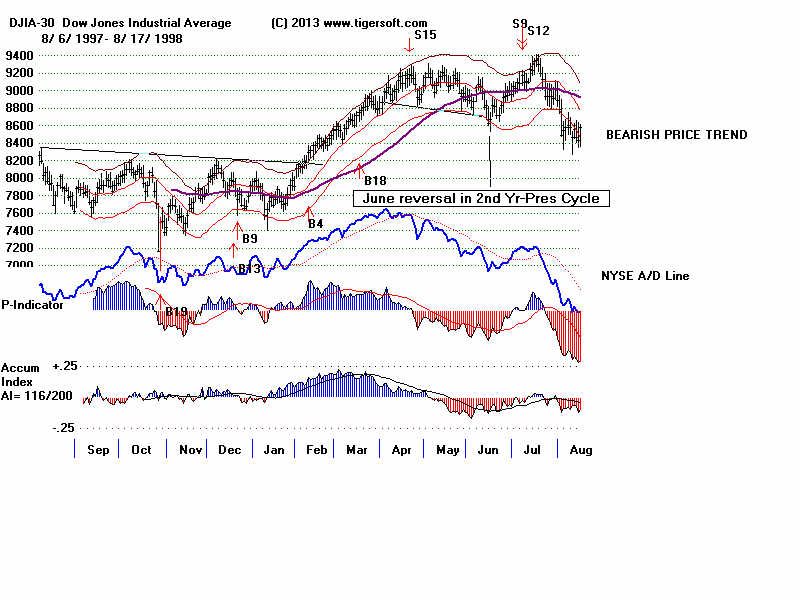
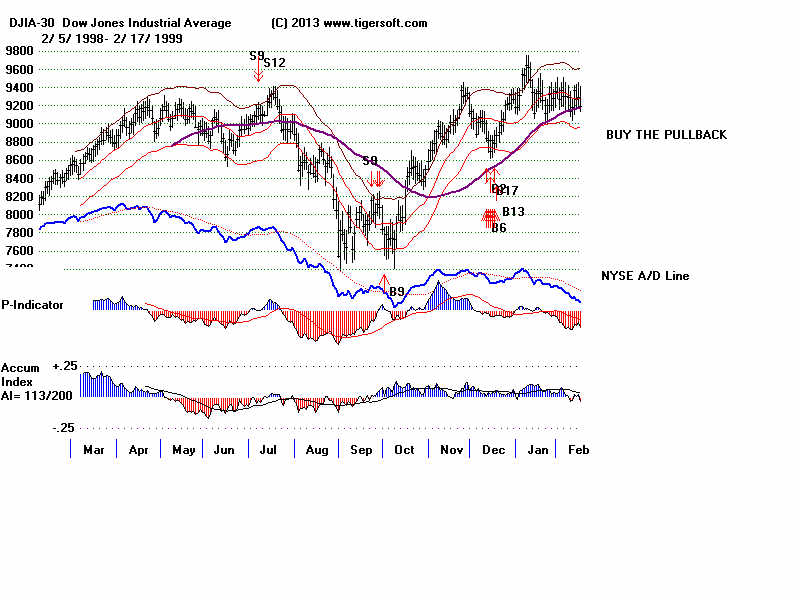
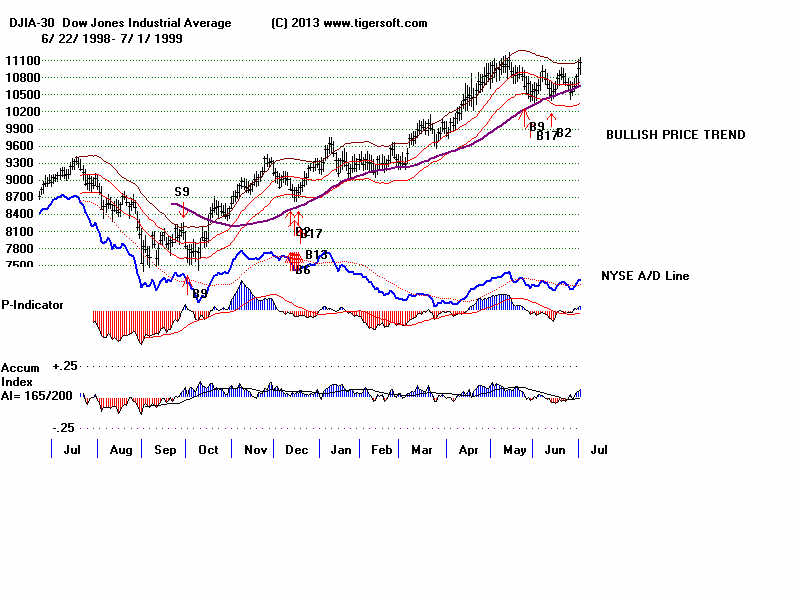
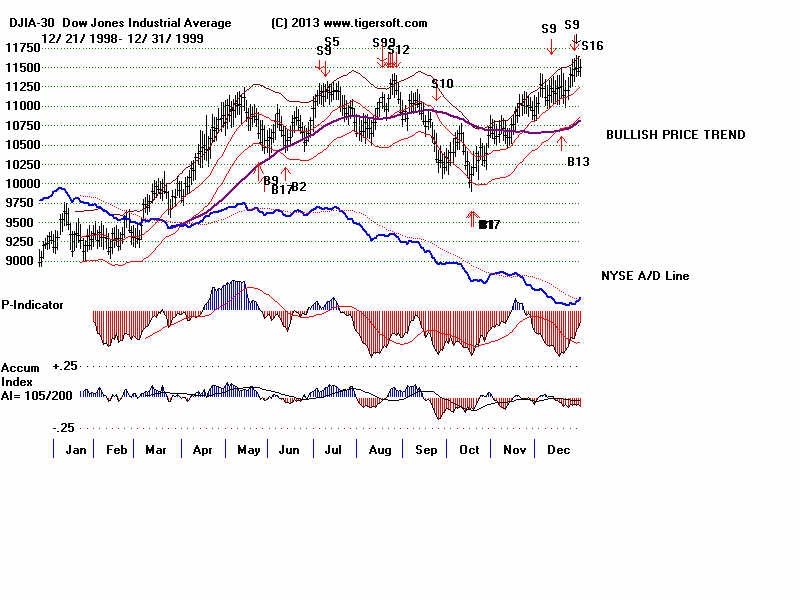
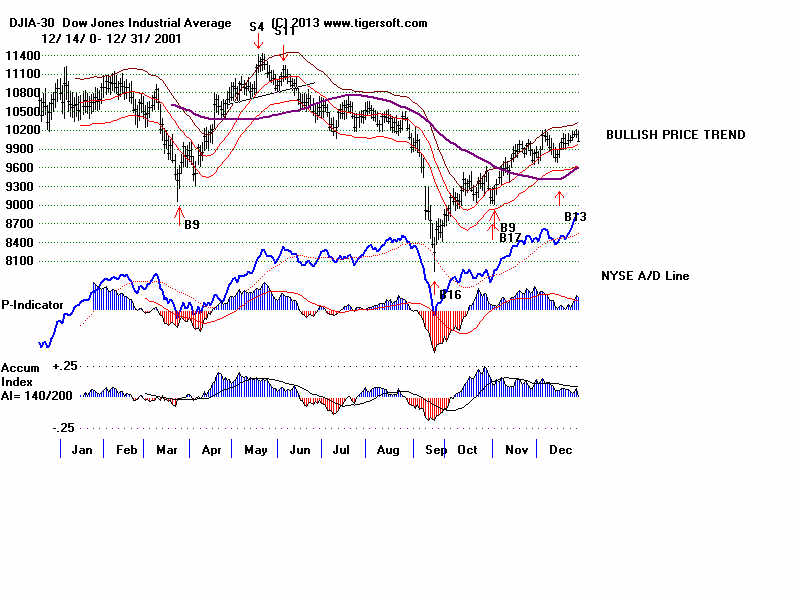
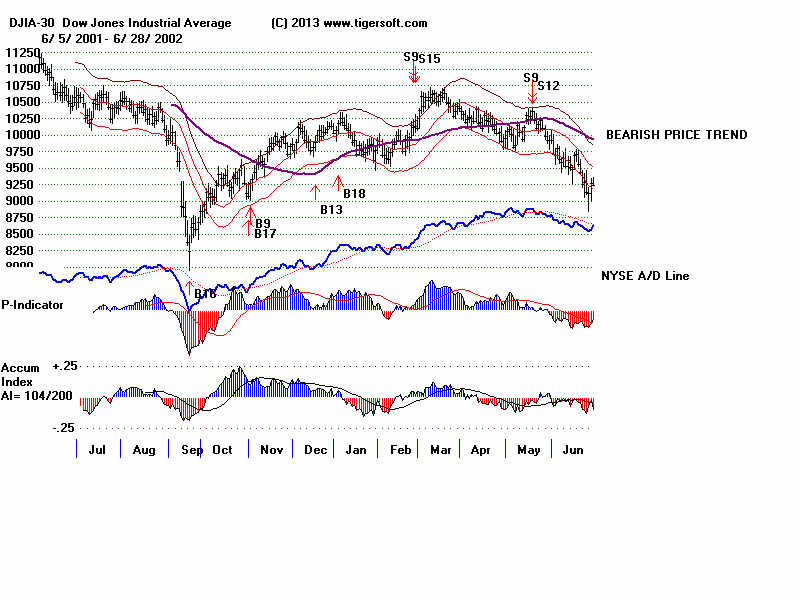
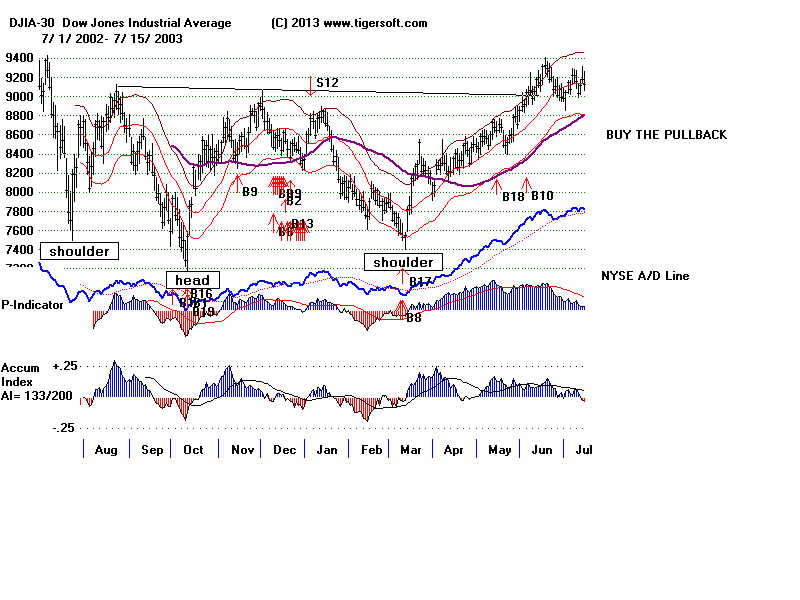
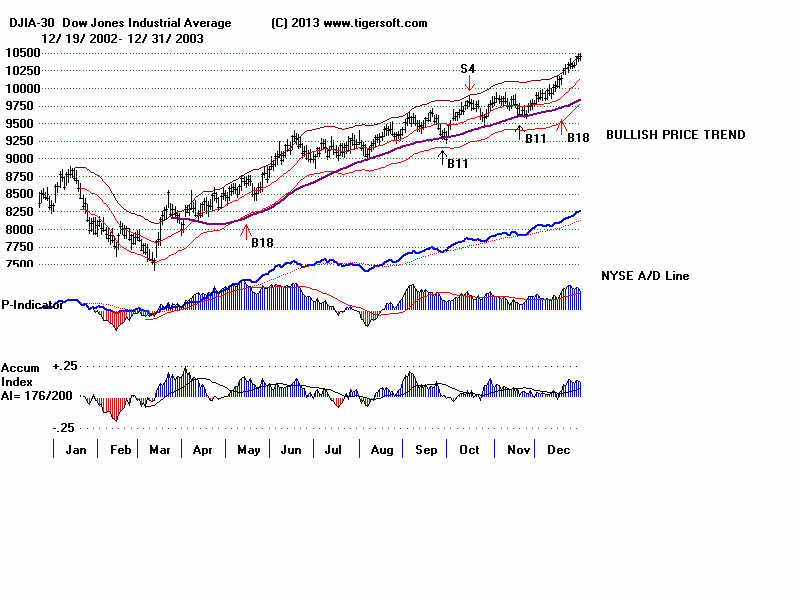
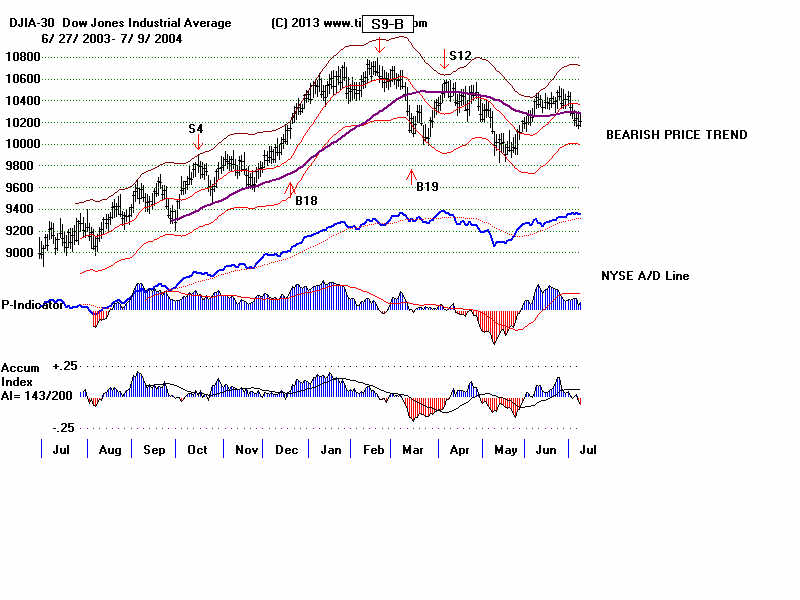
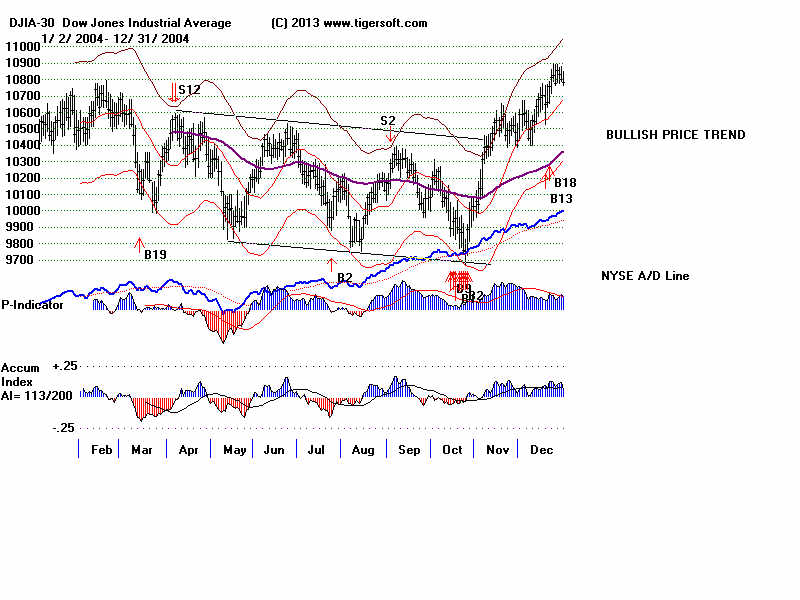
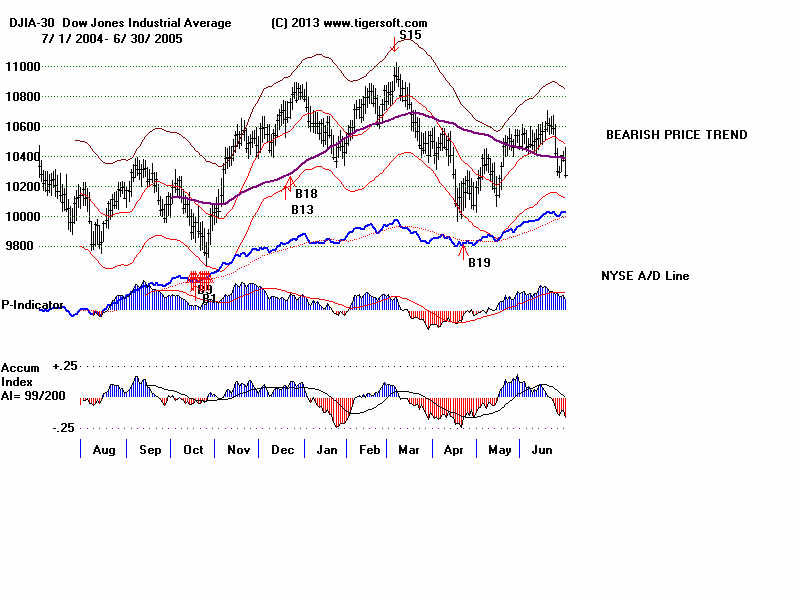
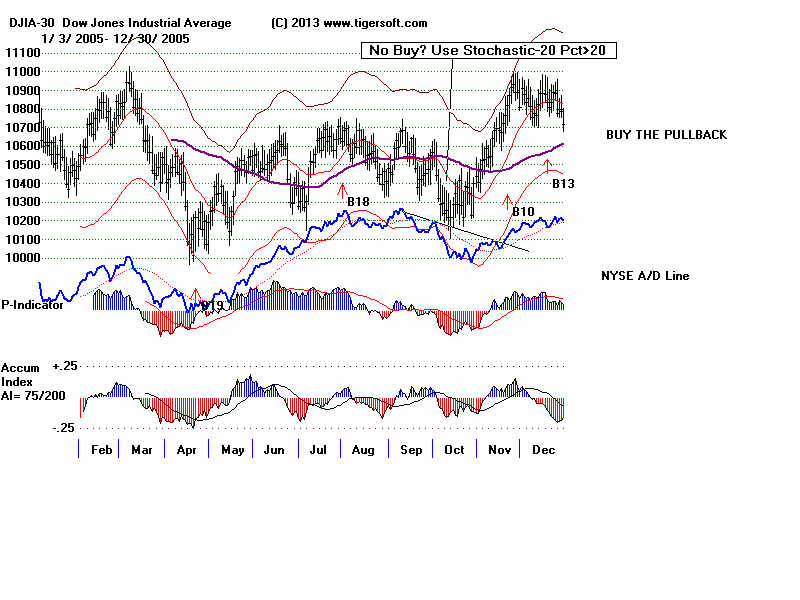
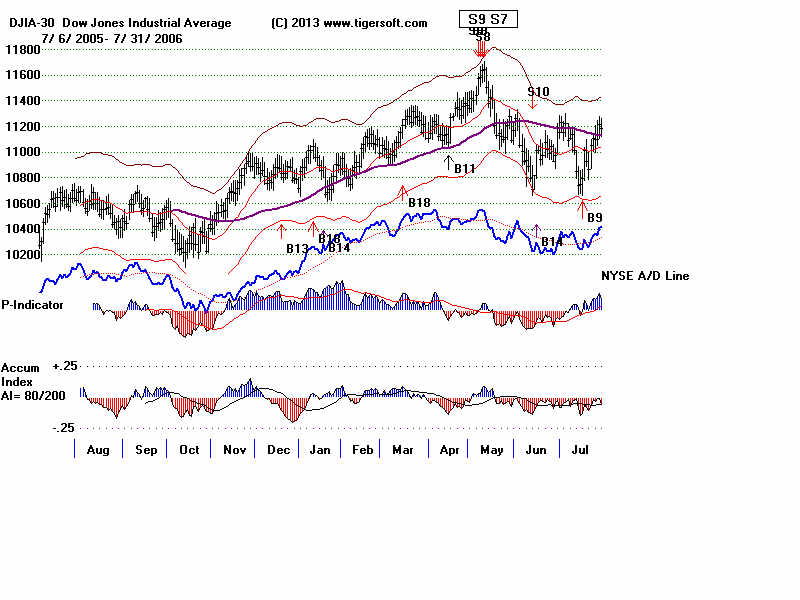
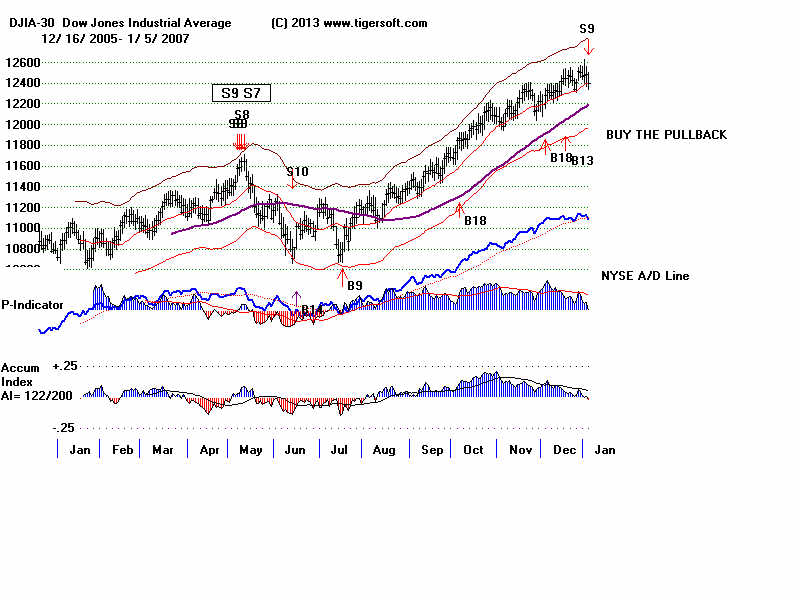
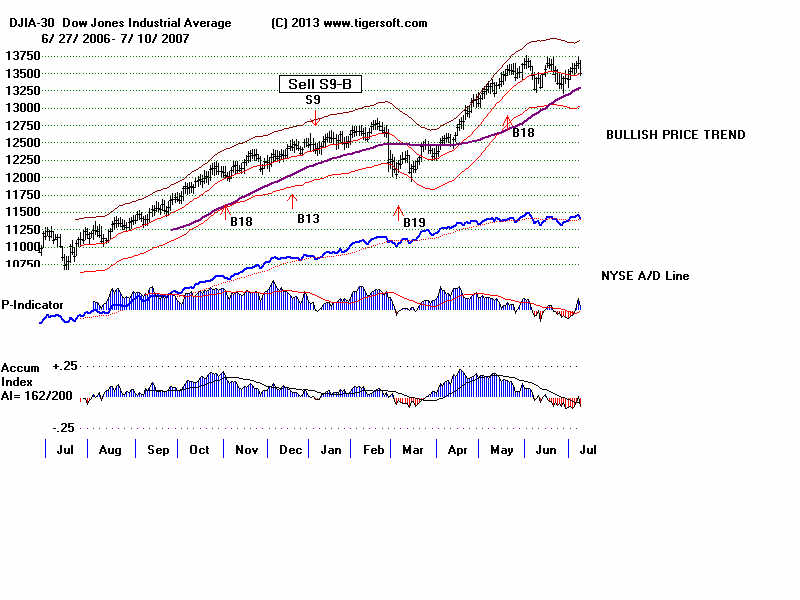
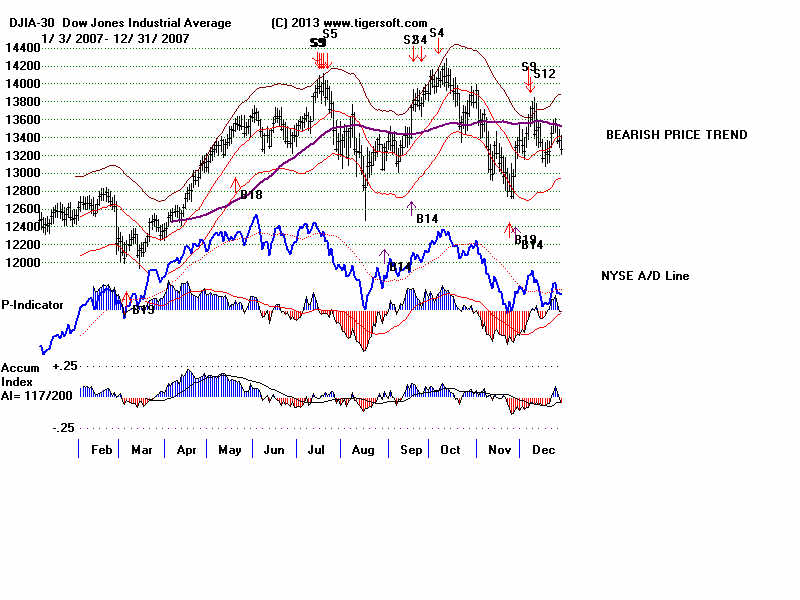
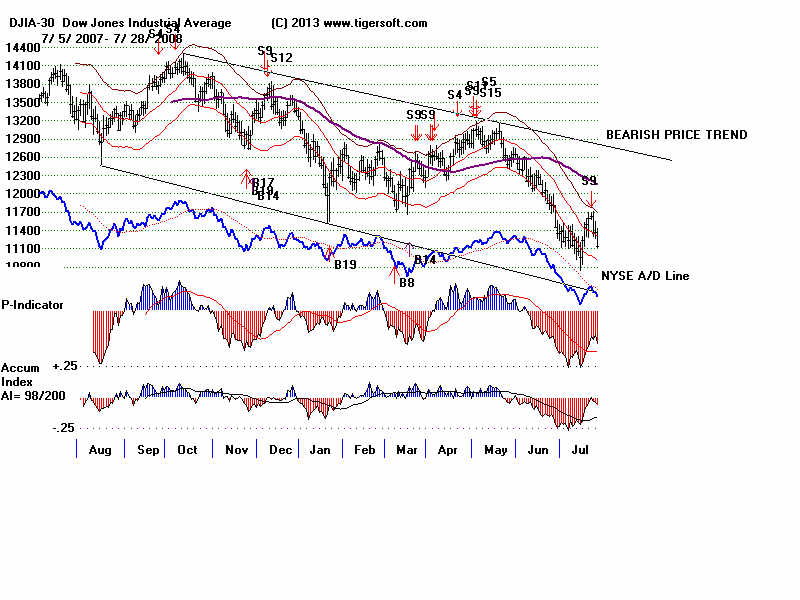
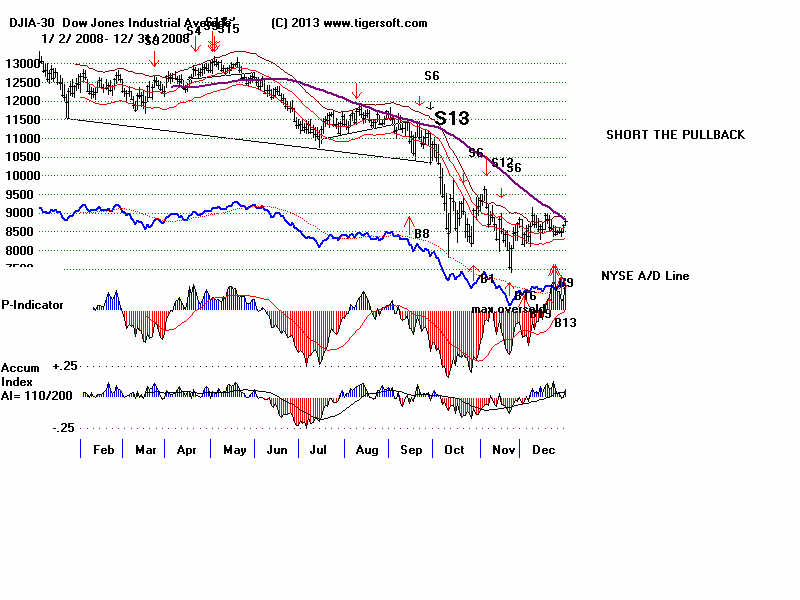
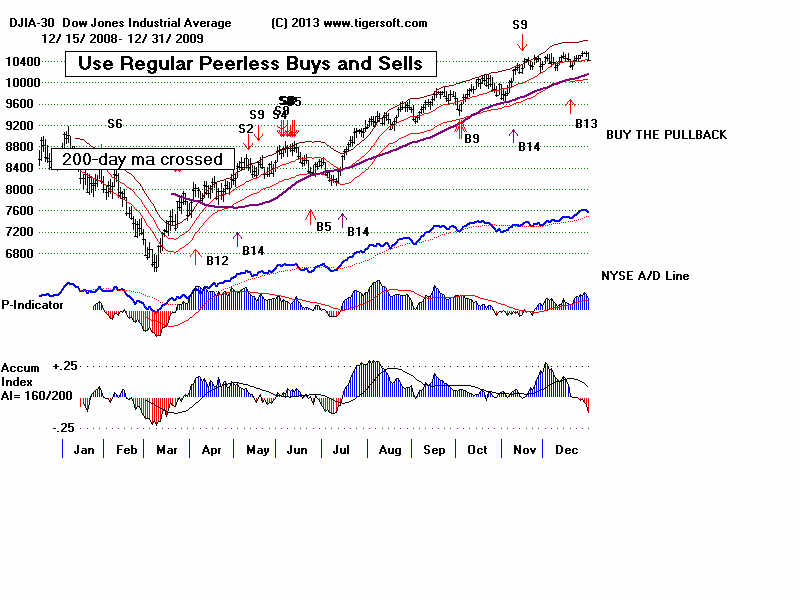
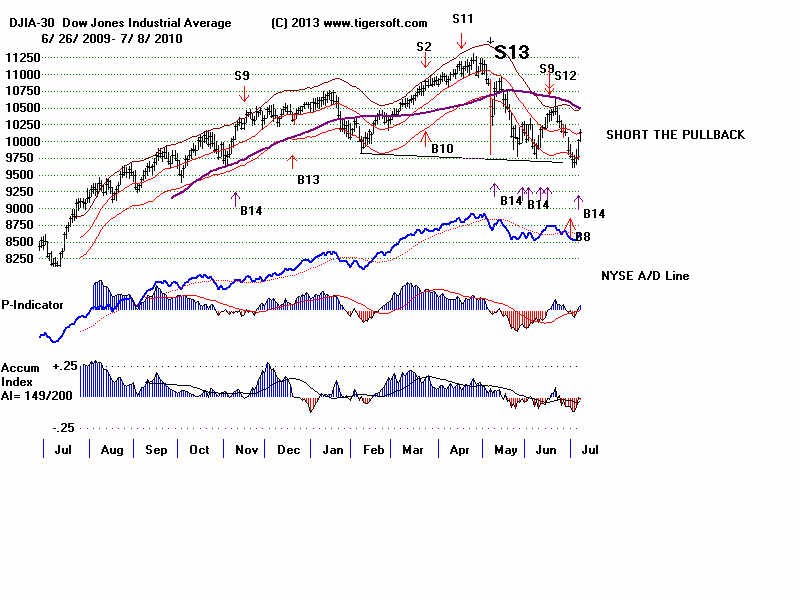
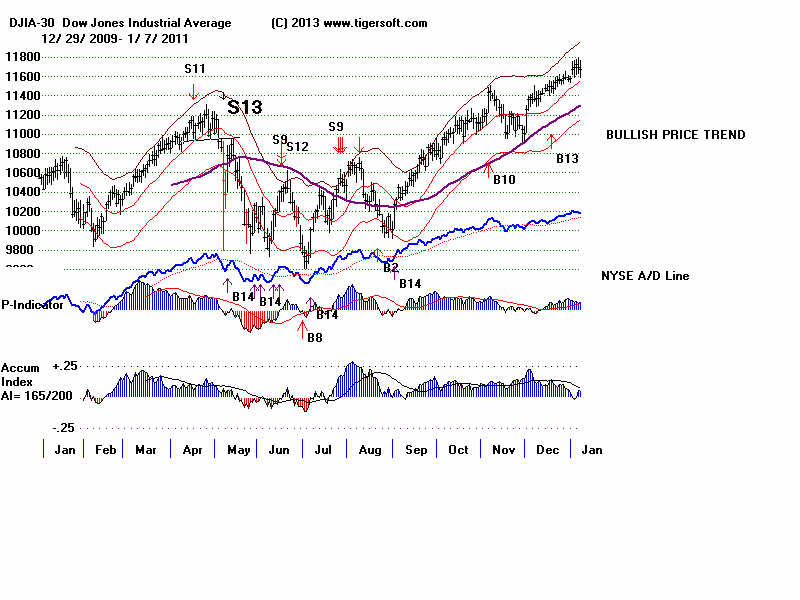
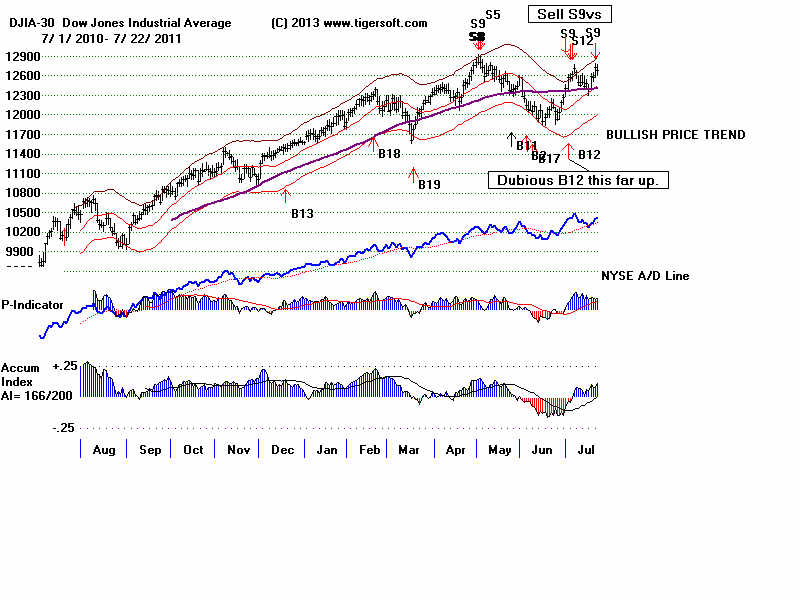
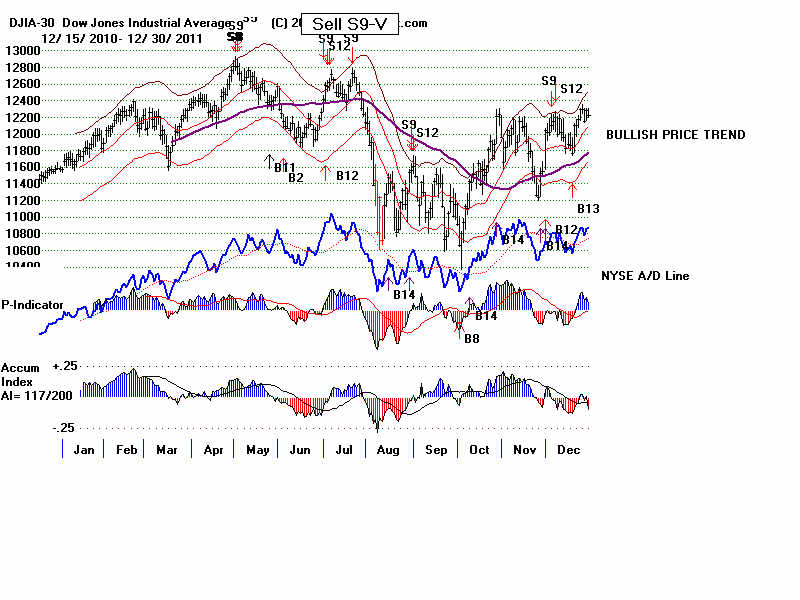
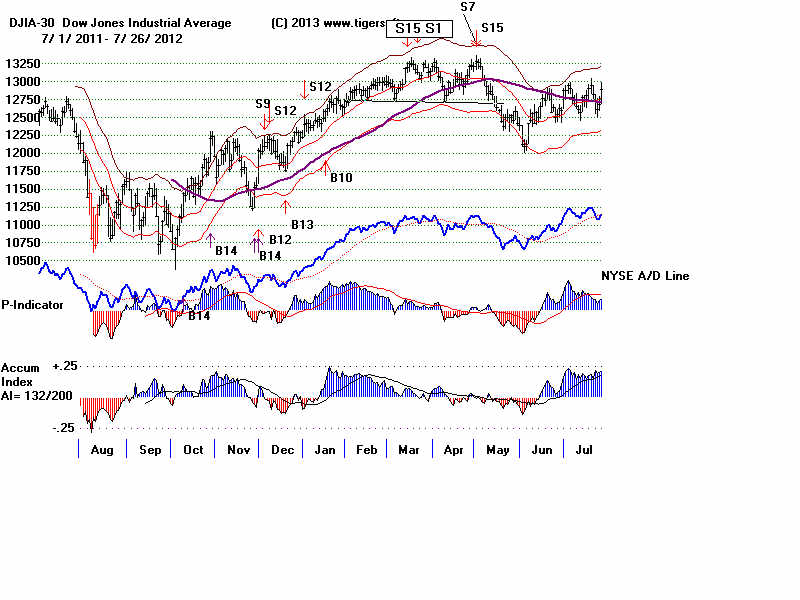
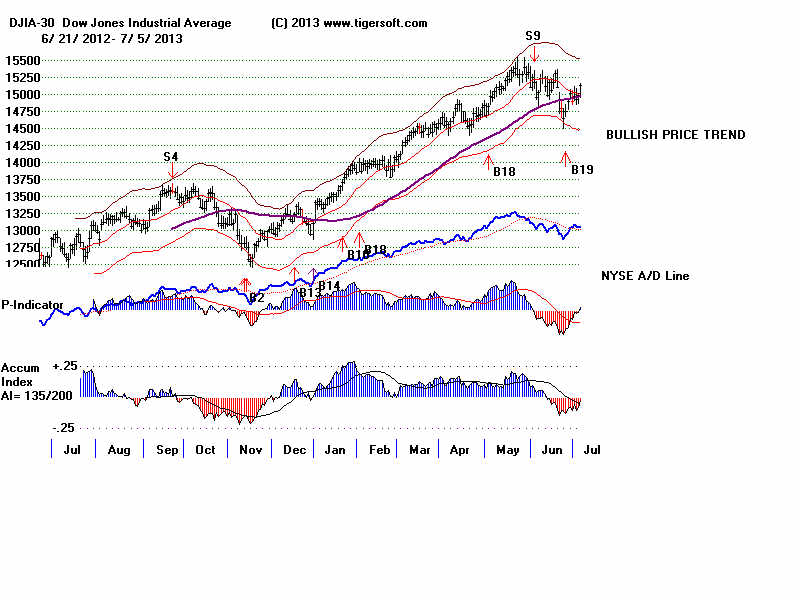
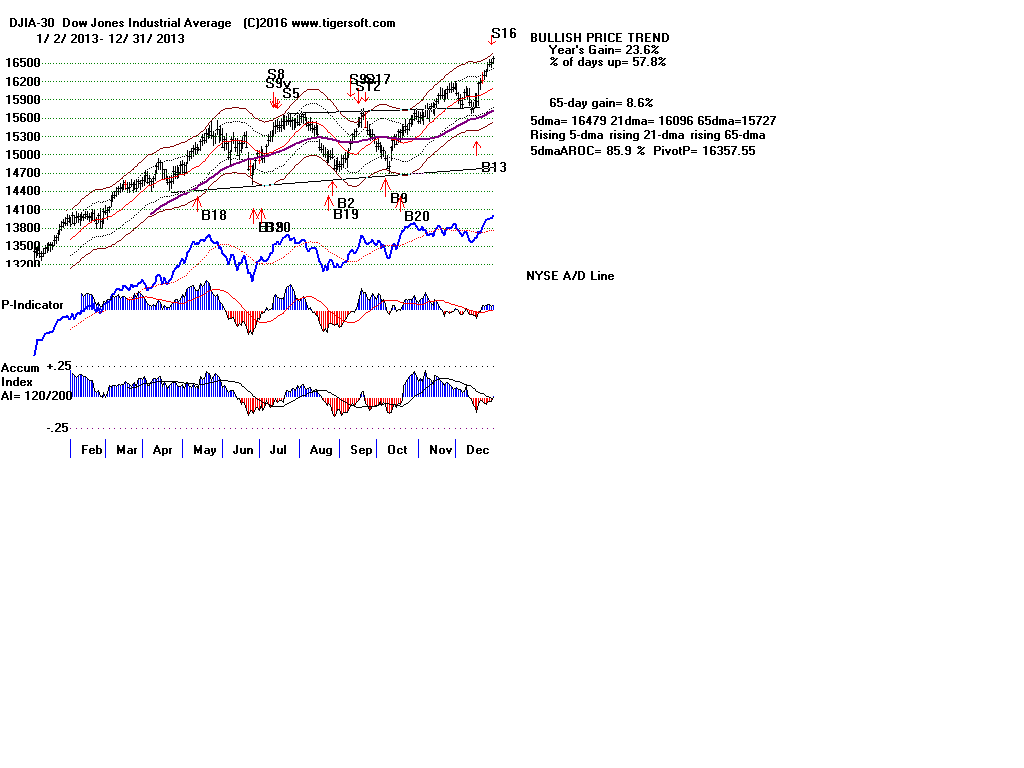
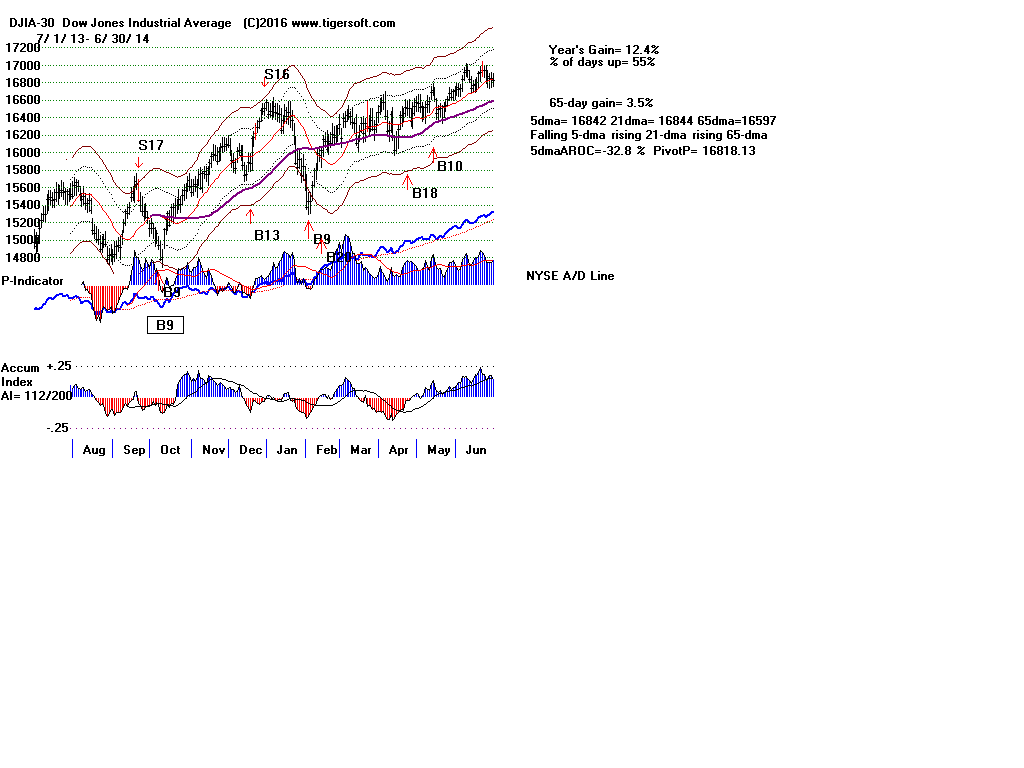
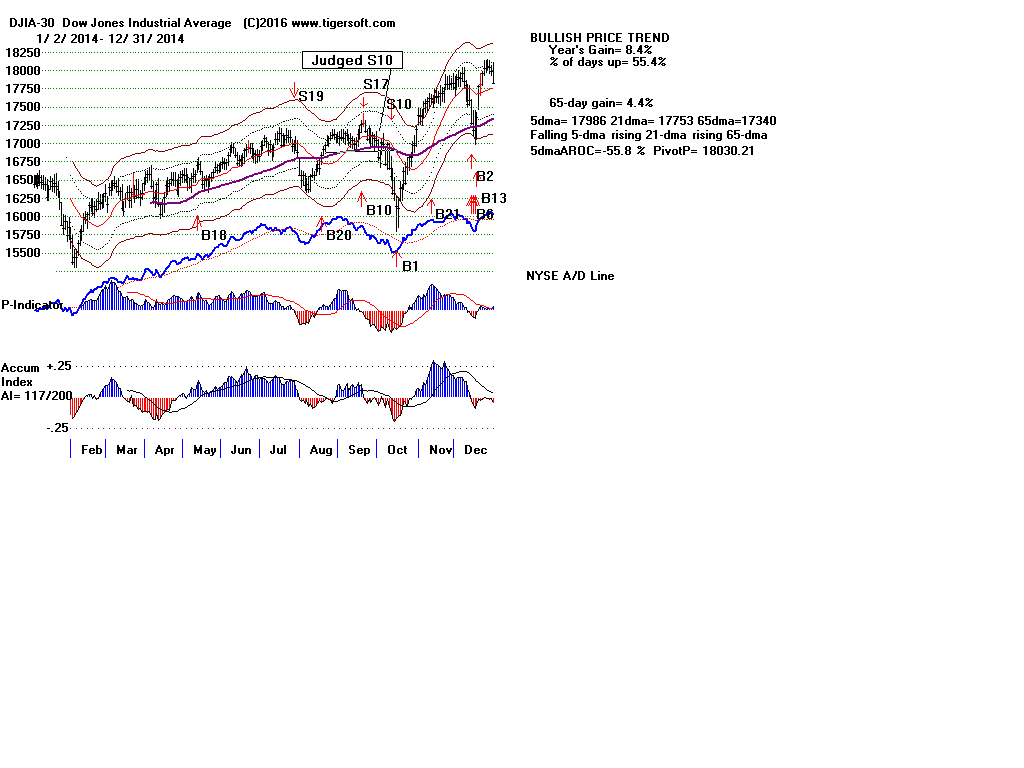
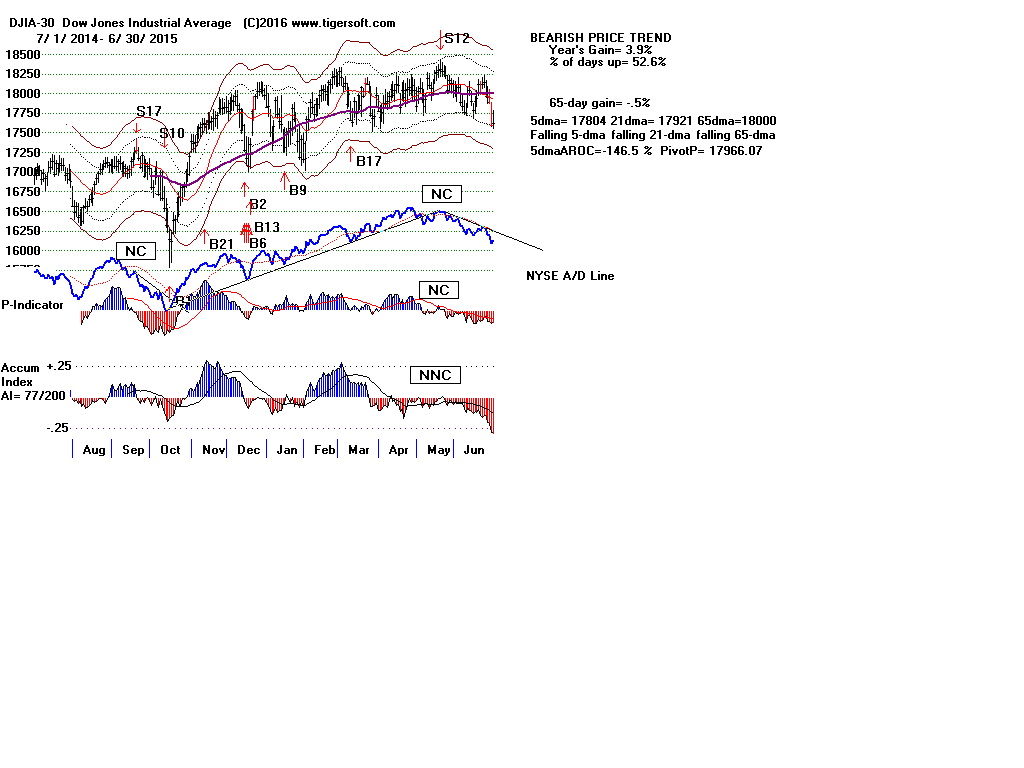
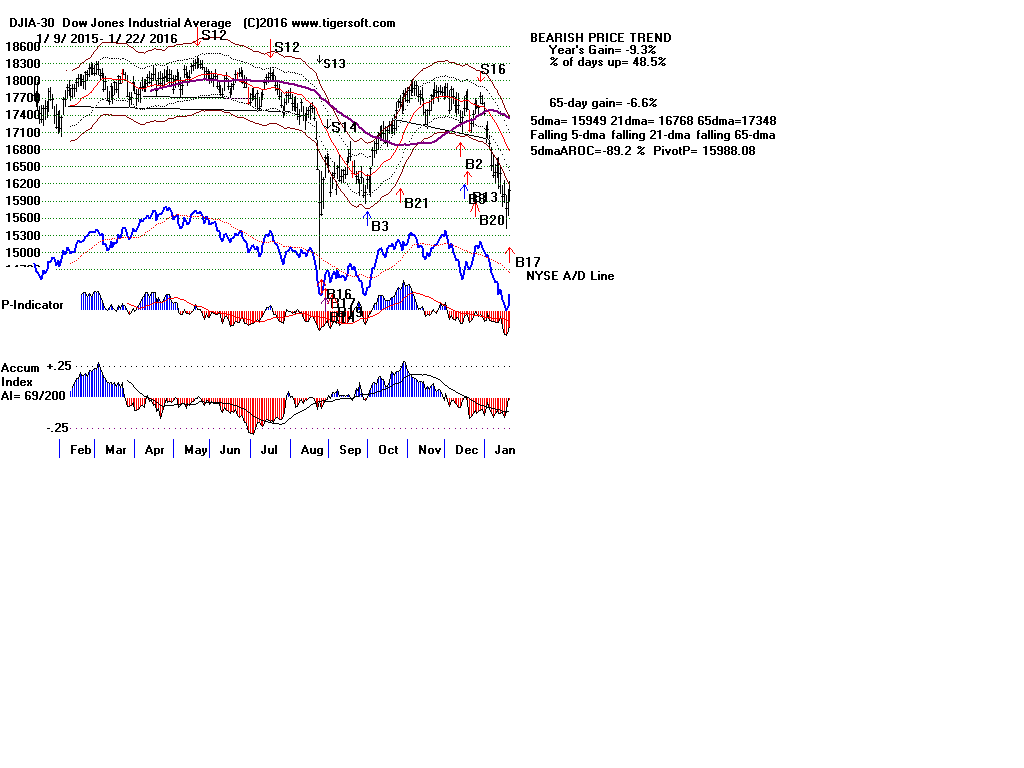
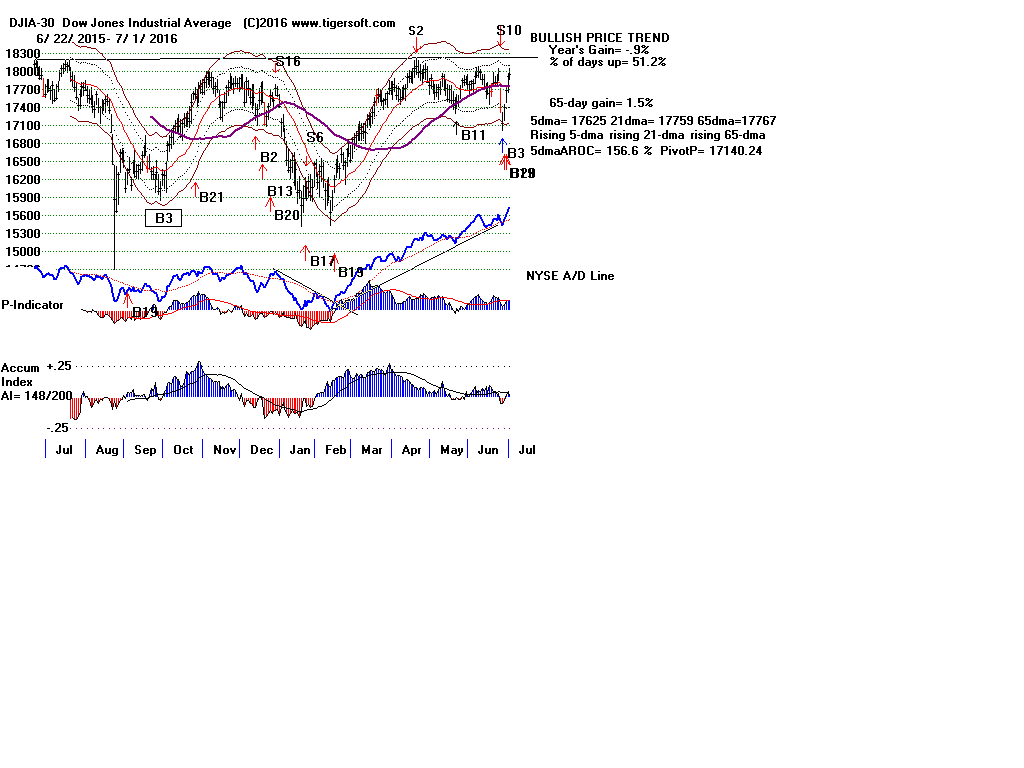
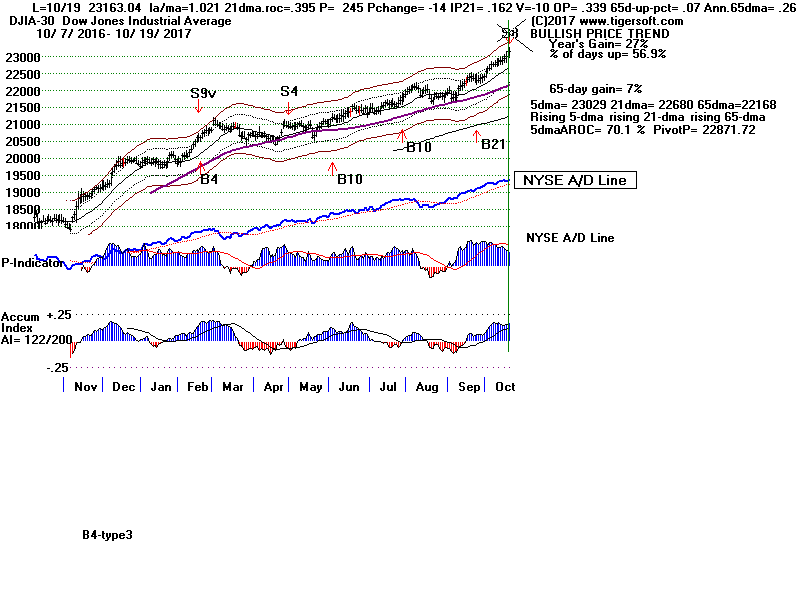
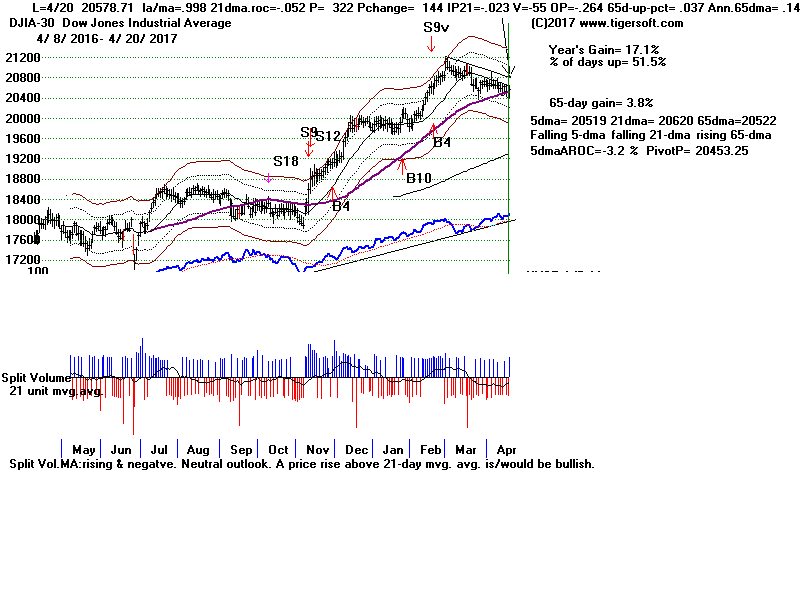
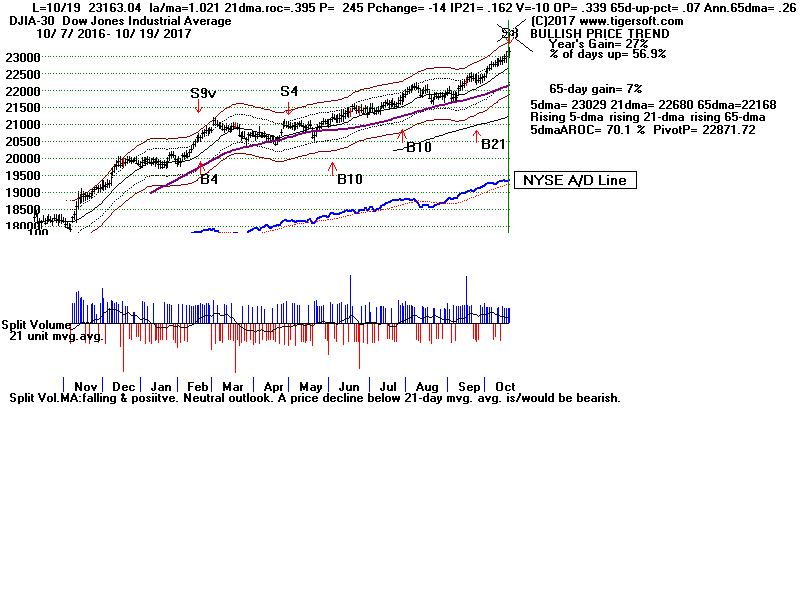
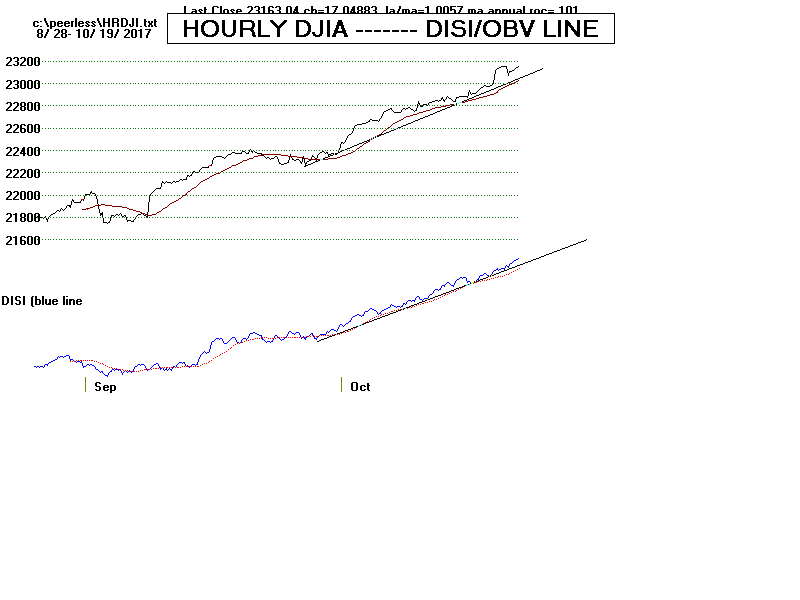
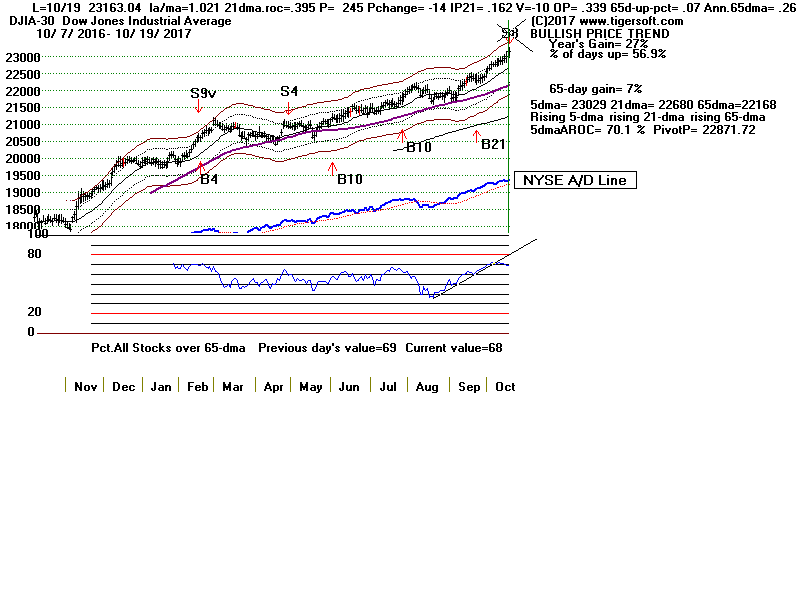
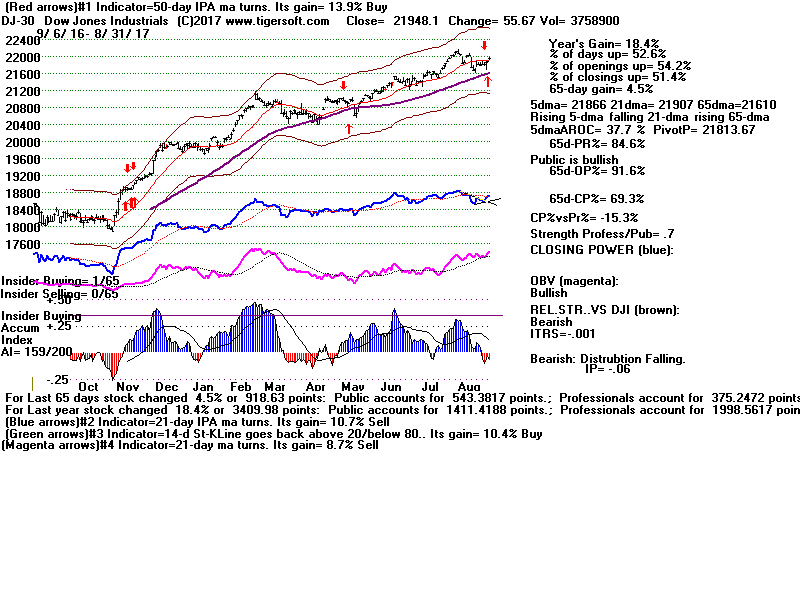
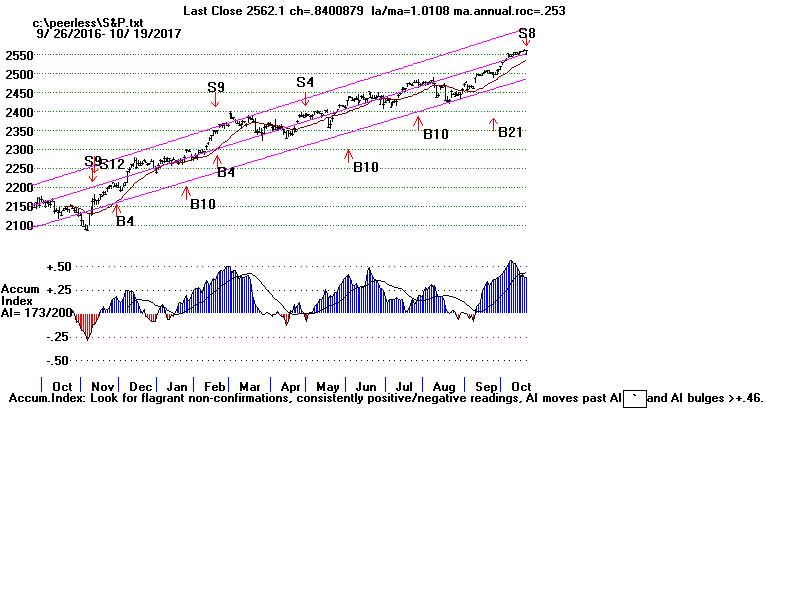
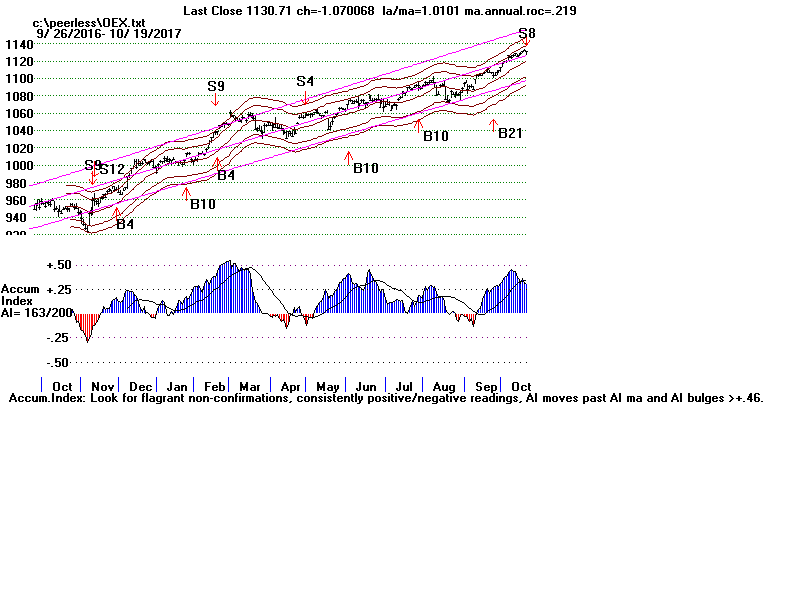
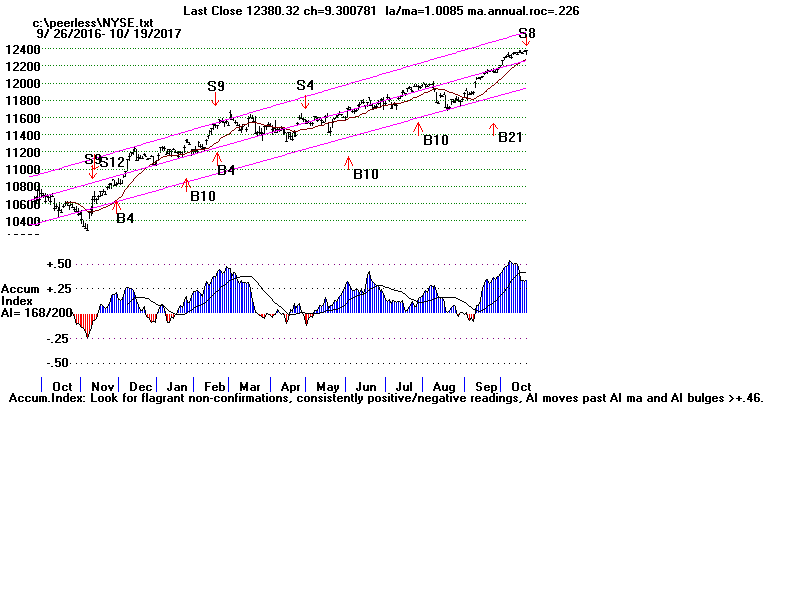
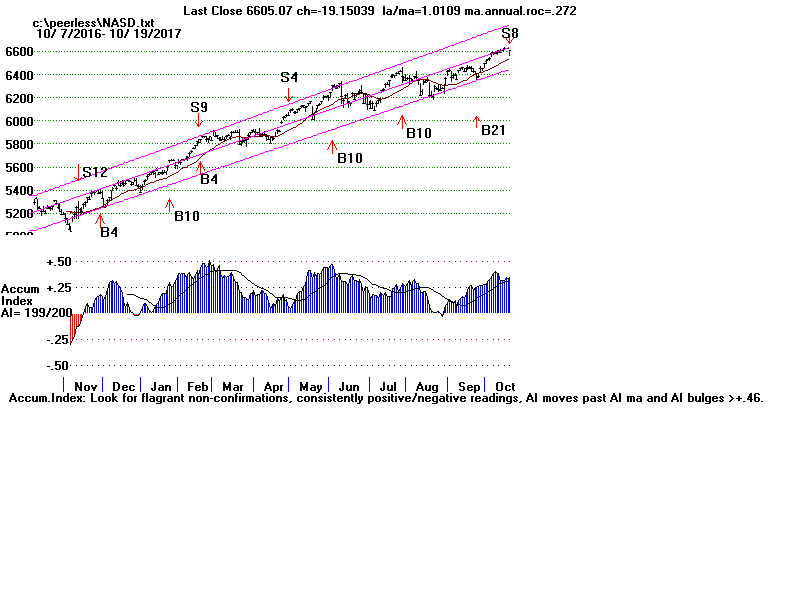
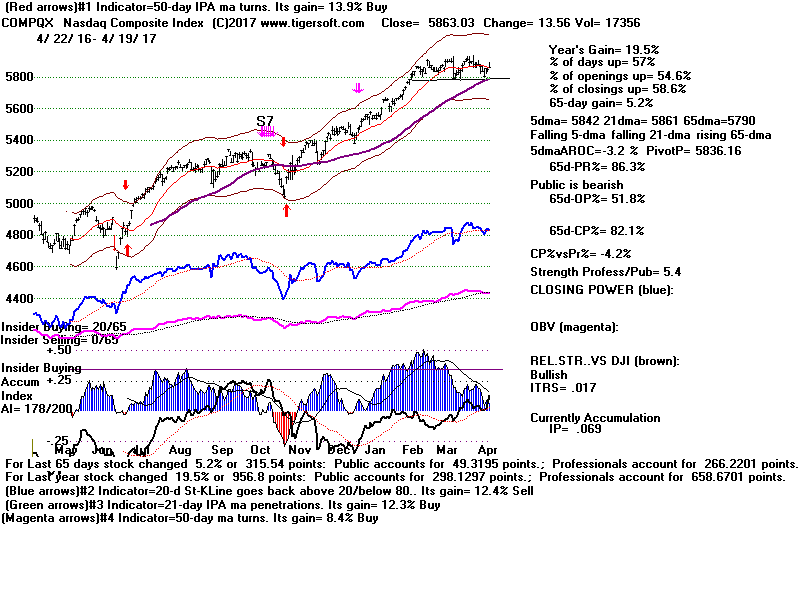
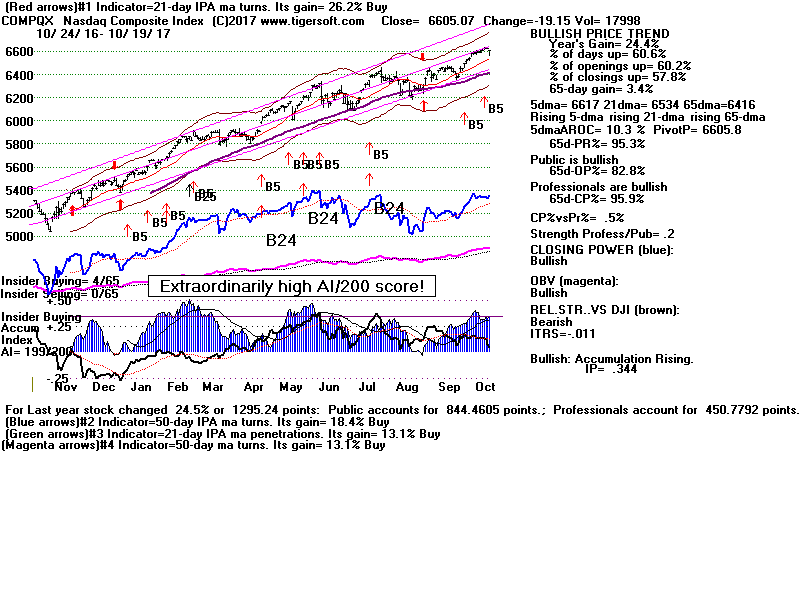
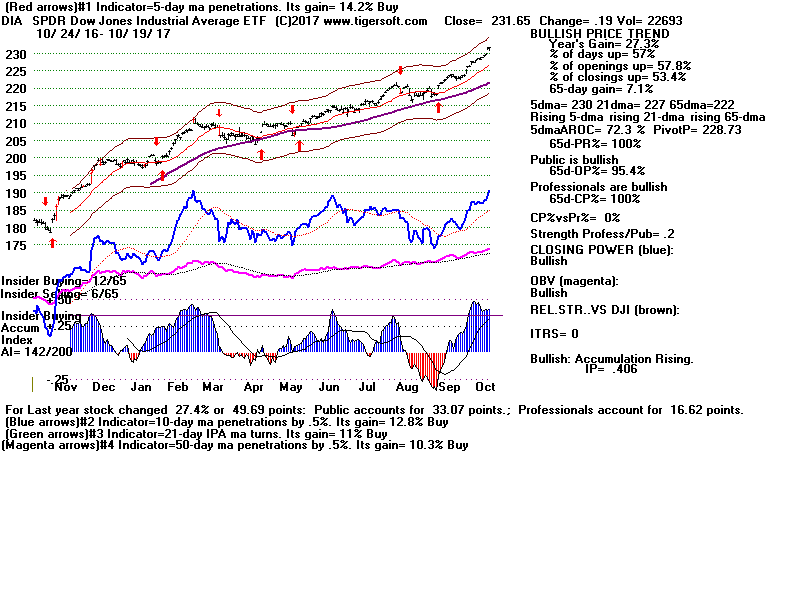
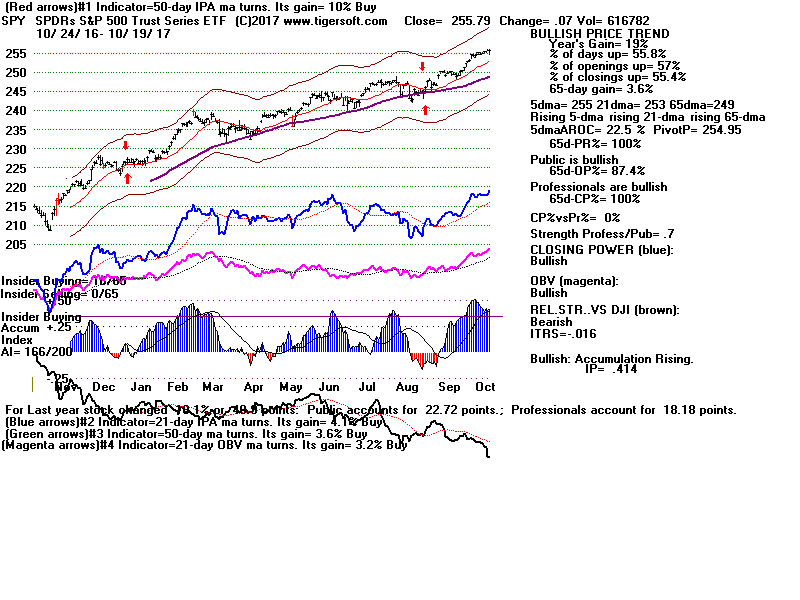
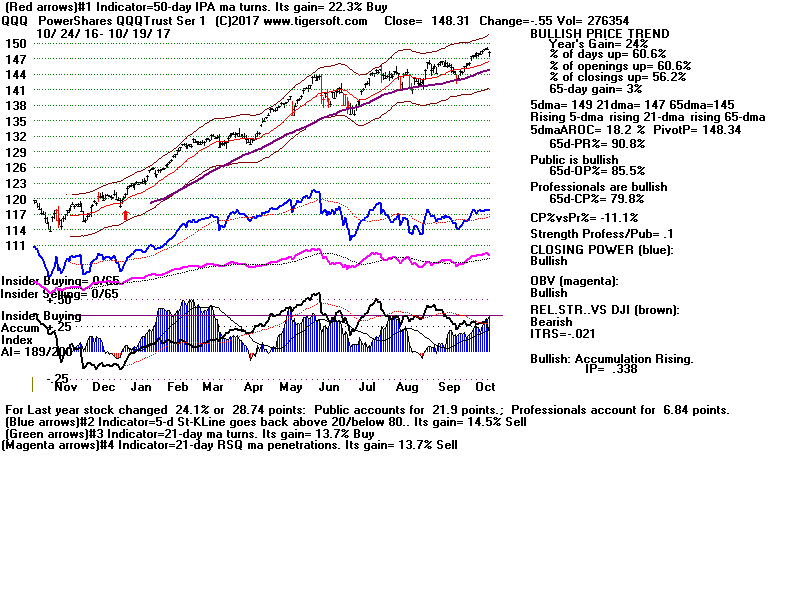
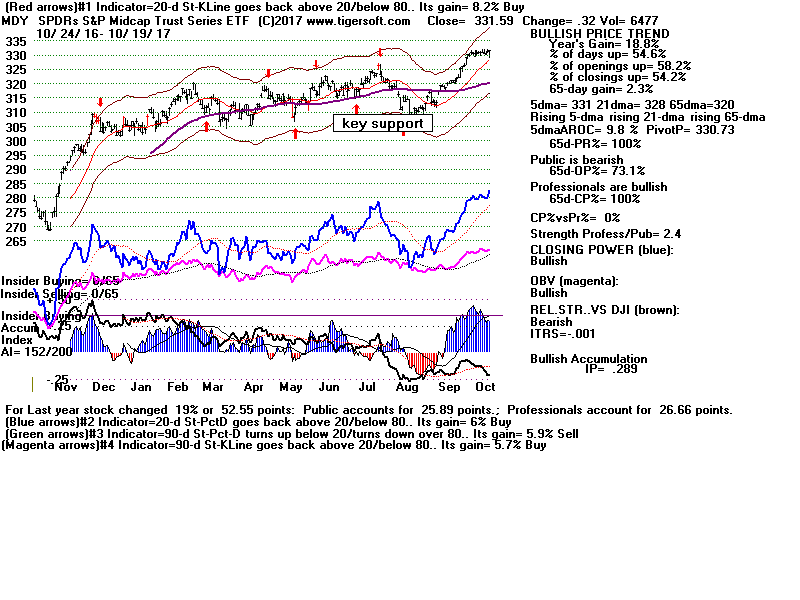
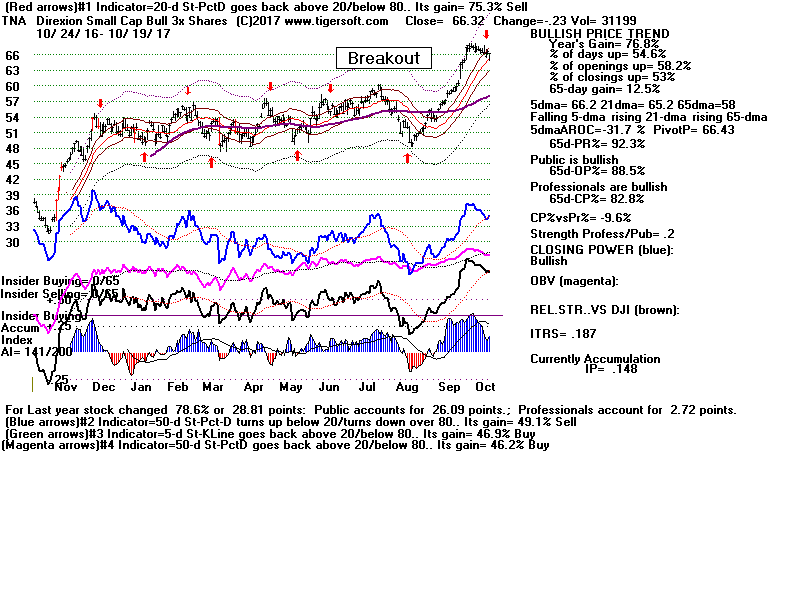
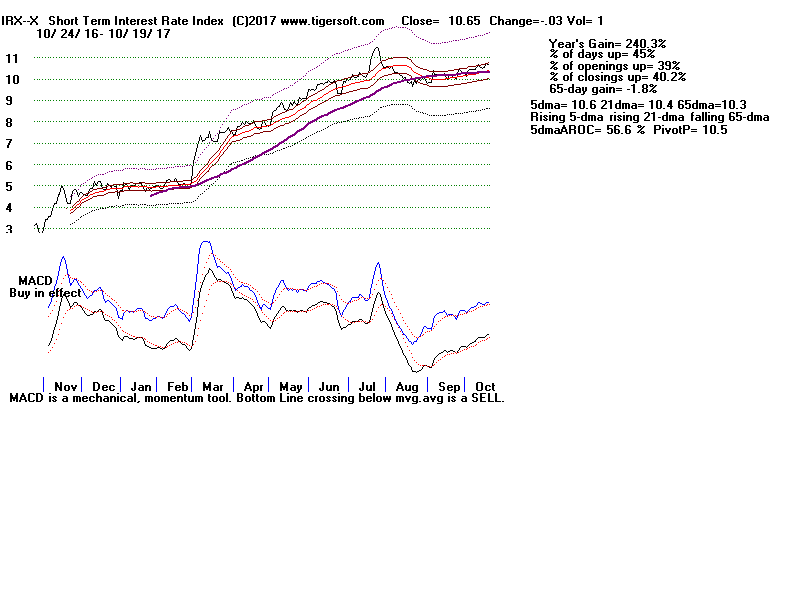
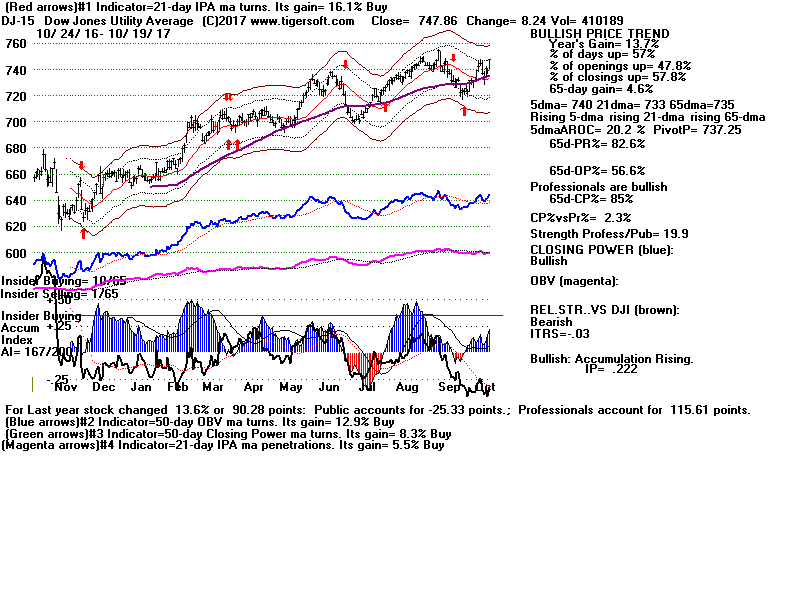
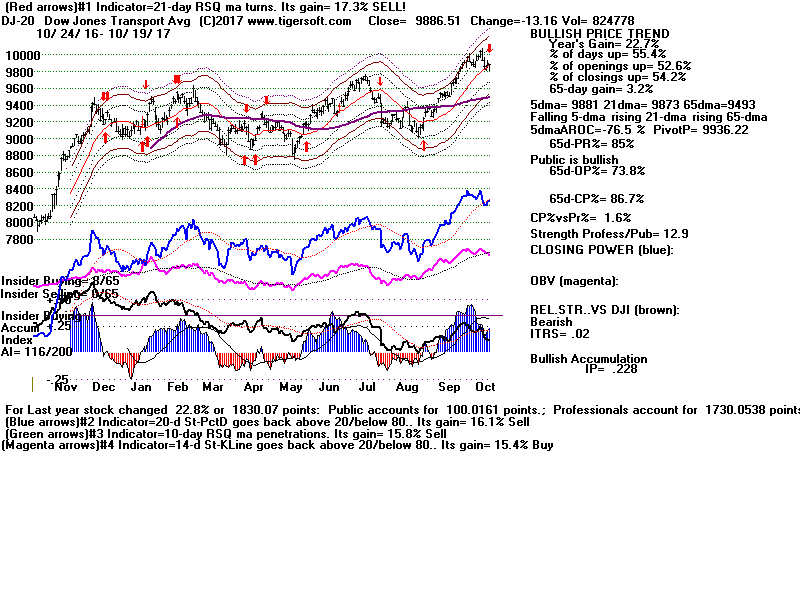
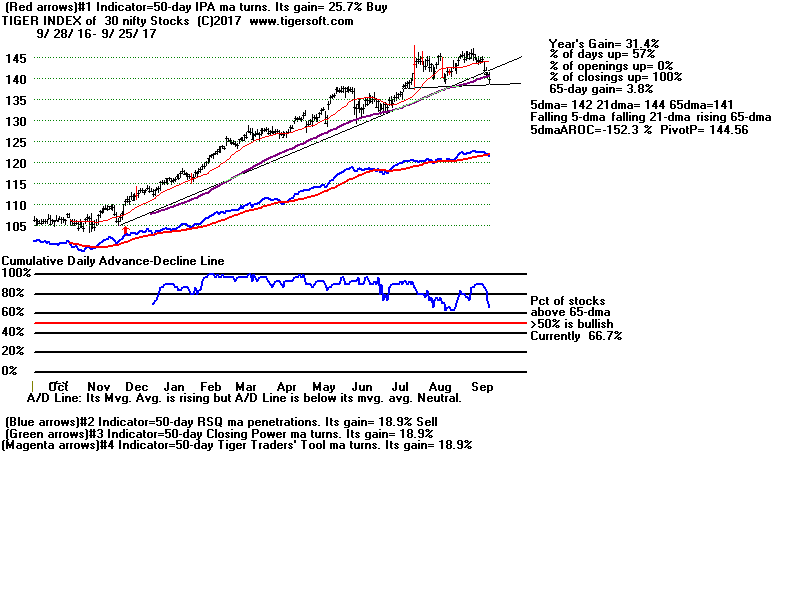
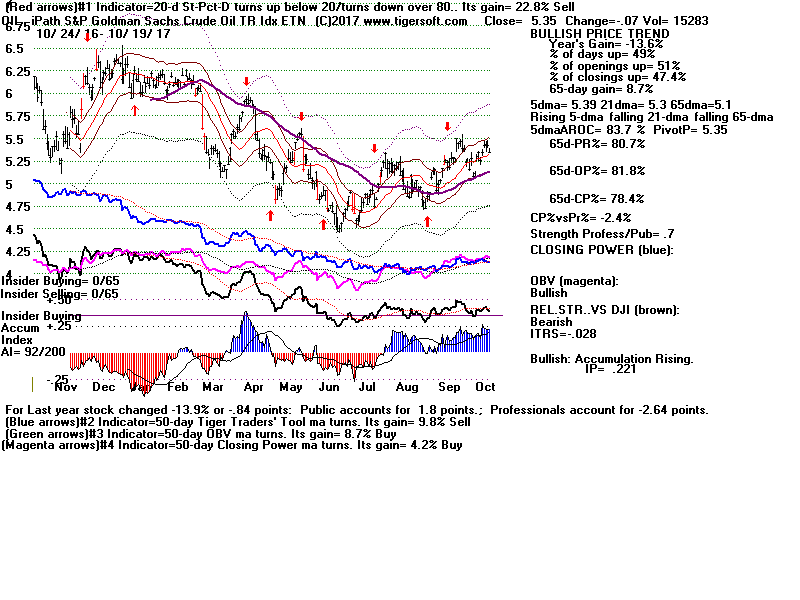
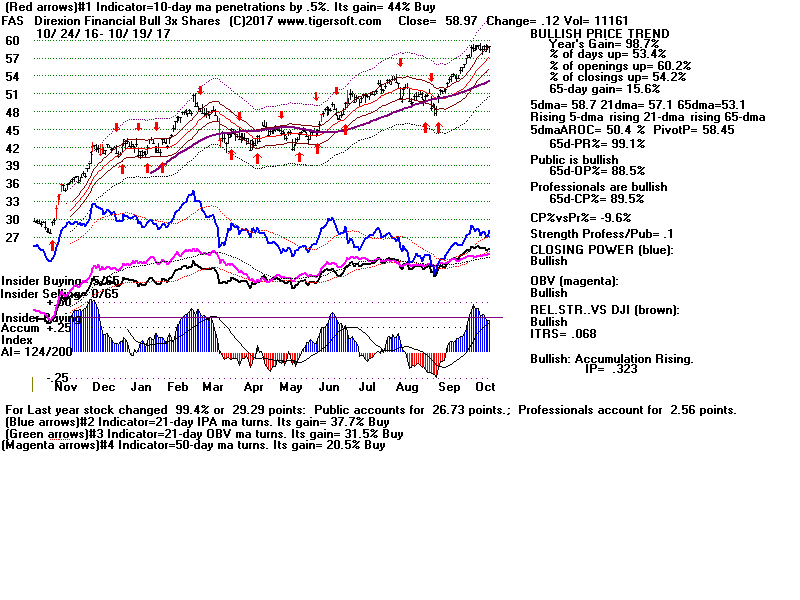
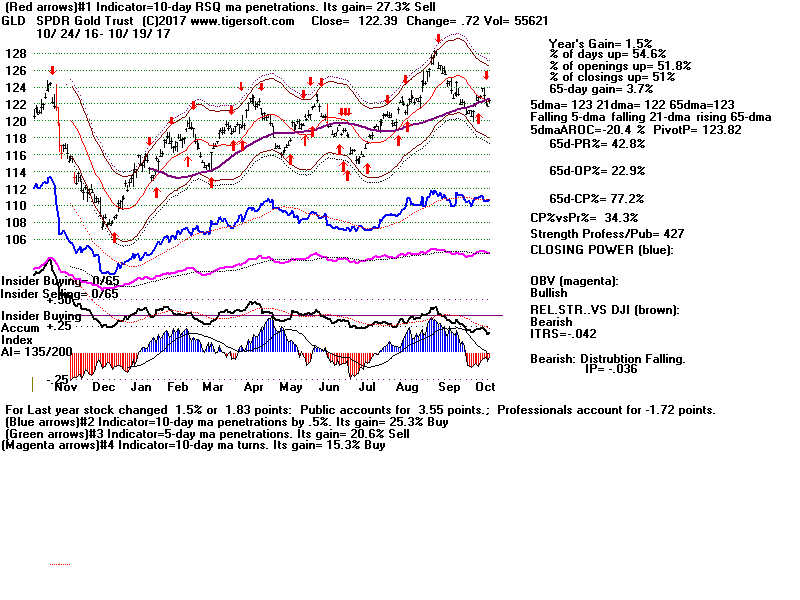
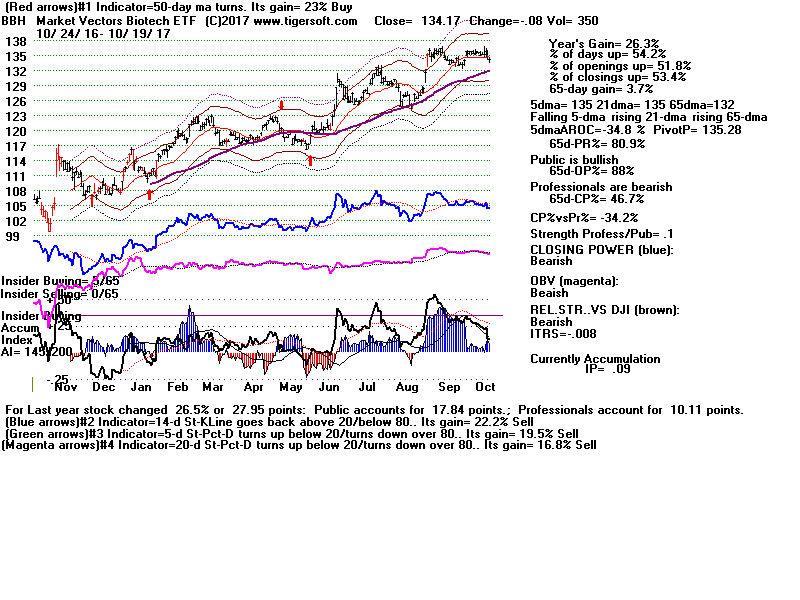
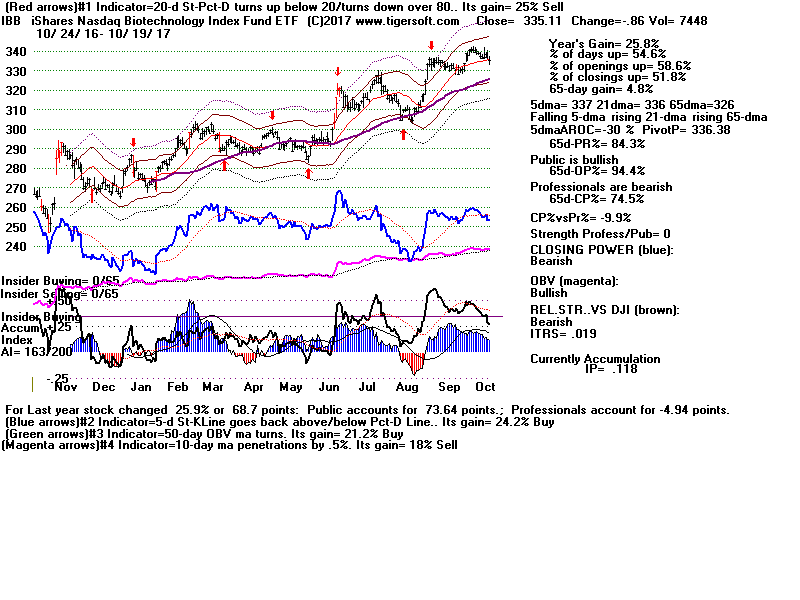
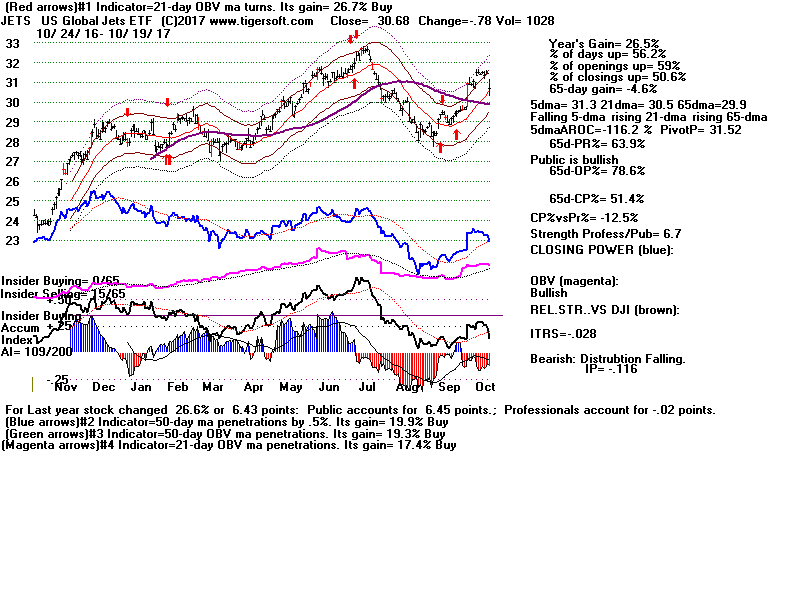
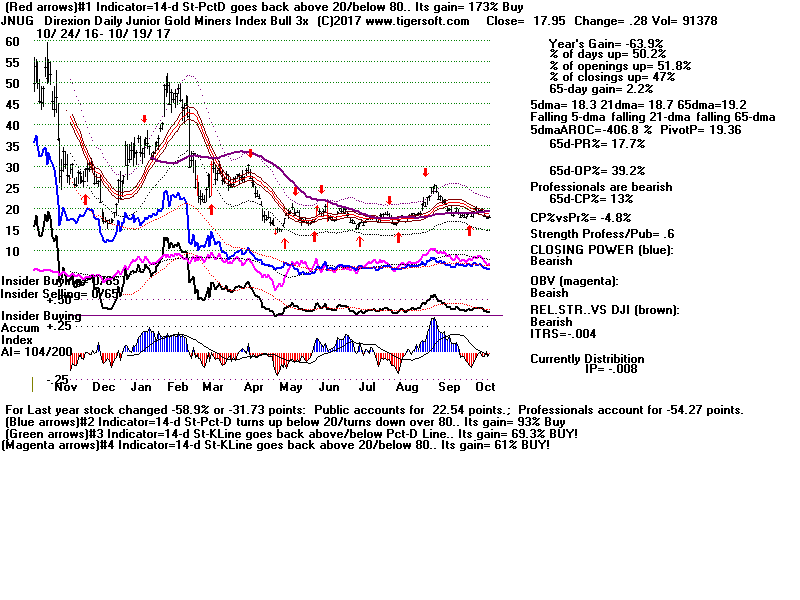
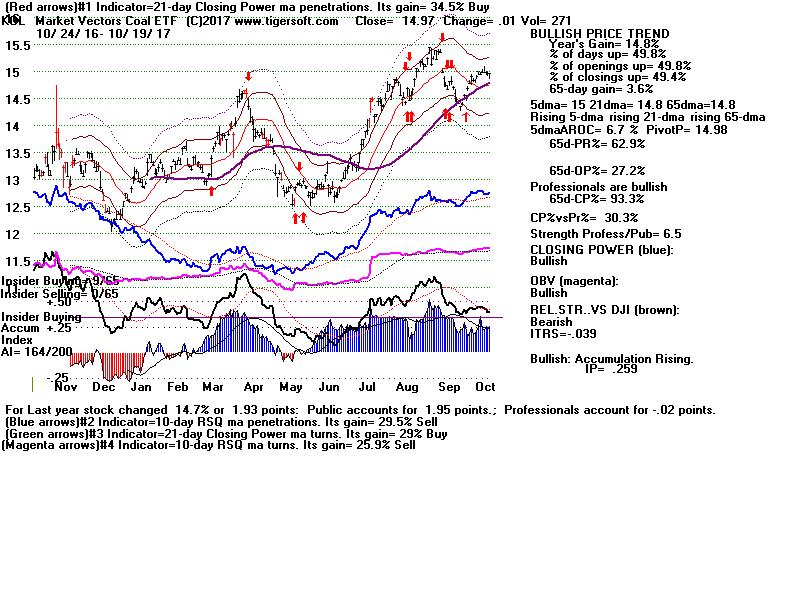
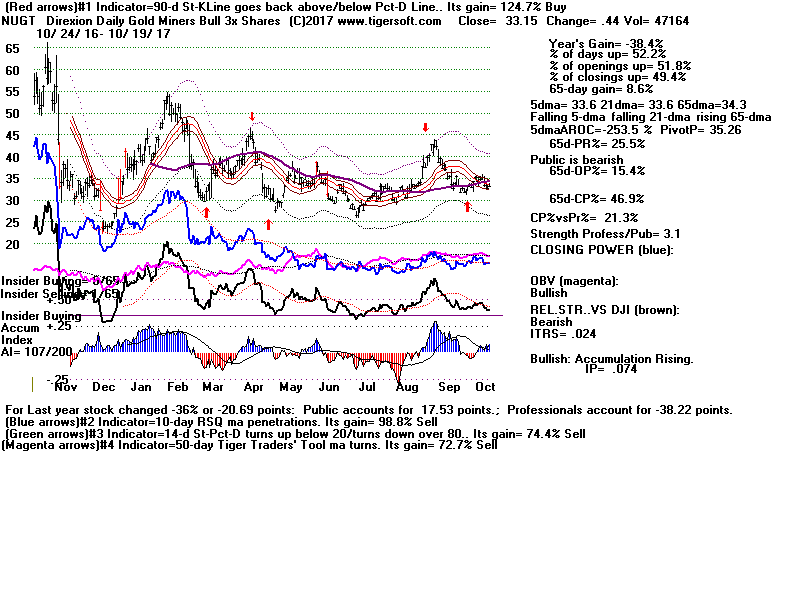
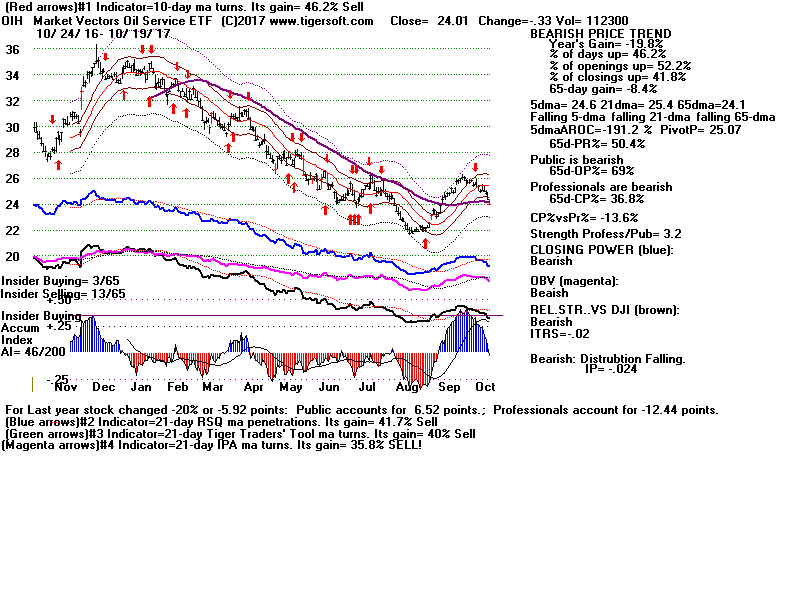
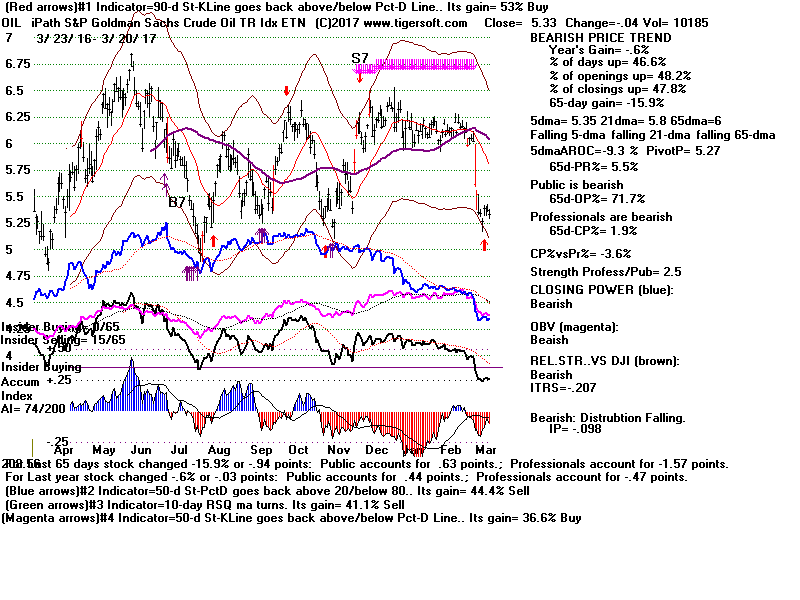
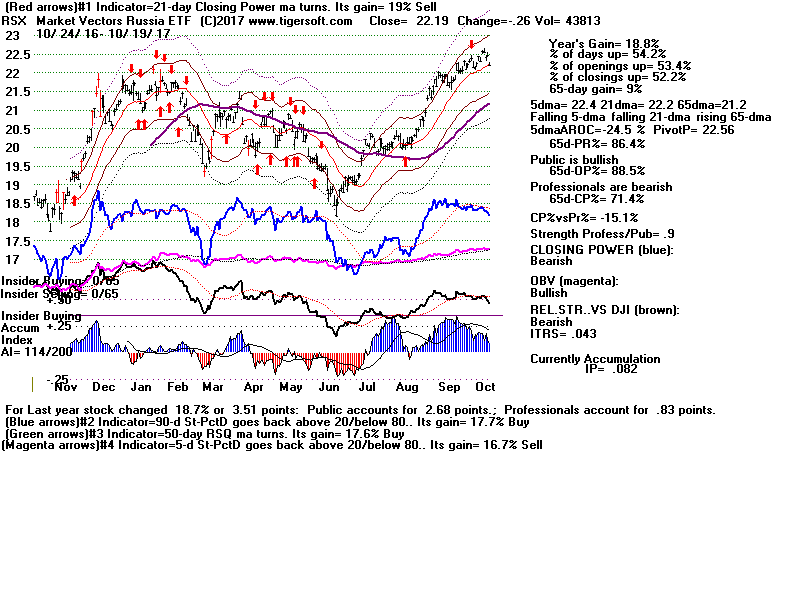
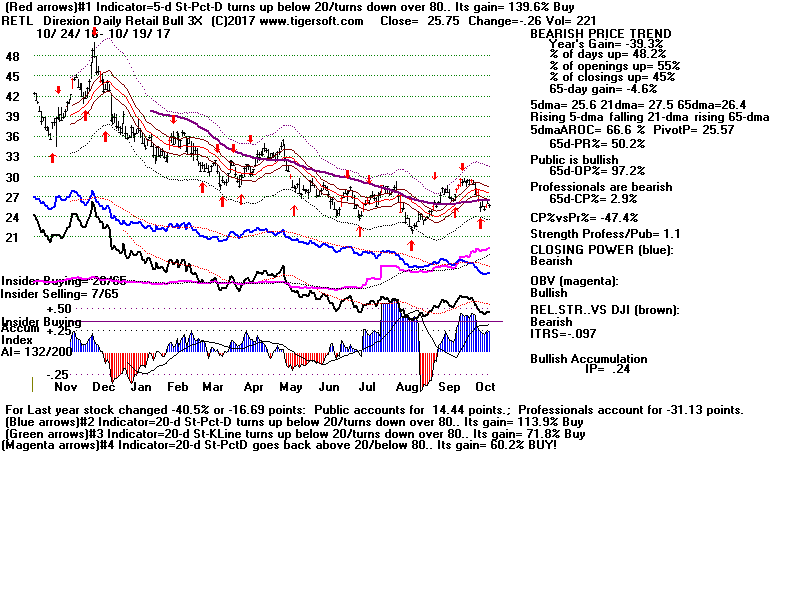
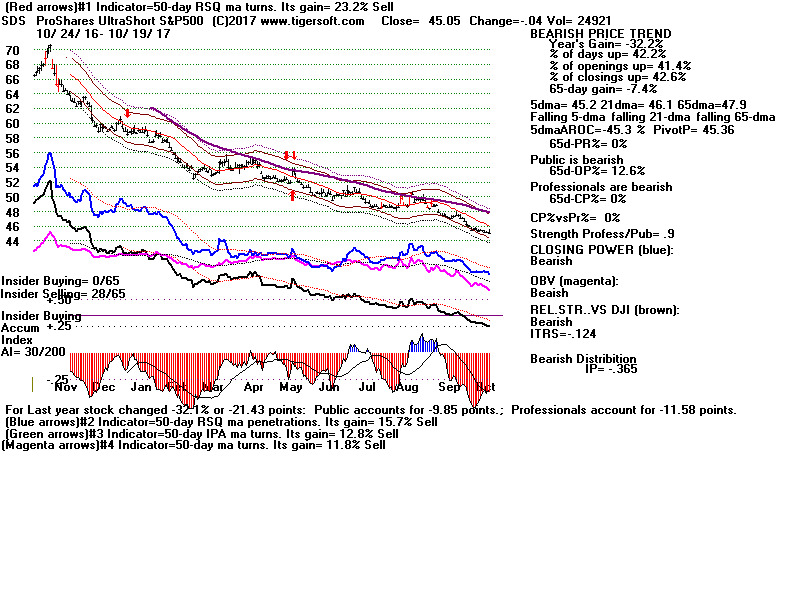
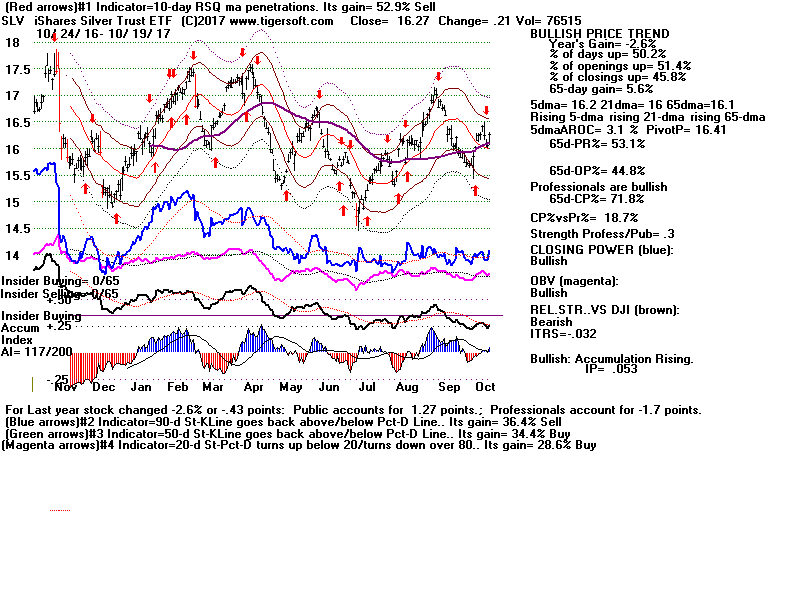
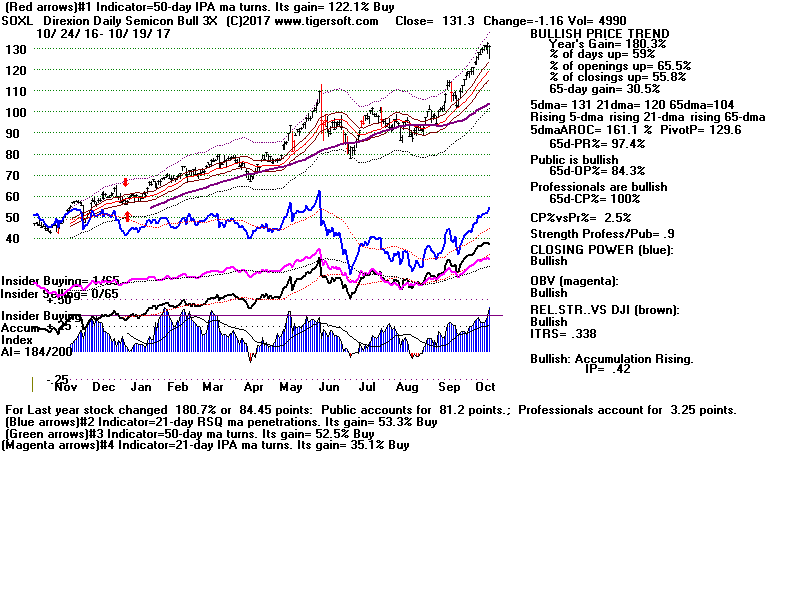
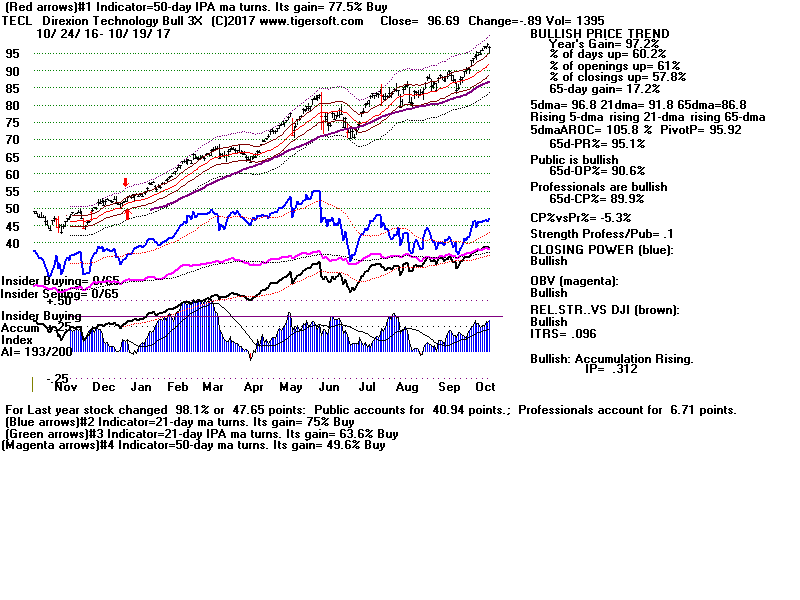
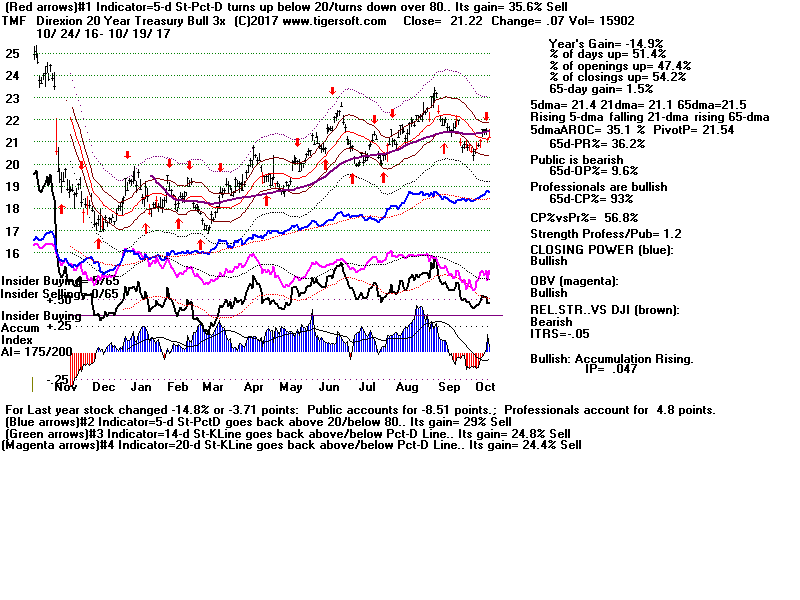
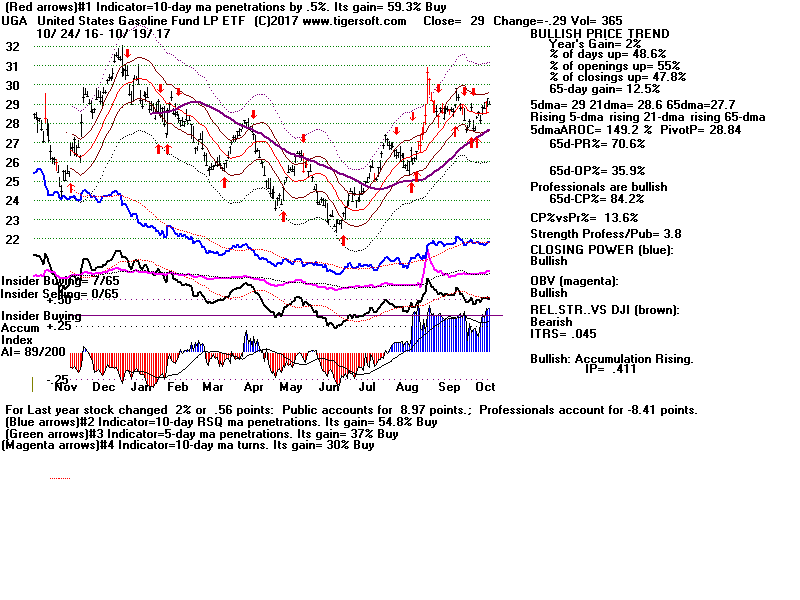
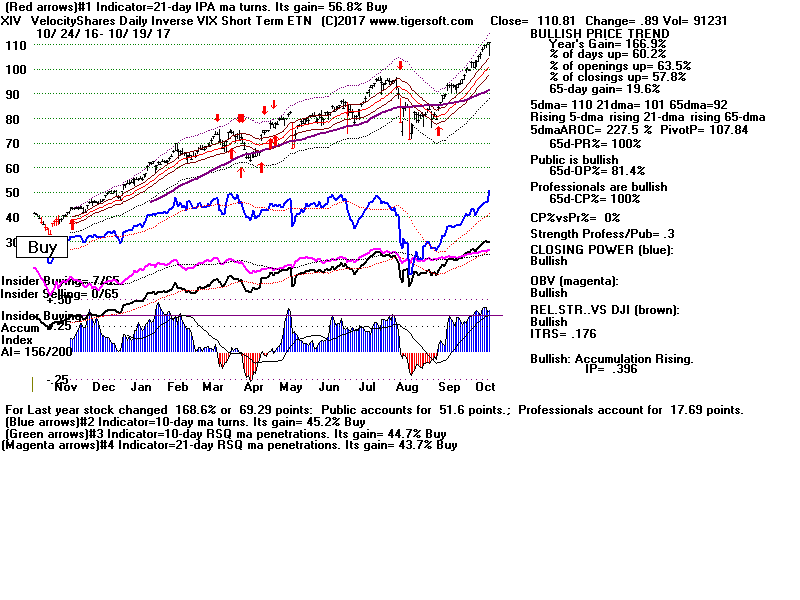
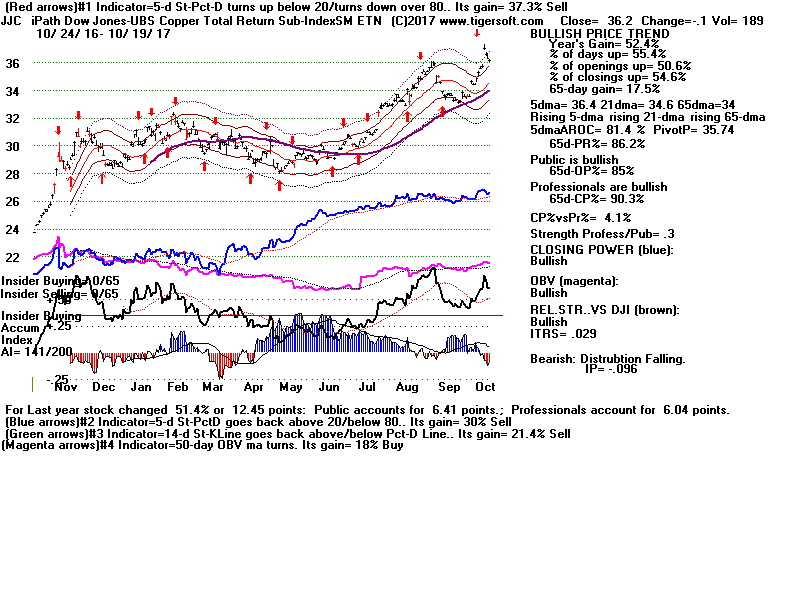
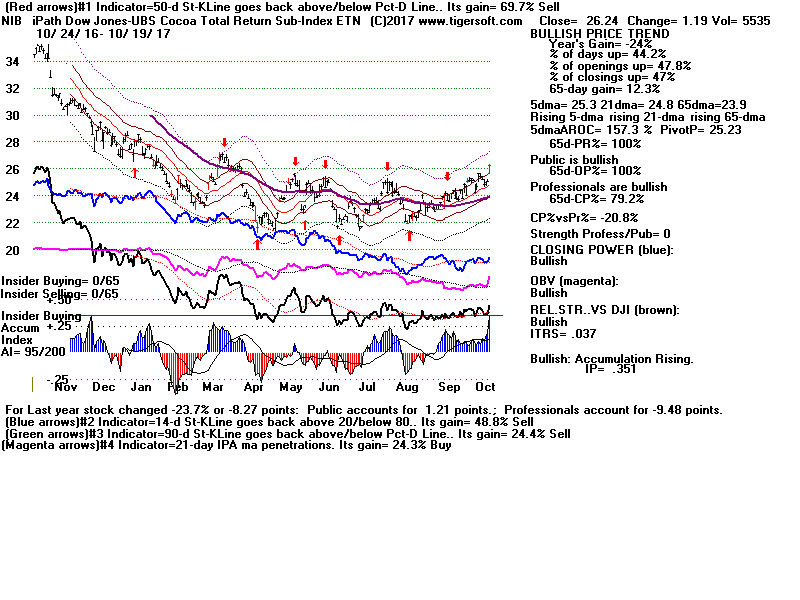
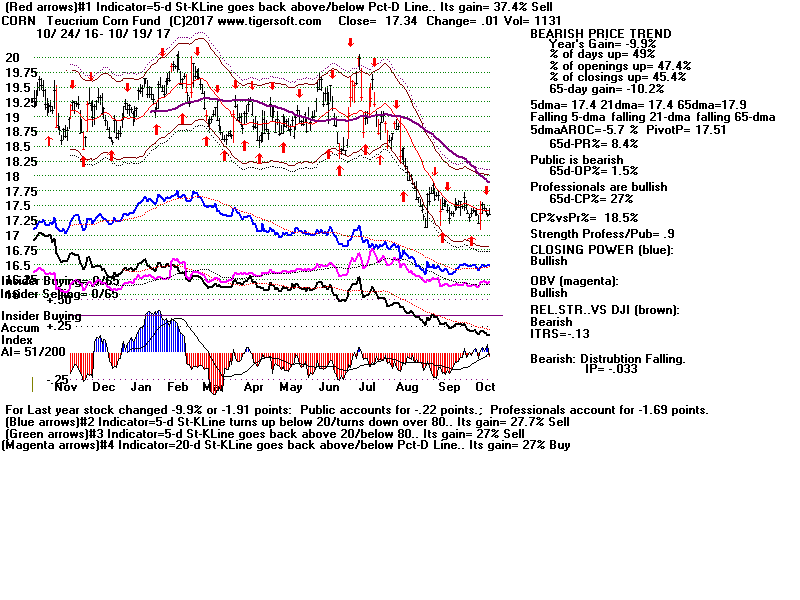
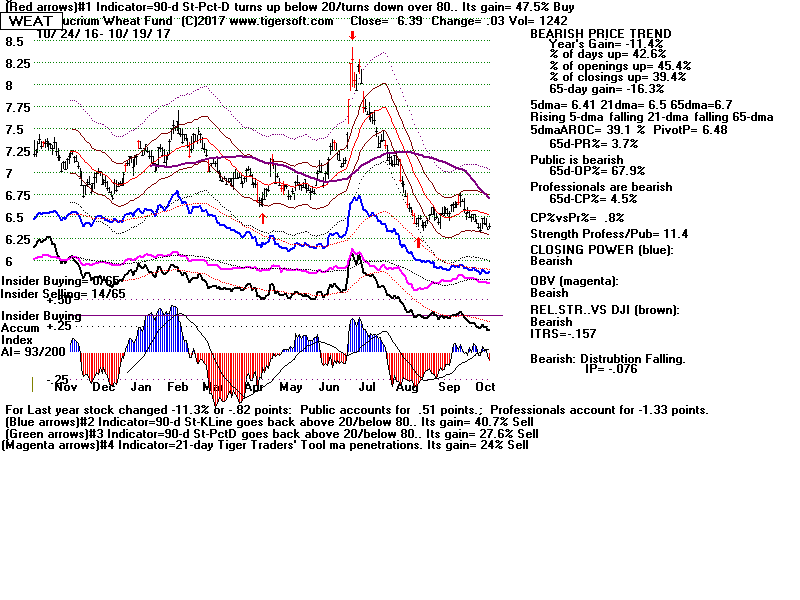
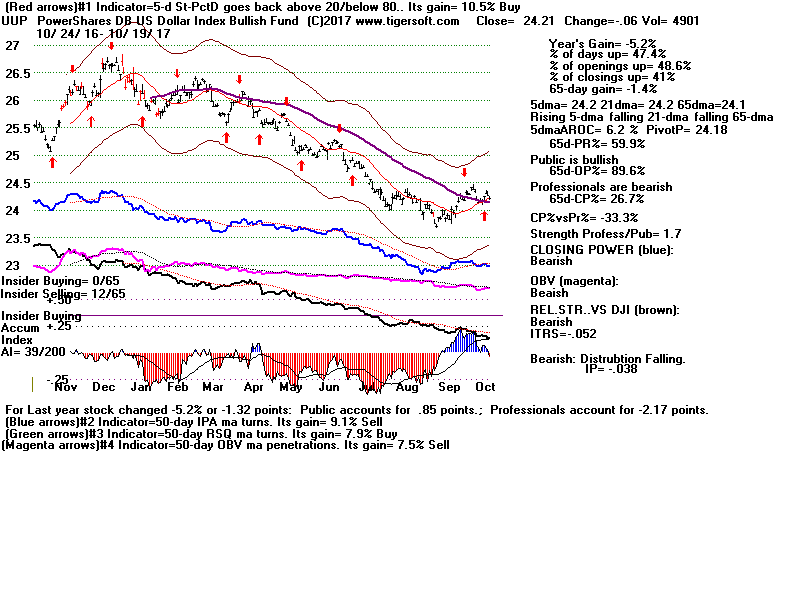
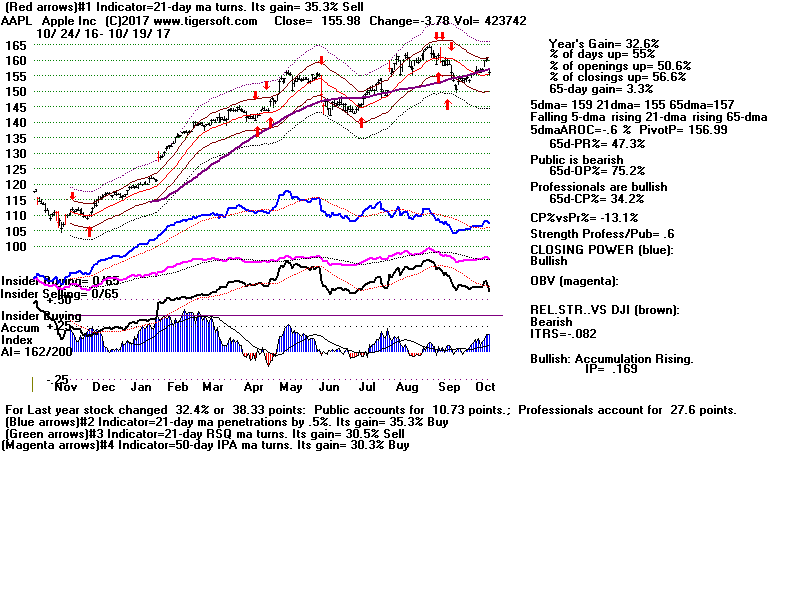
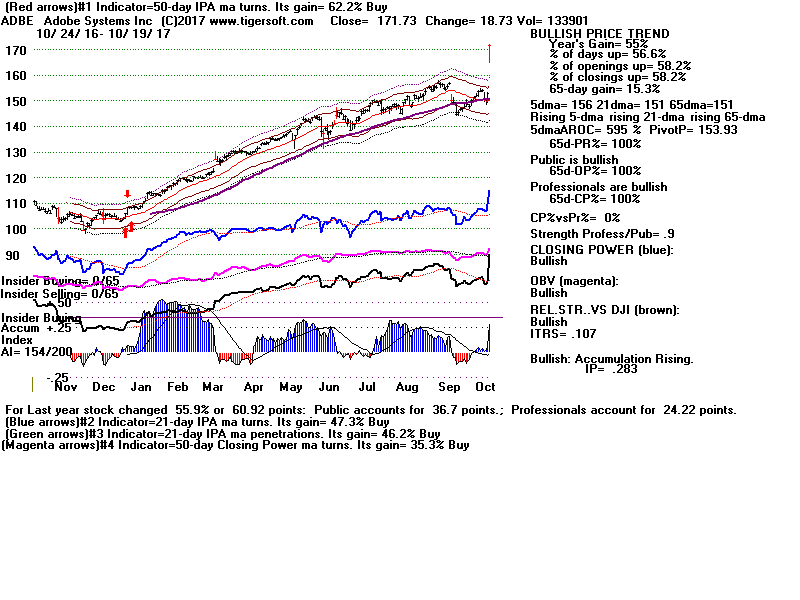
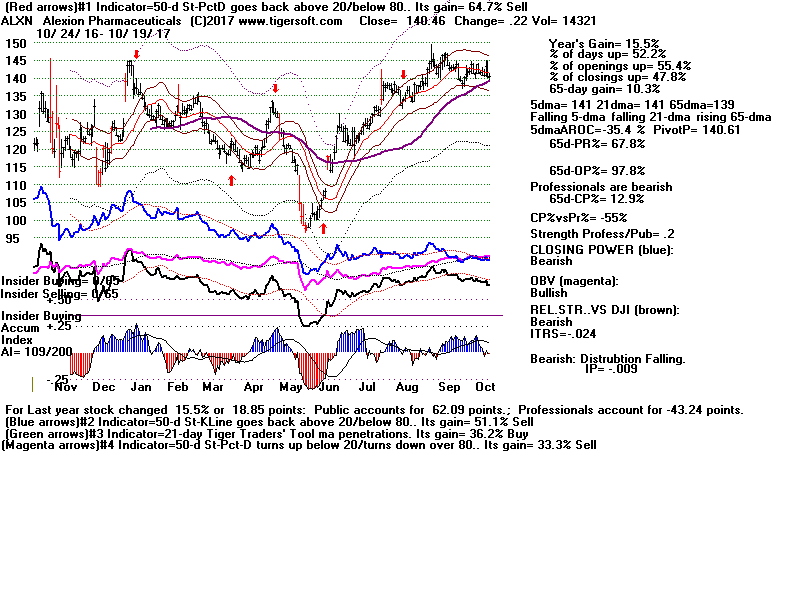
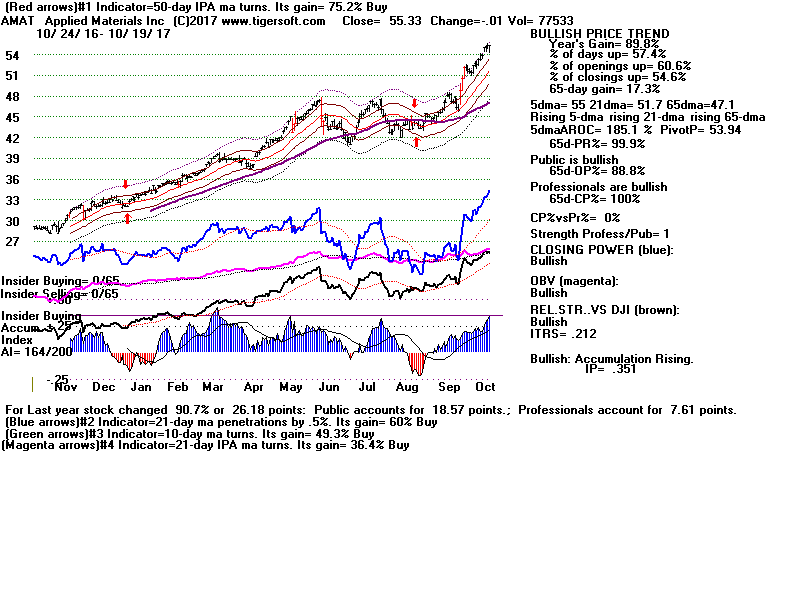
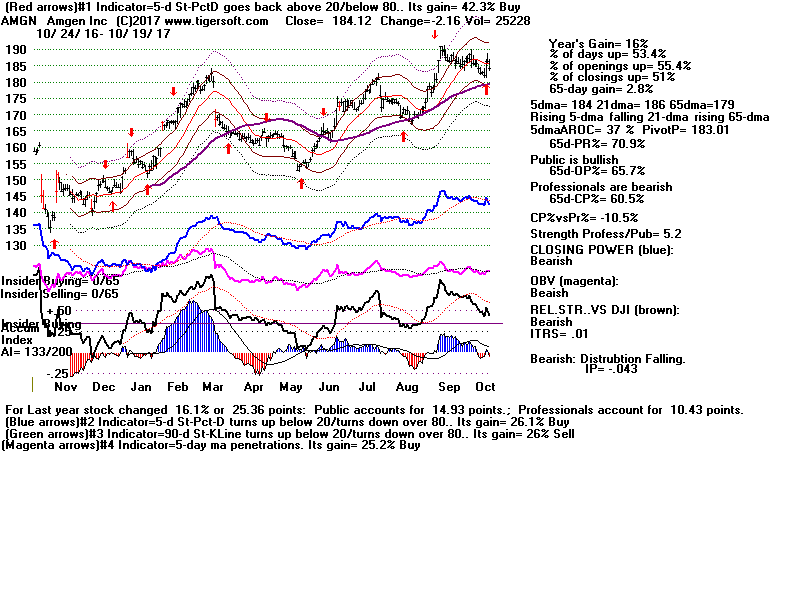
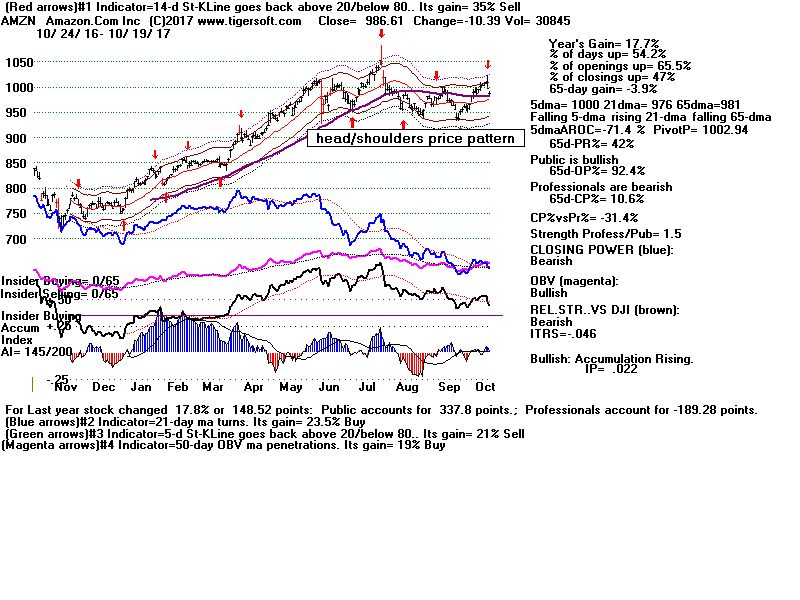
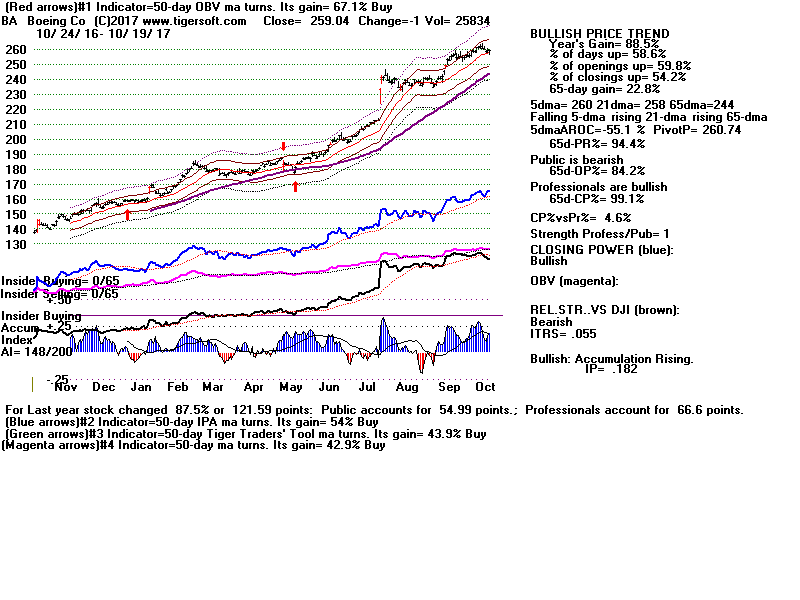
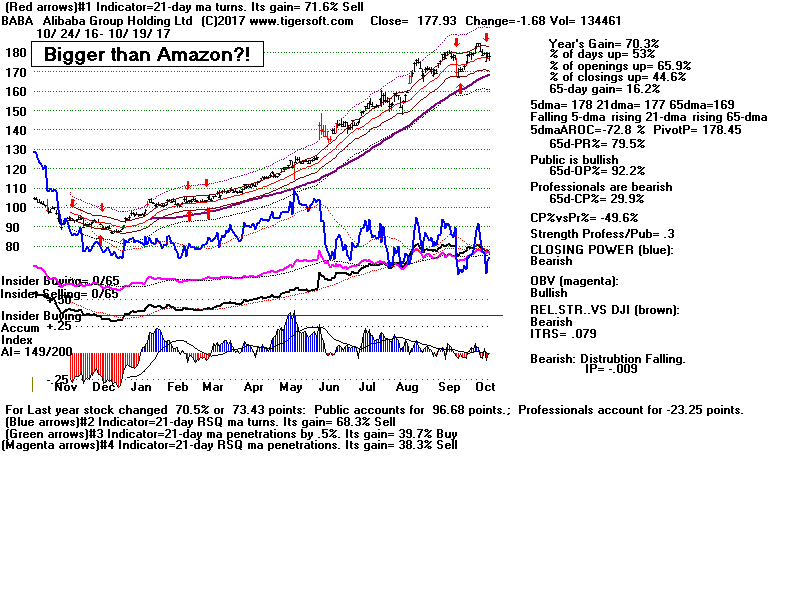
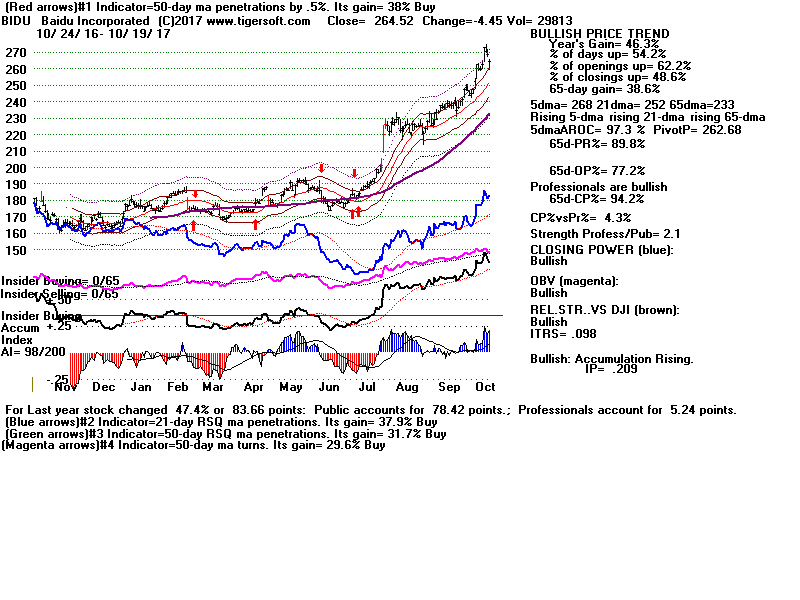
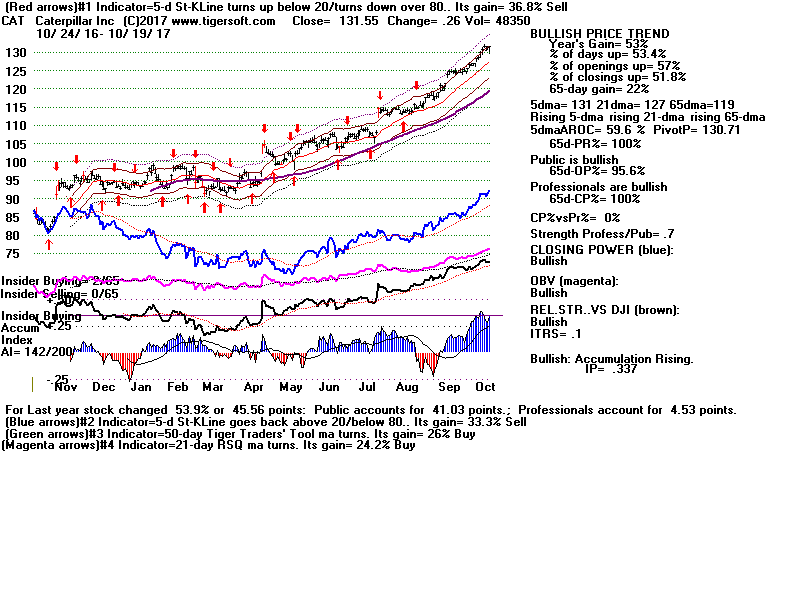
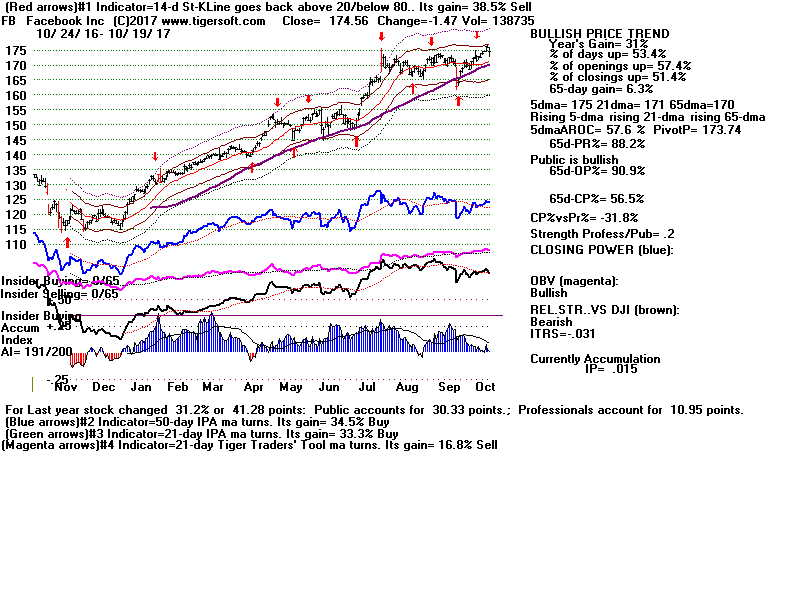
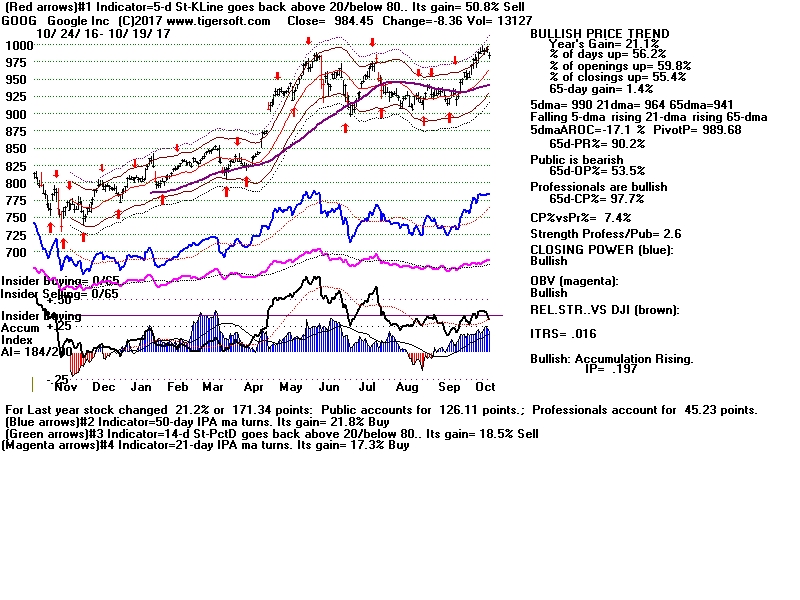
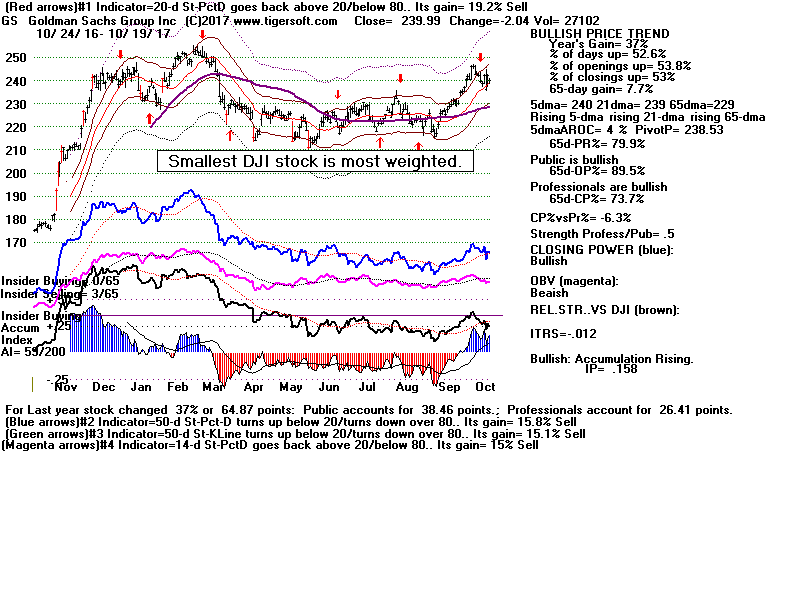
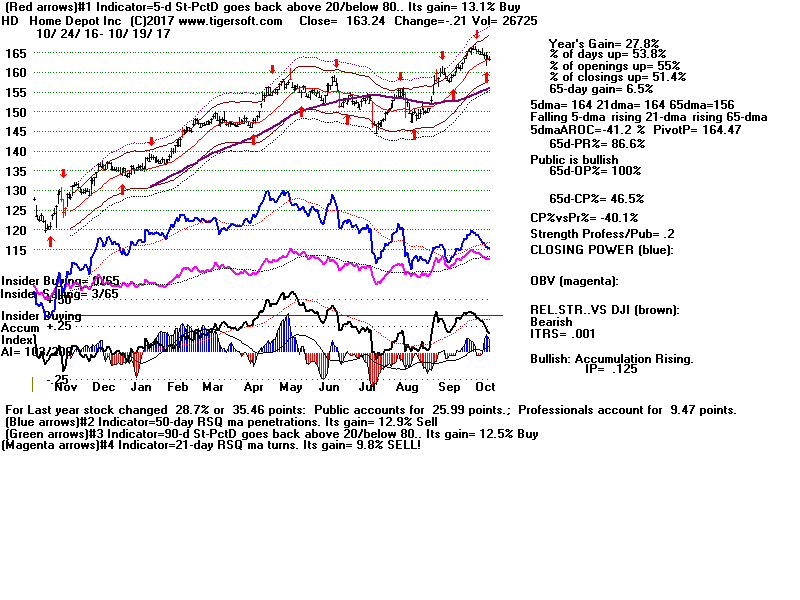
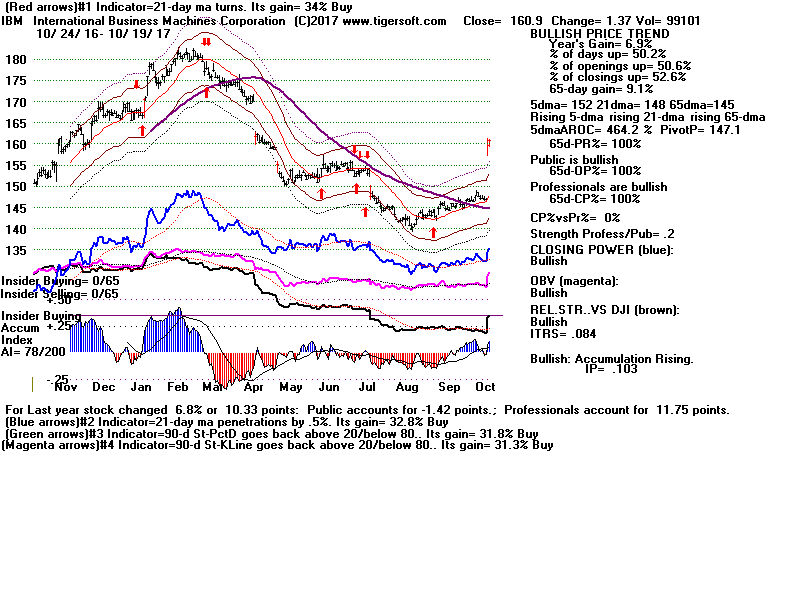
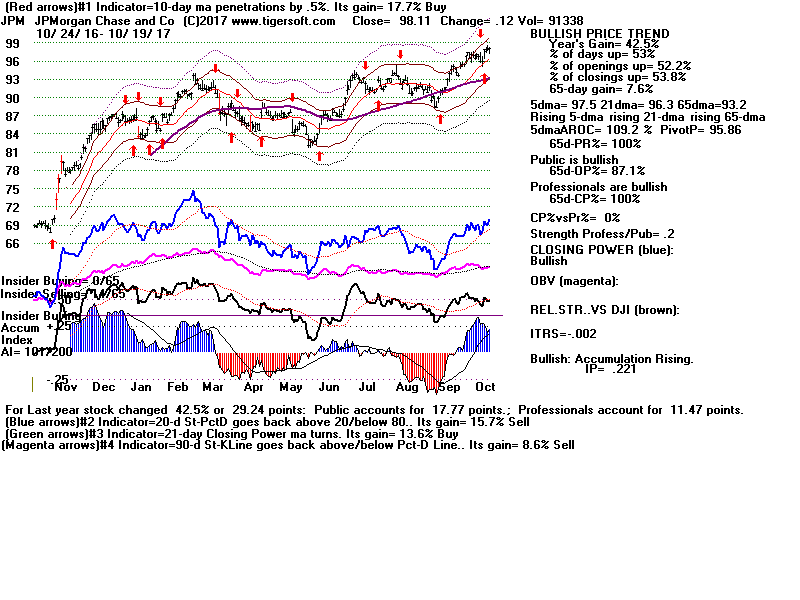
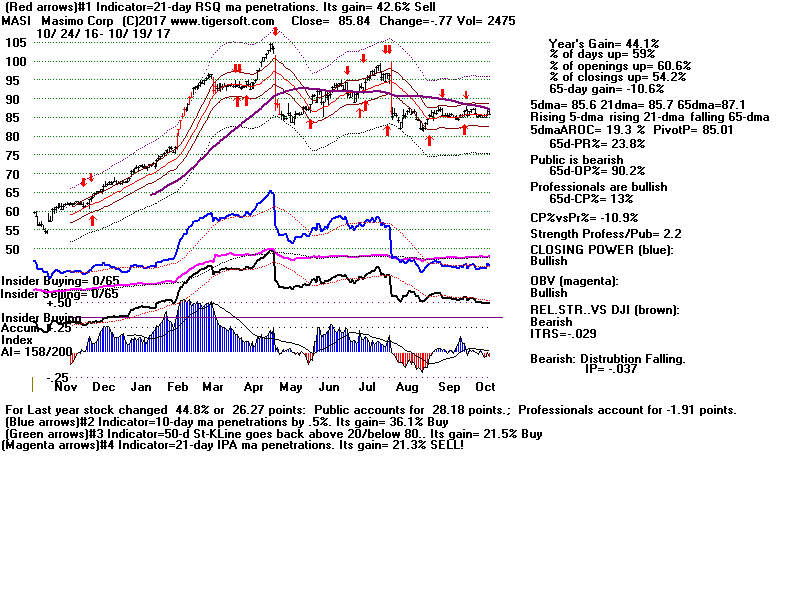
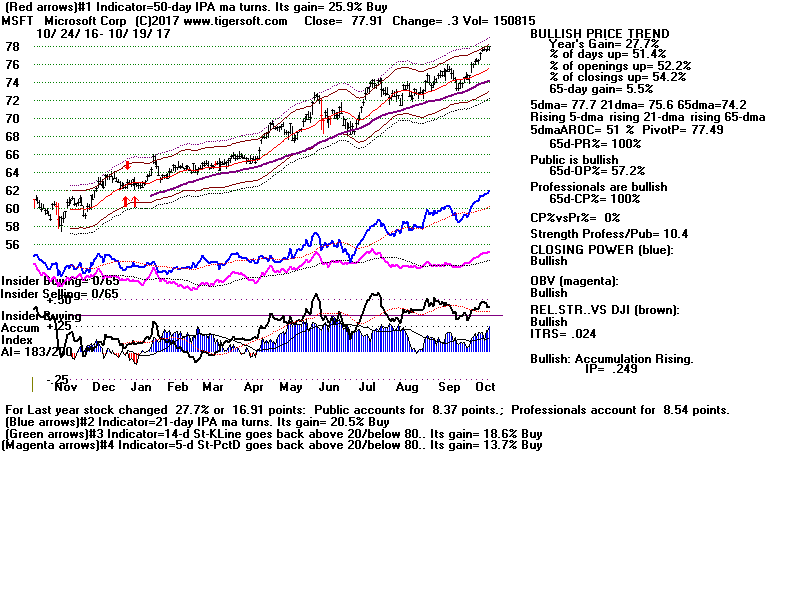
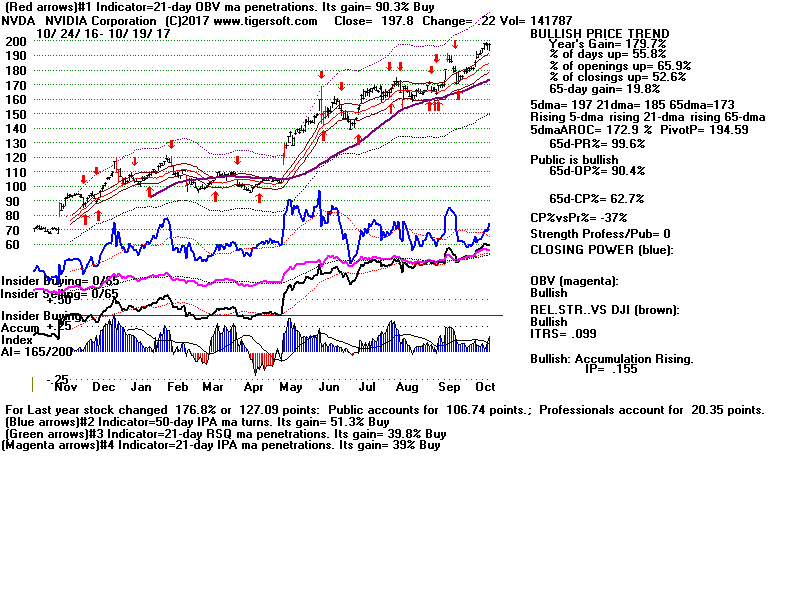
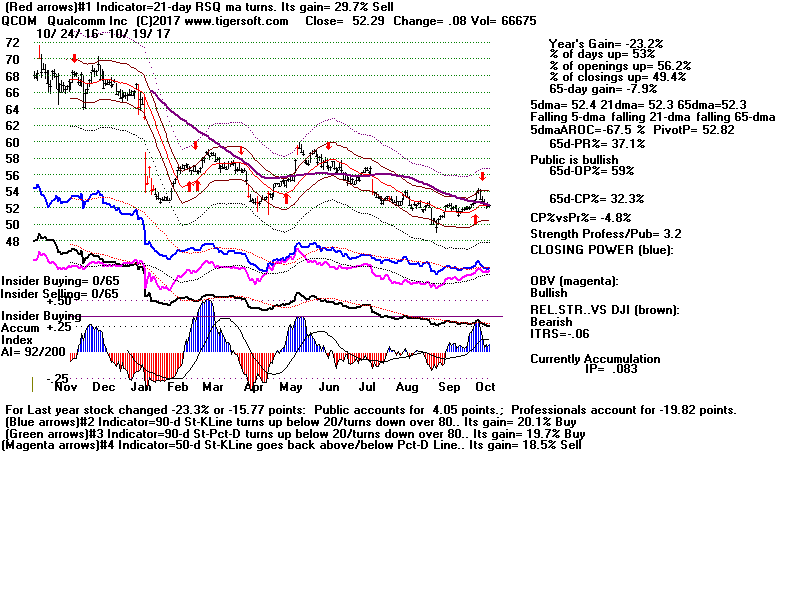
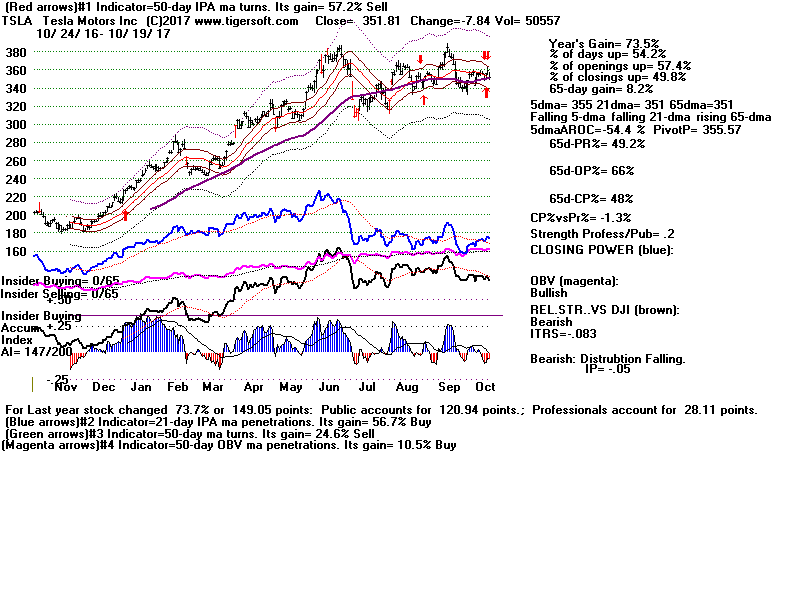
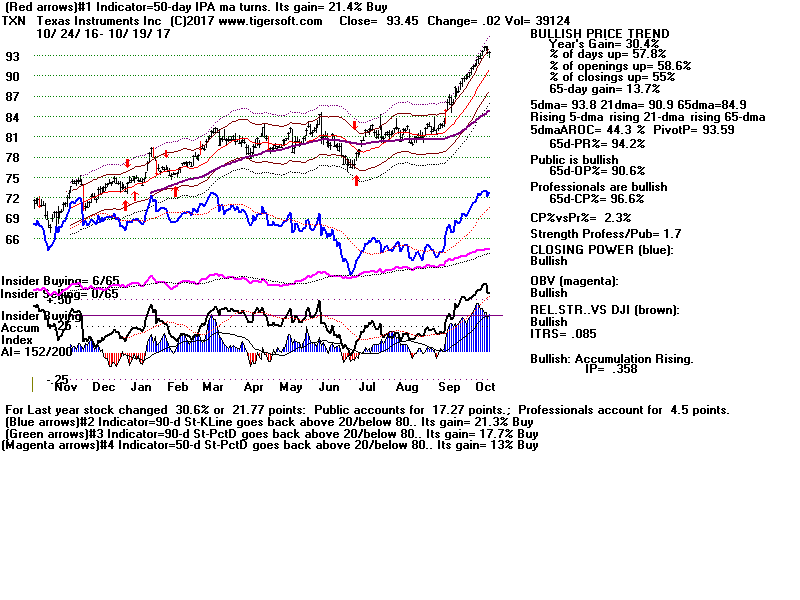
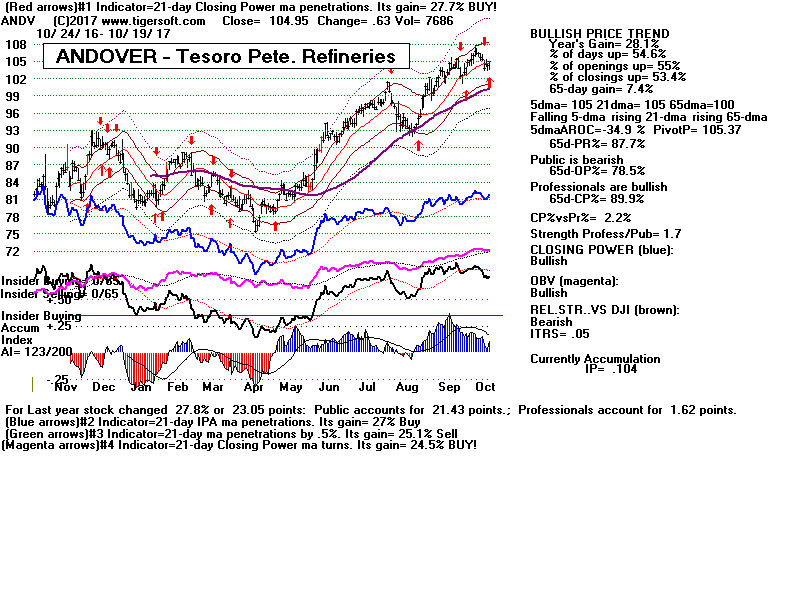
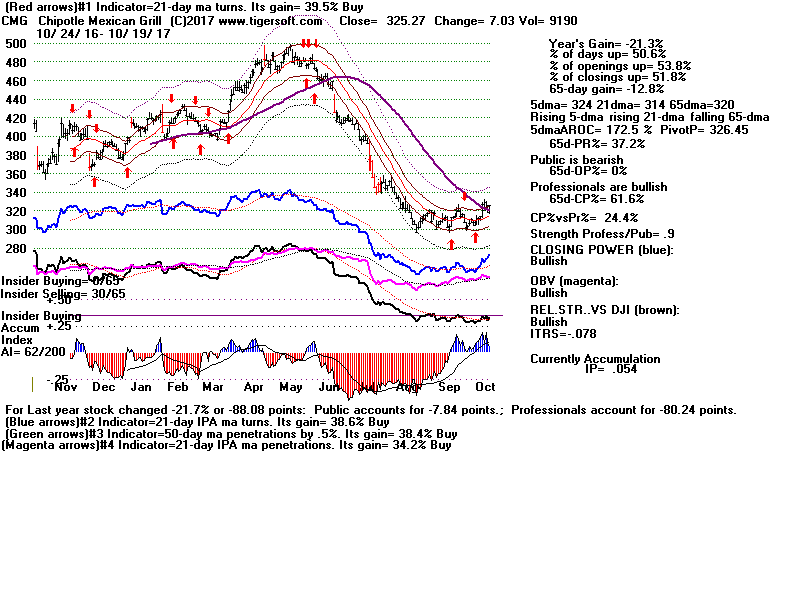
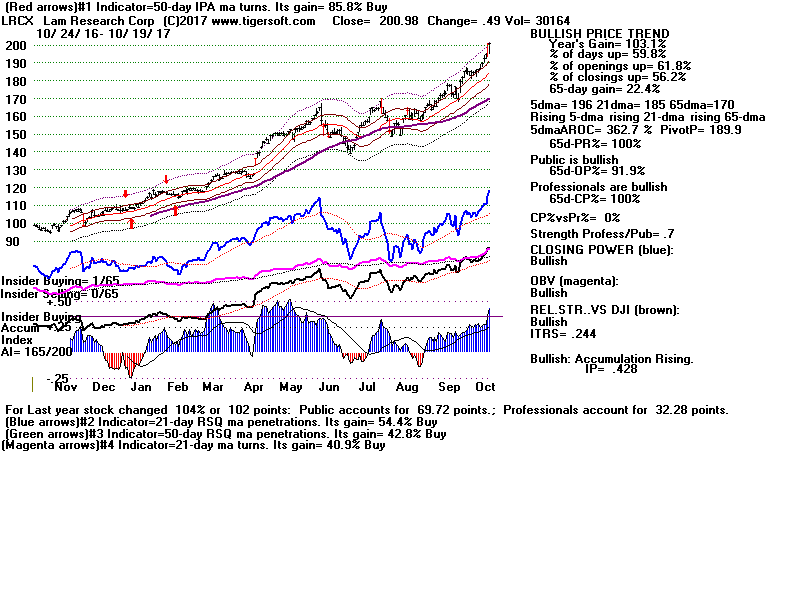
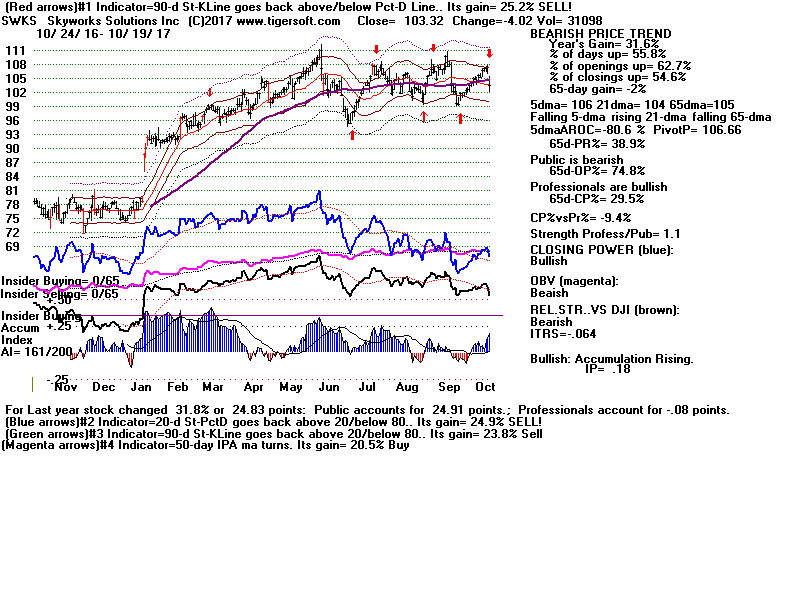
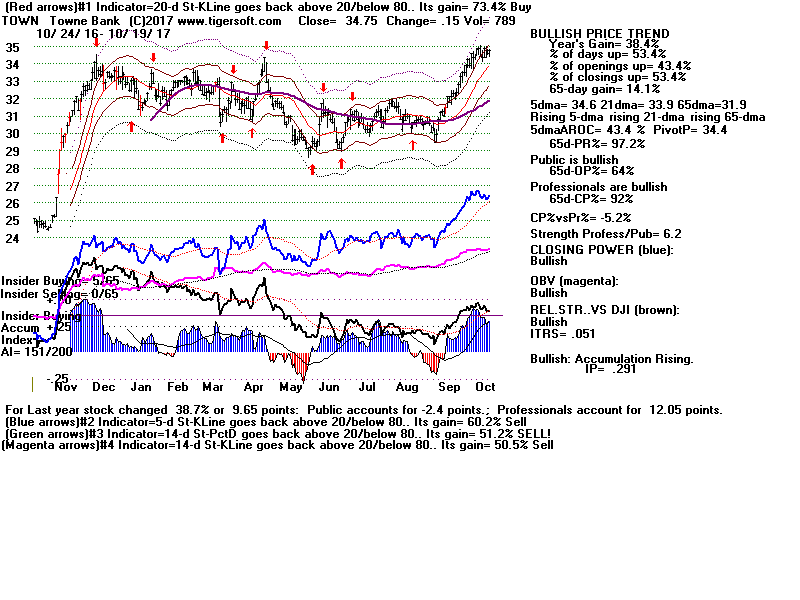
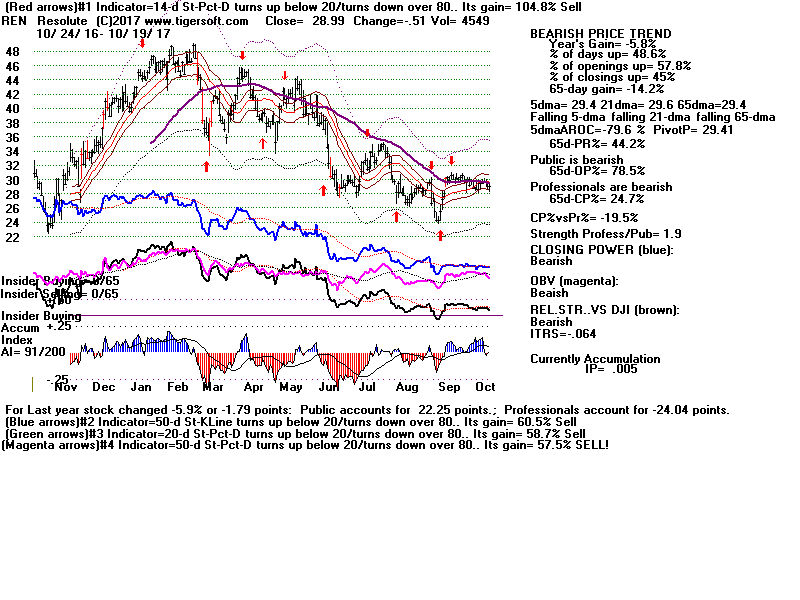
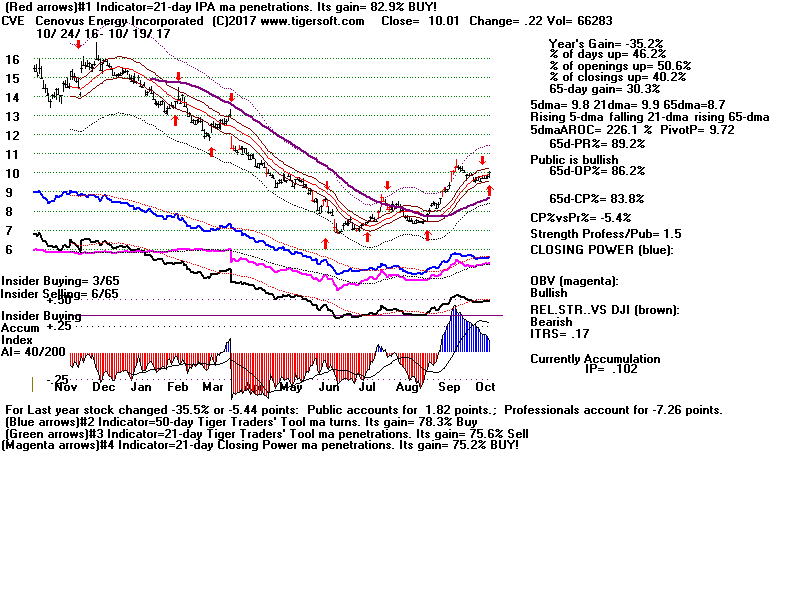
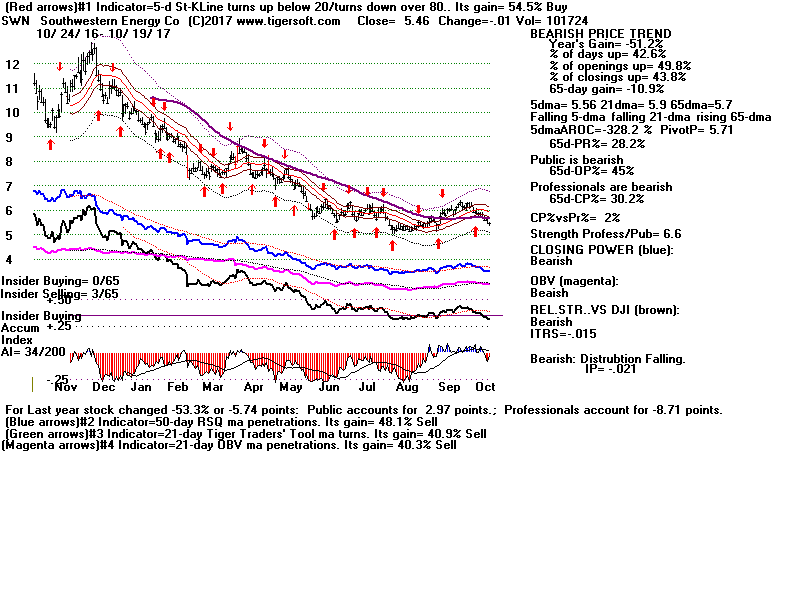
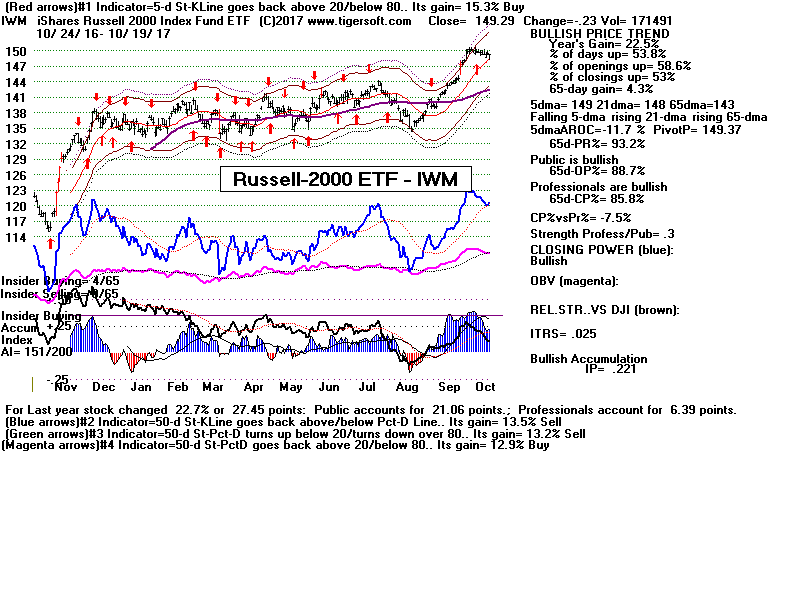
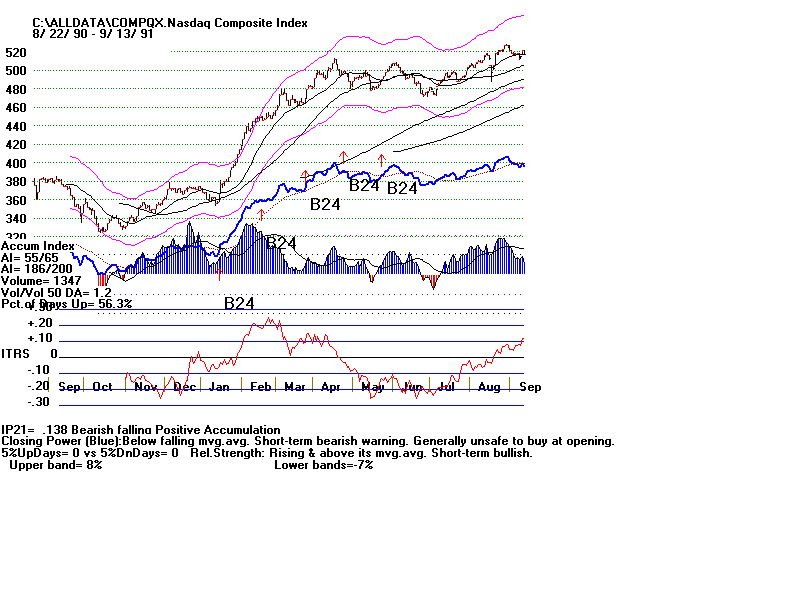
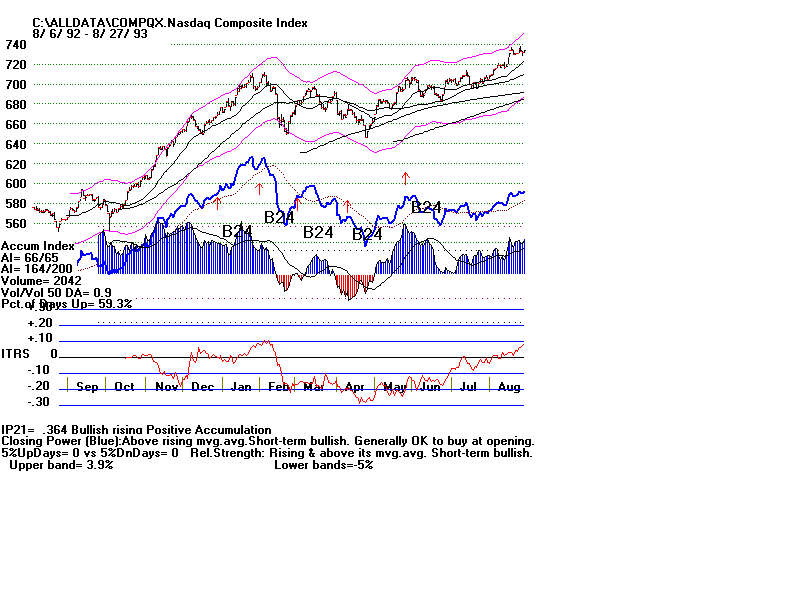
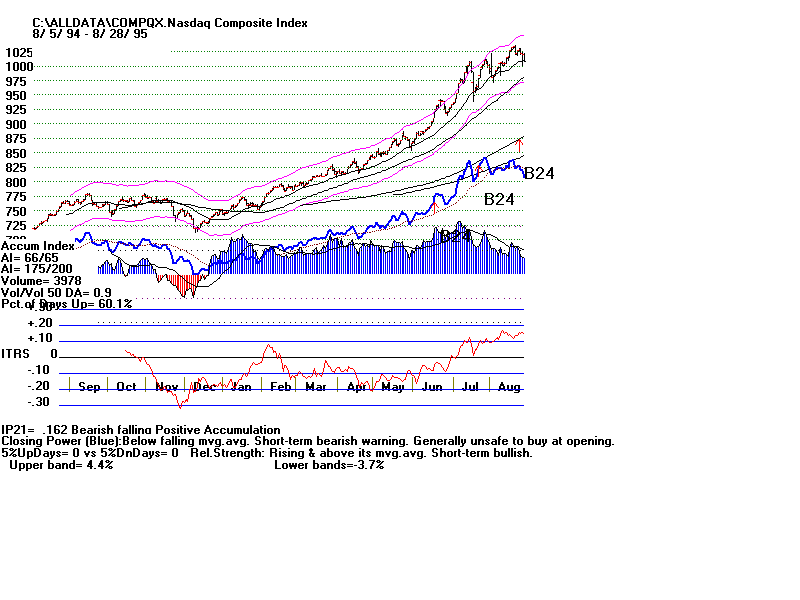
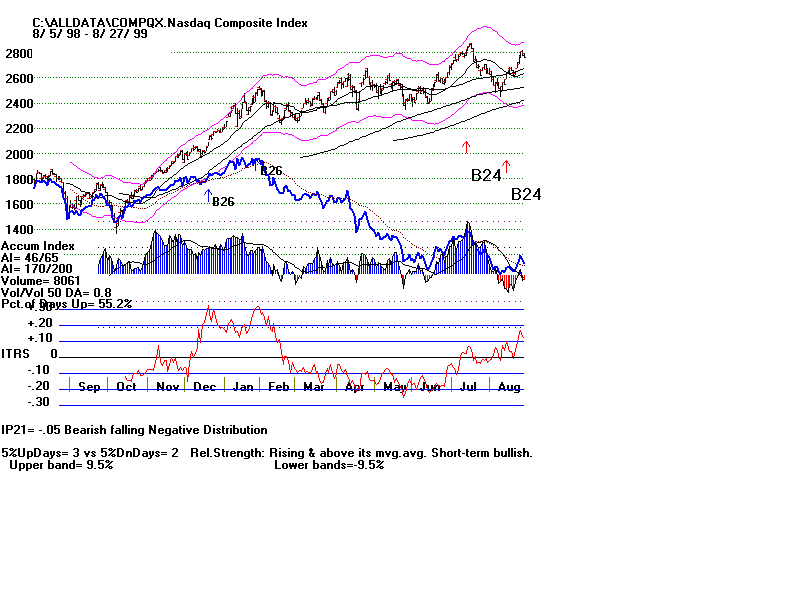
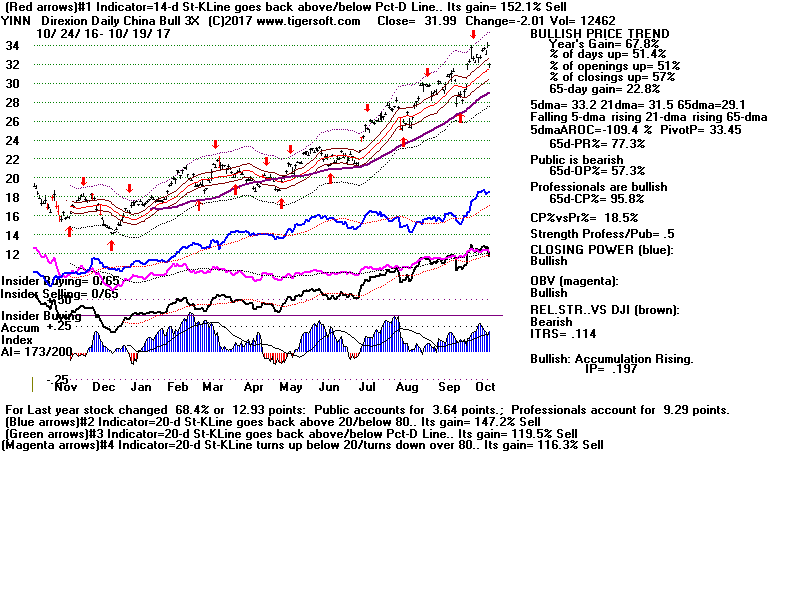