Earlier Hotlines
www.tigersoft.com/H77LION/INDEX.htm
www.tigersoft.com/H7TBR/INDEX.htm
www.tigersoft.com/HH9911/INDEX.htm
http://www.tigersoft.com/HH9911/olderINDEX.htm
http://www.tigersoft.com/HHH517/INDEX.htm
www.tigersoft.com/HHH517/XXXIndex.htm
www.tigersoft.com/HHH517/INDEX6917.htm
www.tigersoft.com/HHH517/OLDER.html
www.tigersoft.com/HH747/INDEX.html
www.tigersoft.com/HHLL217/INDEX.html
PREINDEX.html
www.tigersoftware.com/HL/INDEX.html
Hotlines: 2/4/2017 - 2/15/2017
These have somehow become corrupted. Some graphs
may be missing.
http://www.tigersoft.com/345HLN12/ZINDEX.html
http://www.tigersoft.com/333HLLL/INDEX.html
http://www.tigersoft.com/444HL444/INDEX.html
www.tigersoft.com/119HLPAZ/INDEX.html
http://www.tigersoft.com/888HLAZ/INDEX.html
www.tigersoft.com/821-HL/INDEX.html
http://www.tigersoft.com/816-HLN/INDEX.html
http://www.tigersoft.com/77HL7778/INDEX.html
http://www.tigersoft.com/64HRL/INDEX.html
http://www.tigersoft.com/55HL55/INDEX.html
HELP
A
Guide To Profitably Using The Tiger Nightly HOTLINE
Introduction
to Tiger/Peerless Buys and Sells.
Peerless
Buy and Sell Signals: 1928-2016
Individual Peerless signals explained:
http://tigersoftware.com/PeerlessStudies/Signals-Res/index.htm
http://www.tigersoft.com/PeerInst-2012-2013/
Explanation of each Peerless signal.
http://www.tigersoft.com/PeerInst-2012-2013/
Different
Types of TigerSoft/Peerless CHARTS, Signals and Indicators
-----> More HELP LINKS
Documentation
for TigerSoft Automatic and Optimized Signals.
How
reliable support is the DJI's rising 200-day ma?
SPY
Charts since 1994: Advisory Closing Power S7s, Accum. Index, 65-dma,
Optimized Signals.
^^^^^^^^^^^^^^^^^^^^^^^^^^^^^^^^^^^^^^^^^^^^^^^^
1/19/2016 --->
Corrections,Deeper Declines and Bear Markets since 1945.
1/21/2016
--->
High Velocity Declines since 1929
2/12/2016 --->
Presidential Elections Years and Bullish IP21 Positive Non-Confirmations at
Lower Band.
2/12/2016 --->
OBV NNCs
on DJI's Rally to 2.7% Upper Band when DJI's 65-dma is falling.
11/6/2016 --->
Killer Short Selling Techniques:
===>
Order Here
($42.50)
It's As Easy as
1,2,3
TigerSoft "Combination" Short-Selling...
Easy as 1-2-3 Short Sales
Earlier
Q-Answers
QuickSilver
Documentation (1/11/2016)
Our Different Signals
Better
understand the difference between Peerless DJI-based signals,
the one-year optimized red Signals
and the fixed signals based
on technical developments.
Introduction to
Tiger/Peerless Buys and Sells.
Different
Types of TigerSoft/Peerless CHARTS, Signals and Indicators
New
TigerPeerless
Installation and Basic Uses' Instruction
(11/25/2016)
See
the re-written materials on TigerSoft Buys and Sells.
A few more pages will be added. But users could
print this
main Installation and Uses' Page for reference.
Study-
Trading SPY WITHOUT Peerless - Some Guidelines.
When completed this will be
a new Tiger Trading E-Book.
Study-
Examples of "Hands above the Head" top patterns.
Study-
9/3/2017
TigerSoft (not
Peerless) charts of Major Tops as they occurred.
===> Please report any broken
or out-of-date links.
william_schmidt@hotmail.com
=========================================================================
Happy Thanksgiving!
Note:
There will be
no Hotline Thursday night
unless something
unexpected happens
tomorrow and
the
Hotline address will be changed this Sunday night.
Look for an
Email Friday or
Saturday from giving the new address.
========================================================================= .
11/21/2017 The Peerless signal remains the
very bullish
September Buy B21.
If history
repeats the DJI will not get a Peerless Sell signal until 26,000 is reached
in the
Spring of 2018. That would mean there is another 10% left to the
upside.
So, as we give "Thanks" this week for what the stock market has yielded us,
it may be well to realize, believe it or not, that there is still more
"gravy" ahead.
Resistances from Recent Highs were reached today.
Expect Breakouts above Flat Resistance
Levels Reached Today.
Consider the underlying technicals now. There
were 500+ new highs among NYSE and
NASDAQ stocks. So, the advance is broadening again, not narrowing.
IWM and MDY lept to
new highs today. They are joining the tech ETFs,
SOXL and
TECL ETFs and stocks, which have been the
leaders for months.
Sometimes, there is a bit of indigestion next week. But with the
NYSE A/D Line and the
DJI so close to new 12-month highs, I would not
count on another pullback. New highs
here will probably set off a new surge of Buying. See the Hourly DJI
chart below.
While, it's true that Biotechs are not
participating and RETL's recovery got stalled
today, we should be buoyed that the potential head/shoulders patterns I
mentioned
yesterday are being destroyed and Gold is still
not yet rallying to tell us the advance
is getting dangerous.
As for our former Bearish MINCP shorts, a good many of them have recently
broken their Closing Power downtrends and now the number of MINCPs is
down 150 stocks from its level three weeks ago on November 21st. The
most
bearish looking ETFs now are the negative ETFs. Even the normally
bearish
Day Traders have turned net bullish today. See Table 2.
All things considered, this is a not a market to Sell
yet. The bullish month of December is
just ahead. At the very least, we should not sell until there has been
a climactic
advance up to the DJI's 3.0% upper band spurred on, perhaps, by Trump's tax
cut
finally getting passed by the US Senate.
For now, owning the leading ETFs, as generally
suggested by the Power Rank position
of their representatives among the Leveraged ETFs has to be advised.
Look at how
very high are their IP21 and AI/200 (positive consistency for Accumulation)
are.
Most "Bullish" Power Ranked ETFs in "LEVERAGE"
Group
IP21 AI/200
CP-position
from 65-day low
high.
#1 TECL - ProShares Ultra Technology (3x)
.407 196 100%
#2 TQQQ - ProShares UltraPro QQQ
.423 193 100%
#3 SOXL - Semiconductors (3x)
.452 184 100%
#4 QLD - Ultra QQQ
.404 191 100%
Charts 11/21/2017
PEERLESS
DJI, Signals, Indicators Daily DJI
Volume 10-DayUp/Down Vol
Hourly DJIA
A/D Line for All Stocks
NASDAQ
S&P
OEX
NYSE
COMPQX
DJI-15 DJI-20
DJI-30
DIA
SPY
QQQ
MDY
IWM TNA
CrudeOil
FAS
GLD
BBH
IBB
JETS
JNUG
KOL
NUGT
OIH
OIL
RSX
RETL
SDS
SLV
SOXL
TECL
TMF
TNA UGA
(gasoline)
XIV YINN
Commodities:
JJC, NIB,
CHOC
CORN,
WEAT
UUP
(Dollar)
AAPL ADBE
ALXN AMAT
AMGN AMD
AMZN
BA BABA BAC
BIDU
CAT
CVX
FB
GOOG
GS
HD
IBM
JPM M
(Macy's)
MSFT
NFLX
NVDA
QCOM
TSLA TXN
XOM WMT
ANDV (refinery,
CMG (Chipotle),
LRCX, SWKS,
TOWN New - SPPI
(small Biotech)
11/21/2017
Bullish MAXCPs Bearish
MINCPs |
Table 1
QuickSilver
Documentation
This is for short-term trading
leveraged ETFs.
It also provides a useful short-term outlook of these sectors ETF's
and the sectors they represewnt
Blue is Bullish
and
Red is Bearish.
1 Candle-Stick color is shortest-term. This
changes when close vis-a-vis opening changes.
So, in stocks or ETFs that advanced a long ways, traders should sell
when a higher
opening gives way to a decline that brings a drop below the previous
day's close.
2 5-dma AROC and Close-versus- pivot point is next
most short-term.
W = warning. Close is below PIVOT-Point.
3 Closing Power trend-direction vs. its 21-dma is next
most short-term.
4 IP21 is used to spot divergences and to estimate
underlying support.
5 > IP21 falling and below +.15 and its 21-dma is bearish in
an over-extended ETF, especially
when its Closing Power is falling and is below its 21-dma.
> IP21 below 07 with AROC below .07 is less likely to bring a rally
back up from 21-dma.
6 Note price trend-lines, support/resistance and price
patterns on charts.
QUICKSILVER on ETFS - 11/21/17
ETF      CLOSE   CHANGE     PIVOT-PT   5-dma AROC   CL-PWR    CANDLE   IP21   ITRS
---------------------------------------------------------------------------------------------
DIA       235.73    1.58     232.96        31%     Bullish      BLUE   .132     ----
---------------------------------------------------------------------------------------------
COMPQX    6862.48    71.77   6706.21       92.1%   Bullish      BLUE   .383    -.001
---------------------------------------------------------------------------------------------
SPY       259.99    1.69     256.44        43.8%   Bullish      BLUE   .299    -.025
---------------------------------------------------------------------------------------------
QQQ       155.5    1.67      152.59        71.3%   Bullish      BLUE   .393    -.001
---------------------------------------------------------------------------------------------
MDY       338.41    2.15     330.87        89.9%   Bullish      BLUE   .342    -.005
---------------------------------------------------------------------------------------------
IWM       151.09    1.56     145.63        165.4%  Bullish      BLUE   .201     .003
---------------------------------------------------------------------------------------------
FAS       60.85    .83       59.34         103.1%  Bullish      BLUE   .129     .115
---------------------------------------------------------------------------------------------
RETL      28.2   -1.14       24.97         624.9%   ----        RED    .178    -.027
---------------------------------------------------------------------------------------------
SOXL      170.16    5.89     153.87        380.2%  Bullish      BLUE   .453     .614
---------------------------------------------------------------------------------------------
TECL      113.86    3.37     106.94        202.7%  Bullish      BLUE   .408     .222
---------------------------------------------------------------------------------------------
IBB       310.71    2.38     306.25        91.8%   Bearish      BLUE  -.02     -.138
---------------------------------------------------------------------------------------------
GLD       122.6    .58       119.46        142.2%  Bullish      BLUE   .092     0
---------------------------------------------------------------------------------------------
OIL       6.08    .08        5.86          151.7%  Bullish      BLUE   .272     .144
---------------------------------------------------------------------------------------------
OIH       24.03    .02       23.93        -60.3%   ----         RED    .178    -.058
---------------------------------------------------------------------------------------------
GASL      21.63   -.12       21.36        -64.2%   ----         RED    .278     .166
---------------------------------------------------------------------------------------------
UGA       31.75    .52       31.24         25.6%   Bullish      BLUE   .388     .038
---------------------------------------------------------------------------------------------
UUP       24.43   -.03       24.38         8.2%    Bearish      ----   .004    -.04
---------------------------------------------------------------------------------------------
IEF       106.03    .02     W106.31        4.7%    Bearish      RED    -.045   -.081
---------------------------------------------------------------------------------------------
CORN      16.98   -.03       16.81         59.3%   Bearish      ----   -.175   -.089
---------------------------------------------------------------------------------------------
WEAT      6.2    .04         6.2          -40.3%   Bullish      BLUE    .086   -.115
---------------------------------------------------------------------------------------------
YINN      37.55    2.83      32.4          583.8%  Bullish      BLUE    .064    .187
---------------------------------------------------------------------------------------------
RSX       22.17    .34      W21.38         87.5%   Bearish      BLUE   -.129   -.054
---------------------------------------------------------------------------------------------
AAPL      173.14    3.16     169.08        52.8%   Bullish      BLUE    .232    .012
---------------------------------------------------------------------------------------------
GOOG      1034.49    16.11   1020.91       41.5%   Bullish      BLUE    .056    .045
---------------------------------------------------------------------------------------------
MSFT      83.72    1.19      82.98        -19.9%   ----         BLUE    -.033   .056
---------------------------------------------------------------------------------------------
AMZN      1139.49    13.18   1126.69       11.7%   Bullish      BLUE     .31     .095
---------------------------------------------------------------------------------------------
FB        181.86    3.12     177.95        106.1%  Bullish      BLUE     .281    -.013
---------------------------------------------------------------------------------------------
NVDA     216.05    1.97      209.98        44.1%   ----         BLUE     .219     .209
---------------------------------------------------------------------------------------------
BA        266.99    2.36     262.86        99.4%   Bullish      BLUE     .008     .045
---------------------------------------------------------------------------------------------
GS        238.02   -.11      237.61        16.4%   Bearish      RED     -.05    -.011
|
Table 2
COMPARISONS OF BULLISH AND BEARISH NUMBERS
11/21 11/20
11/17 11/16 11/15 11/14 11/13
11/10 11/9 11/8 11/7 11/6
11/3 11/2
NEWHIGHS 615 363 244 273 71
198 191
164 157 324 255
466 360 334
NEWLOWS 62 50 229 150
111 150
113 98 93 93 103
96 112 114
-----------------------------------------------------------------------------------------------------------
MAXCPs 406 339 295 321
154 276 259
167 171 188
114
164 140
113
MINCPs
63 52
40
74
105 192
150
138
130
145
213 136 180 214
-----------------------------------------------------------------------------------------------------------
TTTNHs
196 172 169
154
89 125 101
88 82 83
67 95
71 69
TTTNLs
186 184 79 78 211
259 203
237 297 278
352 218 311
313
----------------------------------------------------------------------------------------------------------
FASTUP
245 189 158
148 121 146
148 190 209 208
187 239
190 196
FASTDOWN 72 100 136
177 253
249 260
221 250 259 259 194 214
208
|
Table 3
Count of Stocks and New Highs in Key Tiger Directories
Date = 171121

               No.           NHs           Pct
-------------------------------------------------------------------
HOMEBLDG       17            10            59 %
NIFTY-30       30            10            33 %
JETS           9             3             33 %
CHINA          64            20            31 %
INDEXES        195           57            29 %
ELECTRON       179           46            26 %
SEMI           131           31            24 %
ETFS           65            14            22 %
COMPUTER       23            5             22 %
GAMING         28            6             21 %
MORNSTAR       238           51            21 %
SOFTWARE       66            14            21 %
HACKERS        25            5             20 %
BIGMIL         6             1             17 %
NASD-100       88            15            17 %
DJI-13         13            2             15 %
RUS-1000       840           124           15 %
--------------------------------------------------------
CHEM           65            9             14 %
SOLAR          21            3             14 %
REIT           179           25            14 %
MILITARY       38            5             13 %
INSURANC       32            4             13 %
GREEN          31            3             10 %
DOWJONES       30            3             10 %
SP500          486           47            10 %
SP-100         96            9             9 %
FINANCE        92            7             8 %
INDMATER       91            7             8 %
BIOTECH        385           30            8 %
RETAIL         53            4             8 %
FOOD           15            1             7 %
TRANSP         20            1             5 %
UTILITY        43            2             5 %
BEVERAGE       20            1             5 %
OILGAS         144           6             4 %
AUTO           40            1             3 %
COMODITY       71            1             1 %
BONDFUND       112           1             1 %
None: BIGBANKS REGBANKS INFRA  COAL  GOLD
EDU   PIPELINE HOSPITAL
|
 |
Table 5
 RANKING OF KEY DIRECTORIES BASED PCT.OF STOCKS ABOVE 65-DMA
              11/21/17
Bullish = 38
Bearish = 6
---------------------------------------------------------------------------------------
Directory     Current       day-1         day-2         day-3         day-4         day-5
----------------------------------------------------------------------------------------
BIGBANKS       1             1             .857          1             1             1
HOMEBLDG       .941          .882          .882          .882          .882          .941
DJI-13         .923          .846          .846          .923          .923          1
EDU            .857          .857          .857          .857          .857          .857
BIGMIL         .833          .5            .5            .833          .666          .833
NIFTY          .833          .866          .866          .866          .833          .833
SEMI           .816          .816          .786          .755          .74           .77
CHEM           .784          .753          .707          .692          .615          .661
FINANCE        .782          .782          .695          .684          .63           .673
ELECTRON       .776          .776          .743          .72           .675          .703
DOWJONES       .766          .733          .733          .8            .8            .833
SOLAR          .761          .761          .761          .714          .761          .809
REGBANKS       .757          .757          .696          .696          .666          .666
CHINA          .75           .718          .703          .703          .687          .687
INFRA          .727          .727          .727          .727          .636          .727
MORNSTAR       .726          .697          .689          .684          .588          .634
HACKERS        .72           .64           .64           .64           .6            .6
ETFS           .707          .538          .569          .553          .43           .538
UTILITY        .697          .651          .627          .697          .651          .744
MILITARY       .684          .657          .631          .631          .578          .631
GAMING         .678          .714          .678          .678          .642          .678
GREEN          .677          .645          .645          .58           .548          .645
NASD-100       .67           .659          .67           .67           .647          .659
SP500          .67           .664          .654          .666          .617          .668
JETS           .666          .666          .666          .777          .444          .444
SOFTWARE       .666          .651          .606          .636          .575          .59
RUS-1000       .657          .64           .638          .647          .596          .634
COMPUTER       .652          .739          .608          .565          .478          .478
INDEXES        .646          .651          .682          .676          .615          .656
SP-100         .635          .593          .593          .645          .614          .677
AUTO           .625          .625          .55           .6            .55           .575
INSURANC       .625          .687          .656          .687          .687          .75
INDMATER       .604          .582          .538          .516          .494          .527
REIT           .603          .525          .519          .553          .474          .564
FOOD           .6            .533          .6            .466          .466          .533
COMODITY       .549          .521          .619          .464          .464          .492
OILGAS         .52           .52           .569          .555          .576          .638
RETAIL         .509          .622          .584          .49           .415          .415
N=38
===========================================================================================
BEVERAGE       .5            .5            .45           .5            .5            .5
COAL           .5            .625          .625          .5            .5            .625
===========================================================================================
BIOTECH        .451          .425          .438          .418          .376          .371
TRANSP         .45           .35           .3            .55           .25           .35
GOLD           .204          .224          .306          .183          .163          .224
BONDFUND       .16           .098          .151          .125          .178          .098
PIPELINE       .142          0             0             0             0             0
HOSPITAL       0             0             0             0             0             0
N=6
|
| |
================================================================================
================================================================================
11/20/2017
Our official Peerless signal remains the
very bullish
September Buy B21.
Monday was impressive. At one point, the weekend
Futures were down 100 points.
The rally shows Professionals are quite bullish. The ETFs' Closing
Power uptrends
all got lifts. All except Biotechs, that
is.
The New Leaders - Retailers
- 5dma AROC +892%
The typical Thanksgiving rally seems to have started.
If it it can continue, we
could see a really nice December rally, too You have to like the way
the beaten-down
Retailers have quickly moved higher, ever since
Walmart's big jump and RETL
got back above its 65-dma. Shorts have suddenly become very nervous.
The number
of new lows and MINCPs, shown in Table 2, has shrunk way down from three
weeks ago. This has to be bullish. See also the renewed interest in
the smaller stocks,
as represented by IWM.
Now if only the Biotechs will stop falling, we
could see a really nice December rally
in the NASDAQ, too The profit-taking in SOXL
and TECL has been well-absorbed.
Both show across-the-board Bullish Blue QuickSilver values in Table 1.
But first before there can be a real lift-off,
at least some of the bearish-looking
head and shoulders patterns shown below will need to be voided by having the
apexes
of their right shoulders be convincingly exceeded.
Another Hundred-Point Hourly DJI Rally
Will Give The Market A Big Boost.
Charts 11/20/2017
PEERLESS
DJI, Signals, Indicators Daily DJI
Volume 10-DayUp/Down Vol
Hourly DJIA
A/D Line for All Stocks
NASDAQ
S&P
OEX
NYSE
COMPQX
DJI-15 DJI-20
DJI-30
DIA
SPY
QQQ
MDY
IWM TNA
CrudeOil
FAS
GLD
BBH
IBB
JETS
JNUG
KOL
NUGT
OIH
OIL
RSX
RETL
SDS
SLV
SOXL
TECL
TMF
TNA UGA
(gasoline)
XIV YINN
Commodities:
JJC, NIB,
CHOC
CORN,
WEAT
UUP
(Dollar)
AAPL ADBE
ALXN AMAT
AMGN AMD
AMZN
BA BABA BAC
BIDU
CAT
CVX
FB
GOOG
GS
HD
IBM
JPM M
(Macy's)
MSFT
NFLX
NVDA
QCOM
TSLA TXN
XOM WMT
ANDV (refinery,
CMG (Chipotle),
LRCX, SWKS,
TOWN New - SPPI
(small Biotech)
11/20/2017
Bullish MAXCPs Bearish
MINCPs |
Table 1
QuickSilver
Documentation
This is for short-term trading
leveraged ETFs.
It also provides a useful short-term outlook of these sectors ETF's
and the sectors they represewnt
Blue is Bullish
and
Red is Bearish.
1 Candle-Stick color is shortest-term. This
changes when close vis-a-vis opening changes.
So, in stocks or ETFs that advanced a long ways, traders should sell
when a higher
opening gives way to a decline that brings a drop below the previous
day's close.
2 5-dma AROC and Close-versus- pivot point is next
most short-term.
W = warning. Close is below PIVOT-Point.
3 Closing Power trend-direction vs. its 21-dma is next
most short-term.
4 IP21 is used to spot divergences and to estimate
underlying support.
5 > IP21 falling and below +.15 and its 21-dma is bearish in
an over-extended ETF, especially
when its Closing Power is falling and is below its 21-dma.
> IP21 below 07 with AROC below .07 is less likely to bring a rally
back up from 21-dma.
6 Note price trend-lines, support/resistance and price
patterns on charts.
QUICKSILVER on ETFS - 11/20/17
ETF      CLOSE   CHANGE     PIVOT-PT      5-dma AROC   CL-PWR   CANDLE  IP21   ITRS
---------------------------------------------------------------------------------------------
DIA       234.15    .76     W234.28       -10.9%       ----      BLUE   .075    ----
---------------------------------------------------------------------------------------------
COMPQX    6790.71    7.92    6737.87       24.5%       Bullish   BLUE   .306    -.005
---------------------------------------------------------------------------------------------
SPY       258.3    .44       257.73       -.6%         Bullish   BLUE   .22     -.024
---------------------------------------------------------------------------------------------
QQQ       153.83   -.12      153.31       -1.3%        Bullish   RED    .322    -.006
---------------------------------------------------------------------------------------------
MDY       336.26    1.19     332.41        51%         Bullish   BLUE   .278     0
---------------------------------------------------------------------------------------------
IWM       149.53    1.08     146.21        99.4%       Bullish   BLUE   .149     .002
---------------------------------------------------------------------------------------------
FAS       60.02    .59       59.62         36.1%       Bullish   BLUE   .065     .126
---------------------------------------------------------------------------------------------
RETL      29.34    .9        24.85         892.6%      ----      BLUE   .268     .062
---------------------------------------------------------------------------------------------
SOXL      164.27    5.6      158.06        182.6%      Bullish   BLUE   .412     .582
---------------------------------------------------------------------------------------------
TECL      110.49    1.1      109.42        15.1%       Bullish   BLUE   .347     .199
---------------------------------------------------------------------------------------------
IBB       308.33   -2.88     305.05       -28.3%       Bearish   RED   -.062    -.139
---------------------------------------------------------------------------------------------
GLD       122.6    .58       119.46        142.2%      Bullish   BLUE   .092     .004
---------------------------------------------------------------------------------------------
OIL       6   -.05           5.9          -75.6%       Bullish   ----   .26      .142
---------------------------------------------------------------------------------------------
OIH       24.01   -.13      W24.32        -267.5%      ----      RED    .157    -.032
---------------------------------------------------------------------------------------------
GASL      21.75   -.74      W21.91        -647.6%      Bullish   BLUE   .252     .246
---------------------------------------------------------------------------------------------
UGA       31.23   -.19      W31.59        -146.3%      Bullish   BLUE   .34      .041
---------------------------------------------------------------------------------------------
UUP       24.46    .12       24.39        -20.5%       Bearish   BLUE  -.025    -.036
---------------------------------------------------------------------------------------------
IEF       106.01   -.17      105.93        10.8%       ----      ----  -.037    -.079
---------------------------------------------------------------------------------------------
CORN      17.01    .04       16.78         14.8%       Bearish   BLUE  -.106    -.098
---------------------------------------------------------------------------------------------
WEAT      6.16   -.07       W6.25         -56.3%       Bullish   ----   .172    -.103
---------------------------------------------------------------------------------------------
YINN      34.72    1         33.61        -13.3%       ----      BLUE   .024     .088
---------------------------------------------------------------------------------------------
RSX       21.83   -.1        21.79        -87.2%       Bearish   BLUE  -.171    -.068
---------------------------------------------------------------------------------------------
AAPL      169.98   -.17     W171.34       -116.6%      Bullish   RED    .194    -.008
---------------------------------------------------------------------------------------------
GOOG      1018.38   -.71    W1026         -36%         Bullish   RED   -.019     .035
---------------------------------------------------------------------------------------------
MSFT      82.53    .13      W84.05        -84%         Bearish   BLUE  -.099     .043
---------------------------------------------------------------------------------------------
AMZN      1126.31   -3.57   W1136.84      -12.6%       Bullish   RED    .25      .091
---------------------------------------------------------------------------------------------
FB        178.74   -.26      178.07       -.8%         Bullish   RED    .202    -.031
---------------------------------------------------------------------------------------------
NVDA     214.08    2.72     W214.18        34.2%       ----      BLUE   .181     .206
---------------------------------------------------------------------------------------------
BA        264.63    2.37     261.76        42.1%       Bullish   BLUE  -.074     .039
---------------------------------------------------------------------------------------------
GS        238.13    .11      237.24       -44.9%       ----      RED   -.052     .017
|
Table 2
COMPARISONS OF BULLISH AND BEARISH NUMBERS
11/20 11/17
11/16 11/15 11/14 11/13 11/10
11/9 11/8 11/7 11/6
11/3 11/2 11/1
NEWHIGHS 363 244 273 71
198 191
164 157 324 255
466 360 334
272
NEWLOWS 50 229 150
111 150
113 98 93 93 103
96 112 114
70
-----------------------------------------------------------------------------------------------------------
MAXCPs 339 295 321
154 276 259
167 171 188
114
164 140
113
64
MINCPs
52
40
74
105 192
150
138
130
145
213 136 180 214 101
-----------------------------------------------------------------------------------------------------------
TTTNHs
172 169
154
89 125 101
88 82 83
67 95
71 69
43
TTTNLs
184 79 78 211
259 203
237 297 278
352 218 311
313
299
----------------------------------------------------------------------------------------------------------
FASTUP
189 158
148 121 146
148 190 209 208
187 239
190 196 178
FASTDOWN 100 136
177 253
249 260
221 250 259 259 194 214
208
185 |
 Table 2
Count of Stocks and New Highs in Key Tiger Directories
Date = 171120
               No.          NHs            Pct
-------------------------------------------------------------------
HOMEBLDG       17            7             41 %
JETS           9             3             33 %
CHINA          64            16            25 %
GAMING         28            6             21 %
ELECTRON       179           34            19 %
SEMI           131           22            17 %
COMPUTER       23            4             17 %
HACKERS        25            4             16 %
RETAIL         53            8             15 %
===================================================================
INDEXES        195           28            14 %
SOLAR          21            3             14 %
NIFTY          30            4             13 %
MORNSTAR       238           30            13 %
NASD-100       88            11            13 %
SOFTWARE       66            8             12 %
ETFS           65            7             11 %
SP500          486           47            10 %
RUS-1000       840           81            10 %
CHEM           65            5             8 %
DJI-13         13            1             8 %
MILITARY       38            3             8 %
DOWJONES       30            2             7 %
INDMATER       91            6             7 %
GREEN          31            2             6 %
INSURANC       32            2             6 %
FINANCE        92            5             5 %
BIOTECH        386           20            5 %
TRANSP         20            1             5 %
BEVERAGE       20            1             5 %
SP-100         96            4             4 %
REIT           179           7             4 %
AUTO           39            1             3 %
OILGAS         144           3             2 %
------------------------------------------------------------
None:
BIGBANKS   BIGMIL    REGBANKS   INFRA   COAL
GOLD       EDU       UTILITY    PIPELINE
COMODITY   FOOD      BONDFUND   HOSPITAL
|
 |
Table 4 RANKING OF KEY DIRECTORIES BASED PCT.OF STOCKS ABOVE 65-DMA
11/20/17
Bullish = 38
Bearish = 8
---------------------------------------------------------------------------------------
Directory Current day-1 day-2 day-3 day-4 day-5
----------------------------------------------------------------------------------------
BIGBANKS 100% .857 1 1 1 1
HOMEBLDG .882 .882 .882 .882 .941 .882
NIFTY .866 .866 .866 .833 .833 .833
EDU .857 .857 .857 .857 .857 .857
DJI-13 .846 .846 .923 .923 1 1
SEMI .816 .786 .755 .74 .77 .77
N=6
-------------------------------------------------------------------------------------------
FINANCE .782 .695 .684 .63 .673 .663
ELECTRON .776 .743 .72 .675 .703 .703
SOLAR .761 .761 .714 .761 .809 .809
REGBANKS .757 .696 .696 .666 .666 .575
CHEM .753 .707 .692 .615 .661 .676
COMPUTER .739 .608 .565 .478 .478 .478
DOWJONES .733 .733 .8 .8 .833 .866
INFRA .727 .727 .727 .636 .727 .727
CHINA .718 .703 .703 .687 .687 .703
GAMING .714 .678 .678 .642 .678 .642
MORNSTAR .697 .689 .684 .588 .634 .659
INSURANC .687 .656 .687 .687 .75 .781
N=12
------------------------------------------------------------------------------------------
JETS .666 .666 .777 .444 .444 .222
SP500 .664 .654 .666 .617 .668 .664
NASD-100 .659 .67 .67 .647 .659 .67
MILITARY .657 .631 .631 .578 .631 .631
INDEXES .651 .682 .676 .615 .656 .687
SOFTWARE .651 .606 .636 .575 .59 .606
UTILITY .651 .627 .697 .651 .744 .697
GREEN .645 .645 .58 .548 .645 .677
HACKERS .64 .64 .64 .6 .6 .6
RUS-1000 .64 .638 .647 .596 .635 .64
COAL .625 .625 .5 .5 .625 .625
RETAIL .622 .584 .49 .415 .415 .433
AUTO .615 .538 .589 .538 .564 .589
SP-100 .593 .593 .645 .614 .687 .739
INDMATER .582 .538 .516 .494 .527 .593
ETFS .538 .569 .553 .43 .538 .569
FOOD .533 .6 .466 .466 .533 .6
REIT .525 .519 .553 .474 .558 .558
COMODITY .521 .619 .464 .464 .492 .563
OILGAS .52 .569 .555 .576 .638 .715
N=20
------------------------------------------------------------------------------------------
BEVERAGE .5 .45 .5 .5 .5 .55
BIGMIL .5 .5 .833 .666 .833 .833
BIOTECH .424 .437 .417 .375 .373 .391
TRANSP .35 .3 .55 .25 .35 .35
GOLD .224 .306 .183 .163 .244 .285
BONDFUND .098 .151 .125 .178 .107 .08
HOSPITAL 0 0 0 0 0 0
PIPELINE 0 0 0 0 0 0
N=8
|
===============================================================================
11/17/2017
Our official Peerless signal remains the
very bullish
September Buy B21.
But, Friday just could not accommodate bulls with a continuation of
Thursday's
big rally. So, it looks there will be some more weakness on Monday for
the Dow.
It is by no means clear that Professionals will join in the sellers at the
opening
or that the broader NASDAQ will be weak. We will soon be in a normally
bullish
seasonal period. Since 1965, the DJI has risen 67% of the time over
the bext
two months.
(Please note - a B10 appeared
by mistake 10/25/17. The chart below
is correct. The chart shows two bands: +/-1.75% and (brown) +/- 3.5%.)
Still, we know that in 50% of the 8 instances of these
September B21 Buys,
the DJI still needed to tag the lower 3.5% band in November before
rallying much higher.
The NASDAQ's head/shoulders pattern (above) appears to
have been aborted by
Thursday's rally, but apparently we have to watch the H/S pattern
that still might work out in DIA. 232 is the key neckline support for DIA.
The good news is that Thanksgiving week is usually
bullish, And when we
look back at November and December tests of the lower 3% band in years
after a Presidential Election, we find that only 2 times did the lower band
not
hold up: November 1940 and 1948. But in 12 cases, buying at the lower
band
would have been a good idea for the trader.
Other Lengthy Rallies: 1916-2017
The DJI has not tagged its lower 3.5% since June
2016. Perhaps, that is now
over-due. There are only three earlier cases where a DJI rally
lasted longer.
But all these other cases' tops, except the one just before the JFK
assassination's one-day plunge in 1963, showed a previous Peerless
Sell signal.
Lengthy >12 months) Lengthy DJI Rallies
until the DJI's 3.5% Lower Band Is Tagged:
1916 - 2017
Current 6/27/2016 to 11/17/2017 ... 16 + months
6/13/2006 to 7/20/2007 ... 13 + months. Bear Market soon
followed.
11/25/1994 to 4/11/1996 ... 17 + months. 4 more years
of Bull Mkt followed.
10/19/1992 to 3/3/1994 ... 16 + months. 11% correction followed.
12/27/1984 to 4/7/1986 ... 16 + months. Rebounded up from lower band.
11/22/1963 to 6/9/1965 ... 18 + months. 11% correction followed.
10/24/1962 to 11/22/1963 ... 13 months. 7% correct. (JFK assassination.)
12/8/1957 to 8/19/1959 ... 20 + months. 9% correction followed.
6/15/1949 to 6/26/1950 ... 12 months. 13.5% correction. SKorea invaded.
5/1/1942 to 7/27/1943 ... 14+ months. 7% correction.
As it is now, keep in mind, that to reach the lower
band, the DJI-30 would
likely fall without much accompanying breadth-weakness. Thus on
Friday,
the DJI fell 100, but there were still 880 more up than down and NYSE Up
Volume
was 234 million more than Down Volume. Secondly, it looks like the
biggest
pressure on the market, a deeper decline by retail stocks, seems to
have been
postponed. On Friday, RETL gapped up above
its now rising 65-dma on
red high volume. Thirdly, in the semi-conductors,
AMAT's big reversal day
did not spread to other semi-conductors. Thirdly, Biotechs like
IBB are now
probing the support of their 200-day ma. Fourth, industry
groups remain
predominantly bullish. And fifth, Professionals and Day Traders are
now
bullish many more stocks than they are bearish. See Tables 2 and 4.
Retailers' Quandry Points To The Longer-term Dilema for the US Economy
It is not just Amazon and the internet that
are making store front retailers
go out of business. It is the decline of the middle class.
Broad-Based Wage Stagnation
in the US has been evident since the 1970s. So, it
giving the rich more money and
incentives to create jobs was the answer, we should already have a booming
economy.
The truth, of course, is vastly more complex than Paul Ryan makes out.
1) Automation and robotization are here to stay. Giving more money to
corporations
will surely speed up that trend. 2) So, is the export of jobs. Trump is
closing the barn
door only after all the horses a "long gone". 3) Who will buy what
will be made in America
if the number of middle class consumers keeps falling, as it has since the
1970s? Even in
seemingly affluent NY City, the upper West night near Columbia University is
feeling the pain.
A NY Times article called my attention to the plight of the neighborhood
stores and restaurants
that I used to frequent. https://www.nytimes.com/2017/11/19/opinion/nyc-empty-stores.html?emc=edit_th_20171120&nl=todaysheadlines&nlid=58223894
Charts 11/17/2017
PEERLESS
DJI, Signals, Indicators Daily DJI
Volume 10-DayUp/Down Vol
Hourly DJIA
A/D Line for All Stocks
NASDAQ
S&P
OEX
NYSE
COMPQX
DJI-15 DJI-20
DJI-30
DIA
SPY
QQQ
MDY
IWM TNA
CrudeOil
FAS
GLD
BBH
IBB
JETS
JNUG
KOL
NUGT
OIH
OIL
RSX
RETL
SDS
SLV
SOXL
TECL
TMF
TNA UGA
(gasoline)
XIV YINN
Commodities:
JJC, NIB,
CHOC
CORN,
WEAT
UUP
(Dollar)
AAPL ADBE
ALXN AMAT
AMGN AMD
AMZN
BA BABA BAC
BIDU
CAT
CVX
FB
GOOG
GS
HD
IBM
JPM M
(Macy's)
MSFT
NFLX
NVDA
QCOM
TSLA TXN
XOM WMT
ANDV (refinery,
CMG (Chipotle),
LRCX, SWKS,
TOWN New - SPPI
(small Biotech)
11/17/2017
Bullish MAXCPs Bearish
MINCPs |
Table 1
QuickSilver
Documentation
This is for short-term trading
leveraged ETFs.
It also provides a useful short-term outlook of these sectors ETF's
and the sectors they represewnt
Blue is Bullish
and
Red is Bearish.
1 Candle-Stick color is shortest-term. This
changes when close vis-a-vis opening changes.
So, in stocks or ETFs that advanced a long ways, traders should sell
when a higher
opening gives way to a decline that brings a drop below the previous
day's close.
2 5-dma AROC and Close-versus- pivot point is next
most short-term.
W = warning. Close is below PIVOT-Point.
3 Closing Power trend-direction vs. its 21-dma is next
most short-term.
4 IP21 is used to spot divergences and to estimate
underlying support.
5 > IP21 falling and below +.15 and its 21-dma is bearish in
an over-extended ETF, especially
when its Closing Power is falling and is below its 21-dma.
> IP21 below 07 with AROC below .07 is less likely to bring a rally
back up from 21-dma.
6 Note price trend-lines, support/resistance and price
patterns on charts.
QUICKSILVER on ETFS - 11/17/17
ETF      CLOSE   CHANGE     PIVOT-PT    5-dma AROC   CL-PWR   CANDLE  IP21   ITRS
---------------------------------------------------------------------------------------------
DIA       233.39   -1.52    W234.66       -22.2%     ----      RED    .111    ----
---------------------------------------------------------------------------------------------
COMPQX    6782.79   -10.5    6757.6        23.6%     Bullish   RED    .279    -.003
---------------------------------------------------------------------------------------------
SPY       257.86   -.76     W258.33       -4.5%      Bullish   RED    .263    -.024
---------------------------------------------------------------------------------------------
QQQ       153.95   -.59      153.87        8.8%      Bullish   RED    .312    -.002
---------------------------------------------------------------------------------------------
MDY       335.07    .91      332.86        42.9%     Bullish   BLUE   .294     0
---------------------------------------------------------------------------------------------
IWM       148.45    .68      146.61        64.1%     ----      BLUE   .08     -.003
---------------------------------------------------------------------------------------------
FAS       59.43   -.39      W59.59         16%       Bullish   ----   .123     .161
---------------------------------------------------------------------------------------------
RETL      28.44    2.02      24.72         563%      ----      BLUE   .213     .044
---------------------------------------------------------------------------------------------
SOXL      158.67   -2.13     158.5         46%       Bullish   RED    .374     .61
---------------------------------------------------------------------------------------------
TECL      109.39   -1.87    W110.16       -38.8%     Bullish   RED    .325     .229
---------------------------------------------------------------------------------------------
IBB       311.21    .4       310.08       -15.7%     Bearish   BLUE  -.025    -.138
---------------------------------------------------------------------------------------------
GLD       122.6    .58       119.46        142.2%    Bullish   BLUE   .092    -.005
---------------------------------------------------------------------------------------------
OIL       6.05    .19       W6.09         -50.3%     Bullish   BLUE   .259     .158
---------------------------------------------------------------------------------------------
OIH       24.14    .36      W25.31        -333%      ----      BLUE   .165    -.02
---------------------------------------------------------------------------------------------
GASL      22.49    .94      W24.65        -841.5%    ----      RED    .246     .325
---------------------------------------------------------------------------------------------
UGA       31.42    .58      W32.15        -239.4%    Bullish   BLUE   .372     .028
---------------------------------------------------------------------------------------------
UUP       24.34   -.07      W24.56        -40.9%     Bearish   ----  -.039    -.042
---------------------------------------------------------------------------------------------
IEF       106.18    .14      105.78        16.5%     Bearish   ----  -.073    -.092
---------------------------------------------------------------------------------------------
CORN      16.97    .28       16.96        -20.8%     Bearish   BLUE  -.186    -.108
---------------------------------------------------------------------------------------------
WEAT      6.23    .07        6.23         -48.2%     Bullish   ----   .105    -.109
---------------------------------------------------------------------------------------------
YINN      33.72   -.54      W34.81        -221.7%    Bearish   RED    .049     .102
---------------------------------------------------------------------------------------------
RSX       21.93    .27      W22.21        -80%       Bearish   BLUE  -.152    -.056
---------------------------------------------------------------------------------------------
AAPL      170.15   -.95     W173.97       -131.4%    Bullish   RED    .169     .003
---------------------------------------------------------------------------------------------
GOOG      1019.09   -13.41  W1025.75      -43.7%     Bullish   RED    .008     .031
---------------------------------------------------------------------------------------------
MSFT      82.4   -.8        W83.93        -87.9%     Bearish   RED   -.092     .044
---------------------------------------------------------------------------------------------
AMZN      1129.88   -7.41    1129.17       20%       Bullish   RED    .234     .1
---------------------------------------------------------------------------------------------
FB        179   -.59         178.77        15.1%     ----      RED    .187    -.022
---------------------------------------------------------------------------------------------
NVDA     211.36   -.25      W212.63       -112.3%    Bearish   RED    .123     .222
---------------------------------------------------------------------------------------------
BA        262.26   -1.44    W262.42        26.9%     Bullish   RED   -.025     .029
---------------------------------------------------------------------------------------------
GS        238.02   -1.35    W240.27       -44.6%     ----      RED   -.013     .026
|
Table 2
COMPARISONS OF BULLISH AND BEARISH NUMBERS
11/17 11/16
11/15 11/14 11/13 11/10 11/9
11/8 11/7 11/6 11/3 11/2
11/1 10/31
NEWHIGHS 244 273 71
198 191
164 157 324 255
466 360 334
272 392
NEWLOWS 229 150
111 150
113 98 93 93 103
96 112 114
70 170
---------------------------------------------------------------------------------------------------------------
MAXCPs 295 321
154 276 259
167 171 188
114
164 140
113
64
158
MINCPs
40
74
105 192
150
138
130
145
213 136 180 214 101
120
---------------------------------------------------------------------------------------------------------------
TTTNHs 169
154
89 125 101
88 82 83
67 95
71 69
43
76
TTTNLs
79 78 211
259 203
237 297 278
352 218 311
313
299
195
---------------------------------------------------------------------------------------------------------------
FASTUP
158
148 121 146
148 190 209 208
187 239
190 196 178
150
FASTDOWN 136
177 253
249 260
221 250 259 259 194 214
208
185 202 |
Table 3
  Count of Stocks and New Highs in Key Tiger Directories
Date = 171117
               No.           NHs           Pct
-------------------------------------------------------------------
HOMEBLDG       17            5             29 %
HACKERS        25            5             20 %
GAMING         28            5             18 %
===================================================================
CHINA          64            9             14 %
EDU            7             1             14 %
ELECTRON       179           20            11 %
SOFTWARE       66            7             11 %
NASD-100       88            10            11 %
JETS           9             1             11 %
BEVERAGE       20            2             10 %
MORNSTAR       238           22            9 %
COMPUTER       23            2             9 %
INDEXES        195           16            8 %
SEMI           131           10            8 %
RETAIL         53            4             8 %
NIFTY          30            2             7 %
RUS-1000       840           63            7 %
ETFS           65            4             6 %
SP500          486           31            6 %
INSURANC       32            2             6 %
CHEM           65            3             5 %
FINANCE        92            5             5 %
TRANSP         20            1             5 %
SOLAR          21            1             5 %
UTILITY        43            2             5 %
GREEN          31            1             3 %
DOWJONES       30            1             3 %
MILITARY       38            1             3 %
INDMATER       92            3             3 %
OILGAS         144           5             3 %
BIOTECH        385           13            3 %
REIT           179           3             2 %
SP-100         96            1             1 %
COMODITY       70            1             1 %
None: BIGBANKS BIGMIL REGBANKS  AUTO  DJI-13
INFRA COAL  GOLD  PIPELINE  FOOD BONDFUND HOSPITAL
|
 |
Table 4
 RANKING OF KEY DIRECTORIES BASED PCT.OF STOCKS ABOVE 65-DMA
              11/17/17
Bullish = 38
Bearish = 8
---------------------------------------------------------------------------------------
Directory     Current       day-1         day-2         day-3         day-4         day-5
----------------------------------------------------------------------------------------
HOMEBLDG       .882          .882          .882          .941          .882          .882
NIFTY          .866          .866          .833          .833          .833          .8
BIGBANKS       .857          1             1             1             1             1
EDU            .857          .857          .857          .857          .857          .857
DJI-13         .846          .923          .923          1             1             1
--------------------------------------------------------------------------------------------
SEMI           .786          .755          .74           .77           .763          .763
SOLAR          .761          .714          .761          .809          .809          .809
ELECTRON       .743          .72           .675          .703          .703          .715
DOWJONES       .733          .8            .8            .833          .866          .866
INFRA          .727          .727          .636          .727          .727          .818
CHEM           .707          .692          .615          .661          .676          .676
CHINA          .703          .703          .687          .687          .703          .703
REGBANKS       .696          .696          .666          .666          .575          .363
FINANCE        .695          .684          .63           .673          .673          .597
MORNSTAR       .689          .684          .588          .634          .668          .63
INDEXES        .682          .676          .615          .656          .687          .687
GAMING         .678          .678          .642          .678          .642          .642
NASD-100       .67           .67           .647          .659          .67           .636
JETS           .666          .777          .444          .444          .222          .222
INSURANC       .656          .687          .687          .75           .781          .781
SP500          .654          .666          .617          .668          .664          .646
GREEN          .645          .58           .548          .645          .677          .645
HACKERS        .64           .64           .6            .6            .6            .64
RUS-1000       .638          .647          .596          .635          .639          .622
MILITARY       .631          .631          .578          .631          .631          .684
COMODITY       .628          .471          .471          .5            .571          .585
UTILITY        .627          .697          .651          .744          .697          .651
COAL           .625          .5            .5            .625          .625          .5
COMPUTER       .608          .565          .478          .478          .478          .565
SOFTWARE       .606          .636          .575          .59           .606          .621
FOOD           .6            .466          .466          .533          .6            .666
SP-100         .593          .645          .614          .687          .739          .718
RETAIL         .584          .49           .415          .415          .433          .471
ETFS           .569          .553          .43           .538          .569          .692
OILGAS         .569          .555          .576          .638          .715          .715
AUTO           .538          .589          .538          .564          .589          .589
INDMATER       .532          .51           .489          .521          .586          .576
REIT           .519          .553          .474          .558          .564          .536
==============================================================================================
BIGMIL         .5            .833          .666          .833          .833          .833
BEVERAGE       .45           .5            .5            .5            .55           .5
BIOTECH        .438          .418          .376          .374          .397          .431
GOLD           .3            .18           .16           .24           .28           .26
TRANSP         .3            .55           .25           .35           .35           .25
BONDFUND       .151          .125          .178          .107          .08           .08
HOSPITAL       0             0             0             0             0             .125
PIPELINE       0             0             0             0             0             0
|
================================================================================
11/16/2017
Our official Peerless signal remains the
very bullish September
Buy B21.
The Buy B21 seems vindicated. Today the
DJI jumped up 94 points at the
opening and just kept rising for much of the rest of the day. Given
the
likely upwards direction of the market next week because of the Thanksgiving
seasonality, more new highs by the DJI seem quite likely and very soon.
A little more follow-through strength would cast the
Hourly DJI in a more bullish
light and a rise in NYSE volume would help,
too. Not to be picky, but the
the DJIA's 5-day ma has not yet turned up.
Still, the quick passage today in the House of
Representatives of the Trump tax bill
puts added pressure on the Republican hold-outs in the Senate.
This is what the market
really wants.
See
https://www.nytimes.com/2017/11/16/us/politics/house-tax-overhaul-bill.html?emc=edit_th_20171117&nl=todaysheadlines&nlid=58223894
A new optimism has swept over Wall Street. Today's technical
developments were quite bullish:
1) Breadth was excellent today. There were
1472 more up than down on the NYSE.
This statistic has not been so positive since
early August.
2) Today's big rally destroyed the potential
head and shoulders patterns in
the NASDAQ, DIA and SPY that had been looming bearishly over the
market.
See how the steeply rising Closing Powers and high Accumulation overwhelmed
the compact little head/shoulders patterns in price. The shorts are
under great
pressure to scramble and cover.
3) Some of the most important ETFs closed above
their 5-day pivot-points and
near the day's highs.
This has given DIA, SPY, QQQ, COMPQX, TECL
and SOXL
the QuickSilver across-the-board Bullish (blue) status. See table 1
further below.
4) Walmart's 10 point leap upwards today should
give some energy to the market's weakest
group, the retailers.
5) Semi-conductors regained their leadership role as
AMAT and CDNS made new highs
and TXN bullishly aborted its nascent head/shoulders pattern.
November Is Usually Bullish Given The Present
Technical Parameters.
I've taken the current key values to the DJI
chart and sought to match them
in past Novembers. I used the following historical search paramaters.
You can
see they generally bracket today's key values on the Peerless chart just
above.
Month must be 11 (November)
LA/MA must be between 1.01 and 1.01
AROC must be between .1 and .5
PI must be less than zero.
IP21 must be between .04 and .1
The DJI must be up between 0% and 10% (.10) for the last 65 trading days.
I found five past matches. They were in
1949,
1993,
1995,
1996
and
2015.
As you can seem the market rose quite bullishly in the first four but topped
out
a few weeks later in November 2015. (In conjunction with the new
Peerless
book's writing, I have written new 'in-house' software today that should
allow
more such matches between salient current technical readings. "Stay
tuned".)
and those in the past).
Charts 11/16/2017
PEERLESS
DJI, Signals, Indicators Daily DJI
Volume 10-DayUp/Down Vol
Hourly DJIA
A/D Line for All Stocks
NASDAQ
S&P
OEX
NYSE
COMPQX
DJI-15 DJI-20
DJI-30
DIA
SPY
QQQ
MDY
IWM TNA
CrudeOil
FAS
GLD
BBH
IBB
JETS
JNUG
KOL
NUGT
OIH
OIL
RSX
RETL
SDS
SLV
SOXL
TECL
TMF
TNA UGA
(gasoline)
XIV YINN
Commodities:
JJC, NIB,
CHOC
CORN,
WEAT
UUP
(Dollar)
AAPL ADBE
ALXN AMAT
AMGN AMD
AMZN
BA BABA BAC
BIDU
CAT
CVX
FB
GOOG
GS
HD
IBM
JPM M
(Macy's)
MSFT
NFLX
NVDA
QCOM
TSLA TXN
XOM WMT
ANDV (refinery,
CMG (Chipotle),
LRCX, SWKS,
TOWN New - SPPI
(small Biotech)
11/16/2017
Bullish MAXCPs Bearish
MINCPs |
Table 1
QuickSilver
Documentation
This is for short-term trading
leveraged ETFs.
It also provides a useful short-term outlook of these sectors ETF's
and the sectors they represewnt
Blue is Bullish
and
Red is Bearish.
1 Candle-Stick color is shortest-term. This
changes when close vis-a-vis opening changes.
So, in stocks or ETFs that advanced a long ways, traders should sell
when a higher
opening gives way to a decline that brings a drop below the previous
day's close.
2 5-dma AROC and Close-versus- pivot point is next
most short-term.
W = warning. Close is below PIVOT-Point.
3 Closing Power trend-direction vs. its 21-dma is next
most short-term.
4 IP21 is used to spot divergences and to estimate
underlying support.
5 > IP21 falling and below +.15 and its 21-dma is bearish in
an over-extended ETF, especially
when its Closing Power is falling and is below its 21-dma.
> IP21 below 07 with AROC below .07 is less likely to bring a rally
back up from 21-dma.
6 Note price trend-lines, support/resistance and price
patterns on charts.
QUICKSILVER on ETFS - 11/16/17
ETF      CLOSE   CHANGE     PIVOT-PT      5-dma AROC   CL-PWR   CANDLE  IP21   ITRS
---------------------------------------------------------------------------------------------
DIA       234.91    1.95     234.43        4.1%   Bullish      BLUE    .208     0
---------------------------------------------------------------------------------------------
COMPQX    6793.29   87.08   6750.94       32.1%   Bullish      BLUE    .344    -.015
---------------------------------------------------------------------------------------------
SPY       258.62    2.18     258.09        8.7%   Bullish      BLUE    .35    -.029
---------------------------------------------------------------------------------------------
QQQ       154.54    1.95     153.68        27.7%  Bullish      BLUE    .388    -.015
---------------------------------------------------------------------------------------------
MDY       334.16    3.29     332.22        28.8%  Bullish      BLUE    .306    -.008
---------------------------------------------------------------------------------------------
IWM       147.77    2.14     146.57        37.2%   ----        BLUE    .094    -.015
---------------------------------------------------------------------------------------------
FAS       59.82    .48       59.24         22.7%   Bullish     RED     .155     .178
---------------------------------------------------------------------------------------------
RETL      26.42    1.45      25.59         342.4%  Bearish     BLUE    -.041    -.067
---------------------------------------------------------------------------------------------
SOXL      160.8    6.93      157.22        208.1%  Bullish     BLUE     .443     .562
---------------------------------------------------------------------------------------------
TECL      111.26    4.32     110.24        37%     Bullish     BLUE     .376     .211
---------------------------------------------------------------------------------------------
IBB       310.81    4.56    W312.18       -3.7%     Bearish      BLUE    -.037    -.15
---------------------------------------------------------------------------------------------
GLD       122.6    .58       119.46        142.2%   Bullish    BLUE     .092    -.013
---------------------------------------------------------------------------------------------
OIL       5.86    0         W6.11         -224.3%   Bullish    ----     .228     .059
---------------------------------------------------------------------------------------------
OIH       23.78   -.15      W25.78        -442.8%   Bearish    RED      .108    -.064
---------------------------------------------------------------------------------------------
GASL      21.55    .19      W26.39        -1018.4%  Bullish    ----     .232     .138
---------------------------------------------------------------------------------------------
UGA       30.84   -.4       W32.94        -284.9%   Bullish     RED     .324    -.006
---------------------------------------------------------------------------------------------
UUP       24.41    .03      W24.54        -30.6%   Bearish      ----   -.017    -.05
---------------------------------------------------------------------------------------------
IEF       106.04   -.27      105.83       -15.6%   Bearish      RED    -.093    -.102
---------------------------------------------------------------------------------------------
CORN      16.69   -.12      W17.04        -91.6%   Bearish      RED    -.34    -.129
---------------------------------------------------------------------------------------------
WEAT      6.16   -.04       W6.29         -72.1%   Bullish      ----    .056    -.125
---------------------------------------------------------------------------------------------
YINN      34.26    1.86     W35.23        -48.3%   Bearish      BLUE    .113     .098
---------------------------------------------------------------------------------------------
RSX       21.66    .28      W22.28        -168.1%  Bearish      BLUE   -.194    -.085
---------------------------------------------------------------------------------------------
AAPL      171.1    2.02     W174.67       -138.2%  Bullish      RED     .174    -.016
---------------------------------------------------------------------------------------------
GOOG      1032.5    11.59   1028.07       6%       Bullish      BLUE    .053     .026
---------------------------------------------------------------------------------------------
MSFT      83.2    .22       W83.87        -53.1%   Bearish      BLUE   -.036     .042
---------------------------------------------------------------------------------------------
AMZN      1137.29    10.6    1125.35       36.1%   Bullish      BLUE    .249     .084
---------------------------------------------------------------------------------------------
FB        179.59    1.64     178.46        8.1%     ----        BLUE    .222    -.04
---------------------------------------------------------------------------------------------
NVDA     211.61    1.63     W216.14        148.6%   ----        RED     .203     .193
---------------------------------------------------------------------------------------------
BA        263.7    .84       260.85        19.1%   Bullish      RED     .032     .039
---------------------------------------------------------------------------------------------
GS        239.37    1.76    W240.15       -29.7%   ----         BLUE    .009     .032
|
Table 2
COMPARISONS OF BULLISH AND BEARISH NUMBERS
11/16
11/15 11/14 11/13 11/10 11/9
11/8 11/7 11/6 11/3 11/2
11/1 10/31 10/30
NEWHIGHS 273
71
198 191
164 157 324 255
466 360 334
272 392 190
NEWLOWS 150
111 150
113 98
93 93 103
96 112 114
70 170
84
---------------------------------------------------------------------------------------------------------------
MAXCPs 321
154 276 259
167 171 188
114
164 140
113
64
158
97
MINCPs
74
105 192
150
138
130
145
213 136
180 214 101
120 139
---------------------------------------------------------------------------------------------------------------
TTTNHs
154
89 125 101
88 82 83
67 95
71 69
43
76
72
TTTNLs
78 211
259 203
237 297 278
352 218 311
313
299
195 151
---------------------------------------------------------------------------------------------------------------
FASTUP
148 121 146
148 190
209 208
187 239
190 196 178
150 112
FASTDOWN
177 253
249 260
221 250 259 259
194 214
208
185 202 200
|
Table 3
Count of Stocks and New Highs in Key Tiger Directories
Date = 171116
               No.           NHs           Pct.
-------------------------------------------------------------------
NIFTY          30            7             23 %
GAMING         28            6             21 %
HACKERS        25            4             16 %
CHINA          64            10            16 %
SOFTWARE       66            10            15 %
NASD-100       88            13            15 %
ELECTRON       179           25            14 %
SEMI           131           18            14 %
EDU            7             1             14 %
COMPUTER       23            3             13 %
JETS           9             1             11 %
MORNSTAR       238           24            10 %
SOLAR          21            2             10 %
INDEXES        195           18            9 %
UTILITY        43            4             9 %
SP500          486           40            8 %
RUS-1000       841           71            8 %
RETAIL         53            4             8 %
DOWJONES       30            2             7 %
HOMEBLDG       17            1             6 %
CHEM           65            4             6 %
ETFS           65            4             6 %
INSURANC       32            2             6 %
SP-100         96            5             5 %
TRANSP         20            1             5 %
INDMATER       92            4             4 %
BIOTECH        387           14            4 %
GREEN          31            1             3 %
REGBANKS       33            1             3 %
REIT           179           5             3 %
FINANCE        92            2             2 %
OILGAS         144           3             2 %
Rest                                       0%
|
 RANKING OF KEY DIRECTORIES BASED PCT.OF STOCKS ABOVE 65-DMA
              11/16/17
 Bullish = 36
 Bearish = 8
---------------------------------------------------------------------------------------
Directory     Current       day-1         day-2         day-3         day-4         day-5
----------------------------------------------------------------------------------------
BIGBANKS       100%          1             1             1             1             1
DJI-13         .923          .923          1             1             1             1
HOMEBLDG       .882          .882          .941          .882          .882          .882
NIFTY          .866          .833          .833          .833          .8            .8
EDU            .857          .857          .857          .857          .857          .857
BIGMIL         .833          .666          .833          .833          .833          .833
DOWJONES       .8            .8            .833          .866          .866          .866
JETS           .777          .444          .444          .222          .222          .222
SEMI           .755          .74           .77           .763          .77           .778
INFRA          .727          .636          .727          .727          .818          .909
ELECTRON       .72           .675          .703          .703          .715          .72
SOLAR          .714          .761          .809          .809          .809          .857
CHINA          .703          .687          .687          .703          .703          .656
UTILITY        .697          .651          .744          .697          .651          .697
REGBANKS       .696          .666          .666          .575          .363          .484
CHEM           .692          .615          .661          .676          .676          .676
INSURANC       .687          .687          .75           .781          .781          .781
FINANCE        .684          .63           .673          .673          .597          .608
MORNSTAR       .684          .588          .634          .668          .638          .638
GAMING         .678          .642          .678          .642          .642          .607
INDEXES        .676          .615          .656          .687          .692          .651
NASD-100       .67           .647          .659          .67           .636          .636
SP500          .666          .617          .668          .664          .646          .648
RUS-1000       .648          .596          .636          .639          .623          .626
SP-100         .645          .614          .687          .739          .729          .77
HACKERS        .64           .6            .6            .6            .64           .6
SOFTWARE       .636          .575          .59           .606          .621          .621
MILITARY       .631          .578          .631          .631          .684          .71
AUTO           .589          .538          .564          .589          .589          .589
GREEN          .58           .548          .645          .677          .645          .612
COMPUTER       .565          .478          .478          .478          .565          .521
OILGAS         .555          .576          .638          .715          .715          .736
ETFS           .553          .43           .538          .569          .692          .707
REIT           .553          .474          .558          .564          .541          .525
TRANSP         .55           .25           .35           .35           .3            .3
INDMATER       .51           .489          .521          .586          .586          .608
N=36
=============================================================================================
BEVERAGE       .5            .5            .5            .55           .5            .4
COAL           .5            .5            .625          .625          .5            .375
=============================================================================================
RETAIL         .49           .415          .415          .433          .471          .396
FOOD           .466          .466          .533          .6            .666          .733
COMODITY       .463          .463          .492          .565          .579          .594
BIOTECH        .416          .374          .372          .395          .434          .41
GOLD           .18           .16           .24           .28           .26           .3
BONDFUND       .125          .178          .107          .08           .089          .178
HOSPITAL       0             0             0             0             .125          .125
PIPELINE       0             0             0             0             0             0
N= 8
|
=================================================================================
=================================================================================
11/15/2017
Our official Peerless signal remains the
very bullish September
Buy B21.
Despite a big drop at the opening, the DIA, SPY and
the NASDAQ could not break
decisively below the neckline-supports of their head/shoulders' patterns.
Helping the markets,
The Labor Department reported Wednesday morning that the CPI hardly moved up
at all in October. In addition, real wages actually fell.
Without wage inflation, one might
hope that Fed could relax a little bit about raising raising rates.
That news did not stop
short-term rates from rising. That, in turn, stopped the Utilities'
defensive rally.
https://www.bls.gov/news.release/cpi.nr0.htm (CPI)
https://www.bls.gov/news.release/realer.nr0.htm
(wages)
Christmas advertising has started already. Depressed retailers are
betting there will be
a turn-inwards in Holiday sales. Retailers' stocks blipped up today.
.A continuation
of RETL's rally-attempt should take some pressure off the stock market,
especially
among regional banks. This ought then allow the SP-500 to make new
highs
in the bullish month of December.
This would be very consistent with the past
history of September Buy B21s where
50% of the time the DJI only drops to slightly below the 21-day ma in
November
and 50% of the time it declines just to a point just above the lower 3.5%
band.
A brief decline at this time would also be in keeping with the very high
levels of
current Accumulation (IP21), which we see in the NASDAQ, DIA, SPY, QQQ,
SOXL and TECL. See Table 1 below
Let's still be cautious. These key ETFs are still considerably below
tomorrow's
pivot-points and show falling 5-day moving averages.
See Table 1.
Charts 11/15/2017
PEERLESS
DJI, Signals, Indicators Daily
DJI Volume 10-DayUp/Down Vol
Hourly DJIA
A/D Line for All
Stocks
NASDAQ
S&P
OEX
NYSE
COMPQX
DJI-15 DJI-20
DJI-30
DIA
SPY
QQQ
MDY
IWM TNA
CrudeOil
FAS
GLD
BBH
IBB
JETS
JNUG
KOL
NUGT
OIH
OIL
RSX
RETL
SDS
SLV
SOXL
TECL
TMF
TNA UGA
(gasoline)
XIV YINN
Commodities:
JJC, NIB,
CHOC
CORN,
WEAT
UUP
(Dollar)
AAPL ADBE
ALXN AMAT
AMGN AMD
AMZN
BA BABA BAC
BIDU
CAT
CVX
FB
GOOG
GS
HD
IBM
JPM M
(Macy's)
MSFT
NFLX
NVDA
QCOM
TSLA TXN
XOM
ANDV (refinery, CMG (Chipotle),
LRCX, SWKS, TOWN
New - SPPI
(small Biotech)
11/15/2017
Bullish MAXCPs Bearish
MINCPs |
Table 1
Tiger's QUICKSILVER
Evaluation of MAJOR ETFS and KEY STOCKS:
QuickSilver Documentation
This is for short-term trading leveraged ETFs.
It also provides a useful short-term outlook of these sectors ETF's and the sectors they
represewnt
Blue is Bullish and
Red is Bearish.
1 Candle-Stick color is shortest-term. This changes when close vis-a-vis opening changes.
So, in stocks or ETFs that advanced a long ways, traders should sell when a higher
opening gives way to a decline that brings a drop below the previous day's close.
2 5-dma AROC and Close-versus- pivot point is next most short-term.
W = warning. Close is below PIVOT-Point.
3 Closing Power trend-direction vs. its 21-dma is next most short-term.
4 IP21 is used to spot divergences and to estimate underlying support.
5 > IP21 falling and below +.15 and its 21-dma is bearish in an
over-extended ETF, especially
when its Closing Power is falling and is below its 21-dma.
> IP21 below 07 with AROC below .07 is less likely to bring a rally back up from 21-dma.
6 Note price trend-lines, support/resistance and price patterns on charts. QUICKSILVER on ETFS - 11/15/17
ETF      CLOSE   CHANGE     PIVOT-PT      5-dma AROC   CL-PWR   CANDLE  IP21   ITRS
---------------------------------------------------------------------------------------------
DIA       232.96   -1.32    W234.72       -53.3%       Bullish   RED    .213     0
---------------------------------------------------------------------------------------------
COMPQX    6706.21   -31.66  W6750.05      -61.4%       Bullish   BLUE   .317    -.018
---------------------------------------------------------------------------------------------
SPY       256.44   -1.29    W258.17       -51.7%       Bullish   RED    .333    -.029
---------------------------------------------------------------------------------------------
QQQ       152.59   -.72     W153.69       -62.1%       Bullish   ----   .36    -.016
---------------------------------------------------------------------------------------------
MDY       330.87   -1.54    W332.25       -45.5%       Bullish   BLUE   .292    -.013
---------------------------------------------------------------------------------------------
IWM       145.63   -.58     W146.68       -53.5%       Bearish   BLUE   .075    -.023
---------------------------------------------------------------------------------------------
FAS       59.34   -.28      W59.55        -57.9%       Bullish   BLUE   .202     .147
---------------------------------------------------------------------------------------------
RETL      24.97    .12       24.71         285.6%      Bearish   BLUE  -.089    -.091
---------------------------------------------------------------------------------------------
SOXL      153.87   -4.19    W154.29       -328.8%      Bullish   ----   .458     .508
---------------------------------------------------------------------------------------------
TECL      106.94   -2.48    W110.45       -274.3%      Bullish   RED    .371     .182
---------------------------------------------------------------------------------------------
IBB       306.25    1.2     W311.04       -105.6%      Bearish   BLUE  -.092    -.151
---------------------------------------------------------------------------------------------
GLD       122.6    .58       119.46        142.2%      Bullish   BLUE   .092    -.003
---------------------------------------------------------------------------------------------
OIL       5.86   -.04       W6.13         -189.6%      Bullish   ----   .228     .073
---------------------------------------------------------------------------------------------
OIH       23.93   -.39      W26           -381%        Bearish   RED    .091    -.051
---------------------------------------------------------------------------------------------
GASL      21.36   -.55      W26.47        -822.7%      Bullish   RED    .196     .121
---------------------------------------------------------------------------------------------
UGA       31.24   -.35      W32.67        -245.1%      Bullish   RED    .384     .005
---------------------------------------------------------------------------------------------
UUP       24.38   -.01      W24.56        -57%         Bearish   ----  -.049    -.049
---------------------------------------------------------------------------------------------
IEF       106.31    .38     W106.37       -4.7%        Bullish   ----  -.024    -.085
---------------------------------------------------------------------------------------------
CORN      16.81    .03      W17           -123.5%      Bearish   ----  -.291    -.125
---------------------------------------------------------------------------------------------
WEAT      6.2   -.05        W6.25         -48%         Bullish   ----   .069    -.128
---------------------------------------------------------------------------------------------
YINN      32.4   -1.21      W34.59        -301.1%      Bearish   RED    .117     .054
---------------------------------------------------------------------------------------------
RSX       21.38   -.41      W22.4         -231.8%      Bearish   RED   -.263    -.079
---------------------------------------------------------------------------------------------
AAPL      169.08   -2.26    W175.88       -205.3%      Bullish   RED    .157    -.023
---------------------------------------------------------------------------------------------
GOOG      1020.91   -5.09   W1031.26      -91.9%       Bullish   BLUE   .042     .033
---------------------------------------------------------------------------------------------
MSFT      82.98   -1.07     W84.09        -93.9%       Bearish   RED   -.041     .063
---------------------------------------------------------------------------------------------
AMZN      1126.69   -10.15  W1129.13      -27.4%       Bullish   RED    .199     .097
---------------------------------------------------------------------------------------------
FB        177.95   -.12     W179.3        -45%         ----      BLUE   .179    -.033
---------------------------------------------------------------------------------------------
NVDA     209.98   -4.2       205.32        19.4%       Bullish   RED    .268     .199
---------------------------------------------------------------------------------------------
BA        262.86    1.1      262.7        -51.6%       Bullish   BLUE   .077     .053
---------------------------------------------------------------------------------------------
GS        237.61    .37     W240.79       -75.9%       Bullish   BLUE   .076     .018
|
 |
 |
Table 2
COMPARISONS OF BULLISH AND BEARISH NUMBERS
11/15 11/14
11/13 11/10 11/9 11/8 11/7
11/6 11/3 11/2
11/1 10/31 10/30 10/27
NEWHIGHS 71
198 191
164 157 324 255
466 360 334
272 392 190
480
NEWLOWS 111 150 113 98 93 93 103 96 112
114 70
170 84
83
--------------------------------------------------------------------------------------------------------------------
MAXCPs 154 276 259
167 171 188
114 164 140
113
64
158
97
184
MINCPs
105 192
150
138
130
145 213 136 180 214 101
120 139
162
--------------------------------------------------------------------------------------------------------------------
TTTNHs
89 125 101 88 82 83 67 95
71 69
43
76
72 76
TTTNLs
211 259 203 237 297 278 352 218 311
313
299 195
151
224
---------------------------------------------------------------------------------------------------------------------
FASTUP
121 146 148 190 209
208
187 239
190 196 178
150 112
95
FASTDOWN
253 249 260 221 250 259 259 194
214 208
185 202 200
115
|
| |
| |
Table 4
 RANKING OF KEY DIRECTORIES BASED PCT.OF STOCKS ABOVE 65-DMA
              11/15/17

Bullish = 30
Bearish = 14
---------------------------------------------------------------------------------------
Directory     Current       day-1         day-2         day-3         day-4         day-5
----------------------------------------------------------------------------------------
BIGBANKS       1             1             1             1             1             1
DJI-13         .923          1             1             1             1             1
HOMEBLDG       .882          .941          .882          .882          .882          .882
EDU            .857          .857          .857          .857          .857          .857
NIFTY          .833          .833          .833          .8            .833          .833
DOWJONES       .8            .833          .866          .866          .866          .866
SOLAR          .761          .809          .809          .809          .857          .809
SEMI           .74           .77           .763          .77           .778          .809
CHINA          .687          .687          .703          .703          .671          .687
INSURANC       .687          .75           .781          .781          .781          .718
ELECTRON       .675          .703          .703          .715          .72           .737
BIGMIL         .666          .833          .833          .833          .833          .833
REGBANKS       .666          .666          .575          .363          .484          .545
UTILITY        .651          .744          .697          .651          .697          .72
NASD-100       .647          .659          .67           .636          .636          .681
GAMING         .642          .678          .642          .642          .642          .642
INFRA          .636          .727          .727          .818          .909          .909
FINANCE        .63           .673          .673          .597          .608          .619
SP500          .617          .668          .664          .646          .652          .668
CHEM           .615          .661          .676          .676          .692          .723
INDEXES        .615          .656          .687          .692          .651          .661
SP-100         .614          .687          .739          .729          .76           .77
HACKERS        .6            .6            .6            .64           .6            .64
RUS-1000       .596          .636          .639          .623          .627          .643
MORNSTAR       .588          .634          .668          .638          .642          .684
MILITARY       .578          .631          .631          .684          .684          .815
OILGAS         .576          .638          .715          .715          .736          .736
SOFTWARE       .575          .59           .606          .621          .621          .666
GREEN          .548          .645          .677          .645          .612          .645
AUTO           .538          .564          .589          .589          .589          .692
Bullish = 30
==========================================================================================
BEVERAGE       .5            .5            .55           .5            .4            .35
COAL           .5            .625          .625          .5            .375          .5
==========================================================================================
INDMATER       .489          .521          .586          .586          .619          .608
COMPUTER       .478          .478          .478          .565          .521          .521
REIT           .474          .558          .564          .541          .519          .53
FOOD           .466          .533          .6            .666          .733          .733
COMODITY       .457          .485          .557          .571          .585          .585
JETS           .444          .444          .222          .222          .222          .333
ETFS           .43           .538          .569          .692          .707          .784
RETAIL         .415          .415          .433          .471          .415          .32
BIOTECH        .374          .372          .395          .434          .413          .439
TRANSP         .25           .35           .35           .3            .3            .6
BONDFUND       .178          .107          .08           .089          .178          .223
GOLD           .16           .24           .28           .26           .3            .32
HOSPITAL       0             0             0             .125          .125          .125
PIPELINE       0             0             0             0             0             0
Bearish = 14
|
=================================================================================
11/14/2017 Has
Republican Congressional Leadership Hit The Panic Button regarding
The Tax Cut? Their Sudden "Switcheroo" Is Bound To Worry Many
Investors.
Completed Head/Shoulders in DJI, SP-500 and NASDAQ
could be judged
to be a Sell S10, even though the patterns are small. But I would wait
to make
that official. The good news is that the 65-dma supports should hold.
Traders should hedge with more Bearish MINCPs, especially among Airlines and
Biotechs.
Our official Peerless signal will remain the
very bullish Buy
September B21.
But the completion of these H/S patterns is clearly bearish, as today's very
weak
opening shows. Take more Bearish
MINCP shorts. Abide
by the falling 5-day moving
averages shown in Table 1. Almost all the ETFs now show this.
We should not be surprised by this decline to the
65-dma.
As noted already, half of the
previous September B21s led to November declines down to the rising 65-dma
or very near to
the lower band. I also noted this weekend a price would probably have
to be paid for
the sizeable fall in the P-Indicator on the last new high. Now the
quick development of
head/shoulders patterns in the NASDAQ, SP-500 and DIA (DJI), which are
considerably above
their 65-dma, are consistent with such a decline. I've studied these
patterns in this position.
.When they occur quite a ways above a rising 65-dma and also show very
positive IP21-
Accumulation readings, the most frequent outcome is a decline only to
the rising 65-dma.
But these H/S patterns are significant. They
show that the market must
suddenly take into account bearish news that it had not previously fully
discounted.
That news came out on two fronts today. The October Producer Price
Index (PPI) rose 0.4%
(or 4.8% annualized). If the PPI continues to rise at this pace, it
would suggest inflation has
picked up considerably. Tomorrow morning, the Labor Dept will provide
another key measure
of inflation, the Consumer Price Index. Watch for it. Anything
that annualizes above 4% will
almost certainly cause the Fed to raise rates more aggressively.
Later today, the second piece of bearish news broke.
It is more bearish. The Republicans in
Congress and the White House are starting to feel heat from the Bond Market
side
of Wall Street. The risk of a big tax cut hurting Government revenue is too
high. So now,
the new tax cut legislation suddenly WILL include an ending to the expensive
Obama Care
"mandate". I would say this dramatically lowers the odds of tax cut
legislation being passed
this year, though Goldman Sachs says it raises it. Right now, the
skittishness of the market
suggests lots of others investors are shaking their heads in wonderment
about the unsteadiness
of the Republican Congressional leadership. Predictability and consistency
are important
to investors. The head and shoulders pattern in the DJI, SP-500 and
NASDAQ reflect
the market's need to quickly revise downward its estimations of a tax bill
passing. This makes
a decline to the DJI's rising 65-dma seem quite likely.
(See
https://www.nytimes.com/2017/11/14/us/politics/tax-plan-senate-obamacare-individual-mandate-trump.html?emc=edit_th_20171115&nl=todaysheadlines&nlid=58223894
https://www.washingtonpost.com/business/economy/sen-paul-plans-amendment-to-gut-obamacare-in-tax-bill-testing-gop-unity/2017/11/14/f95066c6-c94e-11e7-8321-481fd63f174d_story.html?hpid=hp_hp-top-table-main_goptax-1230p%3Ahomepage%2Fstory&utm_term=.afba1f2a4171
)
WHAT TO DO.
I'm hoping some of you reduced your trading positions
last week, when that was suggested.
Now traders should just let the decline play itself out. As long as
the 5-day moving averages
are falling, there would seem to be no reason to buy back these positions in
DIA, SPY or
the NASDAQ. Let's see if they fall by Monday to their 65-dma and
fulfill the minimum
downside objectives of their head/shoulders patterns. A Thanksgiving
Rally should then
be attempted.
At the same time,I'm hoping some of you have shorted a
few of our bearish MINCPs.
Add to those positions is my counsel. Here we want to focus on stocks
showing lots of
recent red Distribution, a very weak Closing Power and poor relative
strength. I would
also look to those Industry Groups or Sectors showing the most new
lows in the last few
trading days. That means Biotechs (10 tonight), Pipelines (4 of 7) and
Jets (2/7).
Charts 11/14/2017
PEERLESS
DJI, Signals, Indicators Daily
DJI Volume 10-DayUp/Down Vol
Hourly DJIA
A/D Line for All
Stocks
NASDAQ
S&P
OEX
NYSE
COMPQX
DJI-15 DJI-20
DJI-30
DIA
SPY
QQQ
MDY
IWM TNA
CrudeOil
FAS
GLD
BBH
IBB
JETS
JNUG
KOL
NUGT
OIH
OIL
RSX
RETL
SDS
SLV
SOXL
TECL
TMF
TNA UGA
(gasoline)
XIV YINN
Commodities:
JJC, NIB,
CHOC
CORN,
WEAT
UUP
(Dollar)
AAPL ADBE
ALXN AMAT
AMGN AMD
AMZN
BA BABA BAC
BIDU
CAT
CVX
FB
GOOG
GS
HD
IBM
JPM M
(Macy's)
MSFT
NFLX
NVDA
QCOM
TSLA TXN
XOM
ANDV (refinery, CMG (Chipotle),
LRCX, SWKS, TOWN
11/14/2017
Bullish MAXCPs Bearish
MINCPs |
 |
 |
 |
 Table 1

       Tiger's QUICKSILVER and MAJOR ETFS and KEY
			STOCKS:


	QuickSilver Documentation  This is for short-term trading leveraged ETFs.

                      It also provides a useful short-term outlook of these sectors ETF's and the sectors they represewnt

                     Blue is Bullish and Red is Bearish.
                    1    Candle-Stick color is shortest-term. This changes when close vis-a-vis opening changes.
                          So, in stocks or ETFs that advanced a long ways, traders should sell when a higher
                          opening gives way to a decline that brings a drop below the previous day's close.
                    2    5-dma AROC and Close-versus- pivot point is next most  short-term.
                                       W = warning.  Close is below PIVOT-Point.
                    3   Closing Power trend-direction vs. its 21-dma is next most short-term.
                    4   IP21 is used to spot divergences and to estimate underlying support.
                    5  > IP21 falling and below +.15 and its 21-dma is bearish in an over-extended ETF, especially
                           when its Closing Power is falling and is below its 21-dma.
                        > IP21 below 07 with AROC below .07 is less likely to bring a rally back up from 21-dma.
                    6   Note price trend-lines, support/resistance and price patterns on charts.
QUICKSILVER on ETFS - 11/14/17
ETF      CLOSE   CHANGE     PIVOT-PT      5-dma AROC   CL-PWR     CANDLE  IP21   ITRS
---------------------------------------------------------------------------------------------
DIA       234.28   -.38     W235.46       -24.3%       Bullish      BLUE .253     0
---------------------------------------------------------------------------------------------
COMPQX    6737.87   -19.73  W6789.12      -22.1%       Bullish      BLUE .318    -.019
---------------------------------------------------------------------------------------------
SPY       257.73   -.6      W259.11       -18.2%       Bullish      BLUE .364    -.029
---------------------------------------------------------------------------------------------
QQQ       153.31   -.56     W154.5        -18.5%       Bullish      ---- .375    -.017
---------------------------------------------------------------------------------------------
MDY       332.41   -.45     W333.9        -10.1%       Bullish      BLUE .269    -.015
---------------------------------------------------------------------------------------------
IWM       146.21   -.4      W147.2        -26.9%       Bearish      BLUE .041    -.026
---------------------------------------------------------------------------------------------
FAS       59.62    .03      W60.03        -66.9%       Bullish      BLUE .161     .151
---------------------------------------------------------------------------------------------
RETL      24.85    .13       23.56         291%        Bearish      ---- -.089    -.071
---------------------------------------------------------------------------------------------
SOXL      158.06   -.44     W164.29       -144%        Bullish      BLUE .473     .552
---------------------------------------------------------------------------------------------
TECL      109.42   -.74     W113.01       -79.7%       Bullish      BLUE .404     .205
---------------------------------------------------------------------------------------------
IBB       305.05   -5.03    W312.8        -143.7%      Bearish      RED  -.12    -.16
---------------------------------------------------------------------------------------------
GLD       122.6    .58       119.46        142.2%      Bullish      BLUE .092    -.012
---------------------------------------------------------------------------------------------
OIL       5.9   -.19        W6.09         -204.4%      Bullish      RED  .248     .087
---------------------------------------------------------------------------------------------
OIH       24.32   -.99      W25.87        -304.6%      Bearish      RED  .062    -.024
---------------------------------------------------------------------------------------------
GASL      21.91   -2.74     W25.47        -830.2%      Bullish      RED  .181     .192
---------------------------------------------------------------------------------------------
UGA       31.59   -.56      W32.83        -177.5%      Bullish      RED  .486     .005
---------------------------------------------------------------------------------------------
UUP       24.39   -.17      W24.66        -56.9%       Bearish      RED  -.085   -.058
---------------------------------------------------------------------------------------------
IEF       105.93    .15     W106.41       -28.7%       ----         BLUE -.057   -.1
---------------------------------------------------------------------------------------------
CORN      16.78   -.18      W17.23        -143.3%      Bearish      RED  -.309   -.129
---------------------------------------------------------------------------------------------
WEAT      6.25    .02       W6.26         -31.9%       Bullish      ---- .056    -.118
---------------------------------------------------------------------------------------------
YINN      33.61   -1.2      W34.48        -100.9%      Bearish      RED  .117     .1
---------------------------------------------------------------------------------------------
RSX       21.79   -.42      W22.41        -100.9%      Bearish      RED  -.195   -.055
---------------------------------------------------------------------------------------------
AAPL      171.34   -2.63    W176.24       -99.1%       Bullish      RED  .188    -.019
---------------------------------------------------------------------------------------------
GOOG      1026    .25       W1039.85      -35.5%       Bullish      BLUE .03     .029
---------------------------------------------------------------------------------------------
MSFT      84.05    .12      W84.56        -13.1%       ----         BLUE .004    .066
---------------------------------------------------------------------------------------------
AMZN      1136.84    7.67    1132.88       60.6%       Bullish      BLUE .212    .101
---------------------------------------------------------------------------------------------
FB        178.07   -.7      W179.56       -60.8%       ----         BLUE .208   -.033
---------------------------------------------------------------------------------------------
NVDA     214.18    1.55      209.16        50.9%       Bullish      BLUE .271    .215
---------------------------------------------------------------------------------------------
BA        261.76   -.66     W265.57       -82.9%       Bullish      RED  .097    .028
---------------------------------------------------------------------------------------------
GS        237.24   -3.03    W241.25       -53.4%       Bearish      RED -.069    .013
|
Table 2
COMPARISONS OF BULLISH AND BEARISH NUMBERS
11/14
11/13 11/10 11/9 11/8 11/7
11/6 11/3 11/2
11/1 10/31 10/30 10/27 10/26
NEWHIGHS 198 191
164 157 324 255 466
360 334 272
392 190 480
309
NEWLOWS 150 113 98 93 93 103 96 112
114 70
170 84
83 74
--------------------------------------------------------------------------------------------------------------------
MAXCPs 276 259
167 171 188
114 164 140
113
64
158
97
184 120
MINCPs
192
150
138
130
145 213 136 180 214 101
120 139
162 229
--------------------------------------------------------------------------------------------------------------------
TTTNHs
125 101 88 82 83 67 95
71 69
43
76
72 76
59
TTTNLs
259 203 237 297 278 352 218 311
313
299 195
151
224
340
---------------------------------------------------------------------------------------------------------------------
FASTUP
146 148 190 209
208
187 239
190 196 178
150 112
95 86
FASTDOWN
249 260 221 250 259 259 194
214 208
185 202 200
115 222
|
 |
 |
 RANKING OF KEY DIRECTORIES BASED PCT.OF STOCKS ABOVE 65-DMA
              11/14/17
 Bullish = 35
 Bearish = 10
---------------------------------------------------------------------------------------
Directory     Current       day-1         day-2         day-3         day-4         day-5
----------------------------------------------------------------------------------------
BIGBANKS       1             1             1             1             1             1
DJI-13         1             1             1             1             1             1
HOMEBLDG       .941          .882          .882          .882          .882          .823
EDU            .857          .857          .857          .857          .857          .857
BIGMIL         .833          .833          .833          .833          .833          .833
DOWJONES       .833          .866          .866          .866          .866          .866
NIFTY          .833          .833          .8            .833          .833          .8
SOLAR          .809          .809          .809          .857          .809          .809
SEMI           .77           .763          .77           .778          .809          .786
INSURANC       .75           .781          .781          .781          .718          .75
UTILITY        .744          .697          .651          .697          .72           .697
INFRA          .727          .727          .818          .909          .909          .909
ELECTRON       .703          .703          .715          .72           .737          .726
CHINA          .687          .703          .703          .671          .687          .687
SP-100         .687          .739          .729          .76           .77           .791
GAMING         .678          .642          .642          .642          .642          .5
FINANCE        .673          .673          .597          .608          .63           .739
SP500          .668          .664          .646          .652          .668          .662
REGBANKS       .666          .575          .363          .484          .545          .696
CHEM           .661          .676          .676          .692          .723          .738
NASD-100       .659          .67           .636          .636          .681          .659
INDEXES        .656          .687          .692          .651          .676          .676
GREEN          .645          .677          .645          .612          .645          .774
OILGAS         .643          .72           .72           .741          .741          .762
RUS-1000       .636          .64           .623          .628          .643          .638
MORNSTAR       .634          .668          .638          .642          .68           .642
MILITARY       .631          .631          .684          .684          .789          .763
COAL           .625          .625          .5            .375          .5            .625
HACKERS        .6            .6            .64           .6            .64           .64
SOFTWARE       .59           .606          .621          .621          .666          .621
AUTO           .564          .589          .589          .589          .692          .692
REIT           .558          .564          .541          .519          .525          .48
ETFS           .538          .569          .692          .707          .784          .784
FOOD           .533          .6            .666          .733          .733          .666
INDMATER       .521          .586          .586          .619          .619          .652
============================================================================================
BEVERAGE       .5            .55           .5            .4            .35           .4
=============================================================================================
COMODITY       .485          .557          .571          .585          .585          .571
COMPUTER       .478          .478          .565          .521          .521          .521
JETS           .444          .222          .222          .222          .333          .333
RETAIL         .415          .433          .471          .415          .32           .32
BIOTECH        .372          .395          .434          .413          .444          .459
TRANSP         .35           .35           .3            .3            .6            .65
GOLD           .24           .28           .26           .3            .32           .28
BONDFUND       .107          .08           .089          .178          .223          .196
HOSPITAL       0             0             .125          .125          .125          .125
PIPELINE       0             0             0             0             0             0
N=10
|
=========================================================================
========================================================================= .
11/13/2017 I have
suggested doing a small amount of profit-taking if you are a trader.
Many of the major ETFs now show falling 5-day moving averages and are below
tomorrow's pivot points. But what strikes me as important now is the
way the
market keeps refusing to sell-off despite the frequently stressed-out
urgings of
some of the perma-bears. (See
Will The Perma-Bears Ever Learn? )
What Might Hurt This Market?
I have said that it is mainly a new Korean war that would seem to be a
threat to
the bull market. Two other forces are at work. First, if
Congress were to act to
allow Americans to buy drugs more easily outside the US where they are
cheaper,
that would explain the current weakness in biotechs and pharmaceuticals. It
would hit
the NASDAQ hard, too. Second, if Congress were not to pass a big tax
cut that
aids the wealthiest and big corporations, that too, would derail the bull
market. From
the market's viewpoint, the danger here is that it may be whittled down too much
just to get
it to pass. We'll see. But significantly, Wall Street Democrats
(the Clintons, Pelosi and Schumer)
are loudly silent about the Trump tax cuts. Senator Sanders, of course, is
the major
exception. Compare their silence with the shrill, almost desperate,
cries of economist
Paul Krugman in today's New York Times. I would bet a big tax cut will
pass. Certainly,
the Democrats are posing no real opposition. They prefer to stick to
their Russian
conspiracy-mongering.
(
https://www.nytimes.com/2017/11/13/opinion/republican-taxes-next-generation.html?emc=edit_th_20171114&nl=todaysheadlines&nlid=58223894
)
Technicals To Watch
True, the A/D Line is waning, but so far, the major market ETFs and their
Indexes have not completed any top patterns. Even if they do break to
minor
new lows, the high levels of Accumulation should not allow them to drop
below the
support of their 65-dma. See these minor support levels in the
NASDAQ (COMPQX)
and also the S&P-500,
NYSE and OEX. Meanwhile, the stronger
get stronger: see
how the leading
semi-conductors are, so far, holding well above their recent support
levels.
Next week should be up if the market follows its usual
behavior before Thanksgiving.
And then, December ranks as the most bullish month of the year. So, I don't
see any point
in being bearish, much less super-bearish. As far as Peerless goes, we
are still operating
under our
very bullish Buy B21.
Since 1965, the DJI has risen 63% of the time
over the two months following November 13th.
----------------------------------------------------------------------------------------
Charts 11/13/2017
PEERLESS
DJI, Signals, Indicators Daily
DJI Volume 10-DayUp/Down Vol
Hourly DJIA
A/D Line for All
Stocks
NASDAQ
S&P
OEX
NYSE
COMPQX
DJI-15 DJI-20
DJI-30
DIA
SPY
QQQ
MDY
IWM TNA
CrudeOil
FAS
GLD
BBH
IBB
JETS
JNUG
KOL
NUGT
OIH
OIL
RSX
RETL
SDS
SLV
SOXL
TECL
TMF
TNA UGA
(gasoline)
XIV YINN
Commodities:
JJC, NIB,
CHOC
CORN,
WEAT
UUP
(Dollar)
AAPL ADBE
ALXN AMAT
AMGN AMD
AMZN
BA BABA BAC
BIDU
CAT
CVX
FB
GOOG
GS
HD
IBM
JPM M
(Macy's)
MSFT
NFLX
NVDA
QCOM
TSLA TXN
XOM
ANDV (refinery, CMG (Chipotle),
LRCX, SWKS, TOWN
11/13/2017
Bullish MAXCPs Semi-Conductors
Bearish
MINCPs
Groups To Watch Closely: IBB and
Drug Makers.
 |
 |
For Table 1
Tiger's QUICKSILVER and MAJOR ETFS and KEY
STOCKS:
QuickSilver Documentation This is for short-term trading leveraged ETFs.
It also provides a useful short-term outlook of these sectors ETF's and the
sectors they
represent.
Blue is Bullish and Red is Bearish.
1 Candle-Stick color is shortest-term. This changes when close vis-a-vis opng changes.
So, in stocks or ETFs that
have advanced a long ways, traders should sell when a higher
opening
gives way to a decline that brings a drop below the previous day's close.
2 5-dma AROC and Close-versus- pivot point is next most short-term.
W = warning. Close is below PIVOT-Point.
3 Closing Power trend-direction vs. its 21-dma is next most short-term.
4 IP21 is used to spot divergences
an to estimate underlying support.
5
> IP21 falling and below +.15 and its 21-dma is bearish in an
over-extended ETF, especially
when its Closing Power is falling and is below its 21-dma.
> IP21 below 07 with AROC below .07 is less likely to bring a rally back up from
21-dma.
6 Note price trend-lines, support/resistance and price patterns on charts.
|
Table 1
QUICKSILVER on ETFS - 11/13/17
> Falling
5-day moving averages predominate.
> Bearish RED across-the-board
Quicksilver values are seen in IBB.ETF CLOSE CHANGE PIVOT-PT 5-dma AROC CL-PWR CANDLE IP21 ITRS
---------------------------------------------------------------------------------------------
DIA 234.66 .23 W235.42 -16% Bullish BLUE .246 0
---------------------------------------------------------------------------------------------
COMPQX 6757.6 6.66 W6767.78 -21.3% Bullish BLUE .302 -.017
---------------------------------------------------------------------------------------------
SPY 258.33 .24 W258.67 -10.1% Bullish BLUE .342 -.025
---------------------------------------------------------------------------------------------
QQQ 153.87 .19 W153.88 2.6% Bullish BLUE .383 -.013
---------------------------------------------------------------------------------------------
MDY 332.86 .64 W333.08 -35% Bullish BLUE .227 -.016
---------------------------------------------------------------------------------------------
IWM 146.61 .04 W147 -73.7% Bearish BLUE -.002 -.024
---------------------------------------------------------------------------------------------
FAS 59.59 .35 W60.42 -194.2% Bullish BLUE .159 .099
---------------------------------------------------------------------------------------------
RETL 24.72 -.87 23.43 -100% Bearish RED -.098 -.071
---------------------------------------------------------------------------------------------
SOXL 158.5 1.28 W162.65 -143.5% Bullish BLUE .49 .497
---------------------------------------------------------------------------------------------
TECL 110.16 -.08 W111.19 -35.1% Bullish BLUE .421 .188
---------------------------------------------------------------------------------------------
IBB 310.08 -2.1 W314.02 -88% Bearish RED -.138 -.144
--------------------------------------------------------------------------------------------
GLD 122.6 .58 119.46 142.2% Bullish BLUE .092 -.003
--------------------------------------------------------------------------------------------
OIL 6.09 -.02 W6.15 -73.4% Bullish ---- .282 .176
---------------------------------------------------------------------------------------------
OIH 25.31 -.47 W25.89 -119.7% ---- RED .085 .058
---------------------------------------------------------------------------------------------
GASL 24.65 -1.74 W26.2 -384.9% Bullish RED .24 .35
---------------------------------------------------------------------------------------------
UGA 32.15 -.79 W32.75 -114.3% Bullish RED .477 -.005
---------------------------------------------------------------------------------------------
UUP 24.56 .02 W24.67 -14.2% Bearish ---- .013 -.047
---------------------------------------------------------------------------------------------
IEF 105.78 -.05 W106.54 -33.9% ---- RED -.075 -.085
---------------------------------------------------------------------------------------------
CORN 16.96 -.08 W17.27 -90.3% Bearish ---- -.271 -.101
---------------------------------------------------------------------------------------------
WEAT 6.23 -.06 W6.29 -71.6% Bullish ---- .012 -.11
---------------------------------------------------------------------------------------------
YINN 34.81 -.42 34.31 161% ---- BLUE .138 .103
---------------------------------------------------------------------------------------------
RSX 22.21 -.07 W22.24 -15.7% Bearish ---- -.176 -.038
---------------------------------------------------------------------------------------------
AAPL 173.97 -.7 W174.81 -8% Bullish BLUE .258 -.007
---------------------------------------------------------------------------------------------
GOOG 1025.75 -2.32 W1033.33 -.7% Bullish BLUE .021 .027
---------------------------------------------------------------------------------------------
MSFT 83.93 .06 W84.27 -32% Bearish BLUE -.024 .068
---------------------------------------------------------------------------------------------
AMZN 1129.17 3.82 1123.17 37.8% Bullish BLUE .189 .087
---------------------------------------------------------------------------------------------
FB 178.77 .31 W180.25 -39% ---- BLUE .206 -.028
---------------------------------------------------------------------------------------------
NVDA 212.63 -3.51 212.03 71.3% Bullish RED .287 .18
---------------------------------------------------------------------------------------------
BA 262.42 1.57 W266.13 -31.3% Bullish BLUE .056 .025
---------------------------------------------------------------------------------------------
GS 240.27 .12 239.81 -66.8% ---- BLUE -.003 -.003
|
Table 2
COMPARISONS OF BULLISH AND BEARISH NUMBERS
11/13 11/10
11/9 11/8 11/7 11/6 11/3
11/2 11/1 10/31
10/30 10/27 10/26 10/25
NEWHIGHS 191
164 157 324 255 466
360 334 272
392 190 480
309 153
NEWLOWS 113 98 93 93 103 96 112
114 70
170 84
83 74
103
--------------------------------------------------------------------------------------------------------------------
MAXCPs 259
167 171 188
114 164 140
113
64
158
97
184 120
86
MINCPs
150
138
130
145 213 136 180 214 101
120 139
162 229
209
--------------------------------------------------------------------------------------------------------------------
TTTNHs
101 88 82 83 67 95
71 69
43
76
72 76
59 42
TTTNLs
203 237 297 278 352 218 311
313
299 195
151
224
340 389
---------------------------------------------------------------------------------------------------------------------
FASTUP
148 190 209
208
187 239
190 196 178
150 112
95 86
73
FASTDOWN
260 221 250 259 259 194
214 208
185 202 200
115 222 185
|
 Table 3
        Count of Stocks and New Highs in Key Tiger Directories

Date = 171113
               No.           NHs           Pct.
-------------------------------------------------------------------
UTILITY        43            16            37 %
HOMEBLDG       17            3             18 %
GAMING         28            5             18 %
NIFTY          30            5             17 %
CHINA          64            11            17 %
BEVERAGE       20            3             15 %
-------------------------------------------------------------
SOLAR          21            3             14 %
EDU            7             1             14 %
HACKERS        25            3             12 %
SOFTWARE       66            6             9 %
SP500          486           46            9 %
INSURANC       32            3             9 %
NASD-100       88            8             9 %
ELECTRON       179           15            8 %
SEMI           132           11            8 %
RUS-1000       842           64            8 %
REIT           178           15            8 %
INDEXES        195           14            7 %
ETFS           65            4             6 %
MORNSTAR       238           15            6 %
CHEM           65            3             5 %
INDMATER       92            4             4 %
BIOTECH        387           14            4 %
REGBANKS       33            1             3 %
DOWJONES       30            1             3 %
SP-100         96            3             3 %
RETAIL         53            1             2 %
OILGAS         144           2             1 %
---------------------------------------------------
None: BIGBANKS BIGMIL GREEN AUTO DJI-13 FINANCE
MILITARY  INFRA   TRANSP COMPUTER COAL GOLD  PIPELINE
COMODITY   FOOD   BONDFUND HOSPITAL  JETS
|
Falling Trend of All Stocks shows greater need now to be
selective in buying
and, perhaps, do some hedging by shorting some our Bearish MINCPs.
. |
Table 4 RANKING OF KEY DIRECTORIES BASED PCT.OF STOCKS ABOVE 65-DMA
11/13/17
Bullish = 37
Bearish = 9
---------------------------------------------------------------------------------------
Directory Current day-1 day-2 day-3 day-4 day-5
----------------------------------------------------------------------------------------
BIGBANKS 1 1 1 1 1 1
DJI-13 1 1 1 1 1 1
HOMEBLDG .882 .882 .882 .882 .823 .823
DOWJONES .866 .866 .866 .866 .866 .833
EDU .857 .857 .857 .857 .857 .857
BIGMIL .833 .833 .833 .833 .833 .833
NIFTY .833 .8 .833 .833 .8 .8
SOLAR .809 .809 .857 .809 .809 .809
N=8
INSURANC .781 .781 .781 .718 .75 .75
SEMI .765 .772 .78 .81 .787 .803
SP-100 .739 .729 .76 .77 .791 .77
INFRA .727 .818 .909 .909 .909 .818
OILGAS .715 .715 .736 .736 .75 .777
CHINA .703 .703 .671 .687 .687 .703
ELECTRON .703 .715 .72 .737 .726 .754
UTILITY .697 .651 .697 .72 .697 .697
INDEXES .687 .692 .651 .676 .682 .676
GREEN .677 .645 .612 .645 .774 .774
CHEM .676 .676 .692 .723 .723 .738
FINANCE .673 .597 .608 .63 .739 .815
NASD-100 .67 .636 .636 .681 .659 .681
MORNSTAR .668 .638 .642 .68 .642 .668
SP500 .664 .646 .652 .668 .662 .67
GAMING .642 .642 .642 .642 .5 .607
RUS-1000 .64 .623 .628 .643 .64 .656
MILITARY .631 .684 .684 .789 .789 .789
COAL .625 .5 .375 .5 .625 .875
SOFTWARE .606 .621 .621 .666 .621 .696
FOOD .6 .666 .733 .733 .666 .6
HACKERS .6 .64 .6 .64 .64 .64
AUTO .589 .589 .589 .692 .692 .692
INDMATER .586 .586 .619 .619 .652 .684
REGBANKS .575 .363 .484 .545 .696 .848
ETFS .569 .692 .707 .784 .784 .784
REIT .567 .544 .522 .528 .488 .443
COMODITY .557 .571 .585 .585 .571 .6
BEVERAGE .55 .5 .4 .35 .4 .45
N=29
------------------------------------------------------------------------------------------------
COMPUTER .478 .565 .521 .521 .521 .565
RETAIL .433 .471 .415 .32 .32 .396
BIOTECH .395 .434 .413 .444 .467 .545
TRANSP .35 .3 .3 .6 .65 .6
GOLD .28 .26 .3 .32 .28 .28
JETS .222 .222 .222 .333 .333 .333
BONDFUND .08 .089 .169 .214 .187 .133
HOSPITAL 0 .125 .125 .125 .125 0
PIPELINE 0 0 0 0 0 0
N=9
|
===============================================================================
11/10/2017
A little precautionary selling by short-term traders has been
suggested here.
But our technical indicators suggest only a minor pullback.
The way NVDA blew past even the bullish earnings estimations on Friday
has probably re-invigorated the leading semi-conductors. Watch
the 'semis' shown here.
As long as they do not close below their near-term
support, we are probably only seeing a shallow and temporary retreat.
(Nvidia
reported earnings of $1.33 per share on revenues of $2.64
billion.
Wall Street was expecting adjusted earnings of $1.07 per share.)
If a big decline were about to start, we would expect to see red
Distribution,
long and larger breadth divergences. We would see multiple
head/shoulders tops
in leading DJI and SP-500 stocks. The
Hourly DISI would be
making new lows
ahead of price and Gold stocks most likely would have recently risen 25% or
so.
None of these bearish elements are present now. Even the Dollar is
above its 65-dma.
No big financial panic is impending that I can detect.
The biggest threat, of course,
comes in the form of a war with North Korea. But given the number of
Goldman
Sachs people working in the Trump Administration, I would expect to see more
market weakness if such a war was really growing near.
---------------------------------------------------------------------------------------------------------
Charts 11/10/2017
PEERLESS
DJI, Signals, Indicators Daily
DJI Volume 10-DayUp/Down Vol
Hourly DJIA
A/D Line for All
Stocks
NASDAQ
S&P
OEX
NYSE
COMPQX
DJI-15 DJI-20
DJI-30
DIA
SPY
QQQ
MDY
IWM TNA
CrudeOil
FAS
GLD
BBH
IBB
JETS
JNUG
KOL
NUGT
OIH
OIL
RSX
RETL
SDS
SLV
SOXL
TECL
TMF
TNA UGA
(gasoline)
XIV YINN
Commodities:
JJC, NIB,
CHOC
CORN,
WEAT
UUP
(Dollar)
AAPL ADBE
ALXN AMAT
AMGN AMD
AMZN
BA BABA BAC
BIDU
CAT
CVX
FB
GOOG
GS
HD
IBM
JPM M
(Macy's)
MSFT
NFLX
NVDA
QCOM
TSLA TXN
XOM
ANDV (refinery, CMG (Chipotle),
LRCX, SWKS, TOWN
11/10/2017
Bullish MAXCPs Bearish MINCPs
New Issue Breakouts.
---------------------------------------------------------------------------------------------------------------------------------------
The operative Peerless Signals remains the very
Bullish Buy B21.
If you look back at the 8 previous cases of Buy B21, you see that in 4 instances
the
DJI
fell back to the rising 65-dma in November and in 4 cases it fell back only
a little below the 21-day ma. So, it is perfectly normal to have a
limited November
decline.
It is true that NYSE breadth has been deteriorating steadily and the V-I is
negative.
One could construct a Peerless Sell from that. But looking back
at the signal it
would have produced, which is shown is
Table A
below, we see there were 2 instances
of 5 where the market soon after took off very strongly and where the signal
would
have worked out well, there already were other Peerless Sell signals.
So, I think we should just give the market a little time to settle back in
preparation
for the usual pre-Thanksgiving and December rally. But watch the
NYSE to see
if can hold above its near-term support. Watch the oversold Biotechs.
IBB is now
down the support of its rising 200-day ma. Watch the weak the Closing
Power
for IWM (Russell-2000). If it can break its
downtrend, the sell-off now will almost
certainly be over. For the time being, we see falling 5-day moving
averages for
most of the major market ETFs: DIA, COMPQX(Nasdaq), SPY, MDYand IWM.
From the fact that their pivot-points are a good ways above their closing
prices on
Friday, we can below that it will be difficult for them to turn up
convincingly
on Monday. This is conclusion I reach from studying Table 1. The "W"
stands for
'warning', the next day's pivot-point is above the most recent close.
ETFs Friday's Close
Pivot-Point Current AROC
of 5-day ma
------------------------------------------------------------------------------
DIA 234.43 -.29 W235.41 -15.9%
--------------------------------------------------------------------------------
COMPQX 6750.94 +.89 W6786.44 -10%
---------------------------------------------------------------------------------
SPY 258.09 -.08 W258.85 -7%
---------------------------------------------------------------------------------
MDY 332.22 -.03 W335.19 -24.6%
----------------------------------------------------------------------------------
IWM 146.57 -.11 W148.78 -69.1%
-----------------------------------------------------------------------------------
FAS 59.24 -.31 W61.93 -184.6%
------------------------------------------------------------------------------------
TECL 110.24 -.21 W110.94 -3.6%
Past Tax Cuts for The Wealthy Have Always
Set The Stage for Big Rallies so long as Interest
Rates are not much, much higher than they are now.
Don't underestimate how bullish a big tax cut plan combined with a Republican
President
and a Republican Congress is for stocks, at least for a long time
and until interest rates go shooting upwards.
The Coolidge years from 1924 to April 1929 were very good
but, it's true
that
there still there were periodic corrections.
November 1925 - DJI peaked on 11/6 and fell
back 7% that month to its rising 65-dma.
It then rose strongly.
Feb.11, 1926 - DJI peaked
after tax cut was passed and fell back 17%, partly
as a result of Florida
Real Estate Crash.
Oct.4, 1927 - DJI fell 7% and resumed big bull market. In 1928, even
the Fed could
not stop the bull market by raising interest rates.
Nov. 1928 - DJI fell 10% but then the DJIA took off wildly to the upside.
The Reagan years from 1982 to April 1987 were excellent for the stock
market.
It's true that 1981-1982 saw a bear market, but that war born ofinterest rates
that reached 20%. The first
tax cut in
1981 could not bring a rise in stock prices until
the Fed signaled in August
1982
that it was done, for the time being, with keeping rates
extraordinarily high.
The DJI rose steeply from August 1982 to January 1984, when the FED again
started raising rates. A financial crisis in the Summer caused by the
failure of the
huge Continental Bank caused the Fed to relent. The DJI rose steadily
until
a new Fed Chairman, Greenspan, saw the Dollar weakening and decided to
raise interest rates in September 1987.
The Reagan years teach us that a fanatical
Fed has more control over the stock
market
than a pro-business/pro-growth. But the lesson of the Coolidge years
is
that a largely unregulated stock market can go up much more than a more
normal
FED can contain. Greenspan's behavior in 1995-1999 shows that a
cautious
Fed Chairman who does not use his regulatory powers will probably only act
to restrain the stock market only after it has gone to considerable excess. w.
The Eisenhower years were generally pro-business. But there was no big
tax-cut
for the wealthy or for corporations back then. What kept the market going from
1952-1957
was the ending of the Korea War, the strongly competitive US manufacturing
base,
lots of consumer demand from a relatively well-paid working class, big
Military
spending and the start of the Interstate Highway infrastructure program. But
here
again, it was the Fed that stopped the bull market. In 1957, interest rates
were
pushed up above 3%. They had previously been very stable at about 2%.
That
finally brought a 20% DJI decline in the Fall of 1957.
Where Will The Next Threats to The Bull Market Come from?
War with Korea is clearly the biggest threat now. If insiders saw this
coming, they
would be distributing stock and we would probably see negative Accumulation
readings
and head/shoulders patterns that we do not now see.
Interest rates are still very low now. So, the FED should not pose a
threat. The big technology
stocks' boom now is reminiscent of RCA in the 1920s, I've said.
A big
divergence
between one part of the financial market and another is also common place.
It is long forgotten how in the 1920s, agriculture, commodities, small town and
banks did
very poorly. In the Reagan Years, the high interest rates and strong
Dollar saw the
same phenomenon, except that older US manufacturing was then in a serious decline.
The weakened
rural economy in both periods brought on bank failures. But the stock
market just kept rising in the 1920s. It was the
Paul Volcker's
obsession with fighting
all potential inflation and then the failure of the
big Continental
Illinois Bank in the Spring
of 1984, as much as anything, that caused the DJI to fall from
nearly 1286 (Jan 1984)
to 1087 (July
1984). In 1986, two years later, at much higher stocks price levels, Wall Street
insider
trading scandals stopped the growing merger mania and brought about two
more
10%
corrections
in the long 1982-1987 bull market.
Right now the biggest threat I see is the falling Retail stocks. They
could bring about
some failures in regional banks that have a big stake in the thousands of
shopping malls
that dot the American landscape. But the lessons of 1984 and
2008-2009, are that the FED
would probably cut rates if there was a serious problem for one or more big
banks.
Table A

EXPERIMENTAL PEERLESS SELL SIGNAL: DJI 1929-2017
BASED ON Deteriorating Breadth and Negative V-I
but still showing very positive IP21

Parameters
LA/MA>1.0265
IP21>.15
AROC>.30 and <.60
VI<0
P is down more than 1/2 from recent high
March-December, 1929-2017
1) 12/10/1947 175.9 to 183.6 down to 163.6 (down 6.9%)
LA/MA AROC PI   ch  IP21  VI   OPct
1.04  .444 -29  -4  .151  -42  .259
---------------------------------------------
2) 6/12/1950  228.4 down to 197.5 (perfect) Peerless already gives an S8/S5 here.
LA/MA AROC PI   ch  IP21  VI   OPct
1.027 .52  33   -3  .176  -50  .405
---------------------------------------------
3) 6/29/1954  336.9 to 349.6 to 335.8 (LB) then up! Very risky and of no value.
LA/MA AROC PI   ch  IP21  VI   OPct
1.028 .342 37   -6  .157  -77  .488
---------------------------------------------
4) 10/17/2001 9232.96 down to  9075.14 (LB) then up strongly! Very risky and of no value.
LA/MA AROC PI   ch  IP21  VI   OPct
1.032 .439 81   -3  .157  -.69 .012
                               low
---------------------------------------------
5) 5/3/2011   12807.51 down to 11897.27 This already was an S9/S5.
LA/MA AROC PI   ch  IP21  VI   OPct
1.027 .412 113  -99 .154  -47  .352
---------------------------------------------
6) 10/24/2017 23441.76 23563.36 to (23461.94)
LA/MA AROC PI   ch  IP21  VI   OPct
1.027 .599 205  -7  .170  -20  -54
|
| |
For Table 1
Tiger's QUICKSILVER and MAJOR ETFS and KEY
STOCKS:
QuickSilver Documentation This is for short-term trading leveraged ETFs.
It also provides a useful short-term outlook of these sectors ETF's and the
sectors they
represent.
Blue is Bullish and Red is Bearish.
1 Candle-Stick color is shortest-term. This changes when close vis-a-vis opng changes.
So, in stocks or ETFs that
have advanced a long ways, traders should sell when a higher
opening
gives way to a decline that brings a drop below the previous day's close.
2 5-dma AROC and Close-versus- pivot point is next most short-term.
W = warning. Close is below PIVOT-Point.
3 Closing Power trend-direction vs. its 21-dma is next most short-term.
4 IP21 is used to spot divergences
an to estimate underlying support.
5
> IP21 falling and below +.15 and its 21-dma is bearish in an
over-extended ETF, especially
when its Closing Power is falling and is below its 21-dma.
> IP21 below 07 with AROC below .07 is less likely to bring a rally back up from
21-dma.
6 Note price trend-lines, support/resistance and price patterns on charts.
|
Table 1
QUICKSILVER on ETFS -
11/10/17
ETF      CLOSE   CHANGE     PIVOT-PT   5-dma AROC   CL-PWR   CANDLE   IP21   ITRS
---------------------------------------------------------------------------------------------
DIA       234.43   -.29     W235.41      -15.9%   ----         ----   .212     ----
---------------------------------------------------------------------------------------------
COMPQX    6750.94   .89    W6786.44       -10%    Bullish      BLUE   .255   -.018
---------------------------------------------------------------------------------------------
SPY       258.09   -.08     W258.85        -7%    Bullish      BLUE   .317    -.025
---------------------------------------------------------------------------------------------
QQQ       153.68   -.01     W153.79       13.3%   Bullish      BLUE   .383    -.017
---------------------------------------------------------------------------------------------
MDY       332.22   -.03     W335.19      -24.6%   Bullish      BLUE   .169    -.015
---------------------------------------------------------------------------------------------
IWM       146.57   -.11     W148.78      -69.1%   Bearish      RED   -.042    -.019
---------------------------------------------------------------------------------------------
FAS       59.24    -.31      W61.93     -184.6%   Bearish      RED    .156     .099
---------------------------------------------------------------------------------------------
RETL      25.59     .88       25.21       88.1%   Bearish      BLUE  -.108     .004
---------------------------------------------------------------------------------------------
SOXL      157.22   2.93     W163.1        24.4%   Bullish      BLUE   .474     .503
---------------------------------------------------------------------------------------------
TECL      110.24   -.21     W110.94       -3.6%   Bullish      BLUE   .392     .186
---------------------------------------------------------------------------------------------
IBB       312.18   1.14     W315.59      -74.7%   Bearish      BLUE  -.141    -.131
---------------------------------------------------------------------------------------------
GLD       122.6     .58      119.46      142.2%   Bullish      BLUE   .092    -.004
---------------------------------------------------------------------------------------------
OIL       6.11     -.02       W6.18      155.9%   Bullish      ----   .29     .189
---------------------------------------------------------------------------------------------
OIH       25.78    -.22      W25.93      198.5%   ----         RED    .088     .093
---------------------------------------------------------------------------------------------
GASL      26.39    -.08      W26.67      469.8%   Bullish      BLUE   .284     .521
---------------------------------------------------------------------------------------------
UGA       32.94     .27       32.9       107.1%   Bullish      BLUE   .521     .006
---------------------------------------------------------------------------------------------
UUP       24.54    -.02      W24.63      -30.4%   Bearish      ----   .055    -.047
---------------------------------------------------------------------------------------------
IEF       105.83   -.54     W106.5       -25.4%   ----         RED   -.025    -.09
---------------------------------------------------------------------------------------------
CORN      17.04     .04      W17.27      -81.3%   Bearish      ----  -.219    -.105
---------------------------------------------------------------------------------------------
WEAT      6.29      .04       W6.32        8%     Bullish      BLUE   .079    -.094
---------------------------------------------------------------------------------------------
YINN      35.23     .64       33.7        269.8%  ----         BLUE   .117     .118
---------------------------------------------------------------------------------------------
RSX       22.28    -.12       22.28       112.5%  Bearish      RED   -.154    -.023
---------------------------------------------------------------------------------------------
AAPL      174.67   -1.21     174.25        62.1%  Bullish      RED    .266    -.003
---------------------------------------------------------------------------------------------
GOOG      1028.07  -3.19    1025.9        -21.4%  Bullish      BLUE  -.003     .027
---------------------------------------------------------------------------------------------
MSFT      83.87    -.22      W84.47       -16%    Bearish      BLUE  -.062     .054
---------------------------------------------------------------------------------------------
AMZN      1125.35  -3.78    1120.66        61.2%  Bullish      RED    .185     .08
---------------------------------------------------------------------------------------------
FB        178.46   -.84     W180.17       -12.8%  Bearish      BLUE   .176    -.03
---------------------------------------------------------------------------------------------
NVDA     216.14    10.82     209.63       178.3%  Bullish      BLUE   .366     .208
---------------------------------------------------------------------------------------------
BA        260.85   -1.85    W264.07       -17%    Bullish      RED    .008     .02
--------------------------------------- ------------------------------------------------------
GS        240.15   -.64     W243.49       -87.8%  Bearish      RED   -.013     .005
|
Table 2
COMPARISONS
OF BULLISH AND BEARISH NUMBERS
11/10 11/9 11/8 11/7 11/6
11/3 11/2 11/1
10/31 10/30 10/27 10/26 10/25 10/24
NEWHIGHS
164 157 324 255 466
360 334 272
392 190 480
309 153 376
NEWLOWS 98 93 93 103 96 112
114 70
170 84
83 74
103 73
--------------------------------------------------------------------------------------------------------------------------
MAXCPs
167 171 188
114 164 140
113
64
158
97
184 120
86 117
MINCPs
138
130
145 213 136 180 214 101
120 139
162 229
209 179
--------------------------------------------------------------------------------------------------------------------------
TTTNHs
88 82 83 67 95
71 69
43
76
72 76
59 42
70
TTTNLs
237 297 278 352 218 311
313
299 195
151
224
340 389 216
--------------------------------------------------------------------------------------------------------------------------
FASTUP
190 209
208
187 239
190 196 178
150 112
95 86
73 92
FASTDOWN
221 250 259 259 194
214 208
185 202 200
115 222 185
155 |
Table 3
Count of Stocks and New Highs in Key Tiger Directories
Date = 171110
               No.          NHs            Pct
-------------------------------------------------------------------
EDU            7             2             29 %
CHINA          64            12            19 %
BEVERAGE       20            3             15 %
------------------------------------------------------------------
HOMEBLDG       17            2             12 %
GAMING         28            3             11 %
SOLAR          21            2             10 %
ETFS           65            6             9 %
ELECTRON       179           16            9 %
SOFTWARE       66            6             9 %
INSURANC       32            3             9 %
NASD-100       88            8             9 %
DJI-13         13            1             8 %
HACKERS        25            2             8 %
SEMI           130           11            8 %
DOWJONES       30            2             7 %
NIFTY          30            2             7 %
SP500          486           24            5 %
RUS-1000       842           42            5 %
UTILITY        43            2             5 %
MORNSTAR       238           9             4 %
BIOTECH        387           16            4 %
COMPUTER       23            1             4 %
REIT           178           7             4 %
RETAIL         53            2             4 %
INDEXES        195           3             2 %
FINANCE        92            1             1 %
SP-100         96            1             1 %
INDMATER       92            1             1 %
OILGAS         144           2             1 %
COMODITY       71            1             1 %
Others         0                           0%
(BIGBANKS,BIGMIL,GREEN,REGBANKS,AUTO,CHEM,MILITARY,
INFRA, TRANSP,COAL,GOLD,PIPELINE,FOOD,BONDFUND,
HOSPITAL,JETS)
|
 |
Table 4
 RANKING OF KEY DIRECTORIES BASED PCT.OF STOCKS ABOVE 65-DMA
               11/10/17
Bullish =35
Bearish = 9
---------------------------------------------------------------------------------------
Directory     Current       day-1         day-2         day-3         day-4         day-5
----------------------------------------------------------------------------------------
BIGBANKS       100%          1             1             1             1             1
DJI-13         100%          1             1             1             1             .923
HOMEBLDG       .882          .882          .882          .823          .823          .823
DOWJONES       .866          .866          .866          .866          .833          .833
EDU            .857          .857          .857          .857          .857          .714
BIGMIL         .833          .833          .833          .833          .833          .833
INFRA          .818          .909          .909          .909          .818          .818
SOLAR          .809          .857          .809          .809          .809          .809
NIFTY          .8            .833          .833          .8            .8            .833
N=9
--------------------------------------------------------------------------------------------
INSURANC       .781          .781          .718          .75           .75           .687
SEMI           .769          .776          .807          .784          .8            .769
SP-100         .729          .76           .77           .791          .77           .75
ELECTRON       .715          .72           .737          .726          .754          .731
OILGAS         .715          .736          .736          .75           .777          .701
CHINA          .703          .671          .687          .687          .703          .656
ETFS           .692          .707          .784          .784          .784          .753
INDEXES        .692          .651          .676          .682          .676          .625
MILITARY       .684          .684          .789          .789          .789          .815
CHEM           .676          .692          .723          .723          .738          .753
FOOD           .666          .733          .733          .666          .6            .533
UTILITY        .651          .697          .72           .697          .697          .72
SP500          .646          .652          .668          .662          .672          .66
GREEN          .645          .612          .645          .774          .774          .741
GAMING         .642          .642          .642          .5            .607          .535
HACKERS        .64           .6            .64           .64           .64           .6
MORNSTAR       .638          .642          .68           .642          .663          .651
NASD-100       .636          .636          .681          .659          .681          .659
RUS-1000       .623          .628          .643          .64           .66           .65
SOFTWARE       .621          .621          .666          .621          .696          .696
AUTO           .6            .6            .7            .7            .7            .725
FINANCE        .597          .608          .63           .739          .815          .804
INDMATER       .586          .619          .619          .652          .673          .673
COMODITY       .577          .591          .591          .577          .619          .535
COMPUTER       .565          .521          .521          .521          .565          .565
REIT           .544          .522          .528          .488          .449          .421
N=26
----------------------------------------------------------------------------------------------
BEVERAGE       .5            .4            .35           .4            .45           .5
COAL           .5            .375          .5            .625          .875          .75
----------------------------------------------------------------------------------------------
RETAIL         .471          .415          .32           .32           .396          .377
BIOTECH        .434          .413          .444          .467          .545          .534
REGBANKS       .363          .484          .545          .696          .848          .878
TRANSP         .3            .3            .6            .65           .6            .6
GOLD           .265          .306          .326          .285          .285          .224
JETS           .222          .222          .333          .333          .333          .333
HOSPITAL       .125          .125          .125          .125          0             0
BONDFUND       .089          .169          .214          .187          .133          .08
PIPELINE       0             0             0             0             0             0
N=9
|
-----------------------------------------------------------------------------------------------------------------
-----------------------------------------------------------------------------------------------------------------
11/9/2017 Take
Some Trading Profits in the Over-extended Techs
even though
the
operative Peerless Signals remains the very
Bullish Buy B21
and
we will probably see more new DJI highs in December.
"Stocks
tumbled on the news that the corporate rate cut may be delayed.",
wrote the NY Times tonight.
(
https://www.nytimes.com/2017/11/09/us/politics/facing-math-trouble-house-panel-races-to-adjust-tax-bill.html?emc=edit_th_20171110&nl=todaysheadlines&nlid=58223894
)
The DJI gapped down but could not close its gap. Many of the tech
and semi-conductors led the decline.
Regional banks again sold off.
I think their investors are concerned about the possibility of some
big malls failing if major retailers have anything but a Christmas miracle.
Keep in mind that the FED has virtually guaranteed it would play the
role of Grinch and raise rates in December. Rising
oil prices will boost
the CPI and this will give ample ammunition to the "hawks" on the FOMC.
Higher gas prices will also take money out of the typical shopper's pocket.
See -
Retail apocalypse - Wikipedia
QuickSilver Sells in Over-Extended ETFs
I have advocated that traders use what I call the
QuickSilver approach
when an ETF has had a good run. This involves watching for when the
ETF
makes a 6-day low and drops below its 5-day ma pivot-point. When this
happens the 5-day ma turns down and Professional traders jump ship.
Selling at the exact tops and bottoms is not their goal. Instead, they
exploit
the 5-day ma trends in volatile stocks and ETFs. Today, many important
ETFs closed below yesterday's pivot-point. The result is we now see
DIA, MDY,
IWM, FAS,
RETL, IBB and NVDA
have falling (red) 5-day
ma trends in Table 1. In addition, COMPQX
and SOXL closed below
today's pivot point. Only if there is a strong rally their 5-dma not
turn
down at tomorrow's close.
Most likely the semi-conductors will recover after a
week or so of
selling. But, traders should cash in on their excellent rises as they
have now
dropped below their pivot-points. See Table 1 below and their
charts. I warned
two nights ago that SOXL has reached a point 20% above its 20-day ma
and this was as overbought as it has been able to rise in 2017.
So, traders should now be ready to apply the Quicksilver rules to lock
in profits.
44% of November Peaks and Declines
Bring DJI Dips to between 1.5% and 5%
below the 21-day ma.
A normal, even benign, pullback which will take the
DJI below the 21-day ma,
has probably started. But note that historically, a November
decline usually
does not drop the DJI much below the 1% lower band. This was true in
56% of the cases since 1945.
The table below show the November peaks and deeper declines since
1945.
Altogether, there have been 25 instances of the DJI making new highs
in November since 1945. In 14 (56%) of these cases, the DJI did not
drop below
the 21-day by the end of the year. In 7 of these is fell about halfway
between
the 21-day ma and the lower 3.5% band. In other words, 28% of the time
a November top was followed by a decline to the 1.75% lower band. In
3 (12%) cases the DJI fell to the lower band (1950, 1982 and 1996). Only in
one
instance did the DJI fall briefly below the lower band. That was in
late November
1980 after there had been a Sell S9/S12 at the 4.9% upper band and then
a head/shoulders pattern had been completed.
November Peaks and Deeper Declines.
To below lower band
Peak Signal la/ma
AROC P-I IP21 V-I
OBVPct
11/20/1980 S9/S12 1.049 .572 -19
-.006 4 .309
(Very high interest rates)
To lower 3.5% band
Peak Signal la/ma
AROC P-I IP21 V-I
OBVPct
11/24/1950
1.03 .214 130
.111 118 .359 (Korean War Inchon
Landing)
11/3/1982
1.059 1.886 411 .179
23 .339
11/25/1996
1.051 1.038 268 .195
35 .552
Our peak here
Peak Signal la/ma
AROC P-I IP21 V-I
OBVPct
11/7/2011
1.013 .408 65
.075 -70 .611
(very low)
(weaker)
Charts 11/9/2017
PEERLESS
DJI, Signals, Indicators Daily
DJI Volume 10-DayUp/Down Vol
Hourly DJIA
A/D Line for All
Stocks
NASDAQ
S&P
OEX
NYSE
COMPQX
DJI-15 DJI-20
DJI-30
DIA
SPY
QQQ
MDY
IWM TNA
CrudeOil
FAS
GLD
BBH
IBB
JETS
JNUG
KOL
NUGT
OIH
OIL
RSX
RETL
SDS
SLV
SOXL
TECL
TMF
TNA UGA
(gasoline)
XIV YINN
Commodities:
JJC, NIB,
CHOC
CORN,
WEAT
UUP
(Dollar)
AAPL ADBE
ALXN AMAT
AMGN AMD
AMZN
BA BABA BAC
BIDU
CAT
CVX
FB
GOOG
GS
HD
IBM
JPM M
(Macy's)
MSFT
NFLX
NVDA
QCOM
TSLA TXN
XOM
ANDV (refinery, CMG (Chipotle),
LRCX, SWKS, TOWN
11/9/2017
Bullish MAXCPs Bearish MINCPs
|
Tiger's QUICKSILVER and MAJOR ETFS and KEY
STOCKS:
11/9/2017
QuickSilver Documentation This is for short-term trading leveraged ETFs.
It also provides a useful short-term outlook of these sectors ETF's and the
sectors they
represent.
Blue is Bullish and Red is Bearish.
1 Candle-Stick color is shortest-term. This changes when close vis-a-vis opng changes.
So, in stocks or ETFs that
have advanced a long ways, traders should sell when a higher
opening
gives way to a decline that brings a drop below the previous day's close.
2 5-dma AROC and Close-versus- pivot point is next most short-term.
W = warning. Close is below PIVOT-Point
3 Closing Power trend-direction vs. its 21-dma is next most short-term.
4 IP21 is used to spot divergences
an to estimate underlying support.
5
> IP21 falling and below +.15 and its 21-dma is bearish in an
over-extended ETF, especially
when its Closing Power is falling and is below its 21-dma.
> IP21 below 07 with AROC below .07 is less likely to bring a rally back up from
21-dma.
6 Note price trend-lines, support/resistance and price patterns on charts.
|
Table 1
QUICKSILVER on ETFS - 11/09/17
ETF      CLOSE   CHANGE     PIVOT-PT      5-dma AROC   CL-PWR    CANDLE  IP21   ITRS
---------------------------------------------------------------------------------------------
DIA       234.72   -.74     W235.18       -5.1%        ----       ----   .199     0
---------------------------------------------------------------------------------------------
COMPQX    6750.05   -39.07  W6764.44       26%         Bullish    BLUE   .167   -.012
---------------------------------------------------------------------------------------------
SPY       258.17   -.94     W258.45        11.2%       Bullish    BLUE   .286   -.023
---------------------------------------------------------------------------------------------
QQQ       153.69   -.81      153.27        61.3%       Bullish    BLUE   .348   -.01
---------------------------------------------------------------------------------------------
MDY       332.25   -1.65    W333.86       -11.5%       Bullish    BLUE   .2     -.011
---------------------------------------------------------------------------------------------
IWM       146.68   -.52      148.61       -68.6%       Bearish    BLUE  -.02    -.012
---------------------------------------------------------------------------------------------
FAS       59.55   -.48      W61.48        -191.3%      ----       BLUE   .125    .107
---------------------------------------------------------------------------------------------
RETL      24.71    1.15     W25.16        -144.6%      Bearish    BLUE  -.126   -.023
---------------------------------------------------------------------------------------------
SOXL      154.29   -10      W156.44        181.4%      Bullish    RED    .426    .515
---------------------------------------------------------------------------------------------
TECL      110.45   -2.56     110.32        117%        Bullish    BLUE   .362    .208
---------------------------------------------------------------------------------------------
IBB       311.04   -1.76    W316.87       -16.2%       Bearish    ----  -.192   -.113
---------------------------------------------------------------------------------------------
GLD       122.6    .58       119.46        142.2%      Bullish    BLUE   .092   -.008
---------------------------------------------------------------------------------------------
OIL       6.13    .04        5.92          273.7%      Bullish    ----   .317    .227
---------------------------------------------------------------------------------------------
OIH       26    .13          24.76         293.4%      Bullish    BLUE   .089    .103
---------------------------------------------------------------------------------------------
GASL      26.47    1         23.97         651.3%      Bullish    BLUE   .293    .614
---------------------------------------------------------------------------------------------
UGA       32.67   -.16       32.24         84.4%       Bullish    ----   .504    .078
---------------------------------------------------------------------------------------------
UUP       24.56   -.1       W24.69        -14.2%       Bearish    RED    .031   -.053
---------------------------------------------------------------------------------------------
IEF       106.37   -.04      106.37        8%          Bullish    BLUE   .039   -.088
---------------------------------------------------------------------------------------------
CORN      17   -.23         W17.32        -115.6%      Bearish    RED   -.201   -.08
---------------------------------------------------------------------------------------------
WEAT      6.25   -.01       W6.28         -31.8%       Bullish    ----   .029   -.096
---------------------------------------------------------------------------------------------
YINN      34.59    .11       33.39         126.8%      Bearish    ----   .075    .087
---------------------------------------------------------------------------------------------
RSX       22.4   -.01        21.78         92.6%       Bearish    ----  -.156   -.002
---------------------------------------------------------------------------------------------
AAPL      175.88   -.36      172.5         224.3%      Bullish    BLUE   .263    .005
---------------------------------------------------------------------------------------------
GOOG      1031.26   -8.59   W1032.48       27.5%       Bullish    BLUE  -.019    .037
---------------------------------------------------------------------------------------------
MSFT      84.09   -.47      W84.14         2.4%        Bearish    ----  -.059    .064
---------------------------------------------------------------------------------------------
AMZN      1129.13   -3.75    1111.6        156.3%      Bullish    BLUE   .201    .095
---------------------------------------------------------------------------------------------
FB        179.3   -.26       178.92        10.6%       Bearish    BLUE   .161   -.017
---------------------------------------------------------------------------------------------
NVDA     205.32   -3.84     W208.69       -14.8%       Bullish    BLUE   .341    .167
---------------------------------------------------------------------------------------------
BA        262.7   -2.87      261.75        1.3%        Bullish    RED    .022    .02
---------------------------------------------------------------------------------------------
GS        240.79   -.46     W244.4        -125.2%      Bearish    BLUE  -.004    .01
|
Table 2
COMPARISONS
OF BULLISH AND BEARISH NUMBERS
11/9 11/8 11/7 11/6
11/3 11/2 11/1
10/31 10/30 10/27 10/26 10/25 10/24 10/23
NEWHIGHS
157 324 255 466
360 334 272
392 190 480
309 153 376
200
NEWLOWS 93 93 103 96 112
114 70
170 84
83 74
103 73
56
--------------------------------------------------------------------------------------------------------------------------
MAXCPs
171 188
114 164 140
113
64
158
97
184 120
86 117 125
MINCPs
130
145 213 136 180 214 101
120 139
162 229
209 179 157
--------------------------------------------------------------------------------------------------------------------------
TTTNHs
82 83 67 95
71 69
43
76
72 76
59 42
70 53
TTTNLs
297 278 352 218 311
313
299 195
151
224
340 389 216
245
--------------------------------------------------------------------------------------------------------------------------
FASTUP
209
208
187 239
190 196 178
150 112
95 86
73 92
86
FASTDOWN
250 259 259 194
214 208
185 202 200
115 222 185
155 158
|
Table 3 Count of New Highs in Key
DirectoriesDate = 171109
No. NHs Pct
-------------------------------------------------------------------
HOMEBLDG 17 5 29 %
BEVERAGE 20 3 15 %
------------------------------------------------------------------
EDU 7 1 14 %
UTILITY 43 5 12 %
GAMING 28 3 11 %
INSURANC 32 3 9 %
CHINA 64 6 9 %
ETFS 65 5 8 %
INDEXES 196 10 5 %
NASD-100 88 4 5 %
SOLAR 21 1 5 %
FINANCE 92 4 4 %
MORNSTAR 238 9 4 %
BIOTECH 387 15 4 %
RUS-1000 842 36 4 %
COMPUTER 23 1 4 %
RETAIL 53 2 4 %
GREEN 31 1 3 %
REGBANKS 33 1 3 %
DOWJONES 30 1 3 %
NIFTY 30 1 3 %
MILITARY 38 1 3 %
SEMI 130 4 3 %
OILGAS 144 4 3 %
SP500 486 17 3 %
CHEM 65 1 2 %
ELECTRON 179 4 2 %
REIT 179 3 2 %
SP-100 96 1 1 %
INDMATER 91 1 1 %
COMODITY 71 1 1 %
BONDFUND 112 1 1 %
-------------------------------------------------
NONE: BIGBANKS BIGMIL AUTO DJI-13 HACKERS SOFTWARE
INFRA TRANSP COAL GOLD PIPELINE FOOD
HOSPITAL JETS
|
 |
| |
Table 4
 RANKING OF KEY DIRECTORIES BASED PCT.OF STOCKS ABOVE 65-DMA
              11/9/17
Bullish = 35
Bearish = 11
---------------------------------------------------------------------------------------
Directory     Current       day-1         day-2         day-3         day-4         day-5
----------------------------------------------------------------------------------------
BIGBANKS       100%          1             1             1             1             1
DJI-13         100%          1             1             1             .923          .923
INFRA          .909          .909          .909          .818          .818          .818
HOMEBLDG       .882          .882          .823          .823          .823          .764
DOWJONES       .866          .866          .866          .833          .833          .833
EDU            .857          .857          .857          .857          .714          .714
SOLAR          .857          .809          .809          .809          .809          .809
BIGMIL         .833          .833          .833          .833          .833          .833
NIFTY          .833          .833          .8            .8            .833          .9
N=9
----------------------------------------------------------------------------------------------
INSURANC       .781          .718          .75           .75           .687          .718
SEMI           .776          .807          .784          .8            .776          .784
SP-100         .76           .77           .791          .77           .739          .739
OILGAS         .736          .736          .75           .777          .701          .68
FOOD           .733          .733          .666          .6            .533          .533
ELECTRON       .72           .737          .726          .754          .743          .754
ETFS           .707          .784          .784          .784          .769          .784
UTILITY        .697          .72           .697          .697          .72           .697
CHEM           .692          .723          .723          .738          .753          .784
MILITARY       .684          .789          .789          .789          .815          .815
CHINA          .671          .687          .687          .703          .656          .64
INDEXES        .653          .678          .683          .678          .627          .632
SP500          .652          .668          .662          .672          .658          .67
GAMING         .642          .642          .5            .607          .535          .571
MORNSTAR       .642          .68           .642          .663          .651          .659
NASD-100       .636          .681          .659          .681          .67           .659
RUS-1000       .628          .643          .64           .66           .649          .647
INDMATER       .626          .626          .659          .681          .681          .714
SOFTWARE       .621          .666          .621          .696          .696          .696
GREEN          .612          .645          .774          .774          .709          .741
FINANCE        .608          .63           .739          .815          .804          .836
HACKERS        .6            .64           .64           .64           .6            .6
COMODITY       .591          .591          .577          .619          .535          .549
AUTO           .589          .692          .692          .692          .717          .769
COMPUTER       .521          .521          .521          .565          .565          .565
REIT           .519          .525          .486          .446          .413          .446
N=26
----------------------------------------------------------------------------------------------
REGBANKS       .484          .545          .696          .848          .878          .909
RETAIL         .415          .32           .32           .396          .377          .433
BIOTECH        .413          .444          .467          .545          .54           .48
BEVERAGE       .4            .35           .4            .45           .5            .5
COAL           .375          .5            .625          .875          .75           .75
GOLD           .306          .326          .285          .285          .224          .244
TRANSP         .3            .6            .65           .6            .6            .7
JETS           .222          .333          .333          .333          .333          .333
BONDFUND       .169          .214          .187          .133          .08           .08
HOSPITAL       .125          .125          .125          0             0             .25
PIPELINE       0             0             0             0             0             0
N=11
|
=======================================================================
11/8/2017
The
operative Peerless Signals remains the very
Bullish Buy B21.
That there recently has been more MINCPs than MAXCPs
and the
NYSE AD/Line is lagging the DJI amplifies the need to be selective
in stock and ETF selection. It also show the desirability of
being
hedged.
For some time, all one has had to do to make money in the market has been to
be
long SOXL and the
bullish MAXCP stocks and short
RETL and the Bearish MINCPs.
like BBBY.
The way these trends are continuing, we see that trend-playing Professionals
are perfectly in
control. It's true, though, that Bank stocks have recently turned down
somewhat
inexplicably. This has to be of some concern short-term. But is
the big tax cut really
in jeopardy?
The Professionals watch this news. They see the parrying back and
forth between the
Republicans and Democrats for control of Congress and conclude that they are
not very important now. The big thing in their mind is that there will
be, either this
year or next, a big tax cut that will benefit the very wealthy who own most
stocks.
The Republican Congressional majority may tinker with some of the deductions
on
the margins, but the heart of the tax bill will remain unchanged. Wall
Street just does
not expect to be disappointed. This year or next, there will be a big
tax reduction for
the very wealthy and for corporations wishing to repatriate their overseas
profits.
See the NY Times article tonight.
https://www.nytimes.com/2017/11/08/us/politics/senate-republicans-will-diverge-from-house-in-sweeping-tax-rewrite.html?hp&action=click&pgtype=Homepage&clickSource=story-heading&module=first-column-region®ion=top-news&WT.nav=top-news
With the DJI-30, SP-500,
OEX and NASDAQ rising
month after month, the economy is
steadily improving. Bullishly, there has been no big increase in the
number of Sectors with the
majority of their stocks below the 65-dma for months. So, simply
holding the bullish Quicksilver
ETFs plus the strongest Bullish
MAXCPs and shorting some of our
Bearish
MINCPs
as a hedge
continues to work. When it's not broke, don't fix it. Or as JFK said,
"When it's not necessary to change, it
necessary not to change".
The 3 Most Bullish (Highest Power Ranked) Semi-Conductor Stocks
The 3 Most Bearish (Lowest Power Ranked) Retail Stock Stocks
Table 1
Tiger's QUICKSILVER and MAJOR ETFS and KEY
STOCKS:
11/8/2017
QuickSilver Documentation This is for short-term trading leveraged ETFs.
It also provides a useful short-term outlook of these sectors ETF's and the
sectors they
represent.
Blue is Bullish and Red is Bearish.
1 Candle-Stick color is shortest-term. This changes when close vis-a-vis opng changes.
So, in stocks or ETFs that
have advanced a long ways, traders should sell when a higher
opening
gives way to a decline that brings a drop below the previous day's close.
2 5-dma AROC and Close-versus- pivot point is next most short-term.
W = warning. Close is below PIVOT-Point
3 Closing Power trend-direction vs. its 21-dma is next most short-term.
4 IP21 is used to spot divergences
an to estimate underlying support.
5
> IP21 falling and below +.15 and its 21-dma is bearish in an
over-extended ETF, especially
when its Closing Power is falling and is below its 21-dma.
> IP21 below 07 with AROC below .07 is less likely to bring a rally back up from
21-dma.
6 Note price trend-lines, support/resistance and price patterns on charts.
Table 1
QUICKSILVER on ETFS - 11/8/17
Bullish Across-the Board Blue = COMPQX, QQQ, SOXL, TECL, GASL, UGA, AAPL, GOOG, AMZN
Bearish Across-the Board Red = IWM, RETL
QUICKSILVER on ETFS - 11/08/17
ETF      CLOSE   CHANGE     PIVOT-PT      5-dma AROC  CL-PWR   CANDLE  IP21   ITRS
---------------------------------------------------------------------------------------------
DIA       235.46    .04      234.96        27%        ----      BLUE   .195     0
---------------------------------------------------------------------------------------------
COMPQX    6789.12    21.34   6714.94       53.8%      Bullish   BLUE   .201     0
---------------------------------------------------------------------------------------------
SPY       259.11    .44      257.59        31.4%      Bullish   BLUE   .275    -.019
---------------------------------------------------------------------------------------------
QQQ       154.5    .62       151.81        78.4%      Bullish   BLUE   .32     .003
---------------------------------------------------------------------------------------------
MDY       333.9    .82       333.02        17.4%      Bullish   BLUE   .204    -.004
---------------------------------------------------------------------------------------------
IWM       147.2    .2       W148.71       -36.1%      Bearish   BLUE  -.054    -.007
---------------------------------------------------------------------------------------------
FAS       60.03   -.39      W61.89        -46.5%      Bearish   RED    .118     .127
---------------------------------------------------------------------------------------------
RETL      23.56    .13      W25.42        -200%       Bearish   BLUE  -.188    -.069
---------------------------------------------------------------------------------------------
SOXL      164.29    1.64     148.52        569.6%     Bullish   BLUE   .493     .699
---------------------------------------------------------------------------------------------
TECL      113.01    1.82     107.86        245.5%     Bullish   BLUE   .34     .258
---------------------------------------------------------------------------------------------
IBB       312.8   -1.22      312.06        9.7%       Bearish   RED   -.221    -.093
---------------------------------------------------------------------------------------------
GLD       122.6    .58       119.46        142.2%     Bullish   BLUE   .092    -.013
---------------------------------------------------------------------------------------------
OIL       6.09   -.06        5.8           310.7%     Bullish   ----   .363     .194
---------------------------------------------------------------------------------------------
OIH       25.87   -.02       24.51         276.7%     ----      BLUE   .09     .09
---------------------------------------------------------------------------------------------
GASL      25.47   -.73       23.2          255.6%     Bullish   BLUE   .292     .55
---------------------------------------------------------------------------------------------
UGA       32.83    .08       32.12         224.6%     Bullish   BLUE   .558     .093
---------------------------------------------------------------------------------------------
UUP       24.66   -.01       24.63         6.1%       Bearish   ----   .01    -.048
---------------------------------------------------------------------------------------------
IEF       106.41   -.13      106.2         16.5%      Bullish   RED    .074    -.093
---------------------------------------------------------------------------------------------
CORN      17.23   -.04      W17.4         -17.3%      ----      ----  -.149    -.082
---------------------------------------------------------------------------------------------
WEAT      6.26   -.03       W6.29          63.8%      Bullish   ----   .015    -.104
---------------------------------------------------------------------------------------------
YINN      34.48    .17       33.73         181.1%     ----      BLUE   .086     .079
---------------------------------------------------------------------------------------------
RSX       22.41    .17       21.99         95.2%      Bearish   ----  -.118     .004
---------------------------------------------------------------------------------------------
AAPL      176.24    1.43     168.11        272.9%     Bullish   BLUE   .235     .005
---------------------------------------------------------------------------------------------
GOOG      1039.85    6.52    1025.58       69.8%      Bullish   BLUE   .002     .052
---------------------------------------------------------------------------------------------
MSFT      84.56    .29       84.05         82.1%      ----      BLUE  -.065     .08
---------------------------------------------------------------------------------------------
AMZN      1132.88    9.71    1094.22       131.5%     Bullish   BLUE  .188     .11
---------------------------------------------------------------------------------------------
FB        179.56   -.69      178.92       -86%        Bearish   RED   .159    -.009
---------------------------------------------------------------------------------------------
NVDA     209.16   -2.87      205.94        47%        Bullish   RED   .345     .193
---------------------------------------------------------------------------------------------
BA        265.57   -.56      262.63        134.6%     Bullish   RED   .066     .027
---------------------------------------------------------------------------------------------
GS        241.25    1.44    W246.88       -61.7%      Bearish   BLUE -.011     .02
|
Table 2
COMPARISONS
OF BULLISH AND BEARISH NUMBERS
11/8
11/7 11/6 11/3
11/2 11/1 10/31
10/30 10/27 10/26 10/25 10/24 10/23 10/20
NEWHIGHS 324 255 466
360 334 272
392 190 480
309 153 376
200 533
NEWLOWS 93 103 96 112
114 70
170 84
83 74
103 73
56 41
--------------------------------------------------------------------------------------------------------------------------
MAXCPs 188
114 164 140
113
64
158
97
184 120
86 117 125
258
MINCPs
145 213 136 180 214 101
120 139
162 229
209 179 157
106
--------------------------------------------------------------------------------------------------------------------------
TTTNHs
83 67 95
71 69
43
76
72 76
59 42
70 53 78
TTTNLs
278 352 218 311
313
299 195
151
224
340 389 216
245 81
--------------------------------------------------------------------------------------------------------------------------
FASTUP
208
187 239
190 196 178
150 112
95 86
73 92
86
82
FASTDOWN
259 259 194
214 208
185 202 200
115 222 185
155 158 129
|
Table 3Count of Stocks and New Highs in Key Tiger Directories
Date = 171108 Total NHs Pct
-------------------------------------------------------------------
NIFTY 30 12 40 %
GAMING 28 9 32 %
HOMEBLDG 17 5 29 %
SOLAR 21 6 29 %
ETFS 65 13 20 %
HACKERS 25 5 20 %
UTILITY 43 8 19 %
INDEXES 196 35 18 %
NASD-100 88 15 17 %
SEMI 130 21 16 %
====================================================
CHINA 64 9 14 %
GREEN 31 4 13 %
DOWJONES 30 4 13 %
ELECTRON 179 21 12 %
SOFTWARE 66 8 12 %
SP500 486 54 11 %
MORNSTAR 238 23 10 %
RUS-1000 842 82 10 %
BEVERAGE 20 2 10 %
COMPUTER 23 2 9 %
REIT 179 17 9 %
DJI-13 13 1 8 %
SP-100 96 8 8 %
CHEM 65 4 6 %
RETAIL 54 3 6 %
AUTO 39 2 5 %
INDMATER 92 5 5 %
BIOTECH 387 14 4 %
COMODITY 71 3 4 %
REGBANKS 33 1 3 %
MILITARY 38 1 3 %
OILGAS 144 4 3 %
INSURANC 32 1 3 %
FINANCE 92 1 1 %
---------------------------------------------------
None BIGBANKS BIGMIL INFRA TRANSP COAL
GOLD EDU PIPELINE FOOD BONDFUND
HOSPITAL JETS
======================================================
|
Table 4 RANKING OF KEY DIRECTORIES BASED PCT.OF STOCKS ABOVE 65-DMA
11/9/17
Bullish =37
Bearish = 8
---------------------------------------------------------------------------------------
Directory Current day-1 day-2 day-3 day-4 day-5
----------------------------------------------------------------------------------------
BIGBANKS 1 1 1 1 1 1
DJI-13 1 1 1 .923 .923 .923
INFRA .909 .909 .818 .818 .818 .818
HOMEBLDG .882 .823 .823 .823 .764 .882
DOWJONES .866 .866 .833 .833 .833 .8
EDU .857 .857 .857 .714 .714 .714
BIGMIL .833 .833 .833 .833 .833 .5
NIFTY .833 .8 .8 .833 .9 .866
SEMI .815 .784 .8 .776 .784 .746
SOLAR .809 .809 .809 .809 .809 .809
N=10
============================================================================================
MILITARY .789 .789 .789 .815 .815 .763
ETFS .784 .784 .784 .769 .784 .784
SP-100 .77 .791 .77 .739 .739 .729
ELECTRON .737 .726 .754 .743 .754 .731
OILGAS .736 .75 .777 .701 .687 .708
FOOD           .733          .666          .6            .533          .533          .6
CHEM           .723          .723          .738          .753          .784          .753
UTILITY        .72           .697          .697          .72           .697          .627
INSURANC       .718          .75           .75           .687          .718          .718
AUTO           .692          .692          .692          .717          .769          .769
CHINA          .687          .687          .703          .656          .64           .718
NASD-100       .681          .659          .681          .67           .659          .704
MORNSTAR       .68           .642          .663          .651          .659          .663
INDEXES        .678          .683          .678          .627          .632          .642
SP500          .668          .662          .672          .658          .67           .672
SOFTWARE       .666          .621          .696          .696          .681          .757
GREEN          .645          .774          .774          .709          .741          .741
RUS-1000       .643          .64           .66           .649          .647          .65
GAMING         .642          .5            .607          .535          .571          .642
HACKERS        .64           .64           .64           .6            .6            .64
FINANCE        .63           .739          .815          .804          .836          .793
INDMATER       .619          .652          .673          .673          .706          .695
TRANSP         .6            .65           .6            .6            .7            .65
COMODITY       .591          .577          .619          .535          .549          .549
REGBANKS       .545          .696          .848          .878          .909          .878
REIT           .525          .486          .446          .413          .446          .402
COMPUTER       .521          .521          .565          .565          .565          .695
N=27
==============================================================================================
COAL           .5            .625          .875          .75           .75           .75
==============================================================================================
BIOTECH        .444          .467          .545          .54           .488          .498
BEVERAGE       .35           .4            .45           .5            .5            .45
JETS           .333          .333          .333          .333          .333          .444
RETAIL         .333          .333          .407          .388          .444          .37
GOLD           .32           .28           .28           .22           .24           .22
BONDFUND       .214          .187          .133          .08           .071          .053
HOSPITAL       .125          .125          0             0             .25           .25
PIPELINE       0             0             0             0             0             .142
N= 8
|
=================================================================================
11/7/2017 The
operative Peerless Signals remains the very
Bullish Buy B21.
But the deteriorating NYSE breadth and the more numerous MINCPs than MAXCPs
show us the need to be very selective and the value in shorting some of our
Bearish
MINCPs as a hedge.
The extreme bullishness of the coming tax cuts for the super-rich can be
seen by how
much the Dow Jones rose after the early-1926 Coolidge dropping of the top
rates from 46% to 25%, after JFK in 1963 brought about the first big drop in
top bracket income taxes in 35 years, from 90% to 70%, and after Reagan in
steps
caused these rates to drop all the way from 68% to 28%. See the table
in this link.
https://www.politico.com/interactives/2017/gop-tax-rate-cut-wealthy/
But the DJI has now been rising every month
since Trump's
election victory. So most of the bullishness that a drop in taxes on
the
the small sector of the population that own the majority of all stocks has
likely
been discounted. The question, of course, is how much?
For many months, my answer has been that we are apt to see still higher
prices
so long as the Federal Funds' interest rates stay below 3%. ( If they were
to rise
above 10%, of course, the market would fall. This was what happened in
1981
and 1984.)
Our chart of short-interest rates shows the
upswing in progress. But Interest Rates should
be able to stay safely below 3% until mid-2018. That's my guess.
We do see
oil prices rising, but the Dollar is not showing much weakness right now.
Its 65-dma
is actually rising.
The conclusion that this market "has legs"
still is supported by the way Buy B21s are most
often not reversed un the Spring of the next year and how generally
ineffective
even Sell S9s in January.
So, until
Peerless gives a Sell, I think we have to let the DJI works its way higher.
However, if it were to spike up to the 3.5% band, I would probably suggest
selling.
The rest of the market is much more mixed.
We see lots of signs that the majority
of stocks are weakening even as the DJI inches upwards. IWM rates an
across-the
board Red Bearish rating in the Quicksilver Table 1. This is ETF
representing 2000
stocks. IBB (Biotechs) continues to suffer from the same bearish forces.
Now we must
watch IBB to see if it can hold up above its still-rising longer-term moving
averages,
Note that a really weak IBB will weaken the NASDAQ and is likely to cause
more
profit-taking in our favorite biotech, SPPI. (See below) The Falling
Closing Powers
and negative IP21 readings there represent net Professional Selling and
insider Sellling.
We cannot ruleout a breakdown below support. The Closing Power for IBB
will
first need to break its downtrend.
I should add that the rising interest rates are hurting dividend-paying
REITs and slowing down
even HD in the DJI-30 and the hot-homebuilders. It's not clear why the
Big Banks are
under selling pressure. Watch them. They led the market down in
2007-2008. We don't
want to see that 10 years later.
Elsewhere, the rising oil prices are slowing down the airlines, but will
certainly be a lift
for CVX and XOM in the DJI-30 if they continue to go higher. In addition,
within the
DJI-30, we now see bullish across-the-board Blue QuickSilver readings for
high-priced
BA and AAPL. They are likely to continue to prop up the DJI even
though NYSE declines
have regularly started to outnumber their advancers.
Semi-Conductors are getting over-bought, it's
true. SOXL has tagged its 20% upper band.
This is what caused its short-term sell-offs in December and May, as
well as in June
when its retreat was longer. With its breakout above its
uptrend-resistance, aggressive
very short-term traders will be attracted to it. Following the pattern
of a number of
the most bullishly ranked leveraged ETFs with very high IP21 readings, it
could easily
spike up crazily to 200. So, I would only sell it if we see a
clear-cut reversal day. These
occur when there is an upside gap at the opening on very high volume and it
closes
at the lows for the day. Traders should probably anticipate this and
sell if it opens way
up and the drops below the previous day's close.
Charts 11/7/2017
PEERLESS
DJI, Signals, Indicators Daily
DJI Volume 10-DayUp/Down Vol
Hourly DJIA
A/D Line for All
Stocks
NASDAQ
S&P
OEX
NYSE
COMPQX
DJI-15 DJI-20
DJI-30
DIA
SPY
QQQ
MDY
IWM TNA
CrudeOil
FAS
GLD
BBH
IBB
JETS
JNUG
KOL
NUGT
OIH
OIL
RSX
RETL
SDS
SLV
SOXL
TECL
TMF
TNA UGA
(gasoline)
XIV YINN
Commodities:
JJC, NIB,
CHOC
CORN,
WEAT
UUP
(Dollar)
AAPL ADBE
ALXN AMAT
AMGN AMD
AMZN
BA BABA BAC
BIDU
CAT
CVX
FB
GOOG
GS
HD
IBM
JPM M
(Macy's)
MSFT
NFLX
NVDA
QCOM
TSLA TXN
XOM
ANDV (refinery, CMG (Chipotle),
LRCX, SWKS, TOWN
11/7/2017
Bullish MAXCPs Bearish MINCPs
|
Tiger's QUICKSILVER and MAJOR ETFS and KEY
STOCKS:
11/7/2017
QuickSilver Documentation This is for short-term trading leveraged ETFs.
It also provides a useful short-term outlook of these sectors ETF's and the
sectors they
represent.
Blue is Bullish and Red is Bearish.
1 Candle-Stick color is shortest-term. This changes when close vis-a-vis opng changes.
So, in stocks or ETFs that
have advanced a long ways, traders should sell when a higher
opening
gives way to a decline that brings a drop below the previous day's close.
2 5-dma AROC and Close-versus- pivot point is next most short-term.
W = warning. Close is below PIVOT-Point
3 Closing Power trend-direction vs. its 21-dma is next most short-term.
4 IP21 is used to spot divergences
an to estimate underlying support.
5
> IP21 falling and below +.15 and its 21-dma is bearish in an
over-extended ETF, especially
when its Closing Power is falling and is below its 21-dma.
> IP21 below 07 with AROC below .07 is less likely to bring a rally back up from
21-dma.
6 Note price trend-lines, support/resistance and price patterns on charts.
Table 1
QUICKSILVER on ETFS - 11/7/17
Bullish Across-the Board Blue = QQQ, SOXL, AAPL, BA, NVDA
Bearish Across-the Board Red = IWM, RETL
ETF      CLOSE   CHANGE     PIVOT-PT      5-dma AROC   CL-PWR   CANDLE  IP21   ITRS
---------------------------------------------------------------------------------------------
DIA       235.42    .01      234.19        38.1%       ----      RED   .195     0
---------------------------------------------------------------------------------------------
COMPQX    6767.78   -18.66   6716.53       29.7%       ----      RED   .162    -.003
---------------------------------------------------------------------------------------------
SPY       258.67   -.18      257.49        29.5%       Bullish   RED   .251    -.023
---------------------------------------------------------------------------------------------
QQQ       153.88    .09      152.1         56.7%       Bullish   BLUE  .293
---------------------------------------------------------------------------------------------
MDY       333.08   -2.11     332.74       -8.1%        ----      RED   .165    -.011
---------------------------------------------------------------------------------------------
IWM       147   -1.78      W148.27        -76%         Bearish   RED  -.101    -.011
---------------------------------------------------------------------------------------------
FAS       60.42   -1.51     W60.6          5.7%        Bearish   RED   .137     .12
---------------------------------------------------------------------------------------------
RETL      23.43   -1.78     W24.55        -214.3%      Bearish   RED  -.339    -.104
---------------------------------------------------------------------------------------------
SOXL      162.65   -.45      146.58        481.6%      Bullish   BLUE  .487     .691
---------------------------------------------------------------------------------------------
TECL      111.19    .25      107.63        158.9%      Bullish   RED   .304     .248
---------------------------------------------------------------------------------------------
IBB       314.02   -1.57     312.19       -2.5%        Bearish   RED  -.202    -.089
--------------------------------------------------------------------------------------------
GLD       122.6    .58       119.46        142.2%      Bullish   BLUE  .092    -.016
---------------------------------------------------------------------------------------------
OIL       6.15   -.03        5.72          349.1%      Bullish   ----  .44     .193
---------------------------------------------------------------------------------------------
OIH       25.89   -.04       24.48         332.9%      ----      RED   .064     .094
---------------------------------------------------------------------------------------------
GASL      26.2   -.47        24.2          752.4%      Bullish   RED   .288     .586
---------------------------------------------------------------------------------------------
UGA       32.75   -.15       31.38         251.9%      Bullish   ----  .565     .111
---------------------------------------------------------------------------------------------
UUP       24.67    .04       24.63         18.3%       Bearish   ---- -.019    -.049
---------------------------------------------------------------------------------------------
IEF       106.54    .04      106.06        17.9%       Bullish   ----  .069    -.093
---------------------------------------------------------------------------------------------
CORN      17.27    0        W17.29         17.3%       Bearish   ---- -.155    -.088
---------------------------------------------------------------------------------------------
WEAT      6.29   -.03        6.18          72%         Bullish   ---- -.019    -.097
---------------------------------------------------------------------------------------------
YINN      34.31    .61       33.26         251.9%      ----      RED   .093     .072
---------------------------------------------------------------------------------------------
RSX       22.24   -.04       21.99         102.4%      Bearish   RED  -.078    -.012
---------------------------------------------------------------------------------------------
AAPL      174.81    .56      166.89        169.5%      Bullish   BLUE  .185     .002
---------------------------------------------------------------------------------------------
GOOG      1033.33    7.43    1025.5        81.4%       Bullish   BLUE -.021     .051
---------------------------------------------------------------------------------------------
MSFT      84.27   -.2        83.18         65%         Bearish   RED  -.112     .077
---------------------------------------------------------------------------------------------
AMZN      1123.17    2.51    1103.68       80.8%       Bullish   RED   .158     .107
---------------------------------------------------------------------------------------------
FB        180.25    .08     W182.66        5.3%        Bearish   RED   .156    -.002
---------------------------------------------------------------------------------------------
NVDA     212.03    2.4       207.2         125.7%      Bullish   BLUE  .303     .205
---------------------------------------------------------------------------------------------
BA        266.13    2.06     258.5         156.1%      Bullish   BLUE  .138     .042
---------------------------------------------------------------------------------------------
GS        239.81   -3.68    W244.26       -54.6%       Bearish   RED  -.038     .008
|
Table 2
COMPARISONS
OF BULLISH AND BEARISH NUMBERS
11/7
11/6 11/3 11/2
11/1 10/31 10/30 10/27 10/26 10/25
10/24 10/23 10/20 10/19 10/18
NEWHIGHS 255 466
360 334 272
392 190 480
309 153 376
200 533 300
381
NEWLOWS 103 96 112
114 70
170 84
83 74
103 73
56 41 41
32
--------------------------------------------------------------------------------------------------------------------------
MAXCPs
114 164 140
113
64
158
97
184 120
86 117 125
258 251 154
MINCPs
213 136 180 214 101
120 139
162 229
209 179 157
106 98 101
--------------------------------------------------------------------------------------------------------------------------
TTTNHs
67 95
71 69
43
76
72 76
59 42
70 53 78
89 88
TTTNLs
352 218 311
313
299 195
151
224
340 389 216
245 81 122
153
--------------------------------------------------------------------------------------------------------------------------
FASTUP
187 239
190 196 178
150 112
95 86
73 92
86
82
63 68
FASTDOWN
259 194
214 208
185 202 200
115 222 185
155 158 129
148 174
|
Table 3
Count of Stocks and New Highs in Key Tiger Directories
Date = 17.11.07
               No. in Sector NHs           Pct.
-------------------------------------------------------------------
NIFTY30        30            9             30 %
UTILITY        43            13            30 %
GAMING         28            8             29 %
DJI-13         13            3             23 %
HOMEBLDG       17            3             18 %
INFRA          11            2             18 %
BIGMIL         6             1             17 %
DOWJONES       30            5             17 %
ETFS           65            11            17 %
CHINA          64            11            17 %
======================================================
EDU            7             1             14 %
INDEXES        196           24            12 %
SP500          486           53            11 %
SP-100         96            10            10 %
RUS-1000       842           84            10 %
NASD-100       88            9             10 %
SOLAR          21            2             10 %
ELECTRON       179           16            9 %
INSURANC       32            3             9 %
COMPUTER       23            2             9 %
SEMI           123           10            8 %
REIT           179           13            7 %
GREEN          31            2             6 %
CHEM           65            4             6 %
OILGAS         144           8             6 %
AUTO           39            2             5 %
MILITARY       38            2             5 %
INDMATER       92            5             5 %
MORNSTAR       238           11            5 %
SOFTWARE       66            3             5 %
TRANSP         20            1             5 %
BEVERAGE       20            1             5 %
HACKERS        25            1             4 %
BIOTECH        387           14            4 %
RETAIL         54            1             2 %
FINANCE        92            1             1 %
COMODITY       71            1             1 %
------------------------------------------------
None: BIGBANKS REGBANKS  COAL  GOLD   PIPELINE
FOOD   BONDFUND  HOSPITAL  JETS
|
 |
Table 4
 RANKING OF KEY DIRECTORIES BASED PCT.OF STOCKS ABOVE 65-DMA
               11/7/17
Bullish = 36
Bearish = 9
---------------------------------------------------------------------------------------
Directory     Current       day-1         day-2         day-3         day-4         day-5
----------------------------------------------------------------------------------------
BIGBANKS       100%          1             1             1             1             1
DJI-13         100%          1             .923          .923          .923          .923
INFRA          .909          .818          .818          .818          .818          .909
DOWJONES       .866          .833          .833          .833          .8            .833
EDU            .857          .857          .714          .714          .714          .714
BIGMIL         .833          .833          .833          .833          .5            .666
HOMEBLDG       .823          .823          .823          .764          .882          .882
SOLAR          .809          .809          .809          .809          .809          .809
SEMI           .804          .829          .804          .813          .78           .796
NIFTY          .8            .8            .833          .9            .866          .9
N=10
------------------------------------------------------------------------------------------
SP-100         .791          .77           .739          .739          .729          .739
MILITARY       .789          .789          .815          .815          .763          .763
ETFS           .784          .784          .769          .784          .784          .753
GREEN          .774          .774          .709          .741          .741          .774
INSURANC       .75           .75           .687          .718          .718          .781
OILGAS         .75           .777          .701          .687          .701          .666
FINANCE        .739          .815          .804          .836          .793          .804
ELECTRON       .726          .754          .743          .754          .743          .759
CHEM           .723          .738          .753          .784          .753          .753
UTILITY        .697          .697          .72           .697          .627          .72
REGBANKS       .696          .848          .878          .909          .878          .909
AUTO           .692          .692          .717          .769          .794          .769
CHINA          .687          .703          .656          .64           .718          .64
INDEXES        .683          .678          .627          .632          .647          .642
FOOD           .666          .6            .533          .533          .533          .6
SP500          .662          .672          .658          .67           .672          .681
NASD-100       .659          .681          .67           .659          .704          .681
INDMATER       .652          .673          .673          .706          .695          .695
TRANSP         .65           .6            .6            .7            .65           .65
MORNSTAR       .642          .663          .651          .659          .663          .668
HACKERS        .64           .64           .6            .6            .64           .8
RUS-1000       .64           .66           .649          .647          .65           .66
COAL           .625          .875          .75           .75           .75           .875
SOFTWARE       .621          .696          .696          .681          .757          .833
COMODITY       .577          .619          .535          .549          .549          .535
COMPUTER       .521          .565          .565          .565          .695          .695
N=26
================================================================================================
GAMING         .5            .607          .535          .571          .642          .642
================================================================================================
REIT           .486          .446          .413          .446          .402          .335
BIOTECH        .467          .545          .54           .488          .503          .514
BEVERAGE       .4            .45           .5            .5            .45           .55
JETS           .333          .333          .333          .333          .444          .222
RETAIL         .333          .407          .388          .444          .37           .407
GOLD           .28           .28           .22           .24           .22           .16
BONDFUND       .187          .133          .08           .071          .044          .089
HOSPITAL       .125          0             0             .25           .25           .25
PIPELINE       0             0             0             0             .142          0
N=9
|
=================================================================================
=================================================================================
11/6/2017
The
operative Peerless Signals remains the very
Bullish Buy B21.
Professionals are switching their funds slowly from
DIA and SPY. They are redeploying funds
very aggressively into the red hot tech sectors.
See in the charts' section below, the jumps made by
SOXL, TECL and QQQ into all-time high ground. The
buy-out bid for Qualcomm has heated up
their rally. I don't expect the Feds to try to stop
this effort of concentrate economic power here.
If anything, there will be more mergers, just as there
were in the 1980s and this will continue even
longer because interest rates are much lower and the
Trump Administration is so clearly anti-regulation.
Hold your long tech positions tightly and be ready to
cover short sales in any MINCP stocks whose
Closing Power breaks its long downtrendline. .
Watch the news on Qualcomm.
Will Broadcomm be allowed by the Trump Administration
to take over San Diego
chip maker Qualcomm? Qualcomm's Board of Directors is not happy with
the
current offer. If Broadcomm succeeds, there are apt to be many other
buy-outs, all of which would be a big stimulus to stock prices, especially
in the red-hot
semi-conductor field.
This will be reminiscent of the mid-1980s. Only
extremes of
Junk Bond financing and insider trading scandals stopped the Tax Cut Reagan
bull market. But at that time, interest rates were much higher.
The Federal Funds Rate
was close to 6% in 1986.
https://www.nytimes.com/2017/11/06/business/dealbook/broadcom-qualcomm-merger.html?emc=edit_th_20171107&nl=todaysheadlines&nlid=58223894
Charts 11/6/2017
PEERLESS
DJI, Signals, Indicators Daily
DJI Volume 10-DayUp/Down Vol
Hourly DJIA
A/D Line for All
Stocks
NASDAQ
S&P
OEX
NYSE
COMPQX
DJI-15 DJI-20
DJI-30
DIA
SPY
QQQ
MDY
IWM TNA
CrudeOil
FAS
GLD
BBH
IBB
JETS
JNUG
KOL
NUGT
OIH
OIL
RSX
RETL
SDS
SLV
SOXL
TECL
TMF
TNA UGA
(gasoline)
XIV YINN
Commodities:
JJC, NIB,
CHOC
CORN,
WEAT
UUP
(Dollar)
AAPL ADBE
ALXN AMAT
AMGN AMD
AMZN
BA BABA BAC
BIDU
CAT
CVX
FB
GOOG
GS
HD
IBM
JPM M
(Macy's)
MSFT
NFLX
NVDA
QCOM
TSLA TXN
XOM
ANDV (refinery, CMG (Chipotle),
LRCX, SWKS, TOWN
11/6/2017
Bullish MAXCPs Bearish MINCPs
|
1924-1926 Bull Market
set off by Big Republican Tax Cut
 |
 |
 |
 |
 |
Table 1
Tiger's QUICKSILVER and MAJOR ETFS and KEY
STOCKS:
11/6/2017
QuickSilver Documentation This is for short-term trading leveraged ETFs.
It also provides a useful short-term outlook of these sectors ETF's and the
sectors they
represent.
Blue is Bullish and Red is Bearish.
1 Candle-Stick color is shortest-term. This changes when close vis-a-vis opng changes.
So, in stocks or ETFs that
have advanced a long ways, traders should sell when a higher
opening
gives way to a decline that brings a drop below the previous day's close.
2 5-dma AROC and Close-versus- pivot point is next most short-term.
W = warning. Close is below PIVOT-Point.
3 Closing Power trend-direction vs. its 21-dma is next most short-term.
4 IP21 is used to spot divergences
an to estimate underlying support.
5
> IP21 falling and below +.15 and its 21-dma is bearish in an
over-extended ETF, especially
when its Closing Power is falling and is below its 21-dma.
> IP21 below 07 with AROC below .07 is less likely to bring a rally back up from
21-dma.
6 Note price trend-lines, support/resistance and price patterns on charts.
|
Table 1
QUICKSILVER on ETFS - 11/6/17
ETF      CLOSE   CHANGE     PIVOT-PT      5-dma AROC   CL-PWR   CANDLE  IP21   ITRS
---------------------------------------------------------------------------------------------
DIA       235.41    .23      233.63        44.4%       ----      BLUE   .182    ---
---------------------------------------------------------------------------------------------
COMPQX    6786.44    22      6727.67       65%         ----      BLUE   .161   .003
---------------------------------------------------------------------------------------------
SPY       258.85    .4       257.15        40.8%       ----      BLUE   .247  -.021
---------------------------------------------------------------------------------------------
QQQ       153.79    .52      152.15        72.6%    Bullish      BLUE   .267   .004
---------------------------------------------------------------------------------------------
MDY       335.19    1.33     333.62        50.1%    Bullish      BLUE   .154  -.004
---------------------------------------------------------------------------------------------
IWM       148.78    .17     W149.26        19.2%    Bearish      ----  -.085   .007
---------------------------------------------------------------------------------------------
FAS       61.93    .45       60.35         119.8%   Bullish      BLUE   .151   .136
---------------------------------------------------------------------------------------------
RETL      25.21    .05       24.5          165.3%   Bearish      RED   -.289  -.046
---------------------------------------------------------------------------------------------
SOXL      163.1    6.66      147.96        617.8%   Bullish      BLUE   .486   .71
---------------------------------------------------------------------------------------------
TECL      110.94    .62      107.73        206.9%   Bullish      BLUE   .266   .258
---------------------------------------------------------------------------------------------
IBB       315.59   -1.28     314.18       -17%      Bearish      RED   -.2    -.065
---------------------------------------------------------------------------------------------
GLD       122.6    .58       119.46        142.2%   Bullish      BLUE   .092  -.015
---------------------------------------------------------------------------------------------
OIL       6.18    .26        5.74          406.7%   Bullish      BLUE   .451   .166
---------------------------------------------------------------------------------------------
OIH       25.93    1.17      24.24         381%     ----         BLUE   .094   .086
---------------------------------------------------------------------------------------------
GASL      26.67    2.7       22.57         1065.4%   Bullish     BLUE   .289   .561
---------------------------------------------------------------------------------------------
UGA       32.9    .66        31.14         328.1%    Bullish     BLUE   .536   .147
---------------------------------------------------------------------------------------------
UUP       24.63   -.06       24.58         14.2%     Bearish     RED   -.012  -.053
---------------------------------------------------------------------------------------------
IEF       106.5    .13       106.16        12.7%     Bullish     ----   .08   -.092
---------------------------------------------------------------------------------------------
CORN      17.27   -.05       17.21        -23.1%     Bearish     RED   -.161  -.092
---------------------------------------------------------------------------------------------
WEAT      6.32    .04        6.2           40%       ----        ----  -.086  -.104
--------------------------------------------------------------------------------------------
YINN      33.7    .31        32.63         205.6%    Bullish     BLUE   .114  -.053
---------------------------------------------------------------------------------------------
RSX       22.28    .5        21.79         52.5%     ----        BLUE  -.022  -.005
---------------------------------------------------------------------------------------------
AAPL      174.25    1.75     169.04        223.2%    Bullish     BLUE   .156   .01
---------------------------------------------------------------------------------------------
GOOG      1025.9   -6.58     1016.64       42.9%     Bullish     RED   -.075   .04
---------------------------------------------------------------------------------------------
MSFT      84.47    .33       83.18         34.7%     ----        BLUE  -.095   .08
---------------------------------------------------------------------------------------------
AMZN      1120.66    9.06    1105.28       44.4%     Bullish     BLUE   .149   .106
---------------------------------------------------------------------------------------------
FB        180.17    1.25     180.06        8.3%      Bearish      BLUE   .113   .004
---------------------------------------------------------------------------------------------
NVDA     209.63    .94       206.81        140.2%    Bullish     BLUE   .306   .2
---------------------------------------------------------------------------------------------
BA        264.07    2.32     257.98        92.7%     Bullish     BLUE   .138   .04
--------------------------------------------------------------------------------------------
GS        243.49   -.91      242.48        53.3%     Bearish     ----  -.033   .015
|
Table 3
COMPARISONS OF BULLISH AND BEARISH NUMBERS
11/6
11/3 11/2 11/1
10/31 10/30 10/27 10/26 10/25 10/24
10/23 10/20 10/19 10/18 10/17
NEWHIGHS 466
360 334 272
392 190 480
309 153 376
200 533 300
381 238
NEWLOWS 96 112
114 70
170 84
83 74
103 73
56 41 41
32 32
--------------------------------------------------------------------------------------------------------------------------
MAXCPs 164 140
113
64
158
97
184 120
86 117 125
258 251 154 125
MINCPs 136
180 214 101
120 139
162 229
209 179 157
106 98 101
89
--------------------------------------------------------------------------------------------------------------------------
TTTNHs
95
71 69
43
76
72 76
59 42
70 53 78
89 88
65
TTTNLs
218
311
313
299 195
151
224
340 389 216
245 81 122
153 117
--------------------------------------------------------------------------------------------------------------------------
FASTUP
239
190 196 178
150 112
95 86
73 92
86
82
63 68 65
FASTDOWN 194
214 208
185 202 200
115 222 185
155 158 129
148 174 166
|
 |
Table 4 RANKING OF KEY DIRECTORIES BASED PCT.OF STOCKS ABOVE 65-DMA
11/6/17
Bullish = 38
Bearish = 8
---------------------------------------------------------------------------------------
Directory     Current       day-1         day-2         day-3         day-4         day-5
----------------------------------------------------------------------------------------
BIGBANKS       100%          1             1             1             1             1
DJI-13         100%          .923          .923          .923          .923          .923
COAL           .875          .75           .75           .75           .875          .875
EDU            .857          .714          .714          .714          .714          .714
REGBANKS       .848          .878          .909          .878          .909          .909
BIGMIL         .833          .833          .833          .5            .666          .833
DOWJONES       .833          .833          .833          .8            .833          .833
HOMEBLDG       .823          .823          .764          .882          .882          .823
INFRA          .818          .818          .818          .818          .909          .818
FINANCE        .815          .804          .836          .793          .804          .826
SOLAR          .809          .809          .809          .809          .809          .761
NIFTY          .8            .833          .9            .866          .9            .866
SEMI           .8            .776          .784          .753          .776          .753
N= 14
-----------------------------------------------------------------------------------------------
MILITARY       .789          .815          .815          .763          .763          .763
ETFS           .784          .769          .784          .784          .753          .707
OILGAS         .783          .706          .692          .706          .671          .622
GREEN          .774          .709          .741          .741          .774          .838
SP-100         .77           .739          .739          .729          .729          .75
ELECTRON       .754          .743          .754          .743          .759          .731
INSURANC       .75           .687          .718          .718          .781          .812
CHEM           .738          .753          .784          .753          .753          .753
CHINA          .703          .656          .64           .718          .64           .578
UTILITY        .697          .72           .697          .627          .72           .744
SOFTWARE       .696          .696          .681          .757          .833          .818
AUTO           .692          .717          .769          .794          .769          .717
NASD-100       .681          .67           .659          .704          .681          .693
INDEXES        .678          .627          .632          .647          .647          .658
INDMATER       .673          .673          .706          .695          .695          .717
SP500          .672          .658          .67           .672          .679          .681
MORNSTAR       .663          .651          .659          .663          .668          .63
RUS-1000       .66           .649          .647          .65           .659          .663
HACKERS        .64           .6            .6            .64           .8            .8
COMODITY       .619          .535          .549          .549          .535          .549
GAMING         .607          .535          .571          .642          .642          .607
FOOD           .6            .533          .533          .533          .6            .533
TRANSP         .6            .6            .7            .65           .6            .65
COMPUTER       .565          .565          .565          .695          .695          .565
BIOTECH        .545          .54           .488          .503          .516          .511
N= 24
-----------------------------------------------------------------------------------------------
BEVERAGE       .45           .5            .5            .45           .55           .5
REIT           .446          .413          .446          .402          .34           .34
RETAIL         .407          .388          .444          .37           .407          .425
JETS           .333          .333          .333          .444          .222          .333
GOLD           .28           .22           .24           .22           .16           .2
BONDFUND       .133          .08           .071          .044          .089          .062
HOSPITAL       0             0             .25           .25           .25           .25
PIPELINE       0             0             0             .142          0             0
N=8
|
=======================================================================
11/3/2017 The
operative Peerless Signals remains the very
Bullish Buy B21.
But for the second day in a row the DJI advanced but there were more up than
down on the NYSE. The technical result is that the DJI is now 1.6%
over
the 21-day with the P-Indicator now only slightly positive. It stands
at only +6.
But because of the very negative data (-798) that is being dropped off from
the P-Indicator 21 days ago, the P-I cannot easily turn negative tomorrow.
So,
do not try to anticipate a Sell here.
Weak breadth at this stage could be a warning about the general market.
But
even the MINCPs outnumbering the MAXCPs will necessarily bring an immediate
DJI top or turn down the elite stocks at the top of the performance pyramid.
To
stop this bull market, we will technically need to see much bigger
divergences
and internal contradictions.
Understand that a tax cut, however, it's crafted
will bring about an increased budget deficit. There usually boost
stocks and the
economy, at least until the FED hikes interest rates much higher than they
are now.
Nothing I have read indicates that the new Fed Chairman for next year will
be
another super-hawk like Paul Volcker was between 1978 and 1984.
Fed-Chrmn-to-be-Powell's biography
https://www.nytimes.com/2017/11/02/business/economy/jerome-powell-federal-reserve-trump.html
Distrust November S9s.
The new Peerless book (due very soon) allows us to see
how well previous Peerless
Sells with similar key values did. I would start off such a historical
search by looking
at signals for the same month. You can see below that there have only
been four November
since 1928. Two of the four produced small losses when employed 2.4%
or 2.7%
over the 21-dma. Three of the four had negative IP21. This is
not true now. If we do
get a Sell S9, I would not put a lot of faith in unless the DJI closes much
farther up
from the 21-day ma.
SOXL (see
below) remains the top QuickSilver ranked ETF. Along with
TECL, QQQ and
OIL,
it shows bullish across-the-board Blue Quicksilver colors and features a
very
high IP21 reading of +.461. Holding this and some of very bullish
MAXCPs long and short
about 1/3rd or 1/4th as many Bearish
MINCP is my sense about how to
playing the market
now.
                   November S9s since 1928.

                         DJI       Gain       Maximum Paper Loss
19321114      S9         65.6      .084       none        0
 la/ma = 1.048, AROC=1.108, PI=13, -4, IP21=.128, V=66, OP=.18, 65-dayCh= -.055
19801114      S9        986.35     .071       1000.17   -.014   11/20
 la/ma = 1.042, AROC=0.175, PI=-93, -9, IP21=-.110, V=-1, OP=.192, 65-dayCh= .039
20091113      S9       10270.47   -.020       10471.5  -.020       12/01
 la/ma = 1.027, AROC=0.247, PI=-122, +66, IP21=-.007, V=-216, OP=.085, 65-dayCh= .092
20161109      S9       18589.69   -.029       19121.6  -.029       11/29
 la/ma = 1.024, AROC=0.303, PI=-132,+121, IP21=-.022, V=-59, OP=-.158, 65-dayCh= .003
|
Charts 11/3/2017
PEERLESS
DJI, Signals, Indicators Daily
DJI Volume 10-DayUp/Down Vol
Hourly DJIA
A/D Line for All
Stocks
NASDAQ
S&P
OEX
NYSE
COMPQX
DJI-15 DJI-20
DJI-30
DIA
SPY
QQQ
MDY
IWM TNA
CrudeOil
FAS
GLD
BBH
IBB
JETS
JNUG
KOL
NUGT
OIH
OIL
RSX
RETL
SDS
SLV
SOXL
TECL
TMF
TNA UGA
(gasoline)
XIV YINN
Commodities:
JJC, NIB,
CHOC
CORN,
WEAT
UUP
(Dollar)
AAPL ADBE
ALXN AMAT
AMGN AMD
AMZN
BA BABA BAC
BIDU
CAT
CVX
FB
GOOG
GS
HD
IBM
JPM M
(Macy's)
MSFT
NFLX
NVDA
QCOM
TSLA TXN
XOM
ANDV (refinery, CMG (Chipotle),
LRCX, SWKS, TOWN
11/3/2017
Bullish MAXCPs Bearish MINCPs
|
 |
 |
 |
 |
 |
 |
 |
 |
Table 1
Tiger's QUICKSILVER and MAJOR ETFS and KEY
STOCKS:
11/3/2017
QuickSilver Documentation This is for short-term trading leveraged ETFs.
It also provides a useful short-term outlook of these sectors ETF's and the
sectors they
represent.
Blue is Bullish and Red is Bearish.
1 Candle-Stick color is shortest-term. This changes when close vis-a-vis opng changes.
So, in stocks or ETFs that
have advanced a long ways, traders should sell when a higher
opening
gives way to a decline that brings a drop below the previous day's close.
2 5-dma AROC and Close-versus- pivot point is next most short-term.
W = warning. Close is below PIVOT-Point
3 Closing Power trend-direction vs. its 21-dma is next most short-term.
4 IP21 is used to spot divergences
an to estimate underlying support.
5
> IP21 falling and below +.15 and its 21-dma is bearish in an
over-extended ETF, especially
when its Closing Power is falling and is below its 21-dma.
> IP21 below 07 with AROC below .07 is less likely to bring a rally back up from
21-dma.
6 Note price trend-lines, support/resistance and price patterns on charts.
QUICKSILVER on ETFS - 11/3/17
ETF      CLOSE   CHANGE     PIVOT-PT      5-dma AROC   CL-PWR   CANDLE  IP21     ITRS
---------------------------------------------------------------------------------------------
DIA       235.18    .22      233.33        21.6%        ----      RED   .194    -----
---------------------------------------------------------------------------------------------
COMPQX    6764.44    49.5    6698.96       47.1%        ----      BLUE  .169    -.002
---------------------------------------------------------------------------------------------
SPY       258.45    .86      256.75        14.4%        Bearish   BLUE  .231    -.021
---------------------------------------------------------------------------------------------
QQQ       153.27    1.46     151.58        66.9%        Bullish   BLUE  .268    -.003
---------------------------------------------------------------------------------------------
MDY       333.86    .84      331.85       -5.9%         Bullish   BLUE  .156    -.004
---------------------------------------------------------------------------------------------
IWM       148.61   -.1       148.21       -39.6%        Bearish   BLUE -.066     .008
---------------------------------------------------------------------------------------------
FAS       61.48   -.41       60.47         37.8%        ----      ----  .137     .136
---------------------------------------------------------------------------------------------
RETL      25.16   -.26       24.39        -100.4%       Bearish   BLUE -.29      .003
---------------------------------------------------------------------------------------------
SOXL      156.44    7.92     144.71        447.3%       Bullish   BLUE  .461     .611
--------------------------------------------------------------------------------------------
TECL      110.32    2.46     106.47        231.8%       Bullish   BLUE  .257     .247
---------------------------------------------------------------------------------------------
IBB       316.87    4.81     316.66        11.9%        Bearish   BLUE -.167    -.068
--------------------------------------------------------------------------------------------
GLD       122.6    .58       119.46        142.2%       Bullish   BLUE  .092    -.016
---------------------------------------------------------------------------------------------
OIL       5.92    .12        5.71          200.6%       Bullish   BLUE  .365     .118
---------------------------------------------------------------------------------------------
OIH       24.76    .25       24.07         225.3%       Bearish   BLUE -.007     .051
---------------------------------------------------------------------------------------------
GASL      23.97    .77       21.74         590.7%       ----      BLUE  .113     .378
---------------------------------------------------------------------------------------------
UGA       32.24    .12       30.83         209.4%       Bullish   ----  .483     .111
---------------------------------------------------------------------------------------------
UUP       24.69    .06       24.56         2%           ----      BLUE -.013    -.06
---------------------------------------------------------------------------------------------
IEF       106.37    .17      106.23        24.5%        Bullish   ----  .096    -.092
---------------------------------------------------------------------------------------------
CORN      17.32   -.08      W17.35        -5.8%         Bearish   ---- -.112    -.098
---------------------------------------------------------------------------------------------
WEAT      6.28   -.01        6.27         -16%          Bullish   ---- -.085    -.111
---------------------------------------------------------------------------------------------
YINN      33.39   -.34       32.34        -69.4%        ----      RED   .118     .097
---------------------------------------------------------------------------------------------
RSX       21.78   -.21      W22.05        -47.8%        Bearish   RED  -.142    -.018
---------------------------------------------------------------------------------------------
AAPL      172.5    4.39      166.72        283.3%       Bullish   RED  .145     .003
---------------------------------------------------------------------------------------------
GOOG      1032.48    6.9     1017.11       64.7%        Bullish   BLUE -.01      .04
---------------------------------------------------------------------------------------------
MSFT      84.14    .09       83.89         19.7%        ----      ---- -.081     .077
---------------------------------------------------------------------------------------------
AMZN      1111.6    17.38    1110.85       48.3%        Bullish   BLUE .149      .087
---------------------------------------------------------------------------------------------
FB        178.92    0       W179.87        28.9%        Bearish  RED .119     -.014
--------------------------------------------------------------------------------------------
NVDA     208.69    2.75      203.84        166.5%       Bullish   BLUE .298      .183
---------------------------------------------------------------------------------------------
BA        261.75   -.88      259.25        102.1%       Bullish   RED .169      .016
---------------------------------------------------------------------------------------------
GS        244.4   -2.48      240.89        55.3%        Bearish   RED-.034      .016
|
Table 2
COMPARISONS OF BULLISH AND BEARISH NUMBERS
Professionals and day-traders are more bearish than bullish in
broader market,
but excess of new highs over new lows shows that momentum-players
are still
3 times more bullish than bearish. A ratio of 3 longs to one
short might seem
appropriate for a hedged portfolio.
11/3
11/2 11/1 10/31
10/30 10/27 10/26 10/25 10/24 10/23 10/20
10/19 10/18 10/17 10/16
NEWHIGHS 360
334 272
392 190 480
309 153 376
200 533 300
381 238 423
NEWLOWS 112 114 70 170
84 83
74 103 73
56 41 41
32 32 53
--------------------------------------------------------------------------------------------------------------------------
MAXCPs 140 113 64 158
97
184 120 86 117 125
258 251 154 125
137
MINCPs 180 214 101 120 139 162 229 209 179 157
106 98 101
89 105
--------------------------------------------------------------------------------------------------------------------------
TTTNHs
71 69 43
76 72 76 59 42 70 53 78 89 88 65 63
TTTNLs
311
313
299 195
151
224 340 389 216 245 81 122 153 117 138
--------------------------------------------------------------------------------------------------------------------------
FASTUP
190 196 178 150 112 95 86 73 92 86
82 63 68 65
FASTDOWN 214
208 185 202
200 115 222 185 155 158 129 148 174 166
|
Table 3 Percent
of Stocks in Various Directories Making New HighsDate = 171103
No.in Sector NHs Pct.
-------------------------------------------------------------------
NIFTY 30 10 33 %
EDU 7 2 29 %
DJI-13 13 3 23 %
DOWJONES 30 7 23 %
SOLAR 21 4 19 %
GAMING 28 5 18 %
INDEXES 211 38 18 %
SEMI 130 21 16 %
NASD-100 88 14 16 %
SP-100 96 14 15 %
SOFTWARE 66 10 15 %
===================================================================
UTILITY 43 6 14 %
GREEN 31 4 13 %
ELECTRON 179 23 13 %
INSURANC 32 4 13 %
COMPUTER 23 3 13 %
SP500 486 51 10 %
RUS-1000 842 88 10 %
FINANCE 92 8 9 %
ETFS 65 6 9 %
MORNSTAR 238 22 9 %
INFRA 11 1 9 %
AUTO 39 3 8 %
CHEM 65 5 8 %
HACKERS 25 2 8 %
INDMATER 92 6 7 %
BIOTECH 388 29 7 %
COMODITY 70 5 7 %
RETAIL 54 3 6 %
MILITARY 38 2 5 %
CHINA 64 3 5 %
REIT 179 9 5 %
BEVERAGE 20 1 5 %
OILGAS 144 6 4 %
REGBANKS 33 1 3 %
--------------------------------------------------------
None: BIGBANKS BIGMIL HOMEBLDG TRANSP COAL GOAL GOLD
EDU PIPELINE FOOD BONDFUND HOSPITAL JETS
|
 |
 RANKING OF KEY DIRECTORIES BASED PCT.OF STOCKS ABOVE 65-DMA
               11/3/17
Bullish = 38
Bearish = 7
---------------------------------------------------------------------------------------
Directory     Current       day-1         day-2         day-3         day-4         day-5
----------------------------------------------------------------------------------------
BIGBANKS       100%          1             1             1             1             1
DJI-13         .923          .923          .923          .923          .923          .923
REGBANKS       .878          .909          .878          .909          .909          .939
BIGMIL         .833          .833          .5            .666          .833          .833
DOWJONES       .833          .833          .8            .833          .833          .866
NIFTY          .833          .9            .866          .9            .866          .866
HOMEBLDG       .823          .764          .882          .882          .823          .882
INFRA          .818          .818          .818          .909          .818          .909
MILITARY       .815          .815          .763          .763          .763          .815
SOLAR          .809          .809          .809          .809          .761          .761
FINANCE        .804          .836          .793          .804          .826          .836
SEMI           .776          .784          .753          .776          .753          .753
ETFS           .769          .784          .784          .753          .707          .738
CHEM           .753          .784          .753          .753          .753          .846
COAL           .75           .75           .75           .875          .875          .875
ELECTRON       .743          .754          .743          .759          .737          .765
SP-100         .739          .739          .729          .729          .739          .75
UTILITY        .72           .697          .627          .72           .744          .72
AUTO           .717          .769          .794          .769          .717          .871
EDU            .714          .714          .714          .714          .714          .571
GREEN          .709          .741          .741          .774          .838          .87
OILGAS         .701          .687          .701          .666          .625          .576
SOFTWARE       .696          .681          .757          .833          .803          .818
INSURANC       .687          .718          .718          .781          .812          .781
INDMATER       .673          .706          .695          .695          .717          .728
NASD-100       .67           .659          .704          .681          .681          .693
SP500          .658          .67           .672          .679          .681          .703
CHINA          .656          .64           .718          .64           .593          .656
MORNSTAR       .651          .659          .663          .668          .63           .668
INDEXES        .649          .654          .668          .668          .677          .658
RUS-1000       .649          .647          .65           .659          .662          .685
HACKERS        .6            .6            .64           .8            .8            .68
TRANSP         .6            .7            .65           .6            .65           .7
COMPUTER       .565          .565          .695          .695          .565          .608
BIOTECH        .538          .487          .502          .515          .507          .528
GAMING         .535          .571          .642          .642          .607          .607
FOOD           .533          .533          .533          .6            .533          .533
COMODITY       .528          .542          .542          .528          .542          .528
Bullish = 38
=============================================================================================
BEVERAGE       .5            .5            .45           .55           .5            .45
=============================================================================================
REIT           .413          .446          .402          .34           .34           .407
RETAIL         .388          .444          .37           .407          .425          .5
JETS           .333          .333          .444          .222          .333          .222
GOLD           .22           .24           .22           .16           .2            .16
BONDFUND       .08           .071          .044          .089          .071          .044
HOSPITAL       0             .25           .25           .25           .25           .25
PIPELINE       0             0             .142          0             0             0
Bearish = 8
|
=================================================================================
=================================================================================
11/2/2017 The
operative Peerless Signals remains the very
Bullish Buy B21.
The DJI
rose 80+ but there were more down than up on the NYSE. This is what
starts
to happen in an aging bull market. Aggressive fund managers see the
best
performing DJI-blue chips as the most obvious and easily rationalized place
to park new funds. And sure enough, the six highest priced DJI-30
stocks all
rose by more than a point today. The big winner was Boeing, the
highest priced
component. It rose more than 4. Blue chip investors are
very excited at the
likelihood that they will soon be getting a $1 trillion tax break and
now
be able to freely repatriate years of profits that they had sheltered
overseas.
Not surprisingly, the blue chip-DJI seems about to break into new all-time
high
ground even though we can see from the market's own statistics that there is
not
enough aggressive bullish funding yet for the NASDAQ and the SP-500 to come
along for the ride. The SP-500 advanced less than an 1/2 a point today
and the
NASDAQ actually fell.
Discussion of the proposed tax-holiday for repatriated corporate profits has
deliberately
been very muted. As this is very important, let's see what develops.
See
http://www.businessinsider.com/trump-tax-corporate-holiday-repatriation-rate-economy-2017-10
For the NASDAQ to participate more, at the very least, AAPL will need to
break out above its resistance. More importantly, NYSE Down volume,
which
was showed 105 million more shares than Up Volume today, will need to stop
rising and
turn down. Otherwise, the P-Indicator may turn negative and, in
this, match the
V-I. This combination could bring a Peerless Sell at the 2.4% upper
band if the
DJI rallies in isolation despite the very Bullish Buy B21.
Watch BA, AAPL and DIA. See their Candle-Stick charts below.
Semi-conductors
remain the hottest industry group. DIA, FAS, SOXL, TECL, OIL, UGA and
BA
are now showing Bullish Blue-Across-the-Board strength in Table 1.
As a hedge,
hold short some of the Bearish
MINCPs, but keep your long focus on the strongest
groups and stocks.
Charts 11/2/2017
PEERLESS
DJI, Signals, Indicators Daily
DJI Volume 10-DayUp/Down Vol
Hourly DJIA
A/D Line for All
Stocks
NASDAQ
S&P
OEX
NYSE
COMPQX
DJI-15 DJI-20
DJI-30
DIA
SPY
QQQ
MDY
IWM TNA
CrudeOil
FAS
GLD
BBH
IBB
JETS
JNUG
KOL
NUGT
OIH
OIL
RSX
RETL
SDS
SLV
SOXL
TECL
TMF
TNA UGA
(gasoline)
XIV YINN
Commodities:
JJC, NIB,
CHOC
CORN,
WEAT
UUP
(Dollar)
AAPL ADBE
ALXN AMAT
AMGN AMD
AMZN
BA BABA BAC
BIDU
CAT
CVX
FB
GOOG
GS
HD
IBM
JPM M
(Macy's)
MSFT
NFLX
NVDA
QCOM
TSLA TXN
XOM
ANDV (refinery, CMG (Chipotle),
LRCX, SWKS, TOWN
11/2/2017
Bullish MAXCPs Bearish MINCPs
 |
Strongest Sector - SOXL
 |
Low Accumulation and Falling Closing Power stocks make the best
short sales.
For the last 4 months, consistently the stock that has looked very
bearish is TEVA.
 |
Dean Foods
 |
 |
Expect more from BA. That will boost the DJI further.
 |
| |
Table 1
Tiger's QUICKSILVER and MAJOR ETFS and KEY
STOCKS:
11/2/2017
QuickSilver Documentation This is for short-term trading leveraged ETFs.
It also provides a useful short-term outlook of these sectors ETF's and the
sectors they
represent.
Blue is Bullish and Red is Bearish.
1 Candle-Stick color is shortest-term. This changes when close vis-a-vis opng changes.
So, in stocks or ETFs that
have advanced a long ways, traders should sell when a higher
opening
gives way to a decline that brings a drop below the previous day's close.
2 5-dma AROC and Close-versus- pivot point is next most short-term.
W = warning. Close is below PIVOT-Point
3 Closing Power trend-direction vs. its 21-dma is next most short-term.
4 IP21 is used to spot divergences
an to estimate underlying support.
5
> IP21 falling and below +.15 and its 21-dma is bearish in an
over-extended ETF, especially
when its Closing Power is falling and is below its 21-dma.
> IP21 below 07 with AROC below .07 is less likely to bring a rally back up from
21-dma.
6 Note price trend-lines, support/resistance and price patterns on charts.
QUICKSILVER on ETFS - 11/02/17
ETF      CLOSE   CHANGE     PIVOT-PT      5-dma AROC   CL-PWR   CANDLE  IP21   ITRS
---------------------------------------------------------------------------------------------
DIA       234.96    .77      234.17        23.7%       ----      BLUE   .217    ---
---------------------------------------------------------------------------------------------
COMPQX    6714.94   -1.59    6701.26       118.4%      Bearish   BLUE   .16   -.009
---------------------------------------------------------------------------------------------
SPY       257.59    .1       257.71        38.3%       ----      BLUE   .236  -.025
---------------------------------------------------------------------------------------------
QQQ       151.81   -.29      151.24        160.8%      Bullish   RED    .268  -.014
---------------------------------------------------------------------------------------------
MDY       333.02    .28     W334.25        7.8%        ----      BLUE   .132  -.006
---------------------------------------------------------------------------------------------
IWM       148.71    .44     W149.79       -1.7%        Bearish   BLUE  -.076   .015
---------------------------------------------------------------------------------------------
FAS       61.89    1.29      61.02         84.1%       Bullish   BLUE   .144   .144
---------------------------------------------------------------------------------------------
RETL      25.42    .87       25.66        -293.7%      Bearish   BLUE  -.08    .046
---------------------------------------------------------------------------------------------
SOXL      148.52    1.94     143.36        468.2%      Bullish   BLUE   .399   .525
---------------------------------------------------------------------------------------------
TECL      107.86    .23      105.36        485.9%      Bullish   BLUE   .238   .213
---------------------------------------------------------------------------------------------
IBB       312.06   -.13     W316.12       -30.5%       Bearish   RED   -.209  -.069
---------------------------------------------------------------------------------------------
GLD       122.6    .58       119.46        142.2%      Bullish   BLUE   .092  -.014
---------------------------------------------------------------------------------------------
OIL       5.8    .08         5.69          264.5%      Bullish   BLUE   .314   .075
---------------------------------------------------------------------------------------------
OIH       24.51    .03       23.67         239.9%      Bearish   RED   -.037   .032
---------------------------------------------------------------------------------------------
GASL      23.2   -1          21.3          877%        ----      RED   .054    .343
---------------------------------------------------------------------------------------------
UGA       32.12    .74       30.93         242.1%      Bullish   BLUE  .467    .133
---------------------------------------------------------------------------------------------
UUP       24.63    0        W24.68         2%          Bearish   ---- -.018   -.058
---------------------------------------------------------------------------------------------
IEF       106.2    .14       105.85        32.6%       Bullish   ----  .012   -.093
---------------------------------------------------------------------------------------------
CORN      17.4    .11        17.34        -2.9%        Bullish   BLUE -.104   -.09
---------------------------------------------------------------------------------------------
WEAT      6.29    .11       W6.3          -55.9%       Bullish   BLUE -.083   -.098
---------------------------------------------------------------------------------------------
YINN      33.73    .47      W33.85         240.5%      ----      BLUE  .154    .125
---------------------------------------------------------------------------------------------
RSX       21.99    0        ?21.99         47.9%       Bearish   BLUE -.135   -.005
---------------------------------------------------------------------------------------------
AAPL      168.11    1.22     163.05        325%        Bullish   BLUE  .206   -.027
---------------------------------------------------------------------------------------------
GOOG      1025.58    .08     1019.27       262.4%      Bullish   BLUE -.009    .028
--------------------------------------------------------------------------------------------
MSFT      84.05    .87       83.81         320.4%      ----      BLUE -.057    .078
---------------------------------------------------------------------------------------------
AMZN      1094.22   -9.46   W1100.95       564.6%      Bullish   RED   .143    .064
---------------------------------------------------------------------------------------------
FB        178.92   -3.74     177.88        232.6%      Bearish   RED   .138   -.018
---------------------------------------------------------------------------------------------
NVDA     205.94   -1.26      201.86        252.4%      Bullish   RED   .263    .164
---------------------------------------------------------------------------------------------
BA        262.63    4.13     256.46        65%         Bullish   BLUE  .227    .025
---------------------------------------------------------------------------------------------
GS        246.88    2.62     241.71        106.5%      Bullish   BLUE  .029    .03
|
Table 2
COMPARISONS OF BULLISH AND BEARISH
NUMBERS
11/2
11/1 10/31 10/30 10/27 10/26 10/25
10/24 10/23 10/20 10/19 10/18 10/17 10/16 10/17
NEWHIGHS 334
272 392 190
480 309 153
376 200 533
300 381 238
423 430
NEWLOWS 114 70 170
84 83
74 103 73
56 41 41
32 32 53
50
--------------------------------------------------------------------------------------------------------------------------
MAXCPs 113 64 158
97
184 120 86 117 125
258 251 154 125
137 168
MINCPs 214 101 120 139 162 229 209 179 157
106 98 101
89 105 78
--------------------------------------------------------------------------------------------------------------------------
TTTNHs
69 43
76 72 76 59 42 70 53 78 89 88 65 63 76
TTTNLs
313
299 195
151
224 340 389 216 245 81 122 153 117 138 108
--------------------------------------------------------------------------------------------------------------------------
FASTUP
196 178 150 112 95 86 73 92 86
82 63 68 65
FASTDOWN
208 185 202
200 115 222 185 155 158 129 148 174 166
|
Table 3
Count of Stocks and New Highs in Key Tiger Directories
Date = 171102
               No.          NHs            NHs' Pct.
-------------------------------------------------------------------
BIGBANKS       7             2             29 %
ETFS           65            16            25 %
DOWJONES       30            6             20 %
NIFTY          30            6             20 %
GREEN          31            6             19 %
SOLAR          21            4             19 %
GAMING         28            5             18 %
SOFTWARE       66            11            17 %
MILITARY       38            6             16 %
HACKERS        25            4             16 %
INSURANC       32            5             16 %
UTILITY        43            7             16 %
AUTO           39            6             15 %
DJI-13         13            2             15 %
==================================================
SP-100         96            13            14 %
INDEXES        211           26            12 %
ELECTRON       179           18            10 %
SP500          486           50            10 %
RUS-1000       842           85            10 %
MORNSTAR       238           22            9 %
SEMI           130           12            9 %
INFRA          11            1             9 %
NASD-100       88            8             9 %
CHINA          64            6             9 %
COMPUTER       23            2             9 %
INDMATER       92            6             7 %
REGBANKS       33            2             6 %
OILGAS         144           9             6 %
REIT           178           10            6 %
COMODITY       70            4             6 %
CHEM           65            3             5 %
FINANCE        92            5             5 %
BEVERAGE       20            1             5 %
BIOTECH        388           17            4 %
RETAIL         54            1             2 %
---------------------------------------------------
None: BIGMIL HOMEBLDG  TRANSP  COAL  GOAL  GOLD
EDU  PIPELINE  FOOD BONDFUND HOSPITAL  JETS
|
 |
 Table 4
RANKING OF KEY DIRECTORIES BASED PCT.OF STOCKS ABOVE 65-DMA
              11/2/17
Bullish = 37   (10 + 17 + 10)
Bearish = 8
---------------------------------------------------------------------------------------
Directory     Current       day-1         day-2         day-3         day-4         day-5
----------------------------------------------------------------------------------------
BIGBANKS       1             1             1             1             1             1
DJI-13         .923          .923          .923          .923          .923          .846
REGBANKS       .909          .878          .909          .909          .939          .939
NIFTY          .9            .866          .9            .866          .866          .666
FINANCE        .836          .793          .804          .826          .836          .826
BIGMIL         .833          .5            .666          .833          .833          .833
DOWJONES       .833          .8            .833          .833          .866          .833
INFRA          .818          .818          .909          .818          .909          .909
MILITARY       .815          .763          .763          .763          .815          .815
SOLAR          .809          .809          .809          .761          .761          .666
N=10
--------------------------------------------------------------------------------------------
CHEM           .784          .753          .753          .753          .846          .861
ETFS           .784          .784          .753          .707          .753          .676
SEMI           .784          .753          .776          .753          .753          .73
AUTO           .769          .794          .769          .717          .846          .871
HOMEBLDG       .764          .882          .882          .823          .882          .882
ELECTRON       .754          .743          .759          .737          .765          .731
COAL           .75           .75           .875          .875          .875          .875
GREEN          .741          .741          .774          .838          .87           .774
SP-100         .739          .729          .729          .739          .75           .729
INSURANC       .718          .718          .781          .812          .781          .781
EDU            .714          .714          .714          .714          .571          .571
INDMATER       .706          .695          .695          .717          .728          .739
TRANSP         .7            .65           .6            .65           .7            .7
UTILITY        .697          .627          .72           .744          .72           .604
OILGAS         .687          .701          .666          .625          .583          .513
SOFTWARE       .681          .757          .833          .803          .803          .833
SP500          .67           .672          .679          .681          .701          .681
N=17
---------------------------------------------------------------------------------------------
MORNSTAR       .659          .663          .668          .63           .651          .68
NASD-100       .659          .704          .681          .681          .693          .647
INDEXES        .654          .668          .668          .677          .658          .687
RUS-1000       .647          .65           .659          .662          .682          .663
CHINA          .64           .718          .64           .593          .656          .578
HACKERS        .6            .64           .8            .8            .68           .64
GAMING         .571          .642          .642          .607          .607          .571
COMPUTER       .565          .695          .695          .565          .608          .521
COMODITY       .542          .542          .528          .542          .542          .514
FOOD           .533          .533          .6            .533          .533          .466
N=10
---------------------------------------------------------------------------------------------
BEVERAGE       .5            .45           .55           .5            .45           .5
---------------------------------------------------------------------------------------------
BIOTECH        .487          .502          .515          .507          .523          .474
RETAIL         .444          .37           .407          .425          .5            .518
REIT           .443          .398          .337          .337          .404          .308
JETS           .333          .444          .222          .333          .222          .222
HOSPITAL       .25           .25           .25           .25           .25           .25
GOLD           .24           .22           .16           .2            .16           .14
BONDFUND       .071          .044          .089          .071          .044          .026
PIPELINE       0             .142          0             0             0             0
N=8
|
=================================================================================
=================================================================================
11/1/2017 The
operative Peerless Signals remains the very
Bullish Buy B21.
The DJI will likely stay in its narrow trading range a little longer.
In 6 of the earlier September B21s, the DJI retreated back as low as its
21-day ma in November. In the other two cases, it had to go back to
its rising 65-dma. The bigger thing here is that the DJI averaged a
gain of +17.3% before it was reversed by a Peerless Sell.
Professionals took profits today and appear to be waiting for a pullback to
come back
into the market. Another trading approach for us is to stay long the
ETFs with rising Closing
Powers and 5-day moving averages while selling short some of the
bearish
MINCP stocks.
November is usually a much kinder month than September
and October for
the market. Since 1965, we have seen the DJI move mostly positively,
if un-dramatically
in the weeks and month or two after November 1st.
DJI's Behavior after November 1st since 1965
Avg Gain Pct of time, DJI
advances.
Over Next Week
+0.7%
61%
Over Next Two Weeks +0.3%
53%
Over Next Month
+0.8%
61%
Over Next Two Months +1.0%
59%
I suggested traders watch AAPL
to see if it could breakout today and help launch a
bigger advance. Instead, it quickly reversed and that seems to have
been a signal
for traders to take some profits. In addition, the Fed all but promised a
rate hike
in December. This was already expected and several home-builders made
more
new highs. See them in the
BULLISH MAXCPs
tonight. The big news is the tax-cut.
The Republican Congressional leaders delayed setting forth their plan today
and
that gave a reason for some to wait for the details before applauding by
buying more
stocks.
The
Hourly DJI
was stopped early-on at its recent high near
23500-23510. It then lost
most of its early gain today. The NASDAQ fell more. The weak
close is important
short-term. It produced numerous red-Candle-Sticks in the major market
ETFs and
caused the Closing Power for DIA, IWM, MDY and QQQ to drop below their
21-day ma. This should delay our buying here until their CPs rise back
above their
21-dma. Where the IP21 for each of these ETFs is below +.15, a deeper
retreat
would seem in order. See the their Candle-Stick charts just below.
SOXL's IP21
remains quite high, so I would not expect it to be very weak. See more
details in
Table 1 as well as in the comments on the charts below.

 |
 |
 |
 |
 |
 |
|
Table 1
Tiger's QUICKSILVER and MAJOR ETFS and KEY
STOCKS:
11/1/2017
QuickSilver Documentation This is for short-term trading leveraged ETFs.
It also provides a useful short-term outlook of these sectors ETF's and the
sectors they
represent.
Blue is Bullish and Red is Bearish.
1 Candle-Stick color is shortest-term. This changes when close vis-a-vis opng changes.
So, in stocks or ETFs that
have advanced a long ways, traders should sell when a higher
opening
gives way to a decline that brings a drop below the previous day's close.
2 5-dma AROC and Close-versus- pivot point is next most short-term.
W = warning. Close is below PIVOT-Point
3 Closing Power trend-direction vs. its 21-dma is next most short-term.
4 IP21 is used to spot divergences
an to estimate underlying support.
5
> IP21 falling and below +.15 and its 21-dma is bearish in an
over-extended ETF, especially
when its Closing Power is falling and is below its 21-dma.
> IP21 below 07 with AROC below .07 is less likely to bring a rally back up from
21-dma.
6 Note price trend-lines, support/resistance and price patterns on charts.
QUICKSILVER on ETFS - 11/01/17
ETF      CLOSE   CHANGE     PIVOT-PT      5-dma AROC   CL-PWR   CANDLE   IP21   ITRS
---------------------------------------------------------------------------------------------
DIA       234.19    .56      233.85        22%          ----      RED    .177    ---
---------------------------------------------------------------------------------------------
COMPQX    6716.53   -11.14   6556.77       114.8%       ----      RED    .153    -.004
---------------------------------------------------------------------------------------------
SPY       257.49    .34      255.62        42.9%        ----      RED    .216    -.022
---------------------------------------------------------------------------------------------
QQQ       152.1   -.05       146.96        155.8%       Bullish   RED    .244    -.009
---------------------------------------------------------------------------------------------
MDY       332.74   -.88      332.5         25.1%        ----      RED    .147    -.002
---------------------------------------------------------------------------------------------
IWM       148.27   -.99     W148.76       -6%           Bearish   RED   -.109     .017
---------------------------------------------------------------------------------------------
FAS       60.6    .25       W60.87         31.4%        Bearish   RED    .097     .126
---------------------------------------------------------------------------------------------
RETL      24.55    .05      W26.9         -409.8%       Bearish   RED   -.107     .008
---------------------------------------------------------------------------------------------
SOXL      146.58   -1.38     135.08        493%         Bullish   RED    .41      .533
---------------------------------------------------------------------------------------------
TECL      107.63   -.1       97.66         531.7%       Bullish   RED    .206     .212
---------------------------------------------------------------------------------------------
IBB       312.19   -1.99    W313.98       -146.3%       Bearish   RED   -.15     -.065
---------------------------------------------------------------------------------------------
GLD       122.6    .58       119.46        142.2%       Bullish  BLUE   .092    -.007
---------------------------------------------------------------------------------------------
OIL       5.72   -.02        5.5           258.3%       Bullish   RED    .244     .082
---------------------------------------------------------------------------------------------
OIH       24.48    .24       23.36         238%         Bearish   RED   -.035     .046
---------------------------------------------------------------------------------------------
GASL      24.2    1.63       19.37         1225%        ----      BLUE   .05      .459
---------------------------------------------------------------------------------------------
UGA       31.38    .24       30.62         165.7%       Bullish   RED    .449     .129
---------------------------------------------------------------------------------------------
UUP       24.63    .05      ?24.62         55%          Bearish   ----  -.049    -.055
---------------------------------------------------------------------------------------------
IEF       106.06   -.1       105.51        19.4%        Bullish   BLUE   .022    -.084
---------------------------------------------------------------------------------------------
CORN      17.29    .08      W17.41        -49%          Bearish   ----  -.108    -.098
---------------------------------------------------------------------------------------------
WEAT      6.18   -.02       W6.36         -182.3%       Bearish   ----  -.126    -.108
---------------------------------------------------------------------------------------------
YINN      33.26    .63       32.15         154.7%       ----      RED    .118     .134
---------------------------------------------------------------------------------------------
RSX       21.99    .2        21.78         52.6%        Bearish   RED   -.191     .012
---------------------------------------------------------------------------------------------
AAPL      166.89   -2.15     157.41        322.4%       Bullish   RED    .172    -.026
---------------------------------------------------------------------------------------------
GOOG      1025.5    8.86     972.56        260.9%       Bullish   BLUE  -.056     .038
---------------------------------------------------------------------------------------------
MSFT      83.18    0         78.76         278.6%       ----      RED    -.051    .066
---------------------------------------------------------------------------------------------
AMZN      1103.68   -1.6     972.43        621.2%       Bullish   RED    .167     .071
---------------------------------------------------------------------------------------------
FB        182.66    2.6      170.63        343%         Bearish   BLUE   .142     .006
---------------------------------------------------------------------------------------------
NVDA     207.2    .39        195.69        337.9%       Bullish   RED    .278     .204
---------------------------------------------------------------------------------------------
BA        258.5    .52      W259.27        1.5%         Bullish   BLUE   .201     .007
---------------------------------------------------------------------------------------------
GS        244.26    1.78     241.72        52.8%        Bearish   RED   -.024     .022
|
Table 2
COMPARISONS OF BULLISH
AND BEARISH NUMBERS
11/1
10/31 10/30 10/27 10/26 10/25 10/24
10/23 10/20 10/19 10/18 10/17 10/16 10/13 10/12
NEWHIGHS 272
392 190 480
309 153 376
200 533 300
381 238 423
430 402
NEWLOWS 70 170
84 83
74 103 73
56 41 41
32 32 53
50 44
-----------------------------------------------------------------------------------------------------------------
MAXCPs
64 158
97 184 120 86 117 125
258 251 154 125
137 168 255
MINCPs 101 120 139 162 229 209 179 157
106 98 101
89 105 78
79
----------------------------------------------------------------------------------------------------------------
TTTNHs
43
76
72 76 59 42 70 53 78 89 88 65 63 76 115
TTTNLs
299 195
151
224 340 389 216 245 81 122 153 117 138 108
92
------------------------------------------------------------------------------------------------------------------
FASTUP
178 150 112 95 86 73 92 86
82 63 68 65
FASTDOWN 185 202
200 115 222 185 155 158 129 148 174 166
|
Table 3     Pct of Each Sector/Directory Making New Highs
Date = 171101
-------------------------------------------------------------------
HOMEBLDG       17            5             29 %
ETFS           65            15            23 %
SOLAR          21            4             19 %
GAMING         28            5             18 %
DOWJONES       30            5             17 %
==================================================================
CHEM           65            9             14 %
NIFTY          30            4             13 %
INSURANC       32            4             13 %
INDEXES        211           25            12 %
INDMATER       92            10            11 %
NASD-100       88            10            11 %
SEMI           130           13            10 %
ELECTRON       179           17            9 %
CHINA          64            6             9 %
AUTO           39            3             8 %
MILITARY       38            3             8 %
HACKERS        25            2             8 %
SP-100         96            7             7 %
SP500          487           34            7 %
RUS-1000       843           60            7 %
COMODITY       71            5             7 %
FOOD           15            1             7 %
GREEN          31            2             6 %
OILGAS         144           8             6 %
SOFTWARE       66            4             6 %
MORNSTAR       238           13            5 %
UTILITY        43            2             5 %
FINANCE        92            4             4 %
COMPUTER       23            1             4 %
REIT           179           6             3 %
BIOTECH        388           8             2 %
---------------------------------------------------------------
None: BIGBANKS  BIGMIL  REGBANKS DJI-13 INFRA  TRANSP COAL
GOLD EDU  RETAIL PIPELINE  BEVERAGE BONDFUND HOSPITAL JETS
|
 |
Table 4
 RANKING OF KEY DIRECTORIES BASED PCT.OF STOCKS ABOVE 65-DMA
              11/1/17
Bullish = 37
Bearish = 8
---------------------------------------------------------------------------------------
Directory     Current       day-1         day-2         day-3         day-4         day-5
----------------------------------------------------------------------------------------
BIGBANKS       100%          1             1             1             1             1
DJI-13         .923          .923          .923          .923          .923          .846
HOMEBLDG       .882          .882          .823          .882          .882          .823
REGBANKS       .878          .909          .909          .939          .939          .909
NIFTY          .866          .9            .866          .866          .733          .733
INFRA          .818          .909          .818          .909          .909          .818
SOLAR          .809          .809          .761          .761          .714          .666
DOWJONES       .8            .833          .833          .866          .866          .833
---------------------------------------------------------------------------------------------
AUTO           .794          .769          .717          .846          .897          .794
FINANCE        .793          .804          .826          .836          .826          .858
ETFS           .784          .753          .707          .753          .676          .753
MILITARY       .763          .763          .763          .815          .789          .842
SOFTWARE       .757          .833          .803          .803          .818          .818
CHEM           .753          .753          .753          .846          .846          .83
SEMI           .753          .776          .753          .753          .738          .738
COAL           .75           .875          .875          .875          .875          .875
ELECTRON       .743          .759          .737          .765          .731          .743
GREEN          .741          .774          .838          .87           .806          .741
SP-100         .729          .729          .739          .75           .75           .739
CHINA          .718          .64           .593          .656          .593          .625
INSURANC       .718          .781          .812          .781          .781          .718
EDU            .714          .714          .714          .571          .571          .571
NASD-100       .704          .681          .681          .693          .67           .67
OILGAS         .701          .666          .625          .583          .513          .5
COMPUTER       .695          .695          .565          .608          .608          .565
INDMATER       .695          .695          .717          .728          .739          .76
SP500          .671          .677          .679          .7            .687          .698
MORNSTAR       .663          .668          .63           .651          .68           .714
INDEXES        .658          .668          .677          .658          .687          .725
RUS-1000       .65           .658          .661          .682          .666          .654
TRANSP         .65           .6            .65           .7            .7            .7
GAMING         .642          .642          .607          .607          .607          .607
HACKERS        .64           .8            .8            .68           .64           .64
UTILITY        .627          .72           .744          .72           .604          .604
COMODITY       .549          .535          .549          .549          .521          .563
FOOD           .533          .6            .533          .533          .466          .533
BIOTECH        .502          .515          .507          .523          .479          .546
----------------------------------------------------------------------------------------------
BIGMIL         .5            .666          .833          .833          .833          1
----------------------------------------------------------------------------------------------
BEVERAGE       .45           .55           .5            .45           .5            .55
JETS           .444          .222          .333          .222          .222          .333
REIT           .402          .34           .34           .407          .318          .391
RETAIL         .37           .407          .425          .5            .518          .518
HOSPITAL       .25           .25           .25           .25           .25           .625
GOLD           .22           .16           .2            .16           .14           .14
PIPELINE       .142          0             0             0             0             0
BONDFUND       .044          .089          .071          .044          .026          .071
N=8
|
=================================================================================
10/31/2017 The
operative Peerless Signals remains the very
Bullish Buy B21.
It's average
gain is +17.6% at the time of the next Peerless Sell and most often that
comes
in the Spring of the next year.
SOXL remains the leader of all the bullish ETFs
right now. This is very bullish for the
market as a whole. Semi-conductors
are very sensitive to any coming down-turn. Their
bullishness should give us confidence now. Recall an
earlier study that I
did a year ago that
that showed that just about every significant market top going back to1987
also had a
bearish head/shoulders pattern develop in Texas Instruments (TXN). So,
in the same spirit,
while it's true that 3x leveraged SOXL is quite volatile, its surely
important for us now to note
that its important past price tops have always required its IP21 (current
Accumulation Index)
to drop below its 21-day ma and then for a head/shoulders top pattern to
develop in it.
Compare the very positive internal strength of SOXL now and then with the
way it topped
out in in 2010 (see below) as well as all its other past tops since its
creation in 2010:
2012, 2014,
2016 and earlier
in 2017.
SOXL's top back in 2010 was highlighted
by many signs of technical weakness.
Watch
AAPL
tomorrow. It is on the verge of
breaking above its last remaining
resistance-line.
A further advance could send it to 200. Such a move would be very
positive for
tech stocks, especially semi-conductors. And because it is such a big
part
of then,
a breakout by
it could send the DJI and
QQQ soaring, not to mention all the
other ETFs
that it is
a big part of.
There are still many MINCPs. So Professionals are still hedging.
But it is very bullish
that there are no so many across-the-board Bullish ETFs, as shown in our
QuickSilver
Table 2 below: NASDAQ,
QQQ, MDY,
SOXL, TECL,
UGA, YINN and
also NVDA.
Charts 10/312017
PEERLESS
DJI, Signals, Indicators Daily
DJI Split Volume 10-DayUp/Down Vol
Hourly DJIA A/D Line for All
Stocks High Priced DJI
Stocks Chart
DJIA
S&P
OEX
NYSE
NASDAQ COMPQX(Nasdaq)
DIA
SPY
QQQ
MDY
IWM TNA
Short Term Interest Rates
DJI-Utilities
DJI-Transp
CrudeOil
FAS
GLD
BBH
IBB
JETS
JNUG
KOL
NUGT
OIH
OIL
RSX
RETL
SDS
SLV
SOXL
TECL
TMF
TNA UGA
(gasoline)
XIV YINN
Commodities:
COW JJC, NIB,
CHOC
CORN,
WEAT UUP
(Dollar)
AAPL ADBE
ALXN AMAT
AMGN AMD
AMZN BA
BABA
BIDU
CAT CVX
FB
GOOG
GS
HD
IBM JPM M
(Macy's) MASI
MSFT
NVDA QCOM
TSLA TXN
XOM
ANDV (refinery,
CMG (Chipotle),
LRCX, SWKS,
TOWN
Others REN, CVE
and SWN
10/31/2017
Bullish MAXCPs
Bearish MINCPs link corrected |
Table 1
Tiger's QUICKSILVER and MAJOR ETFS and KEY
STOCKS:
10/31/2017
A high number of ETFS show bullish
across-the-board Blue internals:
COMPQX
(Nasdaq), QQQ, MDY, SOXL, TECL, UGA, Yinn (and NVDA)
QuickSilver
Documentation
This is for short-term trading
of leveraged ETFs. It also provides a useful short-term
outlook of these sectors ETF's and the sectors they
represent.
Blue is Bullish
and Red is Bearish.
1 Candle-Stick color is shortest-term. This changes when
close vis-a-vis opng changes.
So, in
stocks or ETFs that advances a long ways, traders should sell when a
higher
opening
gives way to a decline that bring a drop below the previous day's
close.
2 5-dma AROC and Close versus pivot point is next most
short-term.
W = warning.
Close is below PIVOT-Point
3 Closing Power trend-direction vs. its 21-dma is next most
short-term.
4 IP21 is used to spot divergences and to estimate
underlying support.
5 IP21 falling and below +.15 and its 21-dma is bearish.
IP21 below
.07 with AROC below .07 is less likely to bring a rally back up from
21-dma.
6 Note price trend-lines, support/resistance and price
patterns on charts.
QUICKSILVER on ETFS and BIG STOCKS - 10/31/17
ETF      CLOSE   CHANGE     PIVOT-PT   5-dma AROC  CL-PWR   CANDLE  IP21   ITRS
---------------------------------------------------------------------------------------------
DIA       233.63    .3       233.16    -14.1%      ----     ----   .241     ----
---------------------------------------------------------------------------------------------
COMPQX    6727.67    28.71   6563.89    97.6%      Bullish   BLUE  .193     .005
---------------------------------------------------------------------------------------------
SPY       257.15    .4       255.29     11.5%      ----      RED   .279    -.019
---------------------------------------------------------------------------------------------
QQQ       152.15    .57      147.43    139.6%      Bullish   BLUE  .271     .001
---------------------------------------------------------------------------------------------
MDY       333.62    1.77     331.07      7.5%      Bullish   BLUE  .212     .004
---------------------------------------------------------------------------------------------
IWM       149.26    1.05     148.45      3%        Bearish   BLUE -.012     .029
---------------------------------------------------------------------------------------------
FAS       60.35   -.12       60.22     -36.3%      Bearish   RED   .166     .141
---------------------------------------------------------------------------------------------
RETL      24.5    .11       W26.65    -516.1%      Bearish   BLUE -.097     .042
---------------------------------------------------------------------------------------------
SOXL      147.96    3.25     132.7     355.6%      Bullish   BLUE  .442     .618
---------------------------------------------------------------------------------------------
TECL      107.73    1.26     96.7      481.4%      Bullish   BLUE  .245     .26
---------------------------------------------------------------------------------------------
IBB       314.18   -2.48    W321.45   -172.4%      Bearish   RED  -.094    -.047
---------------------------------------------------------------------------------------------
GLD       122.6    .58       119.46    142.2%      Bullish   BLUE  .092    -.014
---------------------------------------------------------------------------------------------
OIL       5.74    .03         5.43      251.9%     Bullish   ----  .267     .086
---------------------------------------------------------------------------------------------
OIH       24.24    .17       23.35     178.2%      Bearish   BLUE  .005     .036
---------------------------------------------------------------------------------------------
GASL      22.57    .83       19.1      660.7%      ----      BLUE -.001     .39
---------------------------------------------------------------------------------------------
UGA       31.14    .31       30.36     161.9%      Bullish   BLUE  .493     .123
---------------------------------------------------------------------------------------------
UUP       24.58    .02       24.36      32.6%      Bearish   ---- -.06    -.06
---------------------------------------------------------------------------------------------
IEF       106.16   -.07      105.65     16.1%      Bullish   RED   .065    -.092
---------------------------------------------------------------------------------------------
CORN      17.21   -.14      W17.46     -89%        Bearish   RED  -.134    -.115
---------------------------------------------------------------------------------------------
WEAT      6.2   -.07        W6.41     -188.8%      Bearish   ---- -.141    -.126
---------------------------------------------------------------------------------------------
YINN      32.63    .29       32.25      83%        Bullish   BLUE  .218     .159
---------------------------------------------------------------------------------------------
RSX       21.79   -.26       21.76     -59.3%      Bearish   RED  -.105     .002
---------------------------------------------------------------------------------------------
AAPL      169.04    2.32     156.41    372.8%      Bullish   BLUE  .205    -.003
---------------------------------------------------------------------------------------------
GOOG      1016.64   -.47     973.33    232.7%      Bullish   BLUE -.045     .043
---------------------------------------------------------------------------------------------
MSFT      83.18   -.71        78.63     267.4%     ----      RED  -.058     .075
---------------------------------------------------------------------------------------------
AMZN      1105.28   -5.57    972.91    630.1%      Bullish   RED   .163     .082
---------------------------------------------------------------------------------------------
FB        180.06    .19      170.6     237.1%      ----      RED   .061    -.005
---------------------------------------------------------------------------------------------
NVDA     206.81    2.97      193.66    204.5%      Bullish   BLUE .289     .222
---------------------------------------------------------------------------------------------
BA        257.98   -1.27    W258.42   -154.3%      ----      RED  .154     .017
---------------------------------------------------------------------------------------------
GS        242.48    1.59     241.71    -48.7%      Bearish   BLUE .006     .02
|
Table 2
COMPARISONS OF BULLISH AND BEARISH NUMBERS
10/31 10/30
10/27 10/26 10/25 10/24 10/23 10/20 10/19 10/18
10/17 10/16 10/13 10/12 10/11
NEWHIGHS 392 190 480
309 153 376
200 533 300
381 238 423
430 402 487
NEWLOWS 170 84
83 74
103 73
56 41 41
32 32 53
50 44
44
-----------------------------------------------------------------------------------------------------------------
MAXCPs 158
97 184 120 86 117 125
258 251 154 125
137 168 255
239
MINCPs 120 139 162 229 209 179 157
106 98 101
89 105 78
79 73
----------------------------------------------------------------------------------------------------------------
TTTNHs 76
72 76 59 42 70 53 78 89 88 65 63 76 115 102
TTTNLs 195
151
224 340 389 216 245 81 122 153 117 138 108
92 92
------------------------------------------------------------------------------------------------------------------
FASTUP
150 112 95 86 73 92 86
82 63 68 65
FASTDOWN
202 200 115 222 185 155 158 129 148 174 166
|
Table 3 New Highs Pct by Sector-Folder 10/31/2017
No. NHs Pct NHs
-------------------------------------------------------------------
HOMEBLDG 17 6 35 %
NIFTY 30 9 30 %
SEMI 130 38 29 %
GAMING 28 7 25 %
ELECTRON 179 44 25 %
ETFS 65 13 20 %
INSURANC 32 5 16 %
DJI-13 13 2 15 %
BEVERAGE 20 3 15 %
=======================================================
CHEM 65 9 14 %
INDEXES 211 30 14 %
GREEN 31 4 13 %
INDMATER 92 12 13 %
NASD-100 88 11 13 %
COMPUTER 23 3 13 %
MORNSTAR 238 26 11 %
SOFTWARE 66 7 11 %
JETS 9 1 11 %
DOWJONES 30 3 10 %
RUS-1000 843 82 10 %
SP500 487 44 9 %
CHINA 64 6 9 %
UTILITY 43 4 9 %
HACKERS 25 2 8 %
FOOD 15 1 7 %
BIOTECH 388 24 6 %
COMODITY 71 4 6 %
AUTO 39 2 5 %
MILITARY 38 2 5 %
TRANSP 20 1 5 %
SOLAR 21 1 5 %
FINANCE 92 4 4 %
SP-100 96 4 4 %
OILGAS 144 4 3 %
GOLD 50 1 2 %
REIT 179 3 2 %
========================================================
None: BIGBANKS BIGMIL REGBANKS INFRA COAL
EDU RETAIL PIPELINE BONDFUND HOSPITAL
|
 |
 Table 4

RANKING OF KEY DIRECTORIES BASED PCT.OF STOCKS ABOVE 65-DMA
             10/31/17
Bullish = 40
Bearish = 7
---------------------------------------------------------------------------------------
Directory     Current       day-1         day-2         day-3         day-4         day-5
----------------------------------------------------------------------------------------
BIGBANKS       100%          1             1             1             1             1
DJI-13         .923          .923          .923          .923          .846          .846
INFRA          .909          .818          .909          .909          .818          .818
REGBANKS       .909          .909          .939          .939          .909          .939
NIFTY          .9            .866          .866          .733          .766          .8
HOMEBLDG       .882          .823          .882          .882          .823          .823
COAL           .875          .875          .875          .875          .875          .75
DOWJONES       .833          .833          .866          .866          .833          .8
SOFTWARE       .833          .803          .803          .818          .803          .818
SOLAR          .809          .761          .761          .714          .666          .761
FINANCE        .804          .826          .836          .826          .858          .836
HACKERS        .8            .8            .68           .64           .64           .76
---------------------------------------------------------------------------------------------
INSURANC       .781          .812          .781          .781          .75           .781
SEMI           .776          .753          .753          .738          .738          .776
GREEN          .774          .838          .87           .806          .741          .806
AUTO           .769          .717          .846          .897          .794          .923
MILITARY       .763          .763          .815          .789          .815          .842
ELECTRON       .759          .737          .765          .731          .743          .77
CHEM           .753          .753          .846          .846          .83           .8
ETFS           .753          .707          .753          .676          .753          .8
SP-100         .729          .739          .75           .75           .75           .76
UTILITY        .72           .744          .72           .604          .581          .697
EDU            .714          .714          .571          .571          .571          .571
COMPUTER       .695          .565          .608          .608          .565          .695
INDMATER       .695          .717          .728          .739          .76           .793
NASD-100       .681          .681          .693          .67           .681          .704
SP500          .677          .679          .7            .687          .698          .731
INDEXES        .668          .677          .658          .687          .72           .753
MORNSTAR       .668          .63           .651          .68           .71           .747
BIGMIL         .666          .833          .833          .833          1             1
OILGAS         .666          .625          .583          .513          .5            .541
RUS-1000       .658          .661          .682          .666          .654          .691
GAMING         .642          .607          .607          .607          .607          .607
CHINA          .64           .593          .656          .593          .625          .687
FOOD           .6            .533          .533          .466          .533          .466
TRANSP         .6            .65           .7            .7            .7            .8
BEVERAGE       .55           .5            .45           .5            .55           .55
COMODITY       .535          .549          .549          .521          .563          .549
BIOTECH        .515          .507          .523          .479          .546          .569
==============================================================================================
RETAIL         .407          .425          .5            .518          .518          .5
REIT           .34           .34           .407          .318          .396          .463
HOSPITAL       .25           .25           .25           .25           .625          .75
JETS           .222          .333          .222          .222          .333          .555
GOLD           .16           .2            .16           .14           .14           .16
BONDFUND       .089          .071          .044          .026          .071          .16
PIPELINE       0             0             0             0             0             0
N=7
|
=================================================================================
=================================================================================
10/30/2017
Peerless has given no sell signal. The
leading techs and semi-conductors
are clearly the center of the "sweet spot" for the bull market now. I see
nothing
technically that presents a serious risk to them at this stage.
The DJI half-heartedly fell today, but it looks like there will be a Tuesday
bounce-back,
just as there was a week ago. Regardless of the indictments of Trump's
campaign-men,
the big tax cut is still on track for corporations and the super-wealthy who
own most stocks.
This should delay most big profit-taking until next year. In addition, rumor
has it that Yellen's
replacement as Fed Chairman is a centrist, neither a hawk nor a dove.
We'll watch
developments here, but clearly Wall Street is already pleased and overnight,
the DJI is up 40.
The DJI seems to be in a consolidation pattern
now. DIA's Closing Power is still classified
as bullish. But we will need to see it not close weakly at tomorrow's
lows as that would cause
its IP21 and Closing Power to decline further and cause another red
candle-stick day.
I showed in last night's Hotline that trading in this fashion for a week or
two more will become
bearish. But right now, the momentum is still up and, as far as
Peerless goes, the
average Buy B21 signal brings a DJI gain of 17+ % before there is an
important reversal.
Yes, this is a fragmented market. But that is
not unusual and it can continue for a
very long time, The leading semi-conductors (SOXL) and tech stocks
(TECL) keep
rising and show bullish (blue) across-the-board QuickSilver key values.
We should stay
these. This is where money managers must place new money if they are
to do well. At the
same time, our Bearish MINCPs keep falling. Stay short some of these.
Pyramid Investing
It will help us, I think, to watch especially closely
the most heavily weighted stocks in
the DJI-30, QQQ and SOXL. The 4 highest priced DJI stocks (BA, GS, MMM
and
UNH) now comprise 28% of the DJI's weight. This is nearly twice as
much as the ten lowest
priced DJI stocks. The ten highest make up 55% of the weighting in the
DJI's movements,
the next ten constitute 30% and the lowest ten are valued at only 15% in the
DJI. This
is important. It takes a relatively small amount of funds to push the
market's most visible
index upwards. And, of course, it is these rising high-fliers that
disproportionately attract
the most aggressive investments from performance minded fund managers.
Once a bull market
gets into high-gear, sheer momentum and these pyramid-investing dynamics
keep it going a long
time. It is usually only when really big excesses are achieved and the divergences
become
much more blatant
that a
major top usually made.
If what I've just said makes sense, it may be even
more true for the QQQ. Just four stocks
comprise 44% of the weighting in the QQQ. Those are AAPL (11.8%), GOOG
(9.3%),
MSFT (9.1%), AMZN (7.4%) and FB (5.9%). To make it a little easier to track
these
I have added these stocks to the QuickSilver listing in Table 2.

 |
 |
 |
 |
|
Charts 10/302017
PEERLESS
DJI, Signals, Indicators Daily
DJI Split Volume 10-DayUp/Down Vol
Hourly DJIA A/D Line for All
Stocks High Priced DJI
Stocks Chart
DJIA
S&P
OEX
NYSE
NASDAQ COMPQX(Nasdaq)
DIA
SPY
QQQ
MDY
IWM TNA
Short Term Interest Rates
DJI-Utilities
DJI-Transp
CrudeOil
FAS
GLD
BBH
IBB
JETS
JNUG
KOL
NUGT
OIH
OIL
RSX
RETL
SDS
SLV
SOXL
TECL
TMF
TNA UGA
(gasoline)
XIV YINN
Commodities:
COW JJC, NIB,
CHOC
CORN,
WEAT UUP
(Dollar)
AAPL ADBE
ALXN AMAT
AMGN AMD
AMZN BA
BABA
BIDU
CAT CVX
FB
GOOG
GS
HD
IBM JPM M
(Macy's) MASI
MSFT
NVDA QCOM
TSLA TXN
XOM
ANDV (refinery,
CMG (Chipotle),
LRCX, SWKS,
TOWN
Others REN, CVE
and SWN
10/30/2017
Bullish MAXCPs
Bearish MINCPs |
Table 1
Tiger's QUICKSILVER and MAJOR ETFS and KEY
STOCKS:
10/30/2017
QuickSilver
Documentation
This is for short-term trading
of leveraged ETFs. It also provides a useful short-term
outlook of these sectors ETF's and the sectors they
represent.
Blue is Bullish
and Red is Bearish.
1 Candle-Stick color is shortest-term. This changes when
close vis-a-vis opng changes.
So, in
stocks or ETFs that advances a long ways, traders should sell when a
higher
opening
gives way to a decline that bring a drop below the previous day's
close.
2 5-dma AROC and Close versus pivot point is next most
short-term.
W = warning.
Close is below PIVOT-Point
3 Closing Power trend-direction vs. its 21-dma is next most
short-term.
4 IP21 is used to spot divergences and to estimate
underlying support.
5 IP21 falling and below +.15 and its 21-dma is bearish.
IP21 below
.07 with AROC below .07 is less likely to bring a rally back up from
21-dma.
6 Note price trend-lines, support/resistance and price
patterns on charts.
QUICKSILVER on ETFS - 10/30/17
ETF      CLOSE    CHANGE     PIVOT-PT   5-dma AROC  CL-PWR     CANDLE   IP21   ITRS
---------------------------------------------------------------------------------------------
DIA       233.33    -.84     W234.29      14.6%     ----        RED     .271     0
---------------------------------------------------------------------------------------------
COMPQX    6698.96  -2.3     6598.43       84.9%     Bullish     BLUE    .2       0
---------------------------------------------------------------------------------------------
SPY       256.75   -.96      256.56       12.5%     ----        RED     .321   -.02
---------------------------------------------------------------------------------------------
QQQ       151.58    .34      147.99      129.5%     Bullish     BLUE    .253   -.004
---------------------------------------------------------------------------------------------
MDY       331.85  -2.4      W333.12         .8%     Bullish     RED     .251   -.001
---------------------------------------------------------------------------------------------
IWM       148.21  -1.58     W149.17      -21.8%     Bearish     RED     .053    .021
---------------------------------------------------------------------------------------------
FAS       60.47    -.55      W60.79       33%       ----        ----    .233    .147
---------------------------------------------------------------------------------------------
RETL      24.39   -1.27      W27.2      -485.4%     Bearish     RED    -.056    .017
---------------------------------------------------------------------------------------------
SOXL      144.71   1.35      138.09      342.6%     Bullish     BLUE    .428    .545
---------------------------------------------------------------------------------------------
TECL      106.47   1.11       98.02      463.6%     Bullish     BLUE    .22     .245
---------------------------------------------------------------------------------------------
IBB       316.66    .54     W325.17     -172.6%     Bearish     BLUE    .021   -.036
---------------------------------------------------------------------------------------------
GLD       122.6     .58      119.46      142.2%     Bullish     BLUE    .092   -.013
---------------------------------------------------------------------------------------------
OIL       5.71      .02        5.46      291.2%     Bullish     ----    .267    .044
---------------------------------------------------------------------------------------------
OIH       24.07     .4        23.4       147.2%     Bearish     BLUE   -.001    .017
---------------------------------------------------------------------------------------------
GASL      21.74     .44       19.89      398.3%     Bearish     BLUE    .047    .291
---------------------------------------------------------------------------------------------
UGA       30.83    -.1        30.15      232.7%     Bullish     RED     .493    .081
---------------------------------------------------------------------------------------------
UUP       24.56    -.12       24.42       36.7%     ----        RED    -.046   -.063
---------------------------------------------------------------------------------------------
IEF       106.23    .38      105.82        4.3%     Bullish     BLUE   -.005   -.09
---------------------------------------------------------------------------------------------
CORN      17.35     .01      W17.52      -34.4%     ----        ----   -.115   -.113
---------------------------------------------------------------------------------------------
WEAT      6.27     -.03       W6.44     -117.4%     Bearish     ----   -.073   -.129
---------------------------------------------------------------------------------------------
YINN      32.34   -1.51       32.09       41.6%     ----        RED     .151    .191
---------------------------------------------------------------------------------------------
RSX       22.05     .06       22.05       18.3%     Bearish     RED   -.103     .011
---------------------------------------------------------------------------------------------
-------------------- STOCKS ------------------------------------------------------------------
AAPL      166.72   3.67      157.1       333.8%     Bullish     BLUE    .18    -.019
---------------------------------------------------------------------------------------------
GOOG      1017.11 -2.16      970.54      248.1%     Bullish     BLUE   -.052    .039
---------------------------------------------------------------------------------------------
MSFT      83.89     .08       78.86      317.1%     Bullish     BLUE   -.007    .08
---------------------------------------------------------------------------------------------
AMZN      1110.85  9.9        975.9      724.4%     Bullish     BLUE    .168    .081
---------------------------------------------------------------------------------------------
FB        179.87   1.99       171.8      249.4%     Bearish     BLUE    .024   -.003
---------------------------------------------------------------------------------------------
NVDA     203.84    1.98       198.68     183%       Bullish     BLUE    .267    .185
---------------------------------------------------------------------------------------------
BA        259.25   2.79       266.00     -58.9%     Bullish     BLUE    .219    .022
---------------------------------------------------------------------------------------------
GS        240.89   -.82       244.84     -25.6%     Bearish     BLUE    .038    .007
==============================================================================================
|
Table 2
COMPARISONS OF BULLISH AND BEARISH NUMBERS
10/30 10/27 10/26 10/25 10/24 10/23 10/20
10/19 10/18 10/17 10/16 10/13 10/12 10/11 10/10
NEWHIGHS 190 480
309 153 376
200 533 300
381 238 423
430 402 487
481
NEWLOWS 84 83
74 103 73
56 41 41
32 32 53
50 44
44 29
------------------------------------------------------------------------------------------------------------------------
MAXCPs
97 184 120 86 117 125
258 251 154 125
137 168 255
239 194
MINCPs 139 162 229 209 179 157
106 98 101
89 105 78
79 73
64
-------------------------------------------------------------------------------------------------------------------------
TTTNHs
72 76 59 42 70 53 78 89 88 65 63 76 115 102 89
TTTNLs
151
224 340 389 216 245 81 122 153 117 138 108
92 92 75
-------------------------------------------------------------------------------------------------------------------------
FASTUP
112 95 86 73 92 86
82 63 68 65
FASTDOWN
200 115 222 185 155 158 129 148 174 166
|
Table 3
Count of Stocks and New Highs in Key Tiger Directories
Date = 171030
-------------------------------------------------------------------
NIFTY          30            10            33 %
SOLAR          21            6             29 %
HOMEBLDG       17            3             18 %
GREEN          31            5             16 %
SEMI           130           21            16 %
NASD-100       88            13            15 %
-------------------------------------------------------
GAMING         28            4             14 %
EDU            7             1             14 %
UTILITY        43            6             14 %
ELECTRON       179           23            13 %
INSURANC       32            4             13 %
SOFTWARE       66            7             11 %
DOWJONES       30            3             10 %
BEVERAGE       20            2             10 %
CHEM           65            6             9 %
INDEXES        211           20            9 %
INFRA          11            1             9 %
DJI-13         13            1             8 %
INDMATER       92            7             8 %
SP-100         96            7             7 %
SP500          488           35            7 %
RUS-1000       844           59            7 %
ETFS           65            4             6 %
MORNSTAR       238           14            6 %
CHINA          64            4             6 %
FINANCE        92            5             5 %
MILITARY       38            2             5 %
TRANSP         20            1             5 %
COMPUTER       23            1             4 %
REGBANKS       33            1             3 %
AUTO           40            1             3 %
OILGAS         144           4             3 %
BIOTECH        388           7             2 %
RETAIL         55            1             2 %
COMODITY       71            1             1 %
None: BIGBANKS BIGMIL HACKERS COAL  GOLD  REIT PIPELINE
FOOD BONDFUND  HOSPITAL   JETS
|
 |
Table 4 RANKING OF KEY DIRECTORIES BASED PCT.OF STOCKS ABOVE 65-DMA
10/30/17
Bullish = 38
Bearish = 7
---------------------------------------------------------------------------------------
Directory Current day-1 day-2 day-3 day-4 day-5
----------------------------------------------------------------------------------------
BIGBANKS 1 1 1 1 1 1
DJI-13 .923 .923 .923 .846 .846 .846
REGBANKS .909 .939 .939 .909 .939 .939
COAL .875 .875 .875 .875 .75 .75
NIFTY .866 .866 .733 .766 .8 .733
GREEN .838 .87 .806 .741 .806 .838
BIGMIL .833 .833 .833 1 1 1
DOWJONES .833 .866 .866 .833 .8 .8
FINANCE .826 .836 .826 .858 .847 .815
HOMEBLDG .823 .882 .882 .823 .823 .823
INFRA .818 .909 .909 .818 .818 .818
INSURANC .812 .781 .781 .75 .781 .812
SOFTWARE .803 .803 .818 .803 .818 .803
HACKERS .8 .68 .64 .64 .72 .76
N=14
============================================================================================
MILITARY .763 .815 .789 .815 .815 .815
SOLAR .761 .761 .714 .666 .761 .761
CHEM .753 .846 .846 .83 .784 .784
SEMI .753 .753 .738 .738 .761 .761
UTILITY .744 .72 .604 .581 .697 .697
SP-100 .739 .75 .75 .75 .76 .76
ELECTRON .737 .765 .731 .743 .765 .77
AUTO .725 .85 .9 .8 .925 .925
INDMATER .717 .728 .739 .76 .782 .76
EDU .714 .571 .571 .571 .571 .571
ETFS .707 .753 .676 .753 .8 .8
NASD-100 .681 .693 .67 .681 .704 .704
SP500 .678 .698 .686 .696 .727 .729
INDEXES .677 .658 .687 .72 .753 .758
RUS-1000 .661 .681 .665 .654 .686 .691
TRANSP .65 .7 .7 .7 .8 .75
MORNSTAR .63 .651 .68 .71 .747 .735
OILGAS .625 .583 .513 .5 .534 .534
GAMING .607 .607 .607 .607 .642 .642
CHINA .593 .656 .593 .625 .687 .671
COMPUTER .565 .608 .608 .565 .652 .608
COMODITY .549 .549 .521 .563 .549 .577
FOOD .533 .533 .466 .533 .466 .466
BIOTECH .507 .523 .479 .546 .567 .613
N=24
===============================================================================================
BEVERAGE .5 .45 .5 .55 .55 .55
===============================================================================================
RETAIL .418 .49 .509 .509 .49 .472
REIT .34 .407 .318 .396 .458 .513
JETS .333 .222 .222 .333 .555 .222
HOSPITAL .25 .25 .25 .625 .75 .75
GOLD .2 .16 .14 .14 .16 .24
BONDFUND .071 .044 .026 .071 .151 .196
PIPELINE 0 0 0 0 0 0
N=7
|
| |
===================================================================================
===================================================================================
10/27/2017
Peerless has given no sell signal. But
a Monday sell-off in the DJI seems to
be shaping up. The DJI did not do nearly as well as the NASDAQ on
Friday
and several high priced DJI-30 stocks (BA, MSFT, MRK and CVX) look
vulnerable
in varying degrees, as will be shown below.
Friday
was a very good day for bullish tech aficionados. AMZN (+128.52)
and GOOG (+46.71) reported much better than expected earnings
and
AAPL hyped that its newest IPhone
orders were "off the charts". All this allowed
many big tech higher, especially the leading semi-conductors, to make what
could
be described as "gaudy gains", which are likely to bring some profit-taking.
The
immediate result was
that QQQ
and the NASDAQ leapt to new highs and we
now see across-the-board Blue
readings
from
DIA, COMPQX, (NASDAQ),
MDY,
SOXL, TECL. The
TigerSoft charts of
each of these show rising Closing Powers,
5-day ma,
BLUE candle-sticks and
very positive
IP21 (Accumulation) and
ITRS (50-day Relative Strength vis-a-vis the DJI.)
values.
The key values are also
positive
for SPY and QQQ, except that their ITRS numbers are
negative.
We have to remain bullish. But I can't help but mentioning that in the late
stages of
a bull market, flashy jumps in tech stocks often occur. This adds to
the allure of
the bull market and makes side-line sitting emotionally difficult. On
days like this, traders
should watch the next trading day's follow-through or the lack of it.
But even on the day of
the big gap opening, they must watch to see if prices rise after the openings. If the closings
on
these big
up-days end up being below the openings, it turns our candle-stick chart RED
and
our Closing Powers down for the day. This
is normally short-term bearish, especially if the next
day is weak. Candle-stick "Red Popsicles"
become
significantly bearish when the Tiger Closing
Powers turn "Bearish" and the
IP21 turns
negative. That is not true now. In fact, as long as
their
Accumulation Index scores
stay above +.25, all declines for the big major market ETFs
are likely to be shallow. From
Table 1, we can
see that all the major market ETFs have very
positive IP21s, the highest
being SOXL (.463 ). Both DIA and SPY have IP21s above +.30.
So, the
major markets
look safe.
Some of The DJI-30 Stocks
(MSFT, BA, CVX, MRK)
Now Show What We Don't Want To
See
MSFT's big gap on Friday was followed by a close near
the day's low and well
below the opening. Its IP21-Accum.Index is only +.05. A closing
of the big gap
seems likely. (No buy-out here!)
High-priced BA's Closing Power is now below its 21-day ma. Bulls
should be
concerned if its IP21 falls much below +.15.
See how CVX peaked.
It showed a RED candle-stick. Its
IP21 dropped well below
its 21-day ma. while above 118 just as its Closing Power uptrend
was violated. See the
amount of Red in the candle-stick chart below in the head/shoulders
shaped top formation.
MRK's
sell-off on Friday is much too big for a blue chip. This is a
definite warning. It showed 7 straight
RED candle-sticks
while stock
was still above 65. As stock broke below 65, its Closing Power uptrend
was violated and its IP21 fell away from its 21-dma.
At the extreme we see how the coming weakness is GE was telegraphed
to alert Tiger users back at start of 2017 by all these factors.
 |
| |
|
Charts 10/27/2017
PEERLESS
DJI, Signals, Indicators Daily
DJI Split Volume 10-DayUp/Down Vol
Hourly DJIA A/D Line for All
Stocks High Priced DJI
Stocks Chart
DJIA
S&P
OEX
NYSE
NASDAQ COMPQX(Nasdaq)
DIA
SPY
QQQ
MDY
IWM TNA
Short Term Interest Rates
DJI-Utilities
DJI-Transp
CHN
CrudeOil
FAS
GLD
BBH
IBB
JETS
JNUG
KOL
NUGT
OIH
OIL
RSX
RETL
SDS
SLV
SOXL
TECL
TMF
TNA UGA
(gasoline)
XIV YINN
Commodities:
COW JJC, NIB,
CHOC
CORN,
WEAT UUP
(Dollar)
AAPL ADBE
ALXN AMAT
AMGN AMD
AMZN BA
BABA
BIDU
CAT CVX
FB
GOOG
GS
HD
IBM JPM M
(Macy's) MASI
MSFT
NVDA QCOM
TSLA TXN
XOM
ANDV (refinery,
CMG (Chipotle),
LRCX, SWKS,
TOWN
Others REN, CVE
and SWN
10/27/2017 Bullish MAXCPs
Bearish MINCPs |
Table 1
Tiger's QUICKSILVER and MAJOR ETFS
10/27/2017
Across-the-board Blue:
DIA, COMPQX, (NASDAQ), MDY,
SOXL, TECL, OIL, UGA and YINN.
QuickSilver
Documentation
This is for short-term trading
of leveraged ETFs. It also provides a useful short-term
outlook of these sectors ETF's and the sectors they
represent.
Blue is Bullish
and Red is Bearish.
1 Candle-Stick color is shortest-term. This changes when
close vis-a-vis opng changes.
So, in
stocks or ETFs that advances a long ways, traders should sell when a
higher
opening
gives way to a decline that bring a drop below the previous day's
close.
2 5-dma AROC and Close versus pivot point is next most
short-term.
W = warning.
Close is below PIVOT-Point
3 Closing Power trend-direction vs. its 21-dma is next most
short-term.
4 IP21 is used to spot divergences and to estimate
underlying support.
5 IP21 falling and below +.15 and its 21-dma is bearish.
IP21 below
.07 with AROC below .07 is less likely to bring a rally back up from
21-dma.
6 Note price trend-lines, support/resistance and price
patterns on charts.
QUICKSILVER on ETFS - 10/27/17
ETF      CLOSE   CHANGE     PIVOT-PT   5-dma AROC  CL-PWR     CANDLE  IP21   ITRS
---------------------------------------------------------------------------------------------
DIA       234.17    .32      232.65     22.3%      Bullish     BLUE   .351    ---
---------------------------------------------------------------------------------------------
COMPQX    6701.26 +144.49   6586.83     54.8%      Bullish     BLUE   .252    .002
---------------------------------------------------------------------------------------------
SPY       257.71    2.09     256.11     11.7%      Bullish     BLUE   .388   -.015
---------------------------------------------------------------------------------------------
QQQ       151.24    4.28     147.74     85.6%      Bullish     BLUE   .316   -.005
---------------------------------------------------------------------------------------------
MDY       334.25    1.75     331.8      10.2%      Bullish     BLUE   .274    .007
---------------------------------------------------------------------------------------------
IWM       149.79    1.03     148.86     -6.4%      Bearish     BLUE   .081    .035
---------------------------------------------------------------------------------------------
FAS       61.02    .15       60.07      43%        ----        BLUE   .291    .153
---------------------------------------------------------------------------------------------
RETL      25.66   -1.24     W26.98     -208.2%     Bearish      RED  -.004    .062
---------------------------------------------------------------------------------------------
SOXL      143.36    8.28     135.33     377%       Bullish      BLUE  .463    .547
---------------------------------------------------------------------------------------------
TECL      105.36    7.7      97.29      351.8%     Bullish      BLUE  .254    .229
---------------------------------------------------------------------------------------------
IBB       316.12    2.14    W327.74    -242%       Bearish      BLUE  .071   -.038
---------------------------------------------------------------------------------------------
GLD       122.6    .58       119.46     142.2%     Bullish      BLUE  .092   -.011
---------------------------------------------------------------------------------------------
OIL       5.69    .19        5.39       276%       Bullish      BLUE  .273    .098
---------------------------------------------------------------------------------------------
OIH       23.67    .31       23.38      -32%       Bearish      BLUE -.069    .013
---------------------------------------------------------------------------------------------
GASL      21.3    1.93       20.15     -2.5%       Bearish      BLUE  .057    .298
---------------------------------------------------------------------------------------------
UGA       30.93    .31       29.42      213%       Bullish      BLUE  .427    .115
---------------------------------------------------------------------------------------------
UUP       24.68    .06       24.38       67.6%     Bullish      ---- -.027   -.059
---------------------------------------------------------------------------------------------
IEF       105.85    .34      106.14      -9%       ----         BLUE -.079   -.091
---------------------------------------------------------------------------------------------
CORN      17.34   -.07      W17.47       43.1%     Bearish      ---- -.087   -.107
---------------------------------------------------------------------------------------------
WEAT      6.3   -.06        W6.42         0%       Bearish      RED  -.105   -.119
---------------------------------------------------------------------------------------------
YINN      33.85    1.7       32.07      103.6%     Bullish      BLUE  .182    .263
---------------------------------------------------------------------------------------------
RSX       21.99    .21       21.97      -34.2%     Bearish      BLUE -.073    .019
|
Table 2
10/27 10/26 10/25 10/24 10/23 10/20
10/19 10/18 10/17 10/16 10/13 10/12 10/11 10/10 10/9
NEWHIGHS 480
309 153 376
200 533 300
381 238 423
430 402 487
481 271
NEWLOWS 83 74 103 73 56
41 41 32 32 53 50 44 44
29 21
------------------------------------------------------------------------------------------------------------------------
MAXCPs
184 120
86 117 125
258 251 154 125
137 168 255
239 194 185
MINCPs
162 229 209 179 157 106 98
101 89 105 78 79 73 64
55
-------------------------------------------------------------------------------------------------------------------------
TTTNHs
76 59 42 70 53 78 89 88 65 63 76 115 102 89 74
TTTNLs
224 340 389 216 245 81 122 153 117 138 108
92 92 75 95
-------------------------------------------------------------------------------------------------------------------------
FASTUP
95 86 73 92 86
82 63 68 65
FASTDOWN
115 222 185 155 158 129 148 174 166
|
Table 3
Percentages of Sectors
Making New Highs: Date = 171027
               No.          NHs            Pct.
-------------------------------------------------------------------
BIGBANKS       7             4             57 %
NIFTY          30            12            40 %
SOLAR          21            7             33 %
HOMEBLDG       17            5             29 %
SEMI           130           35            27 %
ELECTRON       180           46            26 %
GAMING         28            7             25 %
FINANCE        92            20            22 %
INSURANC       32            7             22 %
SP-100         96            20            21 %
INDEXES        212           45            21 %
UTILITY        43            9             21 %
NASD-100       88            18            20 %
GREEN          31            6             19 %
ETFS           65            12            18 %
DOWJONES       30            5             17 %
MORNSTAR       238           41            17 %
SOFTWARE       66            10            15 %
SP500          488           74            15 %
-------------------------------------------------------
RUS-1000       844           118           14 %
MILITARY       38            5             13 %
CHINA          64            8             13 %
HOSPITAL       8             1             13 %
REGBANKS       33            4             12 %
TRANSP         20            2             10 %
CHEM           65            6             9 %
INFRA          11            1             9 %
DJI-13         13            1             8 %
INDMATER       92            6             7 %
AUTO           39            2             5 %
BIOTECH        387           19            5 %
RETAIL         55            3             5 %
BEVERAGE       20            1             5 %
COMODITY       71            2             3 %
REIT           179           4             2 %
------------------------------------------------
None: BIGMIL HACKERS   OILGAS    COMPUTER   COAL
GOLD  EDU   PIPELINE   FOOD    BONDFUND   JETS
|
| |
Table 4
RANKING OF KEY DIRECTORIES BASED PCT.OF STOCKS ABOVE 65-DMA
             10/27/17
Bullish = 38
Bearish = 8
---------------------------------------------------------------------------------------
Directory     Current       day-1         day-2         day-3         day-4         day-5
----------------------------------------------------------------------------------------
BIGBANKS       1             1             1             1             1             1
REGBANKS       .939          .939          .909          .939          .939          1
DJI-13         .923          .923          .846          .846          .846          .846
INFRA          .909          .909          .818          .818          .818          1
HOMEBLDG       .882          .882          .823          .823          .823          .823
COAL           .875          .875          .875          .75           .75           .75
GREEN          .87           .806          .741          .806          .838          .838
DOWJONES       .866          .866          .833          .8            .8            .833
NIFTY          .866          .733          .766          .8            .733          .8
AUTO           .846          .897          .794          .923          .923          .897
CHEM           .846          .846          .83           .784          .769          .846
FINANCE        .836          .826          .858          .847          .815          .891
BIGMIL         .833          .833          1             1             1             1
MILITARY       .815          .789          .815          .815          .815          .868
SOFTWARE       .803          .818          .803          .818          .803          .818
N=15
---------------------------------------------------------------------------------------------
INSURANC       .781          .781          .75           .781          .812          .812
ELECTRON       .761          .727          .738          .761          .75           .722
SOLAR          .761          .714          .666          .761          .761          .666
ETFS           .753          .676          .753          .8            .8            .846
SEMI           .753          .738          .738          .761          .738          .715
SP-100         .75           .75           .75           .76           .75           .812
INDMATER       .728          .739          .76           .782          .771          .793
UTILITY        .72           .604          .581          .697          .697          .72
TRANSP         .7            .7            .7            .8            .75           .9
SP500          .698          .686          .696          .727          .729          .768
NASD-100       .693          .67           .681          .704          .704          .75
RUS-1000       .681          .665          .654          .686          .69           .733
HACKERS        .68           .64           .64           .72           .76           .76
CHINA          .656          .593          .625          .687          .671          .687
INDEXES        .655          .683          .716          .75           .754          .74
MORNSTAR       .651          .68           .71           .747          .731          .773
COMPUTER       .608          .608          .565          .652          .608          .608
GAMING         .607          .607          .607          .642          .642          .642
OILGAS         .583          .513          .5            .534          .541          .604
EDU            .571          .571          .571          .571          .571          .571
COMODITY       .549          .521          .563          .549          .563          .521
FOOD           .533          .466          .533          .466          .4            .4
BIOTECH        .524          .48           .547          .568          .607          .643
N=23
===============================================================================================
RETAIL         .49           .509          .509          .49           .472          .545
BEVERAGE       .45           .5            .55           .55           .55           .55
REIT           .407          .318          .396          .458          .513          .569
HOSPITAL       .25           .25           .625          .75           .75           .75
JETS           .222          .222          .333          .555          .222          .555
GOLD           .16           .14           .14           .16           .26           .28
BONDFUND       .044          .026          .071          .151          .205          .25
PIPELINE       0             0             0             0             0             0
N=8
|
================================================================================
10/26/2017
Peerless has given no sell signal. The
DJI ran up on expectations that Congress
will cut taxes very significantly for corporations and the wealthy, who own
most
stock. Republicans have more than enough votes and the fact that they
will have
no Democrats aboard will not be a problem. See the NY times article
tonight for
details.
https://www.nytimes.com/2017/10/26/us/politics/house-budget-blueprint-tax-cut.html?emc=edit_th_20171027&nl=todaysheadlines&nlid=58223894
The market's rally since last November has been
anticipating this achievement
more than anything else. It should, therefore, not come as a surprise
if there is
a sell-off when the new tax bill and Budget are passed in a month.
But the market is getting nervous now. In fact,
if there is another day where the
DJI rises in "splendid isolation" and it closes near the lows of the day, we
could see
a new Peerless Sell S8. It would be based on the growing divergence
between
the rising DJI and the weakening A/D Line, the IP21's crossing below the
21-day ma
and the V-I being quite negative. We can't be certain if this will
appear. It will depend on
the trading data in the next few days. Such a sell signal would most
likely not bring
a serious decline. The DJI would not be expected to fall below its
rising 65-dma.
And even the NASDAQ, which is being hurt by
the swift drop in the Biotechs, should
hold up because of its underlying very high level of Accumulation.
Professionals
are clearly switching to the bearish camp.
Although there were still 120
MAXCPs today, the number of MINCP stocks (Closing Power New Lows) rose
for the fifth straight days and their number today is now almost twice the
level of
Closing Power New Highs. See Table 2. If these stocks cannot go
up in a bull market,
what will they do in a much weaker general market?
Right now, only DIA, FAS
(Big Banks), MDY and
SOXL, among the general market
ETFs shown in Table 1, can boast a rising Closing Power and a rising 5-dma.
MDY, it should be noted, closed below its 5-day
ma pivot-point today.
For now stick with DIA,
FAS and SOXL on
the long side. Take some short sale
hedges among our bearish MINCPs.
They show no sign of bottoming. But understand
that the excitement over the big tax-cut has not peaked. As such, it
seems bound to bring rising
prices now. That the gains are mostly coming on higher openings is a
warning that
Professionals are increasingly reluctant to buy stocks not among the
elite-performers.
This selectivity is a pattern that has often been seen in the last six
months of past bull market.
In sum, the bullish enthusiasm for the leaders can
reach much high levels, I believe.
That is certainly the lesson of 1929,
1973 and 2000. In these years,
the final DJI tops were
made only after the NYSE A/D Line had been lagging for more than nine
months. Our
A/D Line here is just starting to diverge noticeably from the high-flying
DJI.
Charts 10/26/2017
PEERLESS
DJI, Signals, Indicators Daily
DJI Split Volume 10-DayUp/Down Vol
Hourly DJIA A/D Line for All
Stocks High Priced DJI
Stocks Chart
DJIA
S&P
OEX
NYSE
NASDAQ COMPQX(Nasdaq)
DIA
SPY
QQQ
MDY
IWM TNA
Short Term Interest Rates
DJI-Utilities
DJI-Transp
CrudeOil
FAS
GLD
BBH
IBB
JETS
JNUG
KOL
NUGT
OIH
OIL
RSX
RETL
SDS
SLV
SOXL
TECL
TMF
TNA UGA
(gasoline)
XIV YINN
Commodities:
COW JJC, NIB,
CHOC
CORN,
WEAT UUP
(Dollar)
AAPL ADBE
ALXN AMAT
AMGN AMD
AMZN BA
BABA
BIDU
CAT CVX
FB
GOOG
GS
HD
IBM JPM M
(Macy's) MASI
MSFT
NVDA QCOM
TSLA TXN
XOM
ANDV (refinery,
CMG (Chipotle),
LRCX, SWKS,
TOWN
Others REN, CVE
and SWN
10/26/2017 Bullish MAXCPs
Bearish MINCPs |
Table 1
Tiger's QUICKSILVER and MAJOR ETFS
10/26/2017
Only DIA, FAS and SOXL as well as GLD,
OIL and UGA showing rising Closing Powers
and 5-day ma. MDY closed well below
its pivot-point.
DIA, FAS and
SOXL will become
vulnerable, too, if they close below
their pivot-points. That will turn down their 5-day ma and
likely cause them to fall to their
21-dma.
COMPQX
(NASDAQ), IWM, IBB and QQQ now have falling 5-day mvg.averages.
DIA, FAS and SOXL will become vulnerable,
too, if they close below their pivot-points.
That will turn down their 5-day ma and
likely cause them to fall to their 21-dma.
QuickSilver
Documentation
This is for short-term trading
of leveraged ETFs. It also provides a useful short-term
outlook of these sectors ETF's and the sectors they
represent.
Blue is Bullish
and Red is Bearish.
1 Candle-Stick color is shortest-term. This changes when
close vis-a-vis opng changes.
So, in
stocks or ETFs that advances a long ways, traders should sell when a
higher
opening
gives way to a decline that bring a drop below the previous day's
close.
2 5-dma AROC and Close versus pivot point is next most
short-term.
W = warning.
Close is below PIVOT-Point
3 Closing Power trend-direction vs its 21-dma is next most
short-term.
4 IP21 is used to spot divergences and to estimate
underlying support.
5 IP21 falling and below +.15 and its 21-dma is bearish.
IP21 below
.07 with AROC below .07 is less likely to bring a rally back up from
21-dma.
6 Note price trend-lines, support/resistance and price
patterns on charts.
QUICKSILVER on ETFS - 10/26/17
ETF      CLOSE   CHANGE     PIVOT-PT   5-dma AROC   CL-PWR   CANDLE  IP21    ITRS
---------------------------------------------------------------------------------------------
DIA       233.85    .69      233.13        47.2%   Bullish    RED    .342    ---
---------------------------------------------------------------------------------------------
COMPQX    6556.77   -7.12   W6629.05      -36.6%   ----       RED    .242    -.027
---------------------------------------------------------------------------------------------
SPY       255.62    .33     W257.11       -3.3%   ----        RED    .371    -.026
---------------------------------------------------------------------------------------------
QQQ       146.96   -.47     W148.71       -45.6%   ----       RED    .277    -.042
---------------------------------------------------------------------------------------------
MDY       332.5    1.43     W333.57        13.7%   Bullish    BLUE   .276    -.003
---------------------------------------------------------------------------------------------
IWM       148.76    .31     W149.98       -17.8%   Bearish    RED   .061     .022
---------------------------------------------------------------------------------------------
FAS       60.87    .65       60.5          158%     ----      BLUE   .291     .109
---------------------------------------------------------------------------------------------
RETL      26.9    .25        26.78         215.6%   Bearish   BLUE   .009     .071
---------------------------------------------------------------------------------------------
SOXL      135.08    2.38    133.19        140.9%   Bullish    BLUE   .455     .346
---------------------------------------------------------------------------------------------
TECL      97.66    .96      W98.49         49.8%   ----       RED    .249     .078
---------------------------------------------------------------------------------------------
IBB       313.98   -7.47    W331.8        -321.9%   Bearish   RED    .043    -.048
---------------------------------------------------------------------------------------------
GLD       122.6    .58       119.46        142.2%   Bullish   BLUE   .092     .004
---------------------------------------------------------------------------------------------
OIL       5.5      .07       5.39          138.8%   Bullish   BLUE   .103     .071
---------------------------------------------------------------------------------------------
OIH       23.36    .01      W23.82        -137.8%   Bearish   -----  .174    -.001
---------------------------------------------------------------------------------------------
GASL      19.37    .27      W21.31        -447.7%   Bearish   BLUE  -.036     .145
---------------------------------------------------------------------------------------------
UGA       30.62    .26       29.65         272.6%   Bullish   BLUE   .408     .138
---------------------------------------------------------------------------------------------
UUP       24.62    .26       24.35         84.2%   Bullish    BLUE   .001    -.045
---------------------------------------------------------------------------------------------
IEF       105.51   -.14     W106.04       -45.7%   Bearish    RED  -.094    -.076
---------------------------------------------------------------------------------------------
CORN      17.41   -.05       17.19         20.1%   ----       ----  -.068    -.097
---------------------------------------------------------------------------------------------
WEAT      6.36   -.05        6.3          -23.5%   ----       ----  -.102    -.103
---------------------------------------------------------------------------------------------
YINN      32.15   -.1       W33.18         24.8%   ----       RED   .164     .135
---------------------------------------------------------------------------------------------
RSX       21.78    .02      W22.14        -93.1%   Bearish    ----  -.131     .022
|
| Table 2 COMPARISONS
OF BULLISH AND BEARISH NUMBERS
There are still 4x more new
highs than new lows, but MINCPs,
TTTNLs and FASTDOWN
are far more numerous than their counterparts, showing that
Professionals are heavy sellers of the broad market.
10/26 10/25
10/24 10/23 10/20 10/19 10/18 10/17 10/16 10/13 10/12
10/11 10/10 10/9 10/6 10/5
NEWHIGHS 309 153
376 200 533 300 381 238 423 430 402
487 481 271 371 555
NEWLOWS 74 103 73 56
41 41 32 32 53 50 44 44
29 21 25 19
------------------------------------------------------------------------------------------------------------------------
MAXCPs 120
86 117 125 258 251
154 125 137 168 255 239 194 185 252
229
MINCPs 229 209
179 157 106 98
101 89 105 78 79 73 64 55
41 40
-------------------------------------------------------------------------------------------------------------------------
TTTNHs 59 42
70 53 78 89 88 65 63 76
115 102 89 74
93 104
TTTNLs 340 389 216
245 81 122 153
,117 138 108
92 92 75 95
65 60
-------------------------------------------------------------------------------------------------------------------------
FASTUP
86 73 92 86
82 63 68 65
FASTDOWN
222 185 155 158 129 148 174 166 |
 Table 3
 Percentages of Sectors Making New Highs:  Date = 171026
               No.          NHs            Pct.
-------------------------------------------------------------------
BIGBANKS       7             3             43 %
HOMEBLDG       17            7             41 %
DOWJONES       30            7             23 %
SOFTWARE       66            12            18 %
REGBANKS       33            5             15 %
CHEM           65            10            15 %
DJI-13         13            2             15 %
ELECTRON       180           27            15 %
MORNSTAR       238           35            15 %
======================================================
SP-100         96            13            14 %
SEMI           130           18            14 %
AUTO           39            5             13 %
FINANCE        92            12            13 %
SP500          488           65            13 %
INSURANC       32            4             13 %
RUS-1000       844           109           13 %
CHINA          64            8             13 %
INDMATER       92            11            12 %
GREEN          31            3             10 %
TRANSP         20            2             10 %
RETAIL         55            5             9 %
INDEXES        212           16            8 %
NIFTY          30            2             7 %
NASD-100       88            6             7 %
UTILITY        43            3             7 %
MILITARY       38            2             5 %
SOLAR          21            1             5 %
BEVERAGE       20            1             5 %
GAMING         28            1             4 %
ETFS           65            2             3 %
BIOTECH        387           9             2 %
OILGAS         144           1             1 %
---------------------------------------------------
NO NEW HIGHS:
BIGMIL  HACKERS  INFRA   COMPUTER  COAL   GOLD   REIT
EDU  PIPELINE   COMODITY  FOOD  BONDFUND   HOSPITAL   JETS
|
 |
Table 4 RANKING OF KEY DIRECTORIES BASED PCT.OF STOCKS ABOVE 65-DMA
10/26/17
Bullish = 38
Bearish = 7
---------------------------------------------------------------------------------------
Directory Current day-1 day-2 day-3 day-4 day-5
----------------------------------------------------------------------------------------
BIGBANKS 1 1 1 1 1 1
REGBANKS .939 .909 .939 .939 .969 .939
DJI-13 .923 .846 .846 .846 .846 .846
INFRA .909 .818 .818 .818 1 .818
AUTO .897 .794 .923 .923 .897 .897
HOMEBLDG .882 .823 .823 .823 .823 .823
COAL .875 .875 .75 .75 .75 .875
DOWJONES .866 .833 .8 .8 .833 .8
CHEM .846 .83 .784 .769 .846 .83
BIGMIL .833 1 1 1 1 1
FINANCE .826 .858 .847 .815 .891 .815
SOFTWARE .818 .803 .818 .803 .803 .742
GREEN .806 .741 .806 .838 .838 .806
MILITARY .789 .815 .815 .815 .868 .842
INSURANC .781 .75 .781 .812 .812 .781
SP-100 .75 .75 .76 .75 .812 .802
INDMATER .739 .76 .782 .771 .793 .793
SEMI .738 .738 .761 .738 .707 .707
NIFTY .733 .766 .8 .733 .8 .833
ELECTRON .727 .738 .761 .75 .722 .716
SOLAR .714 .666 .761 .761 .666 .666
TRANSP .7 .7 .8 .75 .9 .8
SP500 .686 .696 .727 .729 .762 .731
INDEXES .683 .716 .75 .754 .745 .75
MORNSTAR .68 .71 .747 .731 .768 .76
ETFS .676 .753 .8 .8 .846 .846
NASD-100 .67 .681 .704 .704 .738 .75
RUS-1000 .665 .654 .686 .69 .728 .714
HACKERS .64 .64 .72 .76 .76 .64
COMPUTER .608 .565 .652 .608 .565 .521
GAMING .607 .607 .642 .642 .642 .571
UTILITY .604 .581 .697 .697 .72 .767
CHINA .593 .625 .687 .671 .687 .703
EDU .571 .571 .571 .571 .571 .571
COMODITY .528 .571 .557 .571 .528 .585
OILGAS .513 .5 .534 .541 .604 .597
RETAIL .509 .509 .49 .472 .527 .381
N=37
==============================================================================================
BEVERAGE .5 .55 .55 .55 .55 .55
==============================================================================================
BIOTECH .48 .547 .568 .607 .635 .63
FOOD .466 .533 .466 .4 .4 .466
REIT .314 .393 .455 .511 .556 .651
HOSPITAL .25 .625 .75 .75 .75 .75
JETS .222 .333 .555 .222 .555 .333
GOLD .14 .14 .16 .26 .28 .32
BONDFUND .026 .071 .151 .205 .25 .375
PIPELINE 0 0 0 0 0 0
N=8
|
==================================================================================


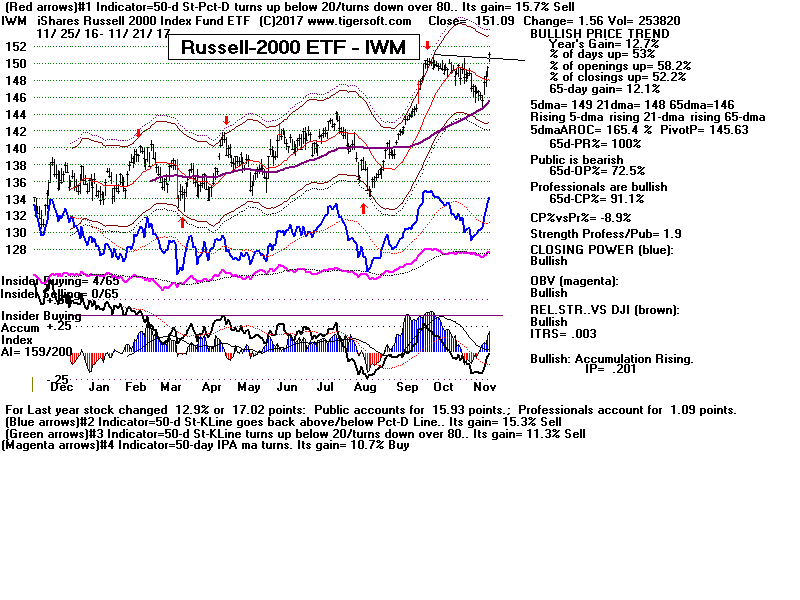
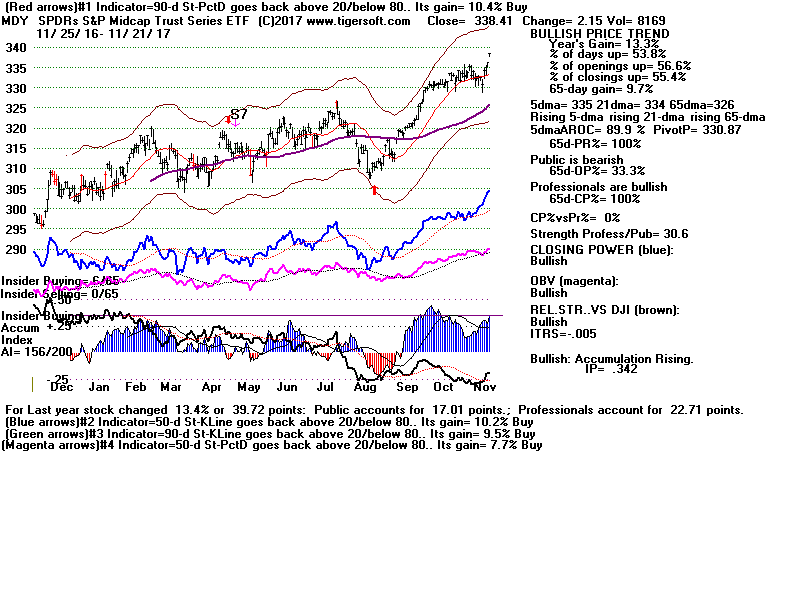
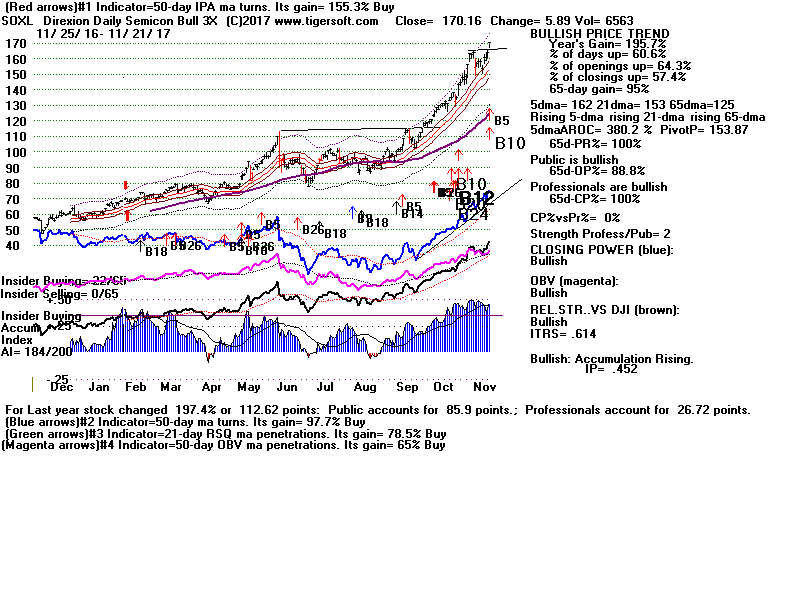
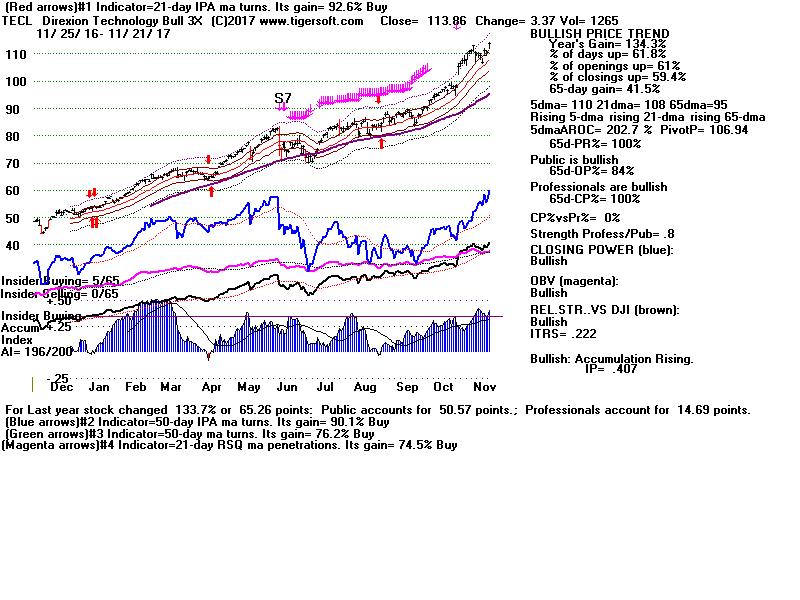
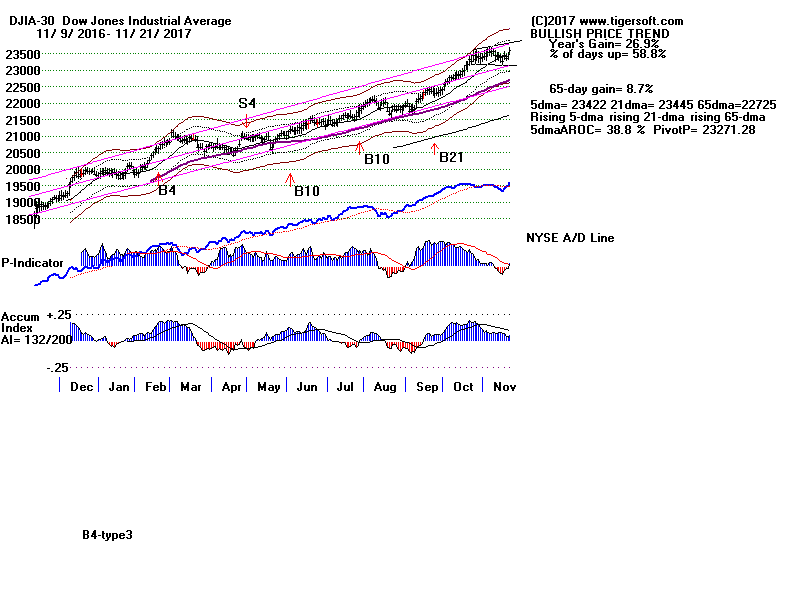
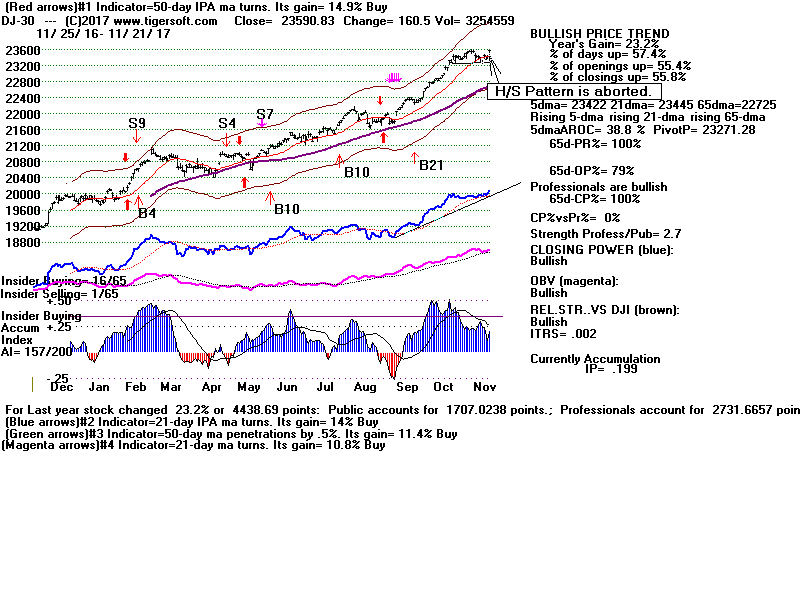
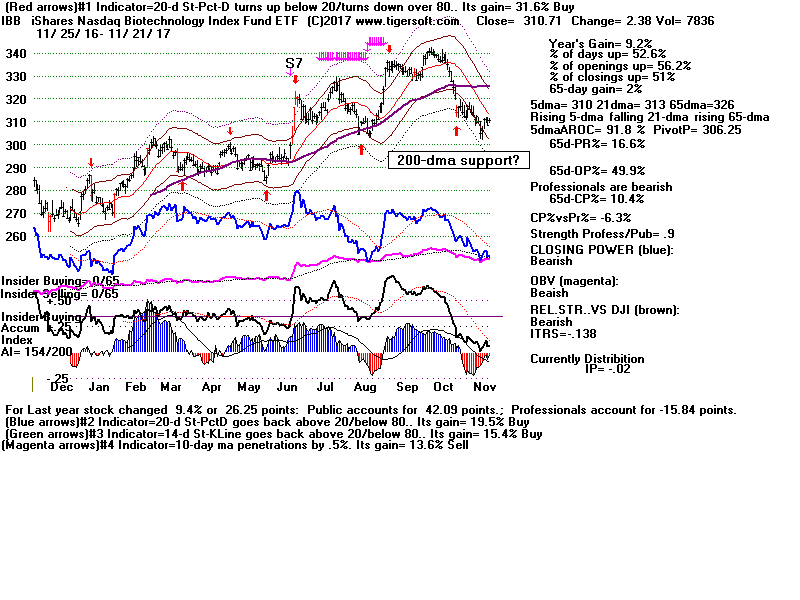
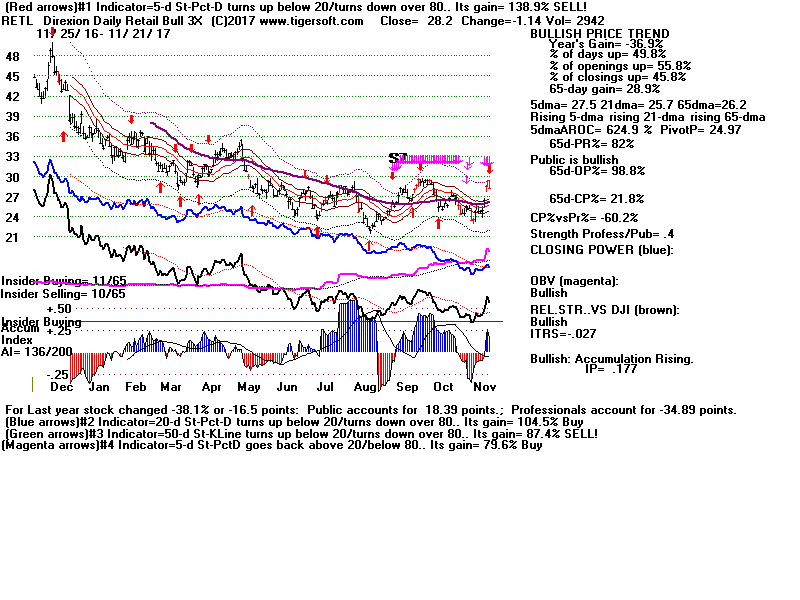
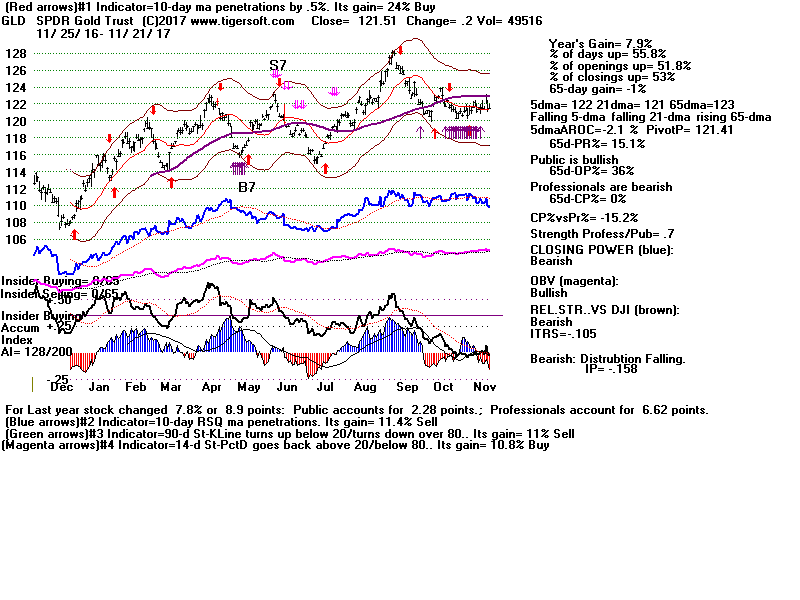
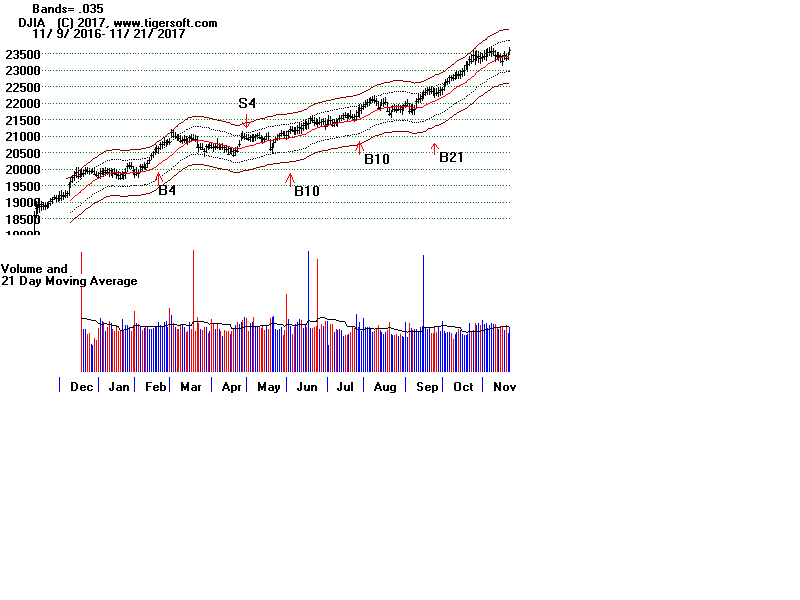
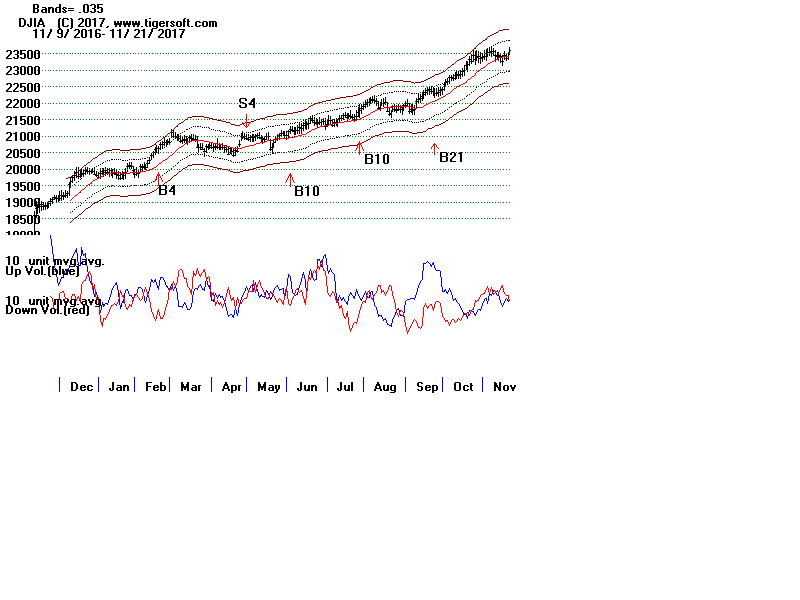
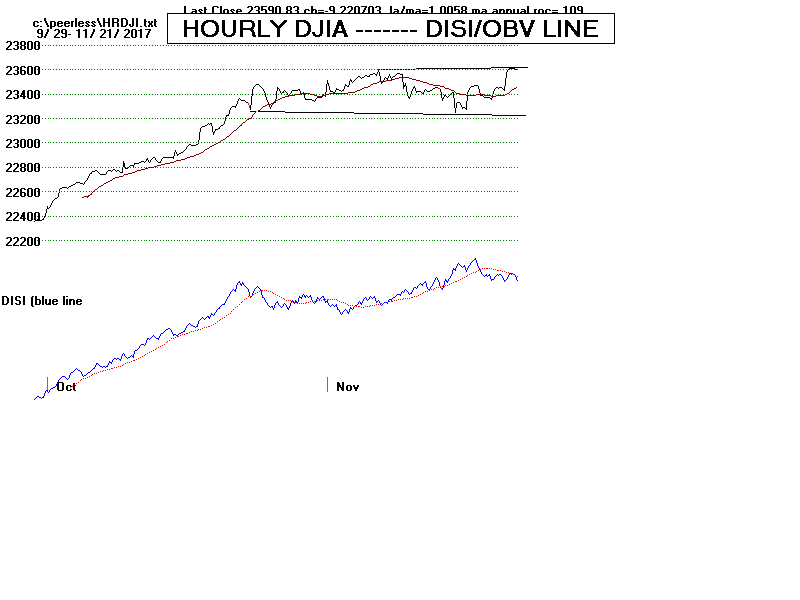
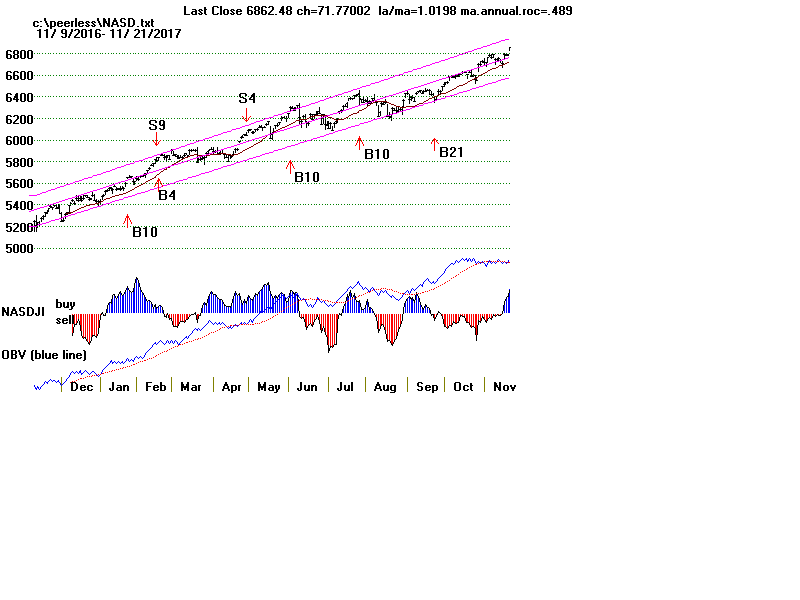
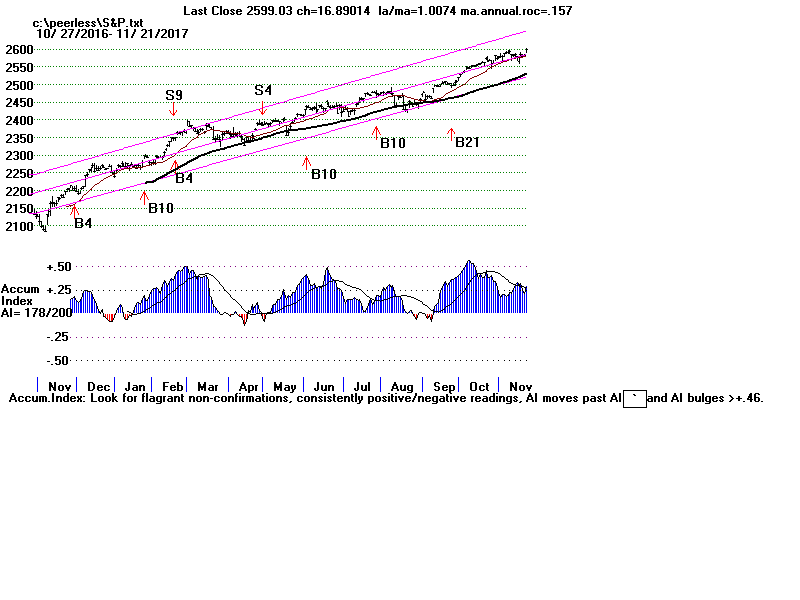
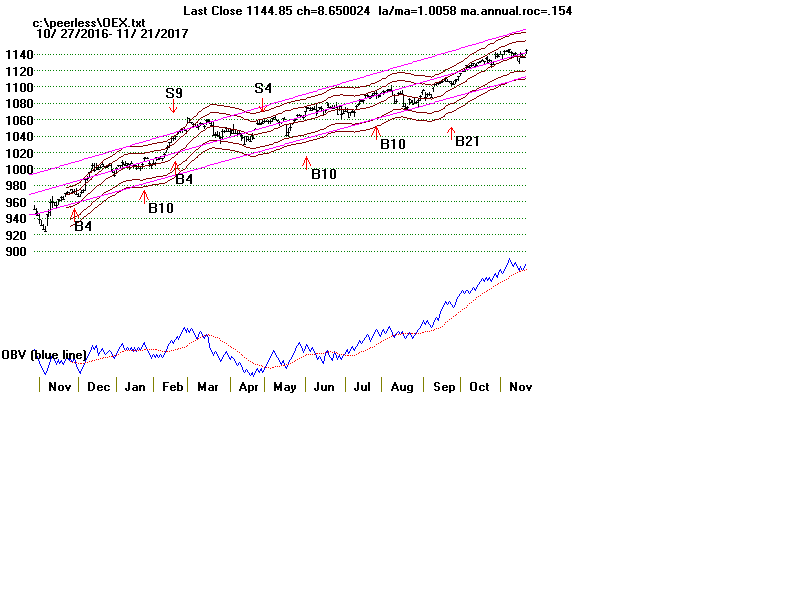
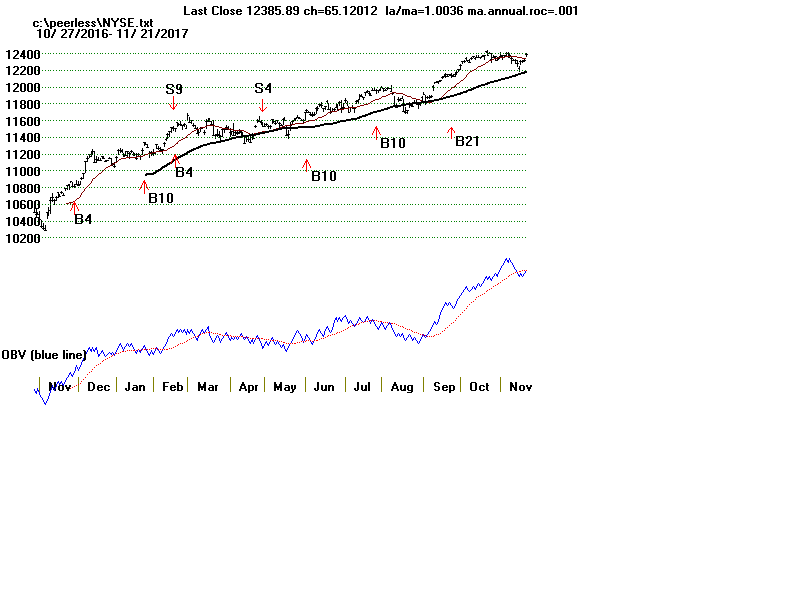
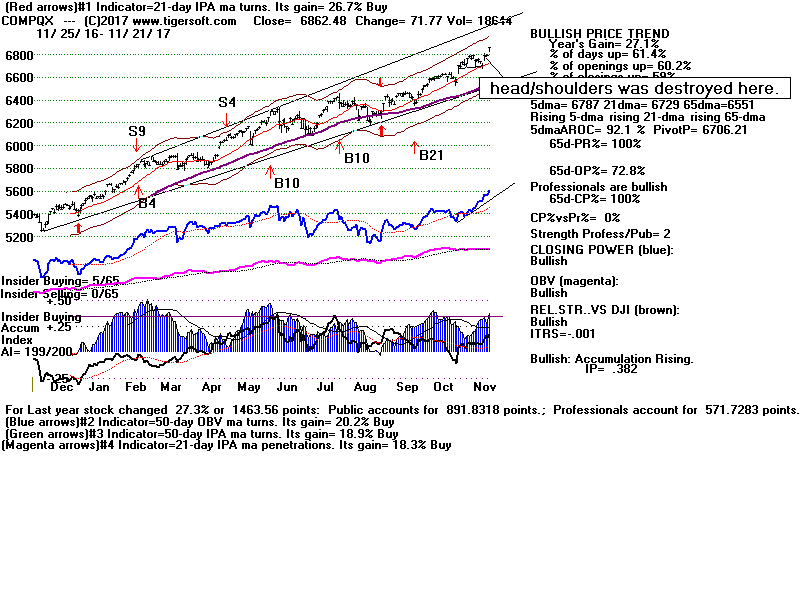
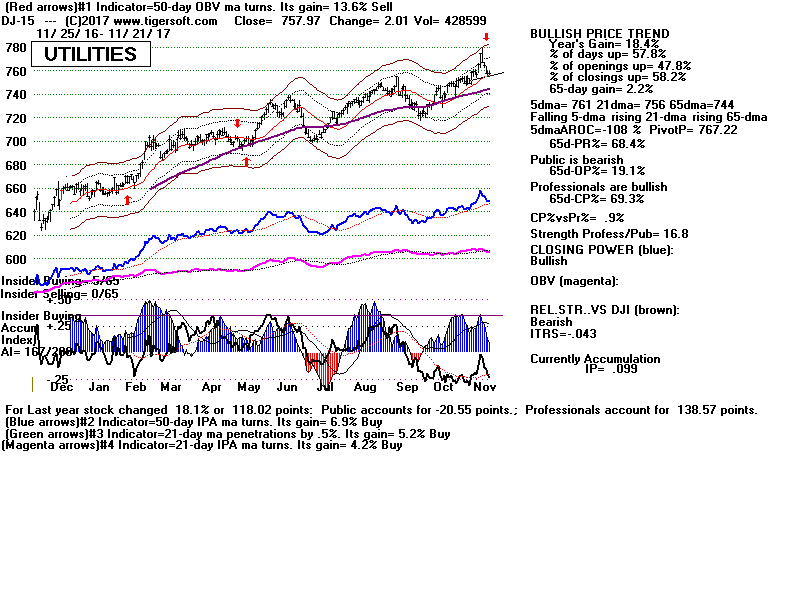
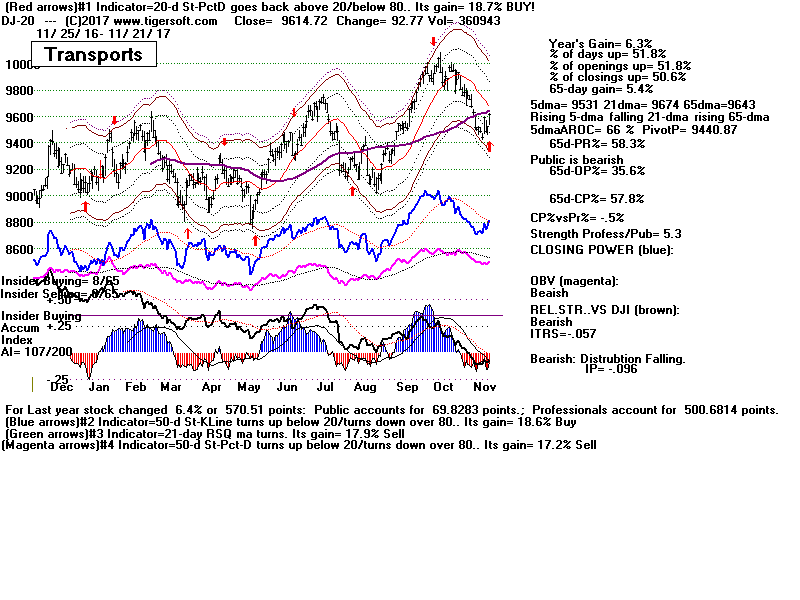
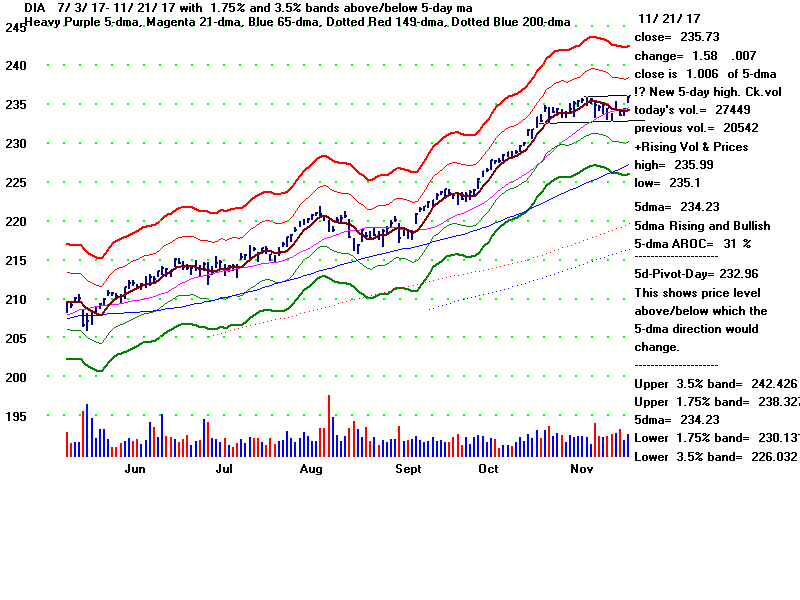
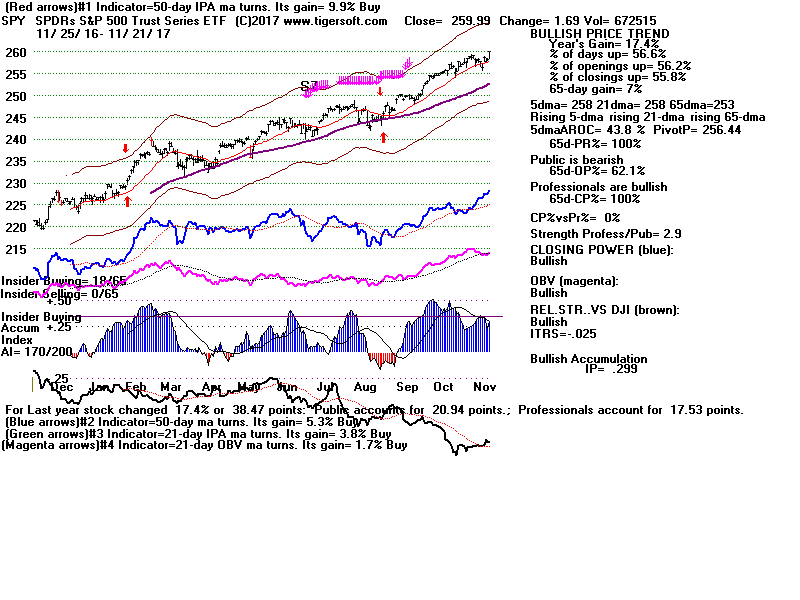
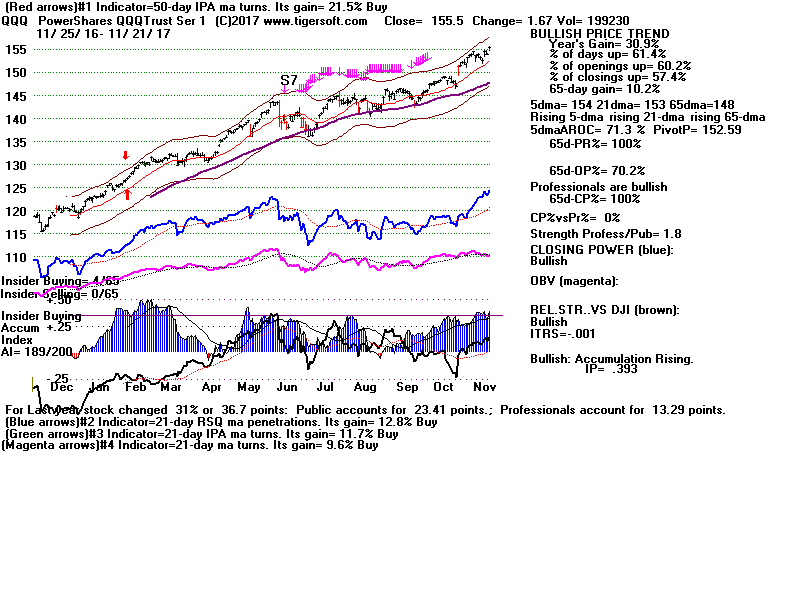
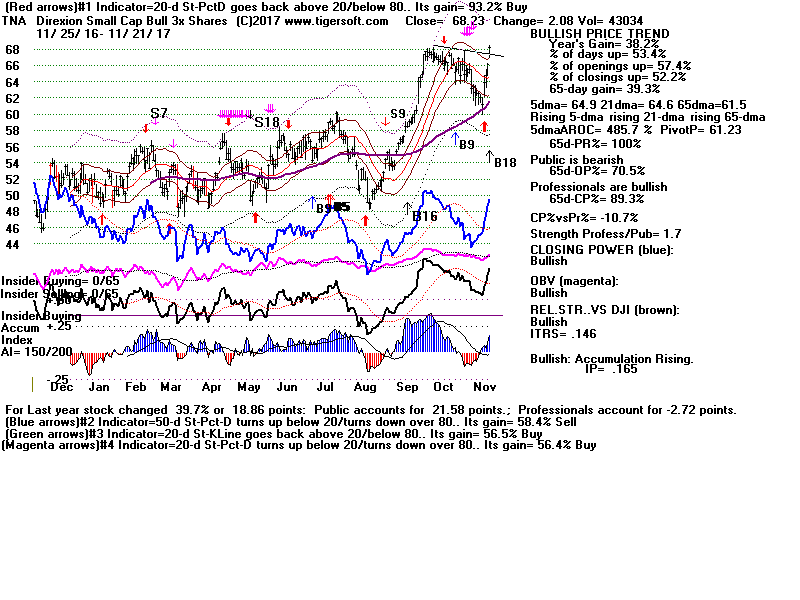
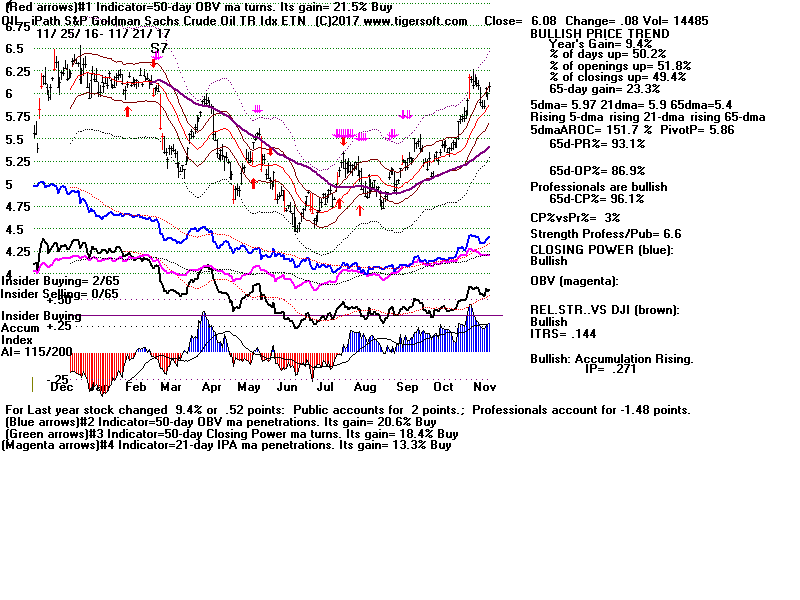
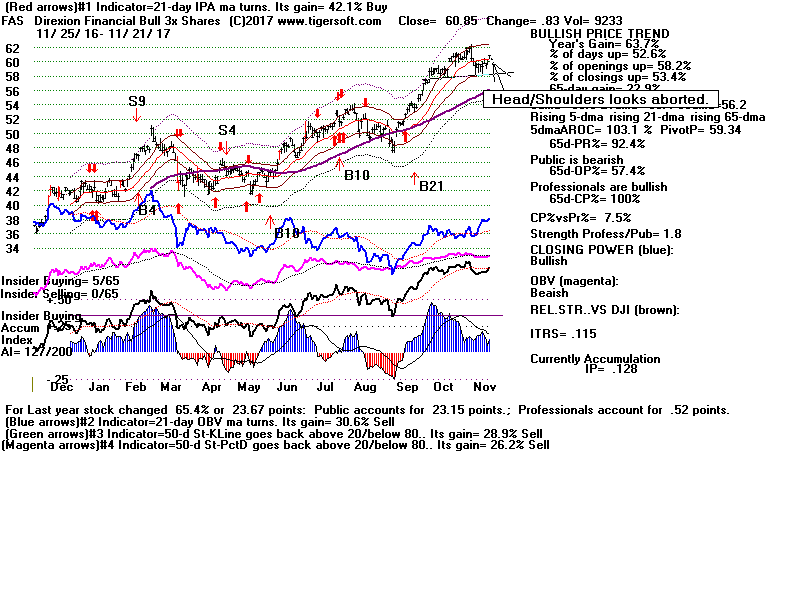
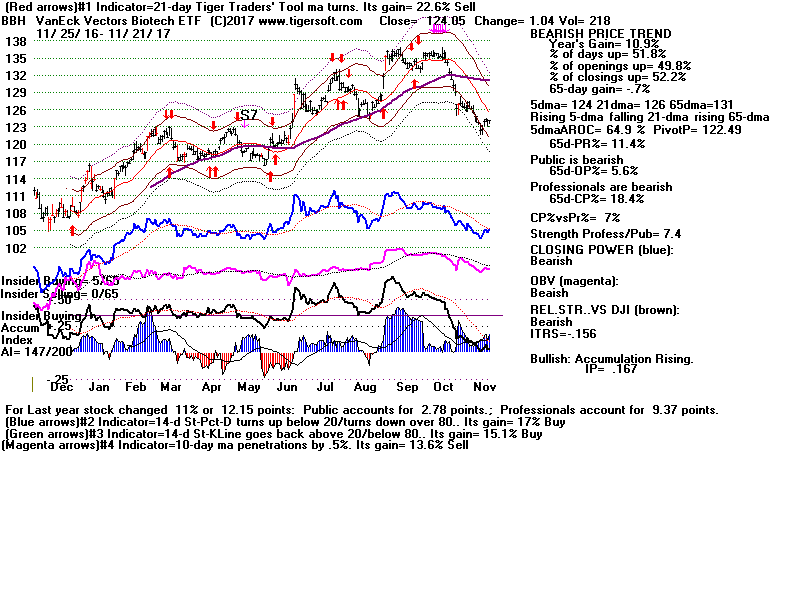
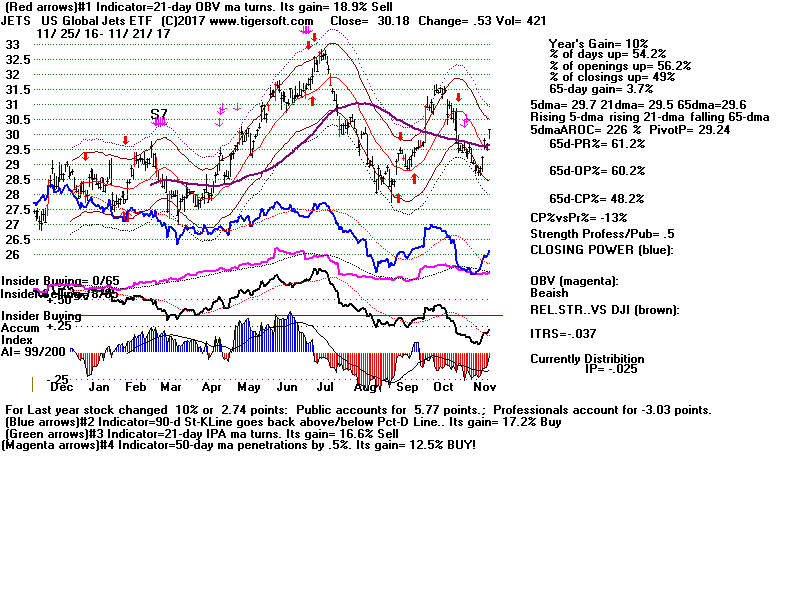
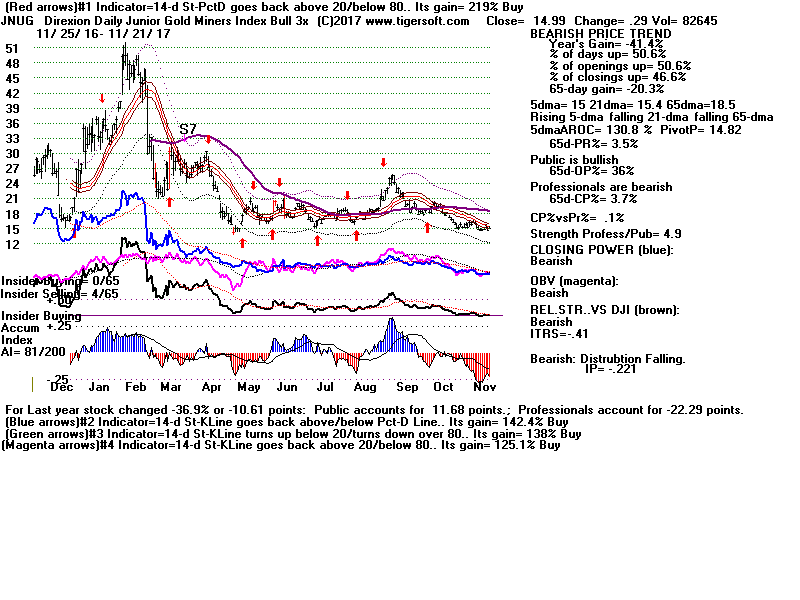
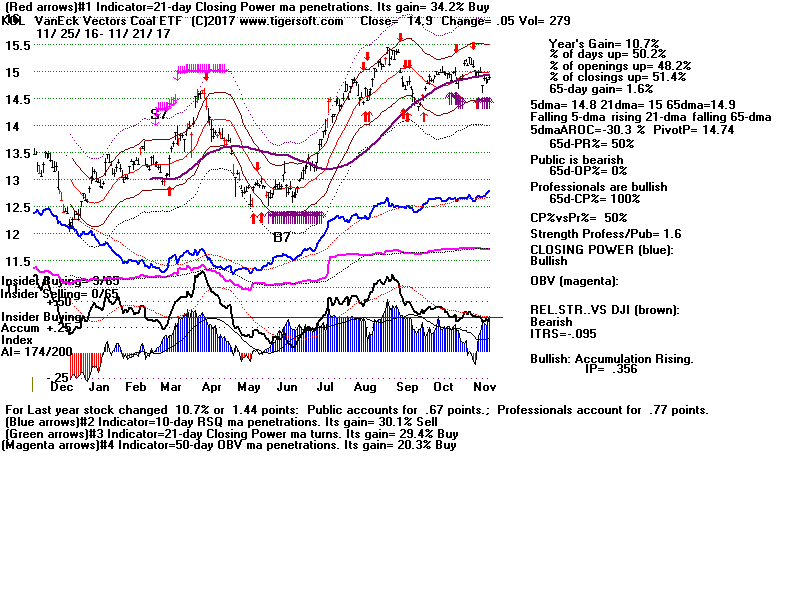
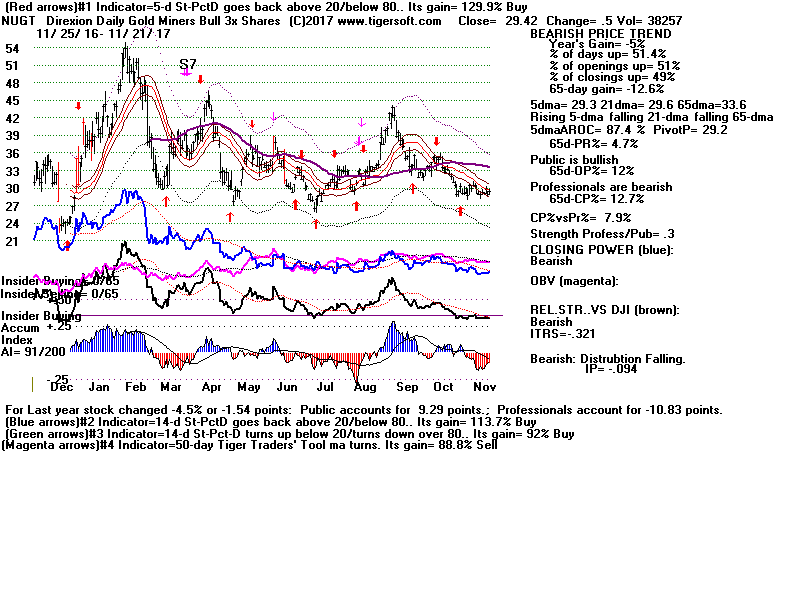
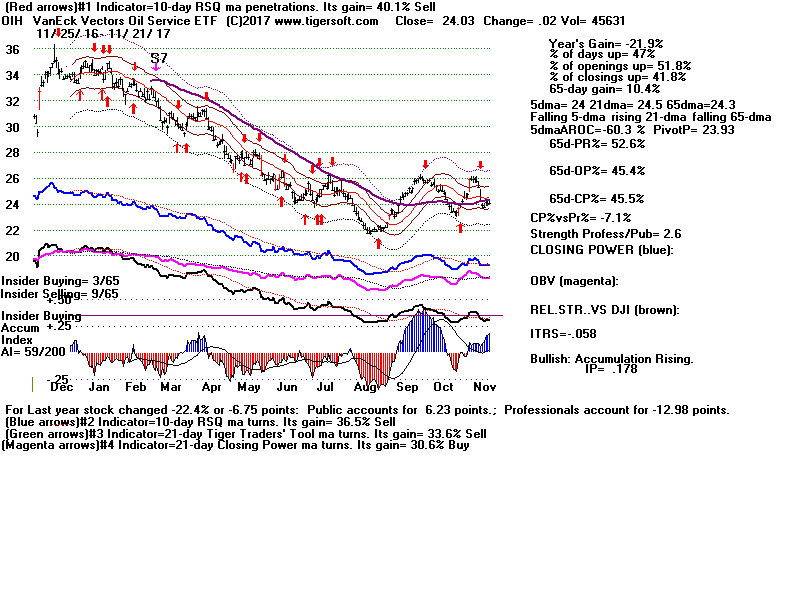
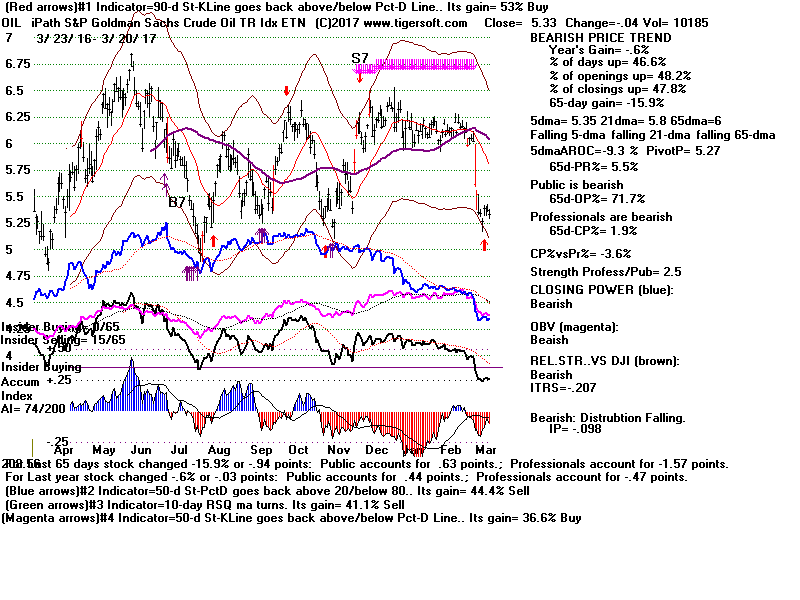
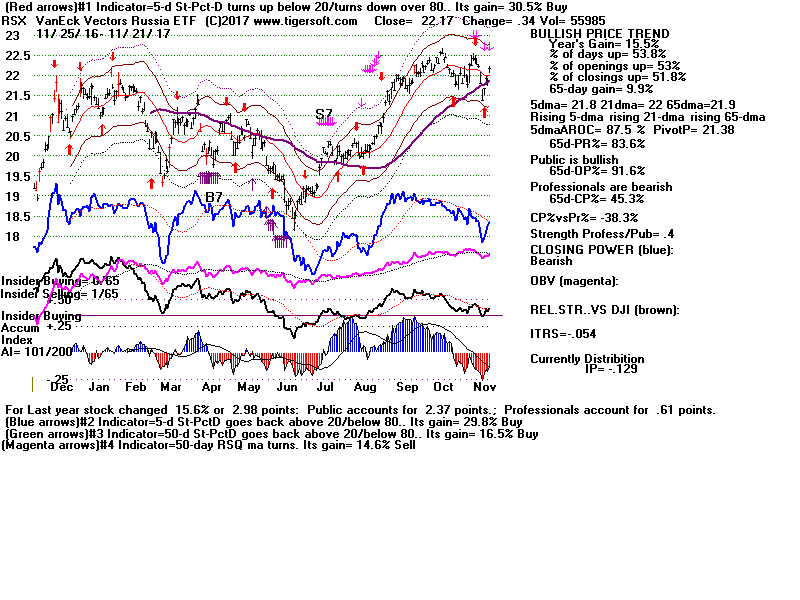
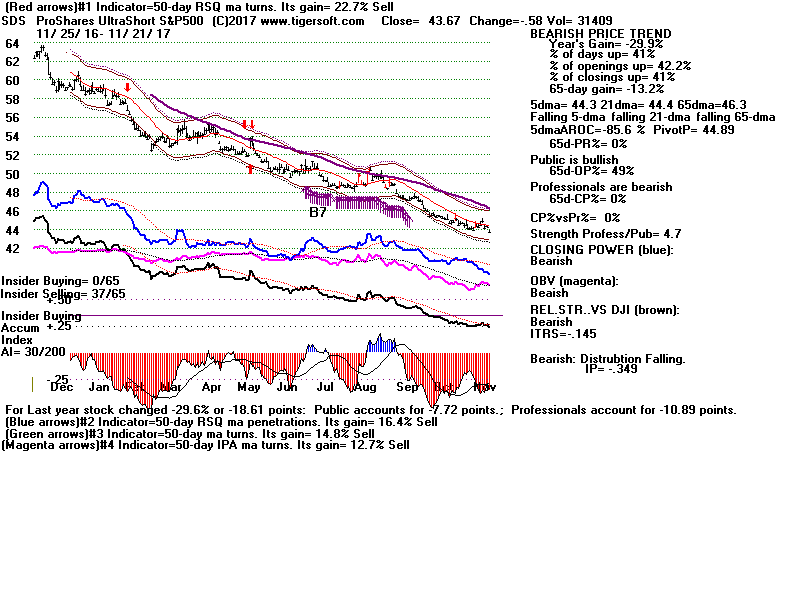
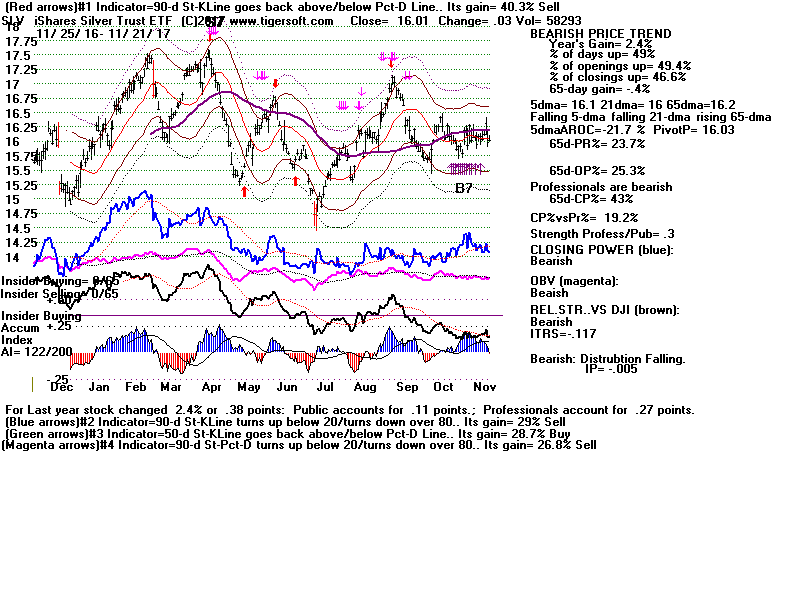
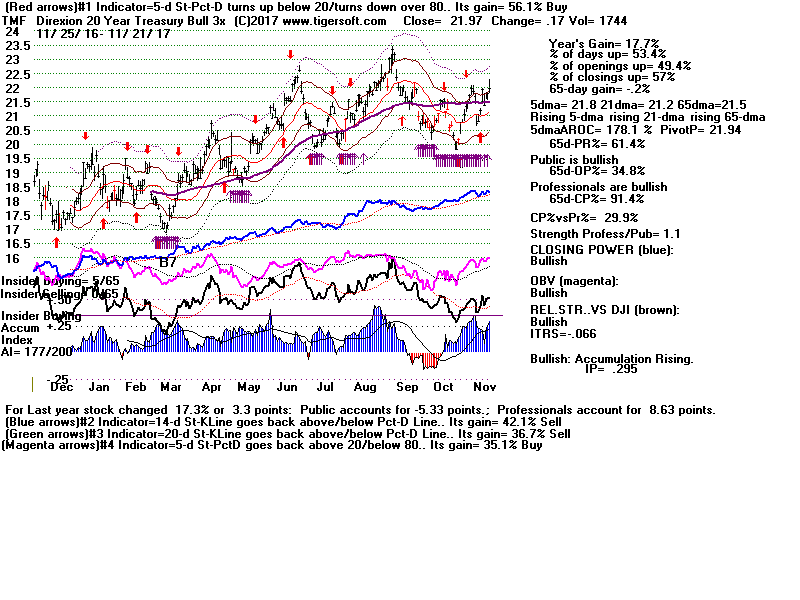
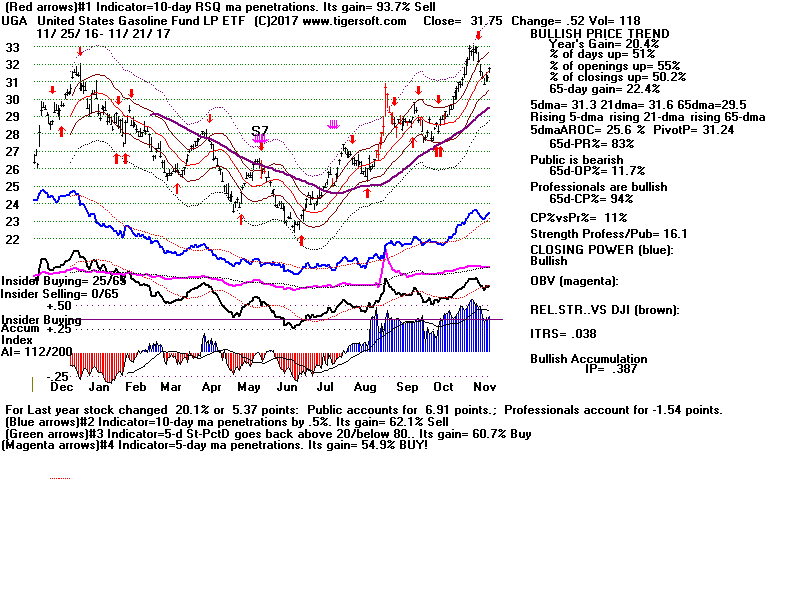
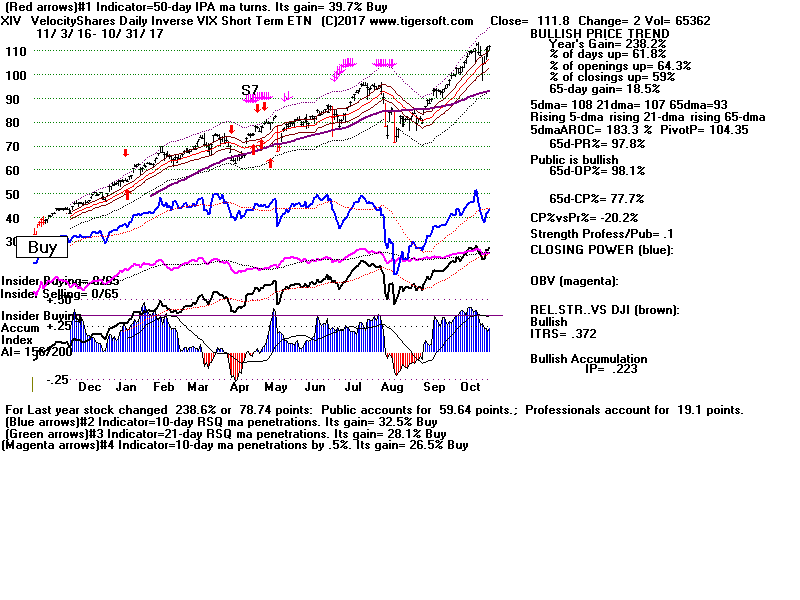
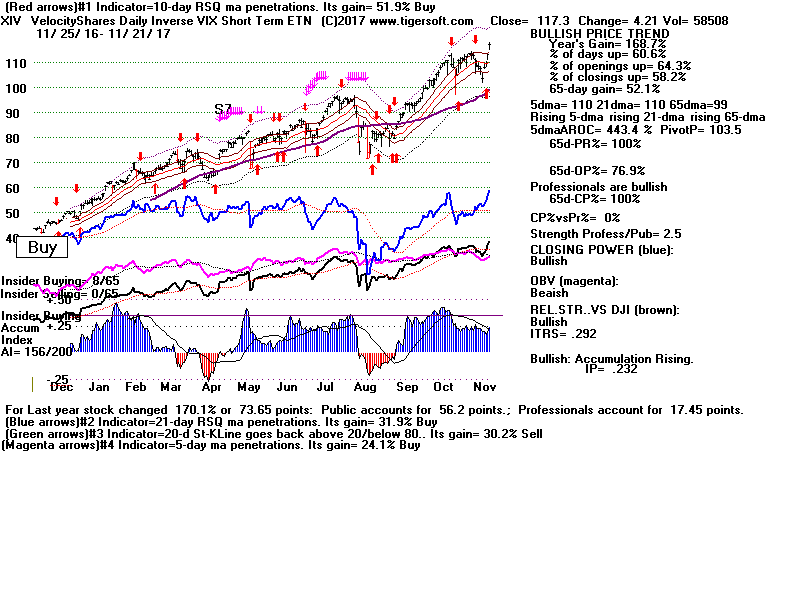
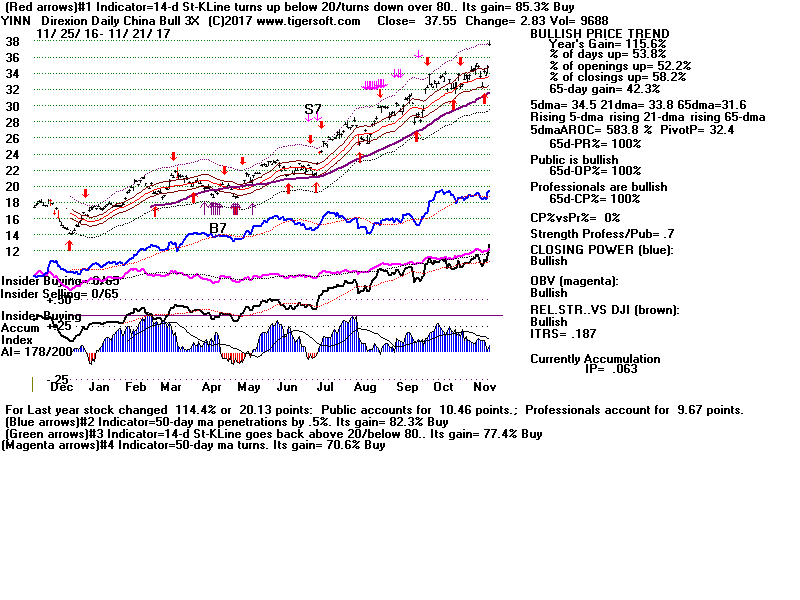
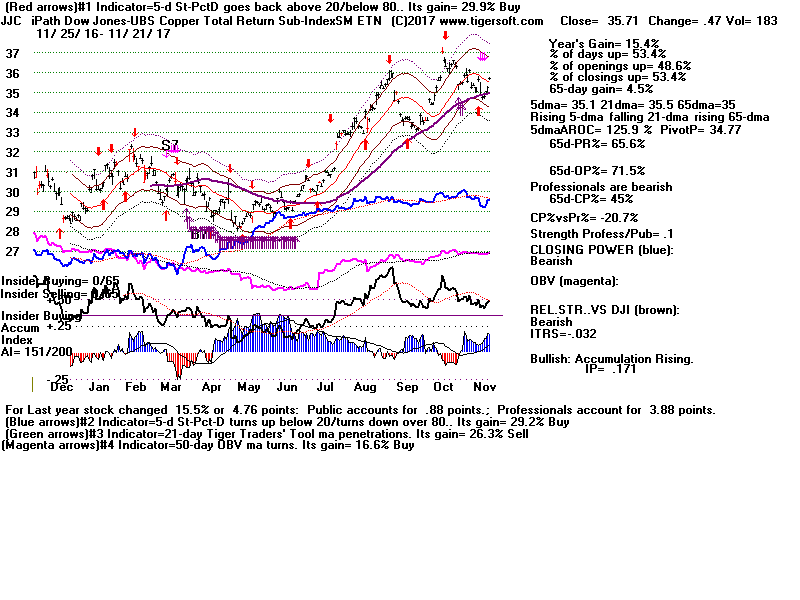
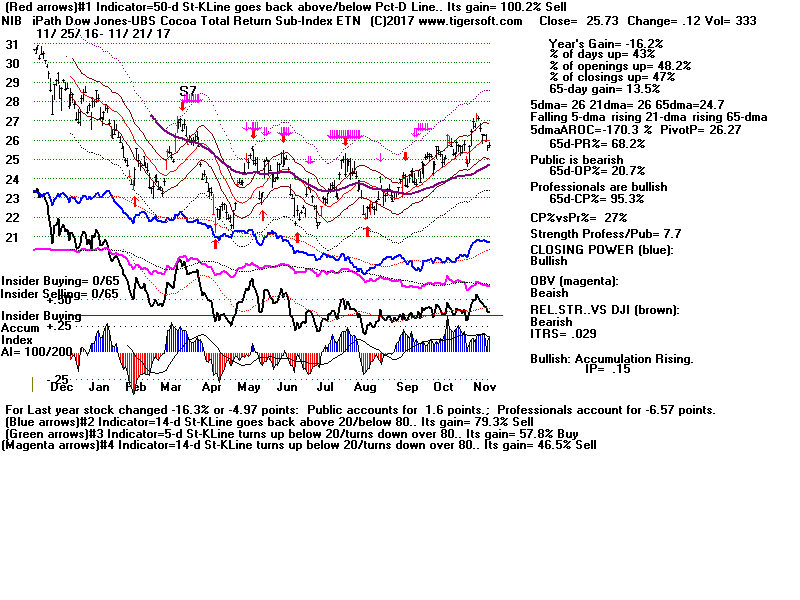
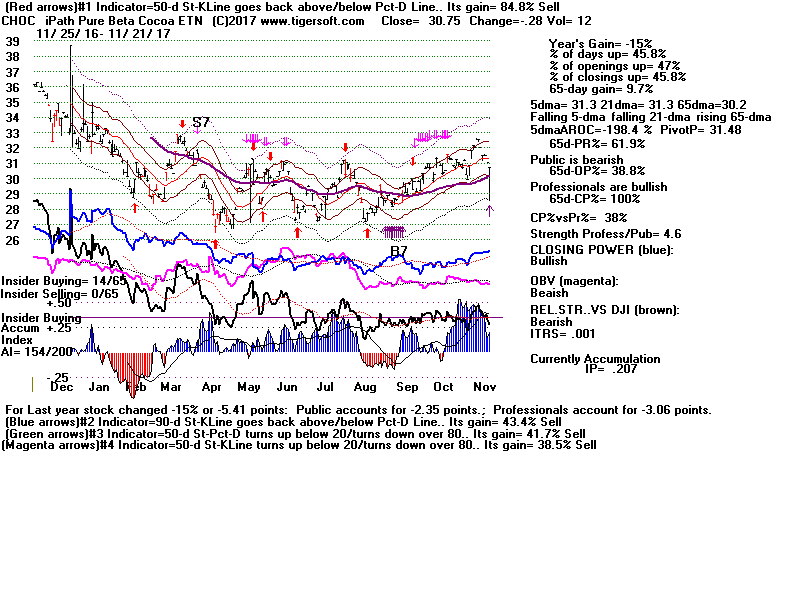
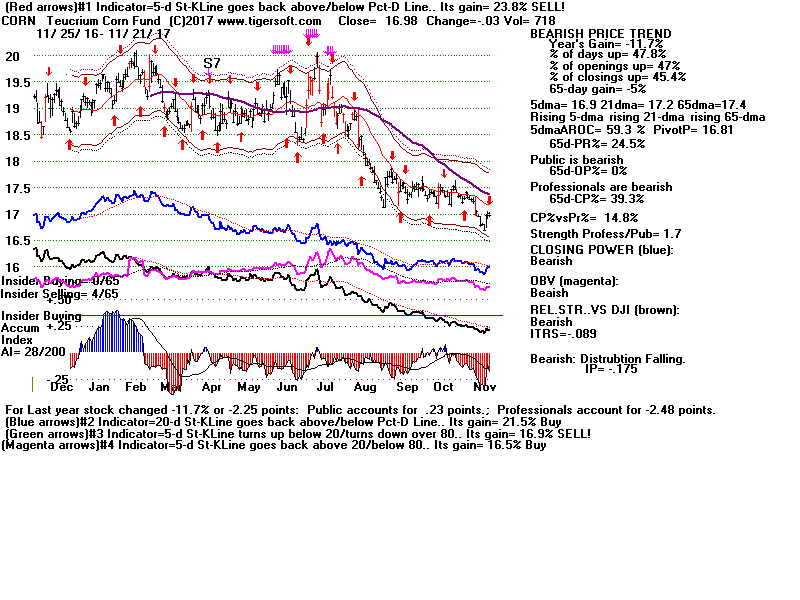
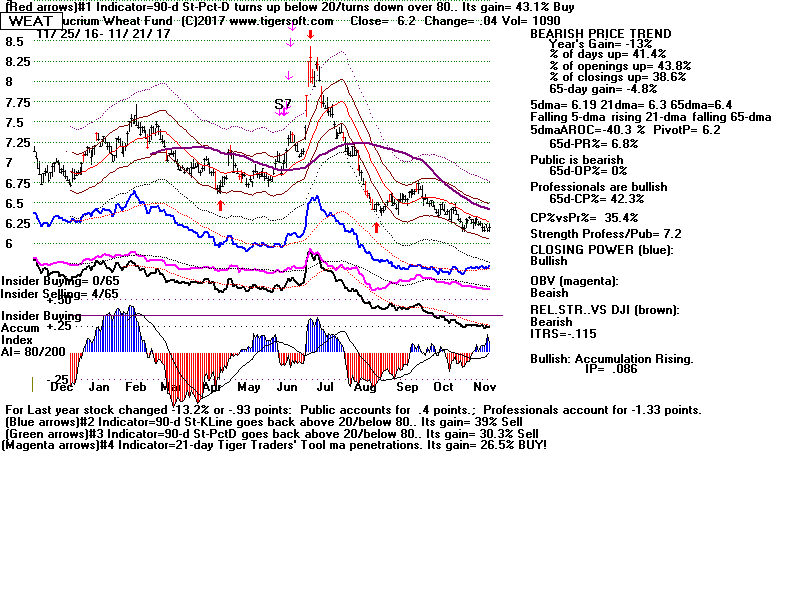
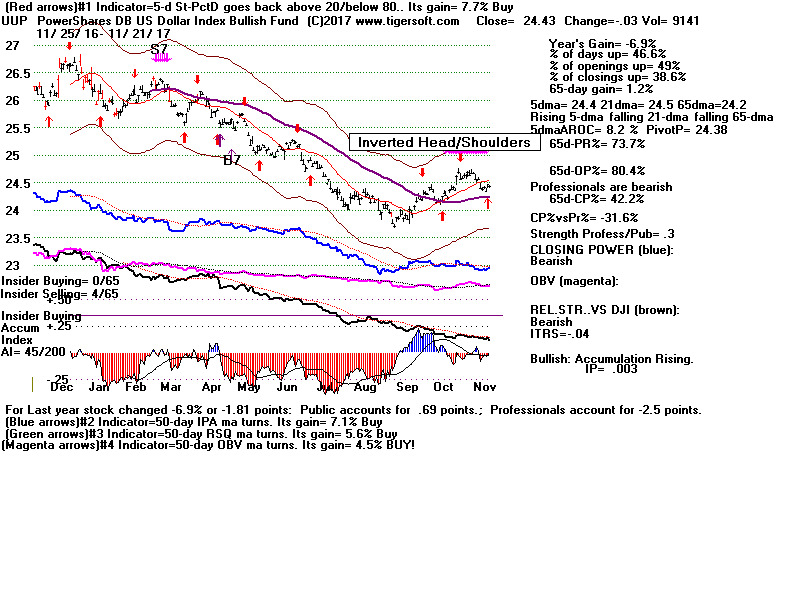
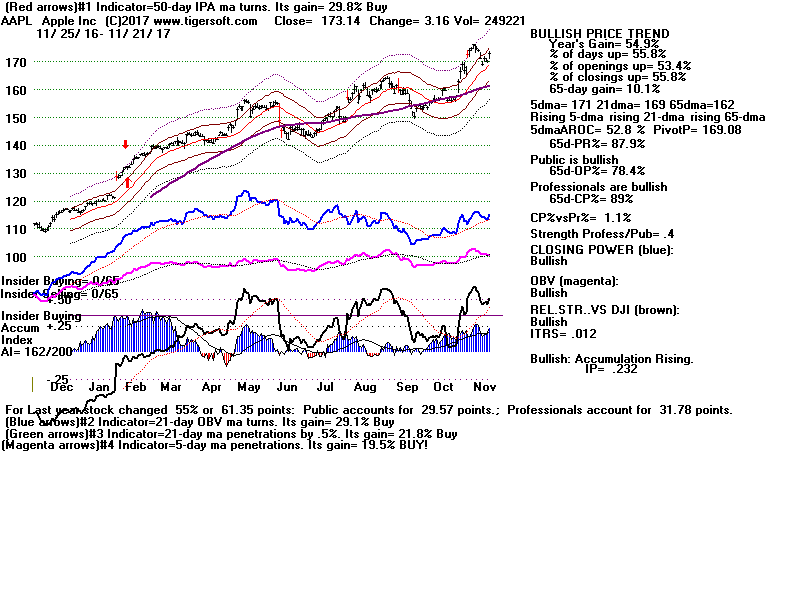
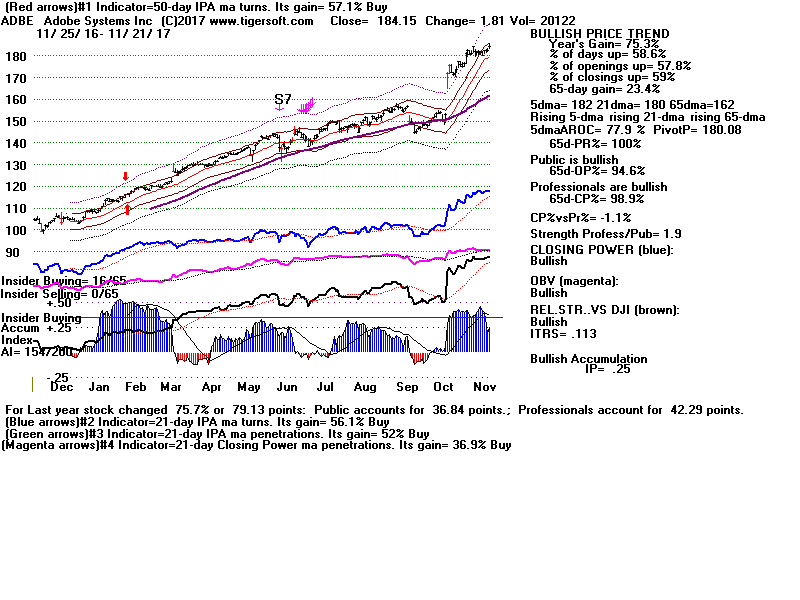
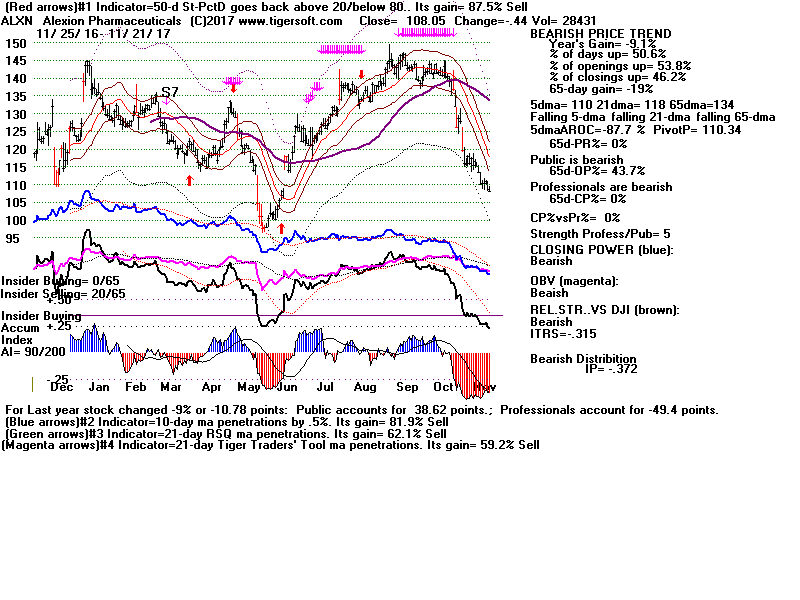
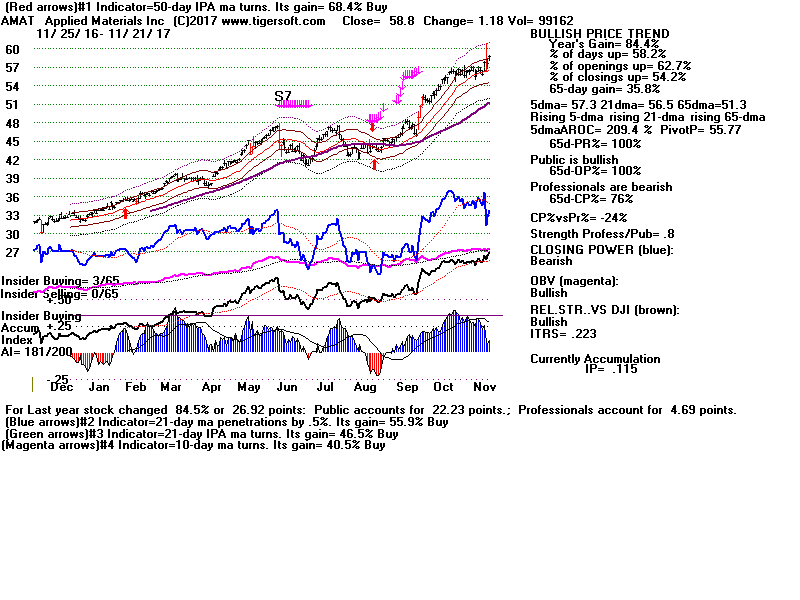
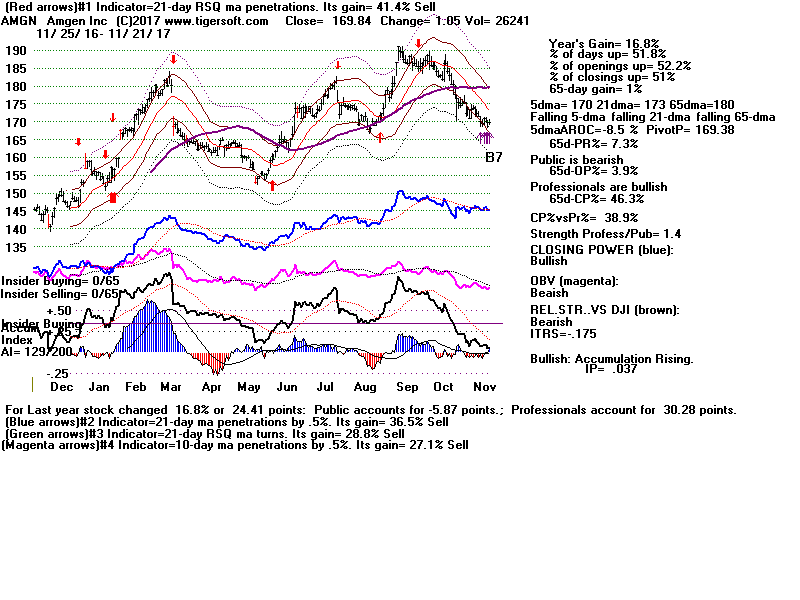
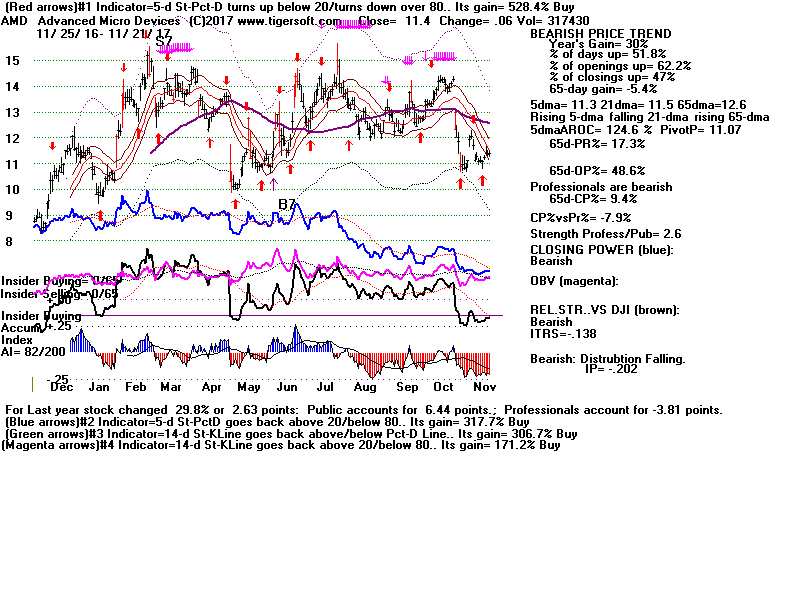
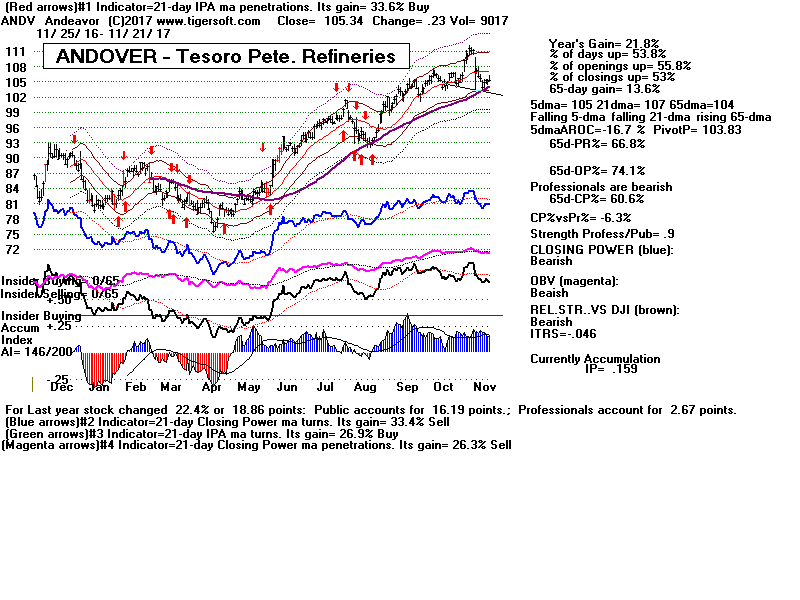
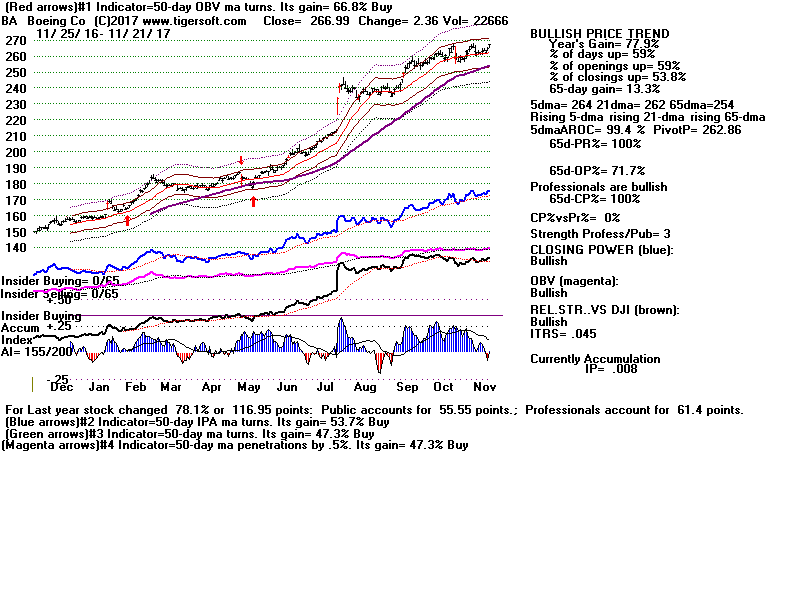
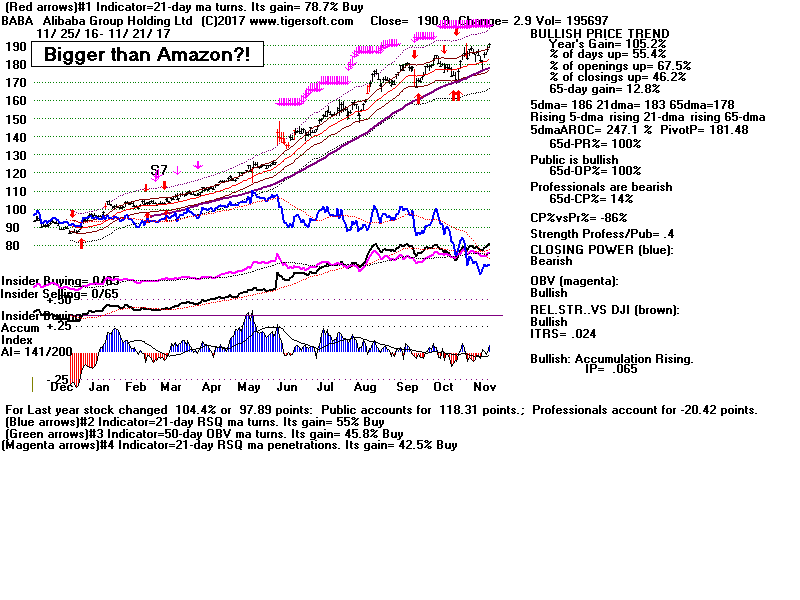
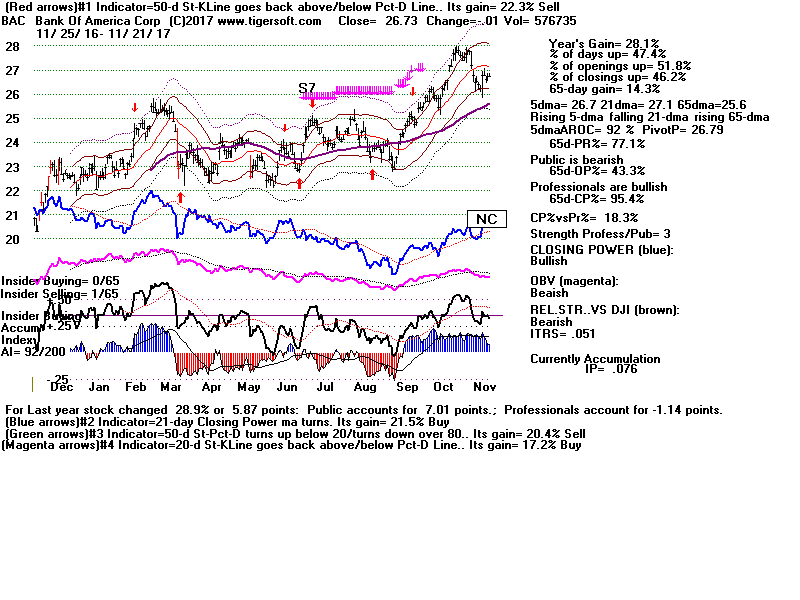
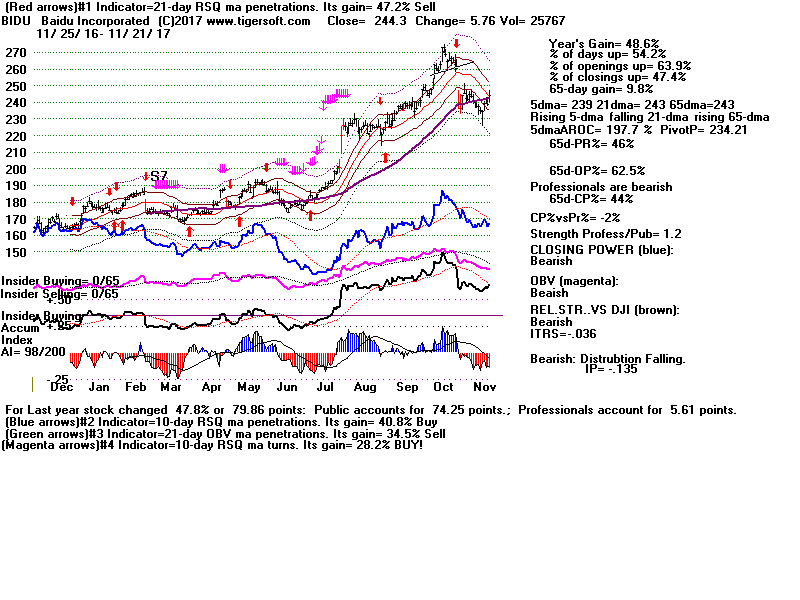
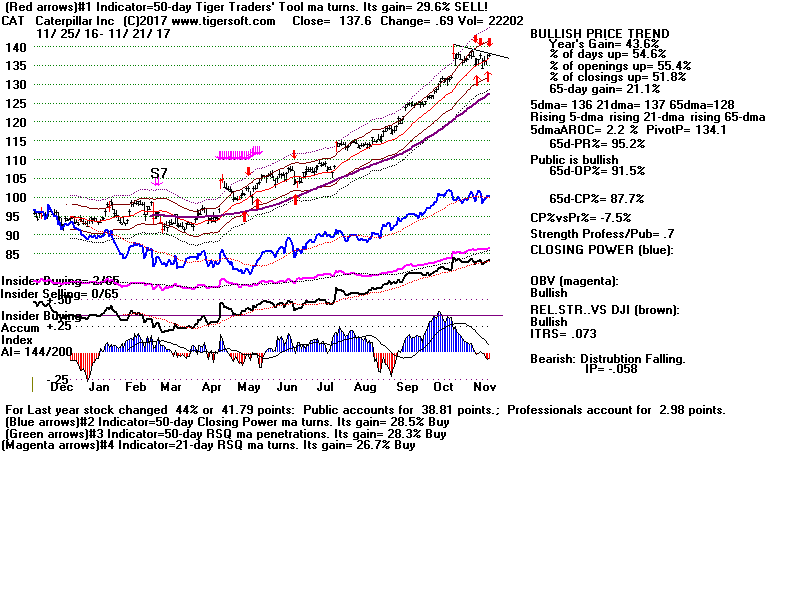
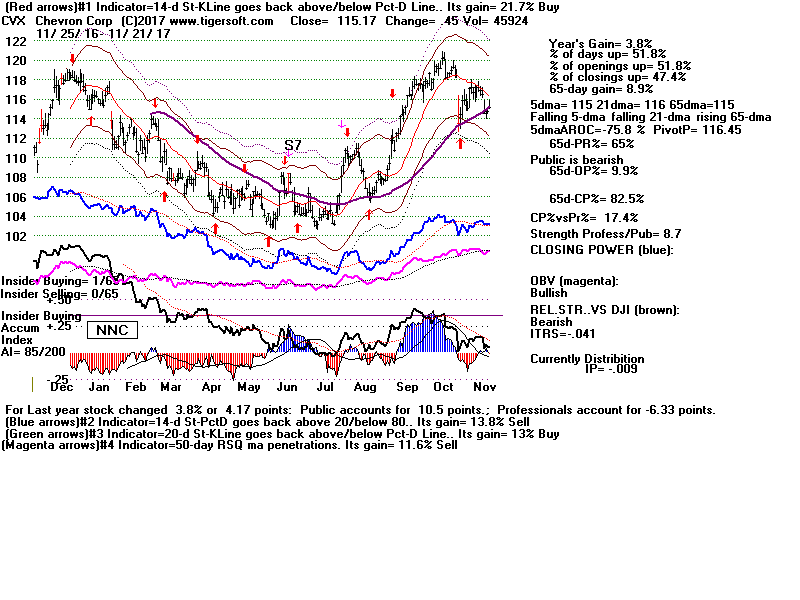
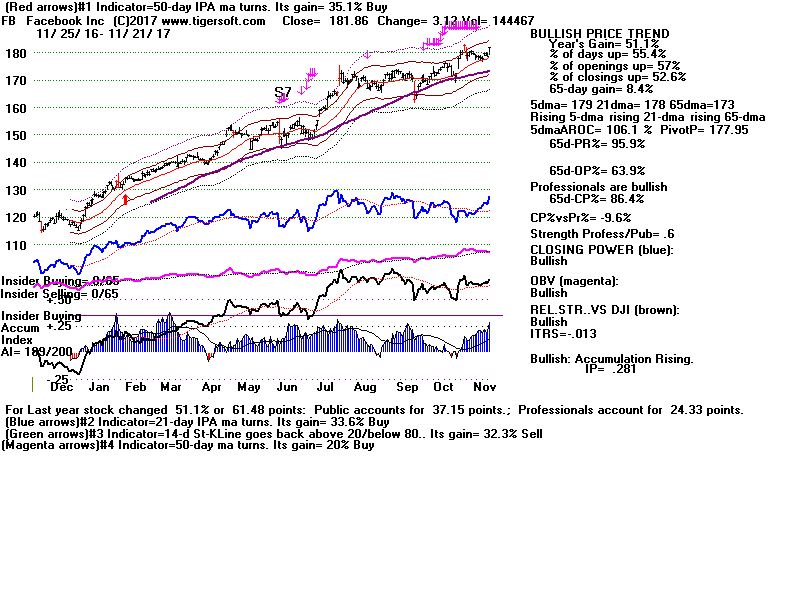
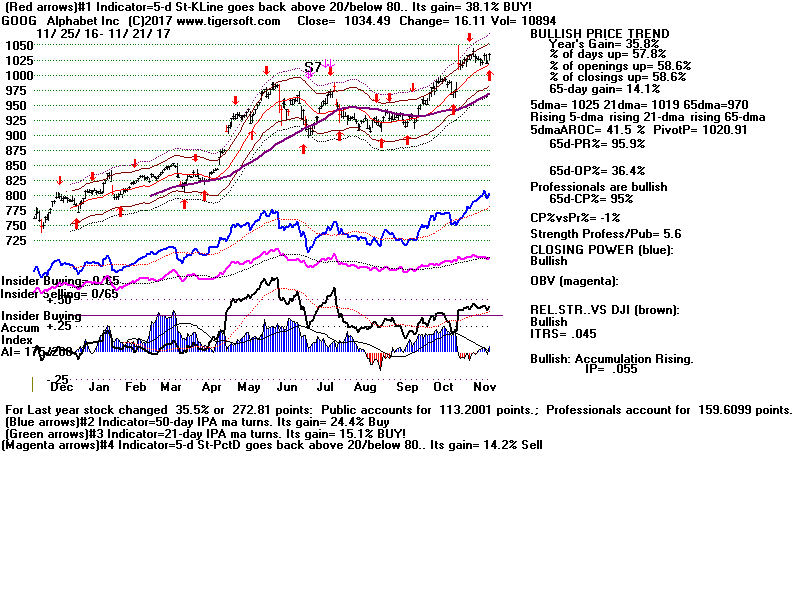
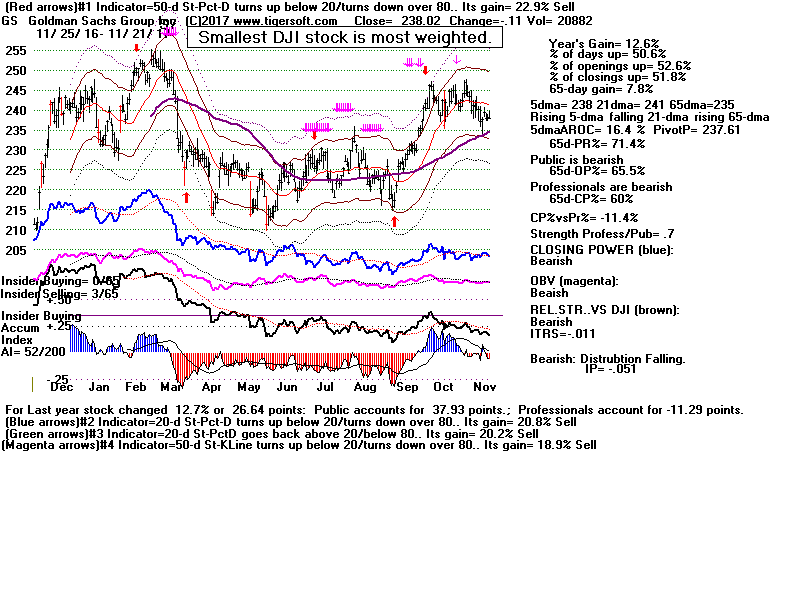
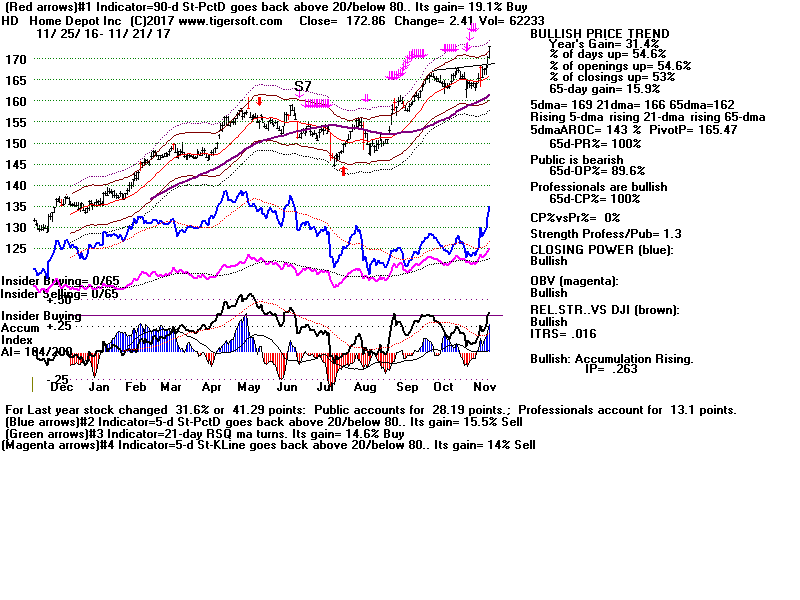
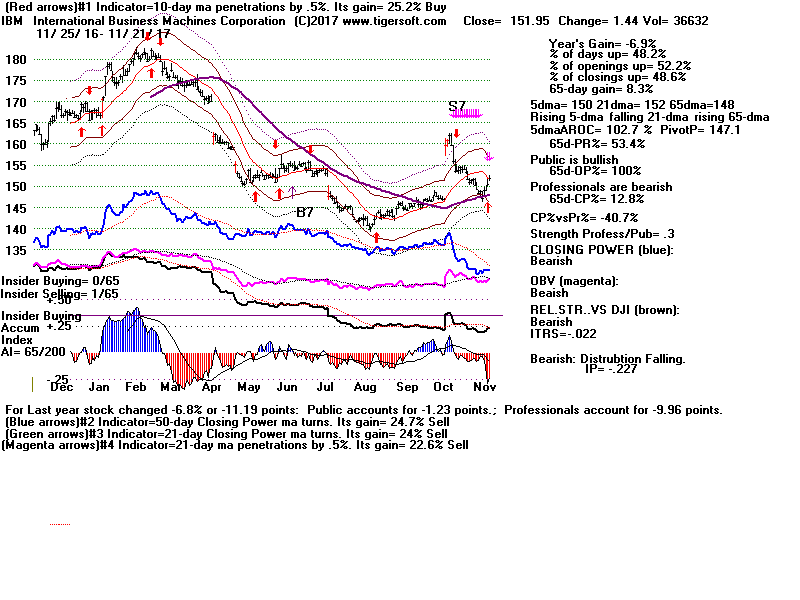
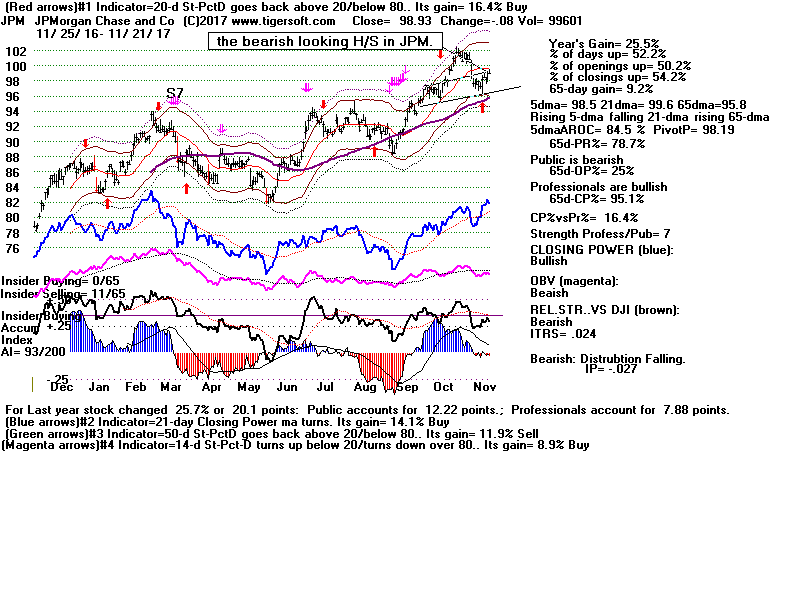
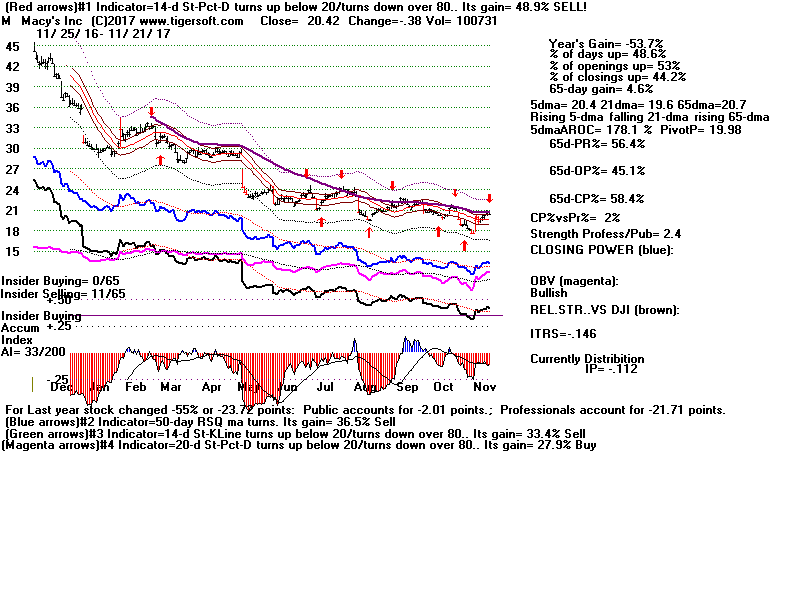
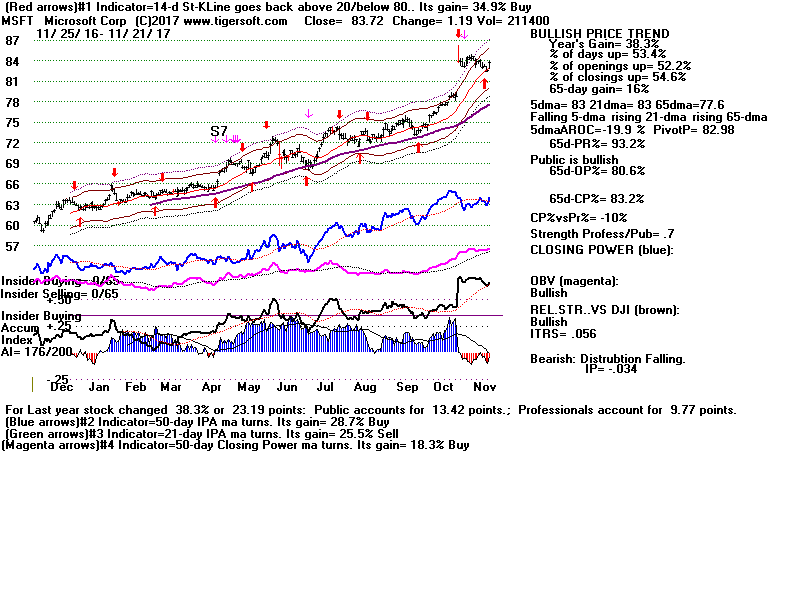
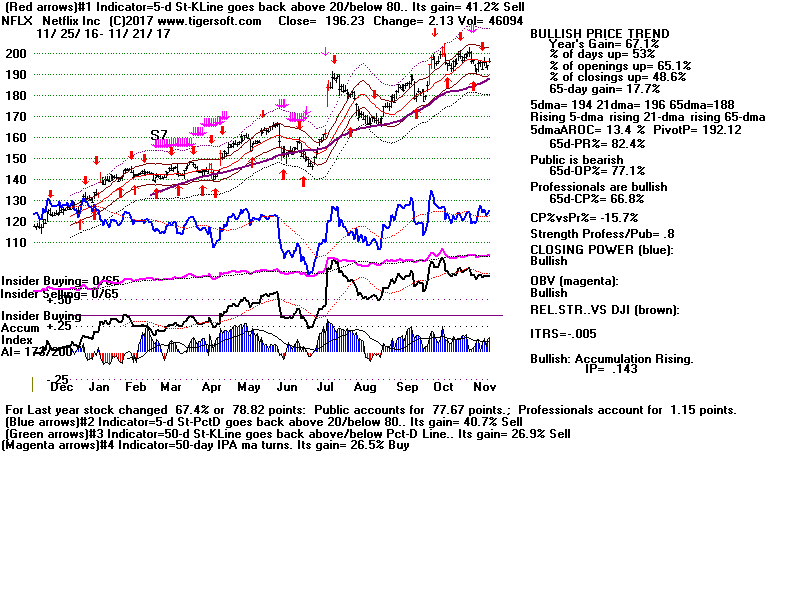
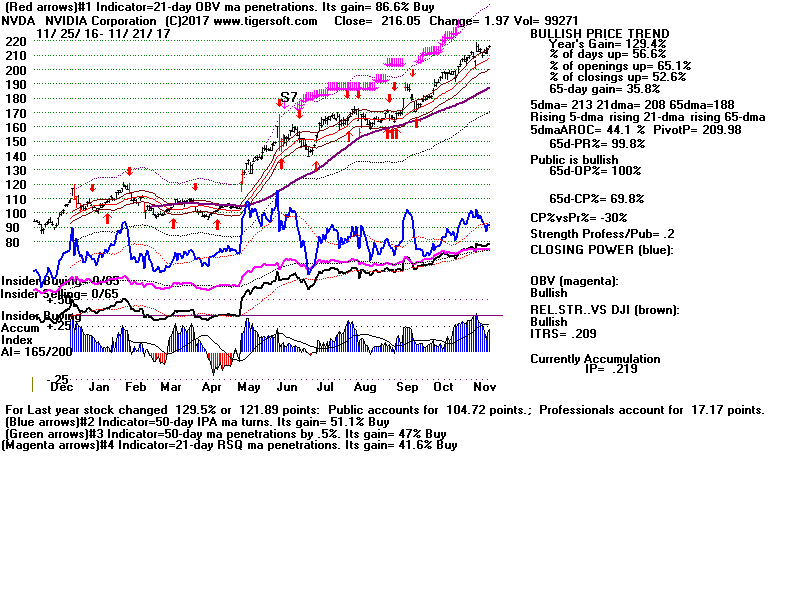
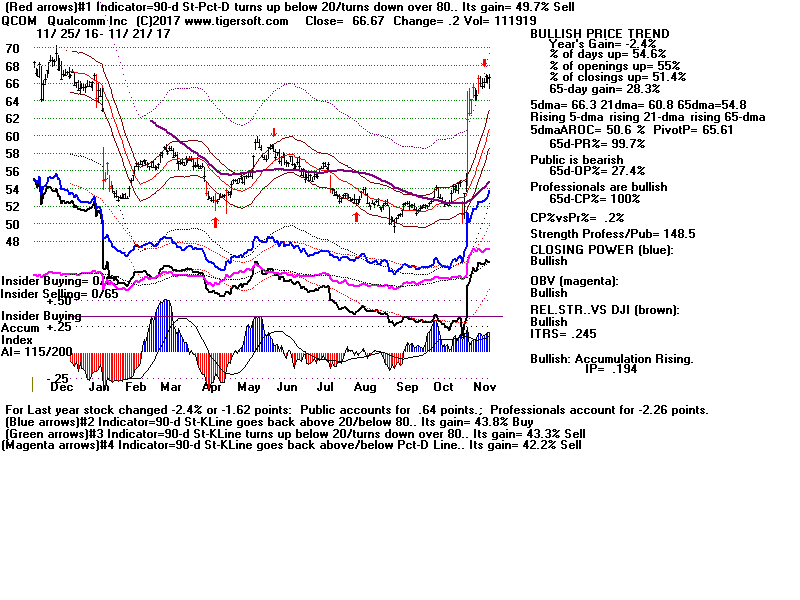
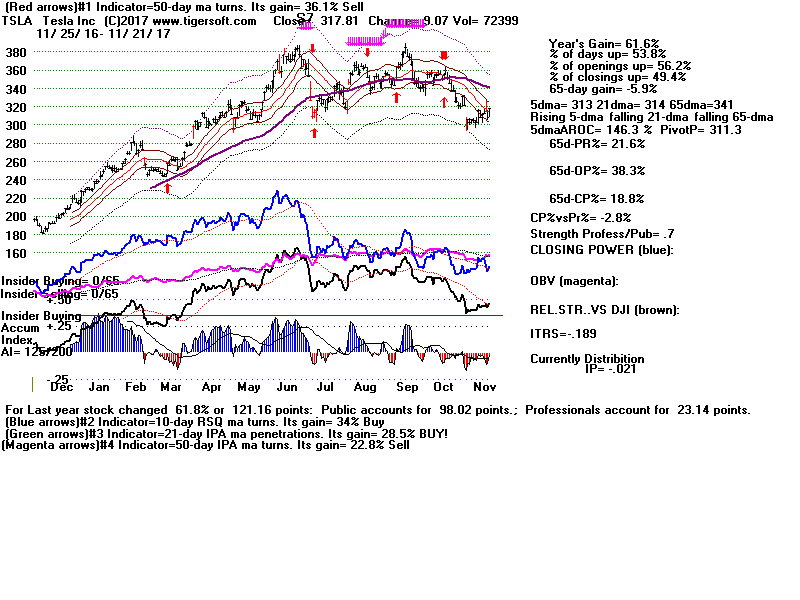
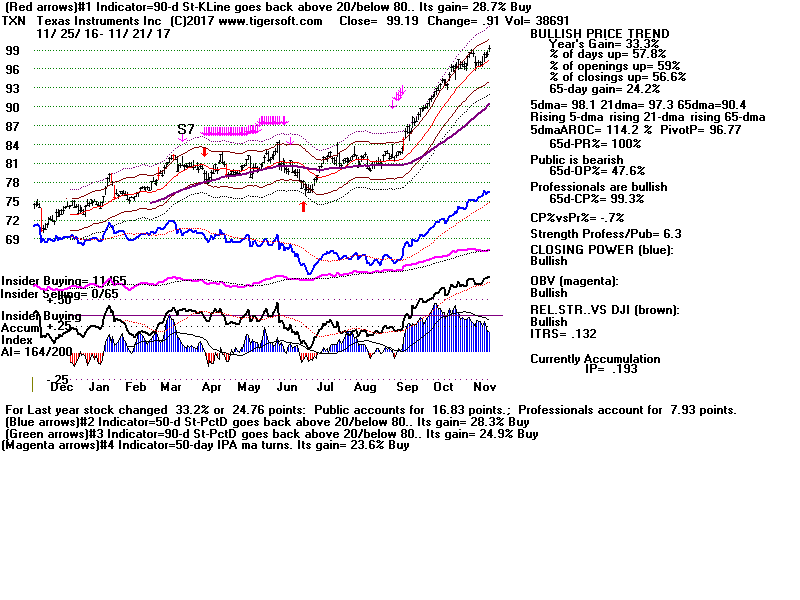
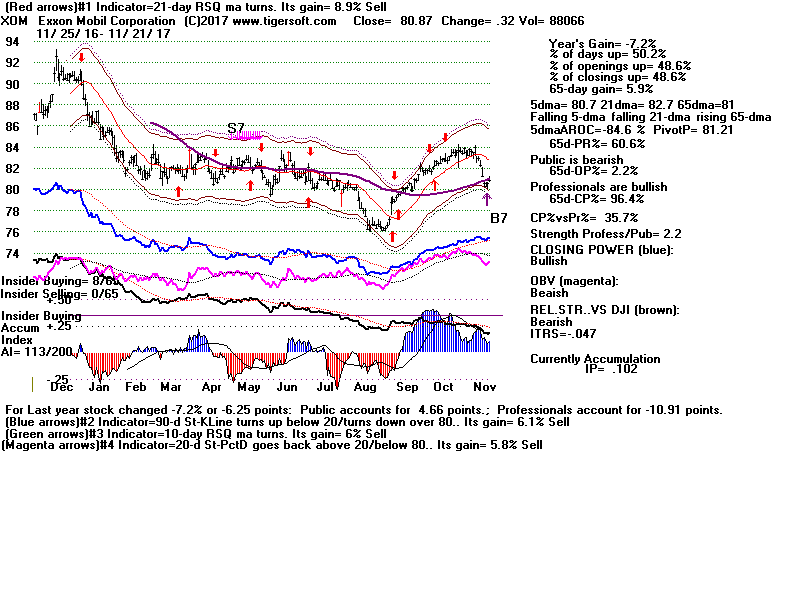
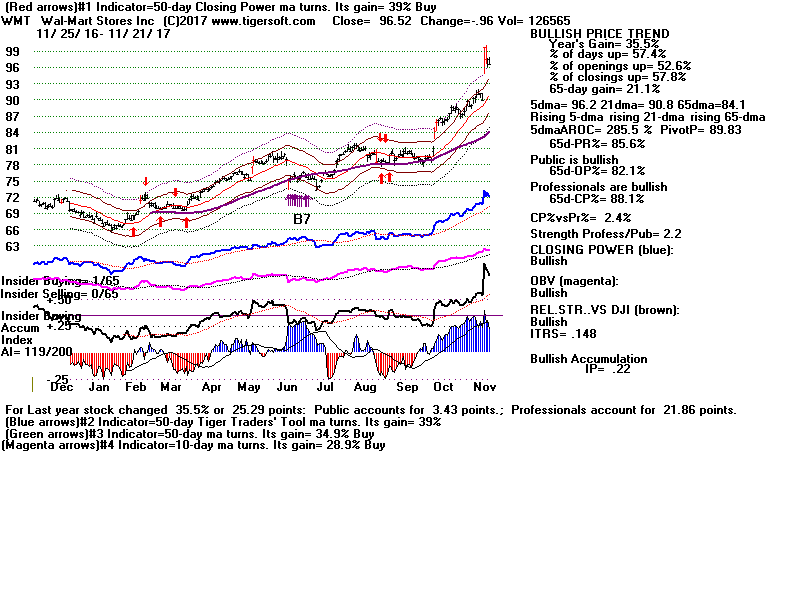
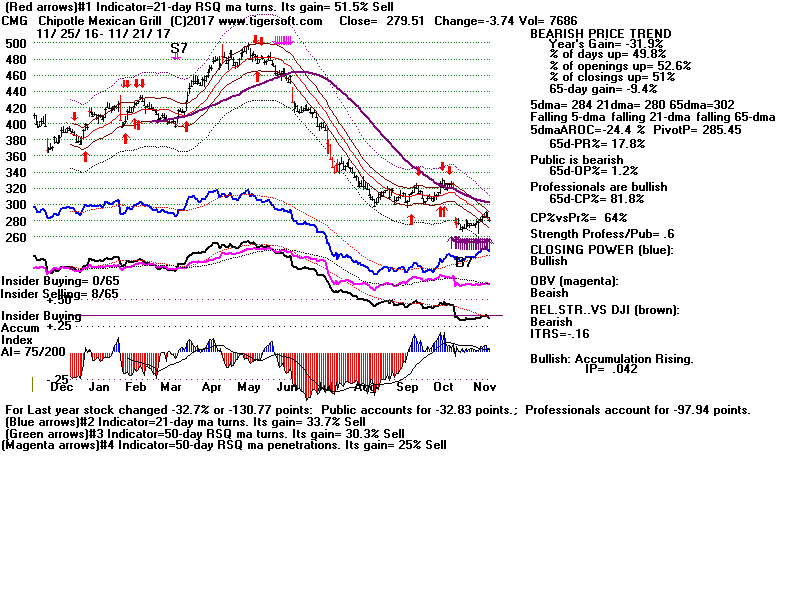
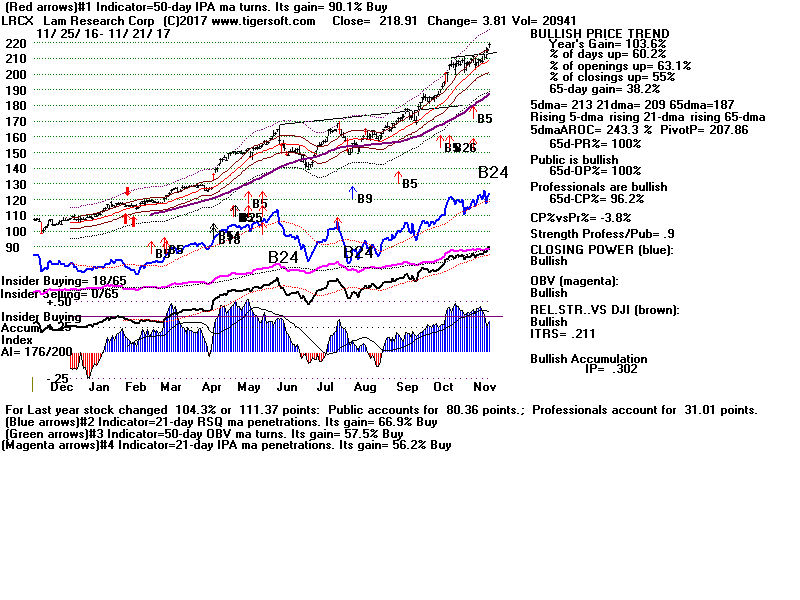
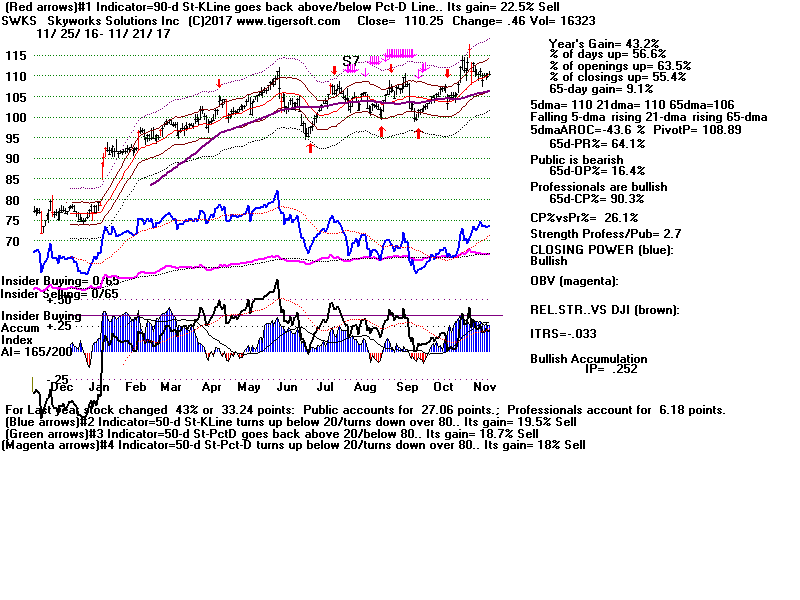
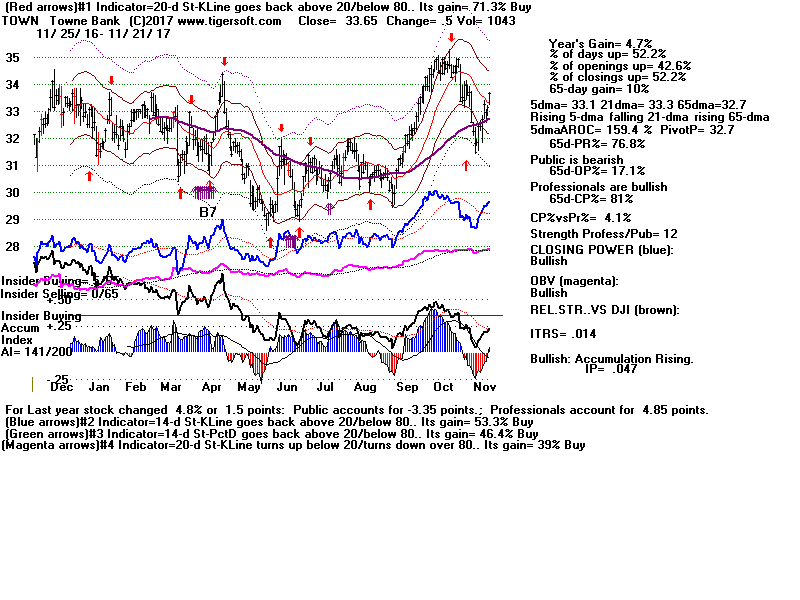
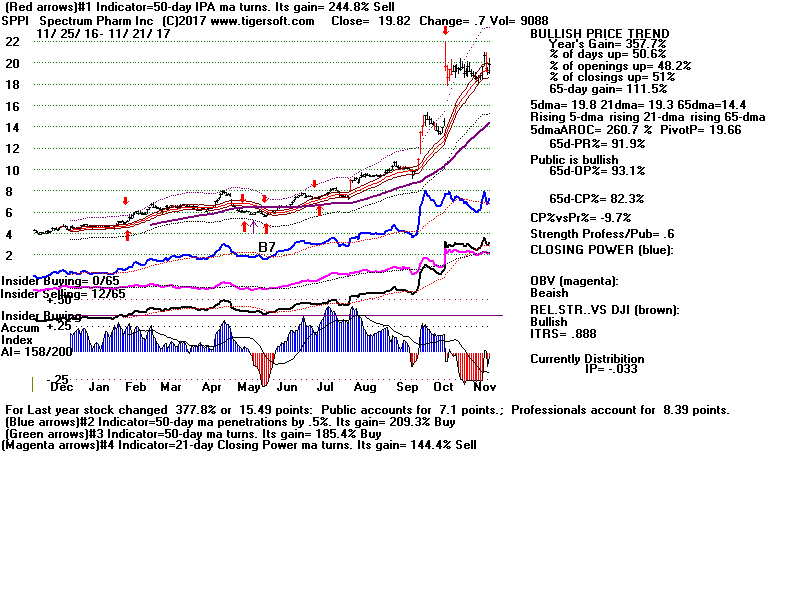
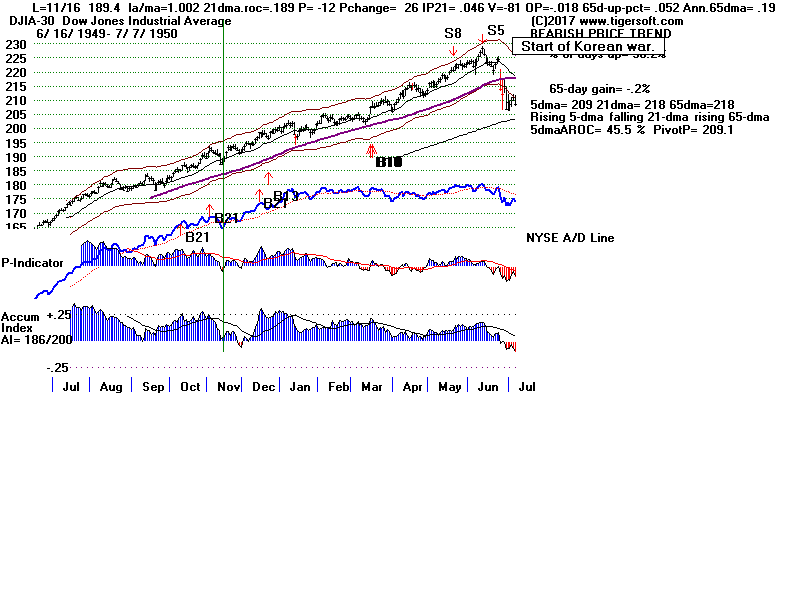
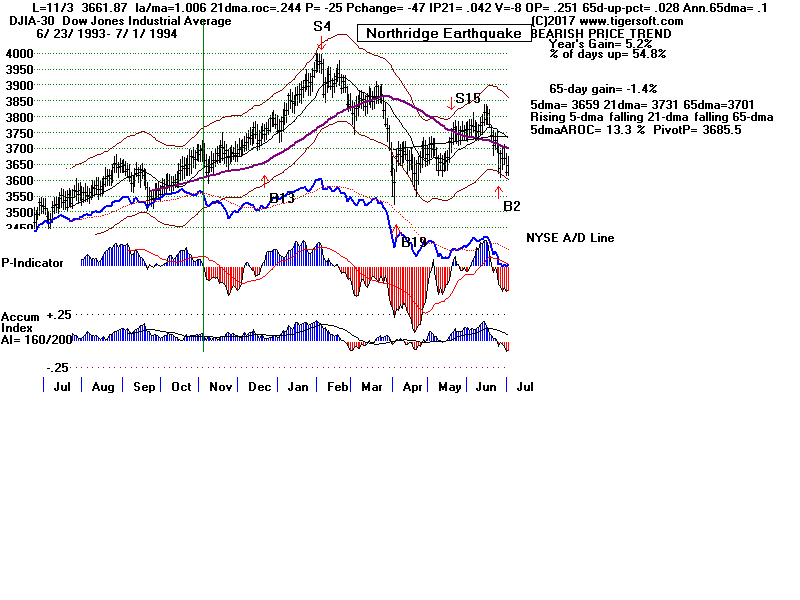
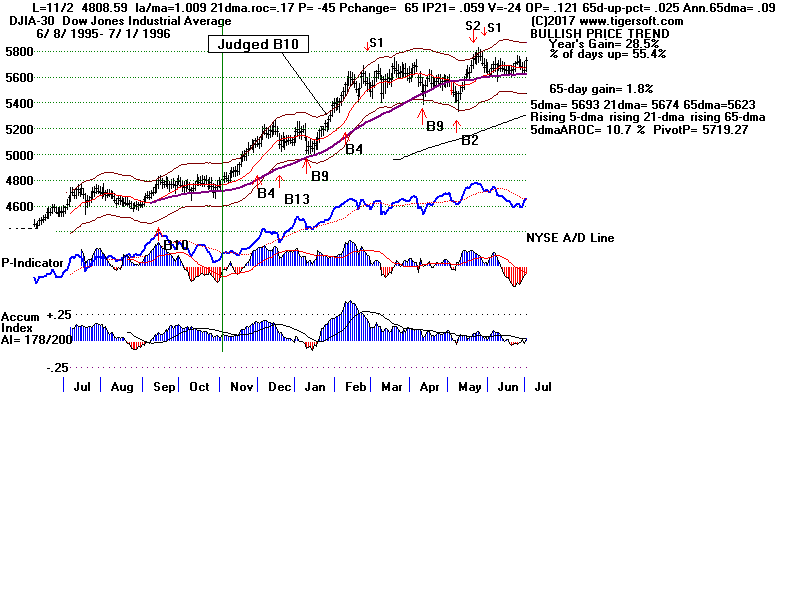
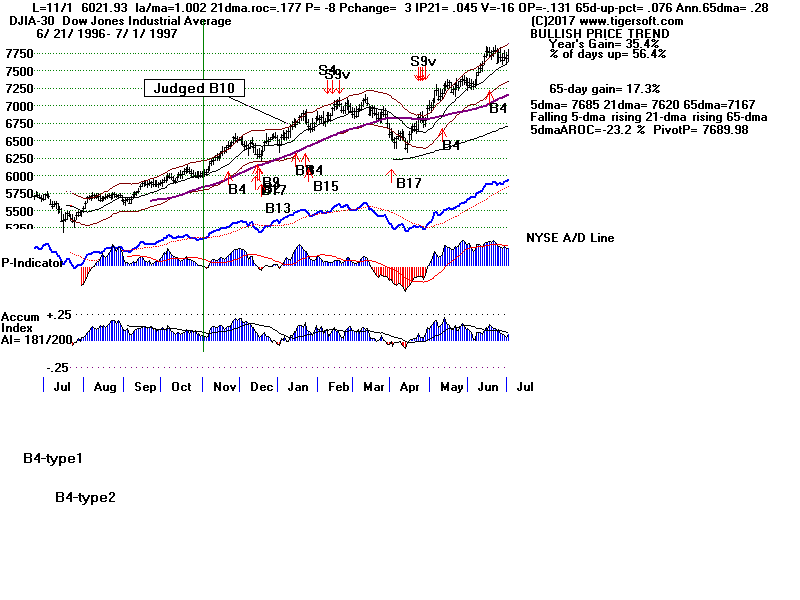
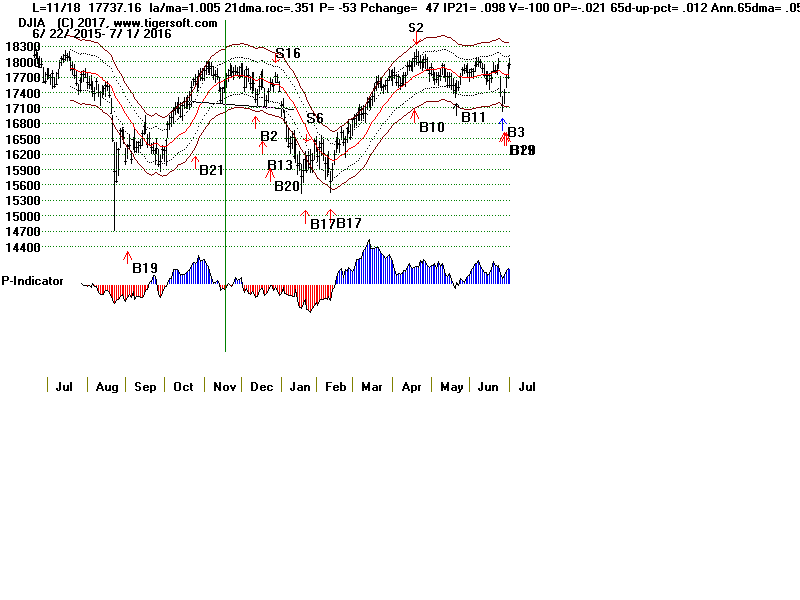
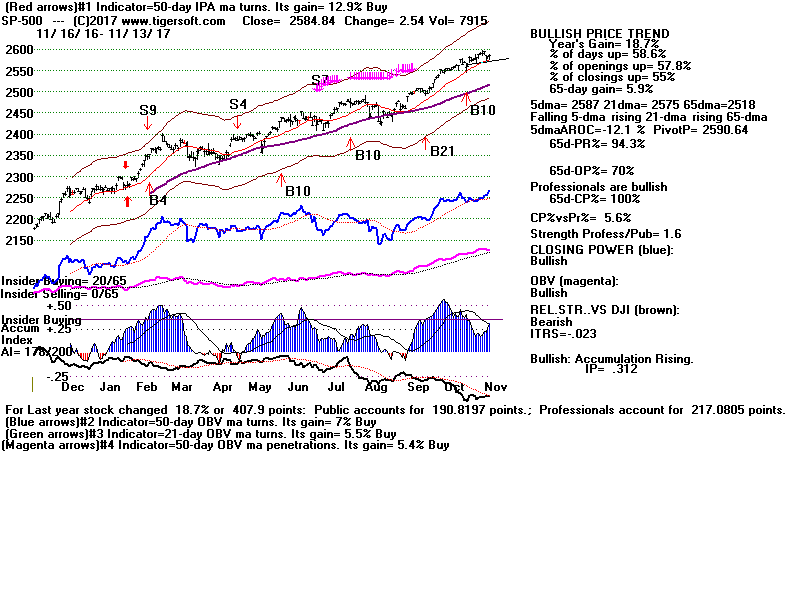
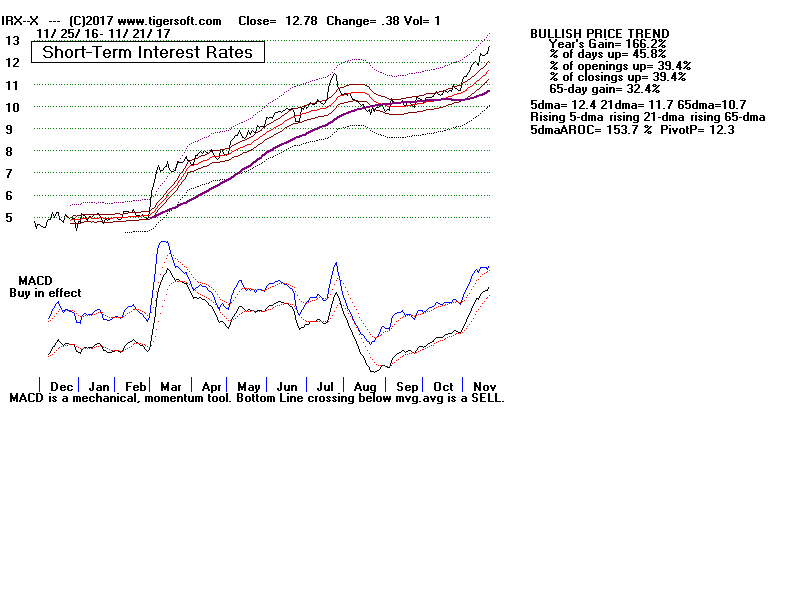
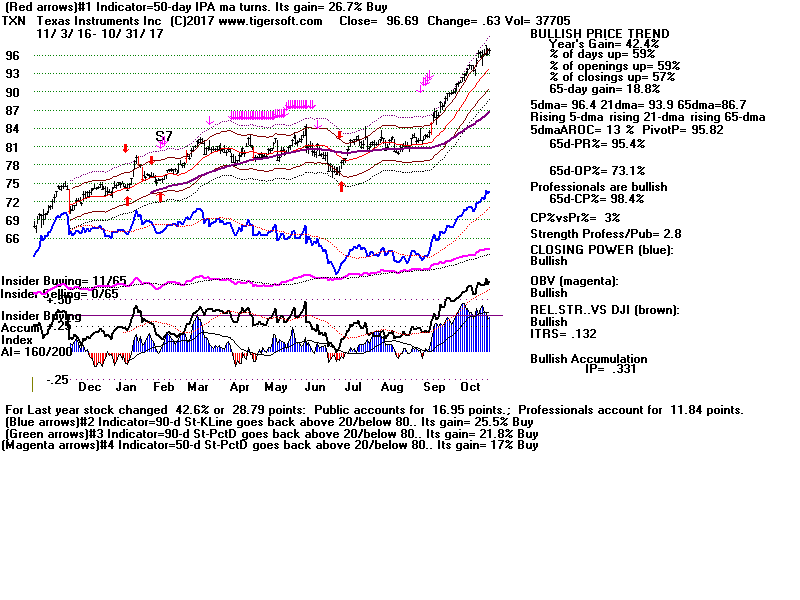
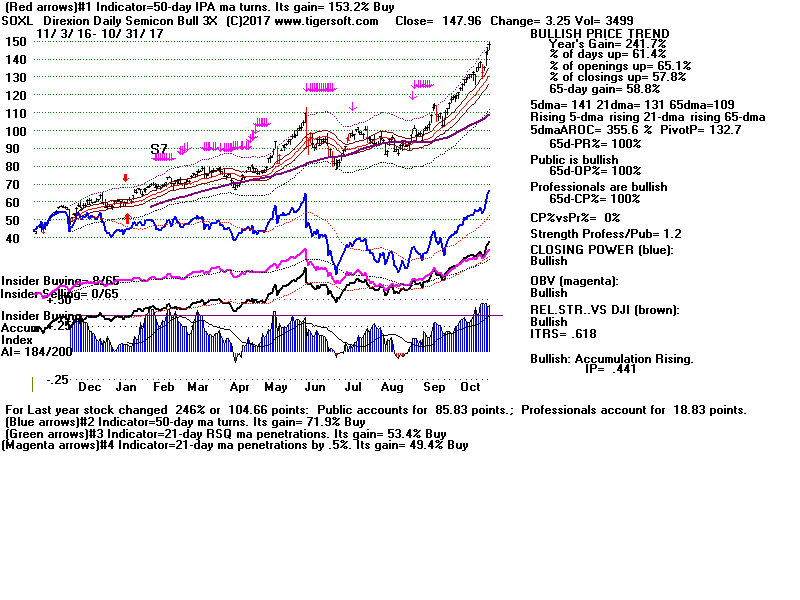
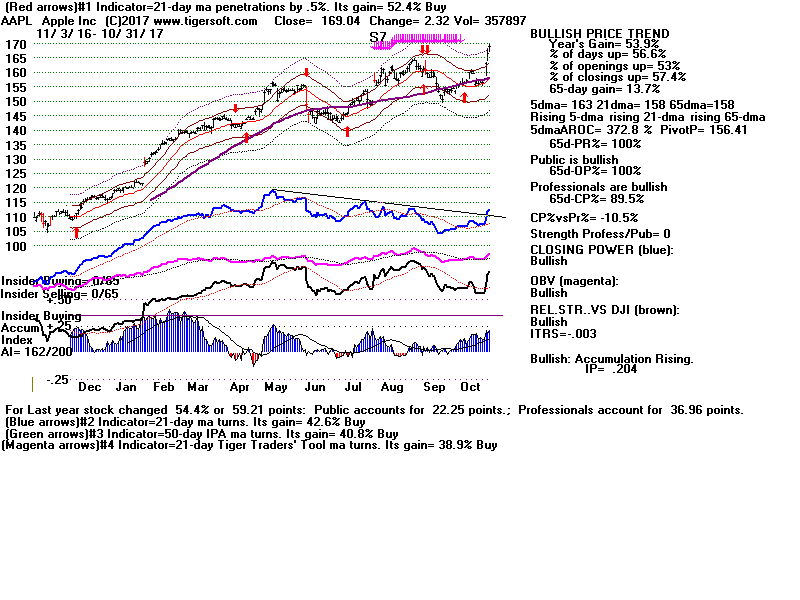
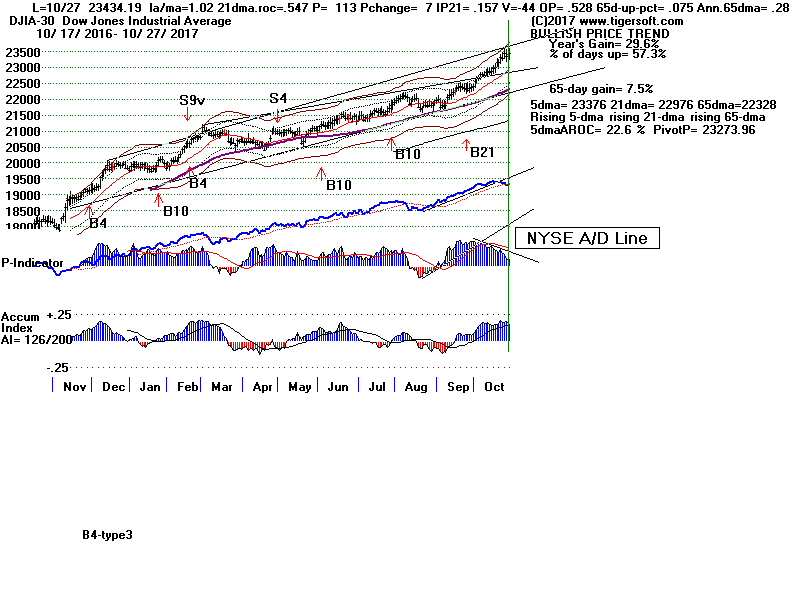
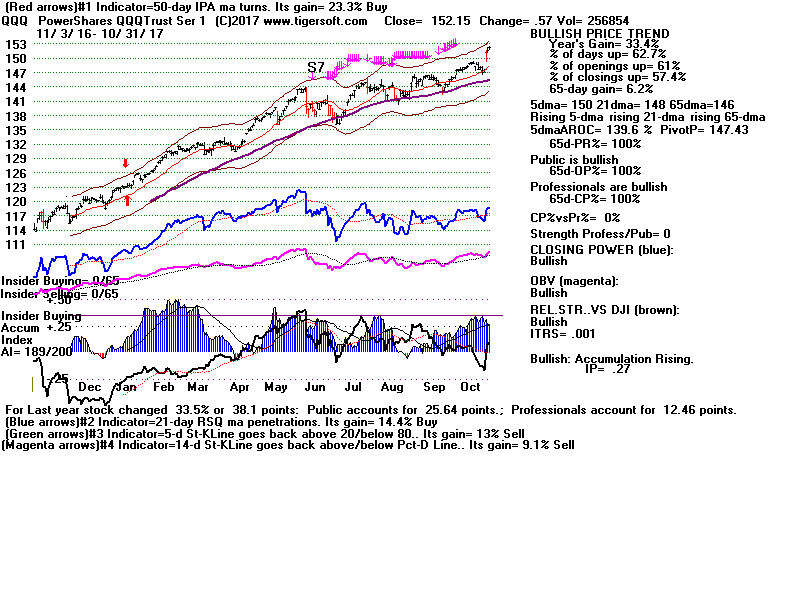
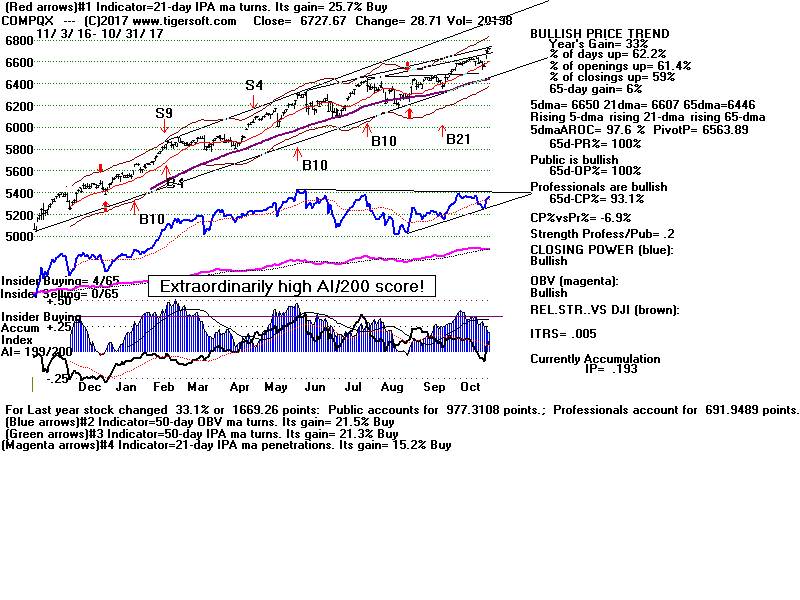
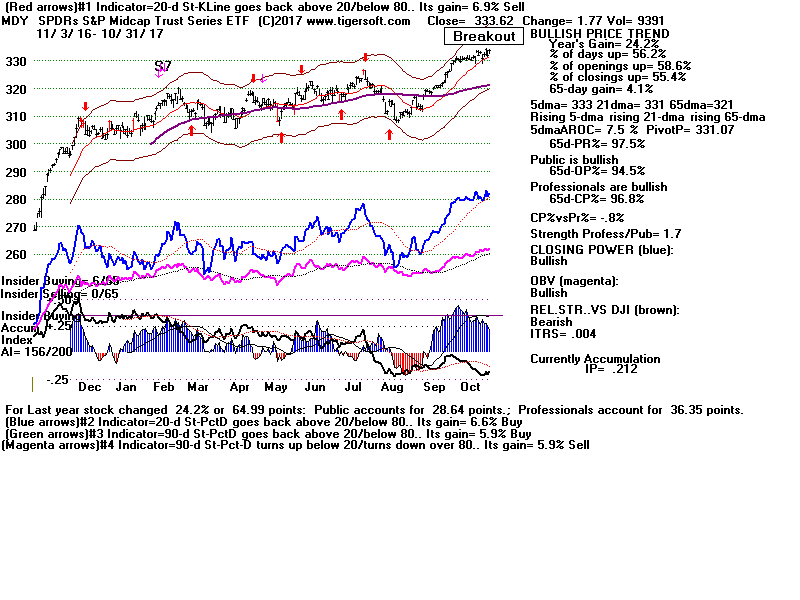
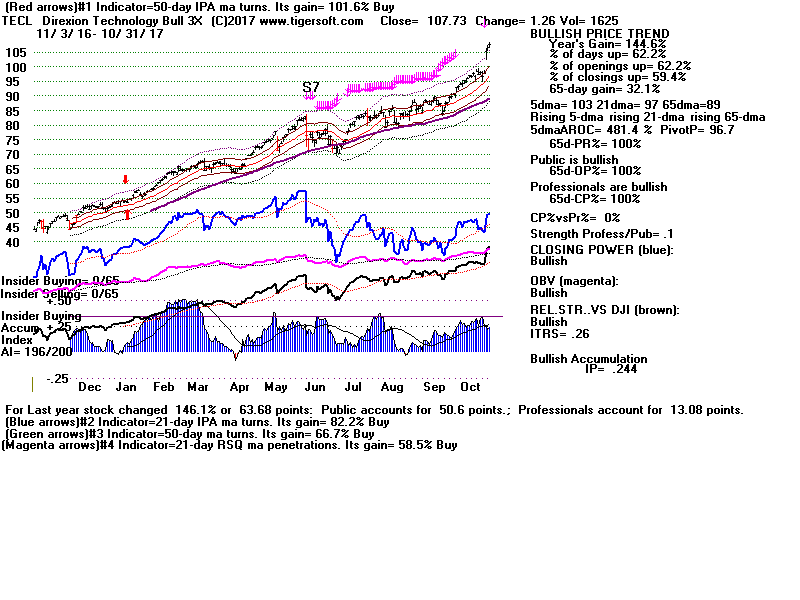
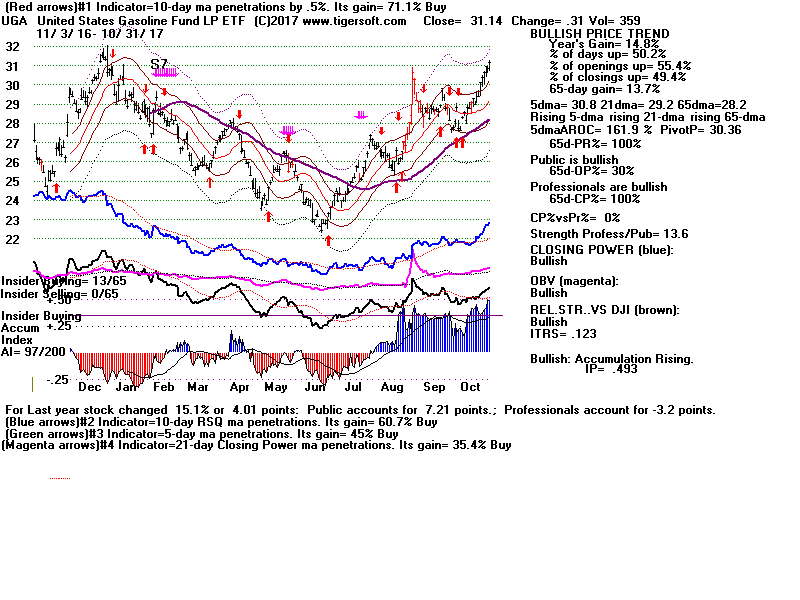
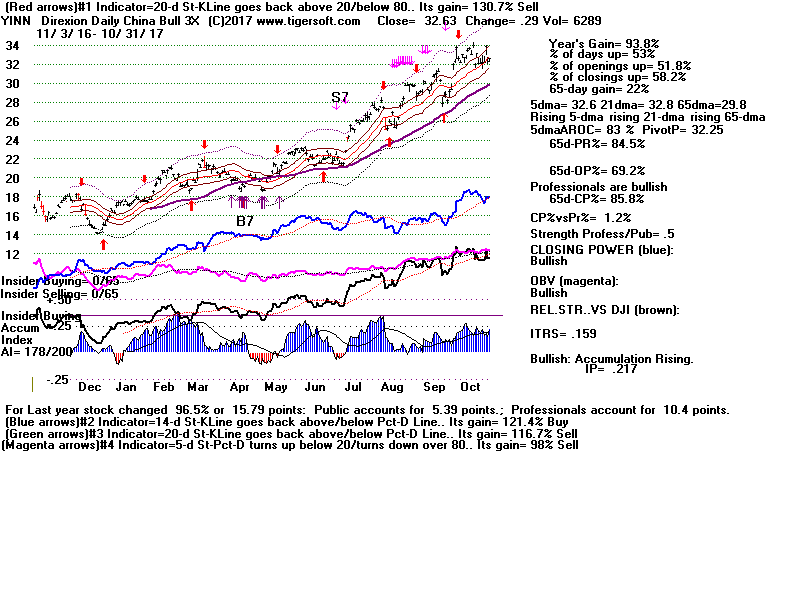
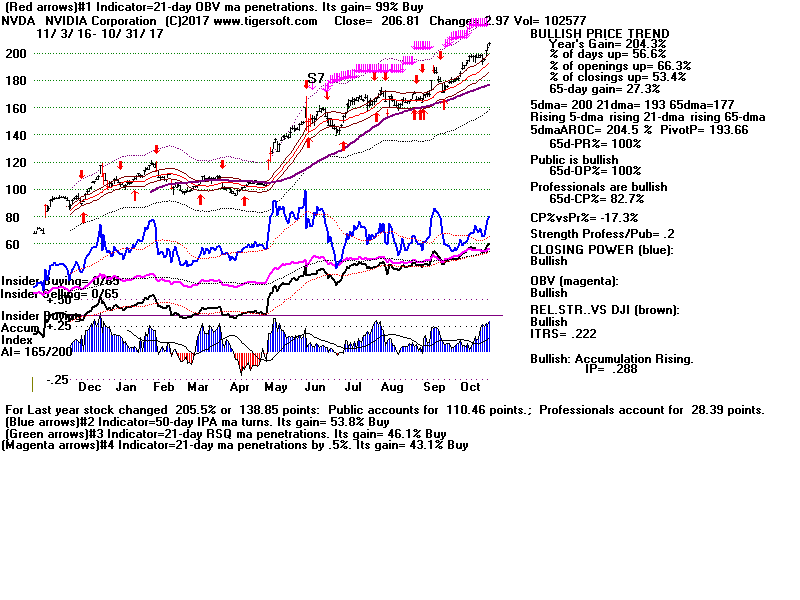
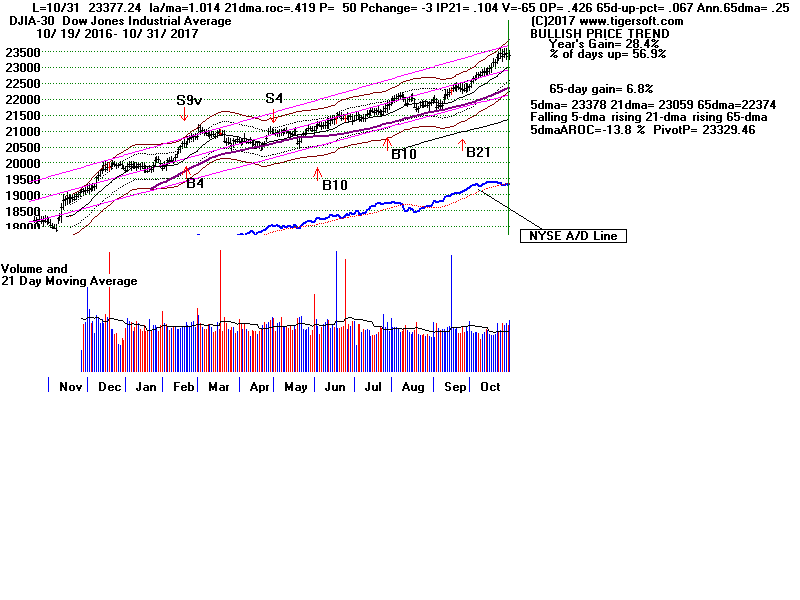
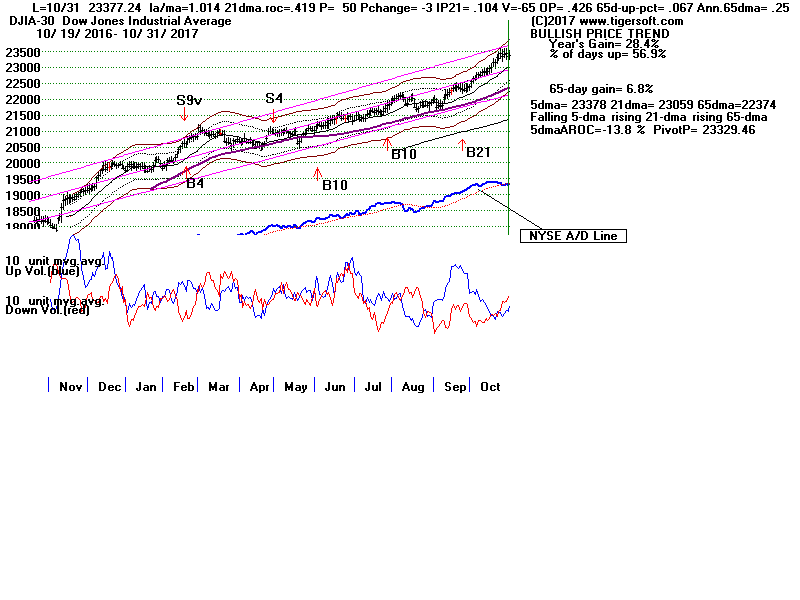
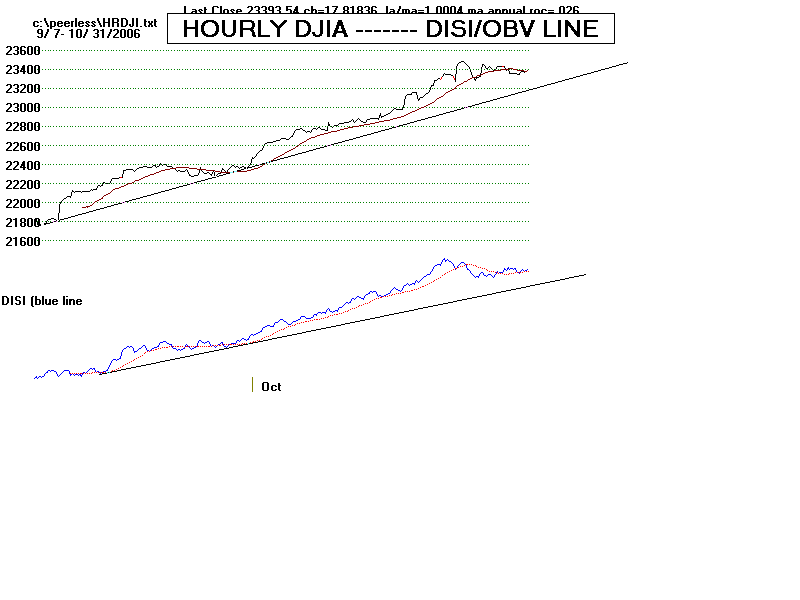
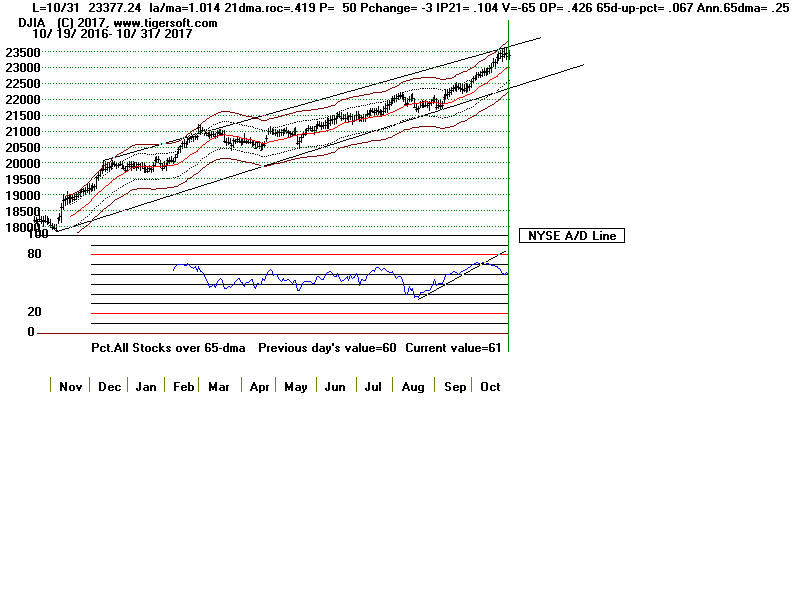
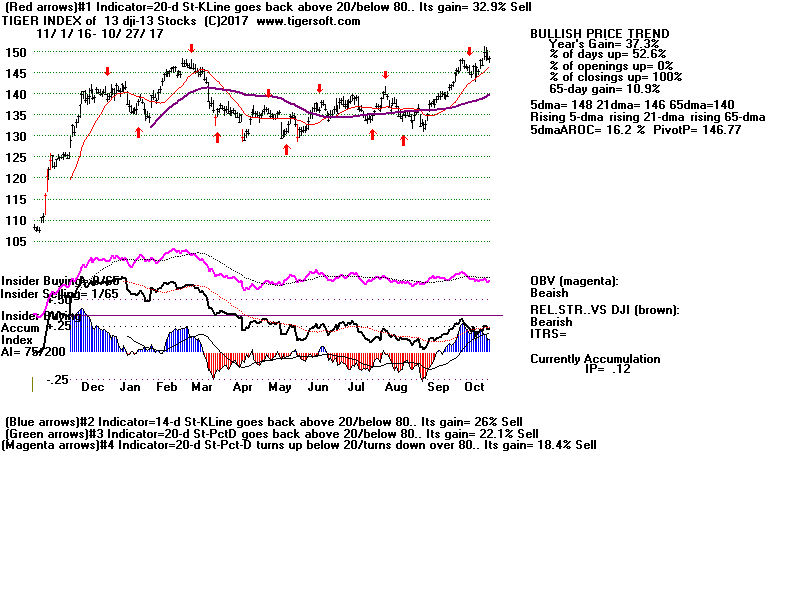
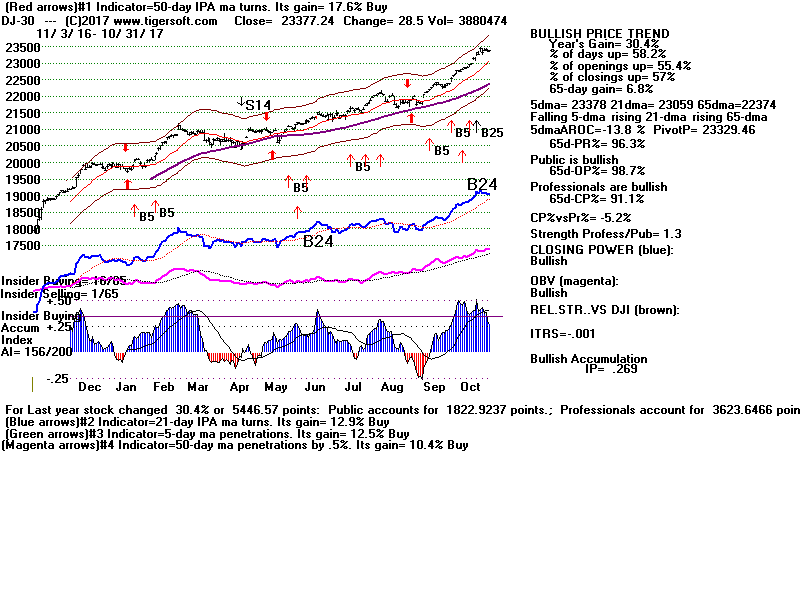
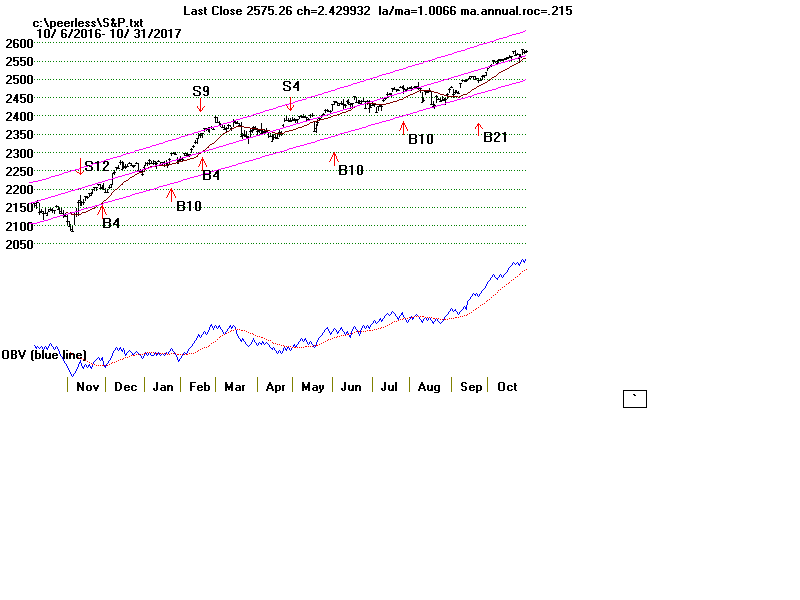
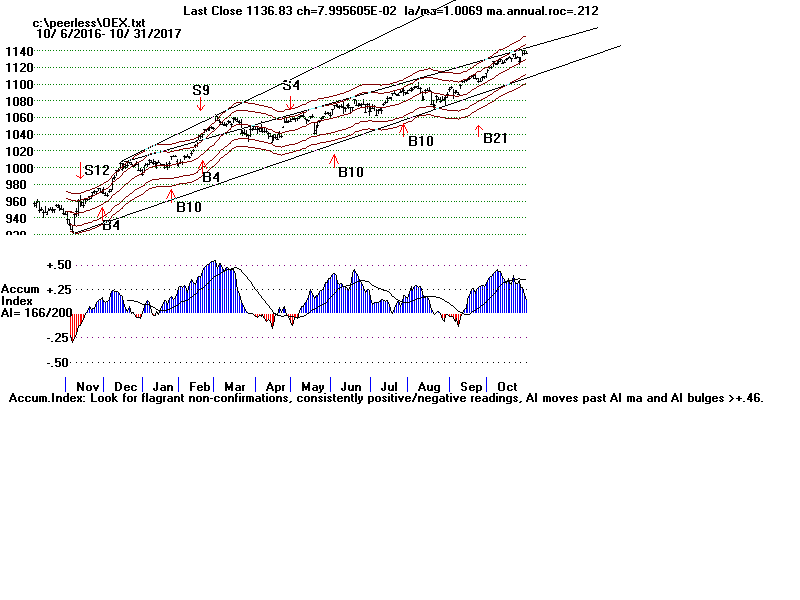
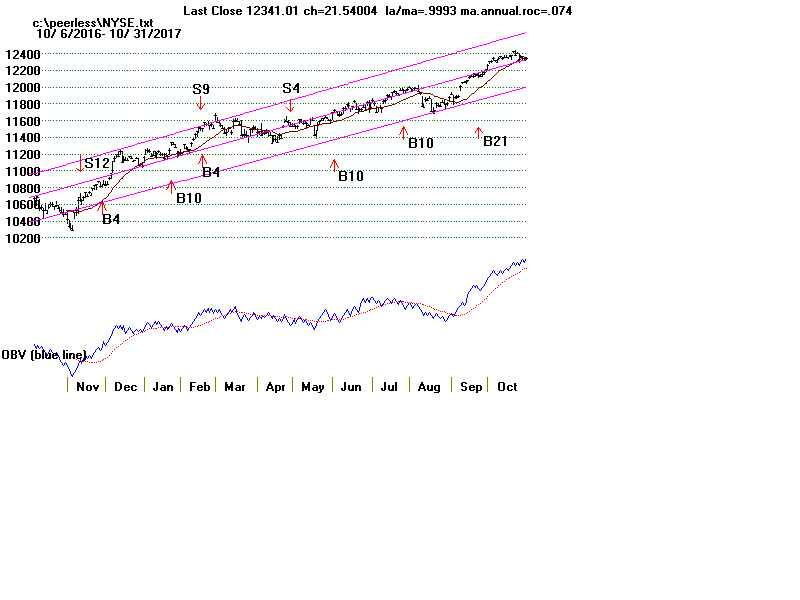
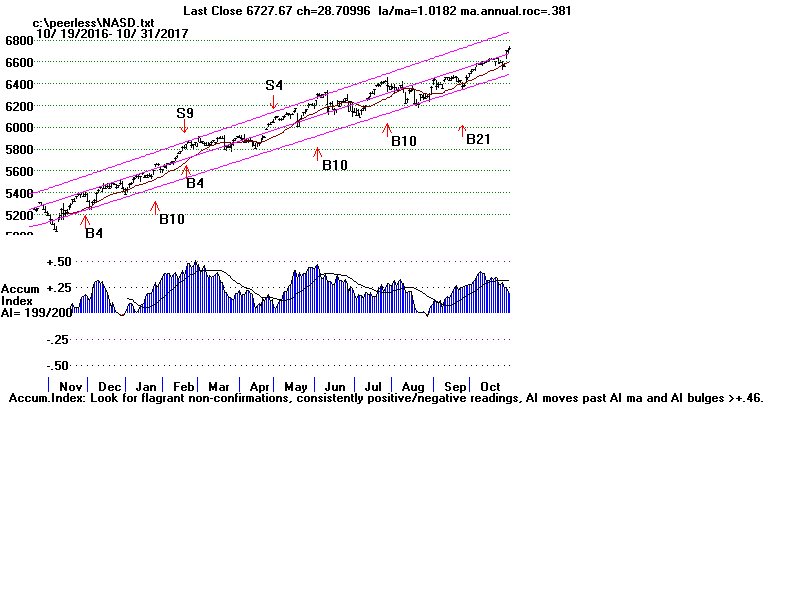
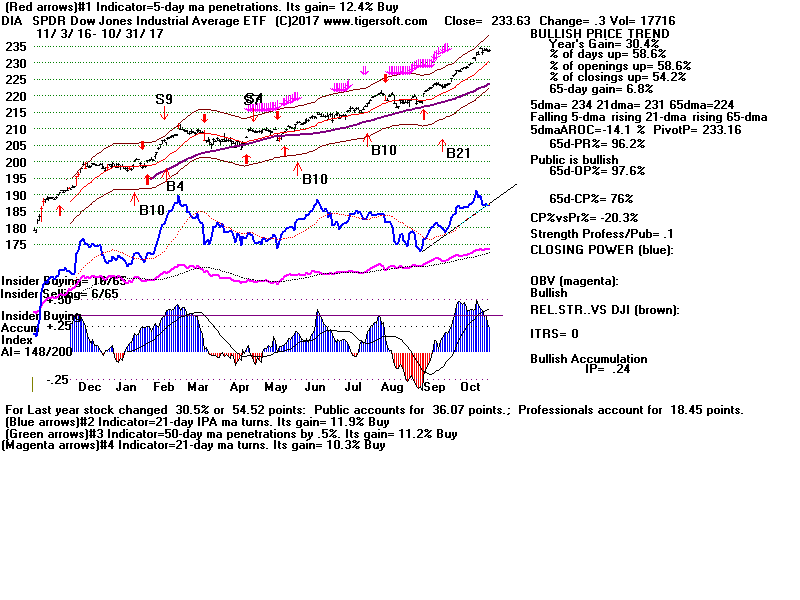
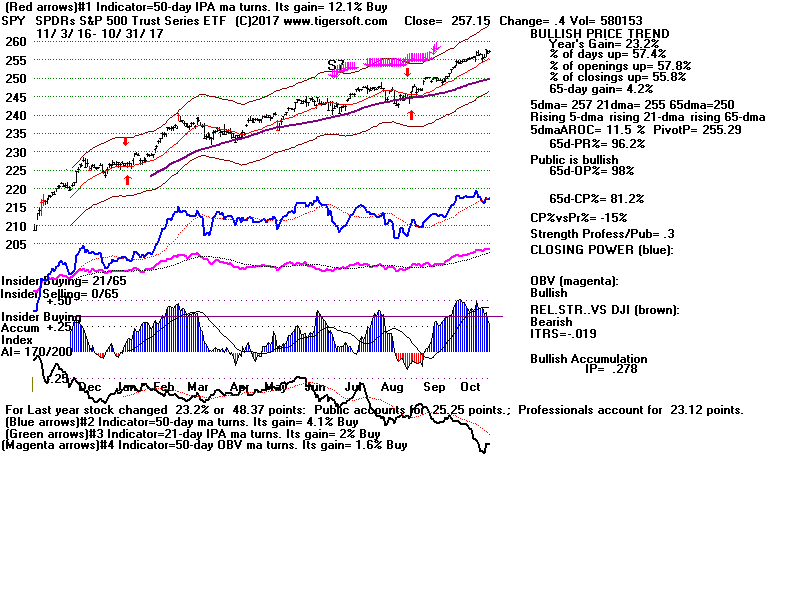
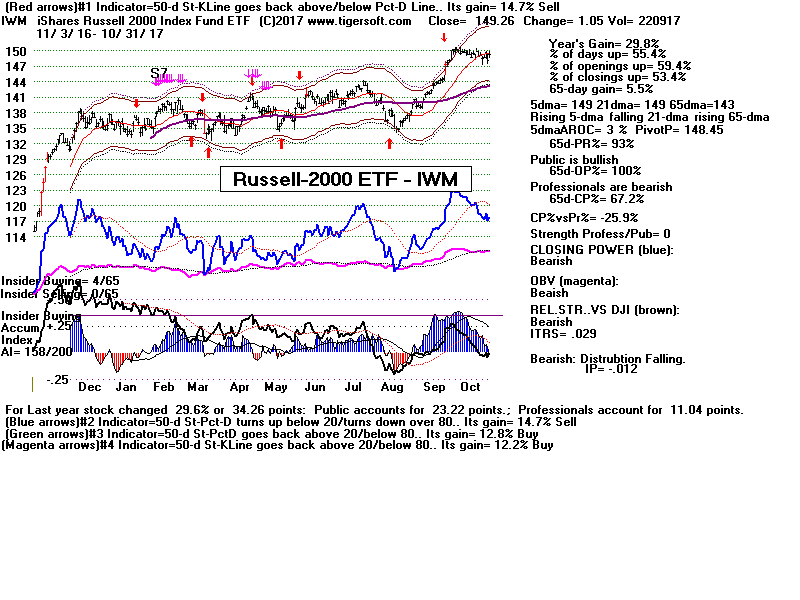
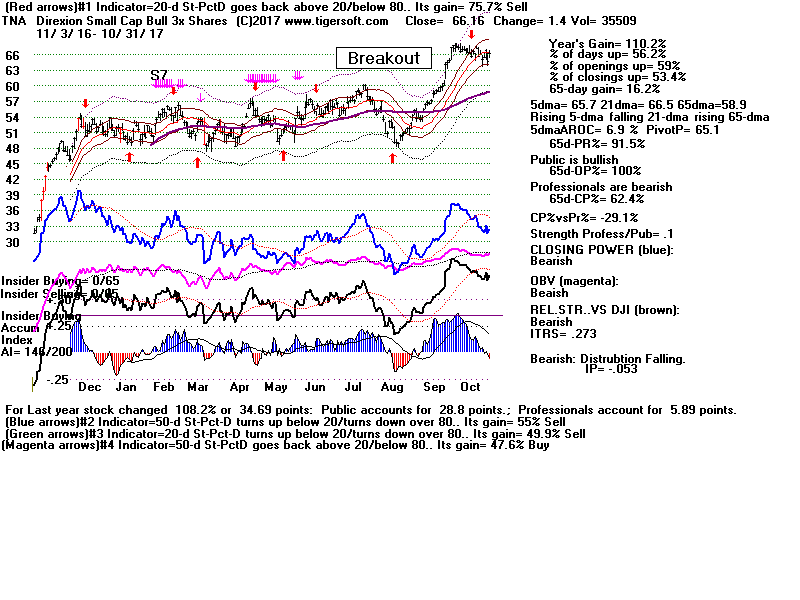
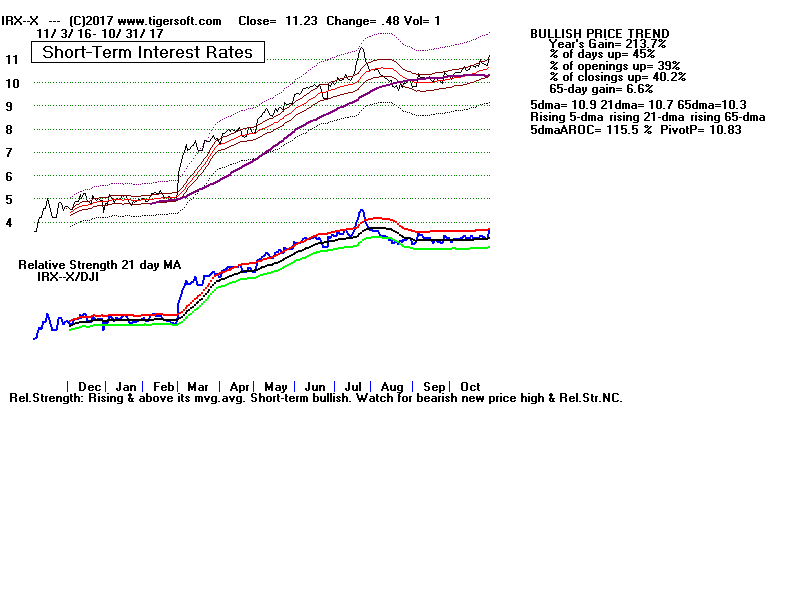
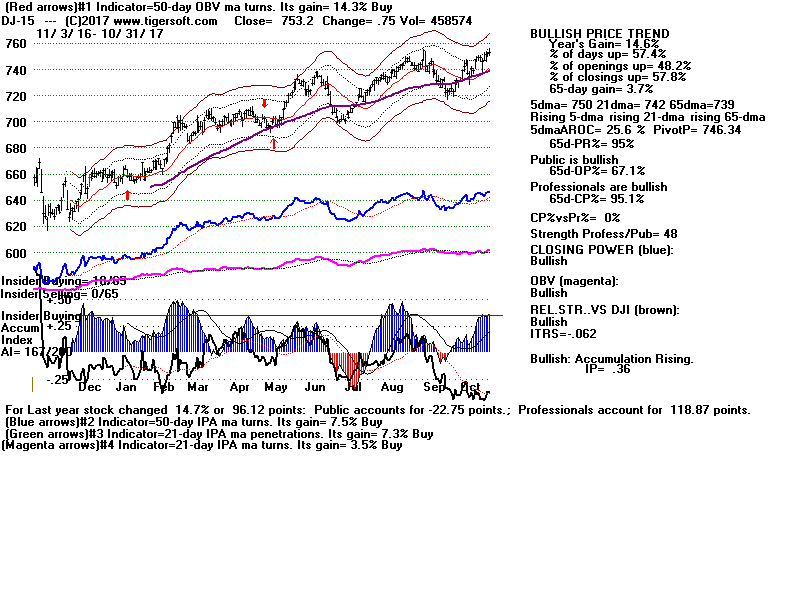
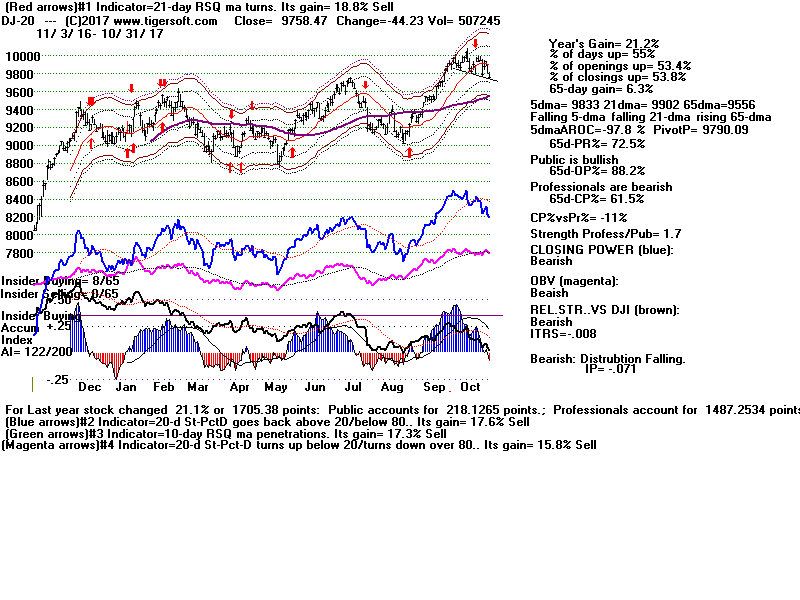
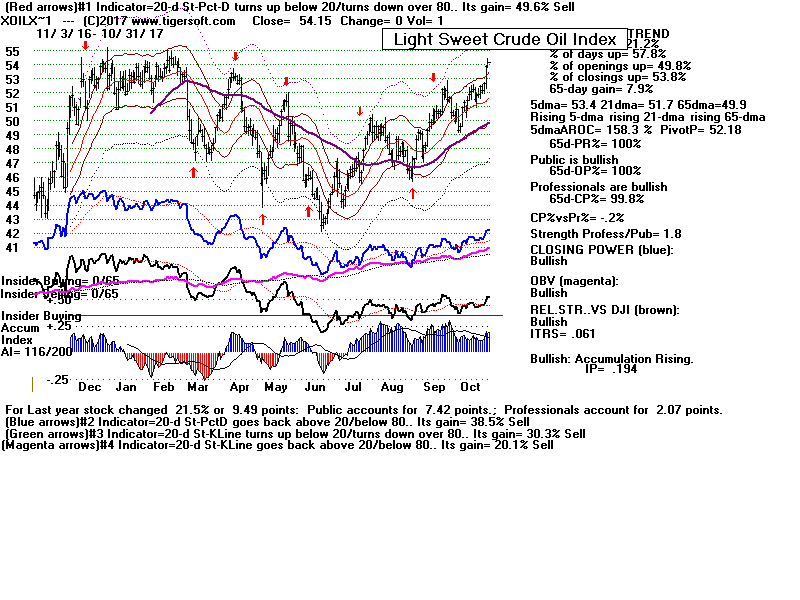
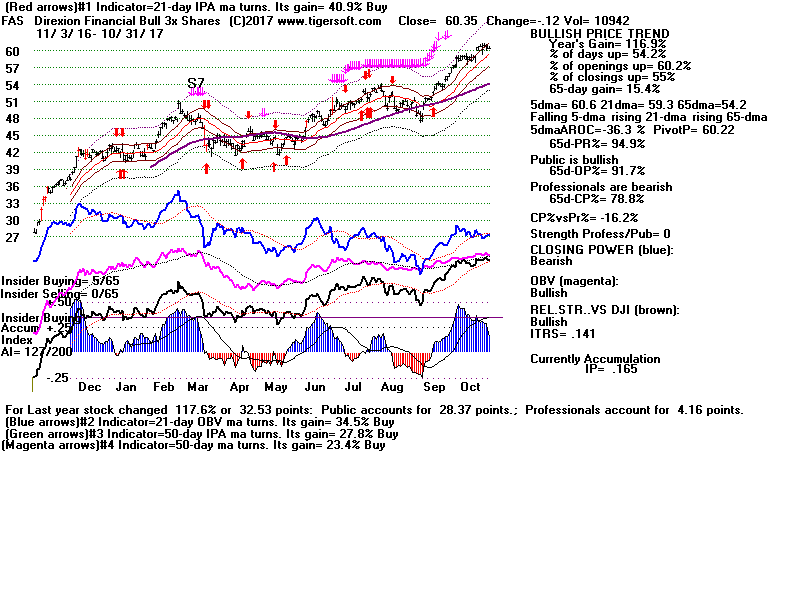
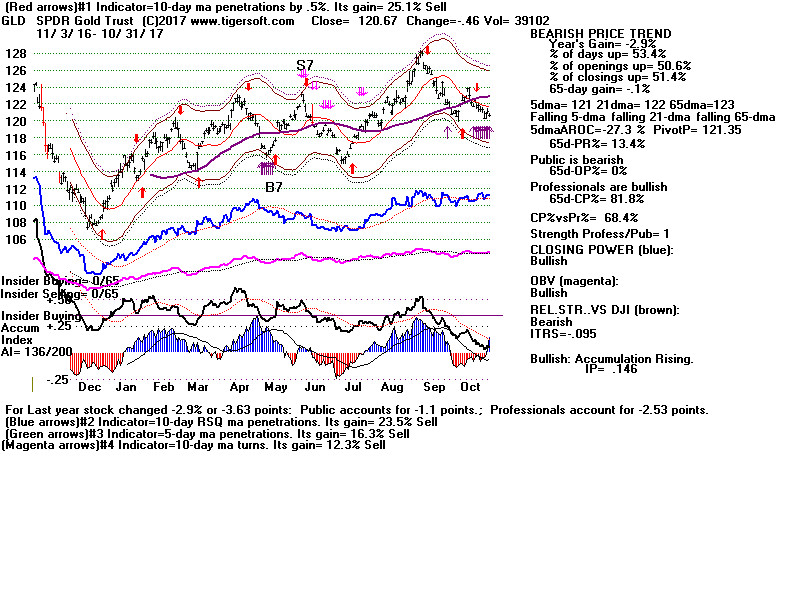
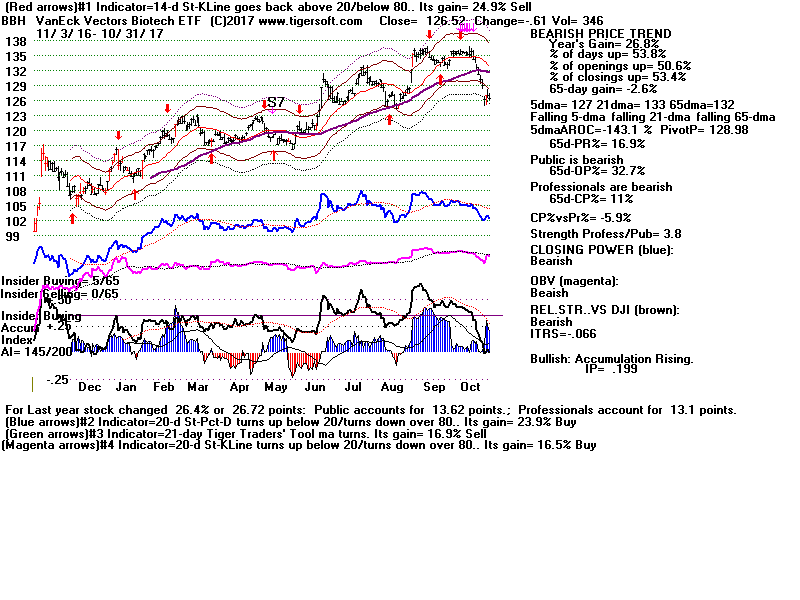
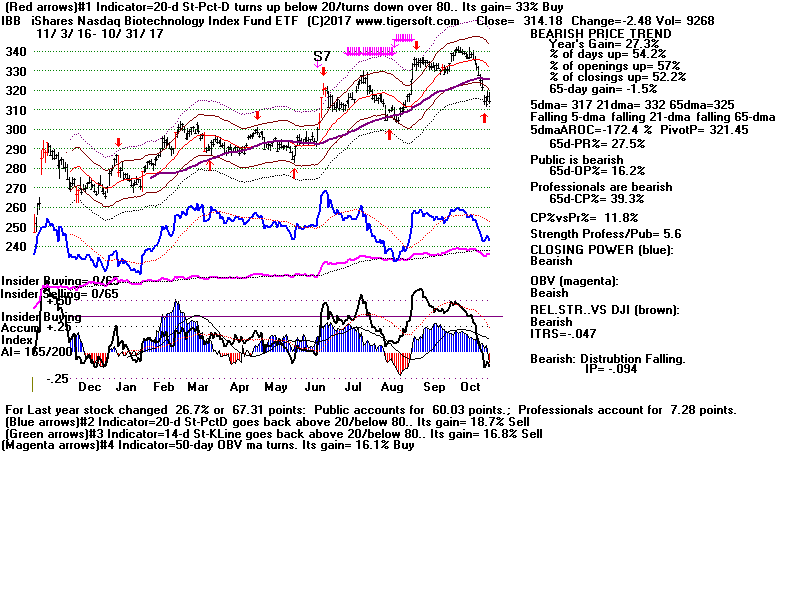
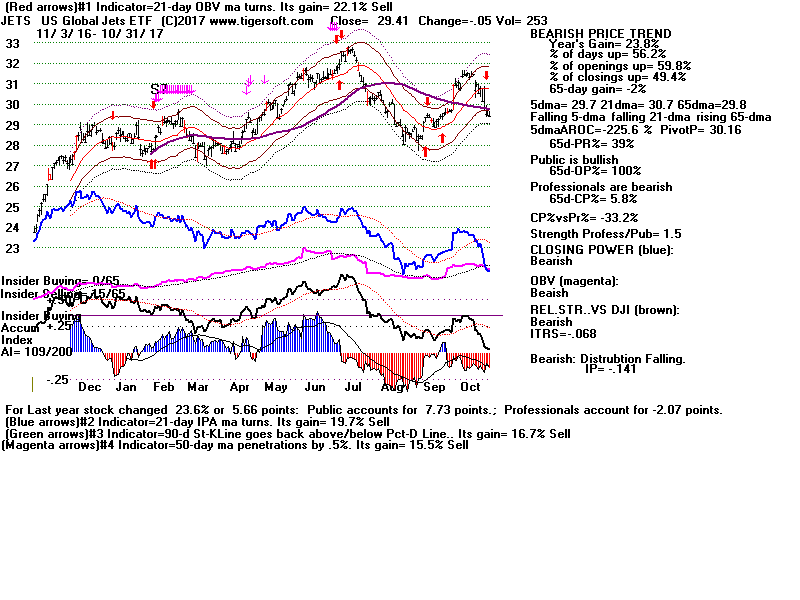
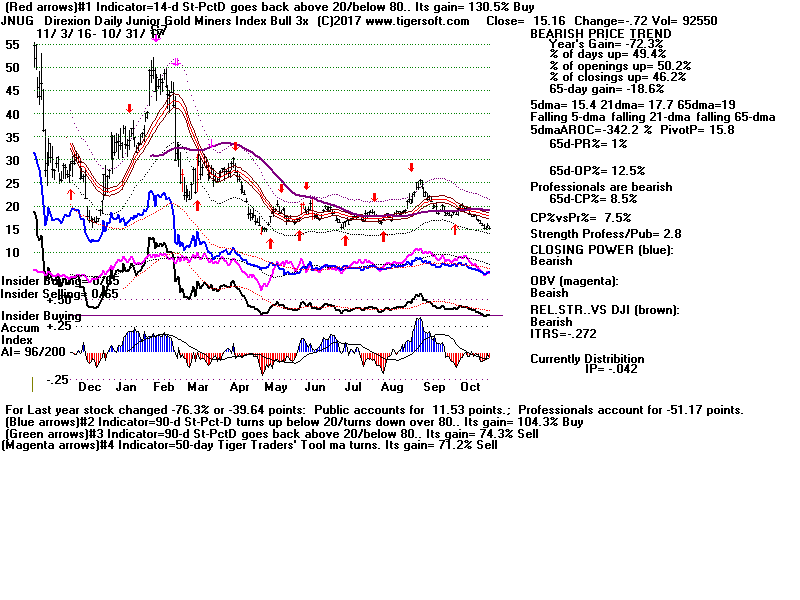
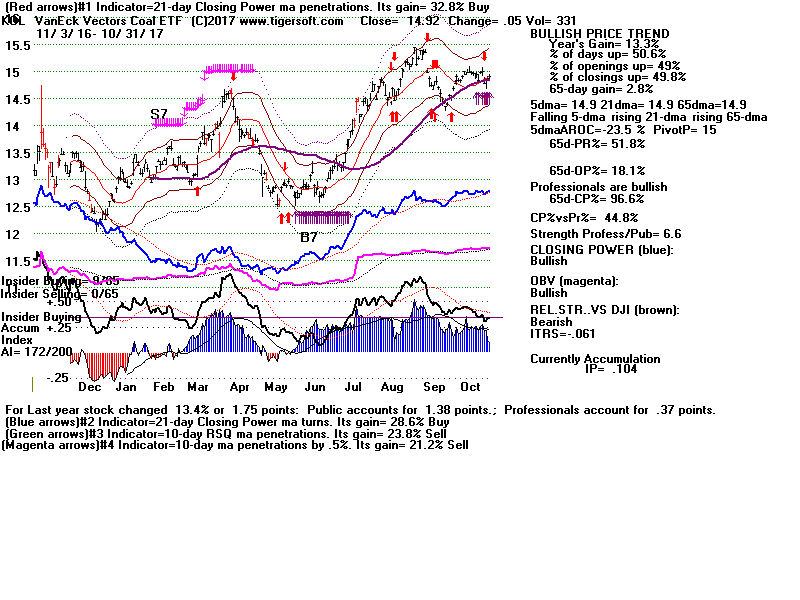
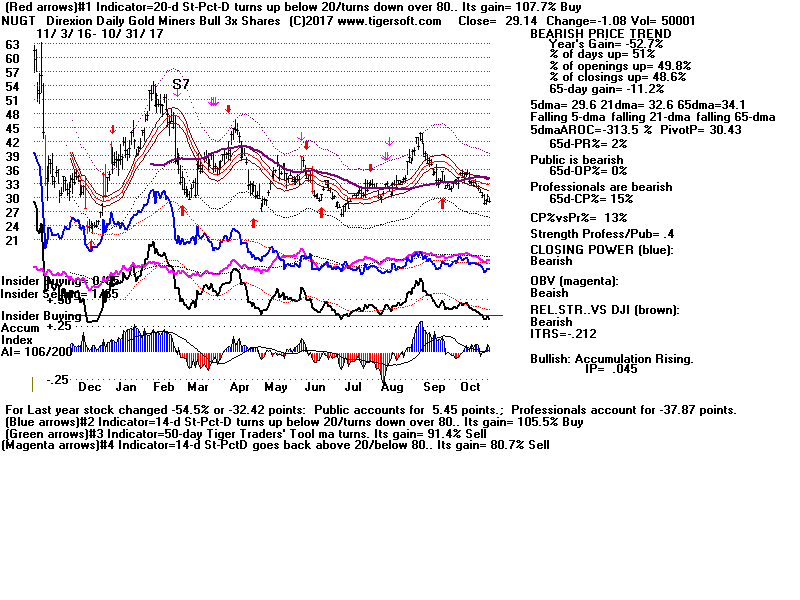
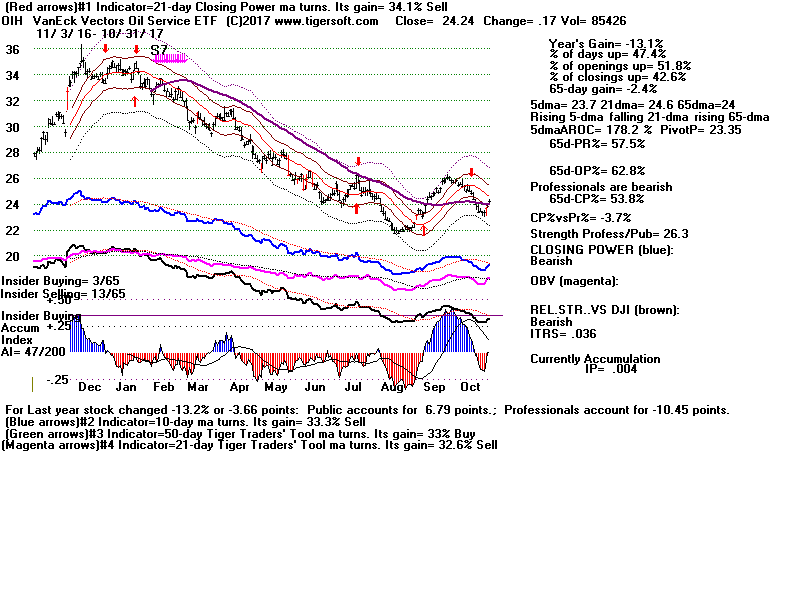
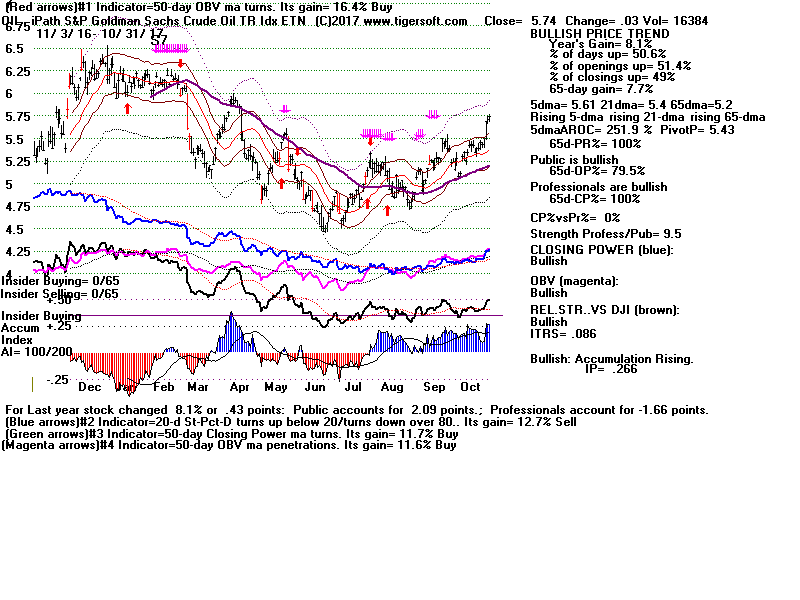
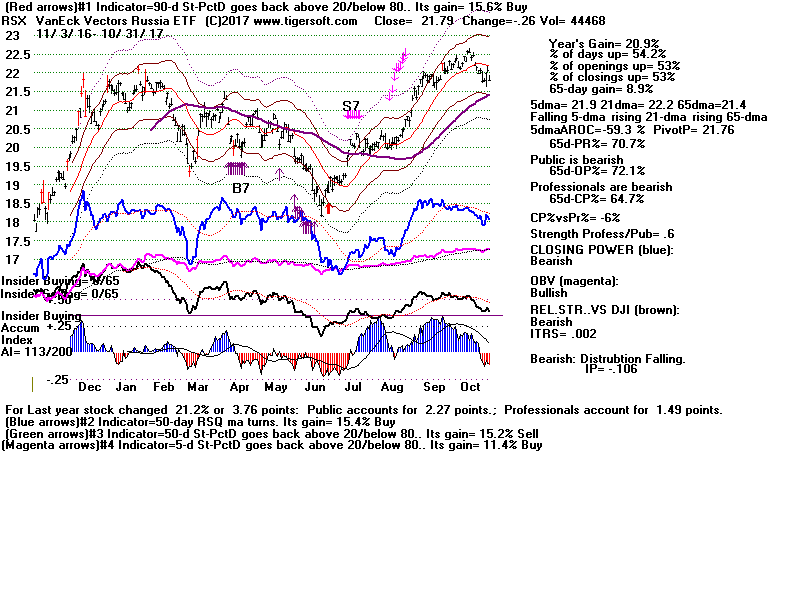
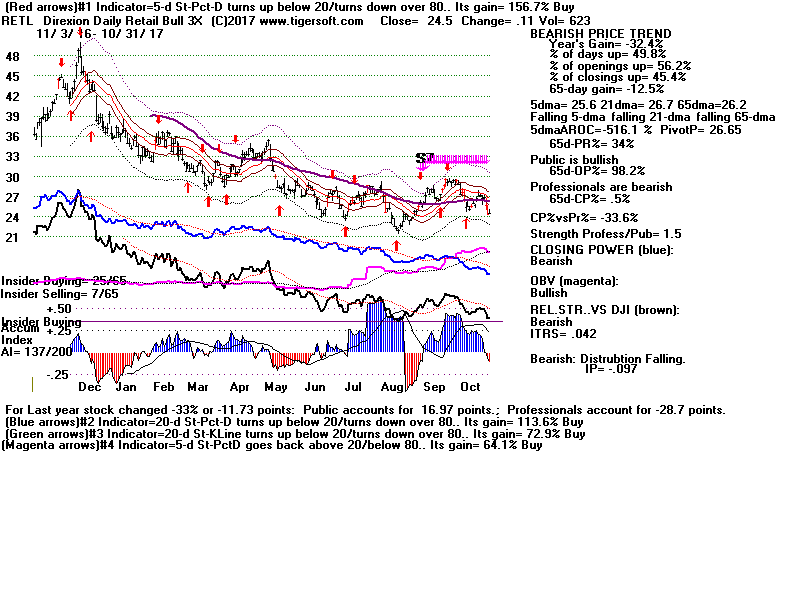
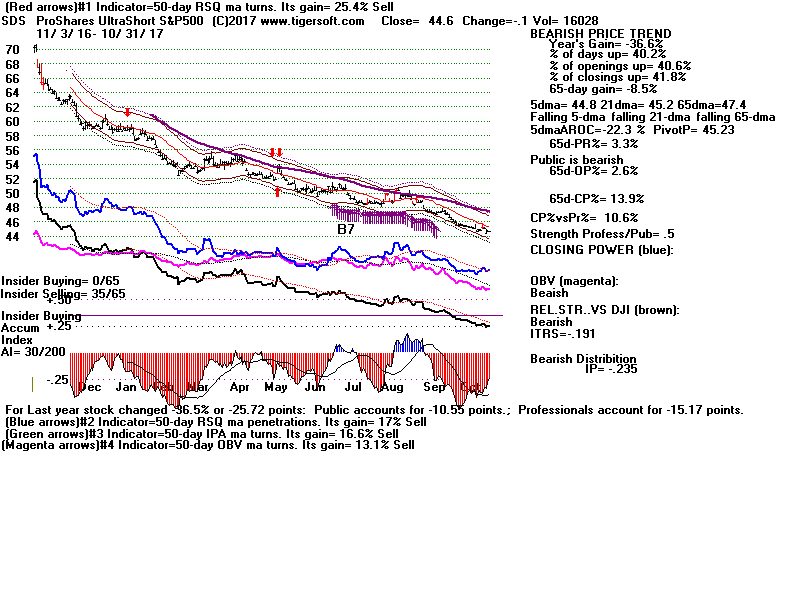
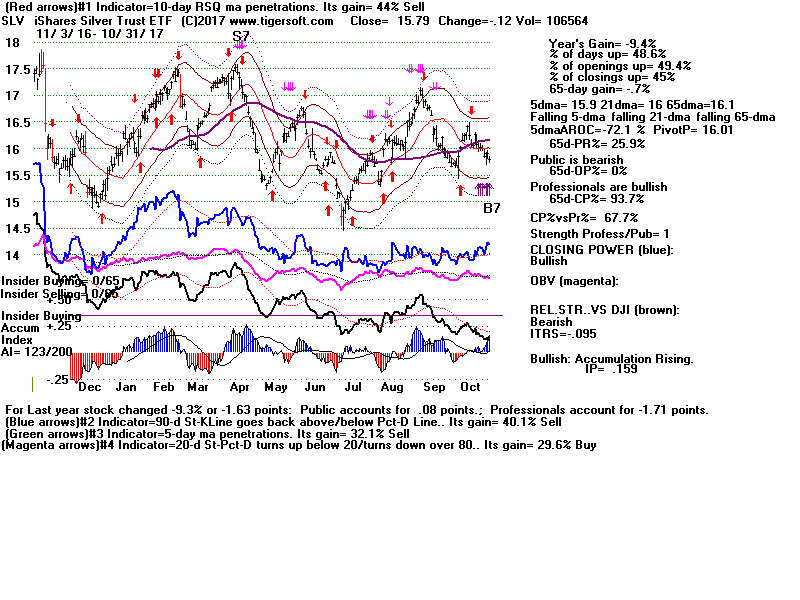
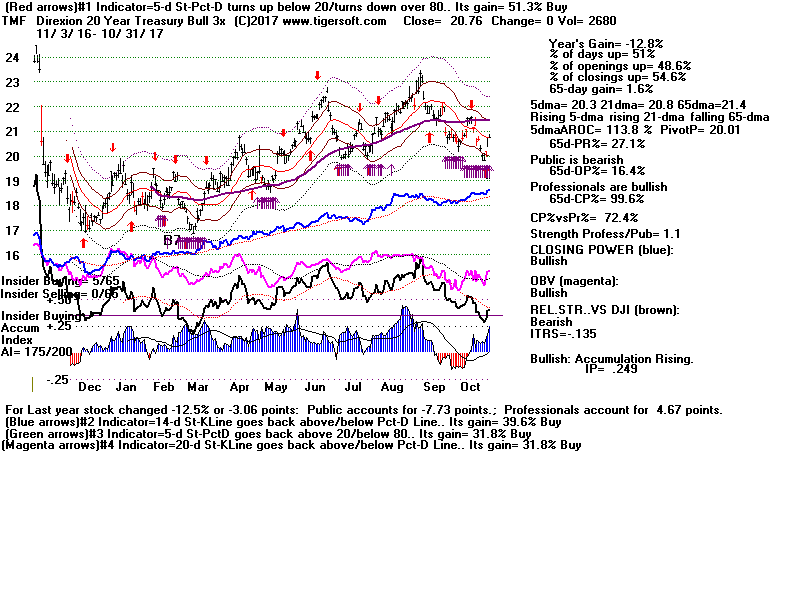
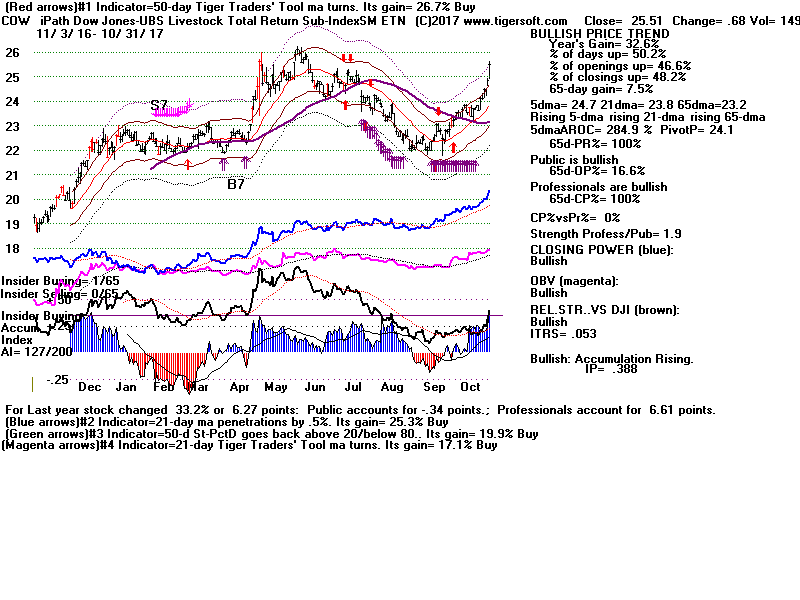
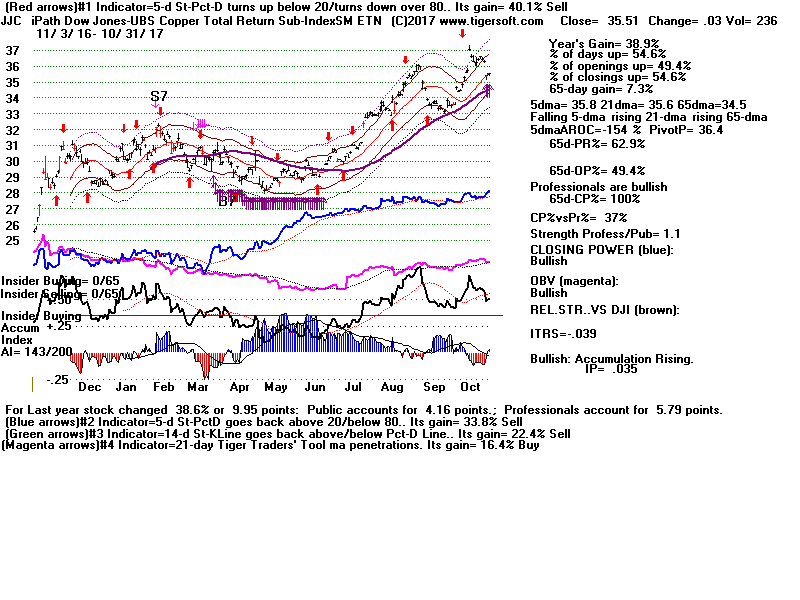
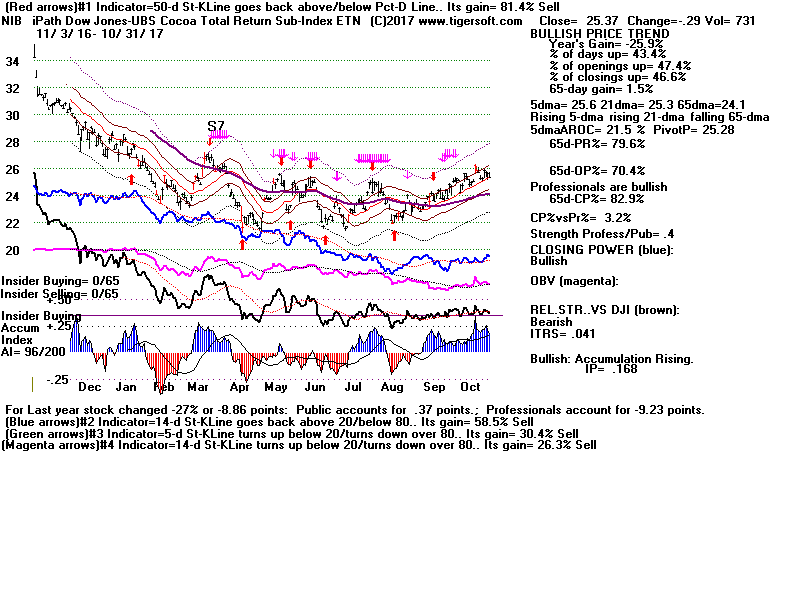
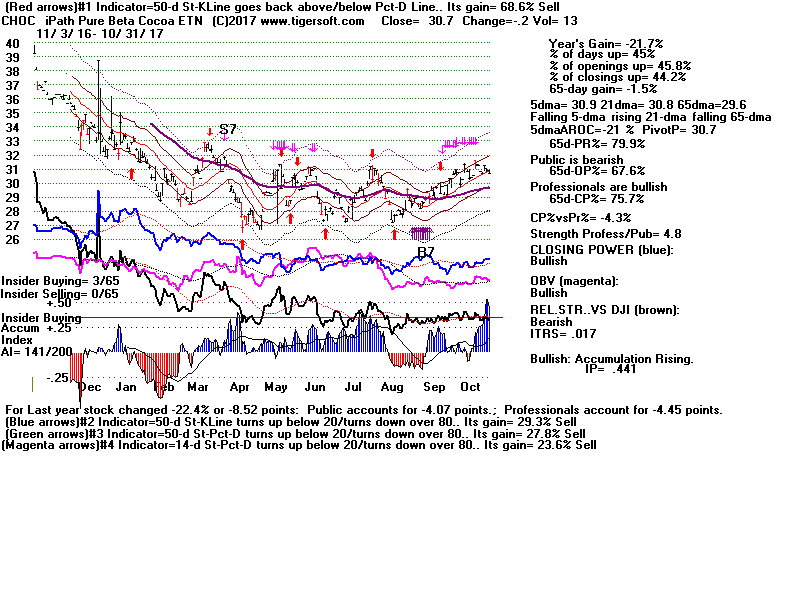
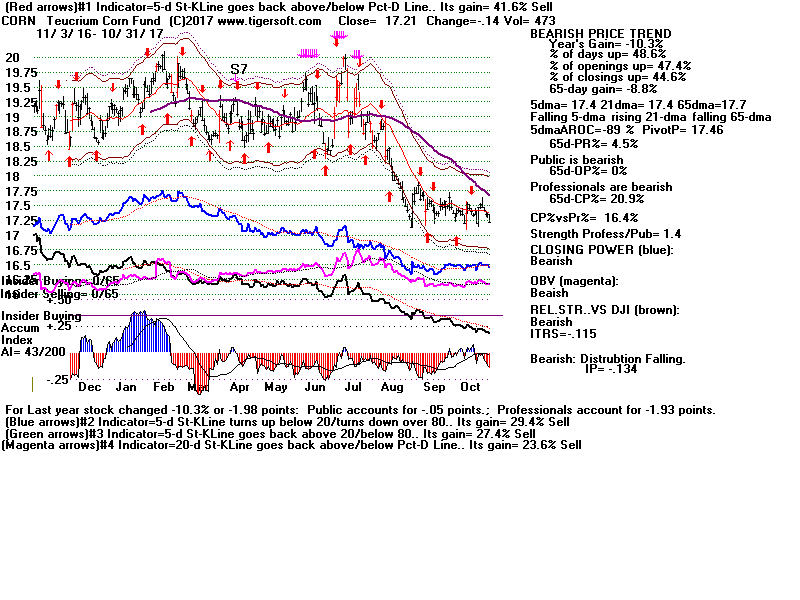
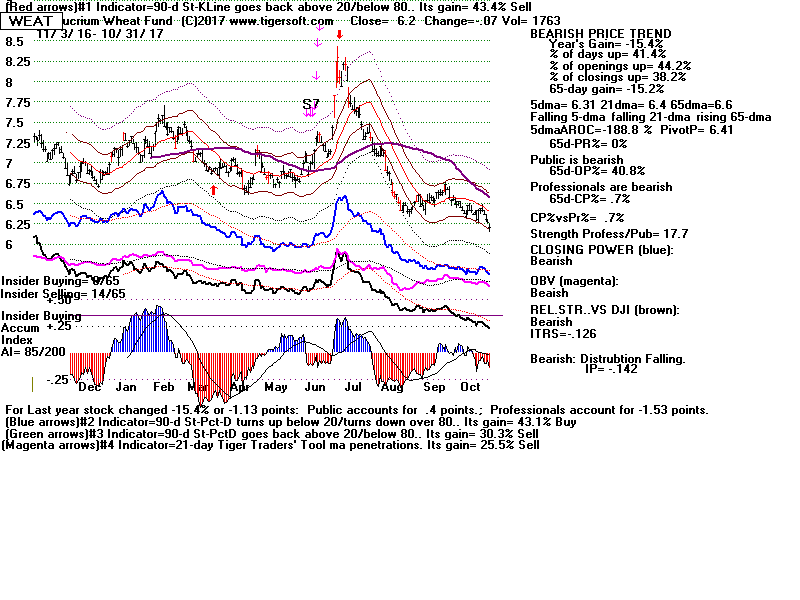
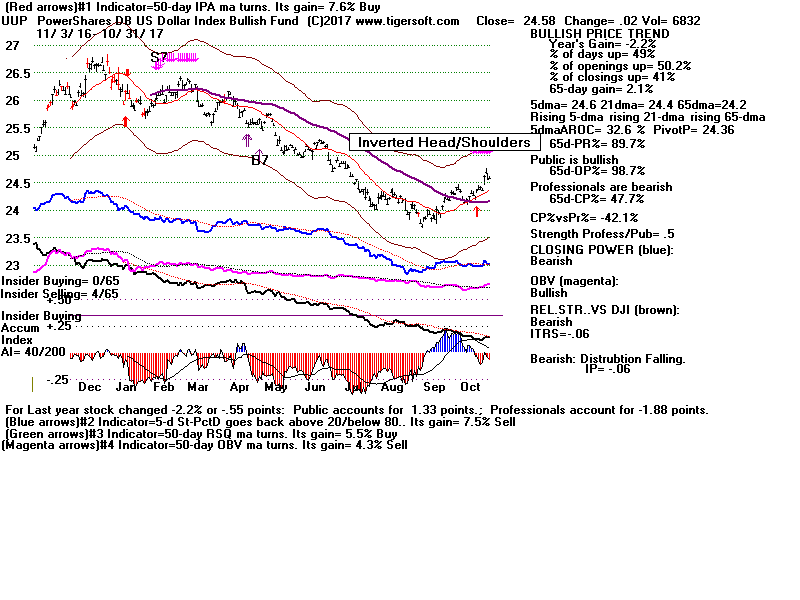
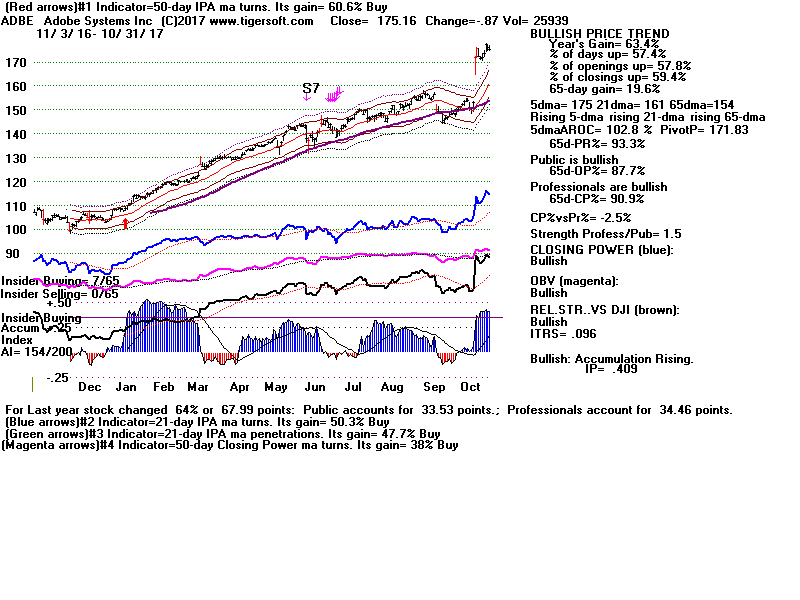
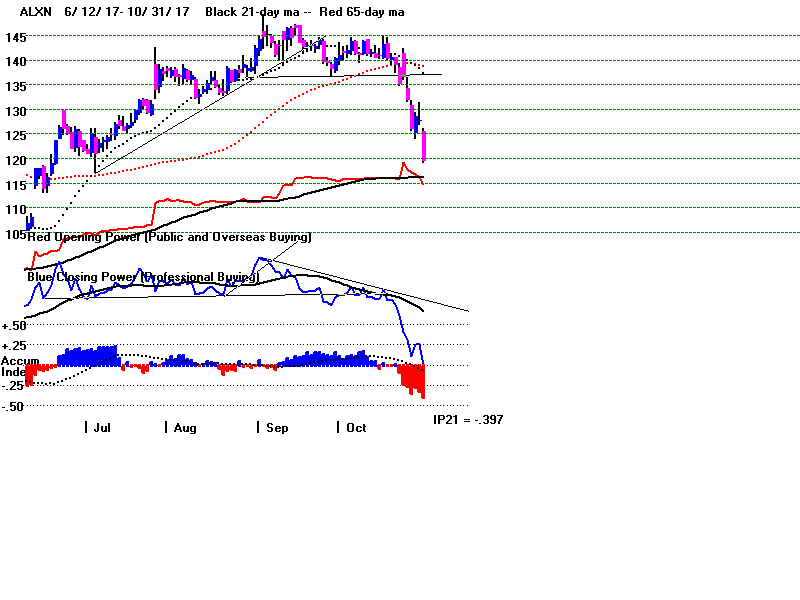
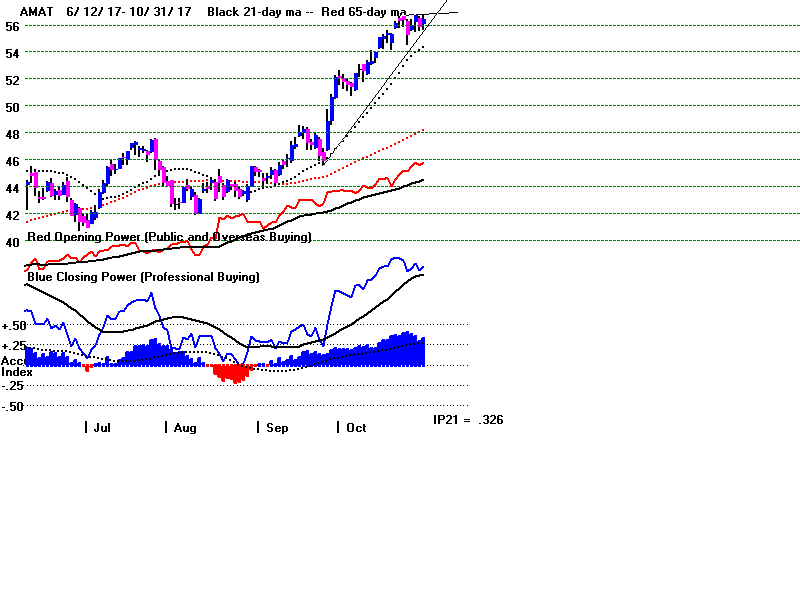
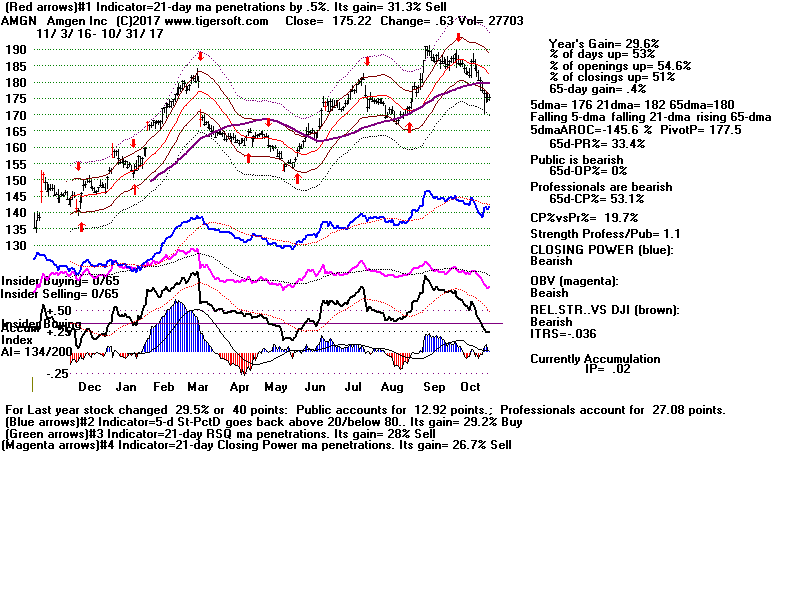
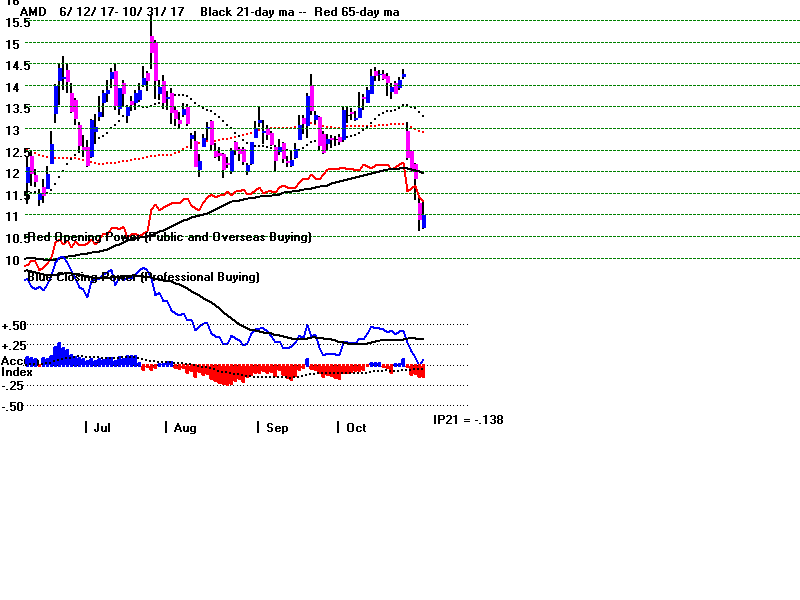
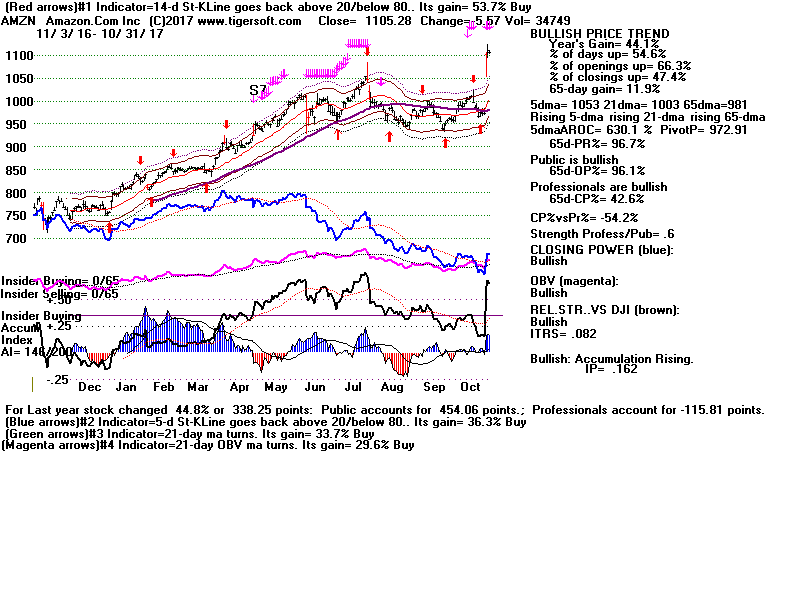
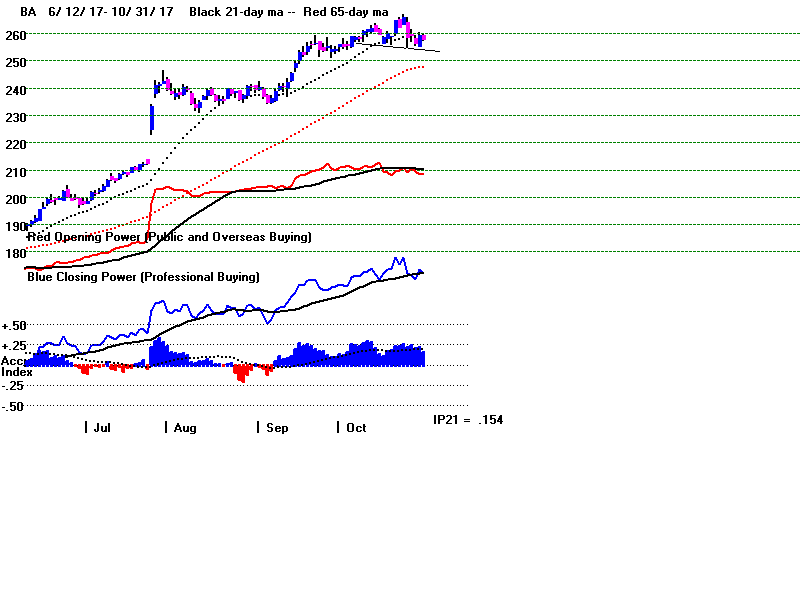
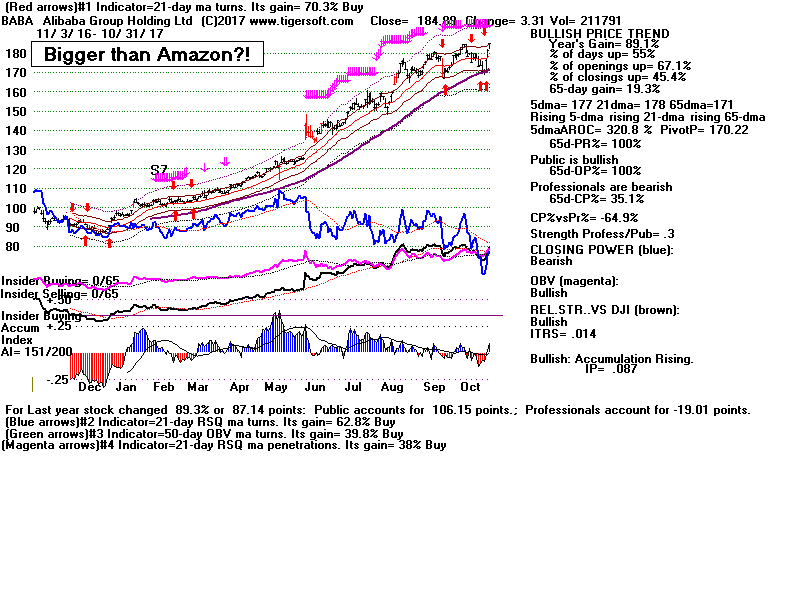
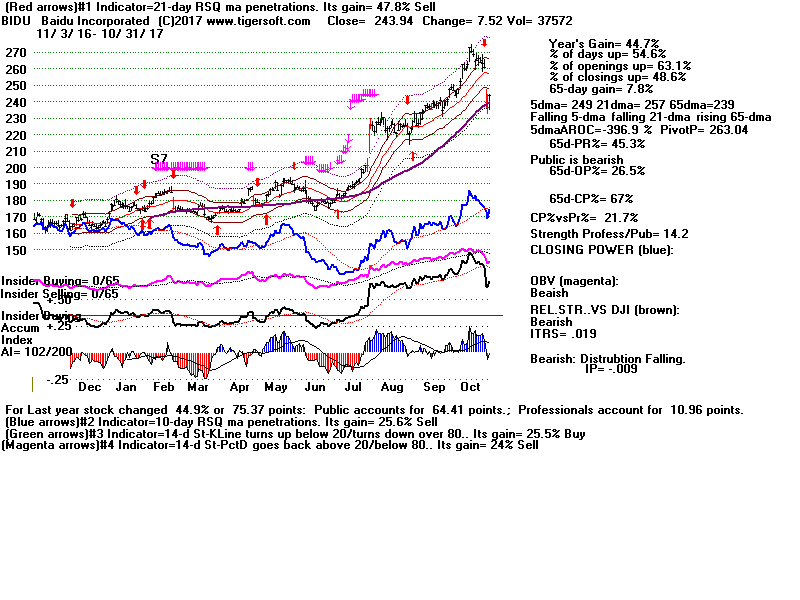
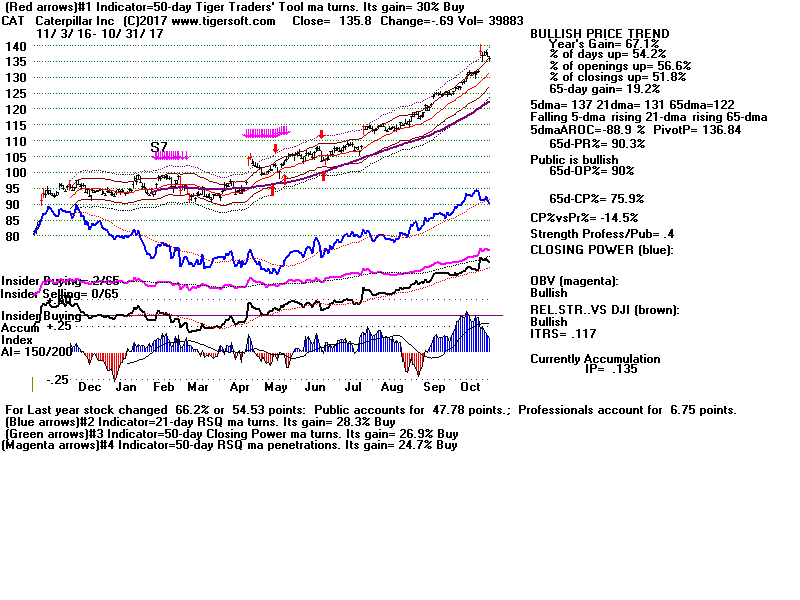
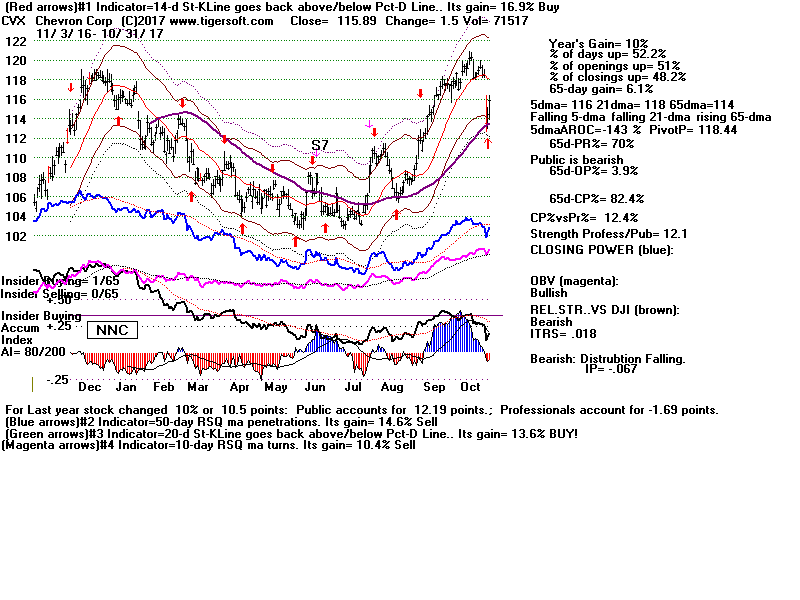
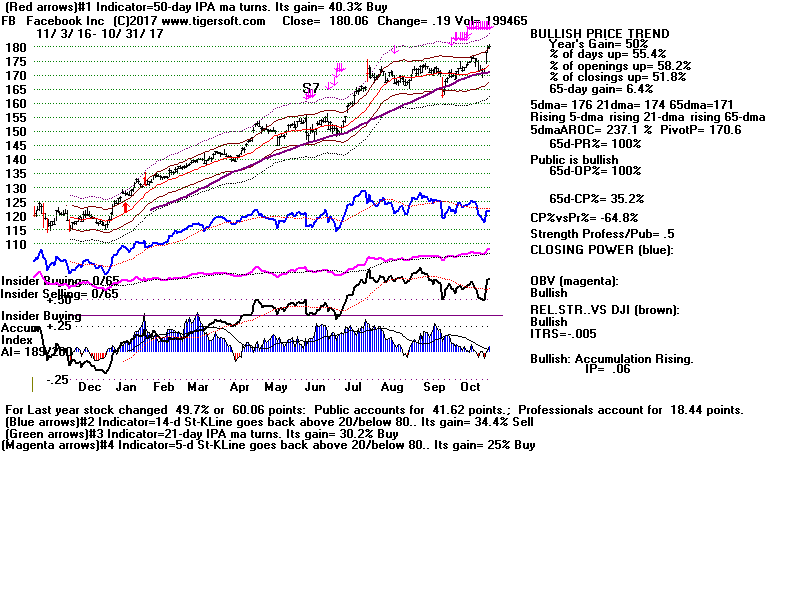
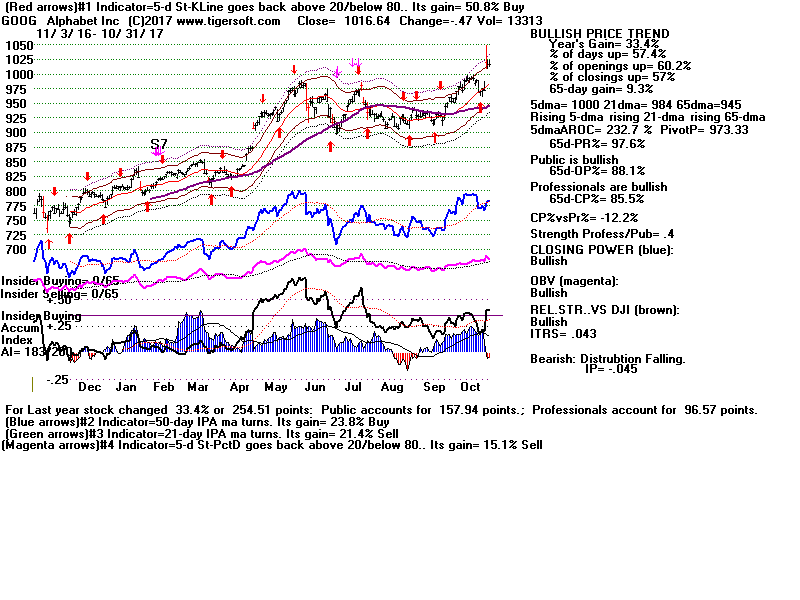
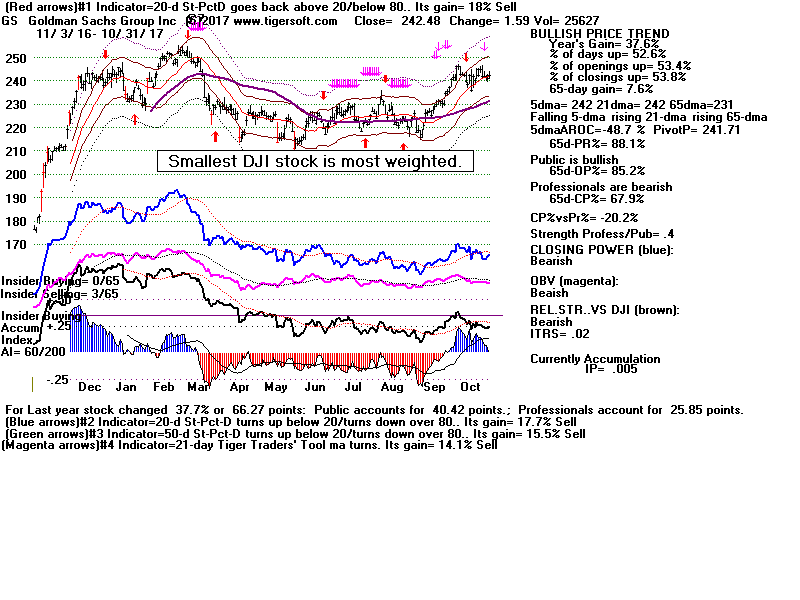
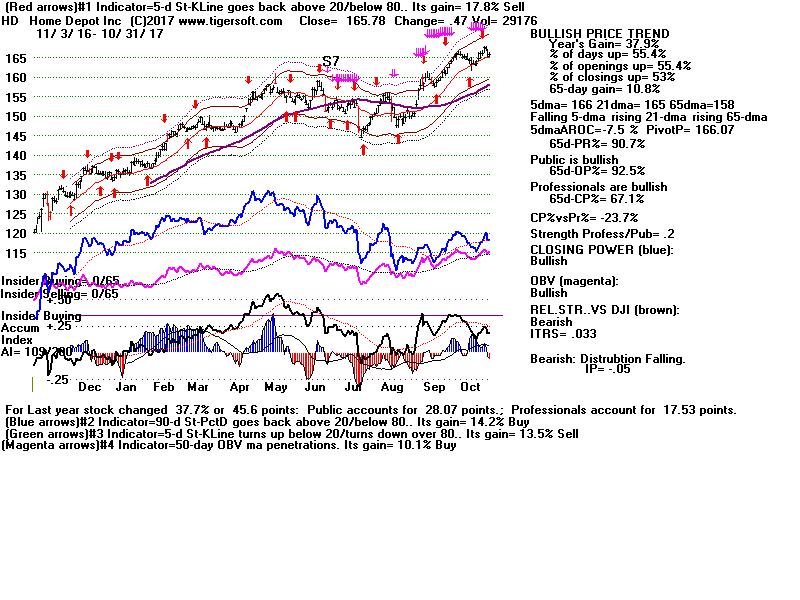
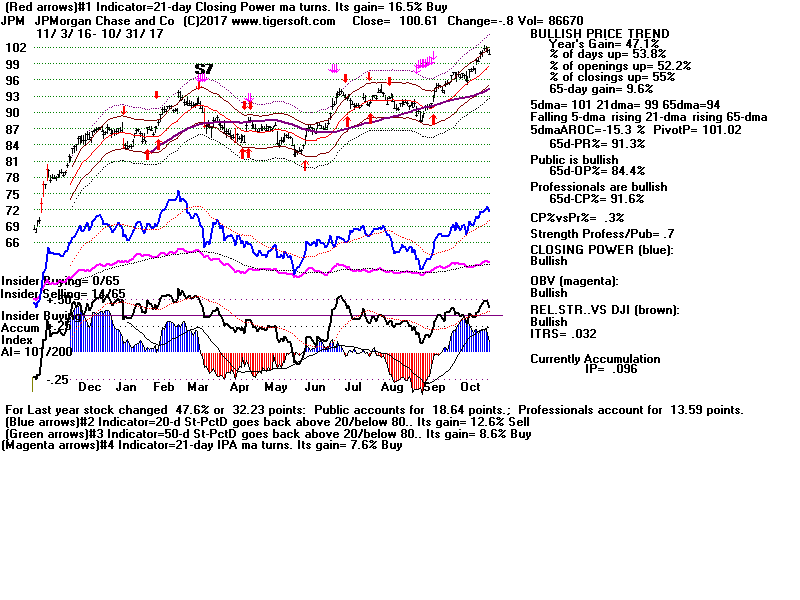
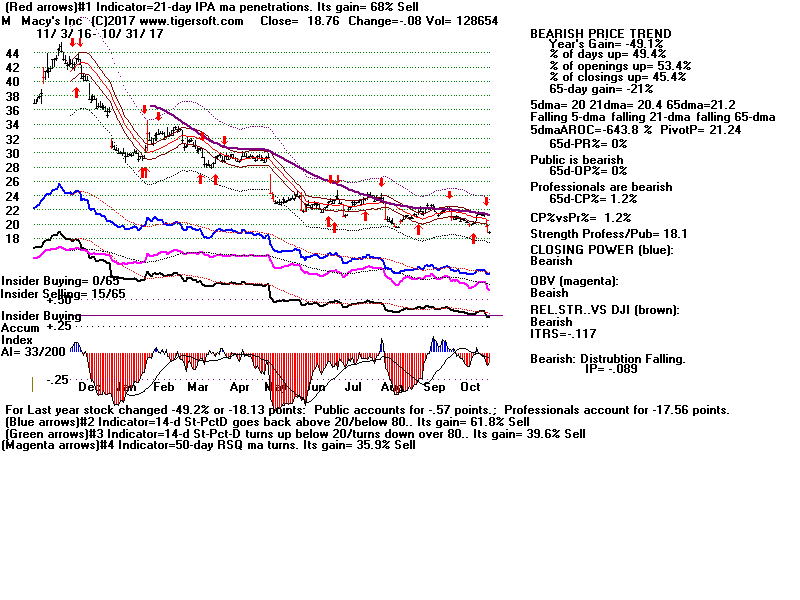
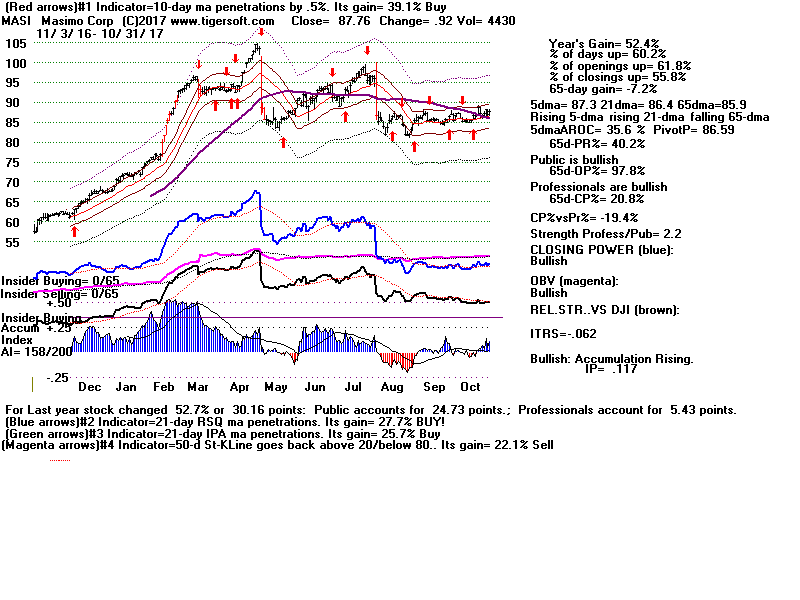
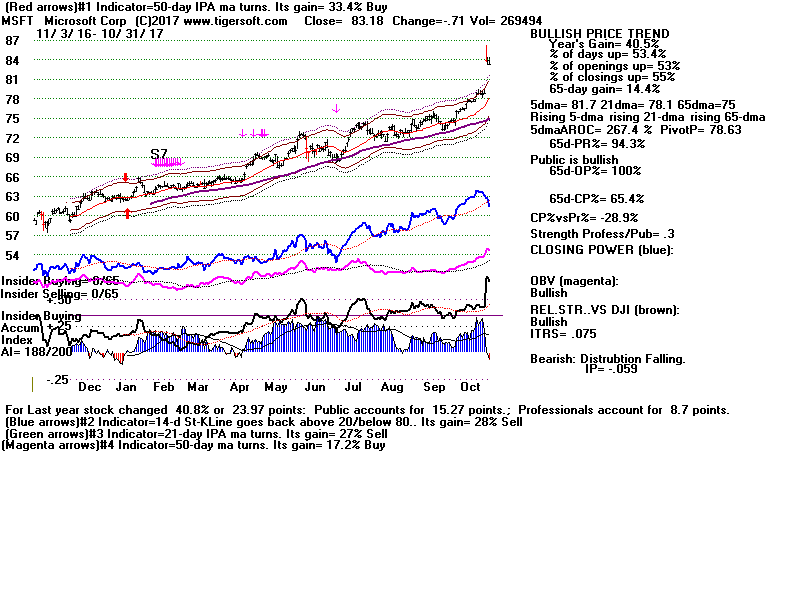
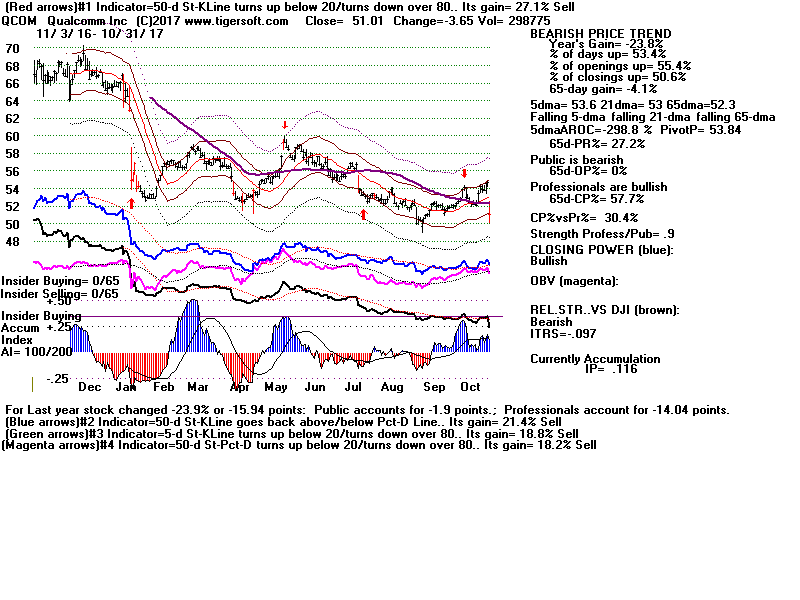
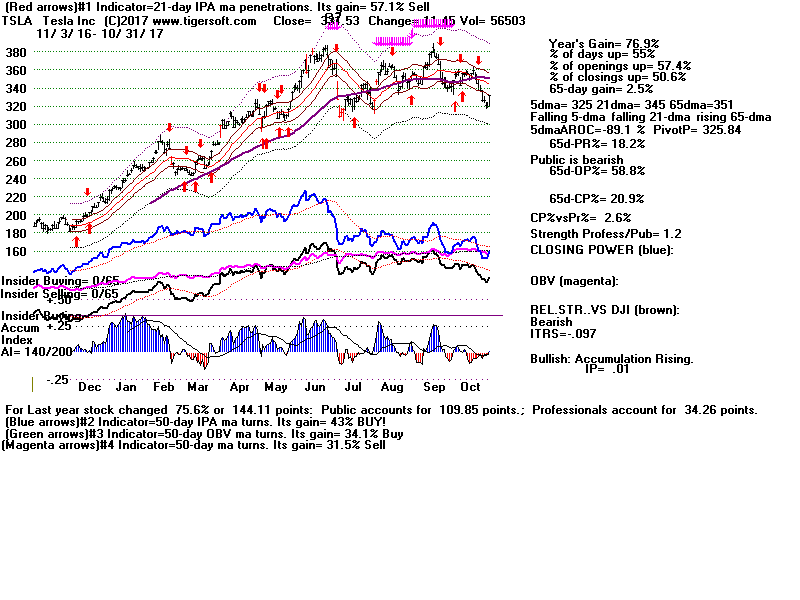
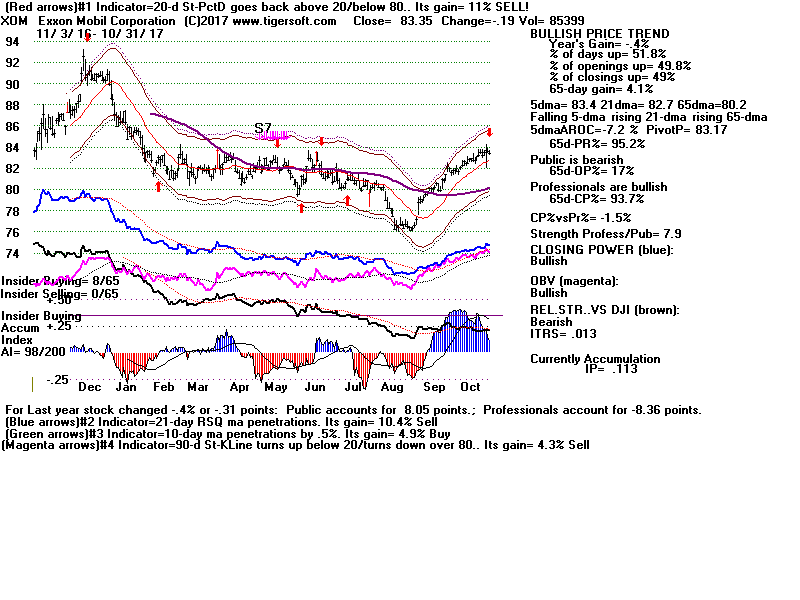
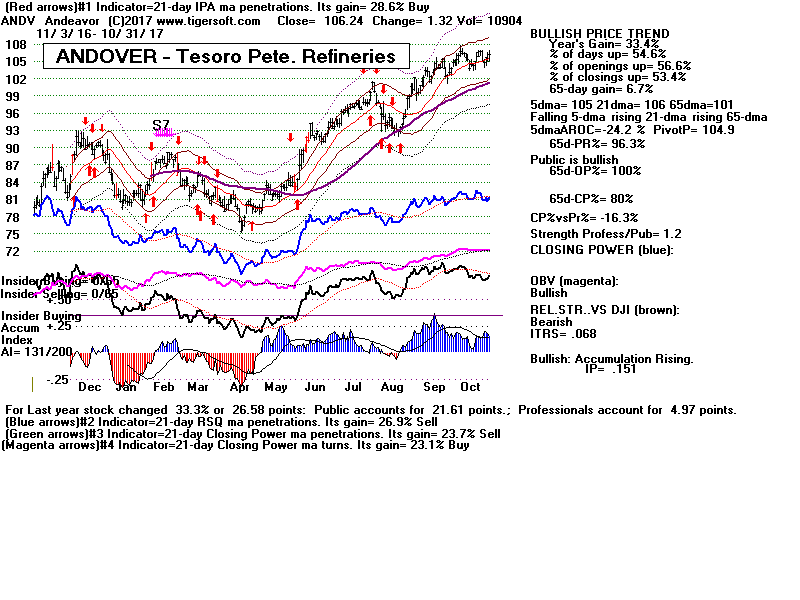
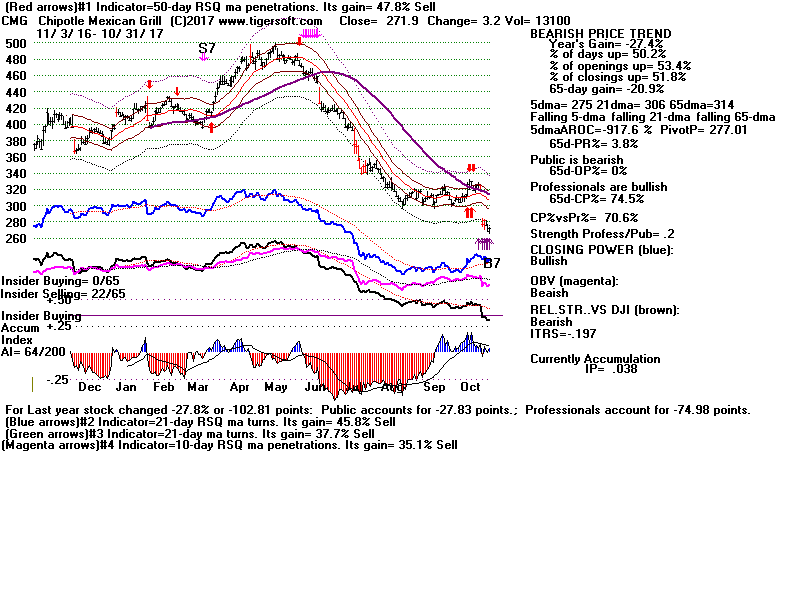
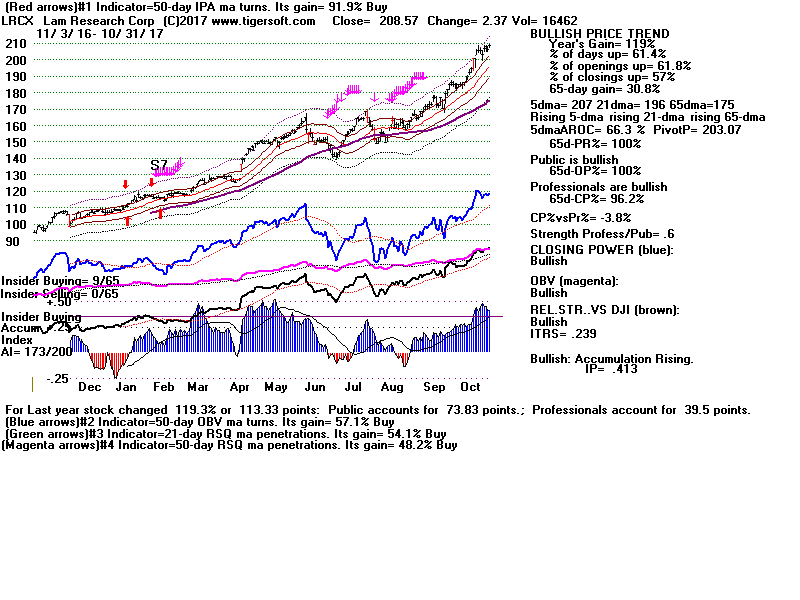
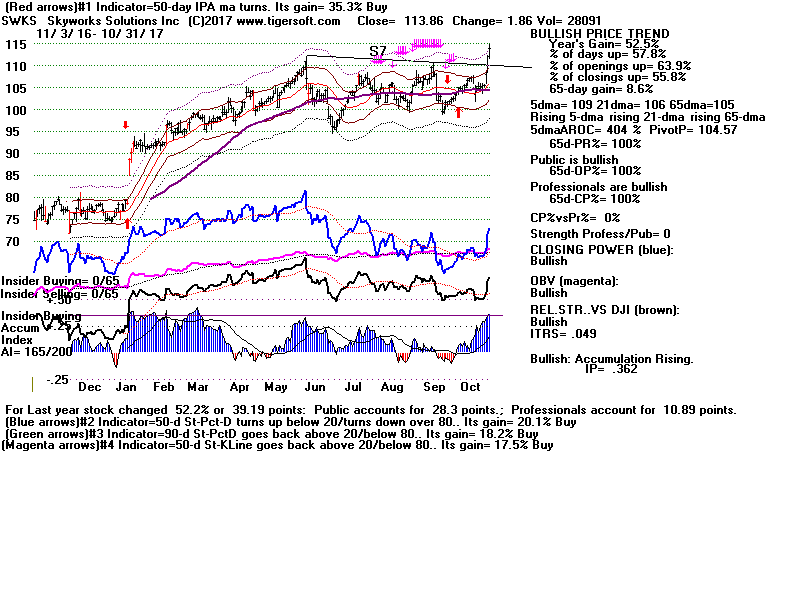
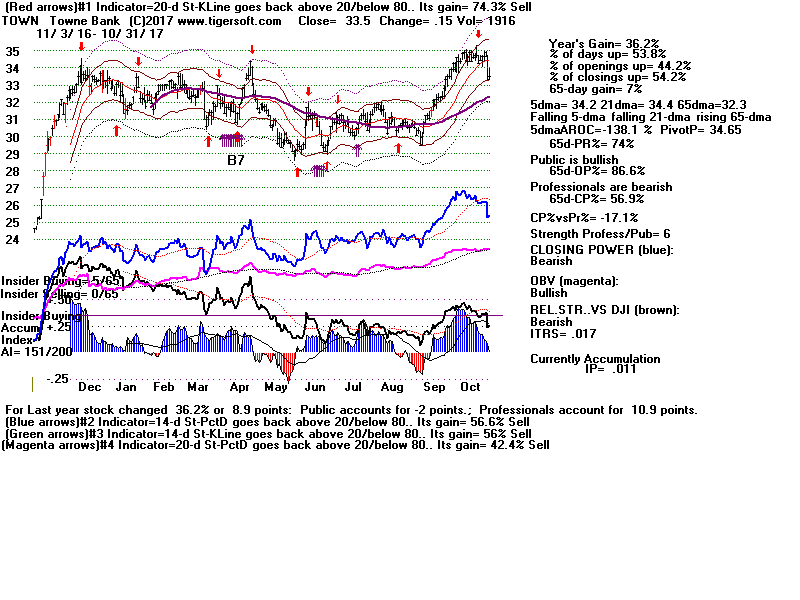
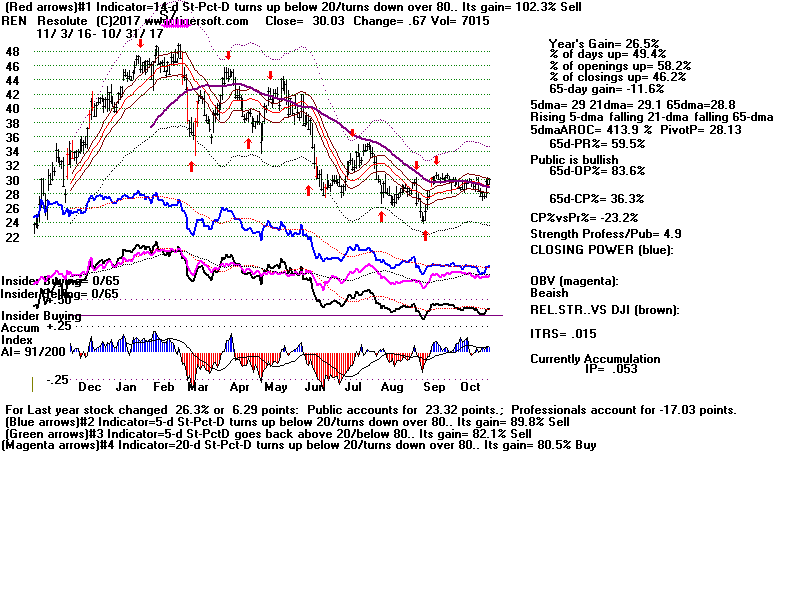
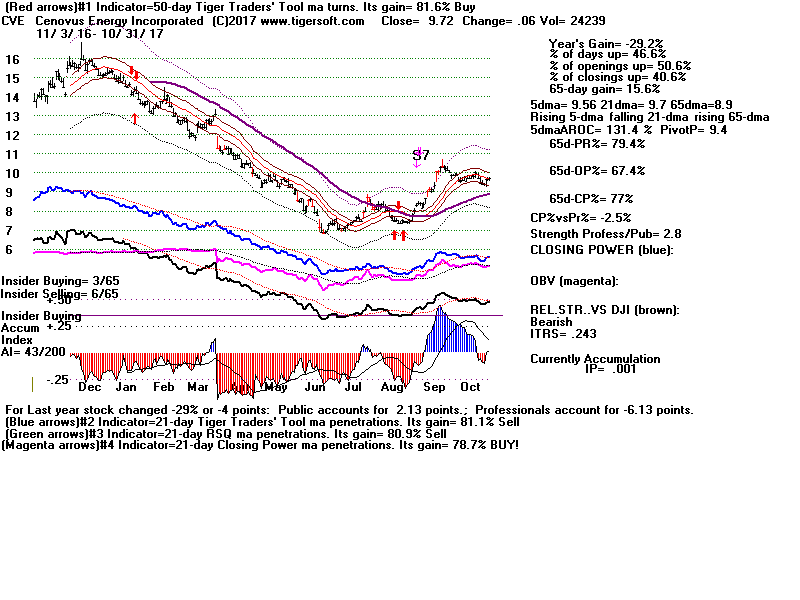
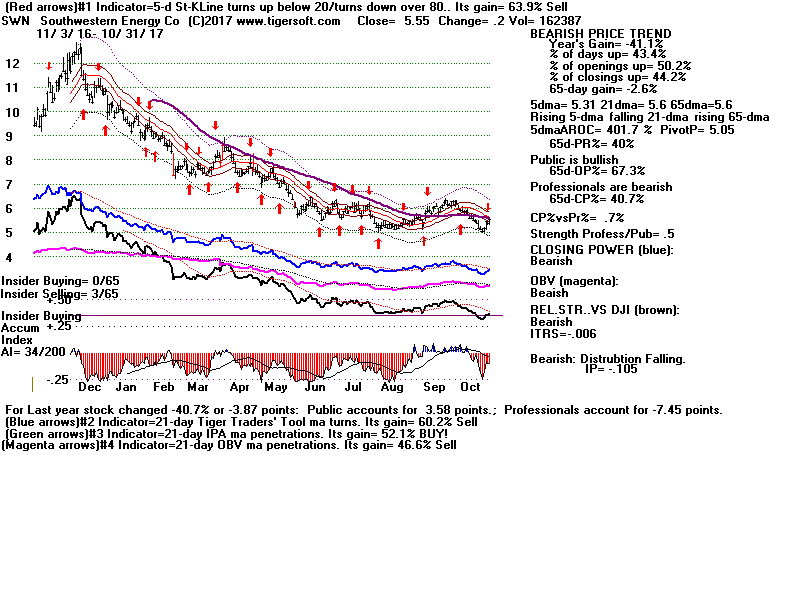
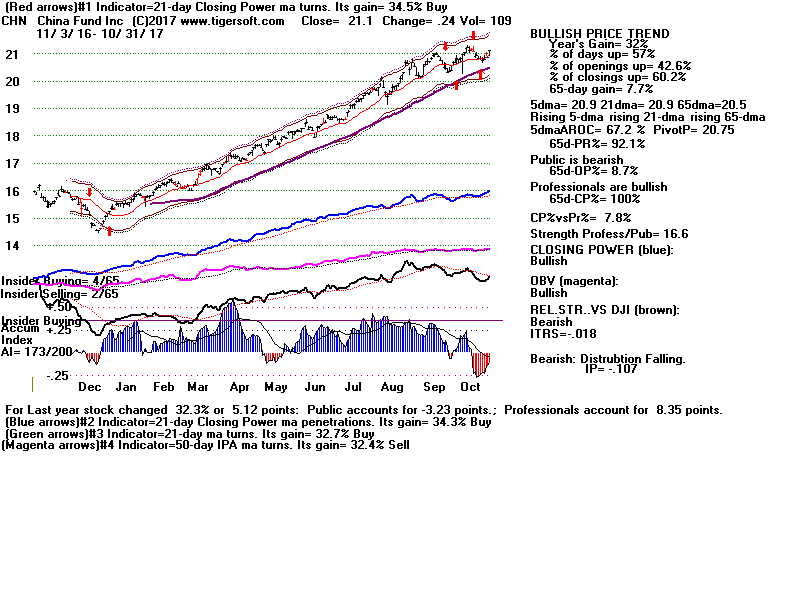