Earlier Hotlines
previous
hotline
www.tigersoft.com/H77LION/INDEX.htm
www.tigersoft.com/H7TBR/INDEX.htm
www.tigersoft.com/HH9911/INDEX.htm
http://www.tigersoft.com/HH9911/olderINDEX.htm
http://www.tigersoft.com/HHH517/INDEX.htm
www.tigersoft.com/HHH517/XXXIndex.htm
www.tigersoft.com/HHH517/INDEX6917.htm
www.tigersoft.com/HHH517/OLDER.html
www.tigersoft.com/HH747/INDEX.html
www.tigersoft.com/HHLL217/INDEX.html
PREINDEX.html
www.tigersoftware.com/HL/INDEX.html
Hotlines: 2/4/2017 - 2/15/2017
These have somehow become corrupted. Some graphs
may be missing.
http://www.tigersoft.com/345HLN12/ZINDEX.html
http://www.tigersoft.com/333HLLL/INDEX.html
http://www.tigersoft.com/444HL444/INDEX.html
www.tigersoft.com/119HLPAZ/INDEX.html
http://www.tigersoft.com/888HLAZ/INDEX.html
www.tigersoft.com/821-HL/INDEX.html
http://www.tigersoft.com/816-HLN/INDEX.html
http://www.tigersoft.com/77HL7778/INDEX.html
http://www.tigersoft.com/64HRL/INDEX.html
http://www.tigersoft.com/55HL55/INDEX.html
HELP
A
Guide To Profitably Using The Tiger Nightly HOTLINE
Introduction
to Tiger/Peerless Buys and Sells.
Peerless
Buy and Sell Signals: 1928-2016
Individual Peerless signals explained:
http://tigersoftware.com/PeerlessStudies/Signals-Res/index.htm
http://www.tigersoft.com/PeerInst-2012-2013/
Explanation of each Peerless signal.
http://www.tigersoft.com/PeerInst-2012-2013/
Different
Types of TigerSoft/Peerless CHARTS, Signals and Indicators
-----> More HELP LINKS
Documentation
for TigerSoft Automatic and Optimized Signals.
How
reliable support is the DJI's rising 200-day ma?
SPY
Charts since 1994: Advisory Closing Power S7s, Accum. Index, 65-dma,
Optimized Signals.
^^^^^^^^^^^^^^^^^^^^^^^^^^^^^^^^^^^^^^^^^^^^^^^^
1/19/2016 --->
Corrections,Deeper Declines and Bear Markets since 1945.
1/21/2016
--->
High Velocity Declines since 1929
2/12/2016 --->
Presidential Elections Years and Bullish IP21 Positive Non-Confirmations at
Lower Band.
2/12/2016 --->
OBV NNCs
on DJI's Rally to 2.7% Upper Band when DJI's 65-dma is falling.
11/6/2016 --->
Killer Short Selling Techniques:
===>
Order Here
($42.50)
It's As Easy as
1,2,3
TigerSoft "Combination" Short-Selling...
Easy as 1-2-3 Short Sales
Earlier
Q-Answers
QuickSilver
Documentation (1/11/2016)
Our Different Signals
Better
understand the difference between Peerless DJI-based signals,
the one-year optimized red Signals
and the fixed signals based
on technical developments.
Introduction to
Tiger/Peerless Buys and Sells.
Different
Types of TigerSoft/Peerless CHARTS, Signals and Indicators
New
TigerPeerless
Installation and Basic Uses' Instruction
(11/25/2016)
See
the re-written materials on TigerSoft Buys and Sells.
A few more pages will be added. But users could
print this
main Installation and Uses' Page for reference.
Study-
Trading SPY WITHOUT Peerless - Some Guidelines.
When completed this will be
a new Tiger Trading E-Book.
Study-
Examples of "Hands above the Head" top patterns.
Study-
9/3/2017
TigerSoft (not
Peerless) charts of Major Tops as they occurred.
-------------------------------------------------------------------------------------------------------------
Watch the Bubble here:
Bitcoin -
https://finance.yahoo.com/quote/BTC-USD?p=BTC-USD
18,123.80
-847.39
(-4.4667%)
===> Please report any broken
or out-of-date links.
william_schmidt@hotmail.com
==============================================================================
==============================================================================
12/18/2017

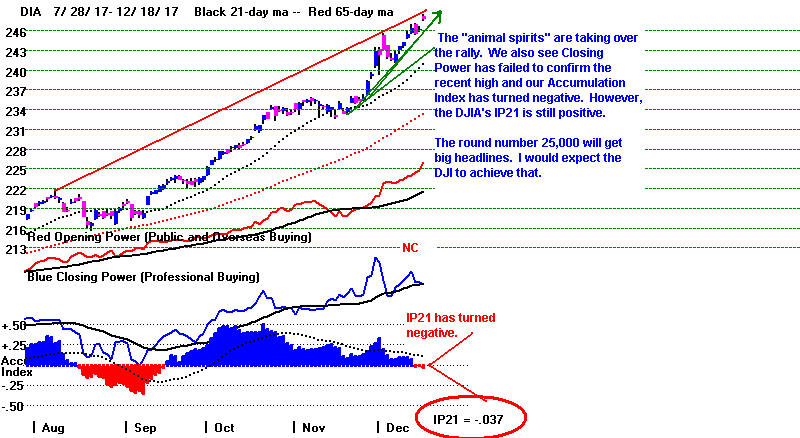
25000 - Here
we come. The September
Buy B21 still operates.
The
DJI easily jumped to another new
high today. Its advance was more than matched by
SPY,
the NASDAQ,
QQQ and TECL.
Powered by TXN's new highs,
semi-conductors have bullishly turned
back up after
testing their 65-dma. The week before Christmas is usually bullish.
Since 1965,
the DJI has
rallied 69% of the time over the next 5 trading days and has gained on
average
1% over the
next ten days and 1.9% over the next month. DIA's IP21 is negative and
it is the
Public and foreign money which is now pushing up the DJI. But the DJI
is on a
mission.
It wants to reach 25,000 by Christmas and make big, splashy headlines to
induce
still more
buying. Today there was a big jump in the number of stocks above their
65-day ma.
The
percentage rose from 54% to 59%. The advance is lifting more and more
boats.
.
A buying stampede is
under way. Among stocks, the strongest
Bullish MAXCPs are the leaders,
but we are
getting trading bounces in the stocks showing new
red Stochastic Buys that
have rising
65-dma. And today, more buy outs were announced. See the list at
this site:
http://www.mergerjournal.com/2016/12/19/mergers-acquisitions-and-buyouts-announced-on-December-19-2016/
(I want to start posting some of these charts each night. See further
below.)
Crescendo or
Take-Off? Stay Tuned.
It has taken a
long time for the
markets to build up to this point in time. The Republican wager
on the
rich and Wall
Street is under way. If 1926 is the best guide, then we may see a
tradable
top
in February. But if the
market follows the scenarios posed by the the tax cuts of 1964 and 1986,
then we are not
likely to see a top in April. This second scenario is interesting
because that
is that is
most frequent outcome after a September B21. In any case, enjoy the
rally
and "don't
try to call a top ahead of Peerless" has to be my counsel.
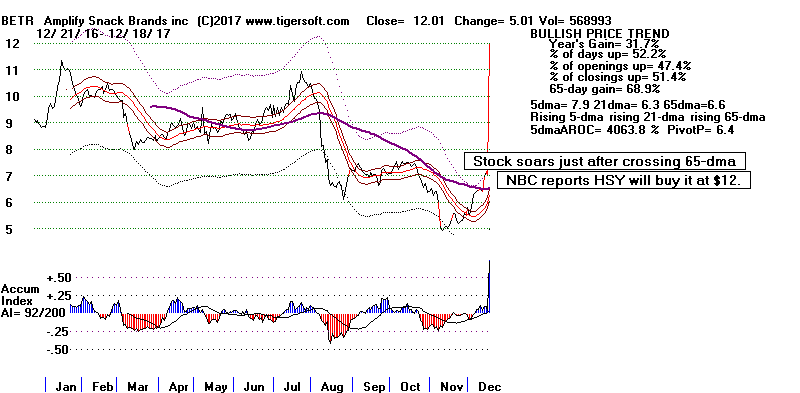
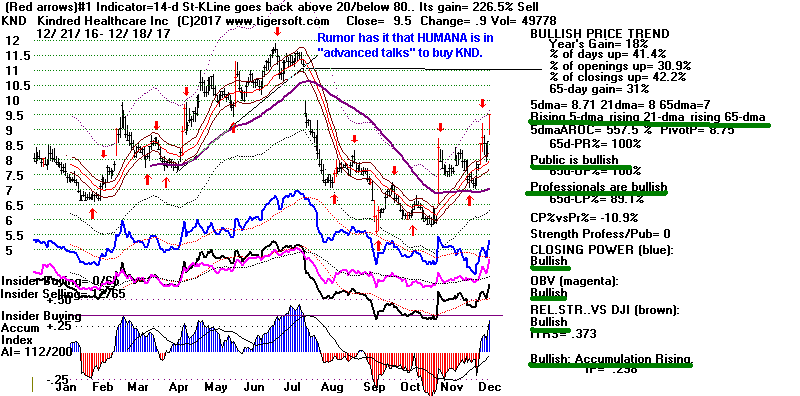
BUY-OUT NEWS TODAY
Charts 12/18/2017
PEERLESS
DJI, Signals, Indicators Daily DJI
Volume 10-DayUp/Down Vol
DJI-AROC
Hourly DJIA
A/D Line for All Stocks
NASDAQ
S&P
OEX
NYSE
COMPQX
DJI-15 DJI-20
DJI-30
DIA
SPY
QQQ MDY
IWM TNA
CrudeOil
FAS
GLD
BBH
IBB
JETS
JNUG
KOL
NUGT
OIH
OIL
RSX
RETL
SDS
SLV
SOXL
TECL
TMF
TNA UGA
(gasoline)
XIV YINN
Commodities:
JJC, NIB,
CHOC
CORN,
WEAT
UUP
(Dollar)
AAPL ADBE
ALXN AMAT
AMGN AMD
AMZN
BA BABA BAC
BIDU
CAT
CVX
FB
GOOG
GS
HD
IBM
JPM M
(Macy's)
MSFT
NFLX
NVDA
QCOM
TSLA TXN
XOM WMT
ANDV (refinery),
CMG (Chipotle),
LRCX, SWKS,
TOWN New -
SPPI
(small Biotech)
12/18/2017
Bullish MAXCPs Bearish
MINCPs
Red Stoch.-Buys Today
|
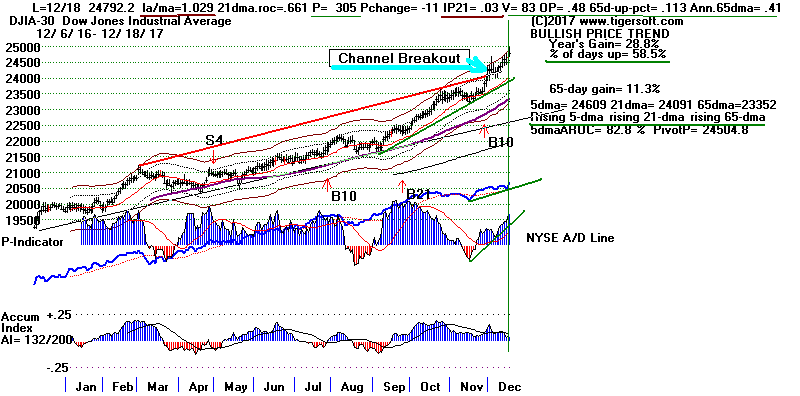 |
Table 1
QuickSilver
Documentation
This is for short-term trading
leveraged ETFs.
It also provides a useful short-term outlook of these sectors ETF's
and the sectors they represewnt
Blue is Bullish
and
Red is Bearish.
1 Candle-Stick color is shortest-term. This
changes when close vis-a-vis opening changes.
So, in stocks or ETFs that advanced a long ways, traders should sell
when a higher
opening gives way to a decline that brings a drop below the previous
day's close.
2 5-dma AROC and Close-versus- pivot point is next
most short-term.
W = warning. Close is below PIVOT-Point.
3 Closing Power trend-direction vs. its 21-dma is next
most short-term.
4 IP21 is used to spot divergences and to estimate
underlying support.
5 > IP21 falling and below +.15 and its 21-dma is bearish in
an over-extended ETF, especially
when its Closing Power is falling and is below its 21-dma.
> IP21 below 07 with AROC below .07 is less likely to bring a rally
back up from 21-dma.
6 Note price trend-lines, support/resistance and price
patterns on charts.
QUICKSILVER on ETFS - 12/18/17
ETF      CLOSE   CHANGE     PIVOT-PT   5-dma AROC   CL-PWR      CANDLE  IP21     ITRS
---------------------------------------------------------------------------------------------
---------------------------------------------------------------------------------------------
DIA       247.79    1.54     245.44        73.7%    ----         RED   -.036     ----
---------------------------------------------------------------------------------------------
COMPQX    6994.76  58.18    6862.32        87.0%    ----         BLUE   .063    -.028
---------------------------------------------------------------------------------------------
SPY       268.2    1.69      266.78        35.5%    Bullish      BLUE   .029    -.035
---------------------------------------------------------------------------------------------
QQQ       158.64    .99      155.69        87.7%    ----         BLUE   .061    -.015
---------------------------------------------------------------------------------------------
MDY       346.03    3.56     343.22        27.9%    Bearish      BLUE  -.138    -.042
---------------------------------------------------------------------------------------------
IWM       154.3    2.06      150.88        97.5%    Bearish      BLUE  -.079    -.061
---------------------------------------------------------------------------------------------
FAS       69.79    1.43      69.39         151.6%   Bearish      BLUE  -.057     .101
---------------------------------------------------------------------------------------------
RETL      36.87    2.78      33.53         251.7%   Bullish      BLUE   .224     .189
---------------------------------------------------------------------------------------------
SOXL      146.81    9.27     132           400.8%   Bearish      BLUE  -.052     .124
---------------------------------------------------------------------------------------------
TECL      119.1    2.99      112.44        286.2%   ----         BLUE   .099     .186
---------------------------------------------------------------------------------------------
IBB       106.36   -.24      105.76        6.1%     Bearish      RED    .03     -.152
---------------------------------------------------------------------------------------------
GLD       119.73    .55      118.15        72.5%    ----         BLUE   .016    -.1
---------------------------------------------------------------------------------------------
OIL       6.12   -.02        6.12         -89.8%    Bearish      ----   .079     .116
---------------------------------------------------------------------------------------------
OIH       24.33   -.09      W25.24        -177%     ----         BLUE  -.053    -.132
---------------------------------------------------------------------------------------------
GASL      20.96    1.14     W22.02        -381.7%   Bearish      BLUE  -.228    -.157
---------------------------------------------------------------------------------------------
UGA       30.11    .24      W30.6         -165%     Bearish      BLUE   .007    -.003
---------------------------------------------------------------------------------------------
UUP       24.37   -.06      W24.48        -14.3%    ----         BLUE   .042    -.089
---------------------------------------------------------------------------------------------
IEF       105.88   -.24      105.75        1.9%     Bullish      RED    .147    -.091
---------------------------------------------------------------------------------------------
CORN      16.58    .01      W16.65        -36%      ----         ----  -.087    -.137
---------------------------------------------------------------------------------------------
WEAT      5.9    .01         5.81          42.6%    Bearish      ----  -.134    -.185
---------------------------------------------------------------------------------------------
YINN      32.2    .47        31.26         1.6%     ----         BLUE   .045    -.103
---------------------------------------------------------------------------------------------
RSX       21.09   -.84      W21.92        -209.1%   Bearish      ----  -.092    -.136
---------------------------------------------------------------------------------------------
AAPL      176.42    2.45     171.7         108.7%   Bullish      BLUE   .108     .047
---------------------------------------------------------------------------------------------
GOOG      1077.14    12.95   1040.48       172.1%   Bullish      BLUE   .038     .011
---------------------------------------------------------------------------------------------
MSFT      86.38   -.47       85.58         67.2%    Bullish      RED    .059     .048
---------------------------------------------------------------------------------------------
AMZN      1190.58    11.44   1165.08       92.5%    Bearish      BLUE   .029     .114
---------------------------------------------------------------------------------------------
FB        180.82    .64      176.96        49.8%    Bearish      RED   -.054    -.039
---------------------------------------------------------------------------------------------
NVDA      197.9    6.34       190.84        85.3%   Bearish      BLUE  -.048     .003
---------------------------------------------------------------------------------------------
BA        296.14    2.2      289.94        223.4%   Bullish      BLUE  -.014     .056
---------------------------------------------------------------------------------------------
GS        260.02    2.85     257.68        193.8%   ----         ----  -.114    -.032
|
Table 2 COMPARISONS
OF BULLISH AND BEARISH GROUPS
12/16 12/15 12/14 12/13 12/12 12/11
12/8 12/7 12/6 12/5
12/4 12/1 11/30 11/29 11/28
11/27 11/24 11/21 11/20 11/17
NEWHIGHS
553 309
103
268 223 234 288 159 91 107 340 197 536 500 582
209 439 615
363 244
NEWLOWS 43 49 56 25 52
41 37 50 65 53 37 16 31 57 265 59 31 62 50 229
-----------------------------------------------------------------------------------------------------------------------------------------------------------------------------------------
MAXCPs
133
122 53
123
83 84 90 90
50
42
92 105 266 262 320
101 166
406 339 295
MINCPs
76
65 142 67 99 75 93 73
141
135 152 93 80 110 93
94 42 63 52 40
----------------------------------------------------------------------------------------------------------------------------------------------------------------------------------------
TTTNHs
146 118
75 110 72 73 76 75 46
44
72 53 139
161 143 79 110 196 172 169
TTTNLs
90 98 192
99 161 155 177 109 219 248
402 286 162 230 124 144
66 186 184 79
-----------------------------------------------------------------------------------------------------------------------------------------------------------------------------------------
FASTUP
166 126 123 175
101
108 96 80
79
95
180 126
128 130 141 143 205 245 189 158
FASTDOWN
96 125
109 91 132 134 169
195 233 248 210 156 123 97 74 64 58 72 100 136
|
Table 3Count of Stocks and New Highs in Key Tiger Directories
Date = 171218
No NHs Pct.
-------------------------------------------------------------------
BIGBANKS 7 4 57 %
DJI-13 13 6 46 %
BIGMIL 6 2 33 %
DOWJONES 30 10 33 %
INDEXES 195 61 31 %
TRANSP 20 6 30 %
MORNSTAR 238 66 28 %
INFRA 11 3 27 %
SP-100 96 24 25 %
FINANCE 92 19 21 %
ETFS 65 13 20 %
NASD-100 105 20 19 %
RETAIL 53 10 19 %
MILITARY 38 7 18 %
NIFTY 30 5 17 %
COMPUTER 23 4 17 %
GREEN 31 5 16 %
SP500 486 78 16 %
==================================================================
RUS-1000 838 118 14 %
HOMEBLDG 17 2 12 %
SOFTWARE 66 8 12 %
CHEM 64 7 11 %
REIT 178 19 11 %
JETS 9 1 11 %
INDMATER 92 9 10 %
BEVERAGE 20 2 10 %
INSURANC 32 3 9 %
HACKERS 25 2 8 %
GAMING 28 2 7 %
REGBANKS 33 2 6 %
ELECTRON 179 11 6 %
SEMI 131 8 6 %
AUTO 39 2 5 %
SOLAR 21 1 5 %
BIOTECH 386 15 4 %
OILGAS 142 2 1 %
COMODITY 71 1 1 %
======================================================
None: CHINA COAL GOLD EDU UTILITY
PIPELINE FOOD BONDFUND HOSPITAL
|
 |
Table 4
 RANKING OF KEY DIRECTORIES BASED PCT.OF STOCKS ABOVE 65-DMA
             12/18/17
 Bullish = 35
 Bearish = 9
---------------------------------------------------------------------------------------
Directory     Current       day-1         day-2         day-3         day-4         day-5
----------------------------------------------------------------------------------------
DJI-13         100%          1             1             1             1             1
INFRA          1             .818          .818          .909          .909          1
JETS           1             .888          .888          .888          .888          .888
TRANSP         1             .9            .8            .9            .9            .9
DOWJONES       .933          .9            .9            .866          .833          .9
BIGBANKS       .857          .857          .857          1             1             1
MORNSTAR       .852          .806          .731          .794          .81           .81
FINANCE        .847          .76           .684          .695          .717          .684
BIGMIL         .833          .833          .833          .833          .833          .833
SP-100         .822          .802          .791          .822          .812          .843
N=10
-------------------------------------------------------------------------------------------
RETAIL         .792          .754          .716          .735          .754          .773
REGBANKS       .787          .696          .515          .696          .696          .636
NIFTY          .766          .7            .7            .733          .733          .666
SP500          .761          .728          .693          .738          .744          .753
RUS-1000       .743          .696          .659          .71           .718          .72
MILITARY       .736          .71           .657          .71           .71           .684
EDU            .714          .571          .428          .714          .714          .714
GAMING         .714          .678          .678          .678          .75           .714
HOMEBLDG       .705          .647          .647          .705          .705          .705
BEVERAGE       .7            .65           .65           .6            .6            .55
INDEXES        .697          .646          .676          .707          .687          .671
HACKERS        .68           .68           .68           .6            .6            .64
NASD-100       .676          .647          .657          .657          .647          .609
REIT           .662          .617          .528          .539          .528          .483
SOFTWARE       .651          .59           .575          .606          .59           .59
GREEN          .645          .548          .516          .612          .645          .58
AUTO           .641          .538          .435          .512          .564          .564
ETFS           .63           .446          .523          .584          .523          .6
COMPUTER       .608          .608          .521          .565          .565          .565
ELECTRON       .608          .536          .458          .502          .502          .519
CHEM           .593          .5            .406          .5            .484          .5
INSURANC       .593          .625          .5            .593          .656          .625
INDMATER       .586          .565          .456          .5            .532          .521
SEMI           .58           .465          .389          .427          .412          .442
SOLAR          .523          .476          .476          .476          .428          .523
=============================================================================================
COAL           .5            .375          .375          .375          .375          .375
HOSPITAL       .5            .5            .375          .5            .5            .375
=============================================================================================
OILGAS         .471          .38           .394          .45           .507          .5
UTILITY        .465          .581          .534          .581          .604          .697
CHINA          .453          .406          .453          .546          .39           .484
BIOTECH        .406          .409          .391          .432          .386          .401
COMODITY       .394          .352          .323          .323          .352          .352
GOLD           .204          .183          .142          .142          .122          .04
BONDFUND       .153          .171          .243          .216          .162          .27
PIPELINE       .142          .142          0             0             0             0
FOOD           .133          .133          .133          .133          .133          .066
N=9
|
| |
==============================================================================
==============================================================================
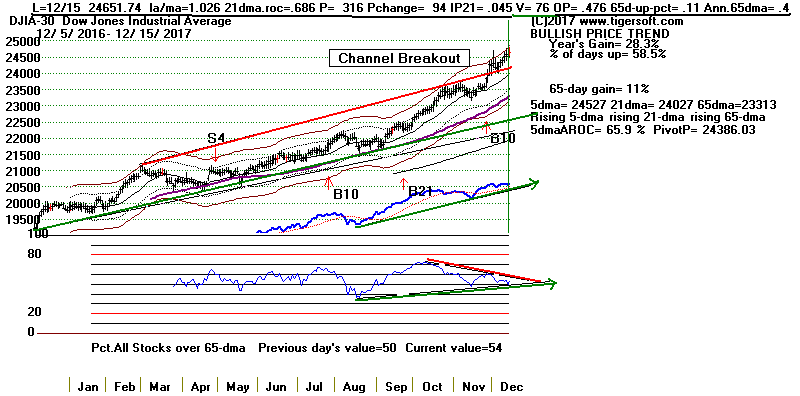
12/15/2017 The September
Buy B21 still operates. The
DJI is soaring into all-time
high territory where sell-orders cannot easily be bunched or placed
confidently.
The upwards momentum in the DJI is accelerating. See the blue
exponential
uptrend in the DJI chart below. The slope for this is Y = mx<>2.
Its steepness
is as high as the software currently allows. Besides this, the
NASDAQ's AI/200
score remains at a record high, 200 and QQQ burst into all-time high
territory.
There are many very bullish technical signs. The DJI's optimized lower band
around the
21-dma is at a record minimum, -1.5%. Short-term, the search for
optimized,
new Stochastic Buys produced lots more tonight than was seen at any time
this
past week. Apparently, a new market charge upwards is beginning.
We have to like the way the DJI has completely disregarded the often weak
seasonality
of the first two weeks of December. Hedge fund Bears have a big
problem now. They
must cover or lose clients when they write their year-end reports. All
this is occurring
at exactly the same time when other fund managers are engaging in aggressive
window-
dressing by buying leading DJI-30 stocks AND many corporations, flush with
more
and more cash, shop around for smaller companies that they can buy out.
(Regarding
Buyouts, see the discussion of FOXA and LNCE below.)
 BUBBLE
The only problem I can see now is the Bitcoin's
vertical advance. This is a bubble,
if ever there was one. It is backed by nothing but emotion and greed.
It will surely
end badly. Now that it is about to be traded in Chicago, shorts may
slow it down.
If it crashes badly, the spill-over could adversely affect normal financial
markets.
Watch its daily prices on Yahoo. It cannot escape Government controls
and
taxation. The Libertarians who think that they have found a way to do
this are
only fooling themselves and others. Wall Street and CBOE insiders will
know when
regulatory stresses will be placed on Bitcoin. I expect that we will
see a head/shoulder
top when it is ready to decline significantly.
https://finance.yahoo.com/quote/BTCUSD%3DX?p=BTCUSD%3DX
Puts and Calls on Bitcoins?
Current price chart:
https://www.worldcoinindex.com/coin/bitcoin
Is this the
equivalent of the 16th century tulip mania? Or 1929
stock market
Or Silver in 1980. Unregulated markets often yield hyperbolic rises
and then waterfall-declines.
Read
Extraordinary Popular Delusions and the Madness of Crowds (1841),
South Sea Bubble
and the
Mississippi Company. The Chicago Mercantile
Exchange (CME)
has announced it
plans to launch Bitcoin futures in the fourth-quarter of 2017.
http://www.cmegroup.com/education/cme-bitcoin-futures-frequently-asked-questions.html
https://www.cnbc.com/2017/12/08/with-bitcoin-futures-set-to-trade-heres-how-its-going-to-work.html
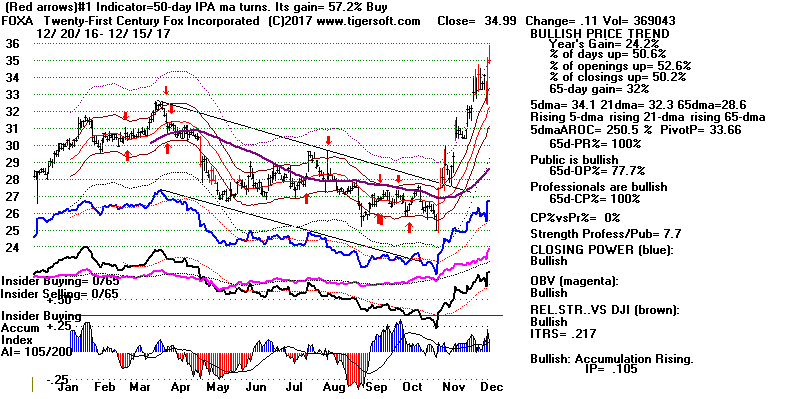
DIS Buyout of FOXA
Terms of this cautious buyout would seem to leave room for a possible
bidding war
and more FOXA stock appreciation. "In the fullness of time", this will
become
known. What is clear right now is that there were big buyers coming
into FOXA
in October, if we judge from the blue Accumulation on its price weakness
back then
followed by a big increase in volume. See how false looking the final
drop to 25
looked from our vantage point. This should be a technical pattern that
we can
profitably look for in other stocks, especially now that the general
regulatory and
financial climate for Buyouts and Mergers would seem to becoming favorable.
See
https://www.nytimes.com/2017/12/14/business/dealbook/disney-fox-deal.html

Flat Top Breakouts, High Accumulation and
Volume Surges
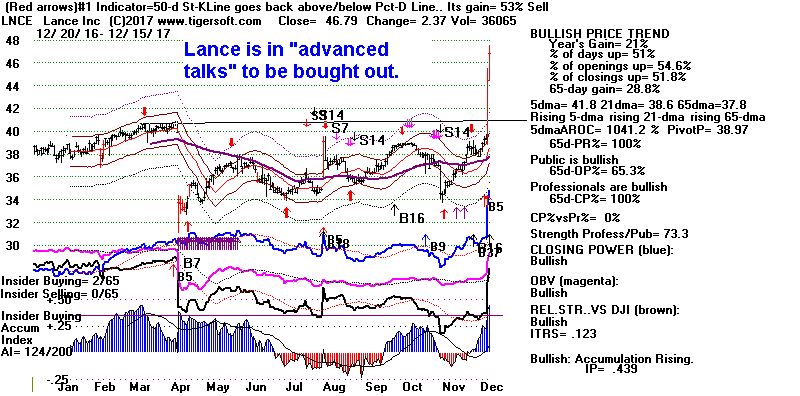
The second technical pattern often occurring just before a buy-out is
announced
is a flat-top breakout with excellent internals. See LNCE below.
In this case
the "secret talks" became public knowledge.
https://finance.yahoo.com/news/campbell-soup-advanced-talks-buy-220029970.html
In the regulatory and financial environment we are in it should pay folks to
consult
a site like
https://www.benzinga.com/news/rumors
and run their ideas through our
software to see if the patterns shown here are appearing.

Charts 12/15/2017
PEERLESS
DJI, Signals, Indicators Daily DJI
Volume 10-DayUp/Down Vol
DJI-AROC
Hourly DJIA
A/D Line for All Stocks
NASDAQ
S&P
OEX
NYSE
COMPQX
DJI-15 DJI-20
DJI-30
DIA
SPY
QQQ MDY
IWM TNA
CrudeOil
FAS
GLD
BBH
IBB
JETS
JNUG
KOL
NUGT
OIH
OIL
RSX
RETL
SDS
SLV
SOXL
TECL
TMF
TNA UGA
(gasoline)
XIV YINN
Commodities:
JJC, NIB,
CHOC
CORN,
WEAT
UUP
(Dollar)
AAPL ADBE
ALXN AMAT
AMGN AMD
AMZN
BA BABA BAC
BIDU
CAT
CVX
FB
GOOG
GS
HD
IBM
JPM M
(Macy's)
MSFT
NFLX
NVDA
QCOM
TSLA TXN
XOM WMT
ANDV (refinery),
CMG (Chipotle),
LRCX, SWKS,
TOWN New -
SPPI
(small Biotech)
12/15/2017
Bullish MAXCPs Bearish
MINCPs
Red Stoch.-Buys Today
Table 1
QuickSilver
Documentation
This is for short-term trading
leveraged ETFs.
It also provides a useful short-term outlook of these sectors ETF's
and the sectors they represewnt
Blue is Bullish
and
Red is Bearish.
1 Candle-Stick color is shortest-term. This
changes when close vis-a-vis opening changes.
So, in stocks or ETFs that advanced a long ways, traders should sell
when a higher
opening gives way to a decline that brings a drop below the previous
day's close.
2 5-dma AROC and Close-versus- pivot point is next
most short-term.
W = warning. Close is below PIVOT-Point.
3 Closing Power trend-direction vs. its 21-dma is next
most short-term.
4 IP21 is used to spot divergences and to estimate
underlying support.
5 > IP21 falling and below +.15 and its 21-dma is bearish in
an over-extended ETF, especially
when its Closing Power is falling and is below its 21-dma.
> IP21 below 07 with AROC below .07 is less likely to bring a rally
back up from 21-dma.
6 Note price trend-lines, support/resistance and price
patterns on charts.
QUICKSILVER on ETFS - 12/15/17ETF CLOSE CHANGE PIVOT-PT 5-dma AROC CL-PWR CANDLE IP21 ITRS
---------------------------------------------------------------------------------------------
---------------------------------------------------------------------------------------------
DIA 246.25 .68 244.17 53.7% Bullish ---- -.006 ----
---------------------------------------------------------------------------------------------
COMPQX 6936.58 80.05 6875.08 70.3% ---- BLUE .073 -.028
---------------------------------------------------------------------------------------------
SPY 266.51 .85 266.31 18.8% Bullish BLUE .061 -.035
---------------------------------------------------------------------------------------------
QQQ 157.65 1.77 155.9 94.8% Bullish BLUE .064 -.013
---------------------------------------------------------------------------------------------
MDY 342.47 2.09 W344.12 -27.4% Bearish BLUE -.129 -.047
---------------------------------------------------------------------------------------------
IWM 152.24 2.14 151.35 27.5% Bearish BLUE -.072 -.069
---------------------------------------------------------------------------------------------
FAS 68.36 1.74 67.73 31% Bearish BLUE -.075 .082
---------------------------------------------------------------------------------------------
RETL 34.09 1.58 W35.16 -195.7% Bullish BLUE .218 .076
---------------------------------------------------------------------------------------------
SOXL 137.54 5.86 136.08 142.4% Bearish BLUE -.104 .07
---------------------------------------------------------------------------------------------
TECL 116.11 3.92 112.62 275.5% ---- BLUE .086 .169
---------------------------------------------------------------------------------------------
IBB 106.6 1.43 106.23 25% Bearish BLUE .1 -.143
---------------------------------------------------------------------------------------------
GLD 119.18 .25 118.01 29.5% Bearish RED .02 -.093
---------------------------------------------------------------------------------------------
OIL 6.14 .04 W6.23 0% Bearish ---- .068 .081
---------------------------------------------------------------------------------------------
OIH 24.42 -.08 W25.21 -68.2% Bearish RED -.097 -.137
---------------------------------------------------------------------------------------------
GASL 19.82 -1.06 W22.59 -398.7% Bearish RED -.224 -.249
---------------------------------------------------------------------------------------------
UGA 29.87 -.32 W31.11 -176.9% Bearish RED -.001 -.045
---------------------------------------------------------------------------------------------
UUP 24.43 .1 W24.44 -2% Bearish BLUE -.007 -.081
---------------------------------------------------------------------------------------------
IEF 106.12 -.02 105.84 9.9% Bullish BLUE .137 -.083
---------------------------------------------------------------------------------------------
CORN 16.57 -.1 W16.7 -80.8% Bearish RED -.101 -.128
---------------------------------------------------------------------------------------------
WEAT 5.89 -.01 5.85 -25.6% Bearish ---- -.125 -.174
---------------------------------------------------------------------------------------------
YINN 31.73 -.57 W32.19 43.6% ---- BLUE .05 -.144
---------------------------------------------------------------------------------------------
RSX 21.93 -.08 W22.01 82.1% Bearish RED -.067 -.101
---------------------------------------------------------------------------------------------
AAPL 173.97 1.75 172.67 134% Bullish BLUE .093 .038
---------------------------------------------------------------------------------------------
GOOG 1064.19 15.04 1041.1 130.3% Bullish BLUE .014 .015
---------------------------------------------------------------------------------------------
MSFT 86.85 2.16 85.23 158.2% Bullish BLUE .095 .061
---------------------------------------------------------------------------------------------
AMZN 1179.14 4.88 1168.92 73.4% Bearish RED .036 .12
---------------------------------------------------------------------------------------------
FB 180.18 1.79 179.04 33.1% Bearish BLUE -.046 -.03
---------------------------------------------------------------------------------------------
NVDA 191.56 5.09 W194.66 1.8% Bearish BLUE -.111 -.022
---------------------------------------------------------------------------------------------
BA 293.94 .06 283.16 139.1% Bullish RED -.045 .054
---------------------------------------------------------------------------------------------
GS 257.17 1.69 250.13 134.3% ---- BLUE -.101 -.037
Table 2 COMPARISONS
OF BULLISH AND BEARISH GROUPS
12/15
12/14 12/13 12/12 12/11 12/8 12/7 12/6
12/5 12/4 12/1 11/30 11/29
11/28 11/27 11/24 11/21 11/20 11/17
11/16
NEWHIGHS 309
103
268 223 234 288 159 91 107 340 197 536 500 582 209
439 615 363 244 273
NEWLOWS 49 56 25 52
41 37 50 65 53 37 16 31 57 265 59 31 62 50 229 150
-----------------------------------------------------------------------------------------------------------------------------------------------------------------------------------------
MAXCPs
122 53
123
83 84 90 90
50
42
92 105 266 262 320
101 166
406 339 295 321
MINCPs
65 142 67 99 75 93 73
141
135 152 93 80 110 93
94 42 63 52 40
74
----------------------------------------------------------------------------------------------------------------------------------------------------------------------------------------
TTTNHs 118
75 110 72 73 76 75 46
44
72 53 139
161 143 79 110 196 172 169
154
TTTNLs
98 192
99 161 155 177 109 219 248
402 286 162 230 124 144
66 186 184 79 78
-----------------------------------------------------------------------------------------------------------------------------------------------------------------------------------------
FASTUP
126 123 175
101
108 96 80
79
95
180 126
128 130 141 143 205 245 189 158
148
FASTDOWN
125
109 91 132 134 169
195 233 248 210 156 123 97 74 64 58 72 100 136
177
|
Table 3Count of Stocks and New Highs in Key Tiger Directories
Date = 171215
No. NHs Pct
-------------------------------------------------------------------
BIGMIL 6 5 83 %
DOWJONES 30 8 27 %
DJI-13 13 3 23 %
MILITARY 38 8 21 %
SP-100 96 19 20 %
INFRA 11 2 18 %
INDEXES 195 33 17 %
TRANSP 20 3 15 %
BEVERAGE 20 3 15 %
-------------------------------------------------------------------
SOFTWARE 66 9 14 %
EDU 7 1 14 %
NIFTY 30 4 13 %
NASD-100 105 13 12 %
GAMING 28 3 11 %
MORNSTAR 238 27 11 %
JETS 9 1 11 %
SP500 486 43 9 %
RUS-1000 838 72 9 %
COMPUTER 23 2 9 %
RETAIL 53 5 9 %
INSURANC 32 2 6 %
REIT 178 11 6 %
ETFS 65 3 5 %
ELECTRON 179 7 4 %
HACKERS 25 1 4 %
OILGAS 142 5 4 %
GREEN 31 1 3 %
REGBANKS 33 1 3 %
FINANCE 92 3 3 %
INDMATER 92 3 3 %
SEMI 131 4 3 %
BIOTECH 386 13 3 %
COMODITY 71 2 3 %
CHEM 64 1 2 %
UTILITY 43 1 2 %
BONDFUND 111 2 2 %
----------------------------------------------------
None BIGBANKS AUTO HOMEBLDG CHINA SOLAR COAL
GOLD PIPELINE FOOD HOSPITAL
|
|
Table 4 RANKING OF KEY DIRECTORIES BASED PCT.OF STOCKS ABOVE 65-DMA
12/15/17
Bullish = 32
Bearish = 12
---------------------------------------------------------------------------------------
Directory Current day-1 day-2 day-3 day-4 day-5
----------------------------------------------------------------------------------------
DJI-13 1 1 1 1 1 1
DOWJONES .9 .9 .866 .833 .866 .866
TRANSP .9 .8 .9 .9 .9 .9
JETS .888 .888 .888 .888 .888 .888
BIGBANKS .857 .857 1 1 1 1
BIGMIL .833 .833 .833 .833 .833 .833
INFRA .818 .818 .909 .909 1 1
MORNSTAR .806 .731 .794 .81 .81 .781
SP-100 .802 .791 .822 .812 .833 .812
----------------------------------------------------------------------------------------------
FINANCE .76 .684 .695 .717 .684 .739
RETAIL .754 .716 .735 .754 .773 .773
SP500 .728 .693 .738 .744 .755 .746
MILITARY .71 .657 .71 .71 .684 .71
NIFTY .7 .7 .733 .733 .7 .666
REGBANKS .696 .515 .696 .696 .636 .696
RUS-1000 .696 .659 .71 .718 .721 .714
HACKERS .68 .68 .6 .6 .64 .64
GAMING .678 .678 .678 .75 .75 .607
BEVERAGE .65 .65 .6 .6 .55 .6
HOMEBLDG .647 .647 .705 .705 .705 .764
NASD-100 .647 .657 .657 .647 .628 .609
INDEXES .646 .676 .707 .687 .671 .651
INSURANC .625 .5 .593 .656 .625 .625
REIT .617 .528 .539 .528 .477 .477
COMPUTER .608 .521 .565 .565 .565 .565
SOFTWARE .59 .575 .606 .59 .606 .636
UTILITY .581 .534 .581 .604 .697 .674
EDU .571 .428 .714 .714 .714 .714
INDMATER .565 .456 .5 .532 .51 .456
AUTO .55 .45 .525 .575 .575 .575
GREEN .548 .516 .612 .645 .612 .612
ELECTRON .536 .458 .502 .502 .536 .502
==============================================================================================
CHEM .5 .406 .5 .484 .484 .468
HOSPITAL .5 .375 .5 .5 .375 .375
==============================================================================================
SOLAR .476 .476 .476 .428 .523 .523
SEMI .465 .389 .427 .412 .458 .412
ETFS .446 .523 .584 .523 .6 .523
BIOTECH .409 .391 .432 .386 .404 .435
CHINA .406 .453 .546 .39 .484 .359
OILGAS .38 .394 .45 .507 .507 .429
COAL .375 .375 .375 .375 .375 .5
COMODITY .352 .323 .323 .352 .352 .352
GOLD .183 .142 .142 .122 .04 .02
BONDFUND .171 .243 .216 .162 .27 .288
PIPELINE .142 0 0 0 0 0
FOOD .133 .133 .133 .133 .066 .133
N=12
|
|
==============================================================================
==============================================================================
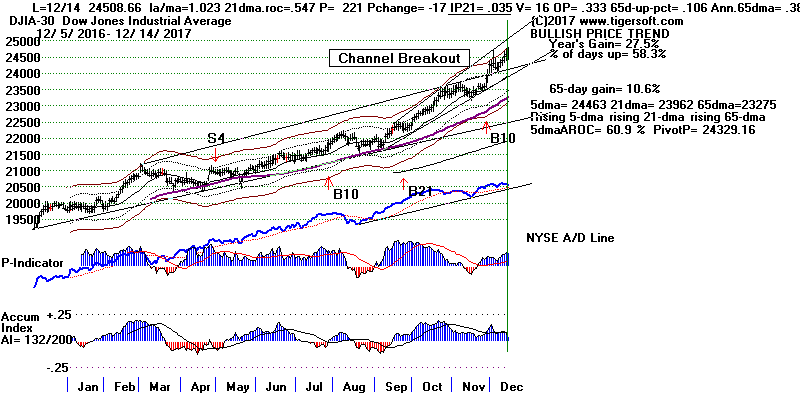
12/14/2017 The September
Buy B21 still operates. But some minor
profit-taking cannot
be ruled out. Down Volume was disproportionately heavy today. It
outweighed
Up Volume by 460 million shares. DIA's IP21 has even turned negative.
Clearly there is some profit-taking going on now that the DJI is approaching
its
3% upper band. We see this especially in the MDY (midcaps),
IWM
(Russell-2000),
OIH and GASL, which now show across-the-board red and bearish
Quicksilver
readings. See Table 2.
I admit that it can't be a positive that SOXL is having a hard time
recovering from
its 65-dma. But Texas Instruments made a
new high today AND Boeing
does not seem
to even mind that American Airlines ordered $25 billion in jets from Airbus.
(Chump
change to Boeing.)
But don't worry yet. In the middle of next week, the market typically
starts rising
from the bullish Santa Claus effect. Secondly, the new wave of
big-time
mergers may now be starting. Today, for $50+ billion, Disney bought
the lion's
share of 20th Century Fox.

What's more, the cutting of the corporate tax rate and reducing the amount of
income tax
the very rich pay IS extraordinarily bullish for the stock market and the
economy, too,
at least for a while. True, much of this may have already been built
into stock prices.
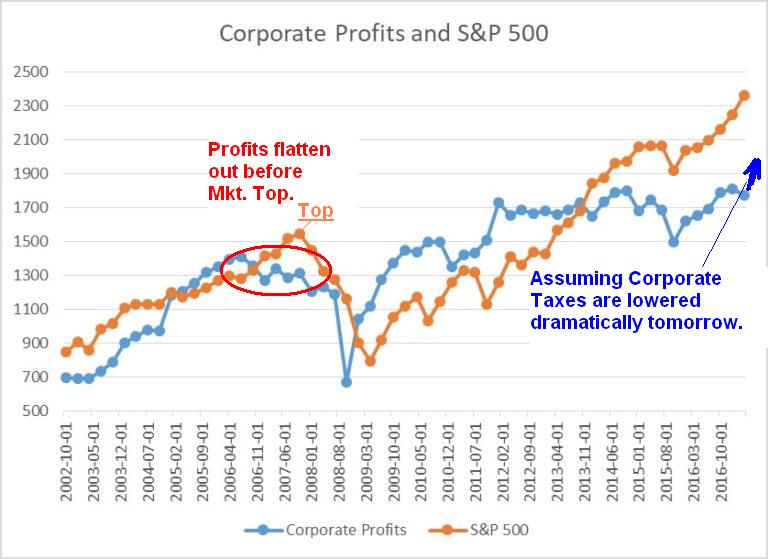
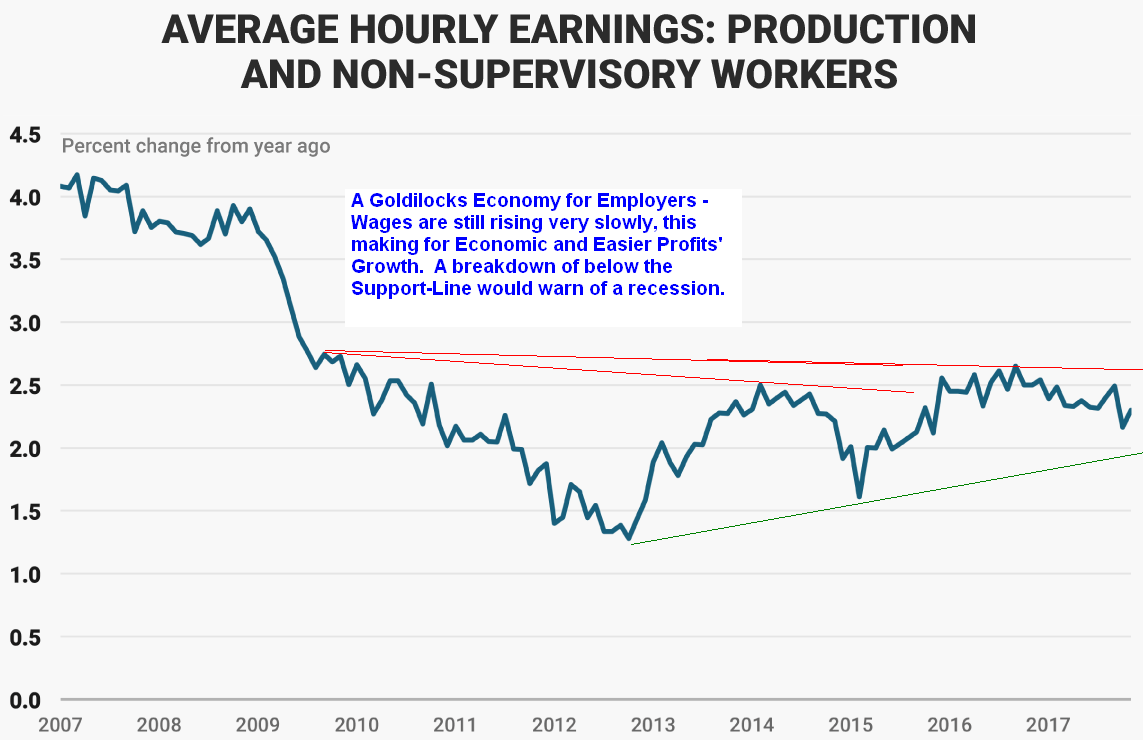
But the Big Picture, shown in Tables 5-7 below shows that Corporate Profits
are already very strong, that the monthly Job Creation numbers are well
above
the 200,000 level that is bullish for the market and that workers' wages are
moving
up very slowly. So, "inflation" is tame. Bullishly,
Gold is going
nowhere and the
FED is actually moving very slowly to raise rates. This is still a
'Goldilocks Economy'.
And now it's about to get a super-stimulus in the form of a big tax cut for
precisely those
who buy 95% of all stocks. The market can still go much higher.
Why sell now?
At least, wait for Peerless to give some sort of Sell.
 |
Charts 12/14/2017
PEERLESS
DJI, Signals, Indicators Daily DJI
Volume 10-DayUp/Down Vol
DJI-AROC
Hourly DJIA
A/D Line for All Stocks
NASDAQ
S&P
OEX
NYSE
COMPQX
DJI-15 DJI-20
DJI-30
DIA
SPY
QQQ MDY
IWM TNA
CrudeOil
FAS
GLD
BBH
IBB
JETS
JNUG
KOL
NUGT
OIH
OIL
RSX
RETL
SDS
SLV
SOXL
TECL
TMF
TNA UGA
(gasoline)
XIV YINN
Commodities:
JJC, NIB,
CHOC
CORN,
WEAT
UUP
(Dollar)
AAPL ADBE
ALXN AMAT
AMGN AMD
AMZN
BA BABA BAC
BIDU
CAT
CVX
FB
GOOG
GS
HD
IBM
JPM M
(Macy's)
MSFT
NFLX
NVDA
QCOM
TSLA TXN
XOM WMT
ANDV (refinery),
CMG (Chipotle),
LRCX, SWKS,
TOWN New -
SPPI
(small Biotech)
12/14/2017
Bullish MAXCPs Bearish
MINCPs
Red Stoch.-Buys Today
Table 1
QuickSilver
Documentation
This is for short-term trading
leveraged ETFs.
It also provides a useful short-term outlook of these sectors ETF's
and the sectors they represewnt
Blue is Bullish
and
Red is Bearish.
1 Candle-Stick color is shortest-term. This
changes when close vis-a-vis opening changes.
So, in stocks or ETFs that advanced a long ways, traders should sell
when a higher
opening gives way to a decline that brings a drop below the previous
day's close.
2 5-dma AROC and Close-versus- pivot point is next
most short-term.
W = warning. Close is below PIVOT-Point.
3 Closing Power trend-direction vs. its 21-dma is next
most short-term.
4 IP21 is used to spot divergences and to estimate
underlying support.
5 > IP21 falling and below +.15 and its 21-dma is bearish in
an over-extended ETF, especially
when its Closing Power is falling and is below its 21-dma.
> IP21 below 07 with AROC below .07 is less likely to bring a rally
back up from 21-dma.
6 Note price trend-lines, support/resistance and price
patterns on charts.
QUICKSILVER on ETFS - 12/14/17
ETF      CLOSE   CHANGE     PIVOT-PT   5-dma AROC   CL-PWR      CANDLE  IP21     ITRS
---------------------------------------------------------------------------------------------
---------------------------------------------------------------------------------------------
DIA       245.57   -.73      243.62        65.7%    Bullish      RED   -.018     ----
---------------------------------------------------------------------------------------------
COMPQX    6856.53   -19.27   6840.08       31.9%    Bearish      RED    .031    -.035
---------------------------------------------------------------------------------------------
SPY       265.66   -1.09     265.51        29.9%    ----         RED    .034    -.035
---------------------------------------------------------------------------------------------
QQQ       155.88   -.11      154.7         59.9%    Bearish      RED    .02     -.017
---------------------------------------------------------------------------------------------
MDY       340.38   -2.88    W344.35       -39.1%    Bearish      RED   -.117    -.053
---------------------------------------------------------------------------------------------
IWM       150.1   -1.68     W151.41       -38.7%    Bearish      RED   -.079    -.083
---------------------------------------------------------------------------------------------
FAS       66.62   -.88      W67.94        -22.8%    Bearish      RED   -.071     .081
---------------------------------------------------------------------------------------------
RETL      32.51   -2.06     W35.43        -238.6%    ----        RED    .218     .045
---------------------------------------------------------------------------------------------
SOXL      131.68   -.3      W133.75       -155.7%   Bearish      RED   -.122     .02
---------------------------------------------------------------------------------------------
TECL      112.19   -.49      109.94        173.6%   Bearish      RED    .035     .158
---------------------------------------------------------------------------------------------
IBB       105.17   -1.55    W106.07        52.9%    Bearish      RED    .082    -.158
---------------------------------------------------------------------------------------------
GLD       118.93   -.24      118.48        18.6%    ----         RED    .006    -.103
---------------------------------------------------------------------------------------------
OIL       6.1    .07        W6.14          57.3%    Bearish      BLUE   .039     .098
---------------------------------------------------------------------------------------------
OIH       24.5   -.39       W24.76         4%       Bearish      RED   -.038    -.13
---------------------------------------------------------------------------------------------
GASL      20.88   -.56      W21.55         18.5%    Bearish      RED   -.141    -.188
---------------------------------------------------------------------------------------------
UGA       30.19    .41      W30.95        -71.9%    Bearish      BLUE   .025    -.01
---------------------------------------------------------------------------------------------
UUP       24.33    .02      W24.44        -14.3%    Bearish      ----   -.03    -.083
---------------------------------------------------------------------------------------------
IEF       106.14   -.04      105.91        7.1%     Bullish      BLUE   .144    -.087
---------------------------------------------------------------------------------------------
CORN      16.67   -.01      W16.84        -41.8%    ----         ----  -.01     -.121
---------------------------------------------------------------------------------------------
WEAT      5.9    .03        W5.92         -59.5%    Bearish      ----  -.122    -.176
---------------------------------------------------------------------------------------------
YINN      32.3   -.92        31.45         371.7%   Bearish      RED    .01     -.083
---------------------------------------------------------------------------------------------
RSX       22.01   -.09       21.57         114.6%   Bearish      ----  -.103    -.097
---------------------------------------------------------------------------------------------
AAPL      172.22   -.05      169.37        84.8%    Bullish      RED    .025     .037
---------------------------------------------------------------------------------------------
GOOG      1049.15    8.54    1037.05       87.8%    Bullish      BLUE  -.047     .018
---------------------------------------------------------------------------------------------
MSFT      84.69   -.66       84.16         130.1%   Bearish      RED   -.003     .049
---------------------------------------------------------------------------------------------
AMZN      1174.26    10.13   1162          62.2%    Bearish      BLUE   .008     .132
---------------------------------------------------------------------------------------------
FB        178.39    .09     W179           -49%     ----         BLUE  -.092    -.025
---------------------------------------------------------------------------------------------
NVDA     186.47    .29      W191.49       -144.5%   Bearish      BLUE  -.153    -.054
---------------------------------------------------------------------------------------------
BA        293.88    2.04     285.9         207.8%   Bullish      BLUE   .017     .064
---------------------------------------------------------------------------------------------
GS        255.48   -.08      250.35        137.1%   Bullish      RED   -.086    -.021
Table 2 COMPARISONS
OF BULLISH AND BEARISH GROUPS
12/14 12/13 12/12 12/11 12/8 12/7 12/6
12/5 12/4 12/1 11/30 11/29
11/28 11/27 11/24 11/21 11/20 11/17
11/16
NEWHIGHS
103
268 223 234 288 159 91 107 340 197 536 500 582 209
439 615 363 244 273
NEWLOWS
56 25 52
41 37 50 65 53 37 16 31 57 265 59 31 62 50 229 150
-----------------------------------------------------------------------------------------------------------------------------------------------------------------------------------------
MAXCPs
53
123
83 84 90 90
50
42
92 105 266 262 320
101 166
406 339 295 321
MINCPs
142 67 99 75 93 73
141
135 152 93 80 110 93
94 42 63 52 40
74
----------------------------------------------------------------------------------------------------------------------------------------------------------------------------------------
TTTNHs
75 110 72 73 76 75 46
44
72 53 139
161 143 79 110 196 172 169
154
TTTNLs
192
99 161 155 177 109 219 248
402 286 162 230 124 144
66 186 184 79 78
-----------------------------------------------------------------------------------------------------------------------------------------------------------------------------------------
FASTUP
123 175
101
108 96 80
79
95
180 126
128 130 141 143 205 245 189 158
148
FASTDOWN
109 91 132 134 169
195 233 248 210 156 123 97 74 64 58 72 100 136
177
|
Table 3Count of Stocks and New Highs in Key Tiger Directories
Date = 171214
No. NHs Pct.
-------------------------------------------------------------------
BIGMIL 6 1 17 %
===================================================================
JETS 9 1 11 %
DJI-13 13 1 8 %
DOWJONES 30 2 7 %
GAMING 28 2 7 %
NASD-100 105 5 5 %
UTILITY 43 2 5 %
BEVERAGE 20 1 5 %
SP-100 96 4 4 %
HACKERS 25 1 4 %
COMPUTER 23 1 4 %
REIT 178 7 4 %
RETAIL 53 2 4 %
GREEN 31 1 3 %
MILITARY 38 1 3 %
ETFS 65 2 3 %
MORNSTAR 238 7 3 %
SOFTWARE 66 2 3 %
COMODITY 71 2 3 %
CHEM 64 1 2 %
FINANCE 92 2 2 %
INDEXES 195 3 2 %
ELECTRON 179 4 2 %
SEMI 131 3 2 %
OILGAS 142 3 2 %
SP500 486 8 2 %
RUS-1000 838 18 2 %
CHINA 64 1 2 %
BONDFUND 111 2 2 %
INDMATER 92 1 1 %
BIOTECH 386 5 1 %
====================================================
None: BIGBANKS BIGBANKS AUTO HOMEBLDG NIFTY
INFRA INSURANC TRANSP SOLAR COAL GOLD EDU
PIPELINE FOOD HOSPITAL
|

|
Table 4 RANKING OF KEY DIRECTORIES BASED PCT.OF STOCKS ABOVE 65-DMA
12/14/17
Bullish = 28
Bearish = 17
---------------------------------------------------------------------------------------
Directory Current day-1 day-2 day-3 day-4 day-5
----------------------------------------------------------------------------------------
DJI-13 100% 1 1 1 1 1
DOWJONES .9 .866 .833 .866 .9 .833
JETS .888 .888 .888 .888 .888 .888
BIGBANKS .857 1 1 1 1 1
BIGMIL .833 .833 .833 .833 .833 .833
INFRA .818 .909 .909 1 1 1
TRANSP .8 .9 .9 .9 .9 .9
N=7
----------------------------------------------------------------------------------------------
SP-100 .791 .822 .812 .833 .822 .76
MORNSTAR .731 .794 .81 .81 .781 .764
RETAIL .716 .735 .754 .773 .754 .754
NIFTY .7 .733 .733 .7 .666 .666
SP500 .693 .738 .744 .755 .748 .718
FINANCE        .684          .695          .717          .684          .75           .739
HACKERS        .68           .6            .6            .64           .64           .64
GAMING         .678          .678          .75           .75           .607          .535
INDEXES        .676          .707          .687          .671          .651          .666
RUS-1000       .659          .71           .718          .721          .715          .694
MILITARY       .657          .71           .71           .684          .71           .736
NASD-100       .657          .657          .647          .628          .609          .59
BEVERAGE       .65           .6            .6            .55           .6            .65
HOMEBLDG       .647          .705          .705          .705          .764          .764
SOFTWARE       .575          .606          .59           .606          .636          .606
UTILITY        .534          .581          .604          .697          .674          .674
REIT           .528          .539          .528          .477          .483          .438
ETFS           .523          .584          .523          .6            .507          .4
COMPUTER       .521          .565          .565          .565          .565          .565
GREEN          .516          .612          .645          .612          .612          .58
REGBANKS       .515          .696          .696          .636          .727          .757
N=21
--------------------------------------------------------------------------------------------
INSURANC       .5            .593          .656          .625          .625          .656
--------------------------------------------------------------------------------------------
SOLAR          .476          .476          .428          .523          .523          .476
ELECTRON       .458          .502          .502          .536          .508          .53
INDMATER       .456          .5            .532          .51           .456          .478
CHINA          .453          .546          .39           .484          .359          .343
AUTO           .435          .512          .564          .564          .564          .589
EDU            .428          .714          .714          .714          .714          .714
CHEM           .406          .5            .484          .484          .468          .546
OILGAS         .394          .45           .507          .507          .429          .422
BIOTECH        .391          .432          .386          .404          .432          .378
SEMI           .389          .427          .412          .458          .419          .442
COAL           .375          .375          .375          .375          .5            .5
HOSPITAL       .375          .5            .5            .375          .375          .375
COMODITY       .323          .323          .352          .352          .352          .352
BONDFUND       .243          .216          .162          .27           .288          .405
GOLD           .142          .142          .122          .04           .02           0
FOOD           .133          .133          .133          .066          .133          .133
PIPELINE       0             0             0             0             0             0
N= 17
|
|
|
Table
5-7 The Bigger Picture:
Much Higher Corporate Profits are very Bullish.
Small or Flat Wages - Bullish.
200,000 New Jobs/month - Bullish
|
Monthly Change
in Non-Farm Jobs. Red shows
a decline. Bright red shows a
decline of more than 200(,000).
A bright blue
shows a rise of
more than
200(,000). |
| Year |
Jan |
Feb |
Mar |
Apr |
May |
Jun |
Jul |
Aug |
Sep |
Oct |
Nov |
Dec |
| 2007 |
240 |
89 |
190 |
80 |
143 |
75 |
-34 |
-20 |
88 |
84 |
114 |
98 |
| 2008 |
17 |
-84 |
-78 |
-210 |
-186 |
-162 |
-213 |
-267 |
-450 |
-474 |
-766 |
-694 |
| 2009 |
-793 |
-702 |
-823 |
-687 |
-349 |
-471 |
-329 |
-213 |
-220 |
-204 |
-2 |
-275 |
| 2010 |
23 |
-68 |
164 |
243 |
524 |
-137 |
-68 |
-36 |
-52 |
262 |
119 |
87 |
| 2011 |
43 |
189 |
225 |
346 |
77 |
225 |
69 |
110 |
248 |
209 |
141 |
209 |
| 2012 |
358 |
237 |
233 |
78 |
115 |
76 |
143 |
177 |
203 |
146 |
132 |
244 |
| 2013 |
211 |
286 |
130 |
197 |
226 |
162 |
122 |
261 |
190 |
212 |
258 |
47 |
| 2014 |
190 |
151 |
272 |
329 |
246 |
304 |
202 |
230 |
280 |
227 |
312 |
255 |
| 2015 |
234 |
238 |
86 |
262 |
344 |
206 |
254 |
157 |
100 |
321 |
272 |
239 |
| 2016 |
126 |
237 |
225 |
153 |
43 |
297 |
291 |
176 |
249 |
124 |
164 |
155 |
| 2017 |
216 |
232 |
50 |
207 |
145 |
210 |
138 |
208 |
38 |
244(P) |
228(P) |
|
| P : preliminary |
|
|
==========================================================================
==========================================================================
12/13/2017 The September
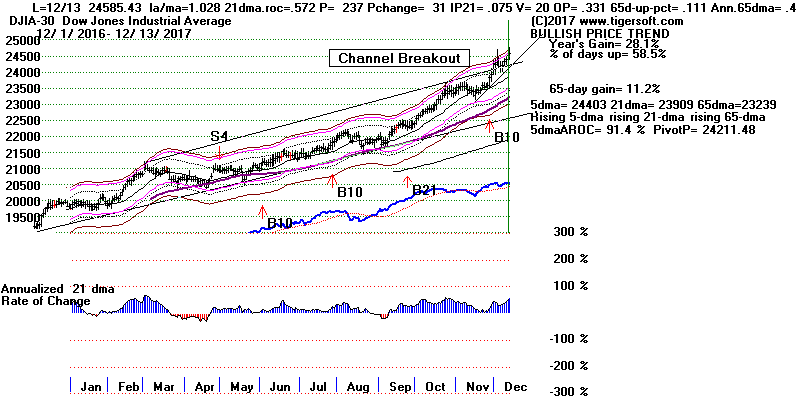
Buy B21 still operates. The DJI has about reached the
top of its price
bands. The NYSE A/D Line is lagging slightly, but our primary internal
strength indicators,
P-I and IP21 are sufficiently positive to prevent a Peerless Sell.
Accordingly, we must
believe the message of its chart, namely that there has been a
channel-breakouts and
a rally to 25500-25750 must now be called for. As mentioned here, the
large majority
of the rallies that follow such a strong market continue to rise for three
or four more months
into the new year. That remains the most likely scenario now. Of
course, we have to be
selective, Table 1's most bullish ETFs remain those with across-the board
(blue) Quicksilver
ratings and those sectors that have the highest percentage of their stocks
making new
highs (Table 3) and are above their 65-dma. (Table 4).
Fidelity and MorningStar Sector Rankings
Because there is a fairly continuous short-term rotation among sectors, it
is advisable
for traders to watch the 21-day performance rankings of the Morningstar Star
and
Fidelity Funds. Those at the top are apt to go still higher until they
break their 21-dma
uptrend. A similar approach can be used for the leveraged ETF group,
except that
here I would watch the 5-day ranking and use closes below the 5-day
pivot-point
and rallies to extremes above the 5-day ma as times to take profits.
Most of the bullish
MAXCPs come from top performing sectors. Meanwhile, the top Tahiti
(longer term)
stock in the DJI-30, ranked by AI/200 score, is MSFT. Because December
is so bullish
generally and experiences very few big sell-offs, the stocks giving
red stochastic Buys
should prove to be profitable trading vehicles for the next two weeks.
Fidelity Select Fund - 21- Day Pct Change Ranking
 11 / 13 / 2017 - 12 / 13 / 2017
Rank          Symbol        Name           Price     21-day Pct Gain
---------     -----------------------------------     --------------
 1            FSRFX     Transportation     107.51        9%
 2            FSLBX   Brokerage/Invmt Mgmt  85.66        8%
 3            FSTCX    Telecommunications   68.83        8%
 4            FSAIX    Air Transportation   89.17        7%
 5            FSRPX       Retailing        135.28        7%
 6            FIDSX     Financial Serv.    116.53        6%
 7            FSRBX       Banking           35.95        6%
 8            FSVLX    Consumer Finance     16.2         6%
 9            FSDCX  Communications Equip.  36.37        5%
 10           DIA           DJI ETF        246.3         4%
------------------------------------------------------------
 38           FSNGX      Natural Gas        23.47       -4%
 39           FSPTX      Technology        179.55       -7%
 40           FSUTX        Utilities        81.7        -7%
 41           FSESX          Energy         41.93       -9%
 42           FSELX       Semiconductors   110.44       -13%
|
Mornstar Funds' 21-Day Performance Ranking
Rank          Symbol        Name                         Price          Pct.Gain
---------     -----------------------------------       ----------    -----------
 1            MG514         Drug Delivery                693.25        20%
 2            MG747         Apparel Stores               2710.69       20%
 3            MG758         Food Wholesale               1277.82       18%
 4            MG738         Auto Parts Stores            2423.8        17%
 5            MG322         Textile/Footwear/Acc.        2879.06       16%
 6            MG741         Sporting Goods Stores        817.45        15%
 7            MG742         Toy & Hobby Stores           145.44        15%
 8            MG771         Major Airlines               358.26        15%
 9            MG517         Diagnostic Substances        843.97        14%
 10           MG735         Electronic Stores            1086.89       14%
 ------
 229          MG135         Gold                          272.69       -4%
 230          MG744         Music & Video Stores         3482.27       -4%
 231          MG830         -Electronics-                3427.03       -4%
 232          MG316         Toys & Games                  779.11       -5%
 233          MG835         Semiconductor-Equipmen       8627.54       -5%
 234          MG124         Oil & Gas Drilling & Expl.    770.22       -7%
 235          MG833         Semiconductor-Specialized   20217.75       -7%
 236          MG834         Semiconductor-Integrated Cir  937.57       -7%
 237          MG832         Semiconductor-Memory Chips   3188.51       -8%
 238          MG911         Foreign Utilities            354.18       -11%
-----------------------------------------------------------------------------------
|
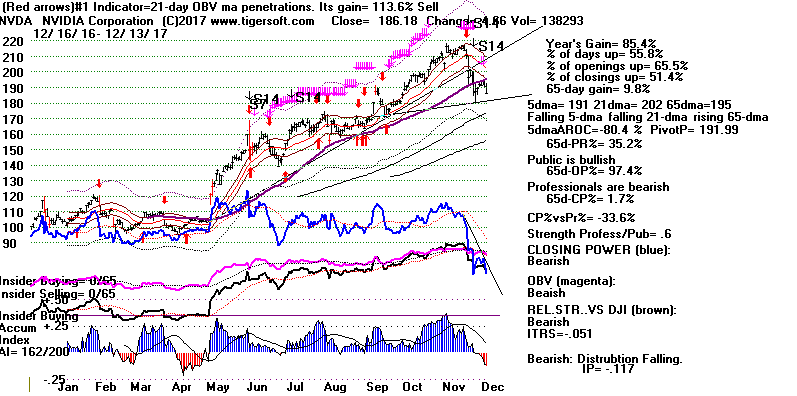
NVDA (See chart further below) has
turned down sharply since it reported stellar
earnings. Its Closing Power is now making new one-year lows far ahead
of prices,
its Accum. Index is negative and we see S14 high volume dumping signals.
Technically,
we have to say, "Sell". Something is wrong with NVDA. We must
wait for Professionals
to turn bullish. But let's give more chance for SOXL to firm up at its
nearby support.
 |
Links to Charts
Charts 12/13/2017
PEERLESS
DJI, Signals, Indicators Daily DJI
Volume 10-DayUp/Down Vol
DJI-AROC
Hourly DJIA
A/D Line for All Stocks
NASDAQ
S&P
OEX
NYSE
COMPQX
DJI-15 DJI-20
DJI-30
DIA
SPY
QQQ MDY
IWM TNA
CrudeOil
FAS
GLD
BBH
IBB
JETS
JNUG
KOL
NUGT
OIH
OIL
RSX
RETL
SDS
SLV
SOXL
TECL
TMF
TNA UGA
(gasoline)
XIV YINN
Commodities:
JJC, NIB,
CHOC
CORN,
WEAT
UUP
(Dollar)
AAPL ADBE
ALXN AMAT
AMGN AMD
AMZN
BA BABA BAC
BIDU
CAT
CVX
FB
GOOG
GS
HD
IBM
JPM M
(Macy's)
MSFT
NFLX
NVDA
QCOM
TSLA TXN
XOM WMT
ANDV (refinery),
CMG (Chipotle),
LRCX, SWKS,
TOWN New -
SPPI
(small Biotech)
12/13/2017
Bullish MAXCPs Bearish
MINCPs
Red Stoch.-Buys Today |
Table 1
QuickSilver
Documentation
This is for short-term trading
leveraged ETFs.
It also provides a useful short-term outlook of these sectors ETF's
and the sectors they represewnt
Blue is Bullish
and
Red is Bearish.
1 Candle-Stick color is shortest-term. This
changes when close vis-a-vis opening changes.
So, in stocks or ETFs that advanced a long ways, traders should sell
when a higher
opening gives way to a decline that brings a drop below the previous
day's close.
2 5-dma AROC and Close-versus- pivot point is next
most short-term.
W = warning. Close is below PIVOT-Point.
3 Closing Power trend-direction vs. its 21-dma is next
most short-term.
4 IP21 is used to spot divergences and to estimate
underlying support.
5 > IP21 falling and below +.15 and its 21-dma is bearish in
an over-extended ETF, especially
when its Closing Power is falling and is below its 21-dma.
> IP21 below 07 with AROC below .07 is less likely to bring a rally
back up from 21-dma.
6 Note price trend-lines, support/resistance and price
patterns on charts.
QUICKSILVER on ETFS - 12/13/17
ETF      CLOSE   CHANGE     PIVOT-PT   5-dma AROC   CL-PWR      CANDLE  IP21   ITRS
---------------------------------------------------------------------------------------------
---------------------------------------------------------------------------------------------
DIA       246.3    .86       242.36        96.1%   Bullish      BLUE   .064     ---
---------------------------------------------------------------------------------------------
COMPQX    6875.8    13.48    6812.84       72.7%   Bearish      RED    .102    -.036
---------------------------------------------------------------------------------------------
SPY       266.75   -.03      264.07        66.2%   Bullish      RED    .12    -.034
---------------------------------------------------------------------------------------------
QQQ       155.99    .3       154.02        80.4%   Bearish      RED    .066    -.019
---------------------------------------------------------------------------------------------
MDY       343.26    .04      343.07        35.1%   ----         RED   -.059    -.049
---------------------------------------------------------------------------------------------
IWM       151.78    .9       151.27        51.6%   Bearish      BLUE  -.031    -.079
---------------------------------------------------------------------------------------------
FAS       67.5   -1.89       66.93         96.1%   ----         RED   -.018     .086
---------------------------------------------------------------------------------------------
RETL      34.57    1.04      34.16         158.7%  Bullish      BLUE   .231     .087
---------------------------------------------------------------------------------------------
SOXL      131.98   -.02     W135.85       -.4%     Bearish      RED   -.101     .026
---------------------------------------------------------------------------------------------
TECL      112.68    .24      108.33        286.5%  Bearish      RED    .082     .155
---------------------------------------------------------------------------------------------
IBB       106.72    .96      104.05        197.3%   ----        BLUE   .084    -.141
---------------------------------------------------------------------------------------------
GLD       119.17    1.02     118.49       -37.9%    ----        BLUE   .034    -.102
---------------------------------------------------------------------------------------------
OIL       6.03   -.09        6.03          73.9%   Bearish      RED   -.059     .064
---------------------------------------------------------------------------------------------
OIH       24.89   -.35       24.48         100.7%  Bearish      RED   -.044    -.121
---------------------------------------------------------------------------------------------
GASL      21.44   -.58       20.8          197.6%  Bearish      RED   -.194    -.178
---------------------------------------------------------------------------------------------
UGA       29.78   -.82      W30.63        -47.3%   Bearish      RED   -.013    -.018
---------------------------------------------------------------------------------------------
UUP       24.31   -.17      W24.4         -8.2%    Bearish      RED   -.065    -.089
---------------------------------------------------------------------------------------------
IEF       106.18    .43      105.99        0%      Bullish      BLUE   .142    -.091
---------------------------------------------------------------------------------------------
CORN      16.68    .03      W16.81        -44.7%   Bearish      BLUE  -.054    -.128
---------------------------------------------------------------------------------------------
WEAT      5.87    .06       W5.97         -118.4%  Bearish      ----  -.12    -.192
---------------------------------------------------------------------------------------------
YINN      33.22    1.96      29.95         505%    Bearish      BLUE   .025    -.05
---------------------------------------------------------------------------------------------
RSX       22.1    .18        21.51         133.6%  Bearish      BLUE  -.134    -.095
---------------------------------------------------------------------------------------------
AAPL      172.27    .57      169.32        95.6%   ----         RED   -.005     .026
---------------------------------------------------------------------------------------------
GOOG      1040.61    .13     1030.93       107.5%  Bullish      RED   -.007    -.002
---------------------------------------------------------------------------------------------
MSFT      85.35   -.23       82.49         152.9%  Bullish      RED    .064     .061
---------------------------------------------------------------------------------------------
AMZN      1164.13   -.95     1159.79       50.7%   Bearish      RED    .021     .128
---------------------------------------------------------------------------------------------
FB        178.3    1.34     W180.14        62.8%   ----         BLUE  -.075    -.04
---------------------------------------------------------------------------------------------
NVDA     186.18   -4.66     W191.99       -80.4%   Bearish      RED   -.116    -.051
---------------------------------------------------------------------------------------------
BA        291.84    1.9      281.97        239%    Bullish      BLUE   .055     .054
---------------------------------------------------------------------------------------------
GS        255.56   -2.12     248.56        191.8%  Bullish      RED   -.062    -.031
|
 |
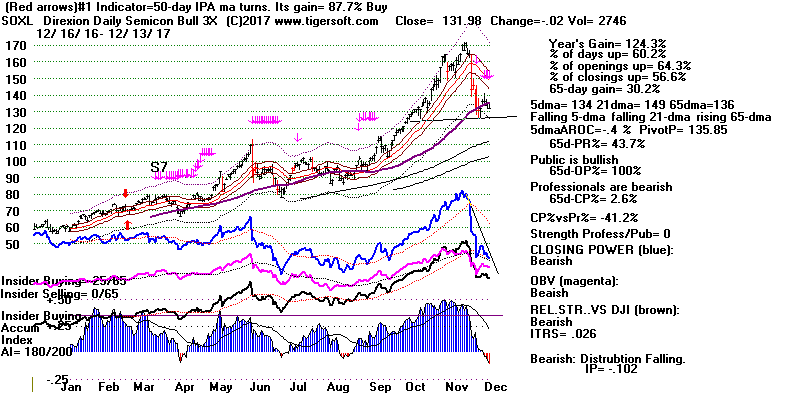 |
Table 2 COMPARISONS
OF BULLISH AND BEARISH GROUPS
12/13 12/12 12/11 12/8 12/7 12/6
12/5 12/4 12/1 11/30 11/29
11/28 11/27 11/24 11/21 11/20 11/17
11/16
NEWHIGHS
268 223 234 288 159 91 107 340 197 536 500 582 209
439 615 363 244 273
NEWLOWS 25 52
41 37 50 65 53 37 16 31 57 265 59 31 62 50 229 150
-----------------------------------------------------------------------------------------------------------------------------------------------------------------------------
MAXCPs
123
83 84 90 90
50
42
92 105 266 262 320
101 166
406 339 295 321
MINCPs
67 99 75 93 73
141
135 152 93 80 110 93
94 42 63 52 40
74
-----------------------------------------------------------------------------------------------------------------------------------------------------------------------------
TTTNHs
110 72 73 76 75 46
44
72 53 139
161 143 79 110 196 172 169
154
TTTNLs
99 161 155 177 109 219 248
402 286 162 230 124 144
66 186 184 79 78
-----------------------------------------------------------------------------------------------------------------------------------------------------------------------------
FASTUP
175
101
108 96 80
79
95
180 126
128 130 141 143 205 245 189 158
148
FASTDOWN
91 132 134 169
195 233 248 210 156 123 97 74 64 58 72 100 136
177
|
Table 3
Count of Stocks and New Highs in Key Tiger Directories
Date = 171213
               No.          NHs            Pct.
-------------------------------------------------------------------
BIGMIL         6             3             50 %
DJI-13         13            4             31 %
DOWJONES       30            7             23 %
TRANSP         20            4             20 %
INFRA          11            2             18 %
HACKERS        25            4             16 %
--------------------------------------------------------------------
ETFS           65            8             12 %
SP-100         96            11            11 %
GAMING         28            3             11 %
INDMATER       92            10            11 %
INDEXES        195           21            11 %
MORNSTAR       238           27            11 %
COMPUTER       23            2             9 %
CHEM           64            5             8 %
MILITARY       38            3             8 %
SOFTWARE       66            5             8 %
FOOD           15            1             7 %
SP500          486           29            6 %
NASD-100       105           6             6 %
RUS-1000       839           46            5 %
UTILITY        43            2             5 %
BEVERAGE       20            1             5 %
RETAIL         53            2             4 %
COMODITY       71            3             4 %
GREEN          31            1             3 %
AUTO           40            1             3 %
FINANCE        92            3             3 %
OILGAS         143           5             3 %
BIOTECH        386           13            3 %
INSURANC       32            1             3 %
REIT           178           5             3 %
ELECTRON       179           1             1 %
BONDFUND       111           1             1 %
--------------------------------------------------
None BIGBANKS  REGBANKS HOMEBLDG NIFTY  SEMI
CHINA SOLAR  COAL  GOLD EDU  PIPELINE JETS
|
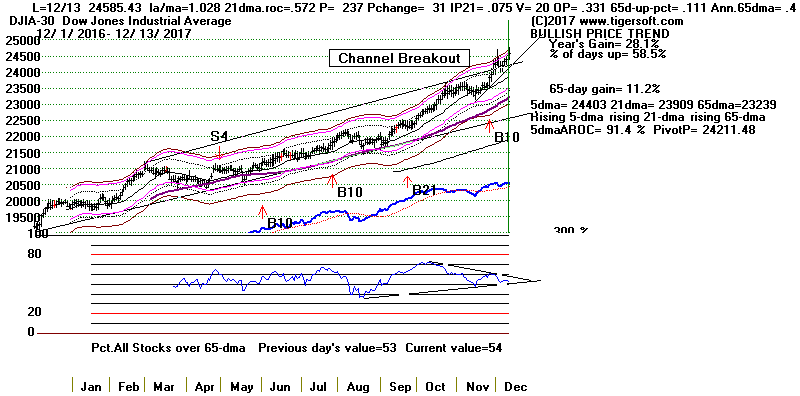 |
Table 4
 RANKING OF KEY DIRECTORIES BASED PCT.OF STOCKS ABOVE 65-DMA
              12/13/17
 Bullish = 33
 Bearish = 10
---------------------------------------------------------------------------------------
Directory     Current       day-1         day-2         day-3         day-4         day-5
----------------------------------------------------------------------------------------
BIGBANKS       100%          1             1             1             1             1
DJI-13         100%          1             1             1             1             1
INFRA          .909          .909          1             1             1             .909
TRANSP         .9            .9            .9            .9            .9            .85
JETS           .888          .888          .888          .888          .888          .888
DOWJONES       .866          .833          .866          .9            .833          .9
BIGMIL         .833          .833          .833          .833          .833          .666
SP-100         .822          .812          .833          .822          .76           .77
--------------------------------------------------------------------------------------------
MORNSTAR       .794          .81           .81           .781          .773          .714
SP500          .738          .744          .755          .748          .722          .705
RETAIL         .735          .754          .773          .754          .754          .773
NIFTY          .733          .733          .7            .666          .666          .633
EDU            .714          .714          .714          .714          .714          .714
MILITARY       .71           .71           .684          .71           .736          .631
RUS-1000       .709          .717          .721          .715          .697          .675
INDEXES        .707          .687          .671          .651          .666          .646
HOMEBLDG       .705          .705          .705          .764          .764          .764
REGBANKS       .696          .696          .636          .727          .787          .757
FINANCE        .695          .717          .684          .75           .75           .728
GAMING         .678          .75           .75           .607          .535          .571
NASD-100       .657          .647          .628          .609          .59           .561
GREEN          .612          .645          .612          .612          .58           .483
SOFTWARE       .606          .59           .606          .636          .606          .606
BEVERAGE       .6            .6            .55           .6            .65           .65
HACKERS        .6            .6            .64           .64           .64           .64
INSURANC       .593          .656          .625          .625          .656          .687
ETFS           .584          .523          .6            .507          .4            .246
UTILITY        .581          .604          .697          .674          .674          .697
COMPUTER       .565          .565          .565          .565          .565          .521
CHINA          .546          .39           .484          .359          .343          .375
REIT           .539          .528          .477          .483          .443          .387
AUTO           .525          .575          .575          .575          .6            .575
ELECTRON       .502          .502          .536          .508          .53           .48
N=25
---------------------------------------------------------------------------------------------
CHEM           .5            .484          .484          .468          .562          .515
HOSPITAL       .5            .5            .375          .375          .375          .375
INDMATER       .5            .532          .51           .456          .478          .456
---------------------------------------------------------------------------------------------
SOLAR          .476          .428          .523          .523          .476          .333
OILGAS         .447          .503          .503          .426          .44           .419
BIOTECH        .432          .386          .404          .432          .378          .357
SEMI           .427          .412          .458          .419          .442          .389
COAL           .375          .375          .375          .5            .5            .5
COMODITY       .323          .352          .352          .352          .352          .338
BONDFUND       .216          .162          .27           .288          .378          .396
GOLD           .142          .122          .04           .02           0             .02
FOOD           .133          .133          .066          .133          .133          .133
PIPELINE       0             0             0             0             0             0
N=10
|
---------------------------------------------------------------------------------------------------------------
---------------------------------------------------------------------------------------------------------------
12/12/2017 The September
Buy B21 still operates. Despite the NASDAQ's decline
and the fact that there were 260 more down than up on the NYSE, the DJI
moved up 118 today. All but 20 points in the DJI's gain was made by
possible
by big jumps up in its two highest priced DJI stocks, Goldman Sachs (+7.55)
and
Boeing (+6.78). (The divisor is .145. So the 14.33 gain in these two
stocks
boosted the DJI by 98.8 points.)
Are the DJI's highest priced stocks doing too much
of the heavy listing?
Not yet. Look at the strong uptrends of
the A/D Line and the Tiger Index
of the SP-500. This is still a broad advance. I expect it to
widen more
as the new year starts.
I have observed that RCA's position in early 1929 could be a model for
what may still happen with Boeing. By February 1929 when RCA split 5:1
and
became a $100 stock again, it had risen almost 100% from where it had been
in October 1928. Boeing is now the stock that almost every fund
manager
wants to show in its end-of-the-year holdings. What will it be when it
splits?
Secondly, the break-out above the
top of its 1600-point wide price channel
at 24000
posits a new minimum price target now of 25600. So, one day's weakness
in the breadth is probably not enough to stop the DJI now, especially in
this typically
bullish month of December. Peerless has been built to call major tops.
For
a major top to occur in December we need to see much weaker P-I and IP21
scores. (They were negative in 2007 before that year's prescient December S9
of that year. They are very positive now.)
At the least, we need to see the NYSE A/D Line break its uptrend as it did
in
1968 and then show immediate weakness for the rest of the month. The
Fed will
raise rates tomorrow. But they will not raise them so sharply as to hurt the
Retailer's
in this their most important month. Yellen will pass along to her successor
the big
challenge of how and when the stock market 'bubble' is to be safely cooled
off.
Thirdly, in the Table below, we see the DJI's strength, such as we now see
in mid-
December, was almost always a harbinger of still more gains next year,
so long
as the P-I and IP21 remain amply positive and the DJI does not even dip far
enough
back for the next two weeks to get a Buy B13 (Santa Claus buy).
DJI Past Closings between +2.0% and +3.0% Upper Band
from Dec 12th through Dec 16th,
Cases all had
Positive P-I and V-I
1965-2017
Next Decline to Tag Lower 3% Band.
1 19701216
819.07 ---> Rose to 950.82 on 4/28/1971.
2 19711214
855.14 ---> Rose to 968.92 on
4/18/1971
3 19761213
974.24 ---> Rose
only to 999.69 on
12/30/1976.
4 19791214
842.75 ---> Rose to 903.84 on 2/23/1980. There was a Santa
Claus B13.
5 19851212
1511.24 ---> Rose to 1821.72 on 3/27/1985.
6 19891212
2752.13 ----> Rose only to 2810.15 on 1/2/1990. There was a
Santa Claus B13.
7 19901212
2622.28 ---> Rose only to 2633.66 on 12/21/1991
There was a Santa Claus B13.
8 19951212
5174.92 ---> Rose to 5686.6 on 3/18/1996. There was a Santa
Claus B13.
9 20031212
10042.16 --->Rose to 10732.29 on 2/11/2004
10 20101214
11476.54 --->Rose to 12391.25 on 2/18/2011 There was a Santa
Claus B13.
11 20121212
13245.45 --->Rose to 15387.58 on 5/21/2013 There was a Santa
Claus B13.
12 20161214
19792.53 ---> Still rising without tagging
lower 3% band. |
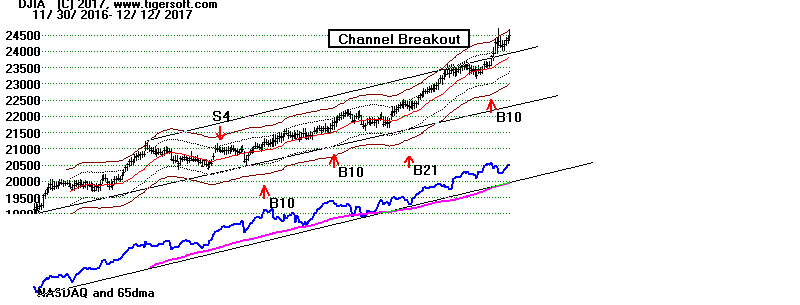


Links to Charts
Charts 12/12/2017
PEERLESS
DJI, Signals, Indicators Daily DJI
Volume 10-DayUp/Down Vol
DJI-AROC
Hourly DJIA
A/D Line for All Stocks
NASDAQ
S&P
OEX
NYSE
COMPQX
DJI-15 DJI-20
DJI-30
DIA
SPY
QQQ MDY
IWM TNA
CrudeOil
FAS
GLD
BBH
IBB
JETS
JNUG
KOL
NUGT
OIH
OIL
RSX
RETL
SDS
SLV
SOXL
TECL
TMF
TNA UGA
(gasoline)
XIV YINN
Commodities:
JJC, NIB,
CHOC
CORN,
WEAT
UUP
(Dollar)
AAPL ADBE
ALXN AMAT
AMGN AMD
AMZN
BA BABA BAC
BIDU
CAT
CVX
FB
GOOG
GS
HD
IBM
JPM M
(Macy's)
MSFT
NFLX
NVDA
QCOM
TSLA TXN
XOM WMT
ANDV (refinery),
CMG (Chipotle),
LRCX, SWKS,
TOWN New -
SPPI
(small Biotech)
12/12/2017
Bullish MAXCPs Bearish
MINCPs
Red Stoch.-Buys Today |
Table 1
QuickSilver
Documentation
This is for short-term trading
leveraged ETFs.
It also provides a useful short-term outlook of these sectors ETF's
and the sectors they represewnt
Blue is Bullish
and
Red is Bearish.
1 Candle-Stick color is shortest-term. This
changes when close vis-a-vis opening changes.
So, in stocks or ETFs that advanced a long ways, traders should sell
when a higher
opening gives way to a decline that brings a drop below the previous
day's close.
2 5-dma AROC and Close-versus- pivot point is next
most short-term.
W = warning. Close is below PIVOT-Point.
3 Closing Power trend-direction vs. its 21-dma is next
most short-term.
4 IP21 is used to spot divergences and to estimate
underlying support.
5 > IP21 falling and below +.15 and its 21-dma is bearish in
an over-extended ETF, especially
when its Closing Power is falling and is below its 21-dma.
> IP21 below 07 with AROC below .07 is less likely to bring a rally
back up from 21-dma.
6 Note price trend-lines, support/resistance and price
patterns on charts.
QUICKSILVER on ETFS - 12/12/17
ETF      CLOSE   CHANGE     PIVOT-PT      5-dma AROC   CL-PWR      CANDLE  IP21   ITRS
---------------------------------------------------------------------------------------------
DIA       245.44    1.27     241.62        70.6%       Bullish      BLUE   .092    ----
---------------------------------------------------------------------------------------------
COMPQX    6862.32   -12.76   6776.38       73.5%       ----         RED    .163    -.037
---------------------------------------------------------------------------------------------
SPY       266.78    .47      263.24        67.9%       Bullish      BLUE   .193    -.032
---------------------------------------------------------------------------------------------
QQQ       155.69   -.21      153.5         93.4%       ----         RED    .093    -.02
---------------------------------------------------------------------------------------------
MDY       343.22   -.9       340.85        14.3%       ----         RED    .016    -.047
---------------------------------------------------------------------------------------------
IWM       150.88   -.47      150.22       -1.7%        Bearish      RED   -.015    -.084
---------------------------------------------------------------------------------------------
FAS       69.39    1.66      66.2          229%        Bullish      BLUE   .051     .128
---------------------------------------------------------------------------------------------
RETL      33.53   -1.63      33.48         4.4%        Bullish      RED    .223     .06
---------------------------------------------------------------------------------------------
SOXL      132   -4.08        131.99        49.8%       Bearish      RED   -.07     .036
---------------------------------------------------------------------------------------------
TECL      112.44   -.18      106.38        370.6%      Bearish      RED    .128     .161
---------------------------------------------------------------------------------------------
IBB       105.76   -.47      102.58        116.3%      Bearish      RED    .057    -.153
---------------------------------------------------------------------------------------------
GLD       118.15    .14     W120.07       -91.1%       Bearish      BLUE  -.048    -.111
---------------------------------------------------------------------------------------------
OIL       6.12   -.11        5.94         -49.1%       Bearish      RED   -.021     .078
---------------------------------------------------------------------------------------------
OIH       25.24    .03       24.39         50.5%       ----         RED   -.042    -.113
---------------------------------------------------------------------------------------------
GASL      22.02   -.57       20.59        -122.6%      Bearish      RED   -.223    -.159
---------------------------------------------------------------------------------------------
UGA       30.6   -.51        30.07        -56.9%       Bearish      RED   -.066     .016
---------------------------------------------------------------------------------------------
UUP       24.48    .04       24.35         39%         ----         ----   .012    -.083
---------------------------------------------------------------------------------------------
IEF       105.75   -.09     W106.18       -9.9%        Bearish      ----   .093    -.094
---------------------------------------------------------------------------------------------
CORN      16.65   -.05      W16.83        -77.3%       Bearish      ----  -.118    -.137
---------------------------------------------------------------------------------------------
WEAT      5.81   -.04       W6.01         -242.9%      Bearish      ----  -.176    -.201
---------------------------------------------------------------------------------------------
YINN      31.26   -.93       30.09        -147.6%      Bearish      BLUE   .029    -.026
---------------------------------------------------------------------------------------------
RSX       21.92   -.09       21.52         48.5%       Bearish      RED   -.164    -.097
---------------------------------------------------------------------------------------------
AAPL      171.7   -.97       169.01        60.6%       ----         RED    .024     .027
---------------------------------------------------------------------------------------------
GOOG      1040.48   -.62     1018.38       172.1%      Bullish      BLUE   .004     .002
---------------------------------------------------------------------------------------------
MSFT      85.58    .35       82.78         239.6%      Bullish      BLUE   .119     .057
---------------------------------------------------------------------------------------------
AMZN      1165.08   -3.84    1152.35       101.6%      Bearish      RED    .021     .125
---------------------------------------------------------------------------------------------
FB        176.96   -2.08     176.06        116.4%      ----         RED   -.062    -.045
---------------------------------------------------------------------------------------------
NVDA     190.84   -3.82      189.26        81.1%       Bearish      RED   -.111    -.024
---------------------------------------------------------------------------------------------
BA        289.94    6.78     278.27        256.3%      Bullish      BLUE   .095     .043
---------------------------------------------------------------------------------------------
GS        257.68    7.55     245.95        188%        Bullish      BLUE   .017    -.019
|
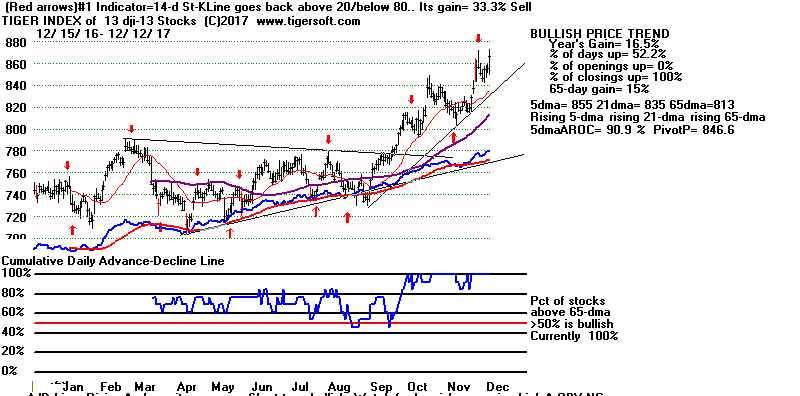 |
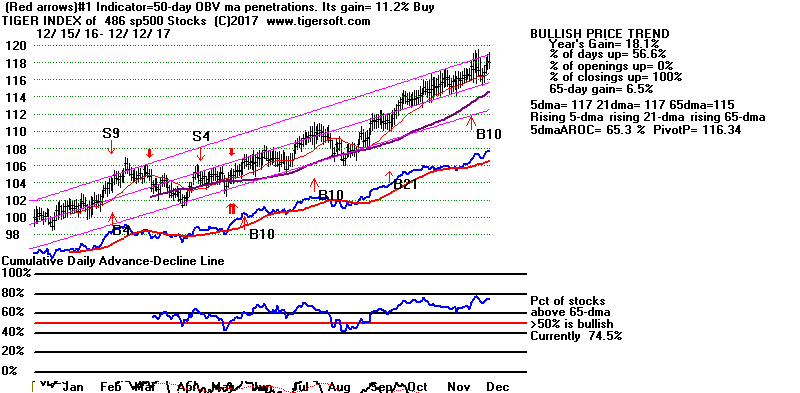 |
Table 2 COMPARISONS
OF BULLISH AND BEARISH GROUPS
12/12 12/11 12/8 12/7 12/6
12/5 12/4 12/1 11/30 11/29
11/28 11/27 11/24 11/21 11/20 11/17
11/16
NEWHIGHS
223 234 288 159 91 107 340 197 536 500 582 209
439 615 363 244 273
NEWLOWS 52
41 37 50 65 53 37 16 31 57 265 59 31 62 50 229 150
---------------------------------------------------------------------------------------------------------------------------------------------------------------------
MAXCPs
83 84 90 90
50
42
92 105 266 262 320
101 166
406 339 295 321
MINCPs
99 75 93 73
141
135 152 93 80 110 93
94 42 63 52 40
74
---------------------------------------------------------------------------------------------------------------------------------------------------------------------
TTTNHs
72 73 76 75 46
44
72 53 139
161 143 79 110 196 172 169
154
TTTNLs
161 155 177 109 219 248
402 286 162 230 124 144
66 186 184 79 78
---------------------------------------------------------------------------------------------------------------------------------------------------------------------
FASTUP
101
108 96 80
79
95
180 126
128 130 141 143 205 245 189 158
148
FASTDOWN
132 134 169
195 233 248 210 156 123 97 74 64 58 72 100 136
177
|
Table 3Count of Stocks and New Highs in Key Tiger Directories
Date = 171211
No. NHs Pct.
-------------------------------------------------------------------
BIGBANKS 7 4 57 %
DOWJONES 30 7 23 %
BIGMIL 6 1 17 %
FINANCE 92 16 17 %
SP-100 96 15 16 %
DJI-13 13 2 15 %
-------------------------------------------------------------------
INDEXES 195 26 13 %
MORNSTAR 238 22 9 %
INSURANC 32 3 9 %
SP500 486 38 8 %
INDMATER 92 6 7 %
RUS-1000 839 55 7 %
REGBANKS 33 2 6 %
CHEM 64 4 6 %
ETFS 65 3 5 %
TRANSP 20 1 5 %
UTILITY 43 2 5 %
COMPUTER 23 1 4 %
GREEN 31 1 3 %
NIFTY 30 1 3 %
MILITARY 38 1 3 %
ELECTRON 179 5 3 %
REIT 178 5 3 %
SOFTWARE 66 1 2 %
BIOTECH 386 8 2 %
NASD-100 105 2 2 %
RETAIL 53 1 2 %
SEMI 131 1 1 %
OILGAS 143 1 1 %
---------------------------------------------------
Others show no new highs today.
AUTO HOMEBLDG GAMING HACKERS INFRA CHINA %
SOLAR COAL GOLD EDU PIPELINE COMODITY BEVERAGE
FOOD BONDFUND HOSPITAL JETS
|
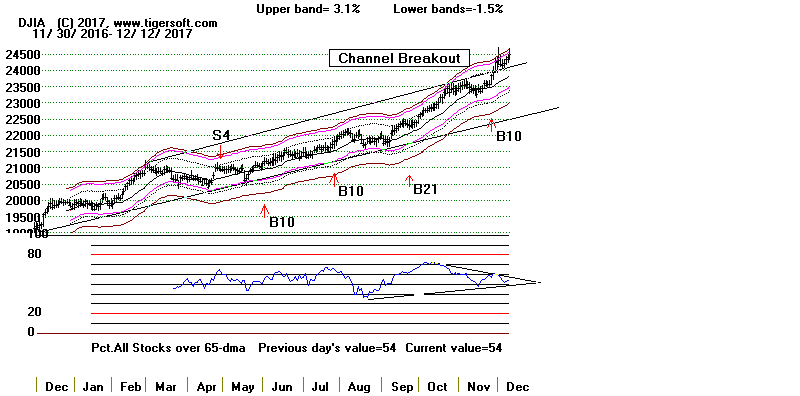 |
Table 4
 RANKING OF KEY DIRECTORIES BASED PCT.OF STOCKS ABOVE 65-DMA
                                 12/12/17
 Bullish = 34
 Bearish = 11
---------------------------------------------------------------------------------------
Directory     Current       day-1         day-2         day-3         day-4         day-5
----------------------------------------------------------------------------------------
BIGBANKS       1             1             1             1             1             1
DJI-13         1             1             1             1             1             1
INFRA          .909          1             1             1             .909          .818
TRANSP         .9            .9            .9            .9            .85           .85
JETS           .888          .888          .888          .888          .888          .888
BIGMIL         .833          .833          .833          .833          .666          .5
DOWJONES       .833          .866          .9            .833          .9            .9
SP-100         .812          .833          .822          .76           .77           .76
MORNSTAR       .81           .81           .781          .773          .722          .76
N=9
===========================================================================================
RETAIL         .754          .773          .754          .754          .773          .754
GAMING         .75           .75           .607          .535          .571          .642
SP500          .744          .755          .748          .722          .705          .724
NIFTY          .733          .7            .666          .666          .633          .566
FINANCE        .717          .684          .75           .75           .739          .793
RUS-1000       .717          .721          .715          .697          .675          .698
EDU            .714          .714          .714          .714          .714          .714
MILITARY       .71           .684          .71           .736          .631          .631
HOMEBLDG       .705          .705          .764          .764          .764          .823
REGBANKS       .696          .636          .727          .787          .787          .818
INDEXES        .687          .671          .651          .666          .646          .712
INSURANC       .656          .625          .625          .656          .687          .718
NASD-100       .647          .628          .609          .59           .561          .609
GREEN          .645          .612          .612          .58           .483          .548
UTILITY        .604          .697          .674          .674          .697          .627
BEVERAGE       .6            .55           .6            .65           .65           .65
HACKERS        .6            .64           .64           .64           .64           .64
SOFTWARE       .59           .606          .636          .606          .606          .59
AUTO           .575          .575          .575          .6            .575          .65
COMPUTER       .565          .565          .565          .565          .521          .565
INDMATER       .532          .51           .456          .478          .456          .5
REIT           .528          .477          .483          .443          .387          .387
ETFS           .523          .6            .507          .4            .246          .384
OILGAS         .503          .503          .426          .44           .433          .538
ELECTRON       .502          .536          .508          .53           .486          .502
N=25
============================================================================================
HOSPITAL       .5            .375          .375          .375          .375          .125
============================================================================================
CHEM           .484          .484          .468          .562          .531          .64
SOLAR          .428          .523          .523          .476          .333          .333
SEMI           .412          .458          .419          .442          .396          .419
CHINA          .39           .484          .359          .343          .375          .437
BIOTECH        .386          .404          .432          .378          .362          .388
COAL           .375          .375          .5            .5            .5            .5
COMODITY       .357          .357          .357          .357          .342          .385
BONDFUND       .162          .27           .288          .378          .378          .198
FOOD           .133          .066          .133          .133          .133          .266
GOLD           .125          .041          .02           0             .02           .062
PIPELINE       0             0             0             0             0             0
N=11
|
================================================================================
12/11/2017 The September
Buy B21 still operates. The DJI broke out above the
top of its 1600-point wide price channel at 24000. Classic technical
analysis suggests a target now of 25600 as a result.
As to when the next
tradable
top may occur in the DJI, the lesson of the 1926
tax cut could be
interpreted
as meaning a top will occur about February 11th
next year or two weeks
before
the President signs the final tax bill. Back then,
a two-month 17%
decline in the DJI followed. (I posted the DJI's 1926 chart in
last night's Hotline.)
But the
bearishness then, I believe, was mostly a result
of aggressive Fed tightening and the abrupt
end
of the Florida Real Estate bubble.
And to show we should not be
so
quick to take profits on the tax-cut's signing,
I also showed last night
that buying
on the signing of the Reagan tax cut in October
1986 was
actually the correct trading
approach, not selling.
(Again see the chart
of 1986-1987 there).
I think there's another way to gauge when we might get a Sell and that is by
finding
all the cases we can of past year-long DJI bull market like our own where
there
were no serious declines and the NYSE A/D Line was showing confirming
strength.
I can only find five since 1929. (Before then, we do not have
Advance/Decline
data.)
One more thing. If we compare the very narrow optimized lower
band numbers
below the 21-day ma, the closest to our own now, -1.5%, is
1995's -2.0%
optimized lower band. If this is right, then we are in the middle
stages of a very
long bull market.
Very strong Bull Market Subsequent Peak the
Following Year
------------------------
----------------------------------------------
1935
4/6/1936 S9,S12 11% decline, then NHs
1955
3/4/1955 No signal 7% decline, then NHs
1958
8/3/1959 S9
9% decline, nominal NH.
1985
3/27/1986 No signal 4.5% decline, then NHs
1995
3/18/1996 S1
5% decline, then NHs.
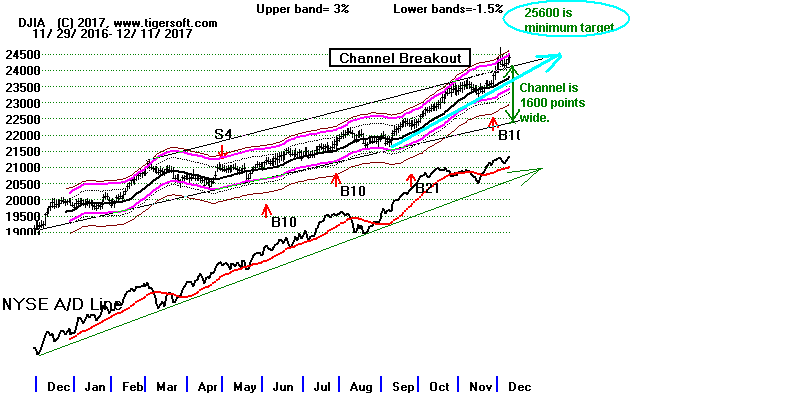
Even with though the DJI is already up nicely this month, it could very well
keep going still higher in keeping with the Santa Claus rally phenomenon.
Note in Table 1, how almost all the ETFs and Stocks we track there are now
above a rising 5-day ma. This is short-term bullish. The DJI is
showing
bullish-blue-across-the-board strength.
New Optimized Stochastic Buys
If you believe that secondary stocks will hold up for the rest of this year
and quite possibly lift-off upwards in January, then consider buying some
of the stocks that have rising 65-day moving averages and show new
red optimized-Stochastic Buys. I will start posting some each night
for the next two weeks. Tonight's can be viewed
here.
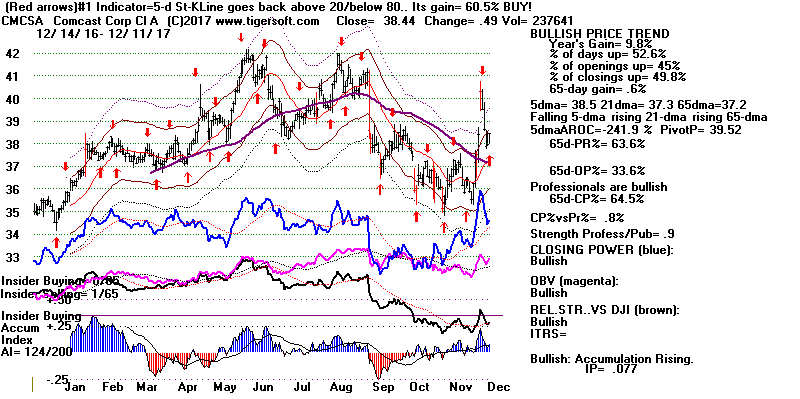
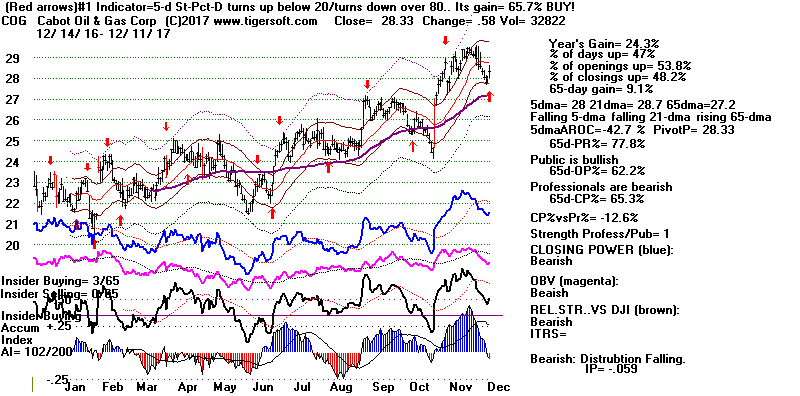
Links to Charts
Charts 12/11/2017
PEERLESS
DJI, Signals, Indicators Daily DJI
Volume 10-DayUp/Down Vol
DJI-AROC
Hourly DJIA
A/D Line for All Stocks
NASDAQ
S&P
OEX
NYSE
COMPQX
DJI-15 DJI-20
DJI-30
DIA
SPY
QQQ MDY
IWM TNA
CrudeOil
FAS
GLD
BBH
IBB
JETS
JNUG
KOL
NUGT
OIH
OIL
RSX
RETL
SDS
SLV
SOXL
TECL
TMF
TNA UGA
(gasoline)
XIV YINN
Commodities:
JJC, NIB,
CHOC
CORN,
WEAT
UUP
(Dollar)
AAPL ADBE
ALXN AMAT
AMGN AMD
AMZN
BA BABA BAC
BIDU
CAT
CVX
FB
GOOG
GS
HD
IBM
JPM M
(Macy's)
MSFT
NFLX
NVDA
QCOM
TSLA TXN
XOM WMT
ANDV (refinery),
CMG (Chipotle),
LRCX, SWKS,
TOWN New -
SPPI
(small Biotech)
12/11/2017
Bullish MAXCPs Bearish
MINCPs
Red Stoch.-Buys Today |
Table 1
QuickSilver
Documentation
This is for short-term trading
leveraged ETFs.
It also provides a useful short-term outlook of these sectors ETF's
and the sectors they represewnt
Blue is Bullish
and
Red is Bearish.
1 Candle-Stick color is shortest-term. This
changes when close vis-a-vis opening changes.
So, in stocks or ETFs that advanced a long ways, traders should sell
when a higher
opening gives way to a decline that brings a drop below the previous
day's close.
2 5-dma AROC and Close-versus- pivot point is next
most short-term.
W = warning. Close is below PIVOT-Point.
3 Closing Power trend-direction vs. its 21-dma is next
most short-term.
4 IP21 is used to spot divergences and to estimate
underlying support.
5 > IP21 falling and below +.15 and its 21-dma is bearish in
an over-extended ETF, especially
when its Closing Power is falling and is below its 21-dma.
> IP21 below 07 with AROC below .07 is less likely to bring a rally
back up from 21-dma.
6 Note price trend-lines, support/resistance and price
patterns on charts.
QUICKSILVER on ETFS - 12/11/17
ETF      CLOSE   CHANGE     PIVOT-PT      5-dma AROC   CL-PWR      CANDLE  IP21   ITRS
---------------------------------------------------------------------------------------------
DIA       244.17    .55      242.01        21.9%       Bullish      BLUE   .09    ----
---------------------------------------------------------------------------------------------
COMPQX    6875.08    35      6762.21       73.4%       ----         BLUE   .288    -.033
---------------------------------------------------------------------------------------------
SPY       266.31    .8       263.19        41.1%       Bullish      BLUE   .223    -.031
---------------------------------------------------------------------------------------------
QQQ       155.9    1.2       152.81        103.9%      Bullish      BLUE   .119    -.019
---------------------------------------------------------------------------------------------
MDY       344.12   -.23      342.24       -11.7%       ----         RED    .058    -.036
---------------------------------------------------------------------------------------------
IWM       151.35   -.06      150.93       -36.4%       Bearish      RED    .013    -.07
---------------------------------------------------------------------------------------------
FAS       67.73   -.21       66.32         37.4%       Bullish      RED    .012     .119
---------------------------------------------------------------------------------------------
RETL      35.16   -.27       33.5          100.9%      Bullish      RED    .251     .111
---------------------------------------------------------------------------------------------
SOXL      136.08    2.33     130.67        210.5%      Bearish      BLUE  -.031     .09
---------------------------------------------------------------------------------------------
TECL      112.62    2.68     104.41        388.1%      ----         BLUE   .141     .166
---------------------------------------------------------------------------------------------
IBB       106.23    .16      103.33        105.8%      Bearish      RED    .098    -.136
---------------------------------------------------------------------------------------------
GLD       118.01   -.47     W120.32       -132.4%      Bearish      RED   -.135    -.12
---------------------------------------------------------------------------------------------
OIL       6.23    .09        6.18          57.5%       Bearish      ----  -.023     .067
---------------------------------------------------------------------------------------------
OIH       25.21    .45       24.99        -42.3%       ----         BLUE  -.016    -.124
---------------------------------------------------------------------------------------------
GASL      22.59    1.04      22.55        -144.9%      Bearish      BLUE  -.188    -.115
---------------------------------------------------------------------------------------------
UGA       31.11    .16       30.95         89.8%       Bearish      BLUE  -.014     .014
---------------------------------------------------------------------------------------------
UUP       24.44    0         24.29         39%         ----         ----   .048    -.08
---------------------------------------------------------------------------------------------
IEF       105.84   -.07     W105.96       -1.9%        Bearish      RED    .002    -.097
---------------------------------------------------------------------------------------------
CORN      16.7   -.14       W16.91        -53.4%       Bearish      RED   -.043    -.144
---------------------------------------------------------------------------------------------
WEAT      5.85   -.07       W6.1          -199.4%      Bearish      ----  -.135    -.202
---------------------------------------------------------------------------------------------
YINN      32.19    .74       32.18         8%          Bearish      ----   .043     .015
---------------------------------------------------------------------------------------------
RSX       22.01    .44       21.71         67.1%       Bearish      BLUE  -.153    -.103
---------------------------------------------------------------------------------------------
AAPL      172.67    3.3      169.64        84.7%       ----         BLUE   .028     .029
---------------------------------------------------------------------------------------------
GOOG      1041.1    4.05     1005.15       208.3%      Bullish      BLUE   .013    -.005
---------------------------------------------------------------------------------------------
MSFT      85.23    1.07      81.59         251.8%      Bullish      BLUE   .138     .053
---------------------------------------------------------------------------------------------
AMZN      1168.92    6.92    1141.57       152.1%      Bearish      BLUE   .015     .125
---------------------------------------------------------------------------------------------
FB        179.04    .04      172.83        215.2%      ----         RED   -.031    -.043
---------------------------------------------------------------------------------------------
NVDA     194.66    3.17      187.74        211.2%      Bearish      BLUE  -.06     -.002
---------------------------------------------------------------------------------------------
BA        283.16   -2.74     275.54        92.7%       Bullish      RED    .108     .023
---------------------------------------------------------------------------------------------
GS        250.13   -.22      248.33       -10.5%       Bearish      BLUE  -.064    -.036
|
Table 2 COMPARISONS
OF BULLISH AND BEARISH GROUPS
12/11 12/8 12/7 12/6
12/5 12/4 12/1 11/30 11/29
11/28 11/27 11/24 11/21 11/20 11/17
11/16
NEWHIGHS
234 288 159 91 107 340 197 536 500 582 209
439 615 363 244 273
NEWLOWS
41 37 50 65 53 37 16 31 57 265 59 31 62 50 229 150
---------------------------------------------------------------------------------------------------------------------------------------------------------------------
MAXCPs
84 90 90
50
42
92 105 266 262 320
101 166
406 339 295 321
MINCPs
75 93 73
141
135 152 93 80 110 93
94 42 63 52 40
74
---------------------------------------------------------------------------------------------------------------------------------------------------------------------
TTTNHs
73 76 75 46
44
72 53 139
161 143 79 110 196 172 169
154
TTTNLs
155 177 109 219 248
402 286 162 230 124 144
66 186 184 79 78
---------------------------------------------------------------------------------------------------------------------------------------------------------------------
FASTUP
108 96 80
79
95
180 126
128 130 141 143 205 245 189 158
148
FASTDOWN
134 169 195 233 248 210 156 123 97 74 64 58 72 100 136
177
|
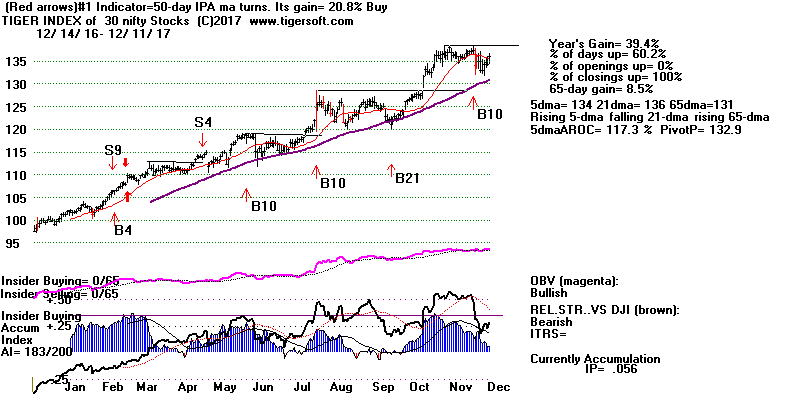
Components of Tiger's Nifty-30 Index.
AAPL ADBE ADP ADSK ALGN AMAT AMT AMZN ATVI AVGO CHDN CPA CTAS
EQIX EXPD FB FISV GOOG HD ISRG LMT MSFT MU NVDA NVR PCLN PLUS TSLA
VRTX |
Table 3
Count of Stocks and New Highs in Key Tiger Directories
Date = 171211
               No.          NHs            Pct.
-------------------------------------------------------------------
JETS           9             2             22 %
UTILITY        43            8             19 %
INDEXES        195           32            16 %
---------------------------------------------------
GAMING         28            4             14 %
DOWJONES       30            4             13 %
INSURANC       32            4             13 %
COMPUTER       23            3             13 %
GREEN          31            3             10 %
TRANSP         20            2             10 %
INFRA          11            1             9 %
MORNSTAR       238           18            8 %
FINANCE        92            6             7 %
RUS-1000       839           58            7 %
SP-100         96            6             6 %
SP500          486           30            6 %
INDMATER       92            5             5 %
ETFS           65            3             5 %
SOFTWARE       66            3             5 %
NASD-100       100           5             5 %
SOLAR          21            1             5 %
HACKERS        25            1             4 %
RETAIL         53            2             4 %
REGBANKS       33            1             3 %
CHEM           64            2             3 %
NIFTY          30            1             3 %
ELECTRON       179           6             3 %
OILGAS         143           4             3 %
BIOTECH        386           11            3 %
REIT           178           6             3 %
SEMI           131           3             2 %
CHINA          64            1             2 %
BONDFUND       111           1             1 %
=================================================
None:  BIGBANKS BIGMIL AUTO HOMEBLDG DJI-13 MILITARY
COAL GOLD EDU  PIPELINE COMODITY  BEVERAGE  FOOD
HOSPITAL
|
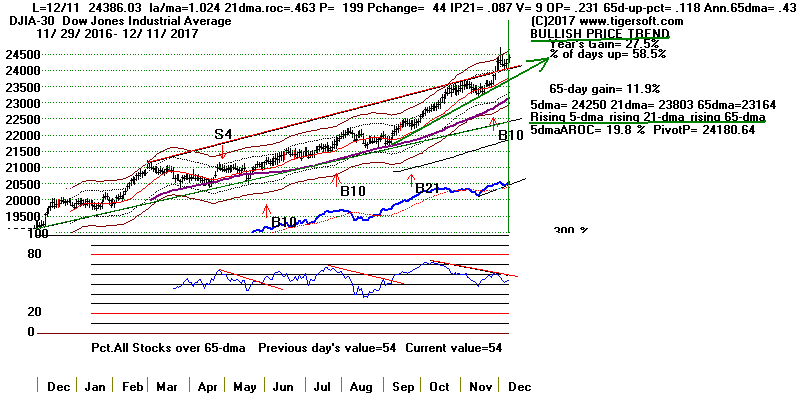 |
Table 4
 RANKING OF KEY DIRECTORIES BASED PCT.OF STOCKS ABOVE 65-DMA
             12/11/17
Bullish = 34
Bearish = 12
---------------------------------------------------------------------------------------
Directory     Current       day-1         day-2         day-3         day-4         day-5
----------------------------------------------------------------------------------------
BIGBANKS       100%          1             1             1             1             1
DJI-13         100%          1             1             1             1             1
INFRA          100%          1             1             .909          .818          1
TRANSP         .9            .9            .9            .85           .85           .95
JETS           .888          .888          .888          .888          .888          .888
DOWJONES       .866          .9            .833          .9            .933          .9
BIGMIL         .833          .833          .833          .666          .5            .833
SP-100         .833          .822          .76           .77           .77           .791
MORNSTAR       .81           .781          .773          .722          .764          .777
---------------------------------------------------------------------------------------------
RETAIL         .773          .754          .754          .773          .754          .792
SP500          .755          .748          .722          .705          .726          .755
GAMING         .75           .607          .535          .571          .642          .642
RUS-1000       .721          .715          .697          .675          .697          .734
EDU            .714          .714          .714          .714          .714          .714
HOMEBLDG       .705          .764          .764          .764          .823          .823
NIFTY          .7            .666          .666          .633          .566          .566
-------------------------------------------------------------------------------------------
UTILITY        .697          .674          .674          .697          .627          .744
FINANCE        .684          .75           .75           .739          .804          .847
MILITARY       .684          .71           .736          .631          .631          .605
INDEXES        .671          .651          .666          .646          .712          .748
HACKERS        .64           .64           .64           .64           .64           .64
REGBANKS       .636          .727          .787          .787          .818          .939
NASD-100       .63           .61           .6            .57           .6            .59
INSURANC       .625          .625          .656          .687          .718          .75
GREEN          .612          .612          .58           .483          .548          .58
SOFTWARE       .606          .636          .606          .606          .59           .59
ETFS           .6            .507          .4            .246          .384          .446
COMPUTER       .565          .565          .565          .521          .565          .608
AUTO           .564          .564          .589          .564          .641          .692
BEVERAGE       .55           .6            .65           .65           .65           .65
ELECTRON       .536          .508          .53           .486          .513          .536
SOLAR          .523          .523          .476          .333          .333          .333
INDMATER       .51           .456          .478          .456          .51           .554
OILGAS         .503          .426          .44           .433          .538          .594
=============================================================================================
CHEM           .484          .468          .562          .531          .656          .703
CHINA          .484          .359          .343          .375          .437          .421
REIT           .477          .483          .443          .387          .387          .522
SEMI           .458          .419          .442          .396          .427          .458
BIOTECH        .404          .432          .378          .362          .391          .409
COAL           .375          .5            .5            .5            .5            .5
HOSPITAL       .375          .375          .375          .375          .125          .375
COMODITY       .357          .357          .357          .342          .385          .485
BONDFUND       .27           .288          .378          .378          .198          .09
FOOD           .066          .133          .133          .133          .266          .466
GOLD           .04           .02           0             .02           .061          .142
PIPELINE       0             0             0             0             0             0
N=12
|
=========================================================================
12/8/2017
The September
Buy B21 still operates. The expected minor seasonal
weakness
again did not materialize. Instead, the market rallied to celebrate
another month's
good Jobs' numbers and signs from food commodities that official Inflation is
not a
problem. FAS and
DIA show across-the-board Bullish Blue technical
indicators
in Table 1 below. The strongest DJI stocks, BA,
HD and CAT made fine
gains again
today. Their leadership is expected to continue and take the DJI to
new highs. The
NASDAQ and
Russell-2000 may have to wait until the start of the next year.
Be Aware of 4-Year Presidential Cycle's Influence
on DJIA's Moves.
In years after a Presidential Election year since 1945, buying on December
10th
and selling April 30th the following year would have gained a trader only
3.1%
This number is considerably less than the average gain over this period for
all years
since 1945. The reason is that the first five months of the second
year in the Presidential
cycle are not so bullish as in other years. Readers might want to save
the table below
future reference. It comes from the new Peerless Technical book I am
writing to
explain the bases of the various Peerless Buys and Sells. This data suggest
that February
and March may pose seasonal problems for the market.
DJI's Performance by Month
in Presidential 4-Year Cycle:
1929-2017
Year of
Year after 2nd Year after 3rd Year after
Pres.Election
Presid.Election Presid. Election Presid. Election
----------------- ------------------ ----------------- -----------------
Month No. Avg. Pct.Up No. Avg. Pct.Up No. Avg. Pct.Up No. Avg. Pct.Up
Change
Change Change Change
----- ----------------- ----------------- ------------------ ------------------
January 21 .008 .571 23 .007 .565 22 .002 .545 22 .025 .772
February 21 .004 .666 23 -.012 .478 22 .004 .636 22 .016 .681
March 21 .004 .666 23 .002 .478 22 .001 .636 22 .005 .59
April 21 -.009 .523 23 .03 .608 22 .007 .636 22 .026 .818
May 21 -.019 .523 23 .013 .652 22 -.007 .454 22 -.002 .545
June 21 .013 .714 23 .005 .391 22 -.009 .363 22 .024 .636
July 21 .016 .571 23 .02 .739 22 .006 .545 22 .004 .545
August 21 .022 .761 23 -.003 .521 22 -.009 .590 22 .002 .59
Sept 21 -.004 .38 23 -.016 .478 22 -.011 .409 22 -.012 .59
October 21 -.006 .571 23 -.01 .565 22 .027 .727 22 .002 .59
Novem. 21 .002 .523 22 .007 .727 22 .015 .681 22 -.003 .5
Decemb. 21 .01 .809 22 .015 .772 22 .01 .590 22 .019 .772
|
But there remain some problems. Leading Semi-conductors could not
power
up through their 65-dma and that turned SOXL down today. QQQ shows a
potential
head/shoulders pattern. And there were more MINCP than MAXCPs today.
I would abide by the direction and trend of the 65-dma. SOXL and QQQ
should find ample support there. Keep in mind that the NASDAQ's AI/200
score is a remarkably bullish 199 of 200. IWM may need to bide its
time for
now, but I would expect it to be the beneficiary of a lot of new investment
funds at the start of the next year.
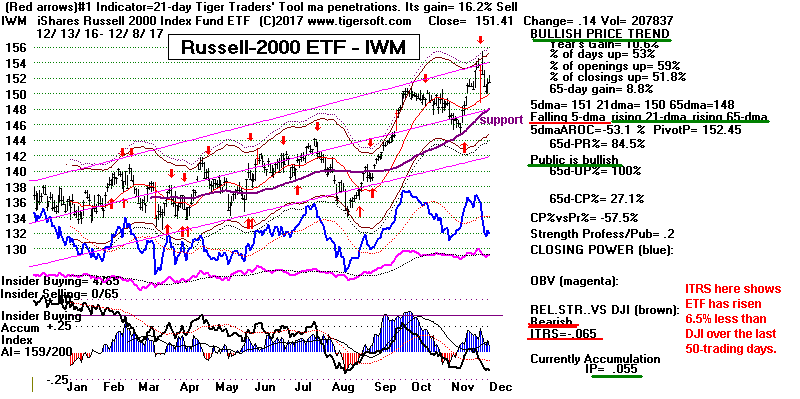
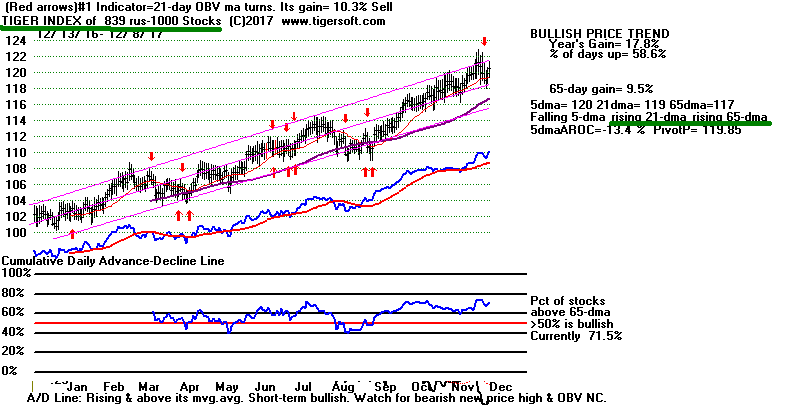
How Two Big Tax Cuts Affected The Market:
1986 and 1926
The second Reagan tax cut was signed on October 22, 1986. It cut the
top income
rate from 50% to 38.5%. You can see below that the DJI immediately
went higher,
but the NASDAQ did not rise until the start of 1987. I would judge
that a useful
guide now for how the NASDAQ and smaller Russell-2000 stocks will behave
over the next three months. A lot of this untaxed money will, I think,
finds its way
into stocks, stock-buy-backs and outright mergers and acquisitions, at least
until
the Fed significantly tightens. That and the collapse of the Florida
Land boom in
February 1926, brought about a 15% drop in the DJI soon after Coolidge
signed
his big tax-cut.
1986-1987
The DJI and NASDAQ after Reagan's Second Tax Cut, which the Fed did not
interfere with.
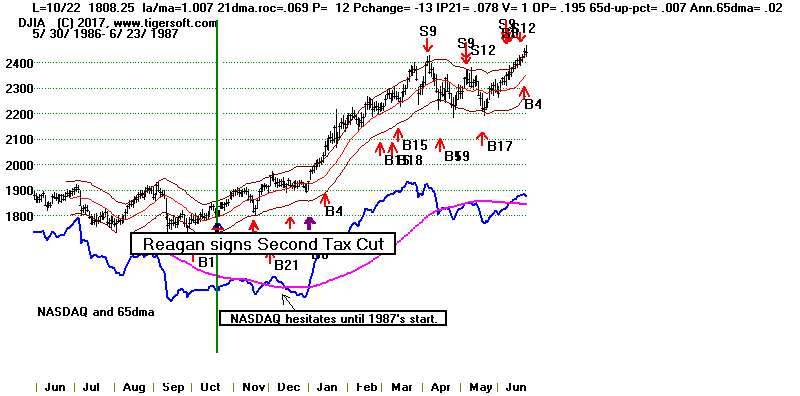 |
1926 Coolidge Tax Cut, Fed's Tightening and Stock Prices
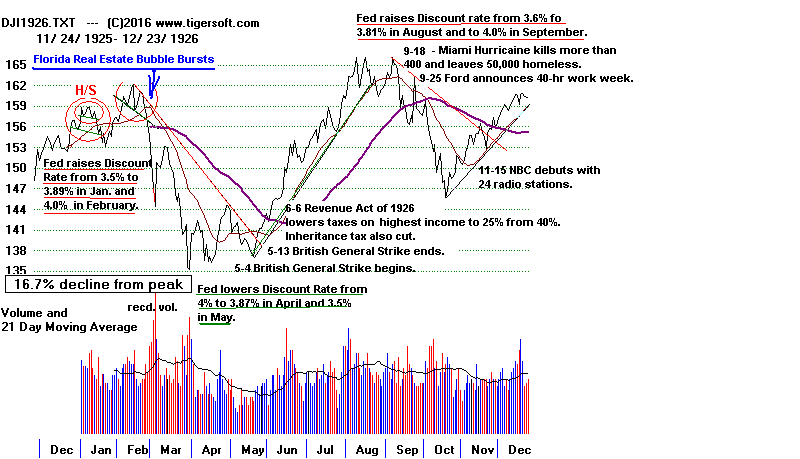 |
BIG BANKS
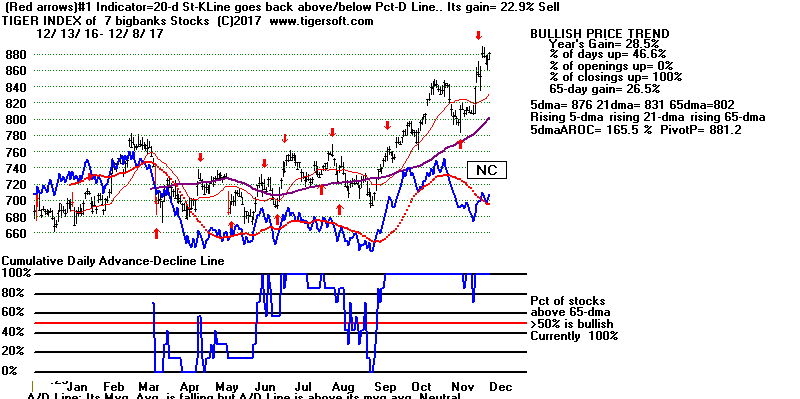 |
NIFTY-30
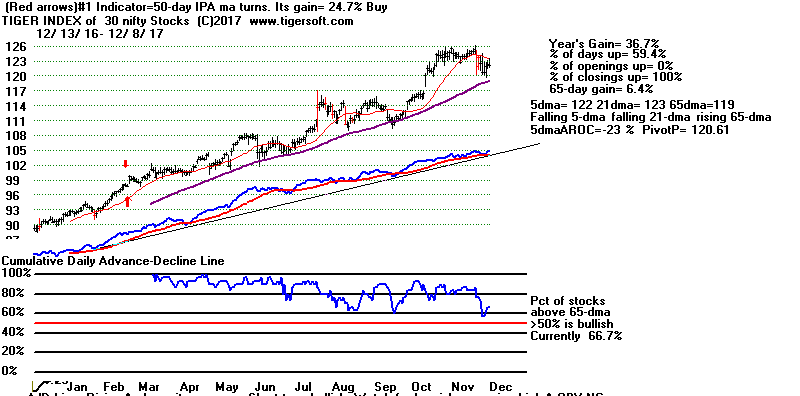
Components of Tiger's Nifty-30 Index.
AAPL ADBE ADP ADSK ALGN AMAT AMT AMZN ATVI AVGO CHDN CPA CTAS
EQIX EXPD FB FISV GOOG HD ISRG LMT MSFT MU NVDA NVR PCLN PLUS TSLA
VRTX |
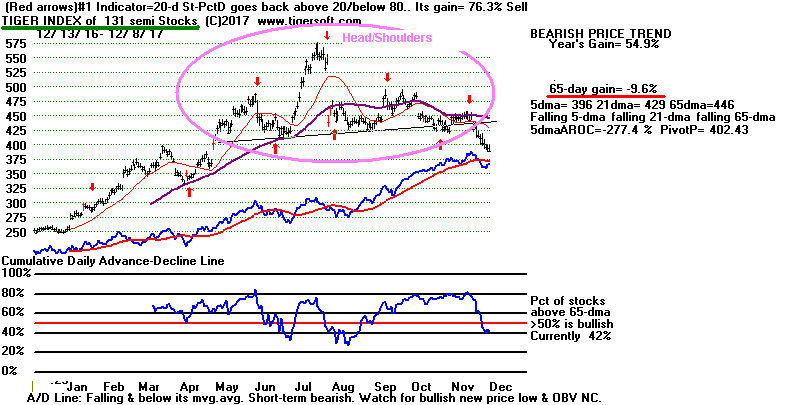 |
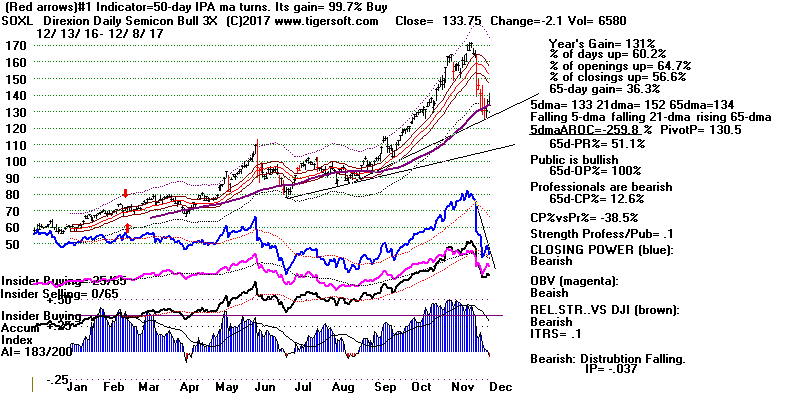 |
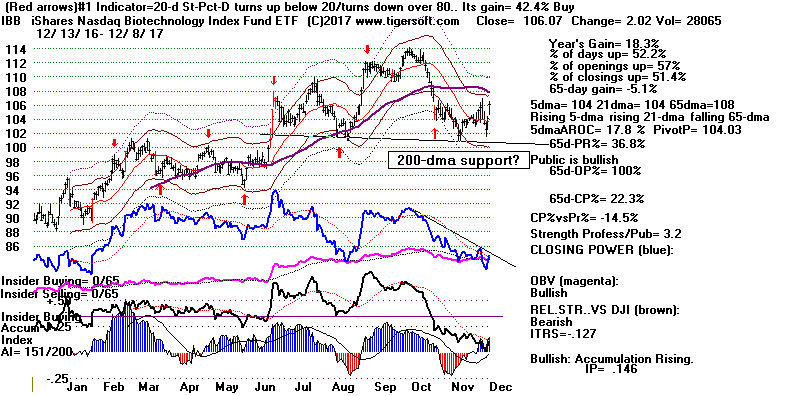 |
Table 1
QuickSilver
Documentation
This is for short-term trading
leveraged ETFs.
It also provides a useful short-term outlook of these sectors ETF's
and the sectors they represewnt
Blue is Bullish
and
Red is Bearish.
1 Candle-Stick color is shortest-term. This
changes when close vis-a-vis opening changes.
So, in stocks or ETFs that advanced a long ways, traders should sell
when a higher
opening gives way to a decline that brings a drop below the previous
day's close.
2 5-dma AROC and Close-versus- pivot point is next
most short-term.
W = warning. Close is below PIVOT-Point.
3 Closing Power trend-direction vs. its 21-dma is next
most short-term.
4 IP21 is used to spot divergences and to estimate
underlying support.
5 > IP21 falling and below +.15 and its 21-dma is bearish in
an over-extended ETF, especially
when its Closing Power is falling and is below its 21-dma.
> IP21 below 07 with AROC below .07 is less likely to bring a rally
back up from 21-dma.
6 Note price trend-lines, support/resistance and price
patterns on charts. QUICKSILVER on ETFS - 12/08/17
ETF      CLOSE   CHANGE     PIVOT-PT      5-dma AROC   CL-PWR   CANDLE  IP21   ITRS
---------------------------------------------------------------------------------------------
DIA       243.62    1.26     243.11        24.1%       Bullish   BLUE   .093    ----
---------------------------------------------------------------------------------------------
COMPQX    6840.08    27.24   6775.37      -5.5%        ----      RED    .294    -.03
---------------------------------------------------------------------------------------------
SPY       265.51    1.44     264.14        19.9%       Bullish   BLUE   .224    -.029
---------------------------------------------------------------------------------------------
QQQ       154.7    .68       152.71        6.8%        ----      RED    .142    -.018
---------------------------------------------------------------------------------------------
MDY       344.35    1.28    W344.92       -9.8%        ----      BLUE   .082    -.033
---------------------------------------------------------------------------------------------
IWM       151.41    .14     W152.45       -53.1%       ----      RED    .055    -.065
---------------------------------------------------------------------------------------------
FAS       67.94    1.01      67.23         134.5%      Bullish   BLUE   .061     .137
---------------------------------------------------------------------------------------------
RETL      35.43    1.27      34.47         494.9%      Bullish   BLUE   .259     .126
---------------------------------------------------------------------------------------------
SOXL      133.75   -2.1      130.5        -259.8%      Bearish   RED   -.037     .1
---------------------------------------------------------------------------------------------
TECL      109.94    1.61     104.34        10.8%       Bearish   RED    .15     .162
---------------------------------------------------------------------------------------------
IBB       106.07    2.02     104.03        17.8%       ----      BLUE   .147    -.127
---------------------------------------------------------------------------------------------
GLD       118.48    -.01     121.18       -129.2%      Bearish   RED   -.113   -.12
---------------------------------------------------------------------------------------------
OIL       6.14    .11       W6.16         -106.3%      Bearish   ----  -.07     .05
---------------------------------------------------------------------------------------------
OIH       24.76    .28      W25.42        -128.3%      Bearish   ----  -.033    -.139
---------------------------------------------------------------------------------------------
GASL      21.55    .75      W23.22        -616.8%      Bearish   BLUE  -.163    -.165
---------------------------------------------------------------------------------------------
UGA       30.95    .32       30.56        -57%         Bearish   ----  -.046    -.015
---------------------------------------------------------------------------------------------
UUP       24.44    .04       24.25         55.6%       ----      ----   .006    -.08
---------------------------------------------------------------------------------------------
IEF       105.91   -.08      105.88       -.9%         ----      RED    .02    -.096
---------------------------------------------------------------------------------------------
CORN      16.84    .03      W16.88        -71%         Bearish   ----  -.129    -.126
---------------------------------------------------------------------------------------------
WEAT      5.92   -.05       W6.09         -206%        Bearish   RED   -.131    -.202
---------------------------------------------------------------------------------------------
YINN      31.45    1.5      W32.14        -108.6%      Bearish   ----   .066     .027
---------------------------------------------------------------------------------------------
RSX       21.57    .06      W21.72         25.5%       Bearish   ----  -.182    -.112
---------------------------------------------------------------------------------------------
AAPL      169.37    .05     W169.8        -49.5%       Bearish   RED    .018     .015
---------------------------------------------------------------------------------------------
GOOG      1037.05    6.12    998.68        132.7%      Bullish   RED    .018     .003
---------------------------------------------------------------------------------------------
MSFT      84.16    1.67      81.08        -6.1%        ----      BLUE   .136     .05
---------------------------------------------------------------------------------------------
AMZN      1162    2.21       1133.95      -1.5%        Bearish   RED    .033     .125
---------------------------------------------------------------------------------------------
FB        179   -1.14        171.47        111.4%      Bullish   RED    .027    -.029
---------------------------------------------------------------------------------------------
NVDA     191.49   -.5        186.66       -162.3%      Bearish   RED   -.036     0
---------------------------------------------------------------------------------------------
BA        285.9    3.93      277.97        262.1%      Bullish   BLUE   .103     .035
---------------------------------------------------------------------------------------------
GS        250.35    1.79    W250.65        28.2%       Bearish   RED   -.053    -.026
|
Table 2 COMPARISONS
OF BULLISH AND BEARISH GROUPS
12/8 12/7 12/6
12/5 12/4 12/1 11/30 11/29
11/28 11/27 11/24 11/21 11/20 11/17
11/16
NEWHIGHS
288 159 91 107 340 197 536 500 582 209
439 615 363 244 273
NEWLOWS 37 50 65 53 37 16 31 57 265 59 31 62 50 229 150
---------------------------------------------------------------------------------------------------------------------------------------------------------------------
MAXCPs
90 90
50
42
92 105 266 262 320
101 166
406 339 295
321
MINCPs
93 73
141
135 152 93 80 110 93
94 42 63 52 40
74
---------------------------------------------------------------------------------------------------------------------------------------------------------------------
TTTNHs
76 75 46
44
72 53 139
161 143 79 110 196 172 169
154
TTTNLs
177 109 219 248
402 286 162 230 124 144
66 186 184 79 78
---------------------------------------------------------------------------------------------------------------------------------------------------------------------
FASTUP
96 80
79
95
180 126
128 130 141 143 205 245 189 158
148
FASTDOWN
169 195 233 248 210 156 123 97 74 64 58 72 100 136
177
|
Table 3Count of Stocks and New Highs in Key Tiger Directories
Date = 171208
No. NHs Pct.
-------------------------------------------------------------------
INFRA 11 3 27 %
TRANSP 20 5 25 %
BIGMIL 6 1 17 %
INSURANC 32 5 16 %
DJI-13 13 2 15 %
RETAIL 53 8 15 %
===================================================
BIGBANKS 7 1 14 %
INDEXES 195 26 13 %
MORNSTAR 238 32 13 %
SP500 486 60 12 %
RUS-1000 839 99 12 %
JETS 9 1 11 %
DOWJONES 30 3 10 %
BEVERAGE 20 2 10 %
COMPUTER 23 2 9 %
FINANCE 92 7 8 %
MILITARY 38 3 8 %
NASD-100 88 7 8 %
GAMING 28 2 7 %
UTILITY 43 3 7 %
GREEN 31 2 6 %
CHEM 64 4 6 %
SP-100 96 6 6 %
INDMATER 92 5 5 %
SOLAR 21 1 5 %
REGBANKS 33 1 3 %
NIFTY 30 1 3 %
ELECTRON 179 6 3 %
SEMI 131 4 3 %
SOFTWARE 66 2 3 %
BIOTECH 385 13 3 %
ETFS 65 1 2 %
REIT 178 3 2 %
OILGAS 142 2 1 %
===================================================
None: AUTO HOMEBLDG HACKERS CHINA COAL GOLD
EDU PIPELINE COMODITY FOOD BONDFUND HOSPITAL
|
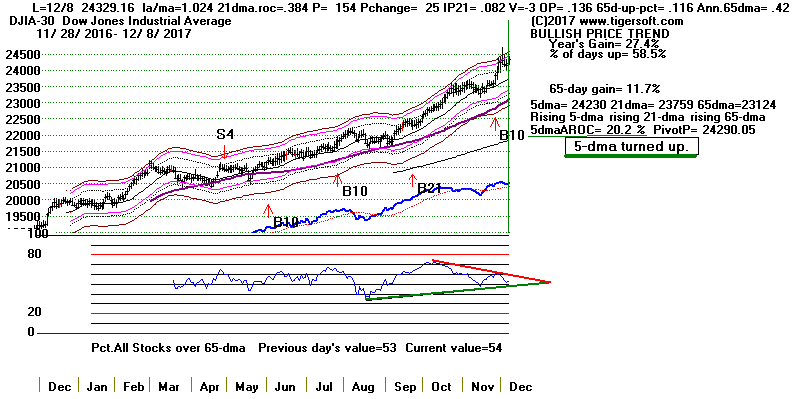 |
Table 4
 RANKING OF KEY DIRECTORIES BASED PCT.OF STOCKS ABOVE 65-DMA
              12/8/17
 Bullish = 32
 Bearish = 13
---------------------------------------------------------------------------------------
Directory     Current       day-1         day-2         day-3         day-4         day-5
----------------------------------------------------------------------------------------
BIGBANKS       100%          1             1             1             1             1
DJI-13         1             1             1             1             1             1
INFRA          1             1             .909          .818          1             .909
DOWJONES       .9            .833          .9            .933          .9            .9
TRANSP         .9            .9            .85           .85           .95           .95
JETS           .888          .888          .888          .888          .888          .888
BIGMIL         .833          .833          .666          .5            .833          .833
SP-100         .822          .76           .77           .77           .791          .833
--------------------------------------------------------------------------------------------
MORNSTAR       .781          .773          .722          .764          .777          .794
HOMEBLDG       .764          .764          .764          .823          .823          .823
RETAIL         .754          .754          .773          .754          .792          .716
FINANCE        .75           .75           .739          .804          .847          .858
SP500          .748          .722          .705          .726          .755          .767
REGBANKS       .727          .787          .787          .818          .939          .939
RUS-1000       .715          .697          .675          .697          .733          .735
EDU            .714          .714          .714          .714          .714          .714
MILITARY       .71           .736          .631          .631          .631          .605
UTILITY        .674          .674          .697          .627          .72           .79
NIFTY          .666          .666          .633          .566          .566          .733
NASD-100       .659          .625          .59           .602          .602          .647
INDEXES        .651          .666          .646          .712          .748          .774
HACKERS        .64           .64           .64           .64           .64           .68
SOFTWARE       .636          .606          .606          .59           .59           .651
INSURANC       .625          .656          .687          .718          .75           .687
GREEN          .612          .58           .483          .548          .58           .645
GAMING         .607          .535          .571          .642          .642          .75
BEVERAGE       .6            .65           .65           .65           .65           .6
COMPUTER       .565          .565          .521          .565          .608          .695
AUTO           .564          .589          .564          .641          .692          .692
SOLAR          .523          .476          .333          .333          .333          .476
ELECTRON       .508          .53           .486          .513          .536          .62
ETFS           .507          .4            .246          .384          .446          .476
N=32
---------------------------------------------------------------------------------------------
COAL           .5            .5            .5            .5            .5            .375
---------------------------------------------------------------------------------------------
REIT           .483          .443          .387          .387          .522          .505
CHEM           .468          .562          .531          .656          .703          .687
INDMATER       .456          .478          .456          .51           .554          .565
BIOTECH        .431          .376          .361          .389          .41           .454
OILGAS         .429          .443          .436          .542          .605          .654
SEMI           .419          .442          .396          .427          .458          .595
HOSPITAL       .375          .375          .375          .125          .375          .375
CHINA          .359          .343          .375          .437          .421          .468
COMODITY       .352          .352          .338          .38           .464          .521
BONDFUND       .288          .378          .378          .198          .09           .108
FOOD           .133          .133          .133          .266          .466          .533
GOLD           .02           0             .02           .061          .122          .183
PIPELINE       0             0             0             0             0             0
N= 13
|
=========================================================================
=========================================================================
12/7/2017
The September
Buy B21 still operates. The expected minor seasonal
weakness
seems unable to hold back leading DJI and tech stocks. Look at
BA's
soaring to another new high. DJI Strength tomorrow would be quite
bullish.
Note that Wednesday night
I recommended buying SOXL because it seemed
to have successfully
tested its rising 65-dma. Each rally to its 65-dma for the
last 12 months has brought a quick recovery back to the recent highs.
This is
a very bullish sign. It is a reminder that the
NASDAQ's AI/200 score is a
record 199 and that the optimized lower band for
the DJI is only 1.5% below
its 21-dma, the shallowest optimized lower band in more than 102 years.
(I only use the DJI's back data to 1915.)
I've suggested that
seasonality and a pause in technical strength was likely
to bring about a shallow DJI decline likely over the next week or so A 3%
DJI decline from its
highs seemed to be in keeping with its key values when it
reached its 3% upper band. This would mean a decline to its 23500,
just below the current 21-dma around the 17th. After that,
I said, we should then
expect the normal Santa Claus B13 rally. But that may be too cautious.
We have to take advantage of new opportunities and
new technical
evidence as they are presented.
I said last night that the DJI would look a lot
stronger
if Home Depot and Caterpillar
would rise too, besides BA and
GS.
That is exactly what took place today. And significantly,
Professionals today
become net buyers of DIA. Its Closing Power
turned up from its 21-day ma |
instead of dropping below it. Tomorrow, it will only take a 20 points
higher
close by the DJI to turn up the 5-day ma and give DIA an across-the-board
Bullish (blue) QuickSilver status. That development would be quite
bullish and
suggest that the bearish immediate seasonality has been overcome.
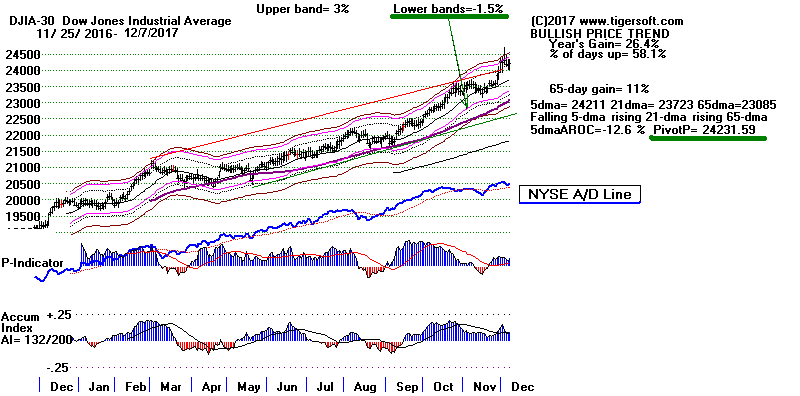
What would really be impressive would be if both the DJI and the leading
techs, especially SOXL, would advance at the
same time. It would show
that the rally is being staged by elite Professionals who are shifting money
from one group to another.
Seasonality As Bench-Mark
The new seasonality study here of the DJI since 1929
suggests that there
should be a bottom about 5 trading days from now, if the market
behaves perfectly typically. See the new
Seasonality (1) Table just
below the Links to Charts. A 1.4% rally in the DJI should then follow
through the 22nd trading day from now. This has some merit because
it encompasses 86 years of data. But it can be faulted, if you believe
the Depression and War years should be considered unduly dismal and
improbable. In that case, consider in Seasonality
(2) Table and only the
years after a Presidential Election since 1945.
The next DJI bottom
according to the more limited data in these 18 cases should take place
9 trading days from now and the next peak 18 trading days hence.
I suggest that we use these numbers as bench-marks to see if the DJI
now is stronger or weaker than it typically was in the past at this time
of year. If there is no decline over the next week, the DJI
should be
considered unusually bullish.
Links to Charts
Charts 12/7/2017
PEERLESS
DJI, Signals, Indicators Daily DJI
Volume 10-DayUp/Down Vol
DJI-AROC
Hourly DJIA
A/D Line for All Stocks
NASDAQ
S&P
OEX
NYSE
COMPQX
DJI-15 DJI-20
DJI-30
DIA
SPY
QQQ MDY
IWM TNA
CrudeOil
FAS
GLD
BBH
IBB
JETS
JNUG
KOL
NUGT
OIH
OIL
RSX
RETL
SDS
SLV
SOXL
TECL
TMF
TNA UGA
(gasoline)
XIV YINN
Commodities:
JJC, NIB,
CHOC
CORN,
WEAT
UUP
(Dollar)
AAPL ADBE
ALXN AMAT
AMGN AMD
AMZN
BA BABA BAC
BIDU
CAT
CVX
FB
GOOG
GS
HD
IBM
JPM M
(Macy's)
MSFT
NFLX
NVDA
QCOM
TSLA TXN
XOM WMT
ANDV (refinery),
CMG (Chipotle),
LRCX, SWKS,
TOWN New -
SPPI
(small Biotech)
12/7/2017
Bullish MAXCPs Bearish
MINCPs
|
New Table - Seasonality (1)
DJI's movement after 12/07 since
1929
(C) 2017 William Schmidt, Ph.D. www.tigersoft.com
All years: 1929-2016.Days 12/7 Pct.Gain Pct.of time DJI advanced.
-----------------------------------------------------
1 day -.001 .505
2 days -.002 .471
3 days -.004 .482
4 days -.005 .517
5 days -.005 trough .482 trough
6 days -.005 .505
7 days -.003 .517
8 days -.004 .528
9 days -.003 .551
10 days -.002 .563
11 days -.001 .528
12 days .002 .563
13 days .003 .586
14 days .004 .62
15 days .007 .597
16 days .01 .666
17 days .012 .735
18 days .013 .747
19 days .013 .77
20 days .014 .747
21 days .014 .735
22 days .014 .747 Peak
23 days .013 .701
24 days .013 .666
25 days .014 .678
26 days .013 .666
27 days .014 .678
28 days .012 .632
29 days .012 .632
30 days .012 .62
31 days .011 .574 Trough
32 days .012 .597
33 days .014 .643
34 days .014 .643
35 days .015 .632
36 days .014 .62
37 days .016 .643
38 days .017 .62
39 days .018 .62
40 days .018 .632
41 days .019 .62
42 days .017 .609
43 days .017 .632
44 days .017 .643 Peak
45 days .019 .632
46 days .019 .609
47 days .021 Peak .62
48 days .021 .62
49 days .02 .62
50 days .02 .62
51 days .02 .62
52 days .019 .609
53 days .019 .609
54 days .02 .62
55 days .02 .597
56 days .02 .632
57 days .021 .632
58 days .023 .643
59 days .027 Peak .678 Peak
60 days .027 .643
61 days .026 .643
62 days .026 .632
63 days .025 .62
64 days .026 .632
65 days .026 .62
66 days .026 .632
67 days .025 .586
|
New Table - Seasonality (2)DJI's movement after 12/07
Only Years after Election: 1945,1949,1953,1957,1961,1965,
1969,1973,1977,1981,1985,1989,1993,1997,2001,2005,2009,
2013 (18 years)...
Days 12/7 Pct.Gain Pct.of time DJI advanced.
-----------------------------------------------------------------
1 day -.002 .388
2 days -.002 .444
3 days -.004 .5
4 days -.003 .555
5 days -.001 .5
6 days -.005 .444
7 days -.003 .555
8 days -.003 .5
9 days -.005 nadir .388 nadir
10 days -.005 .555
11 days -.003 .444
12 days .001 .555
13 days .004 .666
14 days .005 .666
15 days .006 .611
16 days .01 .611
17 days .012 .777
18 days .013 Peak .722
19 days .011 .777
20 days .008 .722
21 days .005 .611
22 days .003 .666
23 days .004 .611
24 days .002 .611
25 days .003 .611
26 days .003 .611
27 days .002 .611
28 days .003 .611
29 days .001 .555
30 days -.002 .555
31 days -.004 .444
32 days -.004 trough .444 trough
33 days -.002 .444
34 days -.004 .5
35 days -.003 .5
36 days -.002 .5
37 days .002 .5
38 days .001 .5
39 days .002 .444
40 days .001 .444
41 days .002 .444
42 days .002 .5
43 days .003 .5
44 days .002 .444
45 days .004 .5
46 days .006 .5
47 days .007 .555
48 days .004 .5
49 days .005 .5
50 days .006 .611
51 days .005 .5
52 days .002 .555
53 days .004 .555
54 days .007 .555
55 days .007 .5
56 days .008 .611
57 days .012 .666
58 days .011 .611
59 days .012 .666
60 days .013 .611
61 days .014 .611
62 days .015 .611
63 days .017 .611
64 days .018 .611
65 days .018 .611
66 days .024 .666
67 days .022 .611
68 days .023 .722
69 days .024 .722
70 days .027 .722
71 days .026 .722
72 days .028 .666
73 days .029 .722
74 days .028 .722
75 days .027 .722
76 days .026 .777
77 days .024 .777
78 days .023 .666
79 days .024 .666
80 days .024 .666
81 days .024 .611
82 days .026 .666
83 days .029 .611
84 days .028 .666
85 days .028 .666
86 days .029 .611
87 days .033 .611
88 days .036 .666
89 days .039 .722
90 days .039 .666
|
Table 1
QuickSilver
Documentation
This is for short-term trading
leveraged ETFs.
It also provides a useful short-term outlook of these sectors ETF's
and the sectors they represewnt
Blue is Bullish
and
Red is Bearish.
1 Candle-Stick color is shortest-term. This
changes when close vis-a-vis opening changes.
So, in stocks or ETFs that advanced a long ways, traders should sell
when a higher
opening gives way to a decline that brings a drop below the previous
day's close.
2 5-dma AROC and Close-versus- pivot point is next
most short-term.
W = warning. Close is below PIVOT-Point.
3 Closing Power trend-direction vs. its 21-dma is next
most short-term.
4 IP21 is used to spot divergences and to estimate
underlying support.
5 > IP21 falling and below +.15 and its 21-dma is bearish in
an over-extended ETF, especially
when its Closing Power is falling and is below its 21-dma.
> IP21 below 07 with AROC below .07 is less likely to bring a rally
back up from 21-dma.
6 Note price trend-lines, support/resistance and price
patterns on charts.
QUICKSILVER on ETFS - 12/07/17
ETF      CLOSE   CHANGE     PIVOT-PT      5-dma AROC  CL-PWR    CANDLE  IP21   ITRS
---------------------------------------------------------------------------------------------
DIA       242.36    .74     W242.45       -9.9%       Bullish    BLUE   .071     0
---------------------------------------------------------------------------------------------
COMPQX    6812.84    36.46  W6847.59      -44.9%      ----       BLUE   .365    -.031
---------------------------------------------------------------------------------------------
SPY       264.07    .83     W264.46       -17.8%      Bullish    BLUE   .205    -.03
---------------------------------------------------------------------------------------------
QQQ       154.02    .52     W154.49       -36.8%      ----       BLUE   .192    -.02
---------------------------------------------------------------------------------------------
MDY       343.07    2.22    W345.02       -41.3%      ----       BLUE   .113    -.031
---------------------------------------------------------------------------------------------
IWM       151.27    1.05    W153.02       -78.3%      ----       BLUE   .118    -.06
---------------------------------------------------------------------------------------------
FAS       66.93    .73       66.15         78.4%      Bullish    BLUE   .027     .132
---------------------------------------------------------------------------------------------
RETL      34.16    .68       32.11         218%       Bullish    BLUE   .263     .069
---------------------------------------------------------------------------------------------
SOXL      135.85    3.86    W140.71       -362.4%     Bearish    BLUE   .019     .149
---------------------------------------------------------------------------------------------
TECL      108.33    1.95    W109.71       -139.4%     ----       BLUE   .191     .154
---------------------------------------------------------------------------------------------
IBB       104.05    1.47    W105.7        -57.1%      Bearish    BLUE   .105    -.14
---------------------------------------------------------------------------------------------
GLD
---------------------------------------------------------------------------------------------
OIL       6.03    .09        6.27         -81.5%      Bearish    ----  -.113     .016
---------------------------------------------------------------------------------------------
OIH       24.48    .09      W25.4         -22%        Bearish    BLUE  -.054    -.144
---------------------------------------------------------------------------------------------
GASL      20.8    .21       W24.3         -492.5%     Bearish    BLUE  -.163    -.216
---------------------------------------------------------------------------------------------
UGA       30.63    .56      W31.3         -97.3%      Bearish    BLUE  -.008    -.021
---------------------------------------------------------------------------------------------
UUP       24.4    .05        24.17         43.3%      Bearish    ----  -.018    -.081
---------------------------------------------------------------------------------------------
IEF       105.99   -.19      105.93        13.7%      ----       RED    .008    -.093
---------------------------------------------------------------------------------------------
CORN      16.81   -.02      W17.08        -53.1%      Bearish    ----  -.127    -.129
---------------------------------------------------------------------------------------------
WEAT      5.97   -.04       W6.17         -98.5%      Bearish    ----  -.083    -.2
---------------------------------------------------------------------------------------------
YINN      29.95   -.14      W32.13        -484.1%     Bearish    BLUE   .047    -.048
---------------------------------------------------------------------------------------------
RSX       21.51   -.01       21.46        -39.3%      Bearish    BLUE  -.221    -.11
---------------------------------------------------------------------------------------------
AAPL      169.32    .31     W171.05       -74.3%      Bearish    BLUE   .082     .012
---------------------------------------------------------------------------------------------
GOOG      1030.93    12.55   1010.17       47.1%      Bullish    BLUE   .041     .005
---------------------------------------------------------------------------------------------
MSFT      82.49   -.29      W84.26        -101.5%     ----       RED    .155     .031
---------------------------------------------------------------------------------------------
AMZN      1159.79    7.44   W1162.35      -73.5%      ----       BLUE   .069     .133
---------------------------------------------------------------------------------------------
FB        180.14    4.08     175.1         84.8%      Bullish    BLUE   .069    -.012
---------------------------------------------------------------------------------------------
NVDA     191.99    2.73     W197.68       -226.6%     Bearish    ----  -.016     .006
---------------------------------------------------------------------------------------------
BA        281.97    3.7      271.38        93.7%      Bullish    BLUE   .05     .018
---------------------------------------------------------------------------------------------
GS        248.56    2.61    W248.95        18.5%      ----       BLUE  -.057    -.027
|
Table 2
COMPARISONS OF BULLISH AND BEARISH NUMBERS
12/7
12/6 12/5 12/4 12/1
11/30 11/29 11/28 11/27 11/24 11/21
11/20 11/17 11/16
NEWHIGHS 159 91 107 340 197 536 500 582 209
439 615 363 244 273
NEWLOWS 50 65 53 37 16 31 57 265 59 31 62 50 229 150
------------------------------------------------------------------------------------------------------------
MAXCPs
90
50
42
92 105 266 262 320
101 166
406 339 295
321
MINCPs
73
141
135 152 93 80 110 93
94 42 63 52 40
74
-----------------------------------------------------------------------------------------------------------
TTTNHs
75 46
44
72 53 139
161 143 79 110 196 172 169
154
TTTNLs
109 219 248
402 286 162 230 124 144
66 186 184 79 78
------------------------------------------------------------------------------------------------------------
FASTUP
80
79
95
180 126
128 130 141 143 205 245 189 158
148
FASTDOWN
195 233 248 210 156 123 97 74 64 58 72 100 136
177 |
Table 3
  Count of Stocks and New Highs in Key Tiger Directories
                   Date = 171207
               No.          NHs            Pct.
-------------------------------------------------------------------
TRANSP         20            5             25 %
INFRA          11            2             18 %
BIGMIL         6             1             17 %
====================================================================
MILITARY       38            5             13 %
DOWJONES       30            3             10 %
RETAIL         53            5             9 %
DJI-13         13            1             8 %
SP-100         96            7             7 %
GAMING         28            2             7 %
SP500          486           34            7 %
NASD-100       88            6             7 %
GREEN          31            2             6 %
MORNSTAR       238           14            6 %
RUS-1000       839           50            6 %
FINANCE        92            5             5 %
SOLAR          21            1             5 %
BEVERAGE       20            1             5 %
HACKERS        25            1             4 %
COMPUTER       23            1             4 %
BONDFUND       111           4             4 %
CHEM           64            2             3 %
INDEXES        195           5             3 %
ELECTRON       179           6             3 %
SOFTWARE       66            2             3 %
BIOTECH        385           10            3 %
INSURANC       32            1             3 %
INDMATER       92            2             2 %
ETFS           65            1             2 %
SEMI           131           2             2 %
REIT           178           3             2 %
UTILITY        43            1             2 %
OILGAS         143           1             1 %
--------------------------------------------------
None: BIGBANKS REGBANKS  AUTO HOMEBLDG  NIFTY
CHINA  COAL   GOLD  EDU  PIPELINE  COMODITY
FOOD   HOSPITAL  JETS
|
Table 4
 RANKING OF KEY DIRECTORIES BASED PCT.OF STOCKS ABOVE 65-DMA
               12/7/17
Bullish = 31
Bearish = 14
---------------------------------------------------------------------------------------
Directory     Current       day-1         day-2         day-3         day-4         day-5
----------------------------------------------------------------------------------------
BIGBANKS       100%          1             1             1             1             1
DJI-13         1             1             1             1             1             1
INFRA          1             .909          .818          1             .909          1
TRANSP         .9            .85           .85           .95           .95           .95
JETS           .888          .888          .888          .888          .888          .888
BIGMIL         .833          .666          .5            .833          .833          1
DOWJONES       .833          .9            .933          .9            .9            .866
--------------------------------------------------------------------------------------------
REGBANKS       .787          .787          .818          .939          .939          .909
MORNSTAR       .773          .722          .764          .777          .798          .785
HOMEBLDG       .764          .764          .823          .823          .823          .823
SP-100         .76           .77           .77           .791          .843          .822
RETAIL         .754          .773          .754          .792          .735          .811
FINANCE        .75           .739          .804          .847          .858          .858
MILITARY       .736          .631          .631          .631          .605          .736
SP500          .722          .705          .726          .755          .771          .771
EDU            .714          .714          .714          .714          .714          .857
RUS-1000       .697          .675          .697          .733          .737          .741
UTILITY        .674          .697          .627          .72           .767          .72
INDEXES        .666          .646          .712          .748          .779          .733
NIFTY          .666          .633          .566          .566          .733          .766
INSURANC       .656          .687          .718          .75           .687          .656
BEVERAGE       .65           .65           .65           .65           .6            .6
HACKERS        .64           .64           .64           .64           .68           .72
NASD-100       .625          .59           .602          .602          .647          .625
SOFTWARE       .606          .606          .59           .59           .666          .636
AUTO           .6            .575          .65           .7            .7            .725
GREEN          .58           .483          .548          .58           .645          .709
COMPUTER       .565          .521          .565          .608          .695          .739
CHEM           .562          .531          .656          .703          .687          .75
GAMING         .535          .571          .642          .642          .75           .75
ELECTRON       .53           .486          .513          .536          .62           .653
-------------------------------------------------------------------------------------------
COAL           .5            .5            .5            .5            .375          .5
-------------------------------------------------------------------------------------------
INDMATER       .478          .456          .51           .554          .554          .608
SOLAR          .476          .333          .333          .333          .476          .571
REIT           .443          .387          .387          .522          .505          .505
SEMI           .442          .396          .427          .458          .595          .625
OILGAS         .44           .433          .538          .601          .657          .587
ETFS           .4            .246          .384          .446          .507          .553
BONDFUND       .378          .378          .198          .09           .108          .063
BIOTECH        .376          .361          .389          .41           .457          .477
HOSPITAL       .375          .375          .125          .375          .375          .375
COMODITY       .352          .338          .38           .464          .521          .535
CHINA          .343          .375          .437          .421          .484          .578
FOOD           .133          .133          .266          .466          .533          .6
GOLD           0             .02           .061          .122          .163          .142
PIPELINE       0             0             0             0             0             0
N=14
|
=========================================================================
=========================================================================
12/6/2017
The September
Buy B21 still operates. But yesterday's weakness
shifted the odds in favor of an additional 2%-3% decline in the
DJI.
Although, some leading NASDAQ techs like
ADBE and GOOG
rebounded
up from their rising 65-dma, I would say the shallow decline in
DJI, SPY,
OEX and NYSE will
continue, probably until December 17th when we
should get a seasonal Peerless Buy B13. I think
SOXL may be ready to
rally. It has reached its 65-dma and its steep Closing Power downtrend
has been slightly broken.
Note (1) the further weakness in the Hourly DJI's
DISI-OBV Line, (2) how many
more bearish MINCP stocks there are than bullish MAXCPs, (3) how the
DJI's Accumulation Index has matched the other Indexes and dropped
below its 21-dma and (4) how the DJI has now closed 133 points below its
5-day ma "pivot-point". In this fourth consideration, it matches all
the major ETFs
shown in Table 2, except FAS,
RETL and GLD.
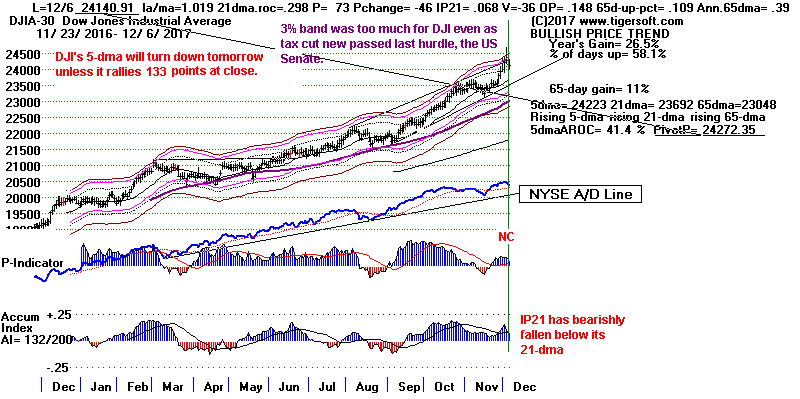
As I showed two nights ago, it is quite common for the DJI to slip a little
in
the two weeks before December 20th, at which point a Santa Claus
Buy B13 signal very frequently occurs and the DJI rallies back to new highs.
Since
1965, over the two weeks following December 6th the DJI has risen only
47.1% of the time. But big declines in on-going bull markets are very
rare in
Decembers. There was one in 2007, but the P-I and IP21 Indicators were
negative as the DJI tagged the upper band and a clear S9/S12 was given.
As I mentioned last night, the other case was in 1968. A breaking of the
NYSE
A/D Line long uptrend next would add to the several technical parallels
between
now and then. So, that is worrisome. But big declines in early
December,
especially in the year after the Presidential Election just do not seem to
occur. The
exception was in 1941, but even in this case there was a decent Santa Claus
rally at the end of the year back up to the upper band.
So far, the SP-500 pullback from the top of its price channel resistance
looks quite limited and in keeping with the profit-taking that might be
expect from those who automatically sell on expected bullish news, in this
case the tax-cut legislation passing the Senate.
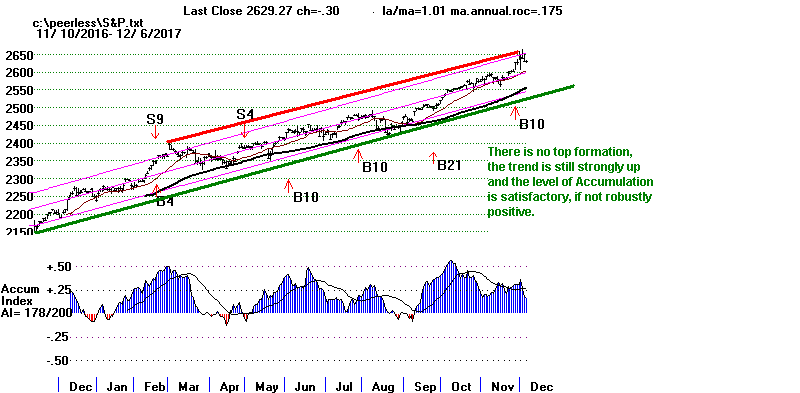
It's bullish that the
NASDAQ held up today.
SOXL
should probably be bought.
See its chart below. Now we need to see the
Biotechs abort their menacing
head and shoulders pattern. Solid rallies in the
Housing and Infrastructure leaders
would be more impressive than jumps in beaten down stocks like
CMG or
sectors like the Retailers.
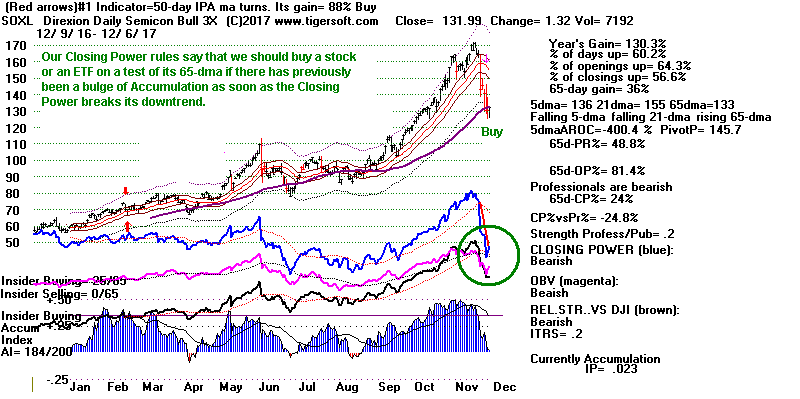
Charts 12/6/2017
PEERLESS
DJI, Signals, Indicators Daily DJI
Volume 10-DayUp/Down Vol
DJI-AROC
Hourly DJIA
A/D Line for All Stocks
NASDAQ
S&P
OEX
NYSE
COMPQX
DJI-15 DJI-20
DJI-30
DIA
SPY
QQQ MDY
IWM TNA
CrudeOil
FAS
GLD
BBH
IBB
JETS
JNUG
KOL
NUGT
OIH
OIL
RSX
RETL
SDS
SLV
SOXL
TECL
TMF
TNA UGA
(gasoline)
XIV YINN
Commodities:
JJC, NIB,
CHOC
CORN,
WEAT
UUP
(Dollar)
AAPL ADBE
ALXN AMAT
AMGN AMD
AMZN
BA BABA BAC
BIDU
CAT
CVX
FB
GOOG
GS
HD
IBM
JPM M
(Macy's)
MSFT
NFLX
NVDA
QCOM
TSLA TXN
XOM WMT
ANDV (refinery),
CMG (Chipotle),
LRCX, SWKS,
TOWN New -
SPPI
(small Biotech)
12/6/2017
Bullish MAXCPs Bearish
MINCPs |
Table 1
QuickSilver
Documentation
This is for short-term trading
leveraged ETFs.
It also provides a useful short-term outlook of these sectors ETF's
and the sectors they represewnt
Blue is Bullish
and
Red is Bearish.
1 Candle-Stick color is shortest-term. This
changes when close vis-a-vis opening changes.
So, in stocks or ETFs that advanced a long ways, traders should sell
when a higher
opening gives way to a decline that brings a drop below the previous
day's close.
2 5-dma AROC and Close-versus- pivot point is next
most short-term.
W = warning. Close is below PIVOT-Point.
3 Closing Power trend-direction vs. its 21-dma is next
most short-term.
4 IP21 is used to spot divergences and to estimate
underlying support.
5 > IP21 falling and below +.15 and its 21-dma is bearish in
an over-extended ETF, especially
when its Closing Power is falling and is below its 21-dma.
> IP21 below 07 with AROC below .07 is less likely to bring a rally
back up from 21-dma.
6 Note price trend-lines, support/resistance and price
patterns on charts.
QUICKSILVER on ETFS - 12/06/17
ETF      CLOSE   CHANGE     PIVOT-PT   5-dma AROC   CL-PWR   CANDLE   IP21    ITRS
---------------------------------------------------------------------------------------------
DIA       241.62   -.39     W242.84        45.5%     ----      RED    .063    ----
---------------------------------------------------------------------------------------------
COMPQX    6776.38    14.17  W6873.97      -35.2%     ----      BLUE   .332    -.023
---------------------------------------------------------------------------------------------
SPY       263.24    .05     W265.01        10%       ----      BLUE   .179    -.028
---------------------------------------------------------------------------------------------
QQQ       153.5    .69      W155.15       -11.7%     ----      BLUE   .199    -.013
---------------------------------------------------------------------------------------------
MDY       340.85   -1.39    W345.91       -44.7%     ----      RED    .075    -.027
---------------------------------------------------------------------------------------------
IWM       150.22   -.71     W153.65       -103.2%   Bearish    RED    .071    -.046
---------------------------------------------------------------------------------------------
FAS       66.2   -.12        65.89         110.5%    ----      BLUE  -.029     .15
---------------------------------------------------------------------------------------------
RETL      33.48   -.02       32.71         52.7%    Bullish    BLUE   .222     .082
---------------------------------------------------------------------------------------------
SOXL      131.99    1.32    W145.7        -400.4%   Bearish    BLUE   .024     .2
---------------------------------------------------------------------------------------------
TECL      106.38    1.97    W111.32       -101.7%   Bearish    BLUE   .194     .169
---------------------------------------------------------------------------------------------
IBB       102.58   -.75     W105.24       -56%      Bearish    RED    .063    -.147
--------------------------------------------------------------------------------------------
GLD
---------------------------------------------------------------------------------------------
OIL       5.94   -.24       W6.13         -170%     Bearish    RED   -.112     .007
---------------------------------------------------------------------------------------------
OIH       24.39   -.6       W24.59         54.2%    Bearish    RED   -.087    -.141
---------------------------------------------------------------------------------------------
GASL      20.59   -1.96     W23.04        -233.1%   Bearish    RED   -.17    -.201
---------------------------------------------------------------------------------------------
UGA       30.07   -.88      W31.23        -194.8%   Bearish    RED    .014    -.06
---------------------------------------------------------------------------------------------
UUP       24.35    .06       24.19         20.6%    Bearish    ----  -.058    -.077
---------------------------------------------------------------------------------------------
IEF       106.18    .22      105.7         7.1%     Bullish    ----   .028    -.095
---------------------------------------------------------------------------------------------
CORN      16.83   -.08      W16.99        -26.5%    Bearish    RED   -.122    -.122
---------------------------------------------------------------------------------------------
WEAT      6.01   -.09       W6.09         -73.6%    Bearish    RED   -.08    -.183
---------------------------------------------------------------------------------------------
YINN      30.09   -2.09     W33.04        -574%     Bearish    BLUE   .008    -.032
---------------------------------------------------------------------------------------------
RSX       21.52   -.19       21.68        -64.6%    Bearish    RED   -.274    -.109
---------------------------------------------------------------------------------------------
AAPL      169.01   -.63     W171.85       -13.8%     ----      BLUE   .124     .019
---------------------------------------------------------------------------------------------
GOOG      1018.38    13.23  W1021.41      -16.2%    Bullish    BLUE   .045     .016
---------------------------------------------------------------------------------------------
MSFT      82.78    1.19     W84.17        -33.8%    Bearish    BLUE   .134     .045
---------------------------------------------------------------------------------------------
AMZN      1152.35    10.78  W1176.75      -38.6%     ----      BLUE   .051     .143
---------------------------------------------------------------------------------------------
FB        176.06    3.23    W177.18        26.7%     ----      BLUE   .033    -.013
---------------------------------------------------------------------------------------------
NVDA     189.26    1.52     W200.71       -184.7%   Bearish    BLUE  -.007     .016
---------------------------------------------------------------------------------------------
BA        278.27    2.73     276.8         163.6%   Bullish    BLUE   .053     .012
---------------------------------------------------------------------------------------------
GS        245.95   -2.38    W247.64        92.8%    Bearish    RED   -.116    -.015
|
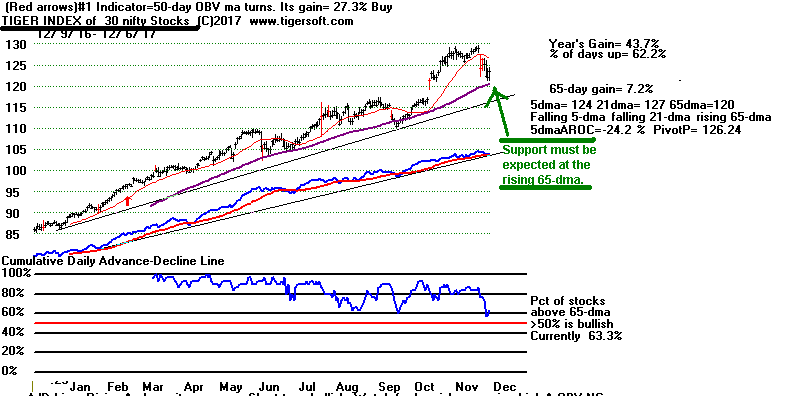
Components of Tiger's Nifty-30 Index.
AAPL ADBE ADP ADSK ALGN AMAT AMT AMZN ATVI AVGO CHDN CPA CTAS
EQIX EXPD FB FISV GOOG HD ISRG LMT MSFT MU NVDA NVR PCLN PLUS TSLA
VRTX
|
Table 2
COMPARISONS OF BULLISH AND BEARISH NUMBERS
12/6
12/5 12/4 12/1 11/30 11/29
11/28 11/27 11/24 11/21 11/20 11/17
11/16 11/15
NEWHIGHS
91 107 340 197 536 500 582 209
439 615 363 244 273 71
NEWLOWS 65 53 37 16 31 57 265 59 31 62 50 229 150
111
-------------------------------------------------------------------------------------------------------------
MAXCPs
50
42
92 105 266 262 320
101 166
406 339 295
321 154
MINCPs
141
135 152 93 80 110 93
94 42 63 52 40
74
105
--------------------------------------------------------------------------------------------------------------
TTTNHs
46
44
72 53 139
161 143 79 110 196 172 169
154
89
TTTNLs
219 248
402 286 162 230 124 144
66 186 184 79 78 211
------------------------------------------------------------------------------------------------------------
FASTUP
79
95
180 126
128 130 141 143 205 245 189 158
148 121
FASTDOWN
233 248 210 156 123 97 74 64 58 72 100 136
177 253
|
Table 3Count of Stocks and New Highs in Key Tiger Directories
Date = 171206
No. NHs Pct.
-------------------------------------------------------------------
BIGMIL 6 1 17 %
DJI-13 13 2 15 %
BEVERAGE 20 2 10 %
INSURANC 32 3 9 %
MILITARY 38 3 8 %
DOWJONES 30 2 7 %
NASD-100 88 4 5 %
TRANSP 20 1 5 %
SOLAR 21 1 5 %
SP-100 96 4 4 %
GAMING 28 1 4 %
HACKERS 25 1 4 %
SP500 486 18 4 %
COMPUTER 23 1 4 %
RETAIL 53 2 4 %
GREEN 31 1 3 %
MORNSTAR 238 6 3 %
RUS-1000 839 26 3 %
BONDFUND 111 3 3 %
FINANCE 92 2 2 %
INDEXES 195 3 2 %
UTILITY 43 1 2 %
ELECTRON 179 2 1 %
SEMI 131 1 1 %
BIOTECH 385 4 1 %
REIT 178 1 1 %
---------------------------------------------------
None - BIGBANKS BIGBANKS AUTO HOMEBLDG CHEM
NIFTY INDMATER ETFS OILGAS SOFTWARE INFRA
CHINA COAL GOLD EDU PIPELINE COMODITY
FOOD HOSPITAL JETS
|
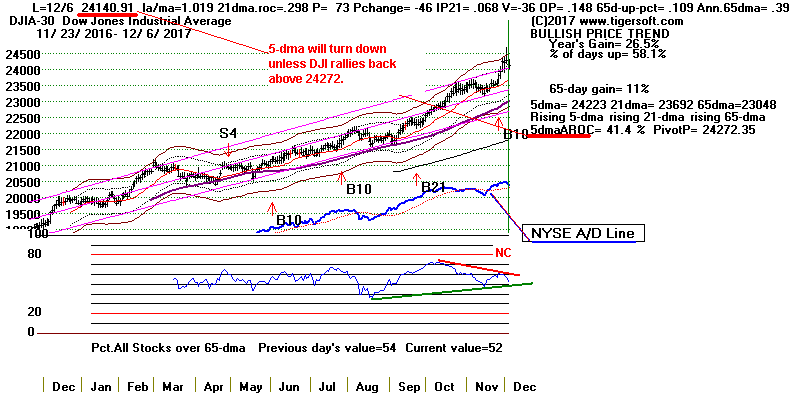
|
Table 4
 RANKING OF KEY DIRECTORIES BASED PCT.OF STOCKS ABOVE 65-DMA
               12/6/17
 Bullish = 29
 Bearish = 17
---------------------------------------------------------------------------------------
Directory     Current       day-1         day-2         day-3         day-4         day-5
----------------------------------------------------------------------------------------
BIGBANKS       1             1             1             1             1             1
DJI-13         1             1             1             1             1             1
INFRA          .909          .818          1             .909          1             1
DOWJONES       .9            .933          .9            .9            .866          .866
JETS           .888          .888          .888          .888          .888          .888
TRANSP         .85           .85           .95           .95           .95           .9
N=6
---------------------------------------------------------------------------------------------
REGBANKS       .787          .818          .939          .939          .909          1
RETAIL         .773          .754          .792          .735          .811          .849
SP-100         .77           .77           .791          .843          .822          .77
HOMEBLDG       .764          .823          .823          .823          .823          .823
FINANCE        .739          .804          .847          .858          .858          .858
MORNSTAR       .722          .764          .777          .798          .785          .789
EDU            .714          .714          .714          .714          .857          .857
SP500          .705          .726          .755          .771          .771          .746
UTILITY        .697          .627          .72           .767          .72           .767
INSURANC       .687          .718          .75           .687          .656          .75
RUS-1000       .674          .696          .731          .736          .742          .725
BIGMIL         .666          .5            .833          .833          1             .833
BEVERAGE       .65           .65           .65           .6            .6            .5
INDEXES        .646          .712          .748          .779          .743          .743
HACKERS        .64           .64           .64           .68           .72           .72
NIFTY          .633          .566          .566          .733          .766          .766
MILITARY       .631          .631          .631          .605          .736          .631
SOFTWARE       .606          .59           .59           .666          .636          .651
NASD-100       .59           .602          .602          .647          .625          .636
AUTO           .575          .65           .7            .7            .725          .8
GAMING         .571          .642          .642          .75           .75           .75
CHEM           .531          .656          .703          .687          .765          .796
COMPUTER       .521          .565          .608          .695          .739          .739
N=23
============================================================================================
ELECTRON       .486          .513          .536          .62           .653          .653
GREEN          .483          .548          .58           .645          .709          .677
INDMATER       .445          .5            .543          .543          .608          .554
OILGAS         .433          .538          .601          .657          .601          .475
SEMI           .396          .427          .458          .595          .625          .61
REIT           .387          .387          .522          .505          .505          .522
BONDFUND       .378          .198          .09           .108          .063          .063
CHINA          .375          .437          .421          .484          .578          .578
COAL           .375          .375          .375          .25           .375          .25
HOSPITAL       .375          .125          .375          .375          .375          .375
BIOTECH        .361          .389          .41           .457          .48           .446
COMODITY       .338          .38           .464          .521          .535          .549
SOLAR          .333          .333          .333          .476          .571          .571
ETFS           .246          .384          .446          .507          .553          .584
FOOD           .133          .266          .466          .533          .6            .6
GOLD           .02           .061          .122          .163          .163          .122
PIPELINE       0             0             0             0             0             0
N=17
|
=======================================================================
=======================================================================
12/5/2017
The September
Buy B21 still operates. But today's decline tilts the
scales
downward for a 2%-3% more decline in the DJI. From the research I did
last night,
we saw that about half the time, there is a minor early (first half)
December pullback
even when Peerless gives no Sell signal after the DJI runs up
above
the 2.3% band
in an on-going bull market. What shifts the
short-term trend to
DOWN today is:
(1), the Hourly DJI's DISI-Line breaking its
uptrend,
(2), that several indexes' (NASDAQ,
SP-500, NYSE and
OEX)
Tiger Accumulation Index have dropped below its 21-day ma,
(3), the number of MINCPs was three times higher than the number
of MAXCPs and
(4) the weak breadth and volume today.
The DJI's internals do not look bearish, but they are not as positive as one
would expect
to see in a really strong December. (Compare the key values with those
at other
taggings of the upper band in December in the table I showed last night and
finished
today.) The good news is that the only case when a December's lower
band tagging
failed in the year after a Presidential Election to produce a quick rally
was in 1941,
after the attack on Pearl Harbor. Let's hope there is no outbreak of war
with North Korea.
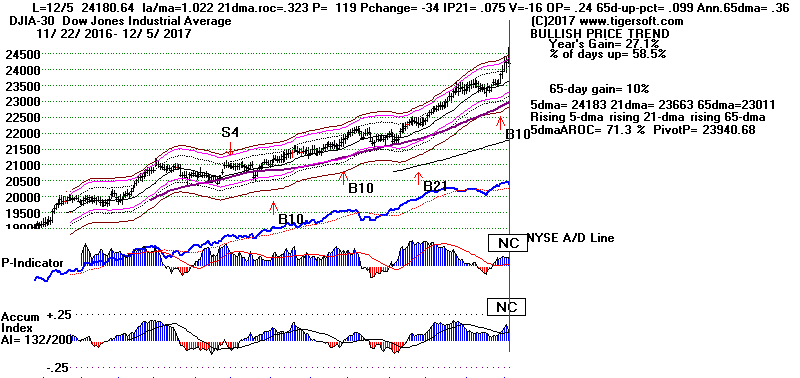

So, without a Peerless Sell, all we can
expect is a shallow, early December decline.
But it should be noted, that we did not miss a Peerless Sell S1 by much
today.
Traders should respect the direction of the 5-day ma and Closing Power
trends.
See Table 1 below and use the 5-dma pivot-points if you are a trader.
The December 1968 Top Shows Some Scary Parallels
Since 1929, only one bull market may be said to have ended in December.
It occurred in
December 1968. Prior to the 1968 top, there had been a very speculative
bull market,
especially
in smaller, less well-know companies. Interest rates had been kept
mostly flat
during
the 1969 Presidential Election campaign. With the Election over, the
FED did not
have
to worry about appearing to play favorites and started raising rates
aggressively. The
early December Peerless Sell S1 was the result of the DJI's Slow
Stochastic-20
dropping below 80 in early December in a Presidential Election Year when
internals
were not very robust. The internals that mattered here
were IP21 and OBVPct.
The IP21 had to be below +.11 and the ObvPct had to be below .232.
Today our
DJI's Pct-D Stochastic-20 also dropped below 20. But we got no
Peerless Sell signal
today for two reasons: first the OBVPct now is slightly too high, at .240
and, second,
this Peerless S1 is programmed only to occur in Presidential Election Years.
So, the data
tonight did not give a Sell S1. But the parallels are certainly there.
Besides the OBVPct,
the 21-dma AROC and IP21 are almost the same. Adjusted for the number
of shares
traded, the P-Indicator is lower now than in 1968. The big difference
is that this is
not a Presidential Election Year with all the uncertainties and changes that
this can bring.
So this is a warning. Now we should, I think, watch to see if our
market next shows the
same three subsequent bearish developments of December 1968, namely that the
DJI's Accumulation Index dropped below its 21-dma, the NYSE A/D Line broke
its
uptrend and, most important, there was no Santa Claus rally.
1968 December Top's (below) Development shows us
what to be wary of next. This 1968 top led to a two-year
bear market. Unlike in our case, smaller stocks
were the leaders in the 1967-1968 bull market.
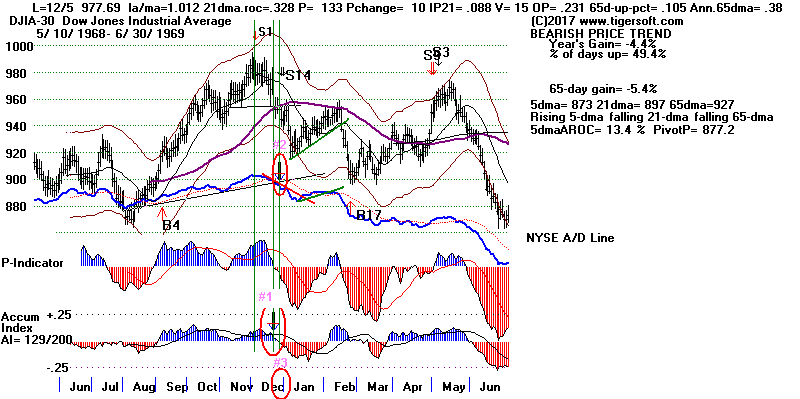
Trouble Is Brewing among The Tech Stocks
I have said that we should expect to see a number of bearish head/shoulders
patterns at the next major top. We don't see them in the DJIA-30
stocks,
but we do see them in a number of tech stocks. In addition, several
bearish
flat-top breakout failures have recently occurred. These, too are warnings.
H/S patterns:
ADBE - now testing its rising 65-dma
ATVI - now below its falling 65-dma
BIDU - now below a rising 65-dma.
NFLX - below its flat 65-dma
NVDA - today broke below 65-dma.
TSLA - below its falling 65-dma
XLNX - below its falling 65-dma.
False flat-top breakout
AMAT - broke today below rising 65-dma.
AMZN
LRCX
QCOM
Testing falling 65-dma
AMGN
GOOG - testing 50-dma
Broke 65-dma today
LMT
I suspect that the NASDAQ and
QQQ will need to successfully retest their
rising
65-dma before they and the general market can again move to new highs.
Typically,
Peerless gives a Santa Claus Buy signal soon after December 16th. That
seems like a
reasonable scenario here.
Charts 12/5/2017
PEERLESS
DJI, Signals, Indicators Daily DJI
Volume 10-DayUp/Down Vol
DJI-AROC
Hourly DJIA
A/D Line for All Stocks
NASDAQ
S&P
OEX
NYSE
COMPQX
DJI-15 DJI-20
DJI-30
DIA
SPY
QQQ MDY
IWM TNA
CrudeOil
FAS
GLD
BBH
IBB
JETS
JNUG
KOL
NUGT
OIH
OIL
RSX
RETL
SDS
SLV
SOXL
TECL
TMF
TNA UGA
(gasoline)
XIV YINN
Commodities:
JJC, NIB,
CHOC
CORN,
WEAT
UUP
(Dollar)
AAPL ADBE
ALXN AMAT
AMGN AMD
AMZN
BA BABA BAC
BIDU
CAT
CVX
FB
GOOG
GS
HD
IBM
JPM M
(Macy's)
MSFT
NFLX
NVDA
QCOM
TSLA TXN
XOM WMT
ANDV (refinery),
CMG (Chipotle),
LRCX, SWKS,
TOWN New -
SPPI
(small Biotech)
12/5/2017
Bullish MAXCPs Bearish
MINCPs |
Table 1
QuickSilver
Documentation
This is for short-term trading
leveraged ETFs.
It also provides a useful short-term outlook of these sectors ETF's
and the sectors they represewnt
Blue is Bullish
and
Red is Bearish.
1 Candle-Stick color is shortest-term. This
changes when close vis-a-vis opening changes.
So, in stocks or ETFs that advanced a long ways, traders should sell
when a higher
opening gives way to a decline that brings a drop below the previous
day's close.
2 5-dma AROC and Close-versus- pivot point is next
most short-term.
W = warning. Close is below PIVOT-Point.
3 Closing Power trend-direction vs. its 21-dma is next
most short-term.
4 IP21 is used to spot divergences and to estimate
underlying support.
5 > IP21 falling and below +.15 and its 21-dma is bearish in
an over-extended ETF, especially
when its Closing Power is falling and is below its 21-dma.
> IP21 below 07 with AROC below .07 is less likely to bring a rally
back up from 21-dma.
6 Note price trend-lines, support/resistance and price
patterns on charts.
QUICKSILVER on ETFS - 12/5/17
ETF      CLOSE   CHANGE     PIVOT-PT      5-dma AROC   CL-PWR   CANDLE   IP21    ITRS
---------------------------------------------------------------------------------------------
DIA       242.01   -1.1      239.42        76.1%        ----      RED    .119    ---
---------------------------------------------------------------------------------------------
COMPQX    6762.21   -13.16  W6824.39      -109.7%       ----      BLUE   .339    -.025
---------------------------------------------------------------------------------------------
SPY       263.19   -.95      262.71        6.1%         ----      RED    .2     -.029
---------------------------------------------------------------------------------------------
QQQ       152.81    .1      W153.86       -122.3%       ----      BLUE   .205    -.016
---------------------------------------------------------------------------------------------
MDY       342.24   -2.68    W343.93       -1.9%         ----      RED    .123    -.023
---------------------------------------------------------------------------------------------
IWM       150.93   -1.52    W153.37       -63%          Bearish   RED    .087    -.042
---------------------------------------------------------------------------------------------
FAS       66.32   -.91       64.74         241.5%       ----      RED   -.01      .15
---------------------------------------------------------------------------------------------
RETL      33.5   -.97        33.13         408.9%       Bullish   RED    .222     .111
---------------------------------------------------------------------------------------------
SOXL      130.67    .17     W143.05       -1174%        Bearish   BLUE   .028     .183
---------------------------------------------------------------------------------------------
TECL      104.41    .07     W108.57       -532.7%       Bearish   BLUE   .199     .155
---------------------------------------------------------------------------------------------
IBB       103.33   -.7      W103.75       -20.6%        Bearish   RED    .027    -.151
---------------------------------------------------------------------------------------------

---------------------------------------------------------------------------------------------
OIL       6.18    .02        6.15         -32.3%        ----      ----   .042     .038
---------------------------------------------------------------------------------------------
OIH       24.99   -.43       24.12         196.3%       ----      RED    .018    -.117
---------------------------------------------------------------------------------------------
GASL      22.55   -.67       21.66         233%         Bearish    RED    .064    -.101
---------------------------------------------------------------------------------------------
UGA       30.95    .39      W31.28        -136.1%       Bearish   BLUE   .104    -.048
---------------------------------------------------------------------------------------------
UUP       24.29    .04       24.25         6.2%         Bearish   ----  -.095    -.077
---------------------------------------------------------------------------------------------
IEF       105.96    .08     W106.03       -19.3%        Bullish   BLUE   .066    -.099
---------------------------------------------------------------------------------------------
CORN      16.91    .03      W16.92         56.2%        Bearish   ----  -.146    -.121
---------------------------------------------------------------------------------------------
WEAT      6.1    .01         6.1           57.4%        Bearish   ----  -.028    -.167
---------------------------------------------------------------------------------------------
YINN      32.18    .04      W33.84        -561.1%       Bearish   ----  -.049     .068
---------------------------------------------------------------------------------------------
RSX       21.71   -.01      W21.8         -133.1%       Bearish   ----  -.176    -.11
---------------------------------------------------------------------------------------------
AAPL      169.64   -.16      169.48       -100.3%       ----      BLUE   .138     .041
---------------------------------------------------------------------------------------------
GOOG      1005.15    6.47   W1021.66      -207.2%       ----      BLUE  -.011     .005
---------------------------------------------------------------------------------------------
MSFT      81.59    .51      W83.34        -196.9%       Bearish   BLUE   .115     .028
---------------------------------------------------------------------------------------------
AMZN      1141.57    7.62   W1161.27      -223.2%       ----      BLUE   .046     .129
---------------------------------------------------------------------------------------------
FB        172.83    1.36    W175.13       -272%         Bearish   BLUE   .019    -.025
---------------------------------------------------------------------------------------------
NVDA     187.74    1.08     W196.42       -578.8%       Bearish   BLUE  -.007     .012
---------------------------------------------------------------------------------------------
BA        275.54   -2.43     269.3         138.4%       ----      RED    .02     -.003
---------------------------------------------------------------------------------------------
GS        248.33   -2.32     241.36        181.6%       Bearish   RED   -.091    -.008
|
Table 2
COMPARISONS OF BULLISH AND BEARISH NUMBERS
12/5
12/4 12/1 11/30 11/29 11/28 11/27
11/24 11/21 11/20 11/17 11/16
11/15 11/14
NEWHIGHS 107 340 197 536 500 582 209
439 615 363 244 273 71
198
NEWLOWS 53 37 16 31 57 265 59 31 62 50 229 150
111 150
-------------------------------------------------------------------------------------------------------------
MAXCPs
42
92 105 266 262 320
101 166
406 339 295
321 154 276
MINCPs
135 152 93 80 110
93
94 42 63 52 40
74
105 192
--------------------------------------------------------------------------------------------------------------
TTTNHs
44
72 53 139
161 143 79 110 196 172 169
154
89 125
TTTNLs
248
402 286 162 230 124 144
66 186 184 79 78 211
259
------------------------------------------------------------------------------------------------------------
FASTUP
95
180 126
128 130 141 143 205 245 189 158
148 121 146
FASTDOWN
248 210 156 123 97 74 64 58 72 100 136
177 253
249 |
Table 3
Count of Stocks and New Highs in Key Tiger Directories
Date = 171205
               No            NHs           Pct
-------------------------------------------------------------------
GAMING         28            4             14 %
DOWJONES       30            3             10 %
DJI-13         13            1             8 %
INSURANC       32            2             6 %
CHEM           64            3             5 %
MILITARY       38            2             5 %
HACKERS        25            1             4 %
SP500          485           17            4 %
COMPUTER       23            1             4 %
GREEN          31            1             3 %
FINANCE        92            3             3 %
SP-100         96            3             3 %
INDMATER       92            3             3 %
ETFS           65            2             3 %
OILGAS         143           4             3 %
RUS-1000       838           28            3 %
INDEXES        195           3             2 %
SOFTWARE       66            1             2 %
BIOTECH        385           6             2 %
NASD-100       88            2             2 %
RETAIL         53            1             2 %
ELECTRON       179           2             1 %
MORNSTAR       238           3             1 %
SEMI           131           1             1 %
BONDFUND       111           1             1 %
------------------------------------------------
None BIGBANKS BIGMIL REGBANKS   AUTO
HOMEBLDG  NIFTY   INFRA  CHINA  TRANSP   SOLAR
COAL   GOLD  REIT  EDU  UTILITY  PIPELINE  COMODITY
BEVERAGE  FOOD  HOSPITAL JETS
|
 RANKING OF KEY DIRECTORIES BASED PCT.OF STOCKS ABOVE 65-DMA
              12/5/17
 Bullish = 31
 Bearish = 13
---------------------------------------------------------------------------------------
Directory     Current       day-1         day-2         day-3         day-4         day-5
----------------------------------------------------------------------------------------
BIGBANKS       1             1             1             1             1             1
DJI-13         1             1             1             1             1             1
DOWJONES       .933          .9            .9            .866          .866          .866
JETS           .888          .888          .888          .888          .888          .777
TRANSP         .85           .95           .95           .95           .9            .65
HOMEBLDG       .823          .823          .823          .823          .823          .823
INFRA          .818          1             .909          1             1             .909
REGBANKS       .818          .939          .939          .909          1             .878
FINANCE        .804          .847          .858          .858          .858          .836
SP-100         .77           .791          .843          .822          .77           .718
MORNSTAR       .764          .777          .798          .785          .794          .798
RETAIL         .754          .792          .735          .811          .849          .698
SP500          .725          .754          .771          .773          .75           .717
INSURANC       .718          .75           .687          .656          .75           .687
EDU            .714          .714          .714          .857          .857          1
INDEXES        .712          .748          .779          .743          .753          .671
RUS-1000       .695          .731          .736          .743          .732          .705
CHEM           .656          .703          .687          .765          .796          .828
AUTO           .65           .7            .7            .725          .8            .725
BEVERAGE       .65           .65           .6            .6            .5            .45
GAMING         .642          .642          .75           .75           .75           .75
HACKERS        .64           .64           .68           .72           .72           .76
MILITARY       .631          .631          .605          .736          .631          .736
UTILITY        .627          .72           .767          .72           .767          .813
NASD-100       .602          .602          .647          .625          .636          .67
SOFTWARE       .59           .59           .666          .636          .651          .742
NIFTY          .566          .566          .733          .766          .766          .866
COMPUTER       .565          .608          .695          .739          .739          .782
GREEN          .548          .58           .645          .709          .677          .709
OILGAS         .538          .601          .657          .601          .503          .517
ELECTRON       .513          .536          .62           .653          .659          .737
N=31
===========================================================================================
BIGMIL         .5            .833          .833          1             .833          .833
INDMATER       .5            .543          .543          .608          .565          .63
============================================================================================
CHINA          .437          .421          .484          .578          .578          .656
SEMI           .427          .458          .595          .625          .618          .725
BIOTECH        .389          .41           .457          .48           .446          .457
REIT           .387          .522          .505          .505          .522          .505
ETFS           .384          .446          .507          .553          .6            .784
COMODITY       .38           .464          .521          .535          .549          .521
COAL           .375          .375          .25           .375          .25           .5
SOLAR          .333          .333          .476          .571          .571          .619
FOOD           .266          .466          .533          .6            .6            .533
BONDFUND       .198          .09           .108          .063          .063          .135
HOSPITAL       .125          .375          .375          .375          .375          .125
GOLD           .061          .122          .163          .163          .122          .265
PIPELINE       0             0             0             0             0             .142
N=13
|
=========================================================================
12/4/2017 The Peerless signal remains the
very bullish
September Buy B21 but clearly|
something is wrong with tech stocks and the previous leaders, the
semi-conductors.
Perhaps, the tax bill is seen is penalizing tech stocks in California.
I've warned
that their 5-dma had turned down, that they were showing bearish red
candle-sticks
and falling Closing Powers. The size of their decline may start to
worry traders
who are play
DIA and
SPY
if it continues. Still, Peerless has given no Sell.
Declines in
December are usually shallow. And perhaps, the tech stocks will
recover now that they
are nearer their rising 50 and 65 day moving averages.
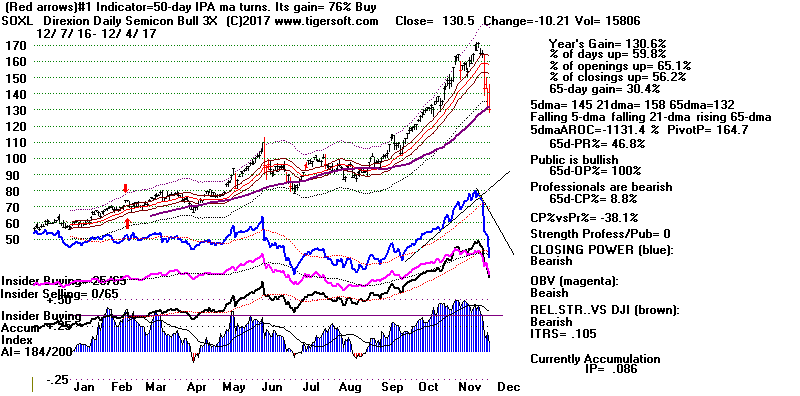
Peerless has not given a Sell on the
DJI, but
that does not mean there can
not be a pullback in tech stocks. In fact, each Buy B10 this year has
coincided
with the start of a pullback in the NASDAQ.
Even the DJI could pullback,
despite our not getting a Peerless Sell, but that is rare in a rising
market.
History does show a few DJI shallow retreats in the first part of December.
They usually end when the in two weeks when the Santa Claus Buy signal kicks
in after December 16th.
We will need more evidence that the DJI will fall back enough to make it
worthwhile to sell DIA and SPY. Remember that the DJI is ruled by its
highest priced 13 stocks. Those are still quite strong.
See the Tiger Index
of them below.
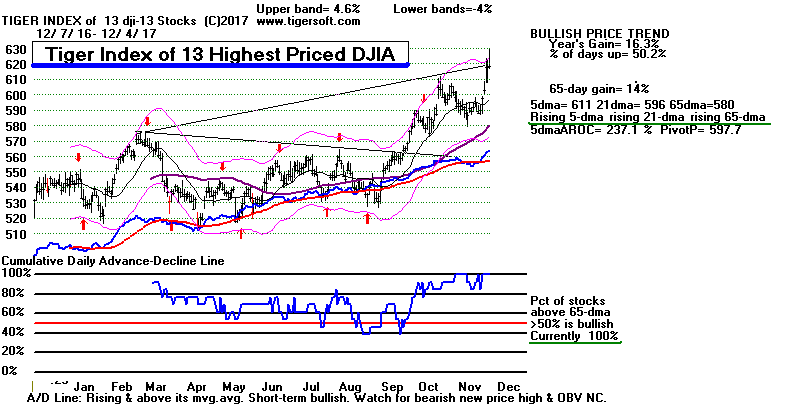
For the first time in more than a month the number of MINCPs
was greater than the number of MAXCPs. (See table 2 below.)
Professionals are taking profits. But not yet in the DJIA. These
are the blue chips. The very wealthy prefer their safety. DIA's
Closing Power is still rising unlike that of
COMPQX, TECL,
SOXL,
and QQQ.

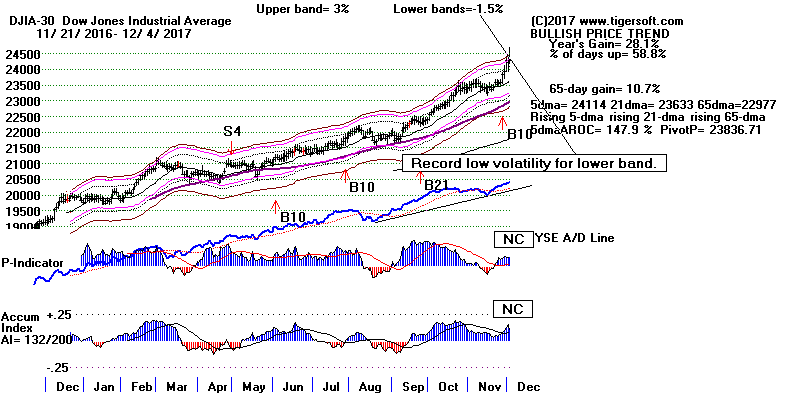
What are the Odds for A Pullback?
All the DJI's key values have now turned positive. This helps prevent
but does not preclude a shallow retreat.
If we only look at the bull market cases where the DJI reached the 2.5% band
and showed reasonably strong internals, we still find declines. Given
the
DJI's positive key values now, below are the closest early December
parallels
that I can find from 1929-1972. The rest will be shown tomorrow night.
Without
a Peerless Sell, a big decline in the DJI and SP-500 are very unlikely.
When there was no Peerless Sell in the first half
of December and the DJI closed
more than 2.2% over the 21-day ma, there were an equal number of shallow
pullbacks and a continued rally. See below.
(added 12/5/2017)
Current:
12/4/2017 1.028 .390 +152 +3
+.102 +2 +.336 +.106
+.39
LA/MA AROC
P-I P-ch IP21
V-I OPct 65dpctCh
65-dma AROC
--------------------------------------------------------------------------------------------------
--------------------------------------------------------------------------------------------------
12/5/1935 1.033 1.183 +105 +24 +.194
+85 +.623 +.103 + .39
LA/MA AROC
P-I P-ch IP21
V-I OPct 65dpctCh
65-dma AROC
No Sell here. DJI fell from 103.4 to 99.6
on 12/20
-------------------------------------------------------------------------------------
12/17/1942 1.029 .434 +23 +10
+.193 +2 +.509 +.119 + .42
LA/MA AROC
P-I P-ch IP21
V-I OPct 65dpctCh
65-dma AROC
No Sell here. DJI kept rallying.
-------------------------------------------------------------------------------------------
12/15/1944 1.026 +.598 +149 +18 +.213
+154 +.051 +.19
LA/MA AROC
P-I P-ch IP21
V-I OPct 65dpctCh
65-dma AROC
No Sell here. DJI kept rallying.
--------------------------------------------------------------------------------------------
12/10/1945 1.022 +.224 +106 -18 +.079
+95 +.068 +.124 +.45
LA/MA AROC
P-I P-ch IP21
V-I OPct 65dpctCh
65-dma AROC
No Sell here. DJI made a shallow retreat,
from 195.6 to 189.4.
------------------------------------------------------------------------------------------
12/14/1949 1.027 +.692 +118 +30 +.272
+107 +.412 +.36
LA/MA AROC
P-I P-ch IP21
V-I OPct 65dpctCh
65-dma AROC
No Sell here. DJI kept rallying.
------------------------------------------------------------------------------------------
12/7/1954 1.033 +.874 +180 +2
+.121 +286 +.632 +.154 +.55
LA/MA AROC
P-I P-ch IP21
V-I OPct 65dpctCh
65-dma AROC
No Sell here. DJI kept rallying.
------------------------------------------------------------------------------------------
12/5/1962 1.031 +.930 +277 -15
+.171 +776 +.389 +.073 +.28
LA/MA AROC
P-I P-ch IP21
V-I OPct 65dpctCh
65-dma AROC
No Sell here. DJI kept rallying.
------------------------------------------------------------------------------------------
12/5/1963 1.025 +.163
-53 +4
-.023
-558 +.125 +.047 +.17
LA/MA AROC
P-I P-ch IP21
V-I OPct 65dpctCh
65-dma AROC
No Sell here. DJI kept rallying.
------------------------------------------------------------------------------------------
12/13/1967 1.015 -.035
+6 -7 +.051
+2 -.010
+.053 +.19
LA/MA AROC
P-I P-ch IP21
V-I OPct 65dpctCh
65-dma AROC
No Sell here. DJI made a shallow retreat, from
816.7 to 785.69.
------------------------------------------------------------------------------------------
12/3/1969 1.021 -.34 +122 +8
+.088 +13 +.258 +.118 +.42
LA/MA AROC
P-I P-ch IP21
V-I OPct 65dpctCh
65-dma AROC
Sell S1 here.
DJI made a shallow retreat, from 816.7 to 785.69.
------------------------------------------------------------------------------------------
12/8/1972 1.019 .582
+156 +6 +.132 +2 +.372 +.072
+.27
LA/MA AROC
P-I P-ch IP21
V-I OPct 65dpctCh
65-dma AROC
No Sell here. DJI made a shallow retreat, from
1033 to 1000 before 12/25..
------------------------------------------------------------------------------------------
12/6/1982 1.027 .063
+21 +15 -.04
-4
+.061 +.160 +.57
LA/MA AROC
P-I P-ch IP21
V-I OPct 65dpctCh
65-dma AROC
Sell S9 here.
DJI made a shallow retreat, from 1047 to 9930 on
12/15..
------------------------------------------------------------------------------------------
12/4/1985 1.03 +.785
+244 +45 +.194
+18 +.406 +.111 +.41
LA/MA AROC
P-I P-ch IP21
V-I OPct 65dpctCh
65-dma AROC
No Sell here. DJI kept rallying.
------------------------------------------------------------------------------------------
12/7/1989 1.029 +.165
-52 +51
+.072
-1
+.241 +.042 +.16
LA/MA AROC
P-I P-ch IP21
V-I OPct 65dpctCh
65-dma AROC
No Sell here. Small and brief pullback.
------------------------------------------------------------------------------------------
12/8/1993 1.021 +.301
+177 +9 +.011
+14 +.177 +.112 +.04
LA/MA AROC
P-I P-ch IP21
V-I OPct 65dpctCh
65-dma AROC
No Sell here. Minor January pullback
3322.18 to 3241.95.
------------------------------------------------------------------------------------------
12/6/1995 1.039 +.920
+206 +12 +.195
+19 +.616 +.113 +.42
LA/MA AROC
P-I P-ch IP21
V-I OPct 65dpctCh
65-dma AROC
No Sell here. Minor pullback from 5199.13
to 5032.94.
------------------------------------------------------------------------------------------
12/5/1997 1.049 +.702
+79 +2 +.065
-18
+.359 +.035 +.13
LA/MA AROC
P-I P-ch IP21
V-I OPct 65dpctCh
65-dma AROC
No Sell here. DJI fell back to 7660.13
(lower band) from 8149.13.
------------------------------------------------------------------------------------------
12/3/1999 1.037 .244
-257
+13 +.016
-12
-.007 +.098
+.021
LA/MA AROC
P-I P-ch IP21
V-I OPct 65dpctCh
65-dma AROC
Sell S9 here.
DJI made a very shallow retreat to 21-dna and B13.
------------------------------------------------------------------------------------------
12/15/2003 1.02 +.224
+245 -57
-.012 -67
+.102 +.058 +.21
LA/MA AROC
P-I P-ch IP21
V-I OPct 65dpctCh
65-dma AROC
No Sell here. DJI kept rallying.
------------------------------------------------------------------------------------------
12/10/2008 1.040
.416 +35
+50 -.035
-82 .147
+.046 +.170
LA/MA AROC
P-I P-ch IP21
V-I OPct 65dpctCh
65-dma AROC
Sell S9 and S12 here.
BEAR MARKET BEGAN.
------------------------------------------------------------------------------------------
12/7/2011 1.029 .129
-35
-9 -.027 -68
.103 +.094 +.350
LA/MA AROC
P-I P-ch IP21
V-I OPct 65dpctCh
65-dma AROC
Sell S9 here.
DJI made a very shallow retreat to 21-dna and B13.
------------------------------------------------------------------------------------------
12/7/2016 1.029 +.811
+382 -17 .179
90 +.656 +.054 +.21
LA/MA AROC
P-I P-ch IP21
V-I OPct 65dpctCh
65-dma AROC
No Sell here. DJI kept rallying.
------------------------------------------------------------------------------------------
Charts 12/4/2017
PEERLESS
DJI, Signals, Indicators Daily DJI
Volume 10-DayUp/Down Vol
DJI-AROC
Hourly DJIA
A/D Line for All Stocks
NASDAQ
S&P
OEX
NYSE
COMPQX
DJI-15 DJI-20
DJI-30
DIA
SPY
QQQ MDY
IWM TNA
CrudeOil
FAS
GLD
BBH
IBB
JETS
JNUG
KOL
NUGT
OIH
OIL
RSX
RETL
SDS
SLV
SOXL
TECL
TMF
TNA UGA
(gasoline)
XIV YINN
Commodities:
JJC, NIB,
CHOC
CORN,
WEAT
UUP
(Dollar)
AAPL ADBE
ALXN AMAT
AMGN AMD
AMZN
BA BABA BAC
BIDU
CAT
CVX
FB
GOOG
GS
HD
IBM
JPM M
(Macy's)
MSFT
NFLX
NVDA
QCOM
TSLA TXN
XOM WMT
ANDV (refinery),
CMG (Chipotle),
LRCX, SWKS,
TOWN New -
SPPI
(small Biotech)
12/4/2017
Bullish MAXCPs Bearish
MINCPs |
Table 1
QuickSilver
Documentation
This is for short-term trading
leveraged ETFs.
It also provides a useful short-term outlook of these sectors ETF's
and the sectors they represewnt
Blue is Bullish
and
Red is Bearish.
1 Candle-Stick color is shortest-term. This
changes when close vis-a-vis opening changes.
So, in stocks or ETFs that advanced a long ways, traders should sell
when a higher
opening gives way to a decline that brings a drop below the previous
day's close.
2 5-dma AROC and Close-versus- pivot point is next
most short-term.
W = warning. Close is below PIVOT-Point.
3 Closing Power trend-direction vs. its 21-dma is next
most short-term.
4 IP21 is used to spot divergences and to estimate
underlying support.
5 > IP21 falling and below +.15 and its 21-dma is bearish in
an over-extended ETF, especially
when its Closing Power is falling and is below its 21-dma.
> IP21 below 07 with AROC below .07 is less likely to bring a rally
back up from 21-dma.
6 Note price trend-lines, support/resistance and price
patterns on charts.
QUICKSILVER on ETFS - 12/4/17
ETF      CLOSE   CHANGE     PIVOT-PT    5-dma AROC  CL-PWR   CANDLE  IP21   ITRS
---------------------------------------------------------------------------------------------
DIA       243.11    .66      238.34        153.9%   Bullish   RED    .19     0
---------------------------------------------------------------------------------------------
COMPQX    6775.37   -72.22  W6912.36      -75.1%    ----      RED    .354    -.035
---------------------------------------------------------------------------------------------
SPY       264.14   -.32      262.87        74.3%    Bullish   RED    .283    -.03
---------------------------------------------------------------------------------------------
QQQ       152.71   -1.78    W156.59       -112.1%   ----      RED    .276    -.031
---------------------------------------------------------------------------------------------
MDY       344.92   -.1       342.37        105.3%   Bullish   RED    .234    -.015
---------------------------------------------------------------------------------------------
IWM       152.45   -.57     W152.86        64.2%    ----      RED    .15    -.033
---------------------------------------------------------------------------------------------
FAS       67.23    1.08      63.16         564.2%   Bullish   RED    .07     .154
---------------------------------------------------------------------------------------------
RETL      34.47    2.36      30.83         988.6%   Bullish   BLUE   .238     .175
---------------------------------------------------------------------------------------------
SOXL      130.5   -10.21    W164.7        -1131.4%  Bearish   RED    .086     .105
---------------------------------------------------------------------------------------------
TECL      104.34   -5.37    W116.13       -483.6%   Bearish   RED    .255     .107
---------------------------------------------------------------------------------------------
IBB       104.03   -1.67     103.76        26.8%    Bearish   RED    .118    -.143
---------------------------------------------------------------------------------------------

---------------------------------------------------------------------------------------------
OIL       6.16   -.11       W6.22         -48.4%    ----      ----   .112     .077
---------------------------------------------------------------------------------------------
OIH       25.42    .02       24.02         317.6%   Bullish   ----   .093    -.081
---------------------------------------------------------------------------------------------
GASL      23.22   -1.08      21.49         449.9%   Bearish   RED    .124    -.004
---------------------------------------------------------------------------------------------
UGA       30.56   -.74      W31.8         -255.1%   Bearish   RED    .132    -.034
---------------------------------------------------------------------------------------------
UUP       24.25    .08      W24.26         18.6%    Bearish   ----  -.061    -.076
---------------------------------------------------------------------------------------------
IEF       105.88   -.05     W106.37       -22.2%    ----      BLUE   .083    -.1
---------------------------------------------------------------------------------------------
CORN      16.88   -.2        16.72         14.8%    Bearish   RED   -.142    -.124
---------------------------------------------------------------------------------------------
WEAT      6.09   -.08        6.03          32.9%    Bearish   RED   -.017    -.168
---------------------------------------------------------------------------------------------
YINN      32.14    .01      W35.93        -443.9%   Bearish   RED   -.006    -.028
---------------------------------------------------------------------------------------------
RSX       21.72    .26      W22.29        -111.9%   Bearish   RED   -.174    -.094
---------------------------------------------------------------------------------------------
AAPL      169.8   -1.25     W173.07       -124.8%   Bearish   RED    .128     .029
---------------------------------------------------------------------------------------------
GOOG      998.68   -11.49   W1047.41      -269.3%   ----      RED    .026    -.014
---------------------------------------------------------------------------------------------
MSFT      81.08   -3.18     W84.88        -165.9%   Bearish   RED    .147     0
---------------------------------------------------------------------------------------------
AMZN      1133.95   -28.4   W1193.6       -262.7%   ----      RED    .09     .098
---------------------------------------------------------------------------------------------
FB        171.47   -3.63    W182.42       -323.7%   Bearish   RED    .03    -.084
---------------------------------------------------------------------------------------------
NVDA     186.66   -11.02    W210.71       -673.8%   Bearish   RED    .006    -.046
---------------------------------------------------------------------------------------------
BA        277.97    6.59     267.99        229.3%   Bullish   BLUE   .05    -.005
---------------------------------------------------------------------------------------------
GS        250.65    1.7      239.41        320.4%   Bearish   RED   -.076    -.004
|
Table 2
COMPARISONS OF BULLISH AND BEARISH NUMBERS
12/4
12/1 11/30 11/29 11/28 11/27 11/24
11/21 11/20 11/17 11/16 11/15 11/14
11/13
NEWHIGHS 340 197 536 500 582 209
439 615 363 244 273 71
198 191
NEWLOWS 37 16 31 57 265 59 31 62 50 229 150
111 150
113
-------------------------------------------------------------------------------------------------------------
MAXCPs
92 105 266 262 320
101 166
406 339 295
321 154 276
259
MINCPs 152 93 80 110
93
94 42 63 52 40
74
105 192
150
--------------------------------------------------------------------------------------------------------------
TTTNHs
72 53 139
161 143 79 110 196 172 169
154
89 125
101
TTTNLs
402 286 162 230 124 144
66 186 184 79 78 211
259 203
--------------------------------------------------------------------------------------------------------------
FASTUP
180 126
128 130 141 143 205 245 189 158
148 121 146
148
FASTDOWN
210 156 123 97 74 64 58 72 100 136
177 253
249 260
|
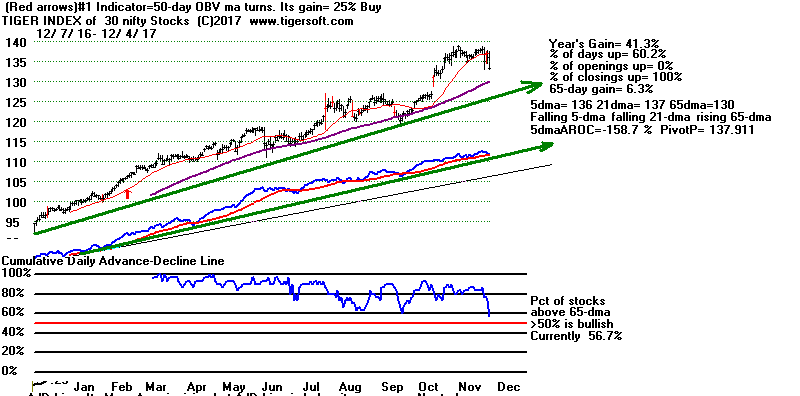 |
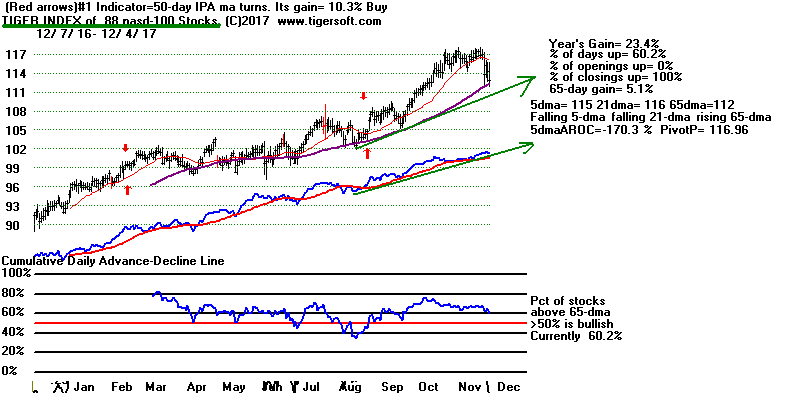 |
Table 3
--------------------------------------------------------
Count of Stocks and New Highs in Key Tiger
Directories
Date = 171204 No. NHs Pct.
-------------------------------------------------------------------
BIGBANKS 7 4 57 %
TRANSP 20 7 35 %
DJI-13 13 4 31 %
HOMEBLDG 17 5 29 %
INSURANC 32 8 25 %
FINANCE 92 21 23 %
DOWJONES 30 6 20 %
MORNSTAR 238 48 20 %
RETAIL 53 10 19 %
SP-100 96 17 18 %
INFRA 11 2 18 %
BIGMIL 6 1 17 %
NIFTY 30 5 17 %
SP500 486 79 16 %
INDEXES 195 29 15 %
BEVERAGE 20 3 15 %
==================================================
RUS-1000 839 119 14 %
NASD-100 88 11 13 %
REGBANKS 33 4 12 %
AUTO 39 3 8 %
MILITARY 38 3 8 %
HACKERS 25 2 8 %
GAMING 28 2 7 %
GREEN 31 2 6 %
CHEM 64 3 5 %
SOFTWARE 66 3 5 %
INDMATER 92 4 4 %
REIT 178 5 3 %
ETFS 65 1 2 %
BIOTECH 385 8 2 %
UTILITY 43 1 2 %
ELECTRON 179 1 1 %
OILGAS 143 1 1 %
COMODITY 71 1 1 %
BONDFUND 111 1 1 %
===============================================
None SEMI, CHINA, SOLAR, COMPUTER, COAL, GOLD
EDU, PIPELINE, FOOD, HOSPITAL and JETS
|
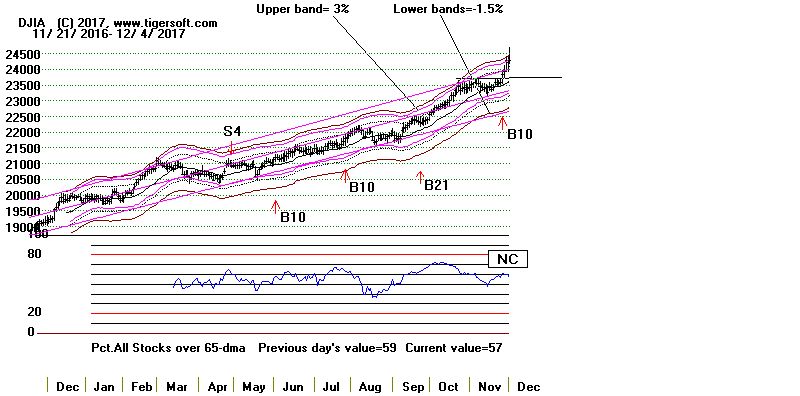 |
Table 4
 RANKING OF KEY DIRECTORIES BASED PCT.OF STOCKS ABOVE 65-DMA
               12/4/17
Bullish = 34
Bearish = 12
---------------------------------------------------------------------------------------
Directory     Current       day-1         day-2         day-3         day-4         day-5
----------------------------------------------------------------------------------------
BIGBANKS       1             1             1             1             1             .571
DJI-13         1             1             1             1             1             .846
INFRA          1             .909          1             1             .909          .545
TRANSP         .95           .95           .95           .9            .65           .4
REGBANKS       .939          .939          .909          1             .909          .696
DOWJONES       .9            .9            .866          .866          .866          .733
JETS           .888          .888          .888          .888          .777          .666
FINANCE        .847          .858          .858          .858          .826          .684
BIGMIL         .833          .833          1             .833          .833          .833
HOMEBLDG       .823          .823          .823          .823          .823          .823
RETAIL         .792          .735          .811          .849          .698          .584
SP-100         .791          .843          .822          .77           .729          .593
MORNSTAR       .777          .798          .785          .794          .794          .726
SP500          .755          .771          .773          .751          .718          .639
INSURANC       .75           .687          .656          .75           .687          .625
INDEXES        .748          .779          .743          .753          .697          .651
RUS-1000       .731          .736          .743          .733          .706          .632
UTILITY        .72           .767          .72           .767          .813          .744
EDU            .714          .714          .857          .857          1             .714
CHEM           .703          .687          .765          .796          .828          .781
AUTO           .692          .692          .717          .794          .717          .615
BEVERAGE       .65           .6            .6            .5            .45           .45
GAMING         .642          .75           .75           .75           .75           .714
HACKERS        .64           .68           .72           .72           .76           .76
MILITARY       .631          .605          .736          .631          .736          .684
COMPUTER       .608          .695          .739          .739          .782          .652
NASD-100       .602          .647          .625          .636          .681          .659
OILGAS         .601          .657          .601          .503          .524          .475
SOFTWARE       .59           .666          .636          .651          .742          .712
GREEN          .58           .645          .709          .677          .709          .645
NIFTY          .566          .733          .766          .766          .866          .833
INDMATER       .543          .543          .608          .565          .63           .597
ELECTRON       .536          .62           .653          .659          .743          .743
REIT           .522          .505          .505          .522          .505          .55
N=34
=============================================================================================
FOOD           .466          .533          .6            .6            .533          .533
COMODITY       .464          .521          .535          .549          .521          .563
SEMI           .458          .595          .625          .618          .732          .748
ETFS           .446          .507          .553          .6            .8            .723
CHINA          .421          .484          .578          .578          .671          .64
BIOTECH        .41           .457          .48           .446          .462          .462
COAL           .375          .25           .375          .25           .5            .375
HOSPITAL       .375          .375          .375          .375          .125          0
SOLAR          .333          .476          .571          .571          .619          .666
GOLD           .122          .163          .163          .122          .244          .265
BONDFUND       .09           .108          .063          .063          .135          .099
PIPELINE       0             0             0             0             .142          .142
N=12
|
=================================================================================
=================================================================================
12/1/2017 The Peerless signal remains the
very bullish
September Buy B21
The new tax cut and prospective ending of most regulations on
big banks have sent the market soaring. The DJI has shot up past
the last resistance line. No one knows where to sell DIA. And
with
the DJI soaring, the other indexes will almost certainly rally too.
Study the chart below. Tiger lets us calculate the best fitting lower
band.
Never since 1915 has the separately optimized lower band been
closer to the 21-day ma. Shorts are miserable. A buying stampede
usually follows when the optimized band is below 3% for a year. What
will happen with it down to 1.5%? We are seeing it now. A
"Melt-UP"
is occurring.
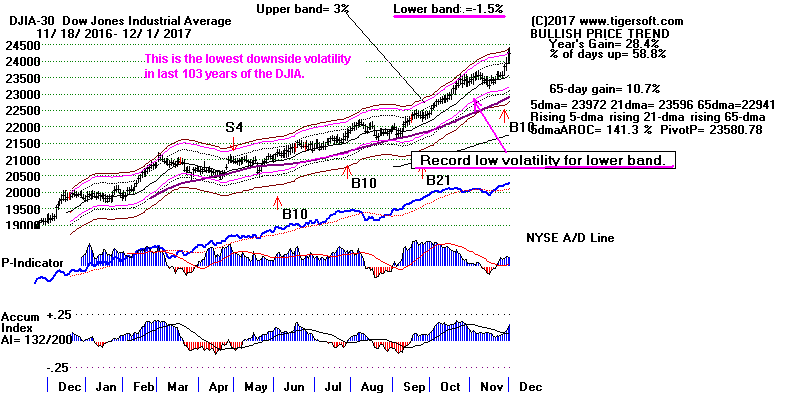
The "Wager on The Rich"
The stock market dare not go down now. A rally now is an essential
part of the
belief system of its Republican supporters. Most big shareholders are
Republicans.
So don't expect them to be sellers. Stocks now are the cheerleaders
for the Trump
economic Revolution. They have to keep rising at this juncture.
A decline now
would undercut the whole rationale for the tax-cut. The stock market
rally is the
primary mechanism by which "Trickle-Down" will boost the Economy. It
will
put much more money in the hands of affluent consumers and lift general
Consumption and it will almost certainly lead to more corporate share
buy-backs
and buy-outs of other corporations.
The lesson of the 1920s and the 1980s argues persuasively that this
will lift stocks for a year or two longer. The big Coolidge Tax cut
was signed
into law in February 1926. The DJI, of course, did not peak until
September 1929,
despite a Crash in the Florida Real Estate in 1926. The big Second
Reagan tax cut
became law in October 1986. The DJI did not peak until October 1987.
It's true that the original Reagan tax was passed in 1981. But it was
short-circuited by
20% interest rates. There's no way we will see rates like this again
for a long while.
So, though, some will suggest it's time to take profits, don't you believe
them. Who
in his right mind would take profits this year when taxes will be lower next
year.
Nor are the Tax Cuts and Deregulation the only things the the Republican
Congress will
do to help corporations and the stock market. Soon big chunks of Western
national parks
will be leased or sold off for mineral exploration. It is only a
matter of time before
Social Security is privatized if the Republicans stay in control of Congress
in 2018
and 2020. They need a roaring economy. To achieve that end, the
stock market
must accelerate up now, not top out.
Two Technical Discoveries To Appear In New Peerless Book (due soon)
In putting together my new Peerless books, I recently discovered two new
ways to make use of Tiger's optimized variable width bands around the 21-dma.
In doing so, I looked back at the year's optimization for the upper and
lower
bands back to 1915. The program calculates the best bands to capture about
91%-92% of the DJI's closes for a year. Here the optimized lower band's
width
was determined
separately
from the upper band's optimized band width..
The first discovery was simply that then when the year's optimized lower band
around the
21-dma was under 3%, as is true now, the odds are quite high that a bull
market will
follow for the next year. See the optimized upper and lower bands in the
chart
above. Bull market advances followed the nine years low
downside volatility
shown here: 1944, 1945 (until mid 1946), 1954, 1958, 1963, 1964, 1985, 1995,
and 2016. Now we see an optimized lower band of only 1.5%.
There are four exceptions. Intermediate tops occurred in the year
after 1952
and in the year after 1993. Bear markets twice, in the year following 1961
and 1972.
The second discovery was that when the yearly optimized lower band
ceases being wider than the yearly optimized upper band after 3 years
of being dominant, market fear is ending and 66.7% of the time the DJI
rallies.
Here is the table I am putting in the new book.
Buying When The Streak of
"Fearful Years"
Ends
Prior Streak
Year the
Subsequent DJI Behavior
of Years with more
Streak Ends
downward than
on Dec 31
upside volatility.
----------------------
-------------
------------------------------------------------------
5
1924
DJI rose from 118.6 to 155.90 at end of 1925.
3
1932
DJI fell from 60.3 to 50.2 on 2/27/1932
and
then rose to 108.7 on 7/18/1933.
3
1942
DJI rose from 119.4 to 145.8 on 7/14/1943
4
1952
DJI fell from 291.9 to 255.5 on 9/14/1952
and then rose to 486 on 9/22/1955.
3
1958
DJI rose from 583.7 to 678.1 on 8/3/1958
5
1971
DJI rose from 881.17 to 1051.7 on 1/11/1973
4
1983
DJI fell from 1258.64 to 1086.57 on 7/24/1984
11
2012
DJI rose from 13104.14 to 16576.66 on 12/31/2013
4
2016
DJI rose from 19762.6 to 24272.35 on 11/30/2017
Charts 12/1/2017
PEERLESS
DJI, Signals, Indicators Daily DJI
Volume 10-DayUp/Down Vol
DJI-AROC
Hourly DJIA
A/D Line for All Stocks
NASDAQ
S&P
OEX
NYSE
COMPQX
DJI-15 DJI-20
DJI-30
DIA
SPY
QQQ MDY
IWM TNA
CrudeOil
FAS
GLD
BBH
IBB
JETS
JNUG
KOL
NUGT
OIH
OIL
RSX
RETL
SDS
SLV
SOXL
TECL
TMF
TNA UGA
(gasoline)
XIV YINN
Commodities:
JJC, NIB,
CHOC
CORN,
WEAT
UUP
(Dollar)
AAPL ADBE
ALXN AMAT
AMGN AMD
AMZN
BA BABA BAC
BIDU
CAT
CVX
FB
GOOG
GS
HD
IBM
JPM M
(Macy's)
MSFT
NFLX
NVDA
QCOM
TSLA TXN
XOM WMT
ANDV (refinery),
CMG (Chipotle),
LRCX, SWKS,
TOWN New -
SPPI
(small Biotech)
12/1/2017
Bullish MAXCPs Bearish
MINCPs
|
Table 1
QuickSilver
Documentation
This is for short-term trading
leveraged ETFs.
It also provides a useful short-term outlook of these sectors ETF's
and the sectors they represewnt
Blue is Bullish
and
Red is Bearish.
1 Candle-Stick color is shortest-term. This
changes when close vis-a-vis opening changes.
So, in stocks or ETFs that advanced a long ways, traders should sell
when a higher
opening gives way to a decline that brings a drop below the previous
day's close.
2 5-dma AROC and Close-versus- pivot point is next
most short-term.
W = warning. Close is below PIVOT-Point.
3 Closing Power trend-direction vs. its 21-dma is next
most short-term.
4 IP21 is used to spot divergences and to estimate
underlying support.
5 > IP21 falling and below +.15 and its 21-dma is bearish in
an over-extended ETF, especially
when its Closing Power is falling and is below its 21-dma.
> IP21 below 07 with AROC below .07 is less likely to bring a rally
back up from 21-dma.
6 Note price trend-lines, support/resistance and price
patterns on charts.
QUICKSILVER on ETFS - 12/1/17
ETF      CLOSE   CHANGE     PIVOT-PT    5-dma AROC   CL-PWR     CANDLE     IP21   ITRS
---------------------------------------------------------------------------------------------
DIA       242.45   -.39      235.73        146.4%    Bullish       RED    .322    ---
---------------------------------------------------------------------------------------------
COMPQX    6847.59   -26.38  W6878.52      -30.2%     Bullish      BLUE   .45     -.019
---------------------------------------------------------------------------------------------
SPY       264.46   -.55      260.23        78.2%     Bullish       RED    .382    -.025
---------------------------------------------------------------------------------------------
QQQ       154.49   -.66     W156.19       -56.9%     Bullish      BLUE   .397    -.016
---------------------------------------------------------------------------------------------
MDY       345.02   -.89      337.7         97.8%     Bullish       RED   .273    -.008
---------------------------------------------------------------------------------------------
IWM       153.02   -.63      150.49        68%       Bullish       RED   .226    -.02
---------------------------------------------------------------------------------------------
FAS       66.15    .26       60.01         468.9%    Bullish      BLUE   .211     .135
---------------------------------------------------------------------------------------------
RETL      32.11   -.6        28.26         638.3%    Bullish      RED    .238     .133
---------------------------------------------------------------------------------------------
SOXL      140.71   -4.99    W164.85       -968.5%    Bearish      RED    .186     .221
---------------------------------------------------------------------------------------------
TECL      109.71   -1.61    W115.19       -240.1%    ----         BLUE   .394     .176
---------------------------------------------------------------------------------------------
IBB       105.7    .46       103.47        72.1%     ----         BLUE   .132    -.128
---------------------------------------------------------------------------------------------
GLD       122.6    .58       119.46        142.2%    Bullish      BLUE   .092    -.021
---------------------------------------------------------------------------------------------
OIL       6.27    .14        6.22         -72.4%     ----         ----   .16     .1
---------------------------------------------------------------------------------------------
OIH       25.4    .81        23.87         242.1%    Bullish      BLUE   .127    -.066
---------------------------------------------------------------------------------------------
GASL      24.3    1.26       21.21         418.7%    Bearish      BLUE   .137     .067
---------------------------------------------------------------------------------------------
UGA       31.3    .07       W32.17        -137.1%    ----         RED    .205     .008
---------------------------------------------------------------------------------------------
UUP       24.17   -.02       24.16         8.3%      Bearish      RED   -.004    -.076
---------------------------------------------------------------------------------------------
IEF       105.93    .23     W106.35       -16.5%     Bearish      BLUE  -.001    -.093
---------------------------------------------------------------------------------------------
CORN      17.08    .09       16.83         44.4%     ----         BLUE  -.1      -.102
---------------------------------------------------------------------------------------------
WEAT      6.17    .08        6.05          41.1%     ----         BLUE   .068    -.156
---------------------------------------------------------------------------------------------
YINN      32.13   -.91      W35.16        -673.6%    Bearish      RED    .082    -.057
---------------------------------------------------------------------------------------------
RSX       21.46   -.22      W22.21        -230.9%    Bearish      RED   -.131    -.101
---------------------------------------------------------------------------------------------
AAPL      171.05   -.8      W174.09       -113.5%    ----         BLUE   .226     .03
---------------------------------------------------------------------------------------------
GOOG      1010.17   -11.24  W1054.21      -146.8%    ----         RED    .109    -.002
---------------------------------------------------------------------------------------------
MSFT      84.26    .09       83.87         59.6%     Bullish      BLUE   .245     .05
---------------------------------------------------------------------------------------------
AMZN      1162.35   -14.4   W1195.83      -100%      ----         RED    .149     .12
---------------------------------------------------------------------------------------------
FB        175.1   -2.08     W183.03       -213.2%    Bearish      RED    .052    -.062
---------------------------------------------------------------------------------------------
NVDA     197.68   -3.03     W214.14       -463.9%    Bearish      RED    .084     .009
---------------------------------------------------------------------------------------------
BA        271.38   -5.42     265.58        102.2%    Bullish      RED    .121    -.025
---------------------------------------------------------------------------------------------
GS        248.95    1.31     235.11        271%      Bullish      RED   -.006    -.009
|
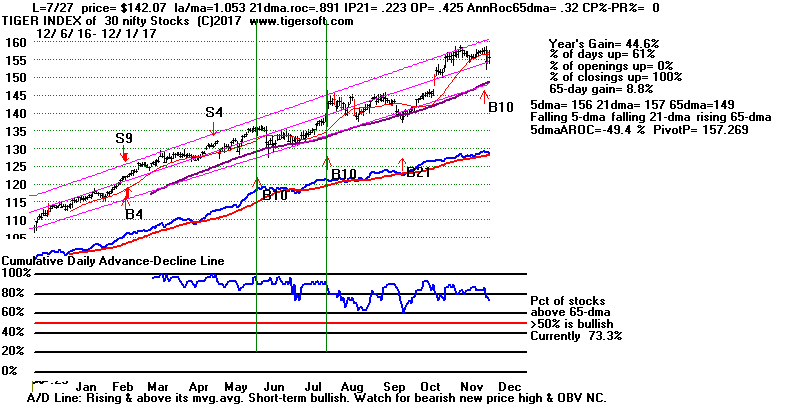
Components of Tiger's Nifty-30 Index.
AAPL ADBE ADP ADSK ALGN AMAT AMT AMZN ATVI AVGO CHDN CPA CTAS
EQIX EXPD FB FISV GOOG HD ISRG LMT MSFT MU NVDA NVR PCLN PLUS TSLA
VRTX |
Table 2
COMPARISONS OF BULLISH AND BEARISH NUMBERS
12/1 11/30
11/29 11/28 11/27 11/24 11/21 11/20
11/17 11/16 11/15 11/14 11/13 11/10
NEWHIGHS 197 536 500 582 209
439 615 363 244 273 71
198 191
164
NEWLOWS 16 31 57 265 59 31 62 50 229 150
111 150
113 98
--------------------------------------------------------------------------------------------------------------------
MAXCPs 105 266 262 320
101 166
406 339 295
321 154 276
259 167
MINCPs 93 80 110
93
94 42 63 52 40
74
105 192
150
138
--------------------------------------------------------------------------------------------------------------------
TTTNHs
53 139
161 143 79 110 196 172 169
154
89 125 101
88
TTTNLs
286 162 230 124 144
66 186 184 79 78 211
259 203
237
--------------------------------------------------------------------------------------------------------------------
FASTUP
126
128 130 141 143 205 245 189 158
148 121 146
148 190
FASTDOWN
156 123 97 74 64 58 72 100 136
177 253
249 260
221 |
  Table 3

Count of Stocks and New Highs in Key Tiger Directories
Date = 171201
               No.           NH            Pct.
-------------------------------------------------------------------
BIGBANKS       7             2             29 %
INSURANC       32            9             28 %
DJI-13         13            3             23 %
GAMING         28            6             21 %
DOWJONES       30            6             20 %
FINANCE        92            14            15 %
BEVERAGE       20            3             15 %
=======================================================
HOMEBLDG       17            2             12 %
NIFTY          30            3             10 %
MORNSTAR       238           24            10 %
SP-100         96            9             9 %
INFRA          11            1             9 %
HACKERS        25            2             8 %
SP500          486           39            8 %
RUS-1000       839           64            8 %
SOFTWARE       66            4             6 %
RETAIL         53            3             6 %
AUTO           39            2             5 %
CHEM           65            3             5 %
INDMATER       92            5             5 %
INDEXES        195           9             5 %
TRANSP         20            1             5 %
SOLAR          21            1             5 %
BIOTECH        385           15            4 %
REGBANKS       33            1             3 %
NASD-100       88            3             3 %
ELECTRON       179           3             2 %
SEMI           131           3             2 %
CHINA          64            1             2 %
REIT           178           4             2 %
UTILITY        43            1             2 %
OILGAS         143           1             1 %
COMODITY       71            1             1 %
--------------------------------------------------------
None:  BIGMIL, GREEN, MILITARY, ETFS,  COMPUTER
COAL, GOLD,  EDU,  PIPELINE,  FOOD,  BONDFUND,
HOSPITAL, JETS,
|
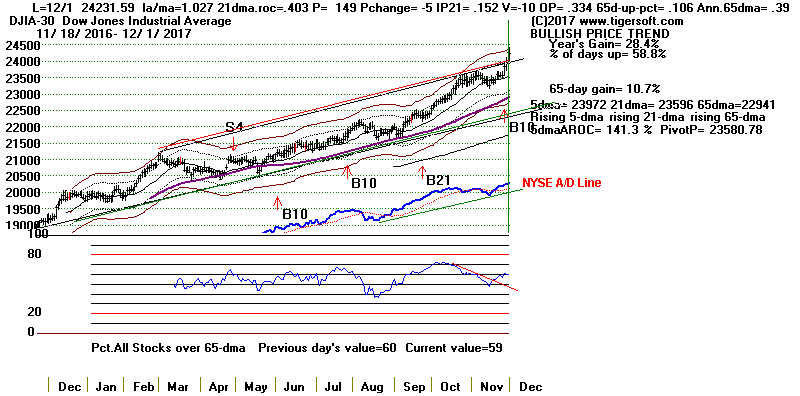 |
 Table 4
   RANKING OF KEY DIRECTORIES BASED PCT.OF STOCKS ABOVE 65-DMA
               12/1/17
Bullish = 38
Bearish = 8
---------------------------------------------------------------------------------------
Directory     Current       day-1         day-2         day-3         day-4         day-5
----------------------------------------------------------------------------------------
BIGBANKS       100%          1             1             1             .714          1
DJI-13         100%          1             1             1             .846          .923
TRANSP         .95           .95           .9            .65           .4            .5
REGBANKS       .939          .909          1             .909          .696          .696
INFRA          .909          1             1             .909          .545          .727
DOWJONES       .9            .866          .866          .866          .733          .8
JETS           .888          .888          .888          .777          .666          .777
FINANCE        .858          .858          .858          .826          .684          .717
SP-100         .843          .822          .77           .729          .604          .645
BIGMIL         .833          1             .833          .833          .833          .666
HOMEBLDG       .823          .823          .823          .823          .823          .941
MORNSTAR       .798          .785          .794          .794          .735          .764
INDEXES        .779          .743          .753          .697          .661          .661
SP500          .771          .773          .751          .718          .641          .666
UTILITY        .767          .72           .767          .813          .744          .697
GAMING         .75           .75           .75           .75           .714          .714
RUS-1000       .736          .743          .733          .706          .635          .65
RETAIL         .735          .811          .849          .698          .584          .603
NIFTY          .733          .766          .766          .866          .833          .833
EDU            .714          .857          .857          1             .714          .857
COMPUTER       .695          .739          .739          .782          .652          .695
AUTO           .692          .717          .794          .717          .641          .589
INSURANC       .687          .656          .75           .687          .625          .625
HACKERS        .68           .72           .72           .76           .76           .76
CHEM           .676          .753          .784          .815          .769          .723
SOFTWARE       .666          .636          .651          .742          .712          .712
OILGAS         .657          .601          .503          .524          .489          .594
NASD-100       .647          .625          .636          .681          .659          .659
GREEN          .645          .709          .677          .709          .645          .645
ELECTRON       .62           .653          .659          .743          .743          .765
MILITARY       .605          .736          .631          .736          .684          .631
BEVERAGE       .6            .6            .5            .45           .45           .45
SEMI           .595          .625          .618          .732          .748          .778
INDMATER       .543          .608          .565          .63           .597          .63
FOOD           .533          .6            .6            .533          .533          .666
COMODITY       .521          .535          .549          .521          .563          .577
ETFS           .507          .553          .6            .8            .738          .738
REIT           .505          .505          .522          .505          .556          .606
--------------------------------------------------------------------------------------------
CHINA          .484          .578          .578          .671          .656          .703
SOLAR          .476          .571          .571          .619          .666          .666
BIOTECH        .457          .48           .446          .462          .464          .475
HOSPITAL       .375          .375          .375          .125          0             0
COAL           .25           .375          .25           .5            .375          .5
GOLD           .163          .163          .122          .244          .265          .224
BONDFUND       .108          .063          .063          .135          .099          .153
PIPELINE       0             0             0             .142          .142          .142
N = 8
|
=========================================================================
=========================================================================
11/30/2017 The Peerless signal remains the
very bullish
September Buy B21
The DJI has not gotten past its 3% band very often since the bull market
began
in 2009. A pullback should come as no surprise. But I would not
expect
it to be very deep. Since 2010, fresh moves to the 3% upper band have
occurred only nine times when the DJI was making new highs. Without a
new Peerless Sell, the odds based on the six cases since 2010 favor more
new highs by 5:1.
Fresh Moves to the DJI's 3% upper band and
their Consequences since 2010.
1 20100323 10888.83 DJI
rose to 11205.03 on 4/26/2010.
(la/ma=1.031 AROC=.571 P= 590 67 IP21= .166
V=90 OP= .459)
2 20110429 12810.54
Multiple Peerless DJI sells and DJI fell to lower band.
(la/ma=1.031 AROC=.441 P= 262 -23 IP21= .141
V=-17 OP=
.338)
3 20130124 13825.33
DJI rose to 15387.58 on 5/21/2013
(la/ma=1.031 AROC=.441 P= 262 -23 IP21= .141
V=-17 OP=
.338)
4 20130916 15494.78
Multiple Peerless DJI sells and DJI fell to lower band.
(la/ma=1.031 AROC=.303 P= 185 154
IP21= -.025 V=-9 OP= .116)
5 20131231 16576.66 Peerless
Sell S16 and DJI fell below lower band.
(la/ma=1.030 AROC=.363 P= 108 29
IP21=.010 V=9
OP= .167)
6 20141031 17390.52
DJI rose to 17958.78 before it fell to lower band.
(la/ma=1.042 AROC=.421 P= 346 71
IP21=.072
V=6
OP= .007)
7 20160712 18347.67 DJI
rose to 18595.03 and then went flat.
(la/ma=1.042 AROC=.421 P= 346 71
IP21=.072
V=6
OP= .007)
8 20161110 18807.88
Trump Bull Market was just starting.
(la/ma=1.031 AROC=.323 P= 454 148
IP21=.049
V=22
OP= .053)
9 20170301 21115.55 DJI
peaked and fell to 20404.49 on 4/19.
(la/ma=1.034 AROC=.669 P= 342 107
IP21=.192
V=3
OP= .485)
-------------------------------------------------------------------------------------
10 Current case la/ma=1.030 AROC=.459 P= 153
-13 IP21=.129
V=-10 OP=
.44
(Note that Sell S9-Vs are not permitted in November and December.)
"Technically"
We just saw a bullish flat-top B10 breakout in the DJI. It is now
above all resistance
lines that can be easily drawn. The path of least resistance will
probably be upwards,
at least, until the tax cut/health care bill is passed. Then will be a
good enough time
to take profits. For now, the DJIA is clearly were the action is and from a
Peerless vantage
point, breadth and our IP21 (accumulation) are good enough to allow
more gains
even though the DJI is now 3% over the 21-dma. While it's true that a
few
of the DJI stocks' rises today caused the DJI's very splashy advance, it's
not true
this was a narrow advance within the DJI-30 itself. Our Tiger Index
chart below shows
the DJI-30's A/D Line easily made another new high today. See how
strong
the Tiger Index of 30 DJI stocks has looked for some time. (This is
one of the
linked charts posted each night
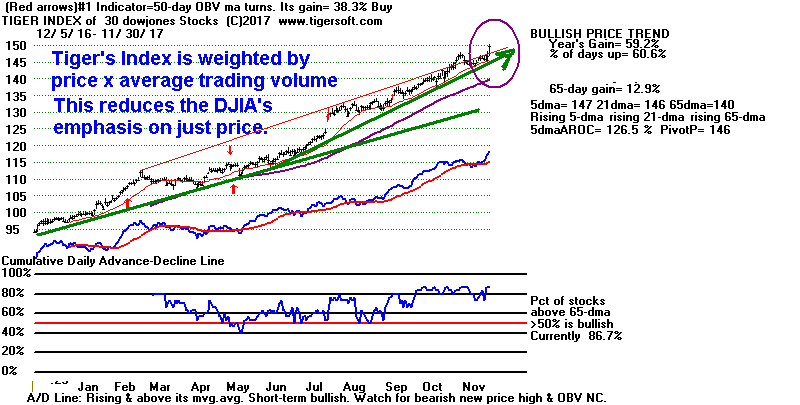
"Hot money" always goes where the action is. The 30-DJI stocks are
big, but
they can be pushed around a lot by aggressive Professionals and
hedge-fund
speculators, especially when there are lots of shorts who can be run in.
Professionals
love to embarrass bearish "talking heads" who appear on TV and Yahoo News.
So, today the DJI today shot up through the 12400 resistance. As is
the convention
in these circumstances, the high-priced DJI stocks were the leaders.
Because the
DJI-30 is weighted by the price of its individual components, its percentage
gain today
was disproportionately greater than the others indexes. See below how
well 8 of the
10 DJI stocks over $150 did.
Let's look at their individual charts to get a sense of their
immediate upside potential.
With the DJI's divisor now 0.145, a mere 1-point advance by each of
these 10 stocks
would, by itself, lift the DJI up 69 points.
I still see much more potential in BA if it can get
past its last resistance-line,
which is where it closed today. GS has 7 more points of upside
potential.
But most bullish are UNH, HD and CAT.
They are above all resistance and
rising freely.
BA
276.80 +7.50
Short-term resistance reached.
Any additional
advance is likely to produce an even steeper rise.
GS 247.64
+6.28 7.36 points away from previous peak at 255.
MMM 243.14 +5.13
Short-term resistance is 3 points higher.
UNH 228.17 +5.29
Above all resistance and likely to zoom much higher
if ObamaCare is killed along with the tax cut's enactment.
HD 179.82
+2.57 Above all resistance and likely to go much
higher
MCD 171.97 +1.54
Short-term resistance is just one point higher.
AAPL 171.85 +2.37
Short-term resistance is 3 points higher.
IBM 153.97
+.42
CAT
141.15 +3.09
Above all resistance and likely to go much higher.
JNJ 139.33 -.48
Charts 11/30/2017
PEERLESS
DJI, Signals, Indicators Daily DJI
Volume 10-DayUp/Down Vol
DJI-AROC
Hourly DJIA
A/D Line for All Stocks
NASDAQ
S&P
OEX
NYSE
COMPQX
DJI-15 DJI-20
DJI-30
DIA
SPY
QQQ MDY
IWM TNA
CrudeOil
FAS
GLD
BBH
IBB
JETS
JNUG
KOL
NUGT
OIH
OIL
RSX
RETL
SDS
SLV
SOXL
TECL
TMF
TNA UGA
(gasoline)
XIV YINN
Commodities:
JJC, NIB,
CHOC
CORN,
WEAT
UUP
(Dollar)
AAPL ADBE
ALXN AMAT
AMGN AMD
AMZN
BA BABA BAC
BIDU
CAT
CVX
FB
GOOG
GS
HD
IBM
JPM M
(Macy's)
MSFT
NFLX
NVDA
QCOM
TSLA TXN
XOM WMT
ANDV (refinery),
CMG (Chipotle),
LRCX, SWKS,
TOWN New -
SPPI
(small Biotech)
11/30/2017
Bullish MAXCPs Bearish
MINCPs
|
Table 1
QuickSilver
Documentation
This is for short-term trading
leveraged ETFs.
It also provides a useful short-term outlook of these sectors ETF's
and the sectors they represewnt
Blue is Bullish
and
Red is Bearish.
1 Candle-Stick color is shortest-term. This
changes when close vis-a-vis opening changes.
So, in stocks or ETFs that advanced a long ways, traders should sell
when a higher
opening gives way to a decline that brings a drop below the previous
day's close.
2 5-dma AROC and Close-versus- pivot point is next
most short-term.
W = warning. Close is below PIVOT-Point.
3 Closing Power trend-direction vs. its 21-dma is next
most short-term.
4 IP21 is used to spot divergences and to estimate
underlying support.
5 > IP21 falling and below +.15 and its 21-dma is bearish in
an over-extended ETF, especially
when its Closing Power is falling and is below its 21-dma.
> IP21 below 07 with AROC below .07 is less likely to bring a rally
back up from 21-dma.
6 Note price trend-lines, support/resistance and price
patterns on charts.
QUICKSILVER on ETFS - 11/30/17
ETF      CLOSE   CHANGE     PIVOT-PT      5-dma AROC   CL-PWR   CANDLE     IP21   ITRS
---------------------------------------------------------------------------------------------
DIA       242.84    3.42     235.47        161.9%      Bullish      BLUE   .265   ---
---------------------------------------------------------------------------------------------
COMPQX    6873.97  49.58   W6889.16       4.8%         Bullish      BLUE   .405    -.02
---------------------------------------------------------------------------------------------
SPY       265.01    2.3      260.36        100.5%      Bullish      BLUE   .322    -.025
---------------------------------------------------------------------------------------------
QQQ       155.15    1.29    W156.26       -17.3%       Bullish      BLUE   .361    -.017
---------------------------------------------------------------------------------------------
MDY       345.91    1.98     338.34        113.5%      Bullish      BLUE   .195    -.007
---------------------------------------------------------------------------------------------
IWM       153.65    .28      150.95        91%         Bullish      RED    .125    -.016
---------------------------------------------------------------------------------------------
FAS       65.89    1.15      60.26         466.3%      Bullish      ----   .129     .137
---------------------------------------------------------------------------------------------
RETL      32.71   -.42       28.2          711.9%      Bullish      RED    .225     .142
---------------------------------------------------------------------------------------------
SOXL      145.7    2.65     W171.3        -651.9%      Bearish      RED    .136     .251
---------------------------------------------------------------------------------------------
TECL      111.32    2.75    W115.15       -93.2%       ----         BLUE   .354     .173
---------------------------------------------------------------------------------------------
IBB       315.76    4.49     312.63        52%         ----         BLUE   .062    -.136
---------------------------------------------------------------------------------------------
GLD       122.6    .58       119.46        142.2%      Bullish      BLUE   .092    -.02
---------------------------------------------------------------------------------------------
OIL       6.13   -.02       W6.36         -80.2%       ----         RED    .157     .076
---------------------------------------------------------------------------------------------
OIH       24.59    .47       24.23         62.2%       Bearish      BLUE   .02    -.108
---------------------------------------------------------------------------------------------
GASL      23.04    1.38      22.46         139.6%      Bearish      BLUE   .184     .02
---------------------------------------------------------------------------------------------
UGA       31.23   -.05      W32.17        -75.4%       ----         RED    .222     .003
---------------------------------------------------------------------------------------------
UUP       24.19   -.06       24.13        -10.3%       Bearish      ----   .015    -.078
---------------------------------------------------------------------------------------------
IEF       105.7   -.33      W106.28       -31.5%       Bearish      RED   -.007    -.096
---------------------------------------------------------------------------------------------
CORN      16.99    .07       16.93        -11.8%       ----         BLUE  -.112    -.106
---------------------------------------------------------------------------------------------
WEAT      6.09   -.01       W6.12         -90.2%       ----         ----   .041    -.166
---------------------------------------------------------------------------------------------
YINN      33.04   -.8       W36.84        -660%        Bearish      RED    .007    -.021
---------------------------------------------------------------------------------------------
RSX       21.68   -.12      W22.48        -186.4%      Bearish      RED   -.156    -.088
---------------------------------------------------------------------------------------------
AAPL      171.85    2.37    W174.97       -89.7%       Bearish      BLUE   .165     .017
---------------------------------------------------------------------------------------------
GOOG      1021.41   -.25    W1040.61      -70%         Bullish      RED    .147     .012
---------------------------------------------------------------------------------------------
MSFT      84.17    .83       83.26         63.3%       Bullish      BLUE   .211     .039
---------------------------------------------------------------------------------------------
AMZN      1176.75    15.48  W1186          87.4%       Bullish      BLUE   .17     .125
---------------------------------------------------------------------------------------------
FB        177.18    2.05    W182.78       -102%        ----         BLUE   .134    -.055
---------------------------------------------------------------------------------------------
NVDA     200.71    4.29     W216.96       -337.6%      Bearish      BLUE   .06    -.005
---------------------------------------------------------------------------------------------
BA        276.8    7.5       265.88        218.3%      Bullish      BLUE   .218    -.001
---------------------------------------------------------------------------------------------
GS        247.64    6.28     235.95        235.8%      Bullish      BLUE  -.071    -.007
|
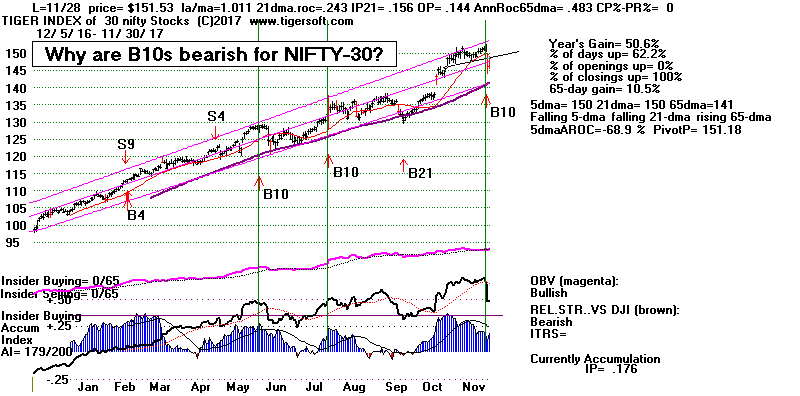
Components of Tiger's Nifty-30 Index.
AAPL ADBE ADP ADSK ALGN AMAT AMT AMZN ATVI AVGO CHDN CPA CTAS
EQIX EXPD FB FISV GOOG HD ISRG LMT MSFT MU NVDA NVR PCLN PLUS TSLA
VRTX |
Table 2
COMPARISONS OF BULLISH AND BEARISH NUMBERS
11/30 11/29
11/28 11/27 11/24 11/21 11/20 11/17
11/16 11/15 11/14 11/13 11/10 11/9
NEWHIGHS 536 500 582 209
439 615 363 244 273 71
198 191
164 157
NEWLOWS 31 57 265 59 31 62 50 229 150
111 150
113 98 93
--------------------------------------------------------------------------------------------------------------------
MAXCPs 266 262 320 101 166 406 339 295 321
154 276 259
167 171
MINCPs
80 110
93
94 42 63 52 40
74
105 192
150
138
130
--------------------------------------------------------------------------------------------------------------------
TTTNHs
139
161 143 79 110 196 172 169
154
89 125 101
88 82
TTTNLs
162 230 124 144
66 186 184 79 78 211
259 203
237 297
--------------------------------------------------------------------------------------------------------------------
FASTUP
128 130 141 143 205 245 189 158
148 121 146
148 190 209
FASTDOWN 123 97 74 64 58 72 100 136
177 253
249 260
221 250 |
Table 3
Count of Stocks and New Highs in Key Tiger
Directories
Date = 171130 No. NHs Pct.
-------------------------------------------------------------------
TRANSP 20 10 50 %
HOMEBLDG 17 8 47 %
DJI-13 13 6 46 %
INFRA 11 4 36 %
BIGMIL 6 2 33 %
DOWJONES 30 10 33 %
BIGBANKS 7 2 29 %
INDEXES 195 57 29 %
GAMING 28 7 25 %
MORNSTAR 238 54 23 %
SP-100 96 21 22 %
MILITARY 38 8 21 %
SP500 486 104 21 %
UTILITY 43 9 21 %
NIFTY 30 6 20 %
RUS-1000 839 156 19 %
INSURANC 32 5 16 %
CHEM 65 10 15 %
FINANCE 92 14 15 %
-----------------------------------------------------
AUTO 40 5 13 %
JETS 9 1 11 %
INDMATER 92 9 10 %
NASD-100 88 9 10 %
RETAIL 53 5 9 %
HACKERS 25 2 8 %
SOFTWARE 66 5 8 %
FOOD 15 1 7 %
GREEN 31 2 6 %
BIOTECH 386 25 6 %
SEMI 131 6 5 %
SOLAR 21 1 5 %
BEVERAGE 20 1 5 %
ELECTRON 179 8 4 %
OILGAS 144 6 4 %
COMODITY 71 3 4 %
REGBANKS 33 1 3 %
REIT 178 5 3 %
ETFS 65 1 2 %
CHINA 64 1 2 %
----------------------------------------------------
None: COMPUTER COAL GOLD EDU PIPELINE
BONDFUND HOSPITAL
|
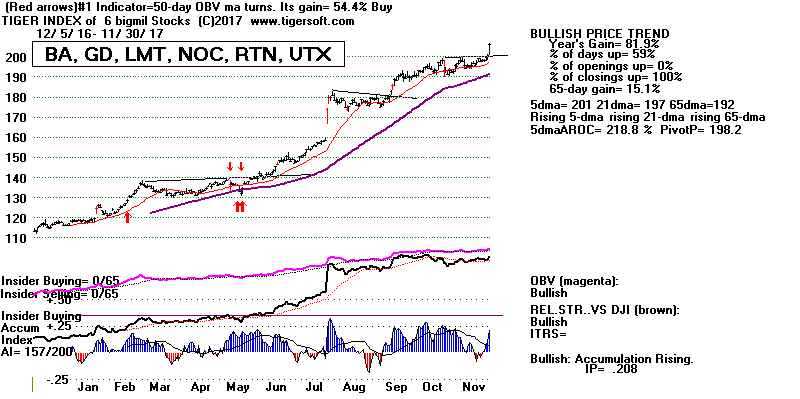 |
 Table 4

RANKING OF KEY DIRECTORIES BASED PCT.OF STOCKS ABOVE 65-DMA
              11/30/17
 Bullish = 40
 Bearish = 6
---------------------------------------------------------------------------------------
Directory     Current       day-1         day-2         day-3         day-4         day-5
----------------------------------------------------------------------------------------
BIGBANKS       100%          1             1             .714          1             1
BIGMIL         100%          .833          .833          .833          .833          .666
DJI-13         100%          1             1             .846          1             .923
INFRA          100%          1             .909          .545          .727          .636
TRANSP         .95           .9            .65           .4            .6            .5
REGBANKS       .909          1             .909          .696          .696          .727
JETS           .888          .888          .777          .666          .777          .777
DOWJONES       .866          .866          .866          .733          .833          .766
FINANCE        .858          .858          .826          .684          .728          .76
EDU            .857          .857          1             .714          .857          .857
HOMEBLDG       .823          .823          .823          .823          .882          .882
SP-100         .822          .77           .729          .604          .656          .645
RETAIL         .811          .849          .698          .584          .603          .547
MORNSTAR       .785          .794          .794          .735          .768          .747
SP500          .773          .751          .718          .641          .672          .664
NIFTY          .766          .766          .866          .833          .833          .833
CHEM           .753          .784          .815          .769          .738          .784
GAMING         .75           .75           .75           .714          .714          .678
INDEXES        .743          .753          .697          .661          .661          .656
RUS-1000       .743          .733          .706          .635          .655          .651
COMPUTER       .739          .739          .782          .652          .695          .695
MILITARY       .736          .631          .736          .684          .657          .684
AUTO           .725          .8            .725          .65           .6            .65
HACKERS        .72           .72           .76           .76           .76           .76
UTILITY        .72           .767          .813          .744          .697          .697
GREEN          .709          .677          .709          .645          .645          .645
---------------------------------------------------------------------------------------------
INSURANC       .656          .75           .687          .625          .625          .625
ELECTRON       .653          .659          .743          .743          .77           .765
SOFTWARE       .636          .651          .742          .712          .712          .712
NASD-100       .625          .636          .681          .659          .67           .681
SEMI           .625          .618          .732          .748          .778          .786
INDMATER       .608          .565          .63           .597          .641          .641
BEVERAGE       .6            .5            .45           .45           .45           .45
FOOD           .6            .6            .533          .533          .666          .666
OILGAS         .597          .5            .52           .486          .59           .597
CHINA          .578          .578          .671          .656          .687          .718
SOLAR          .571          .571          .619          .666          .666          .666
ETFS           .553          .6            .8            .738          .738          .707
COMODITY       .535          .549          .521          .563          .577          .535
REIT           .505          .522          .505          .556          .595          .556
============================================================================================
BIOTECH        .479          .445          .461          .463          .476          .468
COAL           .375          .25           .5            .375          .5            .5
HOSPITAL       .375          .375          .125          0             0             0
GOLD           .163          .122          .244          .265          .224          .265
BONDFUND       .063          .063          .135          .099          .162          .162
PIPELINE       0             0             .142          .142          .142          0
N=6
|
=========================================================================
=========================================================================
11/29/2017 The Peerless signal remains the
very bullish
September Buy B21
Banks
stocks may become the new market leaders, for good reasons.
As a technician, I am bound to
say that it is the DJI's flat-top breakout into all-time high
territory (i.e. the new
Peerless Buy B10) which is bringing the current challenge by the DJI of
24000. It remains to be
seen if the DJI will be able to power through this resistance and
possibly start a swift vertical
ascent above all apparent resistance and points where sellers
can bunch their orders.
Technically, we should appreciate the historical bullishness of our
September B21. These Buys
have averaged a gain on 17.3% in their eight previous cases.
This alone should keep us fully
engaged in the rally. So should the fact that December has
brought a gain in the DJI more
than 70% of the time going back to 1915.
What
should we make of today's weakness in tech stocks? The
lesson of the last
year's similar sell-offs in
this group is that these declines quickly "peter out". As soon
as they close back above their
5-day pivot-points, I would rate them as buys again.
Today's high volatility (surging financials and
falling tech stocks) is simply, I would say,
a case of lots of money being
shifted into what is considered a "sure thing", bank stocks.
De-regulation of the industry
seems a certainty for as long as Trump is President, as long
as the CFPB, the agency charged
with watch-dogging big banks, is run by a man who
ridicules banking regulations
at every chance and as long as Jerome Powell is Fed Chairman.
It is not clear that these
folks want any outsiders to tell big banks what they must do. So,
for the foreseeable future,
this means lots more loans, more riskier loans, de-emphasized compliance
protocols and much higher
profits, all of which will soon be taxed at a lot lower rate. And if
the tax-cut does stimulate the
economy, as is very likely, banking should be even more profitable.
Given this very bullish outlook
for bank stocks, I believe, Professionals are now rushing to shift
a lot more funds into
FAS and into both big banks and regional banks.
Today, some of that
money came out of the exuberant
tech sector stocks. Traders saw the trend-breaks in
QQQ, SOXL,
AAPL,
ADBE ... TECL,
etc. and they hastily all tried to lock in profits at once. Quick
sell-offs like
we saw today in these tech
stocks have happened a couple of time this past year after a Peerless
Buy B10 on the DJIA. See
the DJI-NASDAQ chart below. In
the past, these tech sell-offs
quickly ended. I suspect the
same will be true here once they can rise back above their
5-day ma pivot points.
See these pivot-points in Table 1 further below.
The renewed strength
in FAS and Bank stocks is good for the DJI. A new bear market
is not likely to occur while
they are strong. Moreover, if war with North Korea was,
in fact, imminent, I think we
would not be seeing them rising. Watch Goldman
Sachs,
especially, because of how well
"connected" it is to the decision-makers that run
the country.
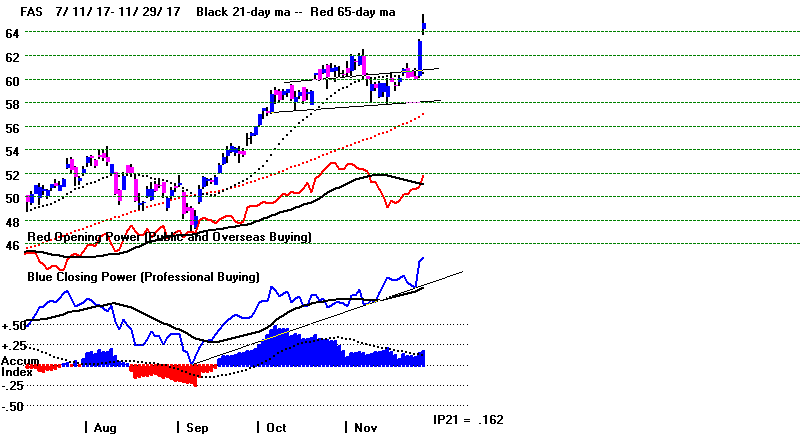 .
.

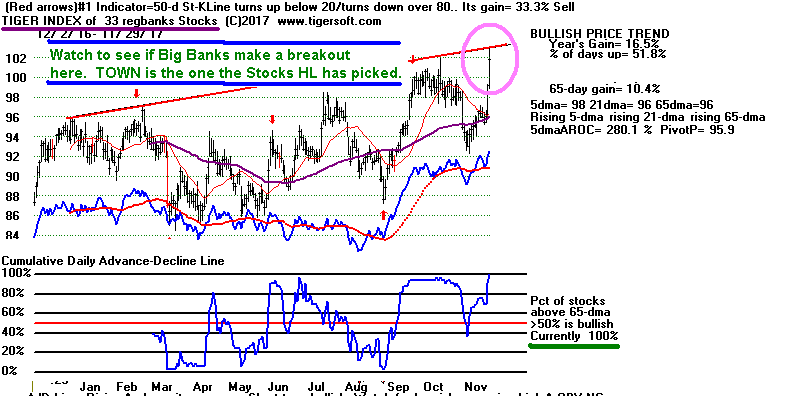
------------------------ DJI and Peerless Signals and Internal Strength
Indicators
------------------------------------------------------------------------------------------------------------------------------

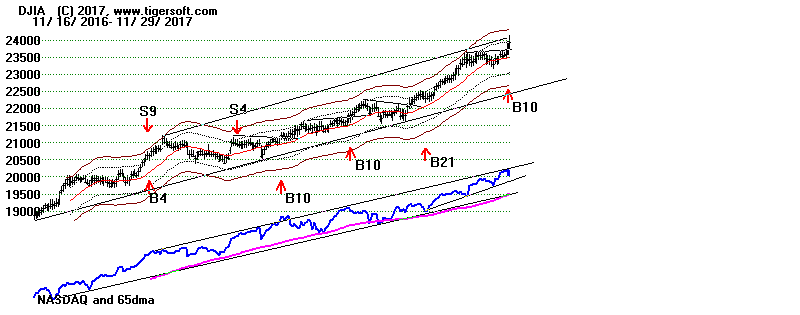 ""
""


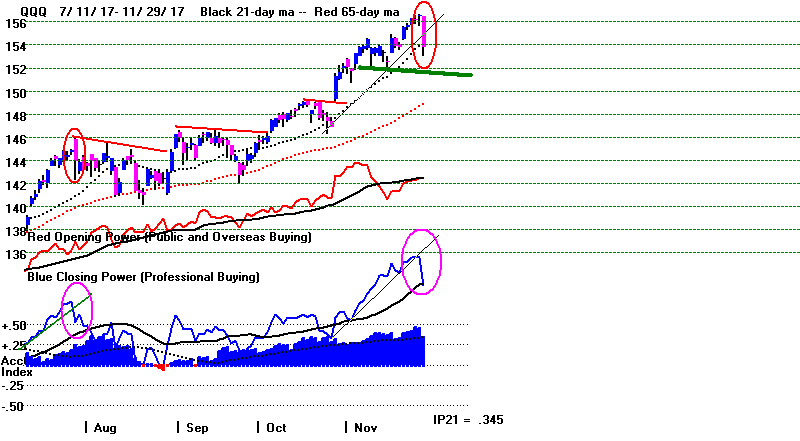 |
Charts 11/29/2017
PEERLESS
DJI, Signals, Indicators Daily DJI
Volume 10-DayUp/Down Vol
DJI-AROC
Hourly DJIA
A/D Line for All Stocks
NASDAQ
S&P
OEX
NYSE
COMPQX
DJI-15 DJI-20
DJI-30
DIA
SPY
QQQ MDY
IWM TNA
CrudeOil
FAS
GLD
BBH
IBB
JETS
JNUG
KOL
NUGT
OIH
OIL
RSX
RETL
SDS
SLV
SOXL
TECL
TMF
TNA UGA
(gasoline)
XIV YINN
Commodities:
JJC, NIB,
CHOC
CORN,
WEAT
UUP
(Dollar)
AAPL ADBE
ALXN AMAT
AMGN AMD
AMZN
BA BABA BAC
BIDU
CAT
CVX
FB
GOOG
GS
HD
IBM
JPM M
(Macy's)
MSFT
NFLX
NVDA
QCOM
TSLA TXN
XOM WMT
ANDV (refinery),
CMG (Chipotle),
LRCX, SWKS,
TOWN New -
SPPI
(small Biotech)
11/29/2017
Bullish MAXCPs Bearish
MINCPs
|
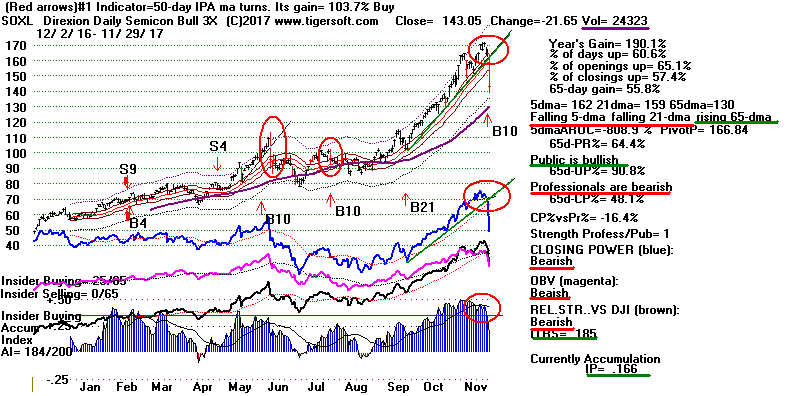 |
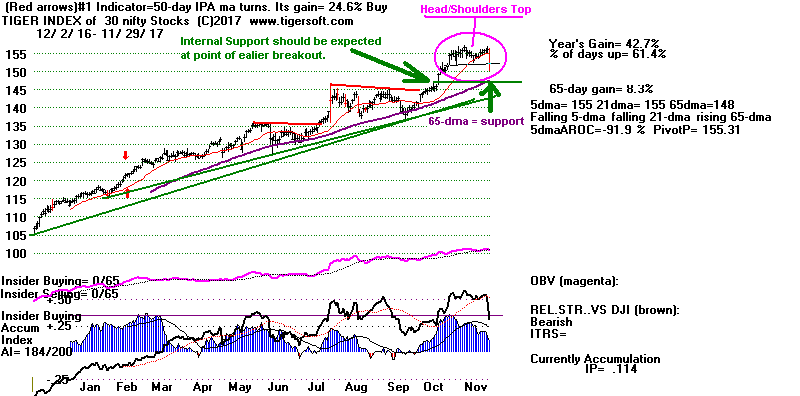
Components of Tiger's Nifty-30 Index.
AAPL ADBE ADP ADSK ALGN AMAT AMT AMZN ATVI AVGO CHDN CPA CTAS
EQIX EXPD FB FISV GOOG HD ISRG LMT MSFT MU NVDA NVR PCLN PLUS TSLA
VRTX
|
Table 1
QuickSilver
Documentation
This is for short-term trading
leveraged ETFs.
It also provides a useful short-term outlook of these sectors ETF's
and the sectors they represewnt
Blue is Bullish
and
Red is Bearish.
1 Candle-Stick color is shortest-term. This
changes when close vis-a-vis opening changes.
So, in stocks or ETFs that advanced a long ways, traders should sell
when a higher
opening gives way to a decline that brings a drop below the previous
day's close.
2 5-dma AROC and Close-versus- pivot point is next
most short-term.
W = warning. Close is below PIVOT-Point.
3 Closing Power trend-direction vs. its 21-dma is next
most short-term.
4 IP21 is used to spot divergences and to estimate
underlying support.
5 > IP21 falling and below +.15 and its 21-dma is bearish in
an over-extended ETF, especially
when its Closing Power is falling and is below its 21-dma.
> IP21 below 07 with AROC below .07 is less likely to bring a rally
back up from 21-dma.
6 Note price trend-lines, support/resistance and price
patterns on charts.
QUICKSILVER on ETFS - 11/29/17
Bullish Across-the-Board: DIA, MDY, FAS, RETL,
Table 1
ETF      CLOSE   CHANGE     PIVOT-PT      5-dma AROC   CL-PWR      CANDLE  IP21   ITRS
---------------------------------------------------------------------------------------------
DIA       239.42    1.08     235.17        78.1%       Bullish      BLUE   .227     ---
---------------------------------------------------------------------------------------------
COMPQX    6824.39   -87.97  W6867.36      -27.7%       Bullish      RED    .403    -.015
---------------------------------------------------------------------------------------------
SPY       262.71   -.16      259.76        52.2%       Bullish      RED    .331    -.02
---------------------------------------------------------------------------------------------
QQQ       153.86   -2.73    W155.69       -52.5%       ----         RED    .345    -.016
---------------------------------------------------------------------------------------------
MDY       343.93    1.56     338.19        81.4%       Bullish      BLUE   .222     .004
---------------------------------------------------------------------------------------------
IWM       153.37    .51      150.89        75.4%       Bullish      ----   .156    -.001
---------------------------------------------------------------------------------------------
FAS       64.74    1.58      60.14         319.5%      Bullish      BLUE   .162     .143
---------------------------------------------------------------------------------------------
RETL      33.13    2.3       28.47         856.1%      Bullish      BLUE   .243     .164
---------------------------------------------------------------------------------------------
SOXL      143.05   -21.65   W166.84       -808.9%      Bearish      RED    .167     .185
---------------------------------------------------------------------------------------------
TECL      108.57   -7.56    W113.44       -230.5%      ----         RED    .35      .139
---------------------------------------------------------------------------------------------
IBB       311.27   -.04     W312.52        9%          Bearish      ----  -.005    -.127
---------------------------------------------------------------------------------------------
GLD       122.6    .58       119.46        142.2%      Bullish      BLUE   .092    -.007
---------------------------------------------------------------------------------------------
OIL       6.15   -.07         W6.23        56.3%       Bullish      RED    .179     .116
---------------------------------------------------------------------------------------------
OIH       24.12    .1       W24.29         18.7%       Bearish      BLUE   .056    -.099
---------------------------------------------------------------------------------------------
GASL      21.66    .17      W22.43         6.9%        Bearish      ----   .191     .018
---------------------------------------------------------------------------------------------
UGA       31.28   -.52      W31.71        -73.6%       ----         RED    .25      .021
---------------------------------------------------------------------------------------------
UUP       24.25   -.01      W24.24        -37.1%       Bearish      ----  -.017    -.053
---------------------------------------------------------------------------------------------
IEF       106.03   -.34     W106.37        0%          Bearish      ----   .02     -.081
---------------------------------------------------------------------------------------------
CORN      16.92    .2       W17.03        -17.8%       ----         BLUE  -.181    -.092
---------------------------------------------------------------------------------------------
WEAT      6.1    .07        W6.2          -81.7%       Bearish       ----  .082    -.138
---------------------------------------------------------------------------------------------
YINN      33.84   -2.09     W37.78        -506.1%      Bearish      RED    .077     .023
---------------------------------------------------------------------------------------------
RSX       21.8   -.49       W22.51        -82.8%       Bearish      RED   -.148    -.068
---------------------------------------------------------------------------------------------
AAPL      169.48   -3.59    W174.96       -105.1%      Bearish      RED    .141    -.003
---------------------------------------------------------------------------------------------
GOOG      1021.66   -25.75  W1035.96      -61.5%       Bullish      RED    .148     .037
---------------------------------------------------------------------------------------------
MSFT      83.34   -1.54      83.11        -22.7%       ----         RED    .123     .034
---------------------------------------------------------------------------------------------
AMZN      1161.27   -32.33   1156.16       92.7%       Bullish      RED    .119     .127
---------------------------------------------------------------------------------------------
FB        175.13   -7.29    W180.87       -184.7%      Bearish      RED    .127    -.056
---------------------------------------------------------------------------------------------
NVDA     196.42   -14.29    W214.93       -457.5%      Bearish      RED    .047    -.022
---------------------------------------------------------------------------------------------
BA        269.3    1.31      265.15        43.4%       Bullish      RED    .106    -.004
---------------------------------------------------------------------------------------------
GS        241.36    1.95     236.43        70.5%       Bearish      RED   -.083    -.016
|
Table 2
COMPARISONS OF BULLISH AND BEARISH
NUMBERS
11/29 11/28
11/27 11/24 11/21 11/20 11/17
11/16 11/15 11/14 11/13 11/10
11/9 11/8
NEWHIGHS 500 582 209
439 615 363 244 273 71
198 191
164 157 324
NEWLOWS 57 265 59 31 62 50 229 150
111 150
113 98 93 93
-----------------------------------------------------------------------------------------------------------
MAXCPs 262 320 101 166 406 339 295 321
154 276 259
167 171 188
MINCPs 110
93
94 42 63 52 40
74
105 192
150
138
130
145
-----------------------------------------------------------------------------------------------------------
TTTNHs
161 143 79 110 196 172 169
154
89 125 101
88 82 83
TTTNLs
230 124 144
66 186 184 79 78 211
259 203
237 297 278
----------------------------------------------------------------------------------------------------------
FASTUP
130 141 143 205 245 189 158
148 121 146
148 190 209 208
FASTDOWN
97 74 64 58 72 100 136
177 253
249 260
221 250 259
|
 Table 3
            Count of Stocks and New Highs in Key Tiger Directories
Date = 171129
               No.          NHs            Pct.
-------------------------------------------------------------------
-------------------------------------------------------------------
HOMEBLDG       17            9             53 %
BIGBANKS       7             3             43 %
REGBANKS       33            11            33 %
DJI-13         13            4             31 %
EDU            7             2             29 %
TRANSP         20            5             25 %
FINANCE        92            22            24 %
DOWJONES       30            7             23 %
MORNSTAR       238           51            21 %
INDEXES        195           39            20 %
GAMING         28            5             18 %
BIGMIL         6             1             17 %
NIFTY          30            5             17 %
MILITARY       38            6             16 %
SP500          486           78            16 %
INSURANC       32            5             16 %
SP-100         96            14            15 %
RUS-1000       839           127           15 %
-------------------------------------------------------
CHEM           65            8             12 %
RETAIL         53            6             11 %
JETS           9             1             11 %
AUTO           39            4             10 %
UTILITY        43            4             9 %
INDMATER       91            6             7 %
NASD-100       88            6             7 %
GREEN          31            2             6 %
BEVERAGE       20            1             5 %
HACKERS        25            1             4 %
BIOTECH        386           14            4 %
REIT           178           8             4 %
ELECTRON       179           5             3 %
SOFTWARE       66            2             3 %
ETFS           65            1             2 %
OILGAS         144           3             2 %
SEMI           131           1             1 %
----------------------------------------------
None:  INFRA     CHINA      SOLAR  COMPUTER   COAL
GOLD   PIPELINE  COMODITY   FOOD   BONDFUND   HOSPITAL
|
| |
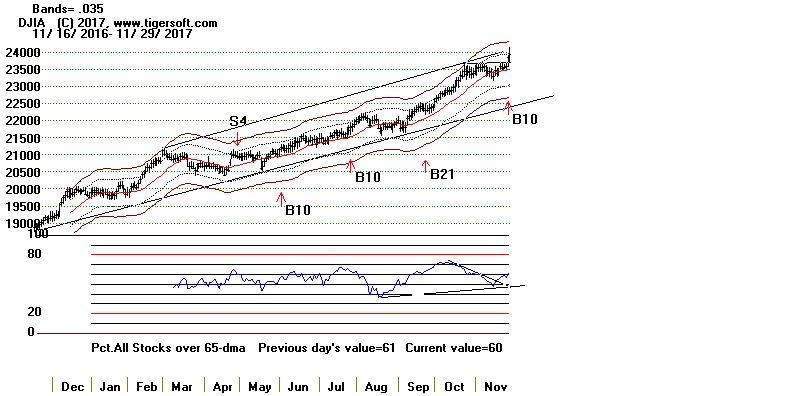 |
Table 4
 RANKING OF KEY DIRECTORIES BASED PCT.OF STOCKS ABOVE 65-DMA
                           11/29/17
 Bullish = 38
 Bearish = 6
---------------------------------------------------------------------------------------
Directory     Current       day-1         day-2         day-3         day-4         day-5
----------------------------------------------------------------------------------------
BIGBANKS       1             1             .714          1             1             1
DJI-13         1             1             .846          1             .923          .923
INFRA          1             .909          .545          .727          .636          .727
REGBANKS       1             .909          .696          .696          .757          .757
TRANSP         .9            .65           .4            .6            .6            .45
JETS           .888          .777          .666          .777          .777          .666
DOWJONES       .866          .866          .733          .833          .8            .766
FINANCE        .858          .826          .684          .728          .75           .782
EDU            .857          1             .714          .857          .857          .857
RETAIL         .849          .698          .584          .603          .547          .509
BIGMIL         .833          .833          .833          .833          .666          .833
HOMEBLDG       .823          .823          .823          .882          .882          .941
============================================================================================
AUTO           .794          .717          .641          .589          .641          .615
MORNSTAR       .794          .794          .735          .768          .747          .731
CHEM           .784          .815          .769          .738          .784          .784
SP-100         .77           .729          .604          .656          .645          .625
UTILITY        .767          .813          .744          .697          .697          .697
NIFTY          .766          .866          .833          .833          .833          .833
INDEXES        .753          .697          .661          .661          .661          .646
SP500          .751          .718          .641          .672          .67           .67
GAMING         .75           .75           .714          .714          .678          .678
INSURANC       .75           .687          .625          .625          .625          .625
COMPUTER       .739          .782          .652          .695          .695          .652
RUS-1000       .733          .706          .635          .655          .656          .656
HACKERS        .72           .76           .76           .76           .76           .72
GREEN          .677          .709          .645          .645          .645          .677
ELECTRON       .659          .743          .743          .77           .765          .77
SOFTWARE       .651          .742          .712          .712          .712          .666
NASD-100       .636          .681          .659          .67           .681          .67
MILITARY       .631          .736          .684          .657          .71           .684
SEMI           .618          .732          .748          .778          .793          .809
ETFS           .6            .8            .738          .738          .692          .707
FOOD           .6            .533          .533          .666          .666          .533
CHINA          .578          .671          .656          .687          .718          .765
INDMATER       .571          .637          .604          .648          .648          .604
SOLAR          .571          .619          .666          .666          .666          .761
COMODITY       .549          .521          .563          .577          .535          .535
REIT           .522          .505          .556          .595          .556          .601
============================================================================================
BEVERAGE       .5            .45           .45           .45           .45           .5
OILGAS         .5            .52           .486          .59           .597          .52
============================================================================================
BIOTECH        .445          .461          .463          .476          .481          .443
HOSPITAL       .375          .125          0             0             0             0
COAL           .25           .5            .375          .5            .5            .5
GOLD           .125          .25           .27           .229          .27           .187
BONDFUND       .063          .135          .099          .162          .162          .171
PIPELINE       0             .142          .142          .142          0             .142
N = 6
|
================================================================================
================================================================================
11/28/2017 The Peerless signal remains the
very bullish
September Buy B21
Santa came weeks ahead of schedule for the Big Banks and Wall Street.
The bulls are stampeding on Wall Street. The major markets should all
go higher, at least until the tax cut legislation is finally signed.
Note the new
B10 and V-I of =38.
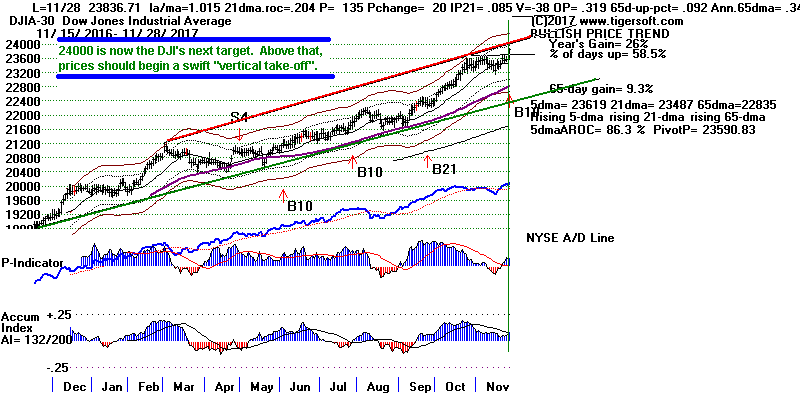
Next year's new Fed Chairman Powell told Senator Warren that he could not
see any area of banking where regulations needed to be tightened.
Pres.
Trump's appointment to be acting head of the CFPB assured reporters that
the President had won a mandate to dismantle all onerous regulations on big
banks.
And the Senate may vote as early as later this week on the new tax cuts for
big corporations and the wealthy. With all there was for Wall Street
to celebrate,
it was a little disappointing that breadth was only a little more than 2:1,
advancers over
decliners. Semi-conductors, which were in over-bought territory,
actually fell
a little today.
Still, who's complaining? All the major market indexes were up,
especially
the DJIA and FAS,
representing banks. Peerless generated a reinforcing
Buy B10
today despite the fact that the V-Indicator was a negative -38.
In the past, how significant is that? There have been 14 closed-out
B10s with a
negative V-I key value. They averaged a DJI gain of 4.2% when the next
Peerless
Sell signal occurred. Often the lack of volume de-energized the rally.
5 of the 14
either brought small losses or less than a 0.7% gain. All paper losses
were small except
one case in 2015, which saw an unusually large paper loss of 8.2%.
What's important now is that the DJI has broken out of its trading range
into all-time
high territory. The path of least resistance is up.
Professionals are joining in and
buying aggressively. Just as the DJI did not sell off in September and
that was
a clear sign of strength, so too, the DJI has hardly pulled back in this
normally weak
period just after Thanksgiving. We are in an unusually bullish market.
Most of this new
money is flowing into the leading ETFs (shown in Blue in Table 1), the
Nifty-30 stocks
and the bullish MAXCPs.
Now is not a good time to sell short. If it were, we
would be seeing a lot more Bearish
MINCPs than we now are getting.
              Signal    DJI        Gain       Low      Max.Paper Loss
-------------------------------------------------------------------------
19500315      B10       207.5      .063       206.1    -.007    3/31
              1.019   .234     8  39   .213   -83   .108   .066   .24
               la/ma  AROC     P-I ch  IP21   V-I   OBVPct 65dch  65-dma AROC
              NH and flat top breakout.
-------------------------------------------------------------------------
19570611      B10       509.5      .015       497.1    -.024     6/24
              1.012   .265      -32 13  .063  -216   .086  .08    .29
                                ^^^           ^^^^
              Overhead resistance. Immediately fell back 3%.
-------------------------------------------------------------------------
19590224      B10       602.9      .078       none       0
              1.023   .137       37  4  -.056 -110   .078  .067   .25
                                              ^^^^
              NH
--------------------------------------------------------------------------
19640701      B10       838.1      .120       823.4    -.018     8/6
              1.024   .354       74 36   .006  -17   .456  .03   .11
                                         low   ^^^
              NH
--------------------------------------------------------------------------
19640909      B10       855.6      .097       none       0
              1.018   .372       67  4   .038  -22   .316  .069   .24
                                         low   ^^^
              NH
--------------------------------------------------------------------------
19840802      B10      1166.07     .106       none       0
              1.046    .34      -33  48  .106   0    .100   -.015  -.06
                                ^^^            ^^^
              overhead resistance, but nice flat top breakout.
---------------------------------------------------------------------------
19960129      B10      5304.98     .046       none       0
              1.029    .484       88   9 .198  -7      .190  .115    .42
                                               ^^^
              flat top breakout and NH.
----------------------------------------------------------------------------
20050304      B10      10940.85   -.003       none       0
              1.017    .381     151   40 .093   -15    .146  .049    .18
                                                ^^^
              Breakout but a Peerless Sell signal followed the next day.
----------------------------------------------------------------------------
20120314      B10      13194.10   -.005       13124.6  -.005       3/21
              1.019    .295     129  -148 .069 -24     .245   .099     .360
                                               ^^^
              Breakout and NH but Peerless Sell followed a few days later.
----------------------------------------------------------------------------
20131114      B10      15821.63    .040       15739.4  -.005       12/12
              1.017    .384     187  -44 .168  -4      .119   .035     .13
              NH                               ^^^
----------------------------------------------------------------------------
20140918      B10      17265.99    .001       none       0
              1.011    .242     -35  -8  .103 -28      .236   .027     .10
                                ^^^           ^^^
              Breakout and NH, but Peerless Sell S17 followed the next day.
----------------------------------------------------------------------------
20150224      B10      19209.19    .006       17635.3  -.082       3/11
              1.025    .36     296   50  .223  -1      .145   .029     .22
                                               ^^^
              Breakout and NH, but 8% pullback started a few days later.
----------------------------------------------------------------------------
20160711      B10      18226.93    .006       18034.7  -.011       9/14
              1.025    .162   305   88   .04  -30     -.025   .039     .14
                                         low  ^^^^    ^^^^^
              Breakout and NH, but DJI ran out of energy and soon steadily fell back.
------------------------------------------------------------------------------
20170602      B10      21206.29     open      none      0
              1.012    .141   225   50   .121 -35      .03    .004     .010
                                              ^^^^
              NH - Trade is open.
-------------------------------------------------------------------------------
20170727      B10      21796.55    open       none      0
              1.013    .269   275   30   .007 -5       .137    .038    .14
                                         low  ^^^
              NH - Trade is open.
--------------------------------------------------------------------------
20071128      B10      23836.71    open
              1.015    .204  135    20   .085 -38      .319    .092    .34
                                              ^^^
====================================================================================
|
Charts 11/28/2017
PEERLESS
DJI, Signals, Indicators Daily DJI
Volume 10-DayUp/Down Vol
DJI-AROC
Hourly DJIA
A/D Line for All Stocks
NASDAQ
S&P
OEX
NYSE
COMPQX
DJI-15 DJI-20
DJI-30
DIA
SPY
QQQ MDY
IWM TNA
CrudeOil
FAS
GLD
BBH
IBB
JETS
JNUG
KOL
NUGT
OIH
OIL
RSX
RETL
SDS
SLV
SOXL
TECL
TMF
TNA UGA
(gasoline)
XIV YINN
Commodities:
JJC, NIB,
CHOC
CORN,
WEAT
UUP
(Dollar)
AAPL ADBE
ALXN AMAT
AMGN AMD
AMZN
BA BABA BAC
BIDU
CAT
CVX
FB
GOOG
GS
HD
IBM
JPM M
(Macy's)
MSFT
NFLX
NVDA
QCOM
TSLA TXN
XOM WMT
ANDV (refinery),
CMG (Chipotle),
LRCX, SWKS,
TOWN New -
SPPI
(small Biotech)
11/28/2017
Bullish MAXCPs Bearish
MINCPs
|
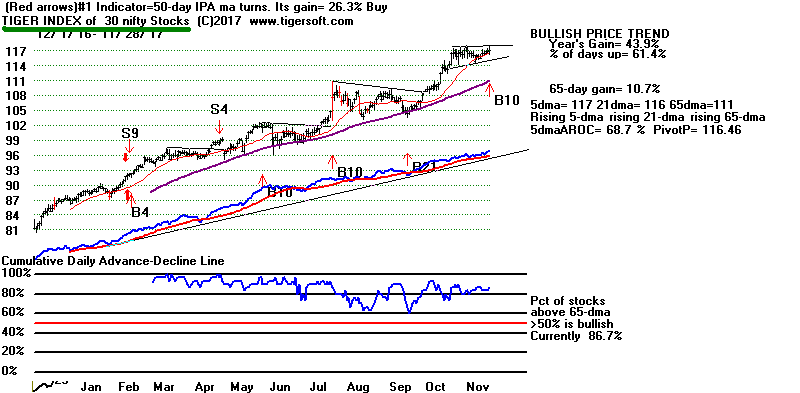
Components of Tiger's Nifty-30 Index.
AAPL ADBE ADP ADSK ALGN AMAT AMT AMZN ATVI AVGO CHDN CPA CTAS
EQIX EXPD FB FISV GOOG HD ISRG LMT MSFT MU NVDA NVR PCLN PLUS TSLA
VRTX |
Table 1
QuickSilver
Documentation
This is for short-term trading
leveraged ETFs.
It also provides a useful short-term outlook of these sectors ETF's
and the sectors they represewnt
Blue is Bullish
and
Red is Bearish.
1 Candle-Stick color is shortest-term. This
changes when close vis-a-vis opening changes.
So, in stocks or ETFs that advanced a long ways, traders should sell
when a higher
opening gives way to a decline that brings a drop below the previous
day's close.
2 5-dma AROC and Close-versus- pivot point is next
most short-term.
W = warning. Close is below PIVOT-Point.
3 Closing Power trend-direction vs. its 21-dma is next
most short-term.
4 IP21 is used to spot divergences and to estimate
underlying support.
5 > IP21 falling and below +.15 and its 21-dma is bearish in
an over-extended ETF, especially
when its Closing Power is falling and is below its 21-dma.
> IP21 below 07 with AROC below .07 is less likely to bring a rally
back up from 21-dma.
6 Note price trend-lines, support/resistance and price
patterns on charts.
QUICKSILVER on ETFS - 11/28/17
ETF      CLOSE   CHANGE     PIVOT-PT   5-dma AROC   CL-PWR   CANDLE    IP21    ITRS
---------------------------------------------------------------------------------------------
---------------------------------------------------------------------------------------------
DIA       238.34    2.61     235.73        89.1%   Bullish     BLUE   .171     -----
---------------------------------------------------------------------------------------------
COMPQX    6912.36    33.84   6862.48       88.7%   Bullish     BLUE   .429     .003
---------------------------------------------------------------------------------------------
SPY       262.87    2.64     259.99        88%     Bullish     BLUE   .336    -.015
---------------------------------------------------------------------------------------------
QQQ       156.59    .4       155.5         88.7%   Bullish      ----  .449     .008
---------------------------------------------------------------------------------------------
MDY       342.37    4.67     338.41        90.4%   Bullish     BLUE   .194     .001
---------------------------------------------------------------------------------------------
IWM       152.86    2.37     151.09        110.6%  Bullish     BLUE   .171    -.002
---------------------------------------------------------------------------------------------
FAS       63.16    3.15      60.85         260.6%  Bullish     BLUE   .138     .131
---------------------------------------------------------------------------------------------
RETL      30.83    2.57      28.2          261.5%  Bullish     BLUE   .189     .05
---------------------------------------------------------------------------------------------
SOXL      164.7   -.15       170.16        12.8%   Bullish     RED    .339     .393
---------------------------------------------------------------------------------------------
TECL      116.13    .94      113.86        248.2%  Bullish     BLUE   .497     .248
---------------------------------------------------------------------------------------------
IBB       311.31    .86      310.71        47.9%   Bearish     BLUE  -.001    -.131
---------------------------------------------------------------------------------------------
GLD       122.6    .58       119.46        142.2%  Bullish     BLUE   .092    -.004
---------------------------------------------------------------------------------------------
OIL       6.22    0          6.08          178.1%  Bullish     ----   .187     .119
---------------------------------------------------------------------------------------------
OIH       24.02    .15      W24.03         2.1%    ----        BLUE   .109    -.101
---------------------------------------------------------------------------------------------
GASL      21.49    .28      W21.63        -59.4%   ----        BLUE   .19      .002
---------------------------------------------------------------------------------------------
UGA       31.8   -.37        31.75         89.6%   Bullish     RED    .278     .039
---------------------------------------------------------------------------------------------
UUP       24.26    .1       W24.43        -41.2%   ----        BLUE  -.034    -.053
---------------------------------------------------------------------------------------------
IEF       106.37    .02      106.03        16.9%   Bearish     RED    .019    -.076
---------------------------------------------------------------------------------------------
CORN      16.72   -.11      W16.98        -85.5%   Bearish     RED   -.2      -.108
---------------------------------------------------------------------------------------------
WEAT      6.03    -.02       W6.2        -105.8%   Bearish     ----   .032    -.146
---------------------------------------------------------------------------------------------
YINN      35.93    .77      W37.55         166.2%  Bullish     BLUE   .117     .101
---------------------------------------------------------------------------------------------
RSX       22.29    .08       22.17         103.4%  Bearish     ----  -.112    -.039
---------------------------------------------------------------------------------------------
AAPL      173.07   -1.02    W173.14        89.1%   Bullish     RED    .182     .023
---------------------------------------------------------------------------------------------
GOOG      1047.41   -6.8     1034.49       140%    Bullish     RED    .22      .077
---------------------------------------------------------------------------------------------
MSFT      84.88    1.01      83.72         141.1%  Bullish     BLUE   .197     .061
---------------------------------------------------------------------------------------------
AMZN      1193.6   -2.23     1139.49       289.9%  Bullish     RED    .185     .157
---------------------------------------------------------------------------------------------
FB        182.42   -.61      181.86        101.4%  Bullish     RED    .261     .005
---------------------------------------------------------------------------------------------
NVDA     210.71   -3.43     W216.05       -78.3%   Bearish     RED    .114     .055
---------------------------------------------------------------------------------------------
BA        267.99    2.41     266.99        63.2%   Bullish     BLUE   .092    -.009
---------------------------------------------------------------------------------------------
GS        239.41    4.3      238.02        27%     ----        BLUE  -.042    -.016
|
Table 2
COMPARISONS OF BULLISH AND BEARISH
NUMBERS
11/28
11/27 11/24 11/21 11/20 11/17
11/16 11/15 11/14 11/13 11/10
11/9 11/8 11/7
NEWHIGHS 582 209
439 615 363 244 273 71
198 191
164 157 324 255
NEWLOWS 265 59 31 62 50 229 150
111 150
113 98 93 93 103
-----------------------------------------------------------------------------------------------------------
MAXCPs 320 101 166 406 339 295 321
154 276 259
167 171 188
114
MINCPs
93
94 42 63 52 40
74
105 192
150
138
130
145
213
-----------------------------------------------------------------------------------------------------------
TTTNHs 143 79 110 196 172 169
154
89 125 101
88 82 83
67
TTTNLs
124 144
66 186 184 79 78 211
259 203
237 297 278
352
----------------------------------------------------------------------------------------------------------
FASTUP
141 143 205 245 189 158
148 121 146
148 190 209 208
187
FASTDOWN 74 64 58 72 100 136
177 253
249 260
221 250 259 259
|
 Table 3
Count of Stocks and New Highs in Key Tiger Directories
Date = 171128
               No.          NHs            Pct.
-------------------------------------------------------------------
HOMEBLDG       17            8             47 %
BIGMIL         6             2             33 %
INDEXES        195           63            32 %
DJI-13         13            4             31 %
EDU            7             2             29 %
DOWJONES       30            8             27 %
MILITARY       38            10            26 %
MORNSTAR       238           59            25 %
REGBANKS       33            8             24 %
GAMING         28            6             21 %
INFRA          11            2             18 %
SP500          486           87            18 %
NIFTY          30            5             17 %
SOFTWARE       66            11            17 %
RUS-1000       839           144           17 %
FINANCE        92            15            16 %
SP-100         96            15            16 %
INSURANC       32            5             16 %
NASD-100       88            14            16 %
RETAIL         53            8             15 %
===================================================================
SOLAR          21            3             14 %
COMPUTER       23            3             13 %
CHEM           65            8             12 %
HACKERS        25            3             12 %
UTILITY        43            5             12 %
ELECTRON       179           19            11 %
GREEN          31            3             10 %
INDMATER       91            9             10 %
BEVERAGE       20            2             10 %
AUTO           39            3             8 %
FOOD           15            1             7 %
ETFS           65            4             6 %
SEMI           131           8             6 %
BIOTECH        386           21            5 %
TRANSP         20            1             5 %
OILGAS         144           4             3 %
CHINA          64            2             3 %
COMODITY       71            2             3 %
REIT           178           3             2 %
BONDFUND       111           1             1 %
===================================================================
BIGBANKS       7                           0 %
COAL           8                           0 %
GOLD           48                          0 %
PIPELINE       7                           0 %
HOSPITAL       8                           0 %
JETS           9                           0 %
|
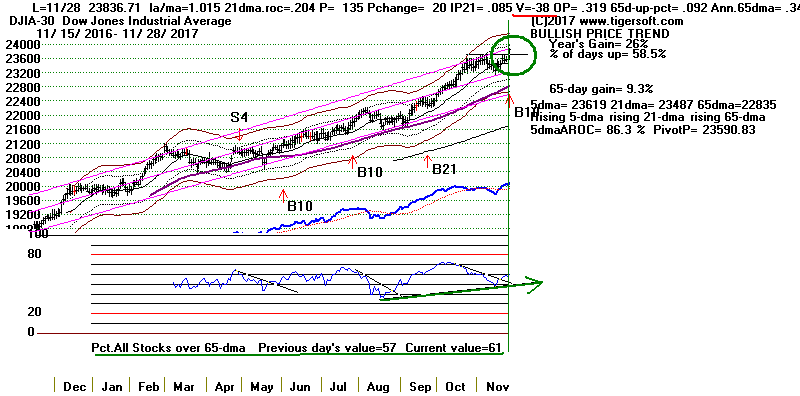 |
Table 4
 RANKING OF KEY DIRECTORIES BASED PCT.OF STOCKS ABOVE 65-DMA
                             11/28/17
Bullish = 39
Bearish = 6
---------------------------------------------------------------------------------------
Directory     Current       day-1         day-2         day-3         day-4         day-5
----------------------------------------------------------------------------------------
BIGBANKS       100%          .714          1             1             1             1
DJI-13         100%          .846          1             .923          .923          .846
EDU            100%          .714          .857          .857          .857          .857
INFRA          .909          .545          .727          .636          .727          .727
REGBANKS       .909          .696          .696          .757          .757          .757
DOWJONES       .866          .733          .833          .8            .766          .733
NIFTY          .866          .833          .833          .833          .833          .833
BIGMIL         .833          .833          .833          .666          .833          .5
FINANCE        .826          .684          .728          .75           .782          .771
HOMEBLDG       .823          .823          .882          .882          .941          .882
CHEM           .815          .769          .738          .784          .784          .753
UTILITY        .813          .744          .697          .697          .697          .651
ETFS           .8            .738          .738          .692          .707          .538
--------------------------------------------------------------------------------------------
MORNSTAR       .794          .735          .768          .747          .726          .693
COMPUTER       .782          .652          .695          .695          .652          .695
JETS           .777          .666          .777          .777          .666          .666
HACKERS        .76           .76           .76           .76           .72           .64
GAMING         .75           .714          .714          .678          .678          .714
ELECTRON       .743          .743          .77           .765          .776          .776
SOFTWARE       .742          .712          .712          .712          .666          .651
MILITARY       .736          .684          .657          .71           .684          .631
SEMI           .732          .748          .778          .793          .816          .816
SP-100         .729          .604          .656          .645          .635          .593
SP500          .718          .641          .672          .67           .67           .66
AUTO           .717          .641          .589          .641          .615          .615
GREEN          .709          .645          .645          .645          .677          .645
RUS-1000       .706          .635          .655          .656          .656          .636
RETAIL         .698          .584          .603          .547          .509          .622
INDEXES        .697          .661          .661          .661          .646          .646
INSURANC       .687          .625          .625          .625          .625          .687
NASD-100       .681          .659          .67           .681          .67           .647
CHINA          .671          .656          .687          .718          .75           .718
TRANSP         .65           .4            .6            .6            .45           .35
INDMATER       .637          .604          .648          .648          .604          .582
SOLAR          .619          .666          .666          .666          .761          .761
FOOD           .533          .533          .666          .666          .6            .466
COMODITY       .521          .563          .577          .535          .549          .492
OILGAS         .52           .486          .59           .597          .52           .5
REIT           .505          .556          .595          .556          .601          .516
------------------------------------------------------------------------------------------
COAL           .5            .375          .5            .5            .5            .625
-----------------------------------------------------------------------------------------------
BIOTECH        .461          .463          .476          .481          .45           .419
BEVERAGE       .45           .45           .45           .45           .5            .5
GOLD           .25           .27           .229          .27           .187          .229
PIPELINE       .142          .142          .142          0             .142          0
BONDFUND       .135          .099          .162          .162          .162          .108
HOSPITAL       .125          0             0             0             0             0
N= 6
|
==================================================================
11/27/2017 The Peerless signal remains the
very bullish
September Buy B21
Expect higher prices but hold back on new commitments.
Since Mondays often bring on a brief wave of public selling in an on-going
bull market,
today's mild decline can be viewed as constructive and bullish. Most
investors seem
unwilling to take profits this year if taxes on trading profits will be much
less next year.
And like others, we are waiting to see if December brings its usual boost to
the market.
As long as the Fed does not make any menacing comments about "Inflation" and
the need to raise rates to fight it, we should still see higher prices.
One way or another,
a big tax cut is likely. It's that prospect which should sustain the
bulls a while longer.
However, I would wait before putting new funds to work. The DJI's
21-day momentum
(the 21-day AROC) has almost turned flat.
Big banks are under a cloud. JPM shows
an unmistakable head/shoulders pattern.
Biotechs cannot find their footing. And many
tech stocks look quite over-bought and in need of some sort of a pullback.
Historically,
the DJI rises only 43% of the time over the next week and 47% over the next
two weeks.
That, at least, has been its pattern since 1965.
The good news, first, is that there are few attractive
Bearish MINCP stocks. This
shows
that even bearish Professionals are betting on a Santa Claus rally.
Secondly, gold stocks
remain in the doldrums. If the general market were about to decline, I
would expect gold
stocks to have rallied 20% -30% recently. Thirdly, semi-conductor leadership
historically
is bullish. If the market were about to top out, they would show
head/shoulders patterns.
And fourthly, our September Buy B21 has, as you know, a powerful history.
Tiger's Nifty-30 Still Looks Strong
and Healthy.
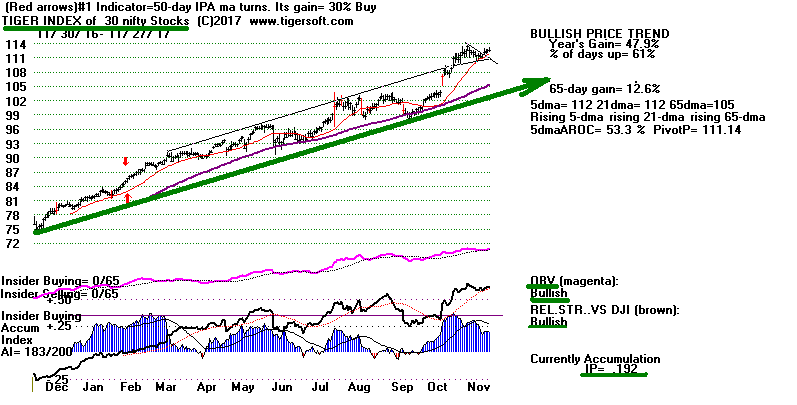
Components of Tiger's Nifty-30 Index.
AAPL ADBE ADP ADSK ALGN AMAT AMT AMZN ATVI AVGO CHDN CPA CTAS
EQIX EXPD FB FISV GOOG HD ISRG LMT MSFT MU NVDA NVR PCLN PLUS TSLA
VRTX |
Tiger Index of DJI=s 13 Highest Priced Stocks looks somewhat
vulnerable because
of possible H/S top pattern.
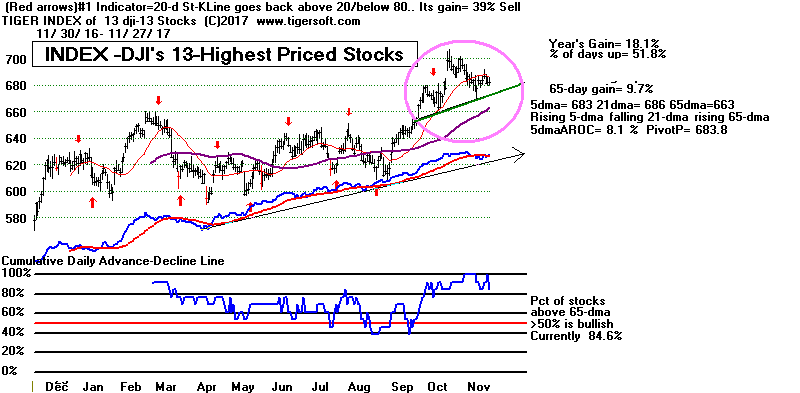 |
Charts 11/27/2017
PEERLESS
DJI, Signals, Indicators Daily DJI
Volume 10-DayUp/Down Vol
DJI-AROC
Hourly DJIA
A/D Line for All Stocks
NASDAQ
S&P
OEX
NYSE
COMPQX
DJI-15 DJI-20
DJI-30
DIA
SPY
QQQ MDY
IWM TNA
CrudeOil
FAS
GLD
BBH
IBB
JETS
JNUG
KOL
NUGT
OIH
OIL
RSX
RETL
SDS
SLV
SOXL
TECL
TMF
TNA UGA
(gasoline)
XIV YINN
Commodities:
JJC, NIB,
CHOC
CORN,
WEAT
UUP
(Dollar)
AAPL ADBE
ALXN AMAT
AMGN AMD
AMZN
BA BABA BAC
BIDU
CAT
CVX
FB
GOOG
GS
HD
IBM
JPM M
(Macy's)
MSFT
NFLX
NVDA
QCOM
TSLA TXN
XOM WMT
ANDV (refinery),
CMG (Chipotle),
LRCX, SWKS,
TOWN New -
SPPI
(small Biotech)
11/27/2017
Bullish MAXCPs Bearish
MINCPs
|
Table 1
QuickSilver
Documentation
This is for short-term trading
leveraged ETFs.
It also provides a useful short-term outlook of these sectors ETF's
and the sectors they represewnt
Blue is Bullish
and
Red is Bearish.
1 Candle-Stick color is shortest-term. This
changes when close vis-a-vis opening changes.
So, in stocks or ETFs that advanced a long ways, traders should sell
when a higher
opening gives way to a decline that brings a drop below the previous
day's close.
2 5-dma AROC and Close-versus- pivot point is next
most short-term.
W = warning. Close is below PIVOT-Point.
3 Closing Power trend-direction vs. its 21-dma is next
most short-term.
4 IP21 is used to spot divergences and to estimate
underlying support.
5 > IP21 falling and below +.15 and its 21-dma is bearish in
an over-extended ETF, especially
when its Closing Power is falling and is below its 21-dma.
> IP21 below 07 with AROC below .07 is less likely to bring a rally
back up from 21-dma.
6 Note price trend-lines, support/resistance and price
patterns on charts.
QUICKSILVER on ETFS - 11/27/17
ETF      CLOSE   CHANGE     PIVOT-PT      5-dma AROC   CL-PWR    CANDLE    IP21    ITRS
---------------------------------------------------------------------------------------------
DIA       235.73    .26      234.15        49.8%      Bullish      BLUE   .132     ----
---------------------------------------------------------------------------------------------
COMPQX    6878.52   -10.64   6790.71       70%        Bullish      RED    .429     .007
---------------------------------------------------------------------------------------------
SPY       260.23   -.13      258.3         45.7%      Bullish      RED    .32     -.015
---------------------------------------------------------------------------------------------
QQQ       156.19   -.07      153.83        72.2%      Bullish      ----   .467     .01
---------------------------------------------------------------------------------------------
MDY       337.7   -.64       336.26        39%        Bullish      RED    .19     0
---------------------------------------------------------------------------------------------
IWM       150.49   -.46      149.53        67.9%      Bullish      RED    .162    -.003
---------------------------------------------------------------------------------------------
FAS       60.01   -.25      W60.02         48.2%      Bullish      RED    .097     .102
---------------------------------------------------------------------------------------------
RETL      28.26    .06      W29.34        -31.5%      ----         BLUE  -.012    -.053
---------------------------------------------------------------------------------------------
SOXL      164.85   -6.45     164.27        185.9%     Bullish      RED    .377     .461
---------------------------------------------------------------------------------------------
TECL      115.19    .04      110.49        257.9%     Bullish      BLUE   .496     .247
---------------------------------------------------------------------------------------------
IBB       310.45   -2.18     308.33       -12.2%      Bearish      RED    .009    -.124
---------------------------------------------------------------------------------------------
GLD       122.6    .58       119.46        142.2%     Bullish      BLUE   .092     .005
---------------------------------------------------------------------------------------------
OIL       6.22   -.14        6             138.3%     Bullish      ----   .258     .123
---------------------------------------------------------------------------------------------
OIH       23.87   -.36      W24.01        -55.9%      ----         RED    .14     -.09
---------------------------------------------------------------------------------------------
GASL      21.21   -1.25     W21.75        -288.9%     ----         RED   .219     .025
---------------------------------------------------------------------------------------------
UGA       32.17    0         31.23         118.5%     Bullish      ----   .341     .057
---------------------------------------------------------------------------------------------
UUP       24.16    .03      W24.46        -37%        Bearish      BLUE  -.12     -.046
---------------------------------------------------------------------------------------------
IEF       106.35    .07      106.01        8%         ----         ----   .078    -.072
---------------------------------------------------------------------------------------------
CORN      16.83   -.1       W17.01        -41.2%      Bearish      RED  -.172    -.102
---------------------------------------------------------------------------------------------
WEAT      6.05   -.07       W6.16         -145.6%     Bearish      RED    .013    -.14
---------------------------------------------------------------------------------------------
YINN      35.16   -1.68      34.72         199.3%     ----         RED    .114     .119
---------------------------------------------------------------------------------------------
RSX       22.21   -.27       21.83         63.1%      Bearish      RED  -.063    -.048
---------------------------------------------------------------------------------------------
AAPL      174.09   -.88      169.98        114.1%     Bullish      RED    .241     .029
---------------------------------------------------------------------------------------------
GOOG      1054.21    13.6    1018.38       170.5%     Bullish      BLUE   .122     .086
---------------------------------------------------------------------------------------------
MSFT      83.87    .61       82.53         88.5%      ----         BLUE   .018     .054
---------------------------------------------------------------------------------------------
AMZN      1195.83    9.83    1126.31       287.3%     Bullish      RED    .341     .152
---------------------------------------------------------------------------------------------
FB        183.03    .25      178.74        111.5%     Bullish      BLUE   .353     .007
---------------------------------------------------------------------------------------------
NVDA     214.14   -2.82     W214.08        64.7%      ----         RED    .179     .129
---------------------------------------------------------------------------------------------
BA        265.58   -.3       264.63        62.6%      Bullish      BLUE   .011     .007
---------------------------------------------------------------------------------------------
GS        235.11   -.84     W238.13       -61.3%      Bearish      RED   -.076    -.016
|
Table 2
COMPARISONS OF BULLISH AND BEARISH
NUMBERS
11/27
11/24 11/21 11/20 11/17 11/16
11/15 11/14 11/13 11/10 11/9
11/8 11/7 11/6
NEWHIGHS 209
439 615 363 244 273 71
198 191
164 157 324 255
466
NEWLOWS 59 31 62 50 229 150
111 150
113 98 93 93 103
96
-----------------------------------------------------------------------------------------------------------
MAXCPs 101 166 406 339 295 321
154 276 259
167 171 188
114
164
MINCPs
94 42 63 52 40
74
105 192
150
138
130
145
213 136
-----------------------------------------------------------------------------------------------------------
TTTNHs
79 110 196 172 169
154
89 125 101
88 82 83
67 95
TTTNLs
144
66 186 184 79 78 211
259 203
237 297 278
352 218
----------------------------------------------------------------------------------------------------------
FASTUP
143 205 245 189 158
148 121 146
148 190 209 208
187 239
FASTDOWN 64 58 72 100 136
177 253
249 260
221 250 259 259 194
|
Table 3
Sector New Highs
               No.          NHs            Pct
-----------------------------------------------------------------
GAMING         28            4             14 %
NASD-100       88            11            13 %
COMPUTER       23            2             9 %
DJI-13         13            1             8 %
MILITARY       38            3             8 %
SOFTWARE       66            5             8 %
DOWJONES       30            2             7 %
SP-100         96            7             7 %
SP500          486           34            7 %
RUS-1000       839           55            7 %
HOMEBLDG       17            1             6 %
RETAIL         53            3             6 %
ETFS           65            3             5 %
ELECTRON       179           9             5 %
MORNSTAR       238           13            5 %
BIOTECH        386           20            5 %
SOLAR          21            1             5 %
UTILITY        43            2             5 %
BEVERAGE       20            1             5 %
INDEXES        195           8             4 %
HACKERS        25            1             4 %
SEMI           131           5             4 %
AUTO           40            1             3 %
CHEM           65            2             3 %
INSURANC       32            1             3 %
FINANCE        92            2             2 %
INDMATER       91            2             2 %
CHINA          64            1             2 %
REIT           178           4             2 %
OILGAS         144           2             1 %
COMODITY       71            1             1 %
-----------------------------------------------
None   BIGBANKS  BIGMIL  GREEN   REGBANKS   INFRA
TRANSP COAL    GOLD   EDU    PIPELINE   FOOD
BONDFUND  HOSPITAL   JETS
|
 |
Table 4
 RANKING OF KEY DIRECTORIES BASED PCT.OF STOCKS ABOVE 65-DMA
            11/27/17
Bullish = 36
Bearish = 10
---------------------------------------------------------------------------------------
Directory     Current       day-1         day-2         day-3         day-4         day-5
----------------------------------------------------------------------------------------
DJI-13         .846          1             .923          .923          .846          .846
BIGMIL         .833          .833          .666          .833          .5            .333
NIFTY          .833          .833          .833          .833          .866          .833
HOMEBLDG       .823          .882          .882          .941          .882          .882
==========================================================================================
CHEM           .769          .738          .784          .784          .753          .707
HACKERS        .76           .76           .76           .72           .64           .6
SEMI           .748          .778          .793          .816          .816          .793
UTILITY        .744          .697          .697          .697          .651          .627
ELECTRON       .743          .77           .765          .776          .776          .743
ETFS           .738          .738          .692          .707          .538          .569
MORNSTAR       .735          .768          .747          .726          .697          .693
DOWJONES       .733          .833          .8            .766          .733          .733
BIGBANKS       .714          1             1             1             1             .857
EDU            .714          .857          .857          .857          .857          .857
GAMING         .714          .714          .678          .678          .714          .678
SOFTWARE       .712          .712          .712          .666          .651          .59
REGBANKS       .696          .696          .757          .757          .757          .666
FINANCE        .684          .728          .75           .782          .782          .684
MILITARY       .684          .657          .71           .684          .657          .605
JETS           .666          .777          .777          .666          .666          .666
SOLAR          .666          .666          .666          .761          .761          .809
INDEXES        .661          .661          .661          .646          .651          .682
NASD-100       .659          .67           .681          .67           .659          .67
CHINA          .656          .687          .718          .75           .718          .703
COMPUTER       .652          .695          .695          .652          .739          .608
AUTO           .65           .6            .65           .625          .625          .55
GREEN          .645          .645          .645          .677          .645          .645
SP500          .641          .672          .67           .67           .664          .65
RUS-1000       .635          .655          .656          .656          .64           .631
INSURANC       .625          .625          .625          .625          .687          .656
INDMATER       .604          .648          .648          .604          .582          .538
SP-100         .604          .656          .645          .635          .593          .593
RETAIL         .584          .603          .547          .509          .622          .584
COMODITY       .563          .577          .535          .549          .521          .619
REIT           .556          .595          .556          .601          .522          .516
INFRA          .545          .727          .636          .727          .727          .727
FOOD           .533          .666          .666          .6            .533          .6
============================================================================================
OILGAS         .486          .59           .597          .52           .52           .562
BIOTECH        .463          .476          .481          .45           .424          .435
BEVERAGE       .45           .45           .45           .5            .5            .45
TRANSP         .4            .6            .6            .45           .35           .3
COAL           .375          .5            .5            .5            .625          .625
GOLD           .27           .229          .27           .187          .229          .312
PIPELINE       .142          .142          0             .142          0             0
BONDFUND       .099          .162          .162          .162          .099          .153
HOSPITAL       0             0             0             0             0             0
N= 10
|
=========================================================================
11/24/2017 The Peerless signal remains the
very bullish
September Buy B21.
QQQ, TECL and
SOXL are the strongest ETFs at this point.
See Table 1.
Their Closing Powers and 5-day moving averages are rising. They show
high Accumulation and bullish blue candle-sticks. But they are already
up a lot. So adding new positions to them may not be so prudent.
Instead, our Stocks' Hotline is suggesting doing some selling if they
reach their upper bands.
The DJI's AROC is in a downtrend.
Its 21-dma is flattening out. This often
results in a shallow decline.
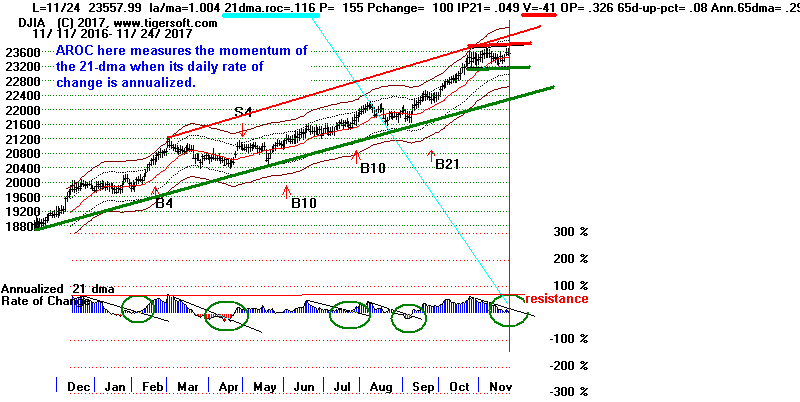
A shallow retreat and consolidation after
Thanksgiving week for
DIA would be in keeping with that holiday's tradition.
Since 1965,
the DJI has fallen slightly (-0.3%) on average over the next week
and has risen only 45.1% of the time. At this time, the AROC
(annualized rate of change) for the DJI is falling and near zero. It
will need to break its downtrend or the DJI is apt to fall back 2%-3%,
test its support and, perhaps, tag its lower band. That, at least, is
what
usually happens when the DJI's AROC is in a downtrend. Another
concern is the relative weakness shown now by the
DJI-13, the highest
priced of the DJI-30. Why are the Big Banks
not doing better? The
head/shoulders pattern in JPM will probably
also need to be aborted for
the DJI to show some renewed strength. The
Hourly DJI's DISI-OBV Line
also will need to firm up and break its downtrend.
Biotechs Are Due for A Rally.
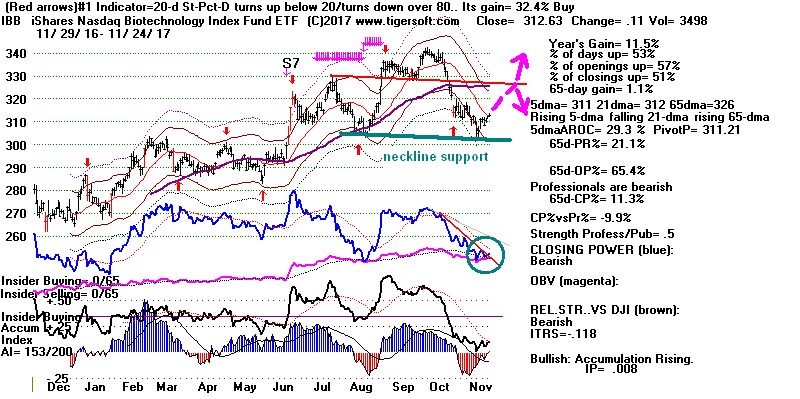
Traders might want to consider taking a different approach here in
picking some new long positions in preparation for a December rally.
Most biotechs have fallen back along with the general weakness
of BBH and IBB. But a few have not.
I culled through the sector and
found a dozen small biotechs that are making Closing Power new highs
and show good Accumulation and unusual relative strength. Traders
might want to look them over here. As long as their Closing Powers
are rising, I would think that they will do well next month. The
Biotechs
below look the most promising to me at this time. However, they are
thinly traded, so buy carefully.
DJIA -
11/24/2017.
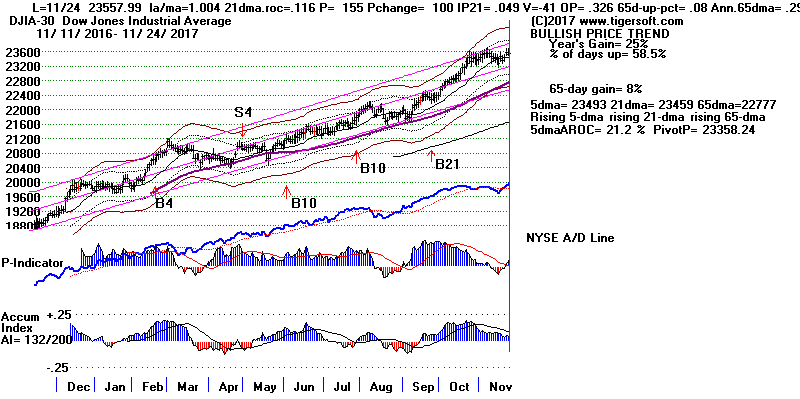
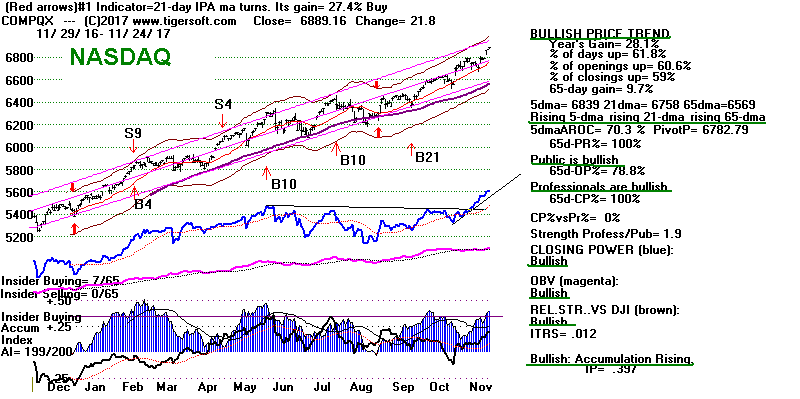
Charts 11/24/2017
PEERLESS
DJI, Signals, Indicators Daily DJI
Volume 10-DayUp/Down Vol
DJI-AROC
Hourly DJIA
A/D Line for All Stocks
NASDAQ
S&P
OEX
NYSE
COMPQX
DJI-15 DJI-20
DJI-30
DIA
SPY
QQQ MDY
IWM TNA
CrudeOil
FAS
GLD
BBH
IBB
JETS
JNUG
KOL
NUGT
OIH
OIL
RSX
RETL
SDS
SLV
SOXL
TECL
TMF
TNA UGA
(gasoline)
XIV YINN
Commodities:
JJC, NIB,
CHOC
CORN,
WEAT
UUP
(Dollar)
AAPL ADBE
ALXN AMAT
AMGN AMD
AMZN
BA BABA BAC
BIDU
CAT
CVX
FB
GOOG
GS
HD
IBM
JPM M
(Macy's)
MSFT
NFLX
NVDA
QCOM
TSLA TXN
XOM WMT
ANDV (refinery),
CMG (Chipotle),
LRCX, SWKS,
TOWN New -
SPPI
(small Biotech)
11/24/2017
Bullish MAXCPs Bearish
MINCPs |
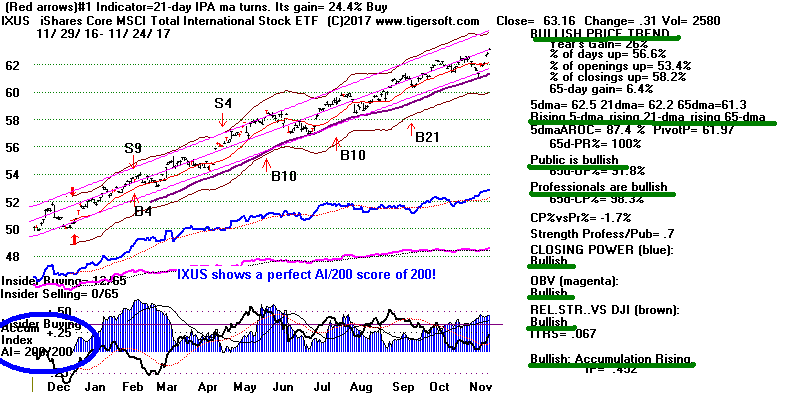 |
Table 1
QuickSilver
Documentation
This is for short-term trading
leveraged ETFs.
It also provides a useful short-term outlook of these sectors ETF's
and the sectors they represewnt
Blue is Bullish
and
Red is Bearish.
1 Candle-Stick color is shortest-term. This
changes when close vis-a-vis opening changes.
So, in stocks or ETFs that advanced a long ways, traders should sell
when a higher
opening gives way to a decline that brings a drop below the previous
day's close.
2 5-dma AROC and Close-versus- pivot point is next
most short-term.
W = warning. Close is below PIVOT-Point.
3 Closing Power trend-direction vs. its 21-dma is next
most short-term.
4 IP21 is used to spot divergences and to estimate
underlying support.
5 > IP21 falling and below +.15 and its 21-dma is bearish in
an over-extended ETF, especially
when its Closing Power is falling and is below its 21-dma.
> IP21 below 07 with AROC below .07 is less likely to bring a rally
back up from 21-dma.
6 Note price trend-lines, support/resistance and price
patterns on charts.
QUICKSILVER on ETFS - 11/24/17
ETF      CLOSE   CHANGE     PIVOT-PT    5-dma AROC   CL-PWR   CANDLE    IP21   ITRS
---------------------------------------------------------------------------------------------
DIA       235.47    .3       233.39        11.9%     Bullish      RED    .11    ----
---------------------------------------------------------------------------------------------
COMPQX    6889.16    21.8    6782.79       70.3%     Bullish      BLUE   .397   .012
---------------------------------------------------------------------------------------------
SPY       260.36    .6       257.86        33.6%     Bullish      ----   .296  -.018
---------------------------------------------------------------------------------------------
QQQ       156.26    .57      153.95        55.6%     Bullish      BLUE   .418   .014
---------------------------------------------------------------------------------------------
MDY       338.34    .15      335.07        62.1%     Bullish      RED    .272   .002
---------------------------------------------------------------------------------------------
IWM       150.95    .06      148.45        106.3%    Bullish      RED    .185   .005
---------------------------------------------------------------------------------------------
FAS       60.26    .12       59.43         36.6%     Bullish      RED    .107   .115
---------------------------------------------------------------------------------------------
RETL      28.2   -.27       W28.44         315.9%    ----         RED    .01   -.029
---------------------------------------------------------------------------------------------
SOXL      171.3    4.46      158.67        319.8%    Bullish      BLUE   .445   .601
---------------------------------------------------------------------------------------------
TECL      115.15    1.71     109.39        174.1%    Bullish      BLUE   .412   .262
---------------------------------------------------------------------------------------------
IBB       312.63    .11      311.21        29.3%     Bearish      RED   .008  -.118
---------------------------------------------------------------------------------------------
GLD       122.6    .58       119.46        142.2%    Bullish      BLUE   .092   .005
---------------------------------------------------------------------------------------------
OIL       6.36    .13        6.05          413.6%    Bullish      ----   .304   .162
---------------------------------------------------------------------------------------------
OIH       24.23   -.06       24.14         93.6%     ----         RED    .173  -.072
---------------------------------------------------------------------------------------------
GASL      22.46    .03      W22.49         207.1%    ----         RED    .292   .077
---------------------------------------------------------------------------------------------
UGA       32.17    .46       31.42         211.9%    Bullish      BLUE   .369   .08
---------------------------------------------------------------------------------------------
UUP       24.13   -.11      W24.34        -57.4%     Bearish      ----  -.05   -.05
---------------------------------------------------------------------------------------------
IEF       106.28   -.09      106.18        11.3%     Bearish      ----  -.011  -.071
---------------------------------------------------------------------------------------------
CORN      16.93   -.1       W16.97         70.9%     Bearish      RED   -.164  -.094
---------------------------------------------------------------------------------------------
WEAT      6.12   -.08       W6.23         -32.3%     Bearish      RED    .042  -.119
---------------------------------------------------------------------------------------------
YINN      36.84   -.94       33.72         362.3%    Bullish      RED    .116   .201
---------------------------------------------------------------------------------------------
RSX       22.48   -.03       21.93         186.2%    Bullish      ----  -.057  -.032
---------------------------------------------------------------------------------------------
AAPL      174.97    .01      170.15        112.6%    Bullish      RED   .253   .046
--------------------------------------------------------------------------------------------
GOOG      1040.61    4.65    1019.09       39.4%     Bullish      BLUE   .01    .066
---------------------------------------------------------------------------------------------
MSFT      83.26    .15       82.4          3.6%      ----         BLUE  -.071   .054
---------------------------------------------------------------------------------------------
AMZN      1186    29.84      1129.88       214%      Bullish      BLUE   .363   .136
---------------------------------------------------------------------------------------------
FB        182.78    1.91     179           88.6%     Bullish      BLUE   .321   .01
---------------------------------------------------------------------------------------------
NVDA     216.96    2.03      211.36        125.2%    ----         BLUE   .237   .222
---------------------------------------------------------------------------------------------
BA        265.88    .73      262.26        41.2%     Bullish      BLUE   .014   .025
---------------------------------------------------------------------------------------------
GS        235.95   -.48     W238.02       -71.9%     Bearish      RED   -.082  -.019
|
Table 2
COMPARISONS OF BULLISH AND BEARISH NUMBERS
11/24
11/21 11/20 11/17 11/16 11/15 11/14
11/13 11/10 11/9 11/8 11/7
11/6 11/3
NEWHIGHS
439 615 363 244 273 71
198 191
164 157 324 255
466 360
NEWLOWS 31 62 50 229 150
111 150
113 98 93 93 103
96 112
-----------------------------------------------------------------------------------------------------------
MAXCPs
166 406 339 295 321
154 276 259
167 171 188
114
164 140
MINCPs
42 63 52 40
74
105 192
150
138
130
145
213 136 180
-----------------------------------------------------------------------------------------------------------
TTTNHs
110 196 172 169
154
89 125 101
88 82 83
67 95
71
TTTNLs
66 186 184 79 78 211
259 203
237 297 278
352 218 311
----------------------------------------------------------------------------------------------------------
FASTUP
205 245 189 158
148 121 146
148 190 209 208
187 239
190
FASTDOWN
58 72 100 136
177 253
249 260
221 250 259 259 194 214
|
Table 3   Sector New Highs
Date = 171124
               No.           NHs           Pct.
-------------------------------------------------------------------
HOMEBLDG       17            7             41 %
NIFTY          30            9             30 %
INDEXES        195           48            25 %
JETS           9             2             22 %
ETFS           65            13            20 %
HACKERS        25            5             20 %
SOLAR          21            4             19 %
GAMING         28            5             18 %
SEMI           131           24            18 %
SOFTWARE       66            12            18 %
ELECTRON       179           31            17 %
MORNSTAR       238           35            15 %
NASD-100       88            13            15 %
BEVERAGE       20            3             15 %
==================================================
CHEM           65            9             14 %
CHINA          64            7             11 %
RUS-1000       839           77            9 %
COMPUTER       23            2             9 %
MILITARY       38            3             8 %
BIOTECH        386           32            8 %
SP500          486           37            8 %
INDMATER       91            6             7 %
COMODITY       71            5             7 %
FOOD           15            1             7 %
SP-100         96            6             6 %
REIT           178           10            6 %
UTILITY        43            2             5 %
FINANCE        92            3             3 %
OILGAS         144           4             3 %
INSURANC       32            1             3 %
RETAIL         53            1             2 %
----------------------------------------------------
None:
BIGBANKS  BIGMIL  GREEN  REGBANKS  AUTO DJI-13
DOWJONES  INFRA   TRANSP COAL      GOLD
EDU       PIPELINE    BONDFUND     HOSPITAL
|
 |
Table 4 RANKING OF KEY DIRECTORIES BASED PCT.OF STOCKS ABOVE 65-DMA
11/24/17
Bullish = 39
Bearish = 6
---------------------------------------------------------------------------------------
Directory Current day-1 day-2 day-3 day-4 day-5
----------------------------------------------------------------------------------------
BIGBANKS 100% 1 1 1 .857 1
DJI-13 100% .923 .923 .846 .846 .923
HOMEBLDG .882 .882 .941 .882 .882 .882
EDU .857 .857 .857 .857 .857 .857
BIGMIL .833 .666 .833 .5 .5 .833
DOWJONES .833 .8 .766 .733 .733 .8
NIFTY .833 .833 .833 .866 .866 .866
N= 7
----------------------------------------------------------------------------------------------
SEMI .778 .793 .816 .816 .786 .755
JETS .777 .777 .666 .666 .666 .777
ELECTRON .77 .765 .776 .776 .743 .715
MORNSTAR .768 .747 .726 .697 .689 .68
HACKERS .76 .76 .72 .64 .64 .64
CHEM .738 .784 .784 .753 .707 .692
ETFS .738 .692 .707 .538 .569 .553
FINANCE .728 .75 .782 .782 .695 .695
INFRA .727 .636 .727 .727 .727 .727
GAMING .714 .678 .678 .714 .678 .678
SOFTWARE .712 .712 .666 .651 .606 .636
UTILITY .697 .697 .697 .651 .627 .697
REGBANKS .696 .757 .757 .757 .696 .696
COMPUTER .695 .695 .652 .739 .608 .565
CHINA .687 .718 .75 .718 .703 .703
SP500 .672 .67 .67 .664 .654 .662
NASD-100 .67 .681 .67 .659 .67 .67
FOOD .666 .666 .6 .533 .6 .466
SOLAR .666 .666 .761 .761 .761 .714
INDEXES .661 .661 .646 .651 .682 .676
MILITARY .657 .71 .684 .657 .631 .631
SP-100 .656 .645 .635 .593 .593 .645
RUS-1000 .655 .656 .656 .64 .637 .644
INDMATER .648 .648 .604 .582 .538 .505
GREEN .645 .645 .677 .645 .645 .58
INSURANC .625 .625 .625 .687 .656 .687
RETAIL .603 .547 .509 .622 .584 .49
AUTO .6 .65 .625 .625 .55 .6
TRANSP .6 .6 .45 .35 .3 .5
REIT .595 .556 .601 .522 .516 .55
OILGAS .59 .597 .52 .52 .569 .534
COMODITY .577 .535 .549 .521 .619 .464
N=32
==============================================================================================
COAL .5 .5 .5 .625 .625 .5
==============================================================================================
BIOTECH .476 .481 .45 .424 .437 .409
BEVERAGE .45 .45 .5 .5 .45 .5
GOLD .244 .285 .204 .224 .306 .183
BONDFUND .16 .16 .16 .098 .151 .125
PIPELINE .142 0 .142 0 0 0
HOSPITAL 0 0 0 0 0 0
N=6
|
=========================================================================
Happy Thanksgiving!
========================================================================= .
11/21/2017 The Peerless signal remains the
very bullish
September Buy B21.
If history
repeats the DJI will not get a Peerless Sell signal until 26,000 is reached
in the
Spring of 2018. That would mean there is another 10% left to the
upside.
So, as we give "Thanks" this week for what the stock market has yielded us,
it may be well to realize, believe it or not, that there is still more
"gravy" ahead.
Resistances from Recent Highs were reached today.
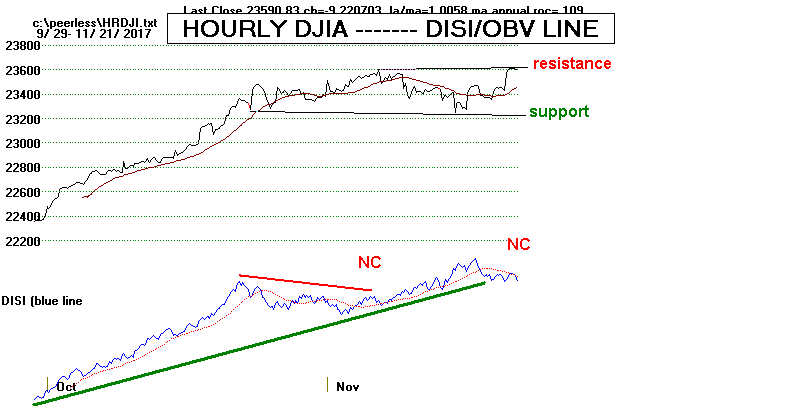
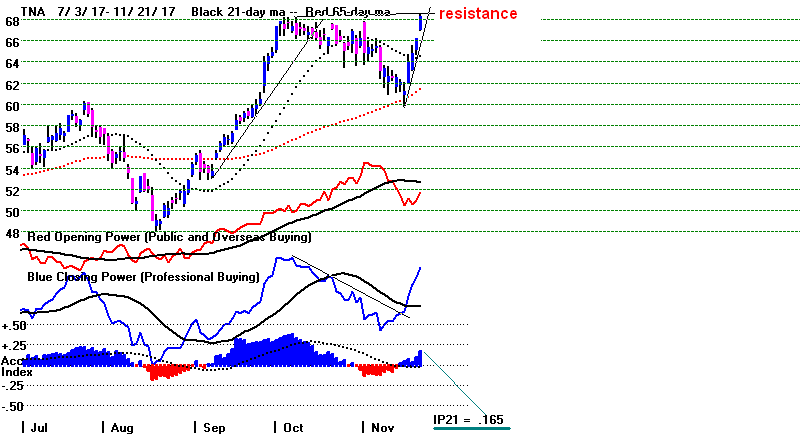
Expect Breakouts above Flat Resistance
Levels Reached Today.
Consider the underlying technicals now. There
were 500+ new highs among NYSE and
NASDAQ stocks. So, the advance is broadening again, not narrowing.
IWM and MDY lept to
new highs today. They are joining the tech ETFs,
SOXL and
TECL ETFs and stocks, which have been the
leaders for months.
Sometimes, there is a bit of indigestion next week. But with the
NYSE A/D Line and the
DJI so close to new 12-month highs, I would not
count on another pullback. New highs
here will probably set off a new surge of Buying. See the Hourly DJI
chart below.
While, it's true that Biotechs are not
participating and RETL's recovery got stalled
today, we should be buoyed that the potential head/shoulders patterns I
mentioned
yesterday are being destroyed and Gold is still
not yet rallying to tell us the advance
is getting dangerous.
As for our former Bearish MINCP shorts, a good many of them have recently
broken their Closing Power downtrends and now the number of MINCPs is
down 150 stocks from its level three weeks ago on November 21st. The
most
bearish looking ETFs now are the negative ETFs. Even the normally
bearish
Day Traders have turned net bullish today. See Table 2.
All things considered, this is a not a market to Sell
yet. The bullish month of December is
just ahead. At the very least, we should not sell until there has been
a climactic
advance up to the DJI's 3.0% upper band spurred on, perhaps, by Trump's tax
cut
finally getting passed by the US Senate.
For now, owning the leading ETFs, as generally
suggested by the Power Rank position
of their representatives among the Leveraged ETFs has to be advised.
Look at how
very high are their IP21 and AI/200 (positive consistency for Accumulation)
are.
Most "Bullish" Power Ranked ETFs in "LEVERAGE"
Group
IP21 AI/200
CP-position
from 65-day low
high.
#1 TECL - ProShares Ultra Technology (3x)
.407 196 100%
#2 TQQQ - ProShares UltraPro QQQ
.423 193 100%
#3 SOXL - Semiconductors (3x)
.452 184 100%
#4 QLD - Ultra QQQ
.404 191 100%
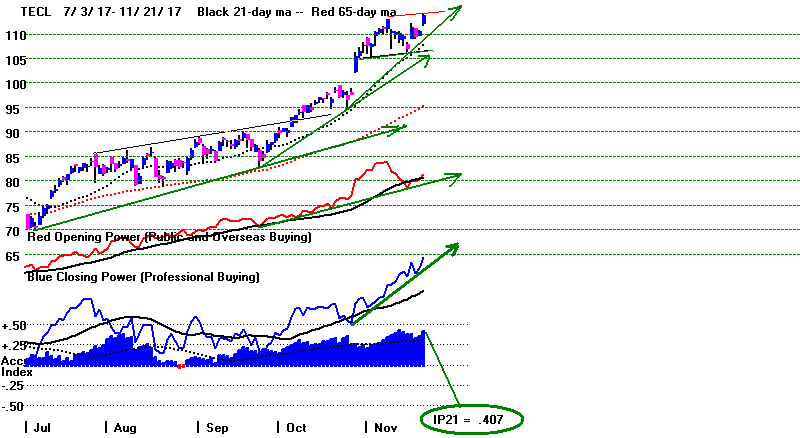
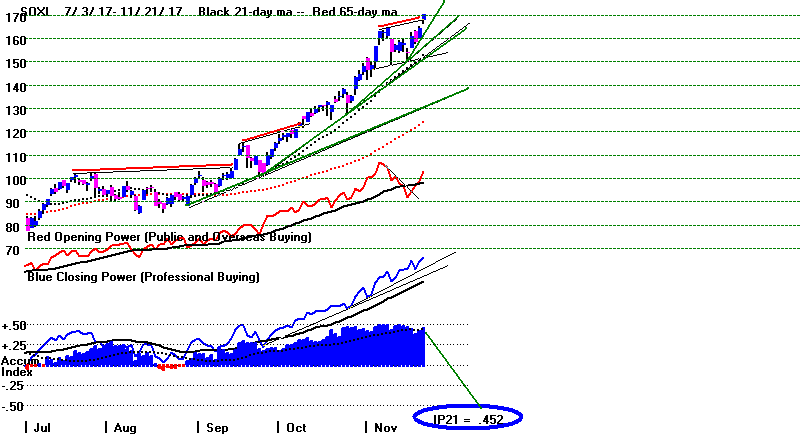
Charts 11/21/2017
PEERLESS
DJI, Signals, Indicators Daily DJI
Volume 10-DayUp/Down Vol
Hourly DJIA
A/D Line for All Stocks
NASDAQ
S&P
OEX
NYSE
COMPQX
DJI-15 DJI-20
DJI-30
DIA
SPY
QQQ
MDY
IWM TNA
CrudeOil
FAS
GLD
BBH
IBB
JETS
JNUG
KOL
NUGT
OIH
OIL
RSX
RETL
SDS
SLV
SOXL
TECL
TMF
TNA UGA
(gasoline)
XIV YINN
Commodities:
JJC, NIB,
CHOC
CORN,
WEAT
UUP
(Dollar)
AAPL ADBE
ALXN AMAT
AMGN AMD
AMZN
BA BABA BAC
BIDU
CAT
CVX
FB
GOOG
GS
HD
IBM
JPM M
(Macy's)
MSFT
NFLX
NVDA
QCOM
TSLA TXN
XOM WMT
ANDV (refinery,
CMG (Chipotle),
LRCX, SWKS,
TOWN New - SPPI
(small Biotech)
11/21/2017
Bullish MAXCPs Bearish
MINCPs |
Table 1
QuickSilver
Documentation
This is for short-term trading
leveraged ETFs.
It also provides a useful short-term outlook of these sectors ETF's
and the sectors they represewnt
Blue is Bullish
and
Red is Bearish.
1 Candle-Stick color is shortest-term. This
changes when close vis-a-vis opening changes.
So, in stocks or ETFs that advanced a long ways, traders should sell
when a higher
opening gives way to a decline that brings a drop below the previous
day's close.
2 5-dma AROC and Close-versus- pivot point is next
most short-term.
W = warning. Close is below PIVOT-Point.
3 Closing Power trend-direction vs. its 21-dma is next
most short-term.
4 IP21 is used to spot divergences and to estimate
underlying support.
5 > IP21 falling and below +.15 and its 21-dma is bearish in
an over-extended ETF, especially
when its Closing Power is falling and is below its 21-dma.
> IP21 below 07 with AROC below .07 is less likely to bring a rally
back up from 21-dma.
6 Note price trend-lines, support/resistance and price
patterns on charts.
QUICKSILVER on ETFS - 11/21/17
ETF      CLOSE   CHANGE     PIVOT-PT   5-dma AROC   CL-PWR    CANDLE   IP21   ITRS
---------------------------------------------------------------------------------------------
DIA       235.73    1.58     232.96        31%     Bullish      BLUE   .132     ----
---------------------------------------------------------------------------------------------
COMPQX    6862.48    71.77   6706.21       92.1%   Bullish      BLUE   .383    -.001
---------------------------------------------------------------------------------------------
SPY       259.99    1.69     256.44        43.8%   Bullish      BLUE   .299    -.025
---------------------------------------------------------------------------------------------
QQQ       155.5    1.67      152.59        71.3%   Bullish      BLUE   .393    -.001
---------------------------------------------------------------------------------------------
MDY       338.41    2.15     330.87        89.9%   Bullish      BLUE   .342    -.005
---------------------------------------------------------------------------------------------
IWM       151.09    1.56     145.63        165.4%  Bullish      BLUE   .201     .003
---------------------------------------------------------------------------------------------
FAS       60.85    .83       59.34         103.1%  Bullish      BLUE   .129     .115
---------------------------------------------------------------------------------------------
RETL      28.2   -1.14       24.97         624.9%   ----        RED    .178    -.027
---------------------------------------------------------------------------------------------
SOXL      170.16    5.89     153.87        380.2%  Bullish      BLUE   .453     .614
---------------------------------------------------------------------------------------------
TECL      113.86    3.37     106.94        202.7%  Bullish      BLUE   .408     .222
---------------------------------------------------------------------------------------------
IBB       310.71    2.38     306.25        91.8%   Bearish      BLUE  -.02     -.138
---------------------------------------------------------------------------------------------
GLD       122.6    .58       119.46        142.2%  Bullish      BLUE   .092     0
---------------------------------------------------------------------------------------------
OIL       6.08    .08        5.86          151.7%  Bullish      BLUE   .272     .144
---------------------------------------------------------------------------------------------
OIH       24.03    .02       23.93        -60.3%   ----         RED    .178    -.058
---------------------------------------------------------------------------------------------
GASL      21.63   -.12       21.36        -64.2%   ----         RED    .278     .166
---------------------------------------------------------------------------------------------
UGA       31.75    .52       31.24         25.6%   Bullish      BLUE   .388     .038
---------------------------------------------------------------------------------------------
UUP       24.43   -.03       24.38         8.2%    Bearish      ----   .004    -.04
---------------------------------------------------------------------------------------------
IEF       106.03    .02     W106.31        4.7%    Bearish      RED    -.045   -.081
---------------------------------------------------------------------------------------------
CORN      16.98   -.03       16.81         59.3%   Bearish      ----   -.175   -.089
---------------------------------------------------------------------------------------------
WEAT      6.2    .04         6.2          -40.3%   Bullish      BLUE    .086   -.115
---------------------------------------------------------------------------------------------
YINN      37.55    2.83      32.4          583.8%  Bullish      BLUE    .064    .187
---------------------------------------------------------------------------------------------
RSX       22.17    .34      W21.38         87.5%   Bearish      BLUE   -.129   -.054
---------------------------------------------------------------------------------------------
AAPL      173.14    3.16     169.08        52.8%   Bullish      BLUE    .232    .012
---------------------------------------------------------------------------------------------
GOOG      1034.49    16.11   1020.91       41.5%   Bullish      BLUE    .056    .045
---------------------------------------------------------------------------------------------
MSFT      83.72    1.19      82.98        -19.9%   ----         BLUE    -.033   .056
---------------------------------------------------------------------------------------------
AMZN      1139.49    13.18   1126.69       11.7%   Bullish      BLUE     .31     .095
---------------------------------------------------------------------------------------------
FB        181.86    3.12     177.95        106.1%  Bullish      BLUE     .281    -.013
---------------------------------------------------------------------------------------------
NVDA     216.05    1.97      209.98        44.1%   ----         BLUE     .219     .209
---------------------------------------------------------------------------------------------
BA        266.99    2.36     262.86        99.4%   Bullish      BLUE     .008     .045
---------------------------------------------------------------------------------------------
GS        238.02   -.11      237.61        16.4%   Bearish      RED     -.05    -.011
|
Table 2
COMPARISONS OF BULLISH AND BEARISH NUMBERS
11/21 11/20
11/17 11/16 11/15 11/14 11/13
11/10 11/9 11/8 11/7 11/6
11/3 11/2
NEWHIGHS 615 363 244 273 71
198 191
164 157 324 255
466 360 334
NEWLOWS 62 50 229 150
111 150
113 98 93 93 103
96 112 114
-----------------------------------------------------------------------------------------------------------
MAXCPs 406 339 295 321
154 276 259
167 171 188
114
164 140
113
MINCPs
63 52
40
74
105 192
150
138
130
145
213 136 180 214
-----------------------------------------------------------------------------------------------------------
TTTNHs
196 172 169
154
89 125 101
88 82 83
67 95
71 69
TTTNLs
186 184 79 78 211
259 203
237 297 278
352 218 311
313
----------------------------------------------------------------------------------------------------------
FASTUP
245 189 158
148 121 146
148 190 209 208
187 239
190 196
FASTDOWN 72 100 136
177 253
249 260
221 250 259 259 194 214
208
|
Table 3
Count of Stocks and New Highs in Key Tiger Directories
Date = 171121

               No.           NHs           Pct
-------------------------------------------------------------------
HOMEBLDG       17            10            59 %
NIFTY-30       30            10            33 %
JETS           9             3             33 %
CHINA          64            20            31 %
INDEXES        195           57            29 %
ELECTRON       179           46            26 %
SEMI           131           31            24 %
ETFS           65            14            22 %
COMPUTER       23            5             22 %
GAMING         28            6             21 %
MORNSTAR       238           51            21 %
SOFTWARE       66            14            21 %
HACKERS        25            5             20 %
BIGMIL         6             1             17 %
NASD-100       88            15            17 %
DJI-13         13            2             15 %
RUS-1000       840           124           15 %
--------------------------------------------------------
CHEM           65            9             14 %
SOLAR          21            3             14 %
REIT           179           25            14 %
MILITARY       38            5             13 %
INSURANC       32            4             13 %
GREEN          31            3             10 %
DOWJONES       30            3             10 %
SP500          486           47            10 %
SP-100         96            9             9 %
FINANCE        92            7             8 %
INDMATER       91            7             8 %
BIOTECH        385           30            8 %
RETAIL         53            4             8 %
FOOD           15            1             7 %
TRANSP         20            1             5 %
UTILITY        43            2             5 %
BEVERAGE       20            1             5 %
OILGAS         144           6             4 %
AUTO           40            1             3 %
COMODITY       71            1             1 %
BONDFUND       112           1             1 %
None: BIGBANKS REGBANKS INFRA  COAL  GOLD
EDU   PIPELINE HOSPITAL
|
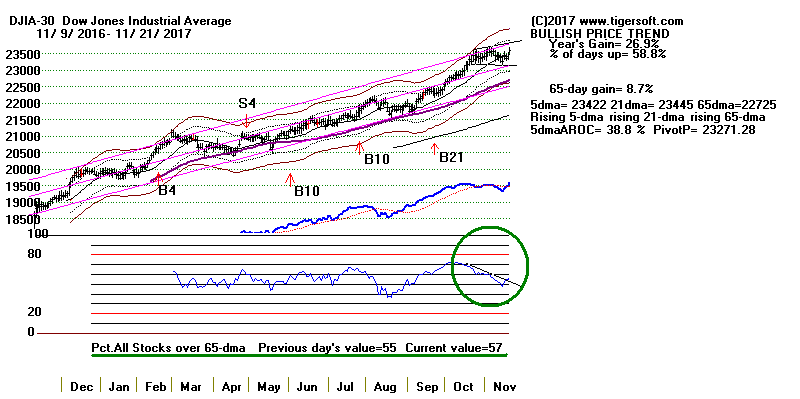 |
Table 5
 RANKING OF KEY DIRECTORIES BASED PCT.OF STOCKS ABOVE 65-DMA
              11/21/17
Bullish = 38
Bearish = 6
---------------------------------------------------------------------------------------
Directory     Current       day-1         day-2         day-3         day-4         day-5
----------------------------------------------------------------------------------------
BIGBANKS       1             1             .857          1             1             1
HOMEBLDG       .941          .882          .882          .882          .882          .941
DJI-13         .923          .846          .846          .923          .923          1
EDU            .857          .857          .857          .857          .857          .857
BIGMIL         .833          .5            .5            .833          .666          .833
NIFTY          .833          .866          .866          .866          .833          .833
SEMI           .816          .816          .786          .755          .74           .77
CHEM           .784          .753          .707          .692          .615          .661
FINANCE        .782          .782          .695          .684          .63           .673
ELECTRON       .776          .776          .743          .72           .675          .703
DOWJONES       .766          .733          .733          .8            .8            .833
SOLAR          .761          .761          .761          .714          .761          .809
REGBANKS       .757          .757          .696          .696          .666          .666
CHINA          .75           .718          .703          .703          .687          .687
INFRA          .727          .727          .727          .727          .636          .727
MORNSTAR       .726          .697          .689          .684          .588          .634
HACKERS        .72           .64           .64           .64           .6            .6
ETFS           .707          .538          .569          .553          .43           .538
UTILITY        .697          .651          .627          .697          .651          .744
MILITARY       .684          .657          .631          .631          .578          .631
GAMING         .678          .714          .678          .678          .642          .678
GREEN          .677          .645          .645          .58           .548          .645
NASD-100       .67           .659          .67           .67           .647          .659
SP500          .67           .664          .654          .666          .617          .668
JETS           .666          .666          .666          .777          .444          .444
SOFTWARE       .666          .651          .606          .636          .575          .59
RUS-1000       .657          .64           .638          .647          .596          .634
COMPUTER       .652          .739          .608          .565          .478          .478
INDEXES        .646          .651          .682          .676          .615          .656
SP-100         .635          .593          .593          .645          .614          .677
AUTO           .625          .625          .55           .6            .55           .575
INSURANC       .625          .687          .656          .687          .687          .75
INDMATER       .604          .582          .538          .516          .494          .527
REIT           .603          .525          .519          .553          .474          .564
FOOD           .6            .533          .6            .466          .466          .533
COMODITY       .549          .521          .619          .464          .464          .492
OILGAS         .52           .52           .569          .555          .576          .638
RETAIL         .509          .622          .584          .49           .415          .415
N=38
===========================================================================================
BEVERAGE       .5            .5            .45           .5            .5            .5
COAL           .5            .625          .625          .5            .5            .625
===========================================================================================
BIOTECH        .451          .425          .438          .418          .376          .371
TRANSP         .45           .35           .3            .55           .25           .35
GOLD           .204          .224          .306          .183          .163          .224
BONDFUND       .16           .098          .151          .125          .178          .098
PIPELINE       .142          0             0             0             0             0
HOSPITAL       0             0             0             0             0             0
N=6
|
| |
