TigerSoft Hotline
(C) 2016 William Schmidt, Ph.D.
www.tigersoft.com
william_schmidt@hotmail.com

IMPORTANT
This address will change this weekend
Look for an EMAIL from us giving
the new address.
Previous Addresses -
www.tigersoft.com/821-HL/INDEX.html
http://www.tigersoft.com/816-HLN/INDEX.html
http://www.tigersoft.com/77HL7778/INDEX.html
http://www.tigersoft.com/64HRL/INDEX.html
http://www.tigersoft.com/55HL55/INDEX.html
-----> Suggestion <-----
A number of your email accounts are putting emails from me
using william_schmidt@hotmail into
the Junker folder. Please
"be-friend" an email from me so that you promptly get change
of address information regarding new Hotline links.
-----------------------------------------------------------------------------------------------------------------
HELP
A
Guide To Profitably Using The Tiger Nightly HOTLINE
Introduction
to Tiger/Peerless Buys and Sells.
Peerless
Buy and Sell Signals: 1928-2016
Individual Peerless signals explained:
http://tigersoftware.com/PeerlessStudies/Signals-Res/index.htm
http://www.tigersoft.com/PeerInst-2012-2013/
Explanation of each Peerless signal.
http://www.tigersoft.com/PeerInst-2012-2013/
Different
Types of TigerSoft/Peerless CHARTS, Signals and Indicators
Peerless Signals and DJI
Charts - version 7/4/2013
1965
1965-6 1966
1966-7
1967
1967-8
1968
1968-9
1969
1969-70 1970
1970-1
1971
1971-2 1972
1972-3
1973 1973-4
1974
1974-5 1975
1975-6
1976 1976-7
1977
1977-1978
1978
1978-79
1979
1979-80
1980
1980-1
1981
1981-2
1982
1982-1983
1983 1983-1984
1984
1984-1985
1985
1985-1986
1986
1986-1987
1987
1987-8
1988
1988-9 1989
1989-90
1990
1990-1 1991
1991-2
1992
1992-3
1993
1993-4
1994
1994-5
1995
1995-1996 1996
1996-7
1997
1997-8 1998
1998-1999
1999
1999-2000
2000
2000-1 2001
2001-2
2002
2002-3
2003
2003-4
2004
2004-5
2005 2005-6
2006
2006-7
2007
2007-8
2008
2008-9
2009
2009-10
2010
2010-11
2011
2011-12
2012
2012-2013
Documentation for
TigerSoft Automatic and Optimized Signals.
How reliable
support is the DJI's rising 200-day ma?
SPY
Charts since 1994: Advisory Closing Power S7s, Accum. Index, 65-dma, Optimized
Signals.
Previous Hotlines -
www.tigersoft.com/55HL55/INDEX.html
^^^^^^^^^^^^^^^^^^^^^^^^^^^^^^^^^^^^^^^^^^^^^^^^
1/19/2016
--->
Corrections,Deeper Declines and Bear Markets since 1945.
1/21/2016
--->
High Velocity Declines since 1929
2/12/2016 --->
Presidential Elections Years and Bullish IP21 Positive Non-Confirmations at
Lower Band.
2/12/2016 --->
OBV NNCs on
DJI's Rally to 2.7% Upper Band when DJI's 65-dma is falling.
Earlier
Q-Answers
New
QuickSilver Documentation
(1/11/2016)
Our Different Signals
Better
understand the difference between Peerless DJI-based signals,
the one-year optimized red Signals and
the fixed signals based
on technical developments.
Introduction to
Tiger/Peerless Buys and Sells.
Different Types of TigerSoft/Peerless CHARTS, Signals and Indicators
===================================================================================
Peerless/TigerSoft Hotlines and
Links |
9/15/2016 The
DJI has held above 17880 but has not been able to close above 18400,
above the neckline in its head/shoulders pattern or even above its 65-dma
at 18268. Today it closed at 18212 and is down overnight about 50. The
NYSE A/D Line is still falling. I think the DJI will need to test 18000
again
before recovering. I suspect that there is more to this decline than worry
about rising interest rates. But next week, assuming the DJI holds above
18000,
I would expect QQQ,
TECL and
SOXL to challenge their highs as the general
market rallies in anticipation of Thursday's decision by the FOMC to keep rates
unchanged.
Could Clinton's Health Be The Big Uncertainty Now?
There is some alarming evidence that Hillary has Parkinson's Disease. This
would
make her becoming President seem very risky, of course. Perhaps, this is
what
is scaring the market rather than the possibility that Fed will raise rates.
Listen or read the evidence about Hillary here and judge for yourself if this
just
partisan conspiracy-mongering. My feeling is that Hillary would not be
running
for President if she had received this diagnosis. Is that unreasonable?
Or could
hubris and a lust for Power cause her to over-reach her health limits?
Most likely,
Trump's rising poll numbers are what is spooking the Wall Street establishment.
https://www.youtube.com/watch?v=Zr1IDQ2V1eM
http://www.wnd.com/2016/09/friends-of-hillary-say-she-has-parkinsons/
Without A Rate Hike, Technology ETFs "Should" Do
Well.
Today they closed above their "pivot-points" and now show rising
Closing Powers and very positive Accumulation Index readings,
I believe that they should be bought on weakness tomorrow (Friday).
They are much stronger than the DJI and way above their 65-dma.
A boost to interest rates in September would seem to have become much less
likely today as a
result of the new Producers' Price Index numbers which came out before
Thursday's opening.
Producer Prices were shown to have been essentially flat last month. The
"Hawks" on
the FOMC will be hard-pressed to make a case now that Inflation is a significant
threat.
0.1% Producer Price Index Increase Short-term rates fell today
noticeably.
The good news for the various INDEXES and ETFs we follow is that unless there
is a really big decline tomorrow and Monday, nearly all the major ETFs we follow
will have rising 5-day moving averages. Next week might be expected to
rally as
the market anticipates the FED's decision on Thursday to leave rates alone.
This
should permit the tech laden ETFs (TECL,
SOXL and
QQQ) to challenge their
recent highs. These now show rising 5-day mvg. averages, rising Closing
Powers
and a very positive IP21 and ITRS.
Links to Charts
Peerless
DJIA Hourly DJIA
DIA
SPY
QQQ
IWM
Short-Term Rates DJI-Utilities REITS
A/D Line-6000 Stocks
SOXL
TECL
FAS
Crude Oil
Short-term traders, it
is suggested you use our 5-dma pivot points with volatile ETFs in this
enviroment.
Major Indexes and A/D
Lines.
Key Tiger Software ETF
Charts
Bullish MAXCPs
Bearish
MINCPs
Stocks:
AAPL, BIDU,
IBM, GS,
TXN
ETFS:
BBH, BRZU,
DIA, DUST,
FAS, GASL,
GLD, IWM,
JETS,
JNUG, KOL, MDY,NUGT
OIH, OIL,
RETL,
RSX, SLV,
SOXL, TECL,
TMF, TNA,
UGAZ, UPW,
VGK, YINN
============================================================================================
9/14/2016 I
take the operative Peerless Signal to be a
Judged S10 based on the
DJI's suddenly completed head and shoulders pattern. This is also an
aitomatic
"Tiger S5" here using "Indicators-1" and "User
Set Defined Tiger Signal "+ "S5").
However, the history of Judged S10s or Tiger S5s where
there was no previous Peerless
sell signal suggests from this point on we will at most see only a modest
additional
decline, as in 1944, not a big decline or Crash. Note that the
NASDAQ, TECL
and QQQ are still well above their 65-day ma. This gives me the feeling
that
the DJI is being manipulated downward to scare folks into selling and makes me
believe that next week there will be no interest rate increase.
Short-term rates
did not breakout today. Instead,
they retreated from resistance. More importantly,
I believe that Trump's efforts to pressure the FED to
raise rates will probably have
the opposite effect. The FOMC will not want to appear to be weak
and easily
pushed around.
So, we want to review now what it would take to make us buy DIA or SPY again.
I think that there is still too much risk to by QQQ, SOXL or TECL. Their
5-dy moving averages are still falling.
What Would Get Us To Buy DIA or SPY?
1) A break in the NYSE downtrend.
2) A break in the down-trending Closing Power for DIA and SPY
3) A rise by the DJI back above its 65-dma
OR
4) a new Peerless Buy signal.

What's Really Going on
in Washington and Wall Street?
Suddenly completed Head and Shoulders
patterns do warn of unexpected bearish
developments suddenly impacting the market. I've mentioned some of the
possibilities
in recent Hotlines.
Right now, the biggest immediate threat is that the Fed will raise short-term
interest
rates next Thursday and that this will start the unwinding of seven years of
pumping
up the stock market by means of low interest rates and massive Open Market
purchases
of public and private debt from Big Banks. The supposed danger in this, of
course, is
that without such FED subsidies of Banks and the markets, the whole financial
house
of cards will come tumbling down.
Many in the FOMC believe such fears are well-founded. By hesitating to raise
interest
rates year after year, the FED seems to be showing that they do fear a repeat of
1929, 1931, 1932, 1937, 1960, 1969, 1978, 1979, 1987 and 2000. These were
years when
the FED tightened and thereby caused a market Crash or Bear Market. In
2008,
they sat on their hands as the financial Crash developed around them.
It is to Wall Street's interest to be a "cry baby"
and to reinforce FED fears that they
might cause a Crash. Why else would the DJI dive down so quickly
and so much when
anyone in the FED even mentions the possibility of higher interest rates.
If this cynicism
has merit, the argument now would be that the DJI will be artificially held down
for the
the next week just to worry the FED.
Now Donald Trump is saying: it's time to call Wall Street's bluff and chance a
big stock
market plunge. He says that he wants the FED to stop "playing politics"and
boosting the market
while the Democrats control the White House and who is the Chairperson of the
FED.
But my guess now is that the FED cannot allow itself to appear to pressured by
such criticism.
As a result, they will not raise interest rates in September. And that, in
turn, will cause the
market to spring back upward.
Links to Charts
Peerless
DJIA Hourly DJIA
DIA
SPY
QQQ
IWM
Short-Term Rates DJI-Utilities REITS
A/D Line-6000 Stocks
SOXL
TECL
FAS
Crude Oil
Short-term traders, it
is suggested you use our 5-dma pivot points with volatile ETFs in this
enviroment.
Major Indexes and A/D
Lines.
Key Tiger Software ETF
Charts
Bullish MAXCPs
Bearish
MINCPs
Stocks:
AAPL, BIDU,
IBM, GS,
TXN
ETFS:
BBH, BRZU,
DIA, DUST,
FAS, GASL,
GLD, IWM,
JETS,
JNUG, KOL, MDY,NUGT
OIH, OIL,
RETL,
RSX, SLV,
SOXL, TECL,
TMF, TNA,
UGAZ, UPW,
VGK, YINN
When QQQ and TECL close back above their
pivot-points, they will again appear bullish enough
to buy. Right now, I would wait.
====================================================================================================
9/13/2012
I take the operative Peerless Signal to be a Judged S10 based on the
DJI's suddenly completed head and shoulders pattern. (As in April 2010,
one can produce an automatic Tiger S5 here using "Indicators-1" and "User
Set Defined Tiger Signal "+ "S5"). Suddenly completed Head and Shoulders
patterns are the way the market responds to unexpectedly very bearish
news. We ignore these patterns at our own peril.
2010 Flash Crash and Judged S10 (TigerSoft Sell S5)
Without a prior Peerless Sell signal, the few earlier Judged S10s tell us to be
patient
while waiting for a new Buy signal. (See the charts in the 9/12/2016
Hotline.)
Based on these three cases, we can guess that the DJI could decline another 3%
or 4%
over the next week to a month before enough base-building will have been
completed
to permit a run to new highs. We can also postulate from these cases that
before the DJI
can recover, the NYSE A/D Line will need to start zig-zagging upwards and not
downwards, as now.
Another short-term rally attempt from 18000 seems likely. Wall Street's
biggest
banks and the Federal Reserve understand the importance now of trying to prevent
the market from breaking the 18000 support. This is the nesting or
juxtaposition of
three different supports derived from technical analysis: (1) the DJI's
rising green
price uptrend-line, (2) the round-number 18000 well-tested resistance back in
much
of 2015 has now turned into support and (3) the 3.5% lower Peerless Band at
17820.
Unfortunately, the loose monetary policies of the FED are now seen by more and
more
experts and also the general Public, to have failed to build a robust economy
while increasing
many of the very forces most antithetical to a healthy economy or stable stock
market. As
a result, the "Doves" on the FOMC will have a tough fight on their hands.
It is also not
even clear that the Fed will be able to hold the market up at these levels if
selling pressures
continue at the levels of intensity seen recently
Why Are Big Investors Dumping Stocks
without even Waiting for A Rally?
DJI
Advances/Declines
9/8/2016 18479.91
1377 / 1656`
9/9/2016 18085.45
173 / 2951
9/12/2016 18325.07 2204 /
855
9/13/2016 18066.75
338 / 2756 (The DJI was down 200 after 30 minutes
of trading.)
Today's dramatic reversal down today is scary. The sell-off today took
place
after what seemed like a decent rally yesterday. Again, we must ask "Why
are big
investors in such a hurry to sell that they choose not to wait even to see if
there is
any follow-through?" We now assume that their biggest reason
for selling is the fear
of an interest rate rise and a reversal of 7 years of exceptionally low interest
rates and
that the whole "house of cards" the Fed has created may come tumbling down.
That
is certainly ample reason to sell. But now Donald Trump tells us the FED
must stop
all its politically biased "nonsense", presumably thereby just letting the stock
market collapse.
That is pretty scary! But even this is not all. The market's
typhoon-in-the-making also now
includes much more bearish news: Hillory's ill health, Trump's rise in the
polls,
North Korean nuclear blackmail, the US Navy being forced to leave the
Phillipines,
and China's direct challenge to the pre-eminence of the Dollar.
What To Do?
At least, being amply hedged with some of Bearish MINCPs seems a minimal
response
to what is happening now. All the key ETFs, of course, show falling 5-day
mvg.avgs.
The "pivot-points" are now so far above current prices, no "QuickSilver" looms
likely
for now.
Charts: Peerless
DJIA Hourly DJIA
DIA
SPY
QQQ
IWM
Short-Term Rates DJI-Utilities REITS
A/D Line-6000 Stocks
SOXL
TECL
IBB
FAS
Crude Oil
Short-term traders, it
is suggested you use our 5-dma pivot points with volatile ETFs in this
enviroment.
Major Indexes and A/D
Lines.
Key Tiger Software ETF
Charts
Bullish MAXCPs
Bearish
MINCPs
=======================================================================================
9/12/2012
This is a tricky market. We need more time to determine the likely
next big move. The head and shoulders patterns still place resistance
overhead, at 18400. But the rising 65-dma shows bullish momentum and
the former resistance at 18000 offers support for the time being.
Continue to watch Short-Term Treasury rates. They are
probably our best way to guess what the FOMC will do. Yellen's
silence suggests to me that she is not willing to aggressively
defend against those who want to see the Fed raise rates.
The Major ETFs all are substantially below their 5-day ma
pivot-points. We should therefore wait before buying them, I think.
On the
other hand, we nearly got a Buy B19 today and Judged S10s with
patterns like ours now do not bring big declines when they try to reverse
operative Peerless Buys.
Despite today's recovery, I think traders still have to consider the
Peerless signal to be a weak judged S10. Today's rally did NOT quite meet
the
qualifications for a Buy B19 (two day reversal). This means that
there
will probably be more backing and filling between 17980 and 18350
while the market waits to see whether the Doves or the Hawks
will prevail at next week's FOMC meeting.
See how today's NYSE advance/decline ratio was less than on
previous B19s since 2009. Buying at the close today also would
have meant "chasing", in that the DJI closed nearer the 21-day ma than in
any of the cases of B19s since 2009 in a rising bull market.
LA/MA Adv/Decl
Subseq. Gain Max Paper Loss
rising bull market 3/17/2011
.973 2232/819 +8.8%
-1.0%
rising bull market 4/11/2012
.976 2433/645 +3.7%
none
rising bull market 6/25/2013
.923 2493/620 +4.8%
none
rising bull market 8/22/2013
.974 2605/505 +1.5%
-1.3%
correction 9/2/2015
.967 2344/834 +8.4%
-2.3%
correction 1/26/2016
.972 2618/543
none
correction 2/16/2016 1.008
2583/603 +11.7%
none
rising
bull market 6/28/2016
.981 2656/465 open
none
rising
bull market 9/12/2016
.992 2204/844
open
Should A Judged S10 Be Allowed
So Suddenly To Reverse Active Peerless Buys?
How much value does the judged S10 have historically when it
tries to reverse an operative set of Peerless Buys? There are very
few cases like this. See them below. Accordingly, we should
probably treat a "judged Sell S10" as only a temporary expedient,
especially when the NYSE A/D Line and the momentum of the 65-dma
are as strong as they are now. See all the cases of half-sized S10s
trying to reverse an otherwise active Peerless Buy. Big declines just do
not follow in any of these cases, though it sometimes takes a month
or two for the market to build a base to permit to make new highs. The
DJI in these cases moves up when the A/D Line shows clearly it is no
longer in a down-trend.
Charts: Peerless
DJIA Hourly DJIA
DIA
SPY
QQQ
IWM
DJI-Utilities REITS
A/D Line-6000 Stocks
SOXL
TECL
IBB
FAS
Crude Oil
Short-term traders, it
is suggested you use our 5-dma pivot points with volatile ETFs in this
enviroment.
Major Indexes and A/D
Lines.
Key Tiger Software ETF
Charts
Bullish MAXCPs
Bearish
MINCPs
The rally today mostly owed to a "dovish"speech by Democrat Lael Brainard, one
of the
voting members of the FOMC. It was interesting how suddenly her speech was
announced on Friday, making it seem that it was an emergency effort by the Doves
to show the stock market that the Doves would not simply roll over and
let the Inflation-Hawks control the FOMC meeting on Sept. 20-21.
But will the Doves prevail? Or will the Hawks prevail in seeking
to strengthen the Dollar in order to show the World and China that the Dollar
is the most secure country in the world? I take Yellen's loud silence to
be a
a sign that the Hawks will win.
-----------------------------------------------------------------------------------------------------------------------------------------------------
9/9/2012
The completed head/shoulders pattern in the DJIA that we see now
must be treated as a Peerless Sell S10, even though:
1) there is no Peerless Sell,
2) the Head/Shoulder pattern now in DJIA shows a right shoulder
only about half the width of the left shoulder and
3) the NYSE A/D Line has only slightly broken in its 6-month uptrend.
Judged Sell S10? See
Past Cases of
Judged Sell S10 since
1929 when right
right shoulder
was about half the width of left shoulder.
I have written a lot about Head/Shoulders patterns' role as warnings of
severely bearish circumstances suddenly intersecting with the stock
stock market. See in the four links below some of important H/S tops in the past
that appeared right before really
bad things happened to the stock market. This
makes the present market look quite risky.
http://www.tigersoftware.com/TigerBlogs/June-28-2009/
.http://www.tigersoft.com/PeerInst-2012-2013/HS-SellS10/index.html
Judged S10s
http://www.tigersoftware.com/TigerBlogs/May-8-2010-/index.html
Stock H/S
http://www.tigersoftware.com/2014-KSS/HShoulders/index.htm
DJIA - H/S with half-size right shoulder
Tiger Index of DJI-30 - Normal H/S
Tiger Index of SP-500 Stocks:
Only 41% are still above their key 65-dma.
TECL - False Breakout is bearish
This traps a lot of traders.
What To Do Now?
Staying long here now seems quite risky, even though we MAY get a Buy signal
near 17700
(5% down from the peak) in the next few days or possibly a Buy B19 if it turns
out that the
FED is not going to raise rates. That is a big gamble considering how
dependent the
stock market has become on the FED.
I've now suggested selling all the ETFs. SOXL and FAS, as of Thursday
night. were the only ones
still
recommended
as "longs". These should have been closed out Friday as they fell way below their
5-day
ma pivot-points.
All are on Sells on this basis now and all show falling Closing Powers.
They cannot easily
become Buys again very soon.
It you are still long, at least hedge with some short sales in
Bond Funds,
MINCP
stocks or
stocks in the SP-500 that show completed head/shoulders patterns.
What hit the market so hard on Friday?
It was a perfect cyclone.
1) North Korea successfully tested an A-Bomb bigger than the ones dropped on
Japan.
It is only a matter of time before they miniaturize the bombs and put them on
their
own rockets. The West Coast of the US is 5000-6000 miles away. An
ICBM can
go between the US and Moscow in 15 minutes. The US must find a better way
to
safeguard itself from N Korean nuclear blackmail. Isolation and War have
not worked
well considering the Cuban and Iraq experiences, so"talk" would seem the only
option.
But will Clinton and Trump advocate "talk" in a Pres. Election year.
Probably, they
will try to appear "tough" and that will surely cause more high
nuclear anxiety this
Fall.
2) The Fed may well raise rates this month. Why else would Gold and Silver
decline so
much on Friday? Why else would Utilities and
Bonds have completed
Head/Shoulders
patterns? Why else would short-term rates be so close to breaking out to
new highs?
3) Hillary's coughing fits, it turns out were pneumonia. She did not
disclose this publicly
last week after being told by her doctors. Instead, she claimed
that she had a simple allergy
attack
and was over-heated. Not so. And she undoubtedly told daughter
Chelsea, who then
probably told her husband on Friday. Hence the sell-off. He is a big hedge fund player.
Will this come out? I doubt it. But a weakened Hillary is a
stronger
Donald Trump! This also
has the potential of adding greatly to the public
doubts about her
trustworthiness and makes
Donald's warnings about her weak health look
positively
insightful. A stronger Trump in the
polls will probably produce a deeper market decline, thus reflecting the
mainstream media's
view that Trump is a wild, loose canon who could do almost anything if elected.
4) Head and Shoulders patterns suddenly are dangerously plentiful now. We know these
bearish
patterns are
self-fulfilling, especially when prices fall below their 65-dma. But more
than that, they
often appear when the stock market must deal with unexpected news, like that of
a sick Hillary or a sudden change of positions by the FED or a new threat of war
or
attack. We have all three of these now!
12 of the 30 DJIA Stocks Now Show H/S Patterns.
This was also true before the intermediate-term declines
of 2010, 2011, 2014 and 2015.
Lots of new H/S pattern. See the charts of the
DIA, the Tiger Index of
30-DJI stocks,
OEX, Retail (RETL),
Military (DJUSDN) , Health Care (DJUSHC) and the many
H/S patterns among DJI and
SP-500 stocks.
"Wall Street's Pre-Eminent Position in
International Finance Can Best Be Maintained
by Making The Dollar The Strongest of All Currencies."
With the DJI up so far, and so dependent on low interest rates and the FED not
yet selling
any of its trillions and trillions of Dollars worth of government securities and
long-term
bonds, its very easy to see the risks now that the Chinese Yuan is about to
become a
reserve currency. The World must be taught that the Dollar is #1.
Historically, the FED
has nearly always exaggerated inflation risks in
order to
protect the Dollar, whose strength
gives the big New York banks their central role in world finance.
With such motivation operating now, the Fed very well choose to raise rates in September
to
strengthen the Dollar, thus also protecting
the pre-eminent position of the big banks that
also pick most of the FED's
Board
of Governors.
Charts: Peerless
DJIA Hourly DJIA
DIA
SPY
QQQ
IWM
DJI-Utilities REITS
A/D Line-6000 Stocks
SOXL
TECL
IBB
FAS
Crude Oil
Short-term traders, it
is suggested you use our 5-dma pivot points with volatile ETFs in this
enviroment.
Major Indexes and A/D
Lines.
Key Tiger Software ETF
Charts
Bullish MAXCPs
Bearish
MINCPs
Bearish Bonds/Reits
Bearish Stocks in SP-500
with Head/Shoulders with drops below 50-day ma.
"CRUN50" finds the stocks thus falling below 50-dma. The ones with H/S
were
gleaned from the resulting CRUN50 charts.
DJI-30 with H/S Shoulders Patterns (12)
This is the same number that has occurred before each of the last four 13.5%
declines: AAPL, BA,
CAT, HD,
IBM, JNJ,
KO, TRV,
UNH, UTX,
VZ and WMT
Charts of Key ETFs
ETFS Report
Each of the 6 key ETFs shown below closed sharply below their 5-day
ma pivot points for Friday. This caused their 5-day ma to be falling at
the close on Friday.
As a result, none of these should be held at Friday's close.
Each
also showed a Falling Closing Power, making their sells more emphatic. Five
of the
6
now show both Opening and Closing Power Falling. With a very negative IP21
(current AI) below -.15, we would have to recommend these as short-sales
using QuickSilver rules. But none show such low IP21s. So, they are
not
recommended here as short sales.
Close
Pivot-Point Pivot-Point 5-day ma Trends
CP
for 9/9
for 9/12
DIA 180.91
184.1
184.86
Falling
Both Falling
SPY 213.28 217.39
218.37
Falling
Both Falling
QQQ 114.28 116.74
116.12
Falling Both
Falling
IWM 121.25 123.32
125.51
Falling Both
Falling
SOXL 42.14 44.16
43.92
Falling
Closing Pwr is falling
TECL 46.19 -1.09 46.41
46.99
Falling
Both Falling
FAS 31.1 -.16
30.64
31.18
Falling
Both Falling
================================================================================================
9/8/2016
I mentioned that short-term interest rates are threatening to make
a breakout to new highs on their own. Perhaps, the FED really is
willing to risk an economic slow-down and a stock market sell-off in
a Presidential Election Year. They may guess, perhaps, that the DJI
is up so very far, that it cannot drop much in the next two months compared
to how far it has risen since March 2009. Or they may want to remind the
Chinese and the World that the Dollar is still the strongest currency now
that the Chinese Yuan will assume reserve currency status by IMF rules
on October 1st. Such considerations could explain why short term
interest rates are rising this week despite last mediocre Friday's Job report.
And this could explain the potential head and shoulders patterns in the DJI
and OEX along with the very negative
Tiger OBV-Pct readings. Such negative
readings at the 2% upper band would certainly be bearish. But right now
the DJI is simply sitting on its 21-day ma.
DJIA Chart, Peerless Signals and Indicators
Hourly DJIA Chart does NOT show the typical DISI/OBV bearish divergence
that typically comes before a market sell-off.
My judgment now is that the standing Peerless Buys tell us to expect more
DJI new highs. In addition, the Hourly DISI-OBV is in an uptrend and
the NYSE A/D Line is still pointing the market higher. Very visible,
bearish
Hourly DISI divergences have appeared before the last two sell-offs
(July-Aug 2015 and Jan 2016). As for the A/D Line, only once, in the Fall of
1976,
did a rising A/D Line like we now see now, NOT prevent an intermediate-term
decline. In other words, the strength in our NYSE A/D Line should prevent
the completion of the head/shoulders patterns we now see in the DJI and
SP-100.
Seasonality is bullish, too. From Sept 8th to November 4th
in the 16 bull market Pres.
Election Years, the DJI rose no fewer than 12 times and fell only 4. The
historical odds
would seem to favor higher prices in November by 3:1.
Charts: Peerless
DJIA Hourly DJIA
DIA
SPY
QQQ
IWM
DJI-Utilities REITS
A/D Line-6000 Stocks
SOXL
TECL
IBB
FAS
Crude Oil
Short-term traders, it
is suggested you use our 5-dma pivot points with leveraged ETFs.
Major Indexes and A/D
Lines.
Key Tiger Software ETF
Charts
Bullish MAXCPs
Bearish
MINCPs
Charts of Key ETFs
ETFS Report
Close
Pivot-Point 5-day ma Trends
DIA 184.2 -.50
184.1
Rising
SPY 218.81 -.50 217.39
Rising
Both OpPwr % CLPwr are rising.
QQQ 117.23 -.69 116.74
Rising
Both Up
IWM 125.16 -.25 123.32
Rising
Both Up
SOXL 42.14 -.19 44.16
Falling
CLPwr is falling
TECL 46.19 -1.09 46.41
Rising
CLPwr is rising.
FAS 31.1 -.16
30.64
Rising
Both OpPwr % CLPwr are rising.
By November 4th, The DJI Should Be Higher.
In a bull market Presidential
Election Years, the market mostly rose
from September 8th to September 30th and then to early November.
I have
put parentheses around those years where the DJI was not in a bull market
going into September of the Presidential Election Year.
Septembers rose in 9 of the 16 Presidential Election years
when a bull market was active. Only 1976 brought a significant
intermediate-term correct. From Sept 8th to November 4th in
the 16 bull market Pres. Election Years, the DJI rose no fewer than
12 times and fell only 4. The historical odds favor higher prices in
November
by 3:1.
| |
What happened in Sept in Pres. Election years?
           9/8          9/30       11/4
---------------------------------------------------------------------
1916      94.6          103.7      106.3  UP
(1920     87.10         83.0        84.5  down On-Going Bear Market.)
1924     101.3         103.2       103.9  up
1928     239.1         237.4       254.4  UP
(1932      77.5          71.6      61.5  DOWN! On-Going Bear Market.)
1936     169.6         167.8       180.7  UP
(1940    133.1         132.6       135.2  up_
1944     143.5         146.3       147.2  up
(1948    182.9         178.3       184.5  up) Market was correcting
1952     275.9         270.6       270.2 down  Note the Summer bearish/Shoulders' pattern.
(1956    506.8         475.3       490.5  DOWN  SUEZ Canal War)
(1960    611.4         580.1       590.8  down On-Going Bear Market.)
1964     851.9         875.4       873.8  UP
1968     921.25        935.79      946.23 up
1972     961.24        953.27      984.12 up
1976     992.94        990.19      960.44 DOWN DJI stalled out at 1000.
1980     948.31        932.42      937.2  down
1984    1212.35       1206.71     1216.65 up
1988    2054.59       2112.91     2145.8  UP
1992    3260.59       3271.66     3223.04 down
1996    5659.86       5882.17     6177.71 UP
(2000   11220.65      10650.92    10817.95 DOWN DJI topping out.)
(2004   10342.79      10080.27    10314.76 down )
(2008   11188.23      10850.66     9625.28 DOWN  On-Going Bear Market)
2012    13035.94      13437.13    13093.16  up
----------------------------------------------------------------------
|
|
================================================================================
9/7/2016
Though Peerless remains on multiple Buys, I think we still should
be on guard about interest rates suddenly rising steeply. See the Short-term
Interest Rates' chart immediately below. Bulls would not want to see a breakout
in this chart or a rupture by
the DJIA and the SP-500 of their recent lows and their
neckline-supports.
Despite these concerns, upside price breakouts seem more likely.
And such upside breakouts should set up some very good "long" trades.
IWM and TECL have already made bullish breakouts.
Because Peerless remains on major Buys, we have to expect that the DJI will
breakout
to the upside. In that spirit, we note that today's decline was limited
and there were 773
more up than down. Again the NYSE A/D Line made a new high.
While Semiconductors
declined enough to turn SOXL's 5-day ma down, we could still be on the
verge of important
flat-topped breakouts by the SP-500 and SPY along with the NASDAQ and
the Tiger Russell-1000 Index.
Such breakouts could likely send the
market up sharply. Volume will have to be expand for these breakouts to
look real. Watch closely to see if prices can achieve breakouts in the
Indexes and
ETFs listed below. Note that breakout runs have already started for
IWM and
TECL. We can hope that the other major market ETFs will follow their lead.
Close 9/7 Resistance 5-dma
Pivot Point Closing Power
-----------------------------------------------------------------------------------------------------------
SP-500
2186.16 2190-2200
rising 2170.95
Both up
SPY
219.01 219.73-220 rising
217.38 Both up
NASDAQ 5283.93
5300
rising 5213.22
Both up
Charts:Peerless
DJIA Hourly DJIA
DIA
SPY
QQQ
IWM
DJI-Utilities REITS
A/D Line-6000 Stocks
SOXL
TECL
IBB
FAS
Crude Oil
Major Indexes and A/D
Lines.
Key Tiger Software ETF
Charts
Bullish MAXCPs
Bearish
MINCPs
Charts of Key ETFs
The DJIA could still be making a head/shoulders top. If this rally
were
to fail and the DJI were then to drop below 18250, a bearish head/shoulders
would be completed. This would have to be judged as a Sell S10.
A sudden rise in interest rates could cause such a sell-off. I have to
note
that Short-Term rates are on the rise and are nearing the upper boundary
of their 7-month long trading range,
====================================================================================
9/6/2016
The real fun for stock market bulls could soon be about to
begin. Our
operative Peerless BUY signals tell us to expect the DJI to make more new
highs. So does the NYSE A/D line which is streaking to new highs ahead of
the DJI. Adding to the optimism now is the sense that the 'Hawks' on the
FED will not prevail, because of the August Jobs' number was lower even than
the number needed to keep up with the population's growth. The market
also does not seem to care that Clinton is slipping badly in the polls.
Not so
secretly, Wall Street admires billionaires like Trump. And today, he said
he
would push for more military spending. It is Hillory's verbal war
with Putin
that seems reckless.
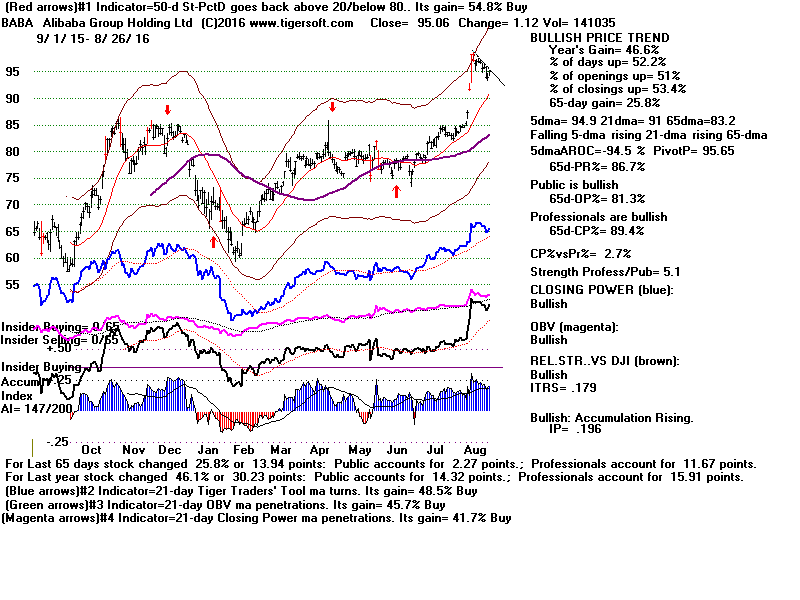
Among our Bullish MAXCPs,
Chinese internet stocks can properly be
said to be the market's leaders low:
WB (133% in last 100 days),
SINA (+68%) and
BABA (+30%). Note the
power behind their recent breakouts.
The DJI seems in no hurray to breakout past its resistance at 18745. That
simply
means we must look elsewhere for purchases. The technology ETFs, IWM and
leading Chinese stocks would be my picks. Traders should close out these
positions
if their 5-day ma turns down.
Exciting breakouts and swift vertical ascents aplenty could start soon
if we can get decisive breakouts now by the NASDAQ and Russell-2000 (IWM).
See how close they are to getting past their flat well-tested resistance lines,
shown below. CNN was doing its bit to attract speculators; it is featuring
news this morning on Amazon's new all-time high. This is great for our
TECL
(3x leveraged technology) position. TECL looks like it has achieved
another
bullish breakout above a short-term flat resistance.
Charts:Peerless
DJIA Hourly DJIA
DIA
SPY
QQQ
IWM
DJI-Utilities REITS
A/D Line-6000 Stocks
SOXL
TECL
IBB
FAS
Crude Oil
Major Indexes and A/D
Lines.
Key Tiger Software ETF
Charts
Bullish MAXCPs
Bearish
MINCPs
Charts of Key ETFs
The expectation that the Fed's Doves will prevail a while longer has sent Gold
and
Silver stocks sharply higher. But they have reached potential apexes in
right shoulders
to such head/shoulders patterns. A little caution here seems warranted.
===================================================================================
9/2/2016
Peerless Remains on a Buy. The operative Peerless Buy
B3,
Buy B19,
Buy B20 and
Buy-B14 keep telling us to
expect more
new highs by the DJI. Friday brought the second-straight up-day,
something we have not seen for more than a month. It sent the
NYSE A/D Line to a new high, way ahead of the DJI. This is bullish.
New Non-Agric Job Creation by Month (Labor Dept.)
| |
| Year |
Jan |
Feb |
Mar |
Apr |
May |
Jun |
Jul |
Aug |
Sep |
Oct |
Nov |
Dec |
| 2006 |
278 |
316 |
281 |
183 |
23 |
82 |
207 |
181 |
158 |
4 |
208 |
171 |
| 2007 |
240 |
90 |
189 |
79 |
143 |
78 |
-33 |
-24 |
88 |
85 |
115 |
97 |
| 2008 |
19 |
-86 |
-78 |
-210 |
-185 |
-165 |
-209 |
-266 |
-452 |
-473 |
-769 |
-695 |
| 2009 |
-791 |
-703 |
-823 |
-686 |
-351 |
-470 |
-329 |
-212 |
-219 |
-200 |
-7 |
-279 |
| 2010 |
28 |
-69 |
163 |
243 |
522 |
-133 |
-70 |
-34 |
-52 |
257 |
123 |
88 |
| 2011 |
42 |
188 |
225 |
346 |
73 |
235 |
70 |
107 |
246 |
202 |
146 |
207 |
| 2012 |
338 |
257 |
239 |
75 |
115 |
87 |
143 |
190 |
181 |
132 |
149 |
243 |
| 2013 |
190 |
311 |
135 |
192 |
218 |
146 |
140 |
269 |
185 |
189 |
291 |
45 |
| 2014 |
187 |
168 |
272 |
310 |
213 |
306 |
232 |
218 |
286 |
200 |
331 |
292 |
| 2015 |
221 |
265 |
84 |
251 |
273 |
228 |
277 |
150 |
149 |
295 |
280 |
271 |
| 2016 |
168 |
233 |
186 |
144 |
24 |
271 |
275(P) |
151(P) |
|
|
|
|
| P : preliminary |
|
|
Friday's mediocre Jobs numbers and the lack of inflation "should"
now prevent the FED from raising rates later this month. So, stay long
TECL (leveraged tech ETF),
SOXL (leveraged Semi-Conductors),
FAS (leveraged bug Banks) as long as they
stay above their pivot points.
For the first time in some while, all of the 7 key ETFs shown below now
have rising 5-day ma. I take the most bullish to be those
whose Closing
Power and Opening Power are both rising and those that do not have clearly
defined overhead resistance.
ETFs 9-2 Price
Pivot-Points
(A Close Monday
below the pivot-point
will cause the ETF's
5-day ma to turn down.)
------------------------------------------------------------------------------------
DIA
184.86 184.83
186 is resistance.
SPY
218.37 218.36
219-220 is resistance.
QQQ
117.2
116.94 120 is
resistance
IWM
124.51 123.7
Move past 124 would be a breakout.
But there still is resistance at old high of 127 (2015)
Both Opening and Closing Power are rising.
SOXL 43.92
43.38
Both Opening and Closing Power are rising
TECL
46.99
46.62
Both Opening and Closing Power are rising
FAS
31.18
30.21
Both Opening and Closing Power are rising
Charts:Peerless
DJIA Hourly DJIA
DIA
SPY
QQQ
IWM
DJI-Utilities REITS
A/D Line-6000 Stocks
SOXL
TECL
IBB
FAS
Crude Oil
Major Indexes and A/D
Lines.
Key Tiger Software ETF
Charts
Bullish MAXCPs
Bearish
MINCPs
Charts of Key ETFs
September's Bearish Reputation Is Completely Undeserved in
Presidential Election Years apart from 2008.
Many believe that Professionals come back from long Summer vacations
and somehow only then decide to engage in wholesale selling, thus causing
September to be a bearish month. That seems self-contradictory.
Someone
who goes away on vacation is more likely to reduce or neutralize his holdings
before he goes away on vacation.
There is no denying, however, that this is the month when lots of money
does come out of the market to pay sky-high tuitions. This seems as good a
reason
as any I can think of to explain the normal bearishness of the market for the
next
four weeks. Since 1965, the DJI has risen only 46.9% of the time and
averages
a drop of 0.7% over the next four weeks. But last year, it only bided its
time
in a narrow consolidation before rallying strongly in October.
Countering negative forces affecting most Septembers, in Presidential Election
years,
the DJI's track record at this time is very different. It's quite bullish,
as savvy traders
often buy in September in anticipation of a post-Presidential Election binge of
buying by partisans
of whichever party wins. In Presidential Election years, the four weeks after
September 5th
are actually up 79.2% of the time and the average DJI gain in this period is
1.9%.
This is pretty amazing, since it includes the data for 2008 when the DJI fell
11%
over the next month. Leaving out 2008, the average DJI gain is about 3.2%
between now and October 6th.
The seasonality now would be quite favorable for a rally IF this were
a normal Presidential Election. Unfortunately, it definitely is not a
normal
Presidential Election Year. More Americans now strongly dislike both
leading
candidates than like them! I should add that Wall Street is definitely not
"most
people." The Wall Street Establishment favors Clinton. And right
now, it looks like
she will win. See
http://www.slate.com/blogs/the_slatest/2016/09/04/trump_is_closing_the_gap_in_national_polls_but_clinton_holds_battleground.html
====================================================================================
9/1/2016
Peerless Remains on a Buy. Two of the three Jobs' Report Scenarios below
should bring higher prices for the DJI. The third, a really positive
number
for August, would be quite bearish for bonds, dividend stocks and probably the
DJI, too. Continue to hold SOXL, TECL and FAS rather than DIA or SPY.
1. A Jobs Report this morning of more than 240,000 will probably
prompt the Fed to raise rates in September, even though inflation
is not at 2% yet and August Jobs' numbers are often subject to significant
later revisions. A number quite a bit over 200,000 will probably bring a
brief
rally which will soon fail just as others have recently. This would be a
dangerous
situation, because by inviting the FEDs to raise rates the Feds, they
would
be reversing the loose money policies of the last 7 years that have artificially
brought about a bull market in stocks with only a limited and modest recovery
in the "real economy". Take away the bull market and we could be back in
recession with much more speed than most imagine. (Let us hope that this
is not the scenario that plays out. The presence of un-reversed Peerless
Buys gives us hope that it will not be.)
2. A Jobs Report for July near the expected 180,000 number will allay fears
of a September rate and permit the DJI to work sidewise away from and
out of its recent pattern of limited decline. In that case, I think the
operative
Peerless signals will play out bullishly.
3. Ironically, a weak Jobs Report, under 120,000 is probably what the stock
and bond market would like the most. The Peerless signals will in this
scenario
likely be vindicated and the normally bullish seasonality that occurs in
Presidential
Elections will unfold.
Hold SOXL, TECL and FAS
Presently SOXL,
TECL and
FAS show rising 5-day moving averages, rising
Closing Powers and bullish positive Accumulation. I would prefer to hold
these
ETFs rather than DIA's or
SPY's. where the 5-day ma is still falling.
Charts:Peerless
DJIA Hourly DJIA
DIA
SPY
QQQ
IWM
DJI-Utilities REITS
A/D Line-6000 Stocks
SOXL
TECL
IBB
FAS
Crude Oil
Major Indexes and A/D
Lines.
Key Tiger Software ETF
Charts
Bullish MAXCPs
Bearish
MINCPs
Charts of Key ETFs
LACK OF BACK-TO-BACK
DJIA UP-DAYS IS
BEARISH
The recent pattern of an up-day in the DJI not being followed by another up-day
for more than a month is definitely a bearish development. Most of the big
market declines since 1929 showed this pattern in varying degrees as the DJI
topped out and the broke downward from its primary peak.
This is another reason for avoiding DIA and SPY atthis time. We will have
to continue
to watch to see if the recently support levels in the
DJI,
SP-500,
OEX and
NASDAQ
can hold. If not, their bearishness will almost certainly be followed by a
break in the
6-month NYSE A/D Line uptrend. This would require us, I think, to then
expect the DJI
to re-test 18000. Without a new Peerless Sell, I still doubt if the DJI
will drop further.
However, the failure of the DJI to rally tomorrow would reinforce the pattern of
failed rallies we have been seeing this past month. As I discussed in last
night's
Hotline, this would be quite disconcerting.
===================================================================================
8/31/2016
Will Janet Yellen and The Fed Dare To Raise Interest Rates?
It begins to look like the answer is "Yes". But maybe, all the recent
sellers will turn out to be wrong and there will be no rate hike before
the Election. We have to let the market's technicals guide us now.
The operative Peerless Buy
B3, Buy B19,
Buy B20 and
Buy-B14) have
generated a nice run into all-time high territory for the
DJIA,
SP-500,
NASDAQ,
SOXL and TECL. Their recent three-week decline has so far been quite
limited
and contained, given that it is caused by a growing sense that interest rates
will soon be lifted by the Fed, perhaps as early as next month.
Bullishly, the NYSE A/D Line remains
in an uptrend. Seldom, does the market
make a significant top without a Peerless Sell, i.e. produce a 5% or more
decline. Even more rarely does the DJI decline very far while the A/D Line
is rising like now. So, for now, I would still hold out hopes for a decent
pre-Labor day rally. Its failure to appear, on the other hand, would have
to
be bearishly construed especially if the
OEX and NASDAQ complete their
head/shoulders' patterns.
We've had plenty of warning to steer clear of
Utilities,
Bonds and
Gold Stocks:
notably a rash of head/shoulders patterns in these groups, long price-uptrend
breaks,
negative Accumulation, violation of 65-dma and downtrending Closing Powers.
Continue to avoid these groups.
Using Tiger's QuickSilver 5-day ma tactics, we have also avoided
DIA and SPY.
We spotted their micro-head/shoulders and did not want to argue with their
falling 5-dma. I think this is still the right approach. The Jobs
numbers on Friday
will probably be good, above 240,000, That could cause DIA and SPY to
briefly jump up. But the pattern of trading for the last month has been a
complete lack of follow-through for these ETFs. The DJI has only had one
instance of two straight up-days in the last month. Professionals are
using
any rally to sell into. They are in a hurry to sell. They are
unwilling to
wait for a multi-day rally to sell.
(See my developing study on this:
LACK OF BACK-TO-BACK
DJIA UP-DAYS IS
BEARISH )
Why are some in such a hurry to get
out?
One could guess that insiders have learned on good authority that the FED
really will raise rates soon. These insiders want to take no chances given
how
artificial the whole advance since 2009 has been. The bull market, most
judge,
has been dependent heavily on very low rates
and unprecedented and extravagant
open-market buying by the FED.
A really good Jobs number Friday AM will certainly boost the Hawks' case
in the FOMC for raising rates. This could hurt the legions of dividend
stocks in
in the DJI-30, OEX and SP-500. But a Jobs Report for August above
250,000 will also considerably brighten the profits' outlook for Semi-Conductors
(SOXL) and technology (TECL)
stocks. So, continue to hold SOXL (and TECL)
as long as their 5-day moving averages are rising. Seldom does the FED
make a meaningful decision without helping its real owners, the Big Banks.
This tendency is reflected in FAS
looking very good short-term.
5-day ma Close Pivot Point
Comments
direction 8/31 for 9-1
-----------------------------------------------------------------------
DIA
Falling 183.94
184.37 Bearish lack
of up days in succession.
SPY
Falling 217.38
217.7
QQQ
Falling 116.49
116.61
Cl.Pwr is rising.
IWM
Rising 123.23
123.31
Cl.Pwr.
rising
SOXL
Rising
43.03 42.38
Both Op.Pwr.& Cl.Pwr. rising.
TECL
Rising
46.08 46.07
Cl.Pwr is rising.
FAS
Rising
30.92 29.42
Both Op.Pwr.& Cl.Pwr. rising.
.
Charts:Peerless
DJIA Hourly DJIA
DIA
SPY
QQQ
IWM
DJI-Utilities REITS
A/D Line-6000 Stocks
SOXL
TECL
IBB
FAS
Crude Oil
Major Indexes and A/D
Lines.
Key Tiger Software ETF
Charts
Bullish MAXCPs
Bearish
MINCPs
Charts of Key ETFs
=================================================================================
8/30/2016
It's very difficult for Peerless to become bearish while the NYSE
A/D Line is streaking upwards. With some qualifications, as discussed
below, I think we must stick with the Peerless major Buys. A break
in the NYSE uptrendline and a rupture of the neckline supports in
the NASDAQ,
OEX and Tiger Index of Bond Funds
would force a
re-evaluation. 
A Bearish Shot Across the Bow of The USS Bull Market
Today, once again the DJI could not rise for two days in a row. It has had two
successive up-days only once in the last month. This is becoming a strain
on the market as a whole. When such market behavior has occurred after
a rally in the last twenty years, it was always a very bearish warningl.
See the
cases in tonight's new study: Dec 1999, Jan & Feb 2001, Aug 2001,
April 2002, June 2002, June 2004, May 2008, Nov 2008, March 2015
and now August 2016.
As long as the NYSE A/D Line stays in an uptrend, I suspect we are still
safe. But now we can make out potential head/shoulders patterns on OEX
and NASDAQ. Presently only SOXL and FAS still have rising 5-day moving
averages. I would continue to hold them long provided they do not close
below
their 5-day ma pivot-points, as shown below. That would cause their 5-day
ma
to turn down.
Clearly, the FED has spooked the market with talk of two interest
rate rises this year. If the Jobs' numbers on Friday are above 250,000
and the various measures on Inflation reach the 2% Fed target, it
would seem that a rise in rates in September is a strong possibility.
I would not have thought the FED would be so politically bold, but the
way Gold stocks fell again today is scary, as is the head and shoulders
pattern now present in Tiger's Index of Bonds.
5-day ma Close Pivot Point
Comments
direction 8/30 for 8-31
-----------------------------------------------------------------------
DIA
Falling 184.51
184.66 Professionals
are bearish.
SPY
Falling 218.00
217.85
Cl.Pwr is rising.
QQQ
Falling 116.56
116.80
Cl.Pwr is rising.
IWM
Falling
123.93
123.07 Both Op.Pwr.& Cl.Pwr.
rising
SOXL
Rising
43.00 41.84
Both Op.Pwr.& Cl.Pwr. rising.
TECL
Falling
46.21 45.87
Cl.Pwr is rising.
FAS
Rising
30.86 29.20
Both Op.Pwr.& Cl.Pwr. rising.
.
Charts:Peerless
DJIA Hourly DJIA
DIA
NetIDOSC for DJI-30
SPY
QQQ
IWM
DJI-Utilities REITS
A/D Line-6000 Stocks
SOXL
TECL
IBB
FAS
Crude Oil
Major Indexes and A/D
Lines.
Key Tiger Software ETF
Charts
Bullish MAXCPs
Bearish
MINCPs
Charts of Key ETFs
Can The Stock Market Keep Rising if Rates Go Up?
This is the big question! I gave this answer
today in an email.
..................................My guess is rates will go up soon.
A lot
..................................depends on Jobs numbers and what is reported
..................................for inflation numbers. Semi-conductors
strength
..................................to be a sign that economy is getting stronger
..................................and Jobs number Friday will be over 240,000.
..................................for third straight month. This would be
consistent
..................................with what we see in mkt.
..................................How much money might come out of bonds and
..................................go into stocks, if business confidence and
Jobs
..................................numbers are improving?
..................................Bonds can certainly go down while the stock
market rises when
..................................economy is getting strong enough to push up
rates
..................................or allow Fed to do same. But this will
require rising corporate
..................................profits occasioned by the better economic
times. .
.................................. A couple of weeks ago, I showed that there
were
...................................a number of cases when Utilities (a surrogate
for
...................................bonds) formed head/shoulders tops (as now)
but
...................................market kept rising. So, the past does
show that the
...................................stock market can for a while shrug off rising
interest
...................................rates and falling bond prices.
....................................My view here is conventional. See the
article
....................................below.
http://www.fool.com/knowledge-center/when-do-stock-bond-prices-move-in-opposite-directi.aspx
Head and Shoulders has not yet been
completed
for Tiger Index of Bond Funds.
==================================================================================
8/29/2016
By itself, the low volume rally today was unconvincing. But it almost
brought another NYSE A/D Line new high. That would be bullish. And
today's advance probably showed traders that there is enough support at
18400 to bring on another test of the 18600 resistance. A bullish, flat
topped
ascending triangle can now be said to be developing in the DJI. A breakout
to
new highs usually follows when prices trace out such a pattern.
For such a breakout to be reliable and not bring a Peerless Sell, we
will need to see volume pick up and for the P-Indicator, Accum. Index
and V-Indicator improve substantially. Still, that is what the operative
Peerless Buy signals, (Buy
B3, Buy B19,
Buy B20 and
Buy-B14), taken
together with a run into all-time high territory, argue is most likely to happen
next.
The 5-day ma are still falling for DIA and
SPY.
Gold stocks could not
manage much of a rebound.
Utilities and REITs are still
in the shadow
cast by the very vocal hawks on the FOMC. They should be avoided.
Friday's Jobs numbers will probably show another +240,000 number.
That would explain the strength in the widely used Semi-Conductors and
continuing weakness in dividend stocks and
Bonds.
Charts:Peerless
DJIA Hourly DJIA
DIA
SPY
QQQ
IWM
DJI-Utilities REITS
A/D Line-6000 Stocks
SOXL
TECL
IBB
FAS
Crude Oil
Major Indexes and A/D
Lines.
Key Tiger Software ETF
Charts
Bullish MAXCPs
Bearish
MINCPs
Charts of Key ETFs
Another bullish factor now is how the
Big Banks are rising back towards
their highs of the year. FAS, the
3x-leveraged ETF representing financials,
now shows both the Opening and Closing Power rising. This is not the
behavior I would expect if the market were about to start even a correction.
FAS should be bought and held along with
SOXL and
TECL, at least, as
long as they are above their 5-day ma pivot points. Bullishly, both their
Opening and Closing Powers are rising. I would also buy those MAXCP
that are starting new runs from flag patterns. In a market environment,
where
speculative excesses in individual stocks are not really much in evidence,
these stocks should get increasing focus from performance-minded hedge funds in
the third quarter: Consider VAR,
SNPS, BPOP,
RDCM,
ATEN,
WB and
SINA.
If you are looking for Bearish MINCPs to hedge with, I take the most
bearish looking now to be: CONN,
INSY, JJC and
FAZ.
Buy FAS, for a trade
back to its highs, at the least.
Big banks are not fazed by the prospects of higher interest
rates now. Such an eventuality will only make the Dollar stronger
and make New York even more the financial center of the much
of the world.
,
Peerless Signals and Indicators on DJIA


==================================================================================
8/26/2016
Still Waiting for A Pre-Labor Day Recovery. ..
Because volatility and volume should soon pick up after Labor Day,
I think a case can be made that the various markets could soon move quickly
and decisively away from their narrow high-level range. Peerless and the
rising A/D Line tells us the next big move will be up. But the
micro-head/shoulders
in DIA and SPY and dominance of hawkish talk from the Fed suggest more
downside lies ahead. In this environment, I continue to suggest that
we
abide by the direction of the 5-day ma, holding only
SOXL for now among the
ETFs while limiting new short-term long commitments mainly to
MAXCP
stocks. It appears that the market is making a fundamental shift
from
defensive stocks to more speculative growth and tech stocks.
Unsignalled DJI Declines
We still show a (Buy
B3, Buy B19,
Buy B20 and
Buy-B14) as the operative
Peerless signals. But there is much more to consider. First. in the
past about
once every two or three years, the DJI has still, despite the Buys, managed
to retreat 5% -7% in a rising bull market. These unsignalled declines
mainly
occurred only after the DJI either made a top farther above the 21-day ma and so
had a long way to pull back when it probed for support
or after the DJI quickly
made a bearish head/shoulders pattern to cope with unexpected bearish news.
(See my study of these unsignalled declines.)
In our present case, the top was made on August 15th with the DJI only 0.7%
over the 21-day ma. Only once since 1928, did Peerless fall as much as
4.9% or
more from a top without a Peerless Sell signal when the DJI was this close
to the 21-day ma. While it's true that the V-Indicator and OBVPct were
negative
on August 15th, my studies show that one can not use these parameters to create
a reliable Peerless
Sell. Just the opposite.
If divergences at the DJI's recent peak did not produce a Sell, I take it then
that
is the presence of the
head/shoulders in the DJI that is technically significant.
All Peerless Buys can be reversed by completed head and shoulders patterns
on the DJI. See
http://www.tigersoft.com/PeerInst-2012-2013/HS-SellS10/index.html
These patterns typically appear as the market suddenly copes
with something new
and unexpectedly bearish.
Almost certainly, now it is the vocal aggressiveness
of the hawks on the FOMC that has caused the head/shoulders.
As we keep pointing out, we do now see micro head/shoulders
patterns in the DJI
and
SP-500. There is also a key high-level flat support in the
NASDAQ.
The good news is that such micro-head/shoulders patterns in the DJI when
completed usually only
bring tests of a rising 65-dma or lower band when they occur
in bull markets. See below.

Vice-Fed Governor Fisher
The Fed Is Scaring The Market Again.
It Finds It Easier To Do This Than Actually Raise Rates.
The Fed, or at least Vice-Fed Governor Fisher, is talking seriously about two
rate hikes this year. Considering how much the DJI has risen and how
important
very low interest rates have been in the stock market boom, the market has to
take
him seriously. After all, he is considered a neo-Keynesian. Fisher
seems now
to have gathered more support in the FOMC while at the same time, Chairwoman
Janet Yellen's utterances appear increasingly vague and confusing.
Dividend Paying Stocks, Bonds and Gold Stocks Are Hit The Hardest
by Talk of Higher Interest Rates
Utilities have cracked decisively below their 65-dma with their Accumulation
has
turned negative. After having formed their own head/shoulders patterns, this has
to be
considered a SELL. See also how now
Bonds are on the very of breaking
down.
This is entirely the result of the FED's hawks new boldness and the muffled
acquiescence of the Doves, like Yellen. The Dollar, of course, has
strengthened
with this talk of higher rates. This is the main reason for
Gold's
weakness.
Banks Stocks Are Still in Uptrends.
The uptrend in FAS and the
Biggest US Banks tells us that we are not
about to see a market crash.
Semi-Conductors Leadership
Is Bullish for Technology Stocks and The General Economy.
Chinese Tech Stocks'
==================================================================================
8/25/2016
The Peerless Buys (Buy
B3, Buy B19,
Buy B20 and
Buy-B14) tell us that
the current decline will most likely not drop the DJI down 5% from its high.
Since 1945, only about once every 31 months, does the DJI fall 5% from its high
without a reliable Peerless Sell at or near the last peak.
Usually, a decline of 5% or more occurs when breadth is lagging the DJI.
a large H/S top appears and or the Accum. Index is glaringly red
as the DJI reaches a level 2.1% or more above the 21-dma. None of these
conditions have recently appeared
However, it is clear now that the DJI seems to be unable to get past the
(red) rising resistance line shown below. With that resistance being taken
as the ceiling for any advance now, traders in the DJI are showing that they
want to buy closer to the 65-dma where there is then more upside potential.
SOXL and
TECL, on the other hand, appear to have less resistance
overhead. They also show better internals than the DJI. As long as
their 5-day ma are rising, I would hold them in expectation of a Labor
Day Rally. But further DJI weakness will hurt them. This and the
fact that volume and volatility are likely to expand after Labor Day makes
me suggest that we simply trade long only those ETFs so long as their
5-day ma is rising.
We do see micro-sized H/S patterns in the DIA and SPY now. Any deeper
decline will violate them. This will prpbably be bearish enough to
drop them
back to their rising 65-dma. But without a Peerless Sell, I would expect
the 65-dma to hold. All the stocks' research I have done on
head/shoulders
supports the same conclusion. Head/Shoulders patterns that are completed
considerably above the 65-day ma can only be counted on to bring tests of
the 65-dma. Deeper declines are particularly unlikely when the 65-dma
momentum
is still strong and the Accum Index is positive. When we look at DIA and
SPY,
we see that their 65-dma are still rising nicely and the their Accum Indexes
are still positive.
 |
 |
More Considerations
Right now there are only 4 DJI-30 stocks that show their own bearish
Head/Shoulders
patterns. This is not enough to be scary. In each of the last 5 DJI
corrections
of more than 13%, no fewer than 12 or 13 of the DJI stocks had completed head/
shoulders before the decline could start in earnest.
Tomorrow at 10:00 Janet Yellen will make a speech on behalf of the FED. It
is
expected that she will say that keeping interest rates as low as they have been
runs too much risk of a speculative stock bubble, does not help the real Economy
and would be inflationary if the Economy were to be expanding normally. I
still doubt
if she will pin herself down about raising rates in September. I think
that she
is too cautious to do that.
Gold Stocks, Utilities and the DJI have been selling off in expectation, I
think,
that she will be more specific and definite about raising rates in September.
If
I am right, she will be vague and indefinite about when rates will next be
raised.
That ought to take some of the pressure of the market and a pre-Labor day
rally "should" occur.
But to be safe, watch the 5-day mvg, averages of the pivot-points of the
key ETFs. I would be long those that show rising 5-day ma and remain
above their pivot-points for tomorrow's close.
5-day ma Close Pivot Point
Comments
direction 8/25 for 8-26
-----------------------------------------------------------------------
DIA
Falling 184.37
185.32
SPY
Falling 217.7
218.54
QQQ
Falling 116.61
117.26
Cl.Pwr is rising.
IWM
Rising 123.31
122.94 Cl.Pwr
is rising.
SOXL
Rising
42.35 42.22
Both Op.Pwr.& Cl.Pwr. rising.
TECL
Rising
46.07 46.10
Cl.Pwr is rising.
Charts:Peerless
DJIA Hourly DJIA
DIA
NetIDOSC for DJI-30
SPY
QQQ
IWM
DJI-Utilities REITS
A/D Line-6000 Stocks
SOXL
TECL
IBB
FAS
Crude Oil
Major Indexes and A/D
Lines.
Key Tiger Software ETF
Charts
Bullish MAXCPs
Bearish
MINCPs
Charts of Key ETFs
Watch for Head/Shoulders Patterns
in the Groups/ETFs You Trade
The
recent sell-off in Gold and Silver stocks did not come out of the
blue. Many of the stocks in this hot industry group showed head/shoulders
tops recently. This should have allowed traders to confidently predict a
test of their rising 65-dma, at the least. See
NEM and ASA below.
Also AEM,
GG,
KGC,
GFI,
GDX,
CDE,
NGD and
RGLD
 |
 |
==================================================================================
8/24/2016
I keep expecting our standing Peerless Buys (Buy
B3, Buy B19,
Buy B20 and
Buy-B14)
to start a nice recovery in here. But something negative is clearly
weighing down the
DJIA, gold stocks (the previously strongest group) and Utilities (another
previously
very strong group). Today, this dark shadow finally sent technology and
semi-conductors down. Short-term traders must appreciate that though
the intermediate-term trend is still up, we could see a decline to 18000 on the
DJI or even a 5% drop from the recent high to 17800 if the next support
down at 18250 is violated. See the research I posted here last
night. My
suggestion is that ETF traders should trade long only those ETFs with a
rising 5-dma.
ETFs
8/24 5-dma
IP21
Close Pivot Point
------------------------------------------------------------
DIA
185.66 186.34
+.137 5-dma falling
SPY
217.85 218.86
+.184 5-dma falling
QQQ
116.8 117.29
+.189 5-dma falling
IWM
123.07 122.94
+.117
SOXL
41.84 41.15
+.107 Strongest of the 6
TECL
45.89 45.97
+.132 5-dma falling
Weakness tomorrow could easily complete the bearish-looking
"micro-head/shoulders
in the DJI". 18250 looks like it would then be the next DJI support
that will have to be tested.
Look for An Increase in Volatility and Volume
Given the "high diving board" appearance of many of the ETFs and the tendency of
of volatility to pick up when their is a decisive breakout or breakdown from
narrow
ranges like those that now govern DIA, SPY, QQQ and IWM
plus the tendency of trading
volume to pick up after Labor Day, I recommend that
traders only get or stay long
the ETFs below when and while their 5-day mvg.avgs. are rising.
If their close tomorrow
is below the "pivot-point" shown below, it means the 5-day ma will be falling
with
tomorrow's data.
FED GUESSING
We can only guess right now what is driving the market down.. My
guess is that the
market expects the FED this weekend to announce that their (the Fed's) tools,
i.e. monetary policy (interest rate determinations and their own open market
activities) should no longer be relied on to boost the market. These tools
can stop a
Crash but they don't help much Main Street in a recovery or bring enough real
economic growth. Easy money and quantitative easing, the argument goes,
are
distorting investments, causing a risky inflation of stock prices and only
making
the very rich on Wall Street even richer while the Middle Class and working
people's income stagnate.
My guess is that these well-known criticisms of the FED can no longer be pushed
aside. I suspect that the FED themselves will now invoke them when they
they
announce this weekend that rates must soon (September) be returned to more
normal levels barring an unforeseen drop in Jobs numbers in August.
===========================================================================
8/23/2016
Our Peerless Buys (Buy
B3, Buy B19,
Buy B20 and
Buy-B14 and the
seasonal strength just before Labor Day should now turn the major
ETFs back up. Though the DJI sold off after opening up 100, breadth
remained very good and the NYSE A/D Line made another 12-month
high ahead of the DJI-30. Usually we need to worry about the market
when the A/D Line is lagging the DJI, not so often when it is leading the
DJI.
Right now, the DJIA is lagging our favorite ETF right now,
SOXL,
by enough so that I would prefer to buy SOXL or QQQ. I think we
should
wait for the DIA's 5-day mvg.avg.. to turn up to buy it. The DJIA is being
held back because of concerns about what Janet Yellen will say
this weekend from the Fed Governors' gathering in Wyoming.
It has been the FOMC's hawks that have been doing most of the talking
recently. This has caused Utilities to drop more than 5% down from their
peak and violate their 6-month price uptrend and their 65-dms. The same
new
concerns about a rate hike this year have caused
Gold Stocks to fall back
almost to their rising 65-dma.
But there's probably more than Rate Hike fears at work here. There
is new enthusiasm for more speculative bonds and stocks now that the
Economy has been able to post two months' New Jobs' numbers over
250,000. Look at how strong
Junk Bonds are. In addition, the
NASDAQ's
"RELDJI" (relative strength vs the DJIA) is positive as it makes all-time
highs. Similarly, Semi-Conductors are outperforming the DJI and today
SOXL made a new all-time high to match its usual companion,
TECL.
I think we have to be buyers of SOXL and
QQQ now because their 5-day ma
are strong and technology stocks are taking over the leadership of the market
from the Utilities,
Gold Stocks and even the
DJI.
ETFs
8/23 5-dma
IP21
Close Pivot Point
------------------------------------------------------------
DIA
185.3 186.10
+.165 5-dma falling
SPY
218.97 218.37
+.267
QQQ
117.56 117.26
+.216
IWM
124.08 122.04
+.179
SOXL
42.95 40.26
+.243 Strongest of the 6
TECL
46.54 46.03
+.192 5-dma falling
Charts:Peerless
DJIA Hourly DJIA
DIA
NetIDOSC for DJI-30
SPY
QQQ
IWM
DJI-Utilities REITS
A/D Line-6000 Stocks
SOXL
TECL
IBB
FAS
Crude Oil
Major Indexes and A/D
Lines.
Key Tiger Software ETF
Charts
Bullish MAXCPs
Bearish
MINCPs
Charts of Key ETFs
Declines of 5% or more without a
Peerless Sell
Since 1945, about 71 years, there have been only 27 cases
where the DJI
fell more than 5% without Peerless having given a Sell. This means a DJI
decline of 5% to 11% occurred about once every 2.6 years without Peerless
giving an automatic warning. In bull markets making new highs, like the
present case, where Peerless was on a Buy, the biggest unheralded DJI declines
were from tops on:
Pct Decline
at nadir.
11/3/1982 7%
The previous top was 5.9% over 21-dma.
10/18/1991 7.0%
The previous top was 2.3% over 21-dma.
8/6/1997 7.4%
The previous top was 2.5% over 21-dma.
In all but 3 of all 27 cases, the previous top before the decline was
at least 1% over the 21-day ma. Our most recent top on 8/15/2016 was
only 0.7% over the 21-day ma. Only one of 27 of the "uncalled" tops took
place so close to the 21-day ma. (The full list will be provided in a day
or two.)
===================================================================================
8/22/2016
Our Peerless Buys
(Buy
B3, Buy B19,
Buy B20 and
Buy-B14 and the
seasonal strength just before Labor Day should now turn the DJI and the major
ETFs back up. It will take only a small advance tomorrow at the
close to turn up
most of the key 5-day ma up. A close above the key values listed below
will turn each up. I'm optimistic also because of the rising
HRDJI OBV-DISI
and the persistent strength of the A/D
Line.
ETFs
8/22 5-dma
IP21
Close Pivot Point
------------------------------------------------------------
DIA
185.12 185.76
+.185
SPY
218.63 217.96
+.267
QQQ
117.35 117.05
+.276
IWM
123.22 122.4
+.187
SOXL
42.27 40.28
+.286 Strongest of the 6
A close over 43 would be an all-time high.
TECL
46.04 46.09
+.192
Charts:Peerless
DJIA Hourly DJIA
DIA
NetIDOSC for DJI-30
SPY
QQQ
IWM
DJI-Utilities REITS
A/D Line-6000 Stocks
SOXL
TECL
IBB
FAS
Crude Oil
Major Indexes and A/D
Lines.
Key Tiger Software ETF
Charts
Bullish MAXCPs
Bearish
MINCPs
Charts of Key ETFs
What To Buy?
I would choose SOXL if it advances past 43 to
an all-time high.
What else will lead a rally in here? Typically, the
Bullish MAXCPs do well.
So, do any stocks that give a new Red Stochastic Buy. Looking at the
individual DJI stocks, I would favor those showing the highest current
Accum. Index. MRK's IP21 is the highest at +.398. INTC's IP21 is
+.278. Consider also buying CVX, whose AI/200 score is 192 if it can close
decisively back above its 65-dma. I would like to
AAPL move to a new
recovery high to destroy its micro-Head/Shoulders pattern.
==================================================================================
8/19/2016
A day or two more of weakness seems likely. Then seasonal
strength should bring a rally to new highs.
The Next Two Weeks
Seasonality should bring a good rally soon into Labor Day,
September 5th. Reflecting this, since 1965, the DJI has risen
59.2% of the time over the next 10 trading days. In Presidential
Election Years, the odds of a rally shift to 66.7% if the
past since 1968 is taken as a guide.
Downside Risk Seems Limited
Without a Peerless Sell, the micro-head/shoulders patterns will
probably not bring a DJI drop below 18400. Buy TECL back
either
when its 5-day ma turns back up or at its 43 support.
Our Peerless Buys (Buy
B3, Buy B19,
Buy B20 and
Buy-B14
are confronting a market that seems, for now, to have lost its ability to
rise with any vigor. Part of the problem is the way both NYSE Up
and Down Volume are drooping in the heat of August.
The DJI will need to rise by more than 80 at its close on
Monday to turn up its 5-day ma.
What's causing the subsidence and drying up of aggressive
buying? The rise in Crude Oil.
It will bring more inflation and this
will strengthen the determination of the anti-inflation "hawks
in the Federal Reserve. Reflecting this, the
DJI-15 (Utilities) fell back on
Friday from its 65-dma resistance. My own belief is that the FED
will not raise rates this year. It does not want to make the
same mistake it did in 2008. Utilities may hold back, though,
in expectation of higher rates next year.
The NASDAQ is developing into a problem, too. It pushed to an
all-time high, but now seems stuck in a rising wedge. Its rallies
have produced tops that are not rising as fast as its up-trendline.
Its chart shows that a micro-head/shoulders could be forming.
But the NASDAQ's Accumulation Index (IP21) now is very
positive. This should mean that there will plenty of big buyers should
it fall back to the 5000 round number support.
And then there are the micro-head/shoulders in the DJI, SP-500,
DIA and SPY. Micro-head/shoulders patterns are rare, but they
can certainly bring declines back to a rising 65-dma. Without a
new Peerless Sell signal, it is very unlikely the DJI will fall below
the support at the 3.5% lower band and the rising 65-dma.
Charts:Peerless
DJIA Hourly DJIA
DIA
NetIDOSC for DJI-30
SPY
QQQ
IWM
DJI-Utilities REITS
A/D Line-6000 Stocks
SOXL
TECL
IBB
FAS
Crude Oil
Major Indexes and A/D
Lines.
Key Tiger Software ETF
Charts
Bullish
MAXCPs
Bearish
MINCPs
Charts of Key ETFs
History of Head/Shoulders in DIA and SPY since
1995
There were 7 micro/mini Head/Shoulders on DIA since
1998.
All of these had a Peerless Sell signal first.
DIA
SPY
1995
N/A
none
1996
N/A
H/S in November aborted as prices rise above right
shoulder apex
1997
N/A
December - very quick and shallow decline only
1998
N/A
Aug - Multiple Peerless Sells. Big decline.
1999
May & Sept - Multiple Sells- Normal correction.
2000
Sept MACRO H/S
Sept -
Also Peerless Sell S4 at top.
2001
June
Feb - MICRO H/S & June
regular H/S - Peerless Sells. Bear Mkt.
2002
March MICRO H/S
Aug MICRO H/S - Peerless
Sells. Bear Mkt.
Also Peerless Sell S15 beforel top.
2003
2004
Sept MICRO H/S -
Peerless Sells. Interm. Decline.
2005
March MICRO H/S
March MICRO - Peerless
Sells. Interm. Decline
Also Peerless Sell S4 at top
2006
May
Nov - Peerless Sells. Interm. Decline
2007
Oct MICRO H/S
Peerless Sells. Intermed. Decline
Also Peerless Sell S4 at top.
2008
May MICRO H/S
June H/S - Peerless Sells. Bear Mkt.
Also Peerless Sell S4, S9, S15 at top.
2009
Aug MICRO - only shallow
decline
2010
April MINI H/S
April MINI H/S Peerless
Sell. Flash Crash
Also Peerless Sell S11 before top
2011
2012
Oct H/S
Sept. aborted.
2013
Aug H/S
Aug H/S October MICRO
2014
Oct/H/S
Nov H/S
2015
June MICRO H/S
FEB H/S & NOV H/S
Also Peerless Sell S12 at top
 |
 |
==================================================================================
8/18/2016
The operative Peerless Buys (Buy
B3, Buy B19,
Buy B20 and
Buy-B14
tells us any decline in here will soon be followed by more new highs.
The NYSE A/D Line bullishly made another new high ahead of the
DJIA itself. NYSE Down Volume keeps falling. And now the Hourly
DISI/OBV has turned up. So has the DJI-15 (Utilities), which got back
above its 65-dma. Meanwhile Crude Oil has risen back to its 65-dma
resistance but refuses to sell off. These are all constructive signs.
The past week's Hotlines present a number of studies suggesting
there will be more new highs:
1) The presence of only 2 head/shoulders patterns
in the DJI-30 compared to the 12 or 13 that appeared before
intermediate-term >13.5% selloffs in 2010, 2011, 2015 and 2016.
2) How well the market does each month until November
when the Democrat is about to win the Presidential Election.
3) How Semiconductors and TXN, in particular, usually top
out and show head/shoulders patterns before there is a serious
decline. Neither is true in here yet.
4) How a completed H/S pattern in the Utilities has brought
not a decline, but significant rallies for the DJI in each of its last 3
appearances since 2009 and the Federal Reserve's institution of "QE"
and "free money" for big banks.
5) How well the DJI does after after breaking out into all-time
high territory above well-tested flat resistance going back more than 5 months.
All this is very nice, but we do not want to let healthy profits slip away.
I suggest that traders close out volatile ETFs if their 5-day ma should
turn down. Therefore watch the QuickSilver 5-day ma pivot points,
as posted below. And let's also watch the short-term price patterns of
the key ETFs. These could be forming micro-H/S patterns. After our
experience with mini-H/S patterns in 2010, I think we have to be alert
for such patterns and not dismiss them. Another "flash crash" is
could happen. Perhaps, Obama's move to de-privatize prisons is an
opening salvo that could adversely affect other stocks and even the
market as a whole.
Charts:Peerless
DJIA Hourly DJIA
DIA
NetIDOSC for DJI-30
SPY
QQQ
IWM
DJI-Utilities REITS
A/D Line-6000 Stocks
SOXL
TECL
IBB
FAS
Crude Oil
Major Indexes and A/D
Lines.
Key Tiger Software ETF
Charts
Bullish
MAXCPs
Bearish
MINCPs
Charts of Key ETFs
The Market Does Not Like Sudden Changes
or De-Privatizations. The Obama Administration
has announced it will end he use of private for-profit
prisons. Might this spook the market? CXW lost
1/3 of its value today. Might there be other
moves to de-privatize that we should be looking at
as short sales? This does create a negative "buzz"
for certain other stocks. Someone on Yahoo wrote:
"Are private insurers next? UNH, HUM, AET? Government
may put pressure on them since they are raising rates so high (sic)
for next years."
https://gma.yahoo.com/justice-department-announces-effort-end-private-prisons-172756594--abc-news-topstories.html?hl=1&noRedirect=1
Potential Micro-H/S Patterns have appeared.
A rally tomorrow would bullishly abort them. But
a sell-off and a close below their green necklines
would complete them.
 |
 |
2010 Mini-H/S in DJIA/DIA
|
I would not be too concerned yet about the appearance of
what might become micro-head/shoulders pattern in the DJI, NASDAQ,
SP-500, OEX and NYSE if they should make a 10 day closing low. The
completion of such patterns would "probably" have only minor and
very short-term significance. See the potential micro-H/S pattern just
above.
I have circled them in pink and the neckline-supports are shown in green.
It would take a sharp sell-off over the next two trading days to break their
necklines. If these necklines were broken, caution would be then required,
remembering April 2010's quick mini H/S tops just after the British Pete.
big spill in the Gulf of Mexico. That brought a "flash crash" and a
13.5%
decline.
2010 Flash Crash Mini H/S Patterns in DIA and SPY shown
below
took 18 days to form and be completed. Our micro-H/S patterns now have
been traced out over only 9 days, so far. Red Down-Day volume was
also noticeably higher as the markets started down in 2010. So, I doubt
if these micro-H/S patterns will be completed or be as bearish if they are.
 |
 |
On the other hand, a rally here would obliterate these patterns
and that would be bullish. I think this is a good time to watch and use
the 5-day ma. Declines by the major ETFs belowtheir 5-dma pivot points
tomorrow should be used to take profits and Sell.
Last night, I suggested applying this rule. That would have meant selling
TECL and BRZU today. See the pivot points on their charts. Remember
that
a close below those levels on Friday will cause their 5-day ma to be falling,
which in the present circumstances I would take to be a QuickSilver Sell.
8/18/2016 QuickSilver Key Values and Big ETFs
ETF Closing 5-dma
Closing IP21 ITRS
Price Pivot Point
Powers
to apply
to tomorrow's
Close
----------------------------------------------------------------------------------
DIA 186.34
185.9
NH
NC +.19
------
SPY 218.86
218.46
rising +.242
-.004
QQQ 117.29
117.20 rising
+.262 +.028
IWM 122.94
122.19 rising
+.126 +.003
SOXL 41.15
39.52
rising +.302
+.278
TECL 45.97
46.41
rising +.181
+.153
BRZU 150.5
152.43
rising +.11 +.555
YINN 19.19
18,19 rising
+.28 +.235
==================================================================================
8/17/2016
The operative Peerless Buys (Buy
B3, Buy B19,
Buy B20 and
Buy-B14
remain in effect. We should see more new highs.
But the shallow short-term decline
we are seeing now is apt to continue
if there is not a rally tomorrow. We can say this based on the fact that
the
"pivot-points" (for the 5-day ma) could easily be closed below at tomorrow's
close. A close below these pivot points will cause their
5-day ma
to turn down. Short term traders in volatile and leveraged ETFS should
probably take profits in these ETFs when they close below their "5-dma
pivot-points". TECL's 6-dma did turn down today. Let's lock in profits
in it. Elsewhere, intermediate-term investors can wait to Sell when we get a
a new Peerless sell signal or a head/shoulders pattern is completed in them.
ETF Closing 5-dma
Closing IP21 ITRS Tiger
Price Pivot Point
Powers
Signal
to apply
to tomorrow's
Close
---------------------------------------------------------------------------------------------
DIA
186.1
186.3
NH NC +.163
------ Buy
SPY 218.37
218.65
rising +.227
-.006
Buy
QQQ 117.26
117.25 rising
+.282 +.027
Sell
IWM 122.04
122.07 rising
+.116 +.001
Sell
SOXL 40.26
39.02
rising +.278
+.268 Sell
TECL 46.03
46.62
rising +.212
+.161 Buy
BRZU 153.41
158.42
rising +.126
+.824 Sell
YINN 18.76
18.04 rising
+.275 +.217
Buy
Charts:Peerless
DJIA Hourly DJIA
DIA
NetIDOSC for DJI-30
SPY
QQQ
IWM
DJI-Utilities REITS
A/D Line-6000 Stocks
SOXL
TECL
IBB
FAS
Crude Oil
Major Indexes and A/D
Lines.
Key Tiger Software ETF
Charts
Bullish
MAXCPs
Bearish
MINCPs
Charts of Key ETFs
How many head/shoulders tops typically appear
among DJI-30 stocks at market tops?
Presently there only 2 two such H/S patterns among DJI-30 stocks:
JNJ and VZ.
Before January 2016 top: 12 DJI stocks showed H/S patterns.
(AAPL,
DIS, GS,
JNJ, MMM,
MSFT, NKE,
UNH, UTX,
V, VZ and
XOM.)
Before July 2015 top: 13 DJI stocks showed H/S patterns.
(BA, CAT,
CSCO, CVX,
DD, DIS,
GS, JNJ,
NKE, PG,
UTX, VZ,
XOM)
Before July 2011 top: 12 DJI stocks showed H/S patterns.
(AAPL,
AXP, BA,
CAT (hands above head),
HD, JPM,
MMM, MRK,
NKE, PFE,
UNH, WMT)
Before April 2010 top: 12 DJI stocks showed H/S patterns.
(CSCO, GE,
HD, IBM,
JNJ, JPM,
KO, MCD,
MSFT, PG,
TRV, WFC,
and see DIA's H/S top, too.)
==================================================================================
8/16/2016
The break in the Closing Power uptrend for DIA following its
failure to confirm the recent high is bearish enough to allow
the DJI to retest 18300, and DIA 183,
provided DIA closes
below 185.12 tomorrow and its 5-dma therefore turns down.
A further shallow decline would then be called for. But without
a new Peerless Sell, I would continue to hold long positions in
TECL, SOXL,
LBJ, BRZU
and YINN.
When Peerless operates under major Buys as now
(Buy
B3, Buy B19,
Buy B20 and
Buy-B14), there can still
be
DJI declines to the lower band, but they are relatively
rare and we generally are better off waiting for higher prices.
I think that applies now, despite the completion by the Utilities
of a second head/shoulders pattern this year. See the
Utilities'
H/S Top Pattern Study further below.
Of more concern would be the appearance of a number of
completed head/shoulders
patterns in the DJI-30.
Presently, there are only two such H/S patterns among DJI-30 stocks:
JNJ and VZ. By contrast, before the DJI's big January sell-off this year,
no fewer than 12 DJI stocks showed H/S patterns. Look at their charts.
Except for JNJ and VZ, no others show such bearish patterns. I think
this has to be considered another bullish factor for now: See all these
Jan 2016 H/S DJI stocks: AAPL,
DIS, GS,
JNJ, MMM,
MSFT, NKE,
UNH, UTX,
V, VZ and
XOM. This would make a useful study
for earlier
declines. I will try to do a little more work here and start to regularly
report the number of currently extant DJI H/S patterns.
Stay long this market...
Charts:Peerless
DJIA Hourly DJIA
DIA
NetIDOSC for DJI-30
SPY
QQQ
IWM
DJI-Utilities REITS
A/D Line-6000 Stocks
SOXL
TECL
IBB
FAS
Crude Oil
Major Indexes and A/D
Lines.
Key Tiger Software ETF
Charts
Bullish
MAXCPs
Bearish
MINCPs
Charts of Key ETFs
What happens when DJI-Utilities completes a
head/shoulders
pattern and Peerless does not show a major Sell?
There have been 9 cases since 1988. In 5 cases the DJI fell to or near
to the lower 3.5% band. But in 4 cases, the DJI rallied instead of
falling.
In the last 3 cases, when there was no Peerless Sell, the DJI rallied.
It is more bearish, when charts show more than one head/shoulders pattern.
The DJI-15 also completed a head/shoulders pattern in April.
---> See all the Utilities
and DJI charts since 1988 here.
DJI-15 (Utilities) H/S Completed
DJI reaction
1 H/S Pattern completed in July 1989 -->
DJI fell 3.8% below 21-dma. No Peerless sell signal.
2 H/S Pattern completed in Aug 1992 --> DJI fell
3.5% below 21-dma. No Peerless sell signal.
3 H/S Pattern completed in Sept 1993 --> DJI fell
2.5% below 21-dma. No Peerless sell signal.
4 H/S Pattern completed in Nov 1995 --> DJI
rose instead of falling. No
Peerless sell signal.
5 H/S Pattern completed in June 2007 --> DJI fell
2.0% below 21-dma. No Peerless sell signal.
6 H/S Pattern completed in Dec 2009 --> DJI fell 4.0%
below 21-dma. No Peerless sell signal.
7 H/S Pattern completed in Aug 2012 --> DJI
rose instead of falling. No
Peerless sell signal.
8 H/S Pattern completed in May 2013 --> DJI
rose instead of falling. No
Peerless sell signal.
9 H/S Pattern completed in May 2014 --> DJI
rose instead of falling. No
Peerless sell signal.
================================================================================
8/15/2016 The still active Peerless Buys (Buy
B3, Buy B19,
Buy B20 and
Buy-B14
should continue to guide us. But the shift away from dividend to tech
stocks and the strongest of Chinese and Emerging markets intensified.
Today, the DJI-15 (Utilities) closed below both its rising 65-dma and its 5%
down-from-the high line. This is a bearish sign for utilities and
dividend plays, generally. But the investment shift away from dividends
to growth is long over-due and usually occurs naturally in an economic
recovery. I suspect the DJI will show some minor weakness now to reflect
this shift. You can see the Hourly
DJI's DISI-OBV Line is in a minor down-
trend. Fortunately, NYSE Down
Volume is bullishly in its own downtrend.
Utilities Have Broken Their Uptrend-line.
Both Opening and Closing Power are falling.
SOXL, TECL,
YINN and BRZU
should keep rising and should not
be sold until Peerless gives a Sell
or they form Head/Shoulders tops.
SOXL (Semi-conductors) rose to a recovery new high above 40 and
is now challenging its all-time high of 42.46 on June 1, 2015. Since
semi-conductors
are such a capital intensive industry, a breakout into all-time high territory
by SOXL
would have to be taken as as an important vote of confidence that economic
growth
will increase world-wide. The same interpretation, that there is a
world-wide
turnaround under way, also would explain the powerful rebound of
Crude
Oil up from its test of its
200-day ma.
Our favorite technical pick, TECL (3x-technology ETF), closed at 48 today,
up exactly 20% since its perfect, flat-topped July 13th breakout into all-time
high territory. Continue to hold both SOXL and TECL. They trade very
well
with the Peerless signals.
Today also brought a very big jump in some volatile and speculative Chinese
stocks. YINN has almost gotten back to 20. Look at the beautifully
bullish Chinese stock charts of WB,
BABA,
CQQQ and
SINA.
Charts: Peerless
DJIA Hourly DJIA
DIA
NetIDOSC for DJI-30
SPY
QQQ
IWM
DJI-Utilities REITS
A/D Line-6000 Stocks
SOXL
TECL
IBB
FAS
Crude Oil
Major Indexes and A/D
Lines.
Key Tiger Software ETF
Charts
Bullish
MAXCPs
Bearish Stocks not posted tonight.
Charts of Key ETFs
One explanation for today's shift to NASDAQ stocks - and the NASDAQ
made an all-time high today - is that the Governor of the San Francisco Fed
made the case for Congress exacting automatic fiscal stimulants for
when the US economy is weak and inflation is not a problem so that
the FED will not have to use monetary stimulants so much. It is surprising
to hear a member of the Federal Reserve take such a Keynesian view, even
to the point where he seems to be advocating a big new Public Works program.
(Would this work, assuming Congress would somehow go along with it? As I
see it, there are two big problems with Public Works spending, which is
certainly
badly needed, are, first, that it will drive up interest rates and this will
hurt all
those seniors who are now overloaded with low-interest bonds and dividend
stocks. AND, second, that the famous Keynesian multiplier is much smaller
now, because so little manufacturing is still done in the US. Public
works
spending may have more of a stimulative effect for China than America!
See ....
SF Fed Federal
Reserve Bank of San Francisco. Search SF Fed ... 2016-23 |
August 15, 2016
====================================================================================
8/12/2016 Peerless Buys (Buy
B3, Buy B19,
Buy B20 and
Buy-B14 operate
still.
We could fuss over the low volume or how DIA's
Closing Power is not
above its 21-day ma, but these are not so bearish as to bring much of
a decline and I think there is more potential elsewhere anyway.
It does not pay to tell the DJIA or
the overall market to go down
after a flat-topped breakout from a 6-months or more trading range,
such as we saw when the DJI cleared 18000 and then 18000 recently,
which then goes into all-time high ground. Such patterns take a long
time to be built. They normally set up really nice advances unless
Peerless gives a Sell signal. Look at the cases of
Jan 1987,
Dec
1991,
March 1995,
October 1996,
May 1997,
Feb 1999 and see how failed breakout
of Jan. 2000 was properly identified as such by Peerless Sell signals.
The "talking heads" tell us August and September are bearish months
and the market can go nowhere at time of year. But, I've shown recently
that
when a Democrat is ahead in the Presidential Polls, as long as we are
not at war or suffering an economic slow-down/melt-down, the odds are better
than 2:1 that August will up, that September will be up and that October will be
up.
The Market as "Suction-Cup Climbing Man".

The market reminds me of the man using suction-cups climbing Trump Towers.
It is creeping upwards despite all the bearish commentary. As long as
there
is no rain in the form of Hillary pushing to breakup the big banks, to tax computer
trading or to make the tax on capital gains the same as ordinary income, I expect
the "suction-cup" market should continue to rise steadily if not dramatically.
I think there is a good chance that there is an international economic
turn-around. A Trump resurgence and protectionism would dampen
the rises in Chinese,
Brazil and
Latin American stocks, as would another
sell-off in Crude Oil. But right now,
there appears to be considerable upside
potential in these non-US markets' stocks. Watch also
Semi-Conductors (SOXL)
to see if it can make an all-time high above 42. Our favorite
TECL keeps
rising, after its perfect breakout above 40. Below I list 21 stocks/ETFs
that are trading particularly well with our Peerless Buys and Sells. Until
we get a Peerless sell signal, I expect the most bullish of these to keep
rising.
I will post their data on Tiger's Data Page as BIGPEER.exe Monday night.
Charts: Peerless
DJIA Hourly DJIA
DIA
NetIDOSC for DJI-30
SPY
QQQ
IWM
DJI-Utilities REITS
A/D Line-6000 Stocks
SOXL
TECL
IBB
FAS
Crude Oil
Major Indexes and A/D
Lines.
Key Tiger Software ETF
Charts
Bullish
MAXCPs Bearish MINCPs
Charts of Key ETFs
        WHAT STOCKS/HAVE BEEN TRADED BEST
          WITH PEERLESS BUYS and SELLS?

     I went through 6000 and came up with the 21
shown in TABLE 2, shown further below. Each of these would have seen
an investment of $10,000 in them double to more than $20,000 being
long only while Peerless was on a Buy signal in the last 12 months.


     Big gains are nice, of course, but, in addition, which of these
did not produce a paper loss of more than 5% on their long positions?

Only  AMKR and  LOCK.  Since LOCK has only been traded a few years. So
AMKR is of most interest.  It is in the strong semi-conductor field.

              Amkor Technology, Inc. provides outsourced semiconductor
              packaging and test services in the United States and internationally.
              Located in Tempe, AZ, the company offers turnkey packaging and
              test services, including semiconductor wafer bumps, wafer probes,
              wafer backgrinds, package design, packaging, and test and drop
              shipment services.
      As you can see below, only in 2012 was it not successfully traded with
Peerless on the long side.  What I like about AMKR is how few large paper losses
there have been.  We compare its gains and losses to DIA later tonight.


How well did Peerless do with AMKR for each of the last 10 years?
How consistently profitable.  What about the big paper losses?
Could they have been anticipated?  Look at the AMKR charts in the
years where the paper loss was more than 20%:  2008 (extreme bear market),
2013 and 2015.


                          Long Trades' Avg. Gain
                      using Peerless Buys and Sells.
                All trades here are taken at next day's opening.

                AMKR  max paper   DIA   max    QQQ     max
                        loss      gain  loss   gain    loss
------------------------------------------------------------------------
2005            +57.3   -19.4%    5.0%  -1.5%  13.9%  -3.5%
2006            +45.0%  -7.0%     15.5% -2.8%  11.7%  -7.9%
2007            +37.6%  -9.7%     26.5% -3.8%  29.6%  -4.9%%
2008            +13.9%  -30.0%     9.6% -16.2%  0.4%  -19.0%
2009           +245.5%  -9.3%     58.1% -3.4%  77.4%  -3.8%%

2010           +126.7%  -6.9%     36.9% -3.0%  62.1%  -4.1%%
2011            +17.7%  -10.6%    21.2% -5.5%  17.7%  -7.2%%
2012            -7.8%   -11.5%    17.2% -2.4%  21.4%  -3.2%%
2013            +38.7%  -26.1%    26.4% -1.4%  29.5%  -3.1%%
2013-2014      +219.3%  -4.6%     21.8% -1.4%  23.2%  -3.1%%

2014            +36.9%  -13.3%    16.4% -6.4%  26.0%  -3.6%%
2015            +12.9%  -29.6%    14.1% -1.9%  18.8%  -2.1%%
2015-2016      +132.1%  -3.2%     14.5% -2.6%  19.0%  -8.9%


Peerless Signals and Trading Gains Starting with $10000
-----------------------------------------------------------------
Directory=C:\goodpeer
 8/ 18/ 15- 8/ 12/ 16
Number of Symbols= 21
How well did Peerless do with AMKR for each of the last 10 years?
How consistently profitable. What about the big paper losses?
Could they have been anticipated? Look at the AMKR charts in the
years where the paper loss was more than 20%: 2008 (extreme bear market),
2013 and 2015.
Long Trades' Avg. Gain
using Peerless Buys and Sells.
All trades here are taken at next day's opening.
AMKR max paper DIA max QQQ max
loss gain loss gain loss
------------------------------------------------------------------------
2005 +57.3 -19.4% 5.0% -1.5% 13.9% -3.5%
2006 +45.0% -7.0% 15.5% -2.8% 11.7% -7.9%
2007 +37.6% -9.7% 26.5% -3.8% 29.6% -4.9%%
2008 +13.9% -30.0% 9.6% -16.2% 0.4% -19.0%
2009 +245.5% -9.3% 58.1% -3.4% 77.4% -3.8%%
2010 +126.7% -6.9% 36.9% -3.0% 62.1% -4.1%%
2011 +17.7% -10.6% 21.2% -5.5% 17.7% -7.2%%
2012 -7.8% -11.5% 17.2% -2.4% 21.4% -3.2%%
2013 +38.7% -26.1% 26.4% -1.4% 29.5% -3.1%%
2013-2014 +219.3% -4.6% 21.8% -1.4% 23.2% -3.1%%
2014 +36.9% -13.3% 16.4% -6.4% 26.0% -3.6%%
2015 +12.9% -29.6% 14.1% -1.9% 18.8% -2.1%%
2015-2016 +132.1% -3.2% 14.5% -2.6% 19.0% -8.9%
Peerless Signals and Trading Gains Starting with $10000
-----------------------------------------------------------------
Directory=C:\goodpeer
8/ 18/ 15- 8/ 12/ 16
Number of Symbols= 21
Symbol        $10000.       Biggest--     Gains/Losses  5% Stops-     10% Stops
------        becomes       Paper----     ------------  triggered     triggered
------        -------       Loss Pct
============================================================================
ADXS Long      28125         25.8          4   1         2             2
ADXS Short     18857         8             4             1
     combined  +474%
AGTC Long      21005         15.2          4   1         3             2
AGTC Short     15305         19.6          4             1             1
     combined  +231%
AMKR Long      22283         3.2           3   2         NONE         NONE
AMKR Short     13059         10.8          3   1         2             1
     combined  +231%

ANIP Long      23488         8.1           4   1         1
ANIP Short     13179         6.2           3   1         1
     combined  +275%
ARWR Long      20523         6.1           3   2         1
ARWR Short     16029         6.1           4             1
     combined  +250%
AVP Long       23136         32.3          3   2         2             1
AVP Short      12060         33.5          3   1         1             1
    combined   +199%
AXDX Long      28346         7.3           4   1         1
AXDX Short     18724         5.1           4             1
    combined   +445%

BCOV Long      25489         5.9           4   1         1
BCOV Short     10941         10.1          2   2         2             1
    combined   +180%
BRZU Long      39748         33.3          3   2         3             1
BRZU Short     12163         55.1          2   2         2             2
    combined   +422%

CECO Long      24002         11            2   3         3             2
CECO Short     12017         16.6          3   1         1             1
    combined   +194%
CSTM Long      27656         18.9          3   2         3             3
CSTM Short     18491         13.4          4             2             2
    combined   +452%
CYTK Long      25958         16.8          4   1         2             1
CYTK Short     14420         3.4           3   1         NONE          NONE
    combined   +276%
HWAY Long      26028         15            3   2         1             1
HWAY Short     11949         7             3   1         1
    combined   +217%
JOY Long       22688         37.9          3   2         3             1
JOY Short      10646         35.5          3   1         2             1
    combined   +150%
KTOS Long      20449         22.2          2   3         3             1
KTOS Short     14565         6.4           3   1         2
    combined   +211%
LOCK Long      25545         3.8           4   1         NONE         NONE
LOCK Short     13841         7.1           4             2
    combined   +267%
LXRX Long      23331         13.6          5             2             2
LXRX Short     14432         6             3   1         1
    combined   +240%
NKTR Long      26264         9.5           5             1
NKTR Short     16094         7             4             1
    combined   +336%
NPTN Long      27974         11.5          4   1         1             1
NPTN Short     12896         24.3          3   1         2             2
    combined   +272%
NUS Long       21890         15.2          5             1             1
NUS Short      13274         10.4          4             2             1
    combined   +198%
X Long         29502         35.7          3   2         2             1
X Short        14079         20.2          3   1         1             1
    combined   +363%
|
====================================================================================
8/11/2016 Our Peerless Buys
(Buy
B3, Buy B19,
Buy B20 and
Buy-B14
have properly kept us long as the SP-500,
NASDAQ and
DJI all made all-time high closings today.
With a little more
follow-through, I would say that the path of least resistance
is up.
Some minor profit-taking is a short-term, but
it looks like there will
be much more upside progress ahead. It would be nice to see
an increase in Up-Hour and Advancing Stocks' Volume. The
Hourly DJI's OBV Line broke its
uptrend-line today and the
V-Indicator is only slightly positive. But bullishly, there were 768
more up than down on the NYSE. TECL and
SOXL both rose.
Long depressed Emerging Economies' ETFs like those of Brazil and Latin
America (LBJ) continued to rise, boosted no doubt by the big jump in Crude
Oil prices. Considering how beaten down ETFs like
BRZU, LBJ
and UBR are, they should remain exceptionally
strong, certainly as long
as their Closing Powers are rising
and Peerless does not give a Sell signal.
Charts: Peerless
DJIA Hourly DJIA
DIA
NetIDOSC for DJI-30
SPY
QQQ
IWM
DJI-Utilities REITS
A/D Line-6000 Stocks
SOXL
TECL
IBB
FAS
Crude Oil
Major Indexes and A/D
Lines.
Key Tiger Software ETF
Charts
Bullish
MAXCPs Bearish MINCPs
Charts of Key ETFs

Table 1 below shows how well certain leveraged ETFs can be
traded on the long side, buying when Peerless gives a reversing Buy signal
and selling when Peerless gives a Sell Signal. The best are
A starting $10,000
would have now become
BRZU 3x Brazil
$41,266
UBR 2x Brazil
$26,456
LBJ Latin Amer.
$24,498
SOXL Semi-Cond.
$21,217
What makes BRZU so interesting is how well Peerless does in the past with
it. See
http://tigersoft.com/BRAZIL/index.html If the world economy is,
in fact, turning back upwards, as suggested by the strength we see in foreign
ETFs, YINN and
Crude Oil. then BRZU along with
UBR and LBJ could rise
a lot more. We have only to look at the 5-year charts of previously
depressed
JNUG and NUGT to see how far back upwards BRZU could still move.
"Long and Short" "Long"
Short
2001
+78.6% +31.5% +35.8%
2002
+62.1% +8.1% +50.0%
2003
+122.8% +124.9% -0.9%
2004
+87.2% +63.5% +14.5%
2005
+45.6% +45.6% no trades
2006
+133.7% +74.3% +34.1%
2007
+141.1% +119.8% +12.5%
2008
+155.3% +18.8% +115.0%
2009
+110.2% +108.8% +1.0%
2010
+29.3% +18.5% +9.2%
2011
+87.2% +24.3% +50.6%
2012
data not available
2013
+55.3%
-14.2%
+59.4%
2014
-29.4%
-64.7%
+30.0%
2015
+471.9%
+58.2
+258.7%
2015-2016 +583.2%
+367.0% +38.5%
BRZU DAILY
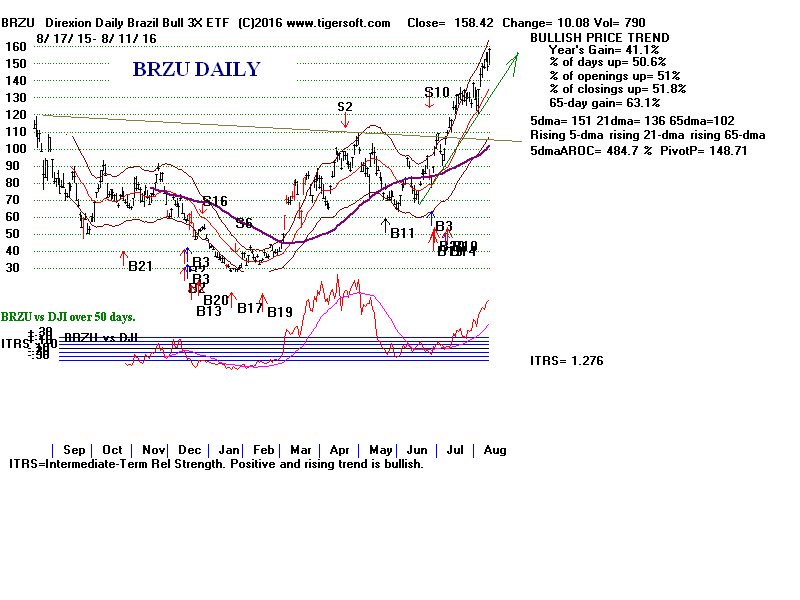
BRZU WEEKLY
| |
|
|
Table 1
Peerless returns on Leveraged ETF Longs over 50% in last Year,
excluding precious metals.Peerless Signals and Trading Gains Starting with $10000
-------------------------------------------------------
Directory=C:\leverage
8/ 17/ 15- 8/ 11/ 16
Symbol        $10000.       Biggest--     Gains/Losses  5% Stops-     10% Stops
------        becomes       Paper----     ------------  triggered     triggered
------        -------       Loss Pct
============================================================================
BRZU Long      41266         33.3          3   2         3             1
BRZU Short     12163         55.1          2   2         2             2
-------------------------------------------------------------------------------------------------------------------------------------
CURE Long      16418         3.9           3   2
CURE Short     13606         4.1           3   1
-------------------------------------------------------------------------------------------------------------------------------------
DRN Long       18461         16.3          5             1             1
DRN Short      12736         17.2          3   1         1             1
-------------------------------------------------------------------------------------------------------------------------------------
EDC Long       17141         31.8          3   2         2             1
EDC Short      13472         17.8          2   2         1             1
-------------------------------------------------------------------------------------------------------------------------------------
INDL Long      16700         30.3          3   2         2             1
INDL Short     16158         9             3   1         1
-------------------------------------------------------------------------------------------------------------------------------------
LBJ Long       24498         27.4          3   2         3             1
LBJ Short      12010         40            2   2         2             2
-------------------------------------------------------------------------------------------------------------------------------------
RETL Long      18147         12            4   1         2             1
RETL Short     13441         6.2           3   1         1
-------------------------------------------------------------------------------------------------------------------------------------
ROM Long       15286         5.9           3   2         1
ROM Short      13192         6.6           4             1
-------------------------------------------------------------------------------------------------------------------------------------
SOXL Long      21217         11.2          3   2         1             1
SOXL Short     13599         13.2          4             1             1
-------------------------------------------------------------------------------------------------------------------------------------
TECL Long      17252         9.4           2   3         1
TECL Short     13622         11            4             1             1
-------------------------------------------------------------------------------------------------------------------------------------
TNA Long       18676         12.4          2   3         2             1
TNA Short      14950         10.5          4             1             1
-------------------------------------------------------------------------------------------------------------------------------------
TQQQ Long      16675         9.4           3   2         2
TQQQ Short     14825         5.9           4             1
-------------------------------------------------------------------------------------------------------------------------------------
UBR Long       26456         21.4          3   2         2             1
UBR Short      10722         37.7          2   2         2             2
-------------------------------------------------------------------------------------------------------------------------------------
UDOW Long      15556         7             3   2         1
UDOW Short     12348         10.3          2   2         1             1
-------------------------------------------------------------------------------------------------------------------------------------
UPRO Long      15335         9.8           3   2         1
UPRO Short     12563         9.8           2   2         1
-------------------------------------------------------------------------------------------------------------------------------------
URE Long       15116         9             5             1
URE Short      11906         9.1           3   1         1
-------------------------------------------------------------------------------------------------------------------------------------
URTY Long      18702         12.3          2   3         2             1
URTY Short     14876         10.6          4             1             1
-------------------------------------------------------------------------------------------------------------------------------------
USD Long       17395         6.5           4   1         1
USD Short      12897         9             4             1
-------------------------------------------------------------------------------------------------------------------------------------
UWM Long       15447         8.1           3   2         1
UWM Short      13203         6.8           4             1
-------------------------------------------------------------------------------------------------------------------------------------
YINN Long      15986         32.7          3   2         3             1
YINN Short     16287         13.7          2   2         1             1
-------------------------------------------------------------------------------------------------------------------------------------
|
-------------------------------------------------------------------------------------------------------------------------------------------------
8/10/2016 Our Peerless Buys (Buy
B3, Buy B19,
Buy B20 and
Buy-B14
still stand. The Hourly DJI
and Utilities are now at good
short-term support, but today's trading produced short-term
red (optimized Tiger) Sells on IWM,
MDY, SPY,
VGK, XOP
and YINN. A small retreat for them
would not be a bad thing.
It would permit some consolidation and base-building.
I have to remain bullish until Peerless gives a major Sell.
Two new pieces of research support that conclusion. First,
I mentioned the importance of semi-conductors as "canaries
in the coal mine", warning of trouble. That is particularly true
of Texas Instruments (TXN). Since as far back as 1987, but
probably further, TXN has marked tops for it AND the overall
market by showing very timely, bearish head/shoulders patterns.
Since TXN shows none now, I think we must give it,
SOXL and the market
as a whole more room to run. See the study I am developing
further below.
Secondly, we are now in the Presidential Election Year, of course.
Since 1916, when the US was not itself at war or in a worsening
Depression or Financial crisis, the market has shown a strong
tendency to rally over the next three months when the Democrat
running for President was far out in
front of the Republican.
Like it or now, Trump keeps having problems conducting a successful
campaign in search of independent voters. His problems are mostly of
his own
making, but they also provide the establishment media just what they
need to work him over even more. I had thought
his needless clashes
with so many other
people would quickly end after his
Nomination. That
is not the case. So, his poll numbers are weakening
and his lack of
diplomatic and political skills appear now to be making
him his own worst
enemy.
Hillary Clinton is quite vulnerable, but Trump keeps turning
attention away from her failings to his own. That helps Democrats
and should aid stock market bulls until November.
Historically, the market seems to like Democrats in most Augusts, Septembers
and Octobers up to the Presidential Election. My new research on this topic
suggests we should not sell yet. If there is a retreat, it will
probably end up
being only a constructive, sidewise consolidation as the market sets up for
a rally into November. This, at least, was the case in
1916,
1936,
1940,
1964
and 1996.
2012 was the main exception.
Charts: Peerless
DJIA Hourly DJIA
DIA
NetIDOSC for DJI-30
SPY
QQQ
IWM
DJI-Utilities REITS
A/D Line-6000 Stocks
SOXL
TECL
IBB
FAS
Crude Oil
Major Indexes and A/D
Lines.
Key Tiger Software ETF
Charts
Bullish
MAXCPs Bearish MINCPs
Charts of Key ETFs
NO BIG DECLINE AT LEAST UNTIL TEXAS INSTRUMENTS
(TXN) FORMS A BEARISH TOP PATTERN.
Before nearly every big DJI decline since 1987, TXN formed either a bearish
head/shoulders top pattern or a "hands above the head" speculative top.
All these charts will be shown tomorrow night. This was true before the
January 2016 general market sell-off. See chart below. That we still
do
not see a top developing in TXN should give us some faith that still higher
prices lie ahead for the general market.
1987 Head/Shoulders
1989 early Head/Shoulders
1990 "hands above the head" speculative top.
1997 Head/Shoulders
1998 Head/Shoulders
Jan 2000 Head/Shoulders
2000 Head/Shoulders
2002 Head/Shoulders
2007 Head/Shoulders
2008 Head/Shoulders
2010 Flat - DJI high not confirmed
2011 Head/Shoulders
Aug 2015 already falling
Jan 2016 Head/Shoulders
==============================================================
HOW DJI BEHAVES IN SECOND HALF OF
PRES.ELECTION YEAR
WHEN DEMS WIN WHITE HOUSE: 1916-2012.
(All DJI charts)
DJI Chart
Aug Sept
Oct Nov
Aug 10 Nov 7 Background
------------------------------------------------------------------------------------------------------------------
1916
377 vs 254 up
up up
flat
98.10 107.2
US not at war.
1932 472 vs
59 up
flat
down down
69.4
64.6 Depression worsening
1936 523 vs
8 flat
up up
down
168.8 188.3
Depression not worsening.
1940 449 vs
82 up
flat up
down
126.4 137.8
US not at war.
1944 432 vs
99 down up
flat up
145.7 147.9
US at war.
1948 303 vs
189 down flat
up down
180
178.4 Dewey expected to win
1964 486 vs
52 up
up flat
down
829.4 876.9
US not at war.
1976 297 vs
240 flat down
up up
999.43 943.07
Economic Stagnation.
1996 379 vs
159 flat up
up up
5681
6206 Bull Market
2008 365 vs
173 flat
down down
down
11734 8943
Depression worsening
2012 332 vs
206 up
up
down down
13208 12933
Economic Stagnation.
---------------------------------------------------------
5 up 6 up
6 up 3 up
6 up
2 down 2 down 3 down 7
down 5 down
===================================================================================
8-9-2016 See
Hotline here.
===================================================================================
8-8-2016 Our Peerless Buys (Buy
B3, Buy B19,
Buy B20 and
Buy-B1
still stand. Though the
DJI slipped back a
little, there were
more up than down and the
Hourly DISI/OBV
trend is still rising, too.
The
DIA's Closing Power's
trend is no longer up, but this indicator
is decidedly pointing higher for the
OEX,
SPY,
QQQ,
IWM,
TECL,
SOXL,
IBB and
FAS. Also making recovery
highs today were
the
foreign ETFs,
Brazil,
emerging markets and
YINN.
I doubt if a turn downwards now by the
DJI or the Utilities will stop
the general movement higher. There are
enough periods when
the DJ-15 falls while the DJI-30 rises ,
so that I think we should not
place too much emphasis on it. See
Utilities
since 1988 study.
Generally speaking, Wall Street is
probably pleased that Trump
is dropping in the recent polls. I also
continue to believe that the
FED will not raise rates until November,
after the Presidential
Election.
Charts: Peerless
DJIA Hourly DJIA
DIA
NetIDOSC for DJI-30
SPY
QQQ
IWM
DJI-Utilities REITS
A/D Line-6000 Stocks
SOXL
TECL
IBB
FAS
Crude Oil
Major Indexes and A/D
Lines.
Key Tiger Software ETF
Charts
Bullish
MAXCPs
Bearish MINCPs
Charts of Key ETFs
The Peerless Buys and Sells have worked
well for most of the
last year. "It's important to do
nothing if nothing needs to be done"
(JFK, the conservative.)
Tiger Index of
Stocks Peerless Signals' Gain
since Oct 28, 2015
(Buying and Selling Short
at opening the day after
a reversing Peerless signal)
DJI-30
50.9%
OEX-100
51.1%
QQQ-100
48.2%
SP-500
44.3%
RUSS-1000
46.7%
BIG BANKS
91.0%
BIOTECHS
106.2%
COMMODITIES
only +12.5%
FOREIGN ETFS
136.6%
GOLD
only 15.1%
NIFTY-35
54.7%
OIL STOCKS
only 14.0%
FAS
+117%
IBB
+63.4%
SOXL
+195.8%
TECL
+143.3%
TNA
+190.8%
Tiger says to sell SOXL. Peerless does not say to
sell it yet.
42.6 is its 5-year high. See second weekly chart
below. We
should get back there on this advance.
Weekly Resistance on SOXL
=======================================================================
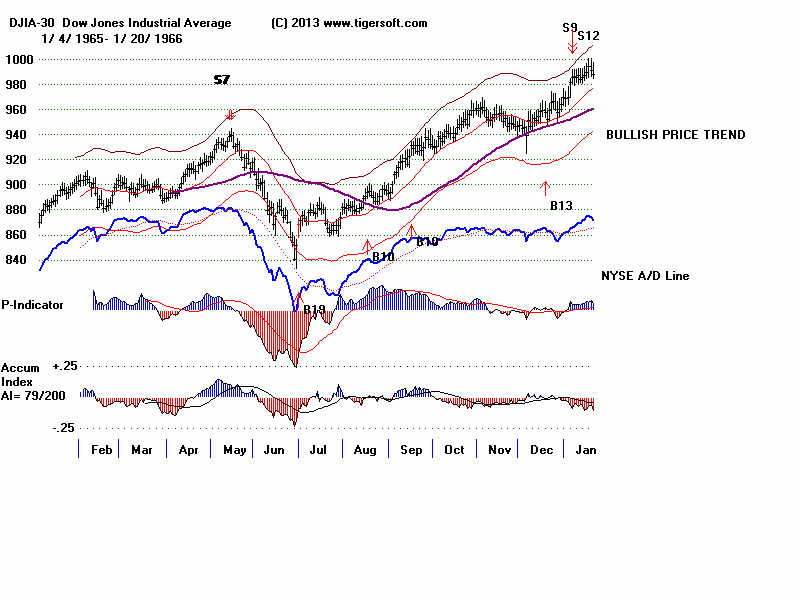
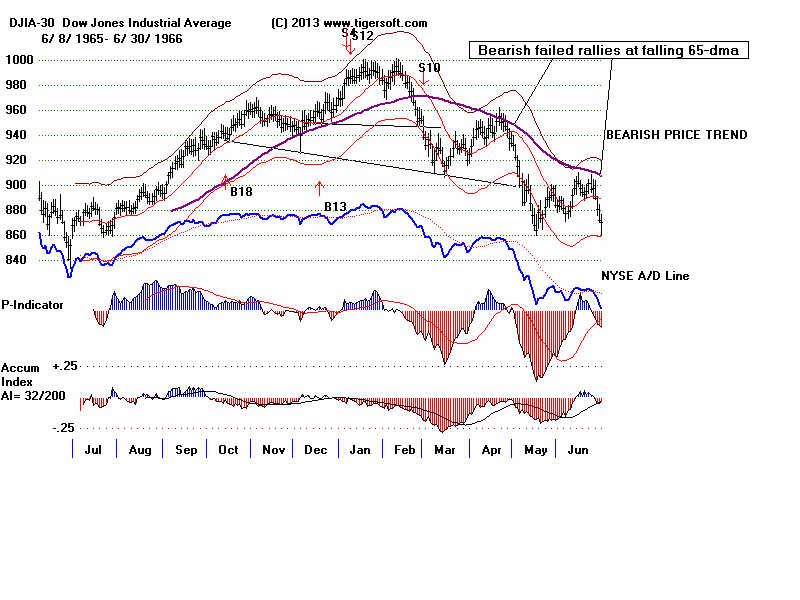
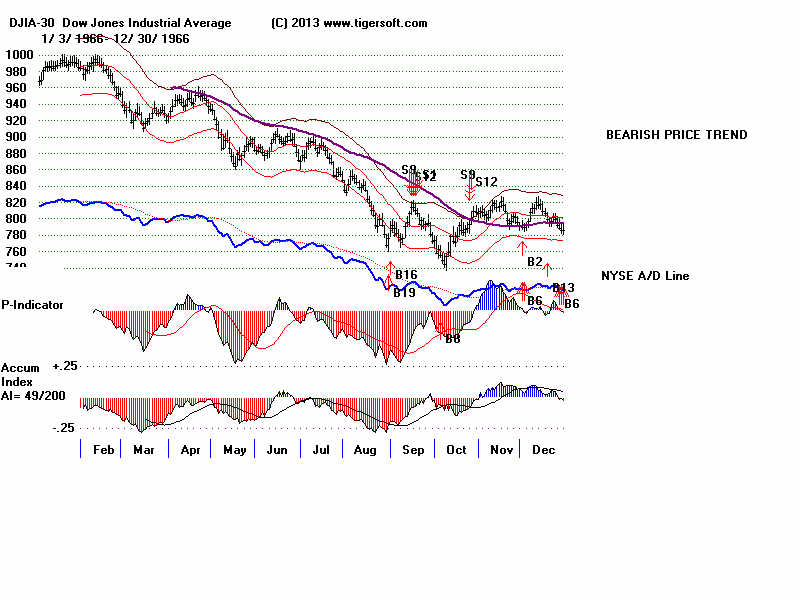
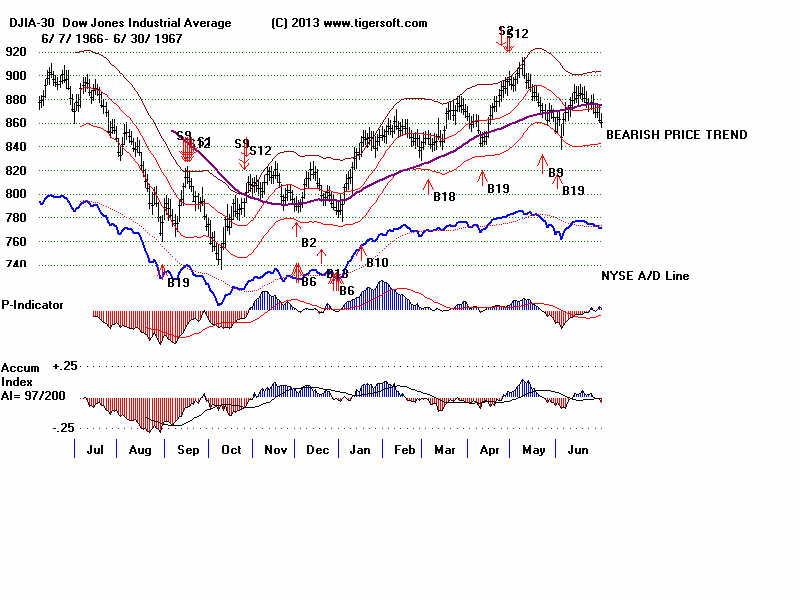
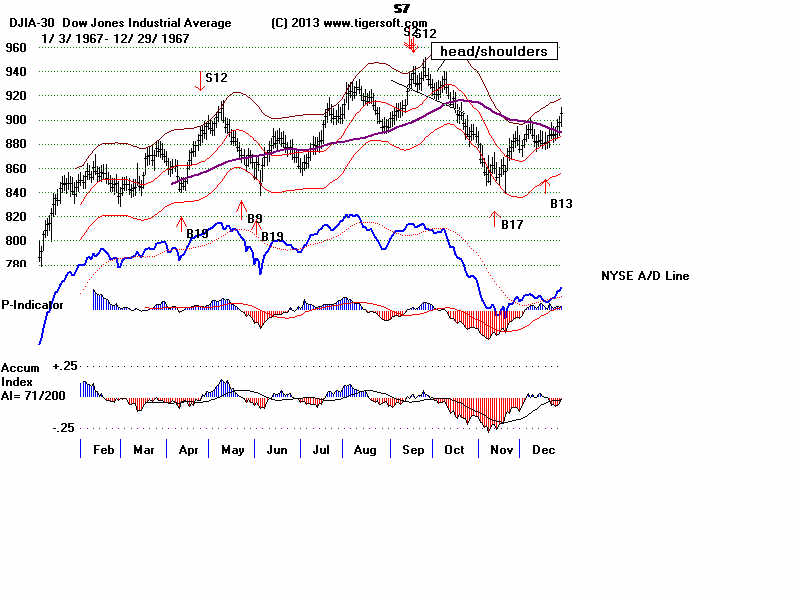
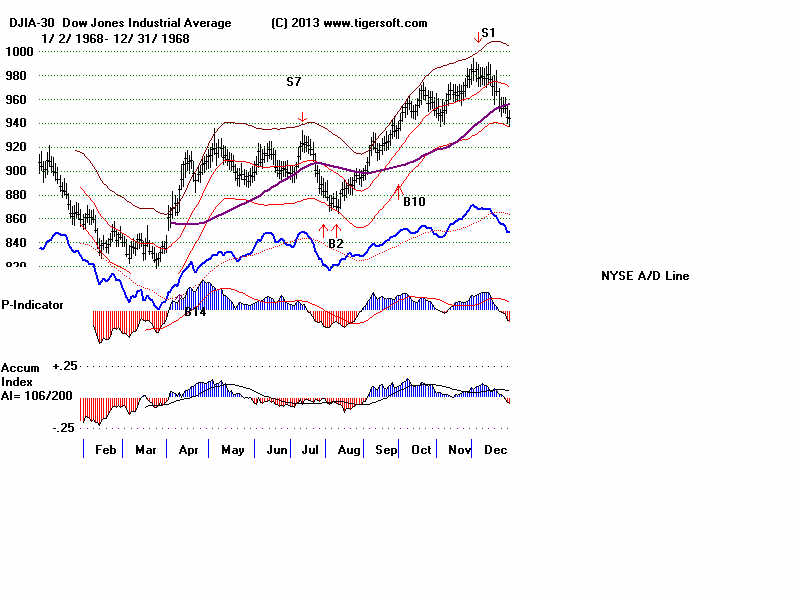
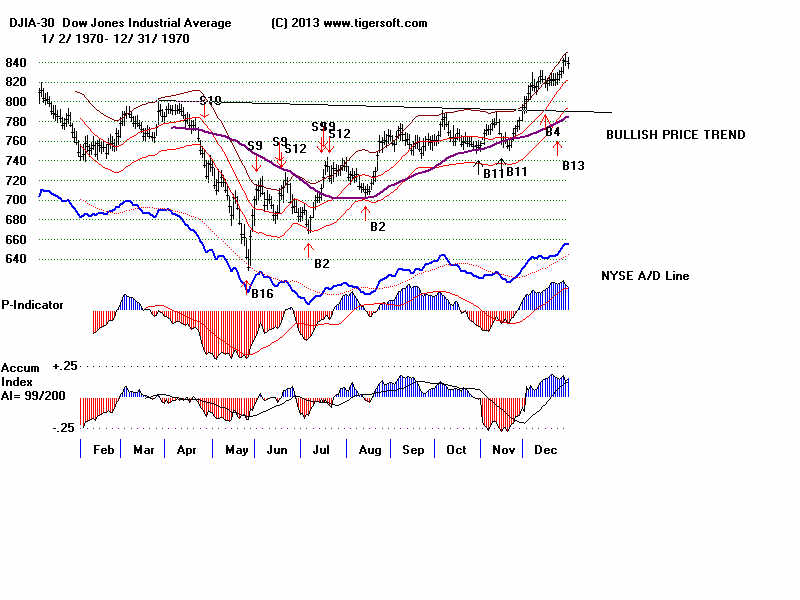
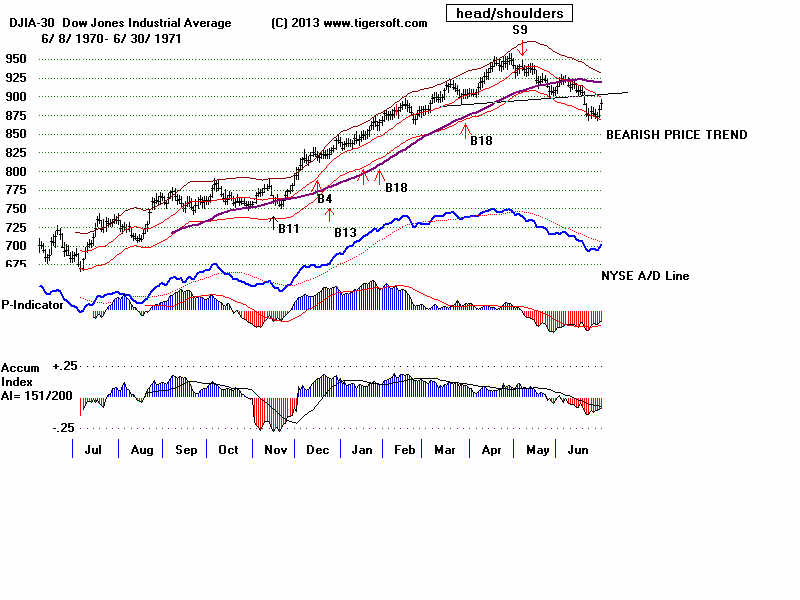
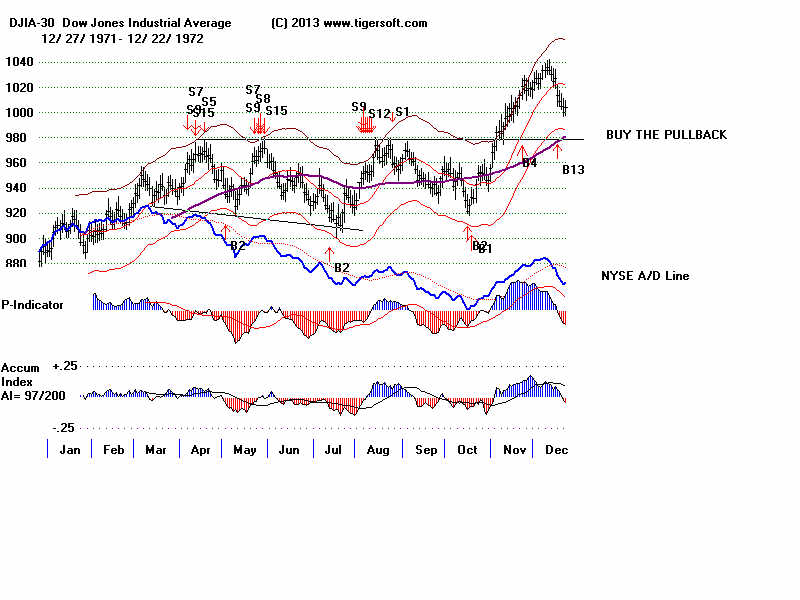
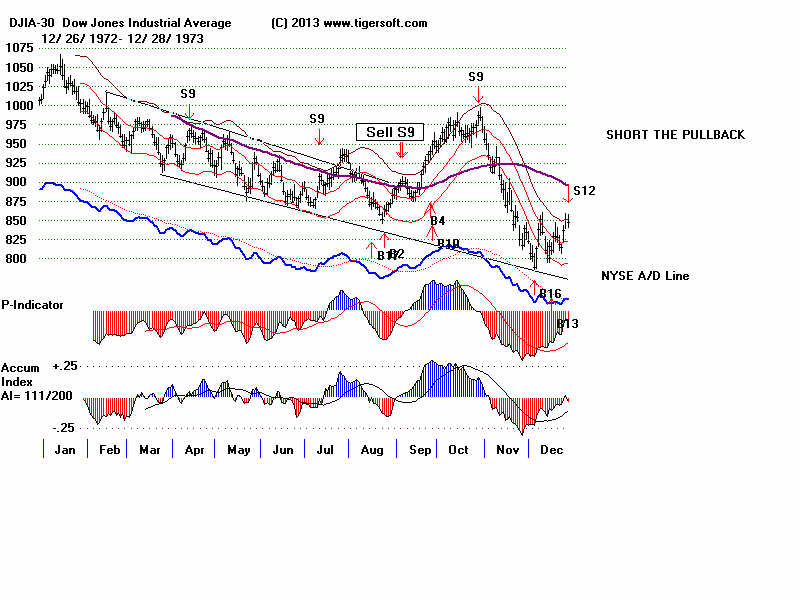
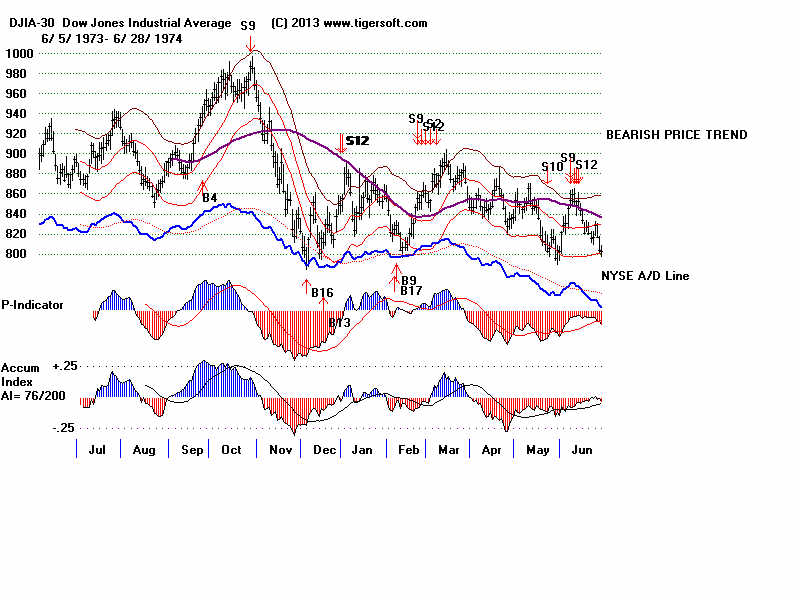
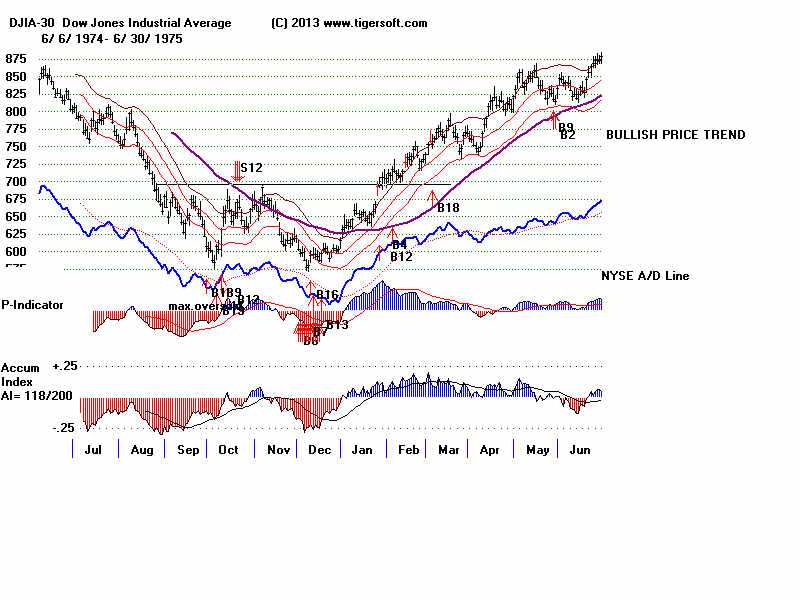
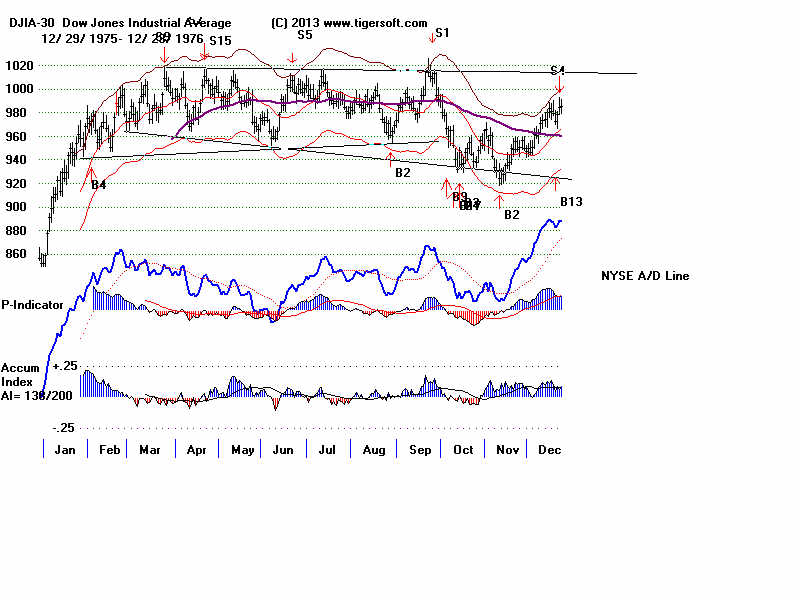
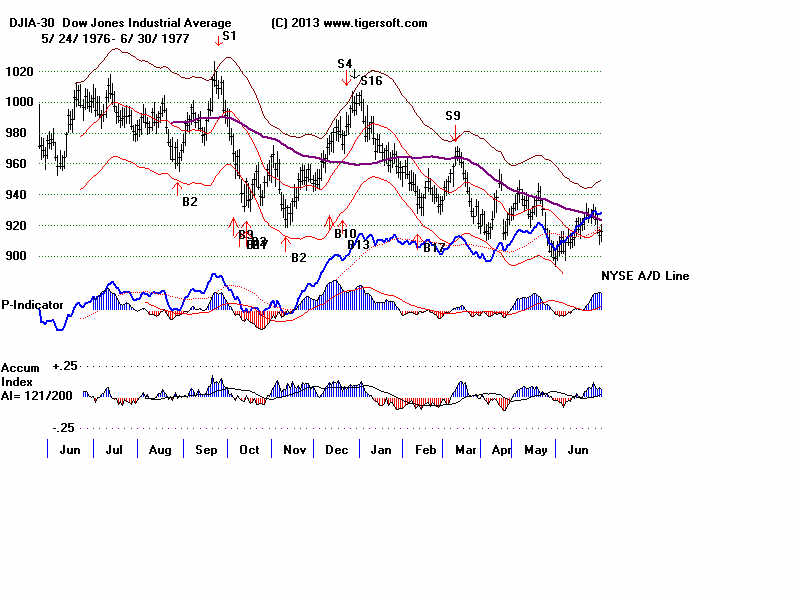
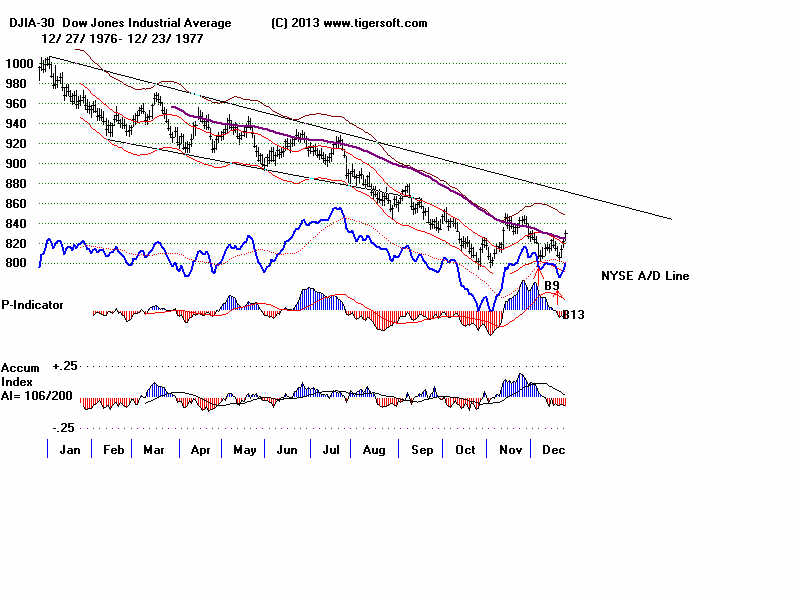
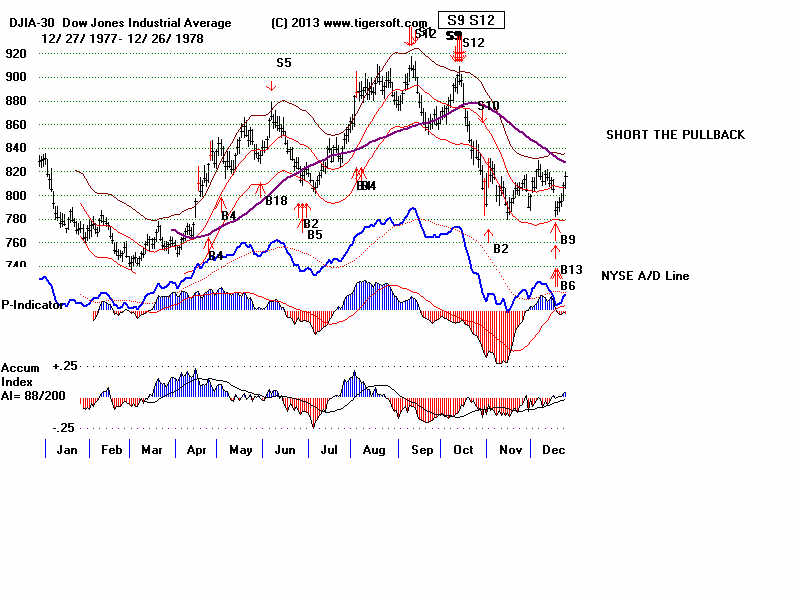
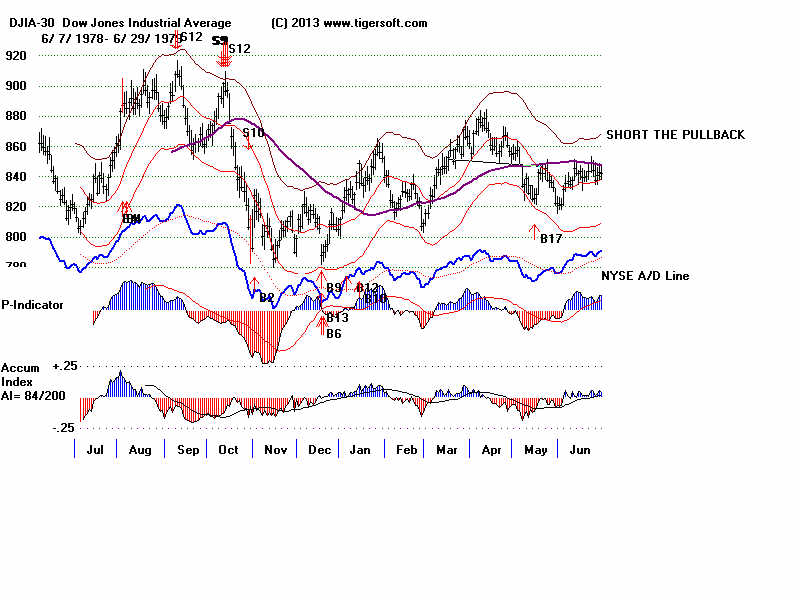
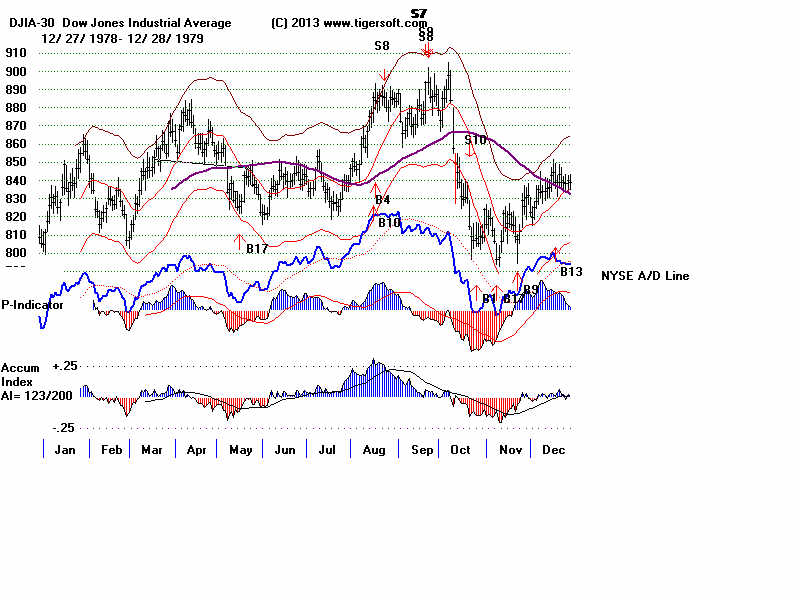
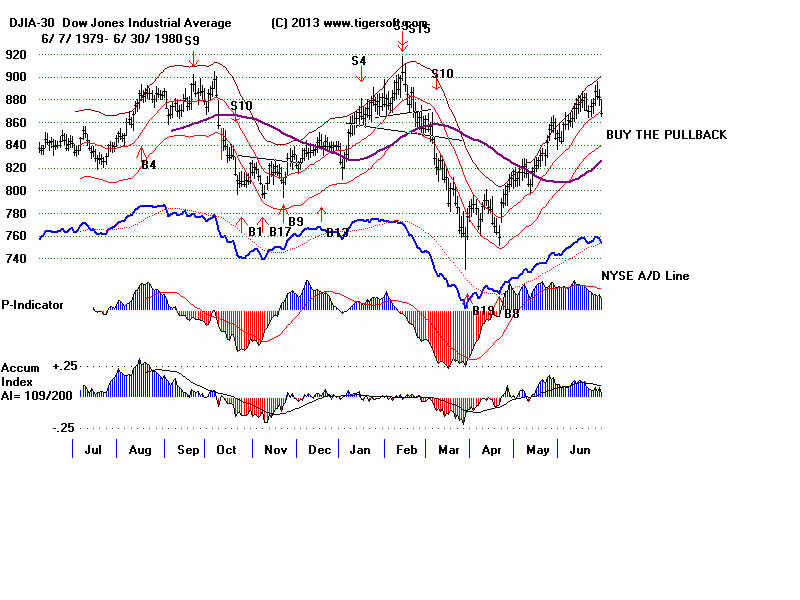
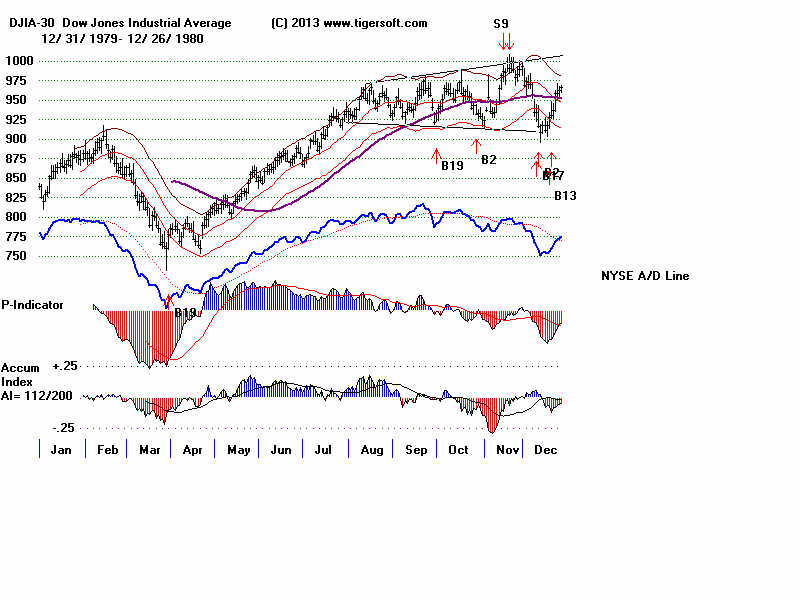
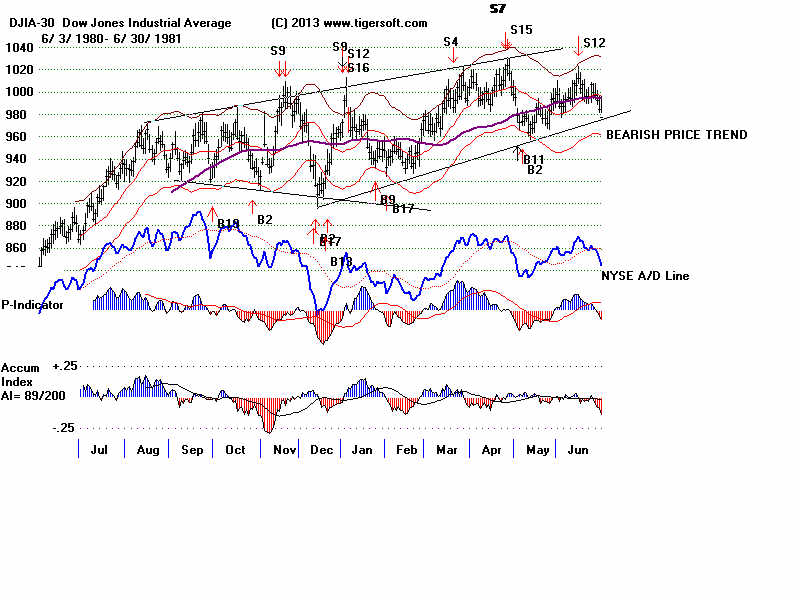
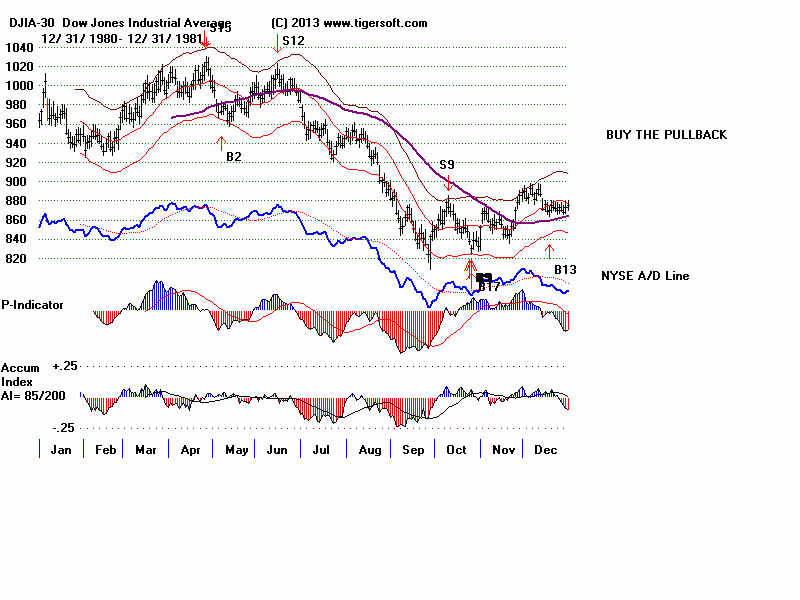
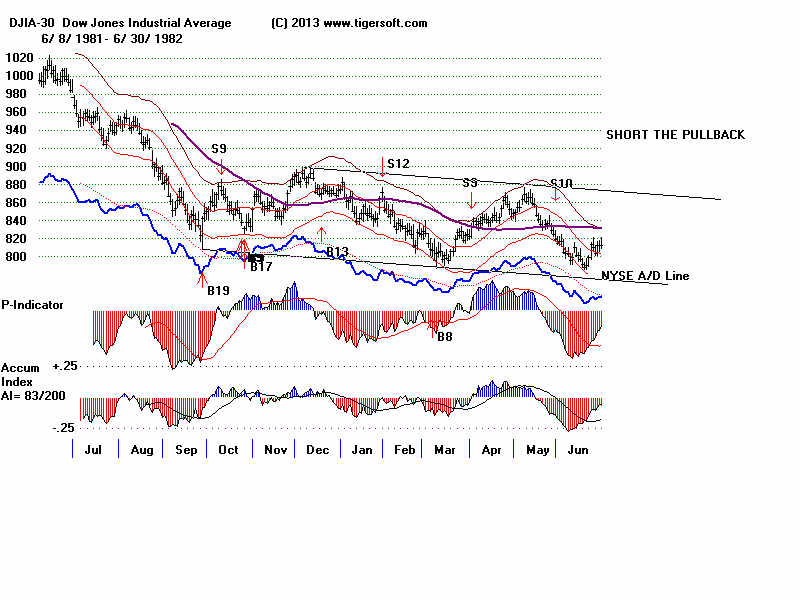
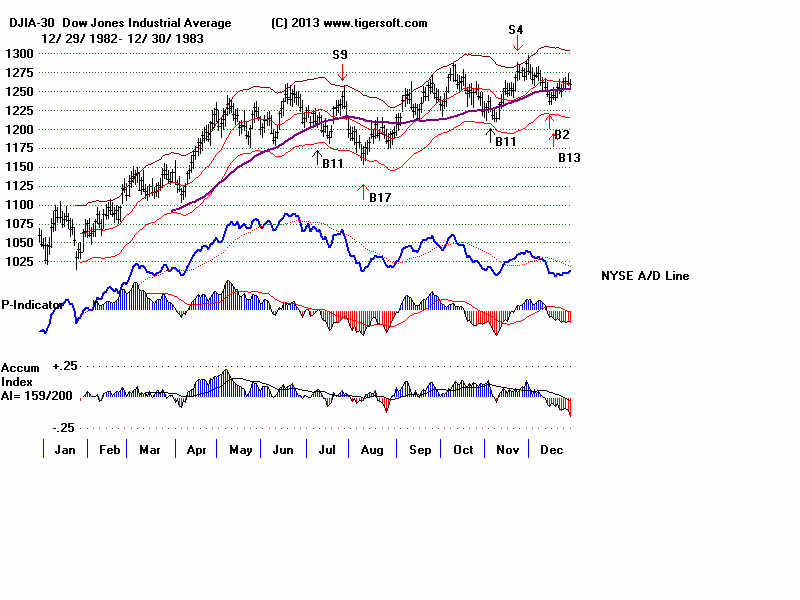
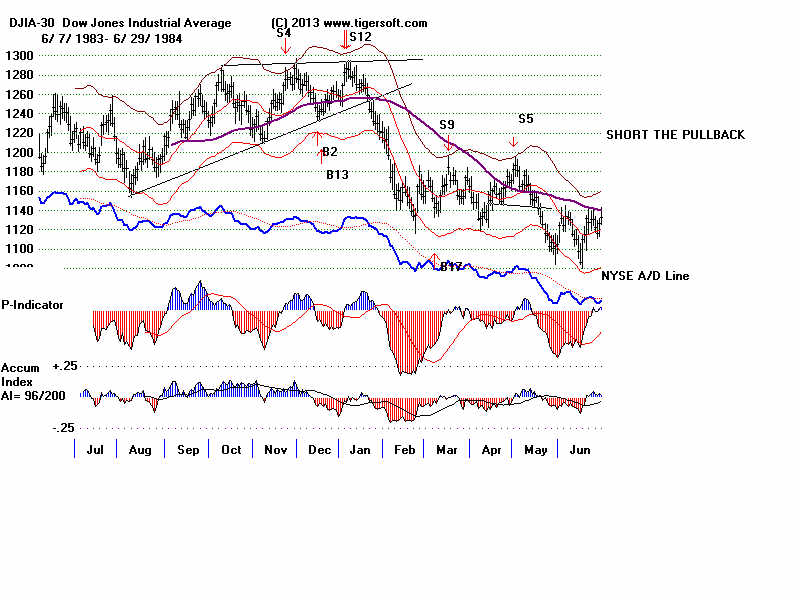
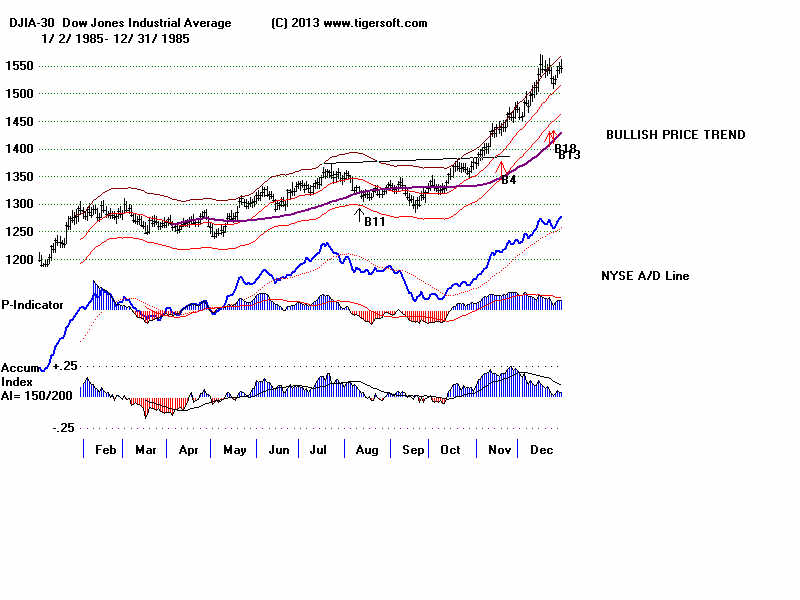
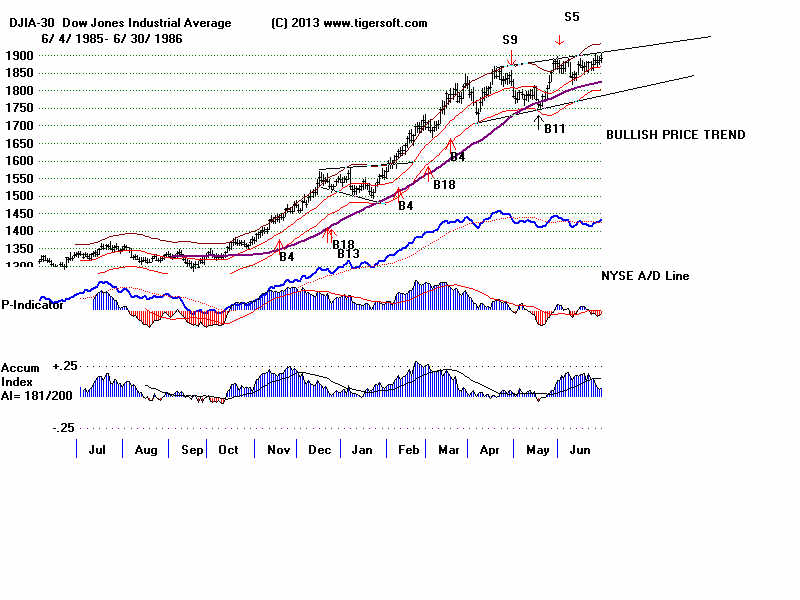
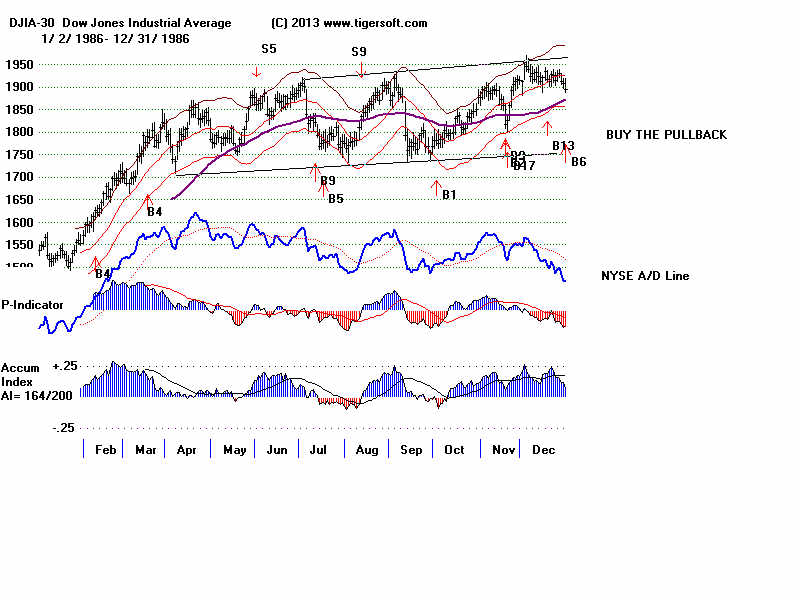
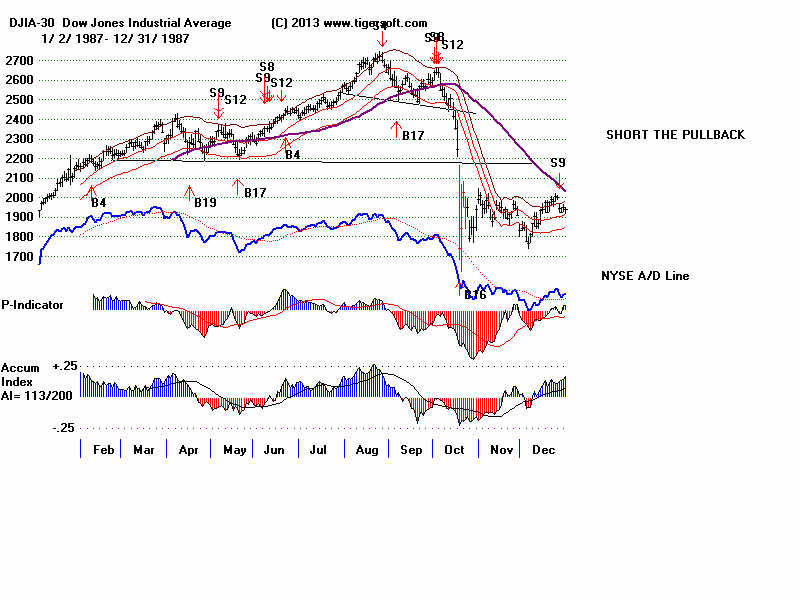
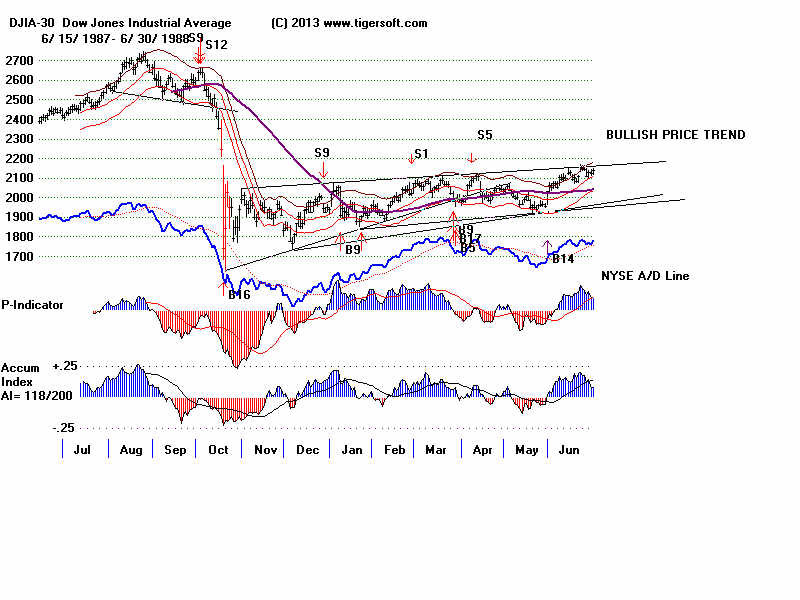
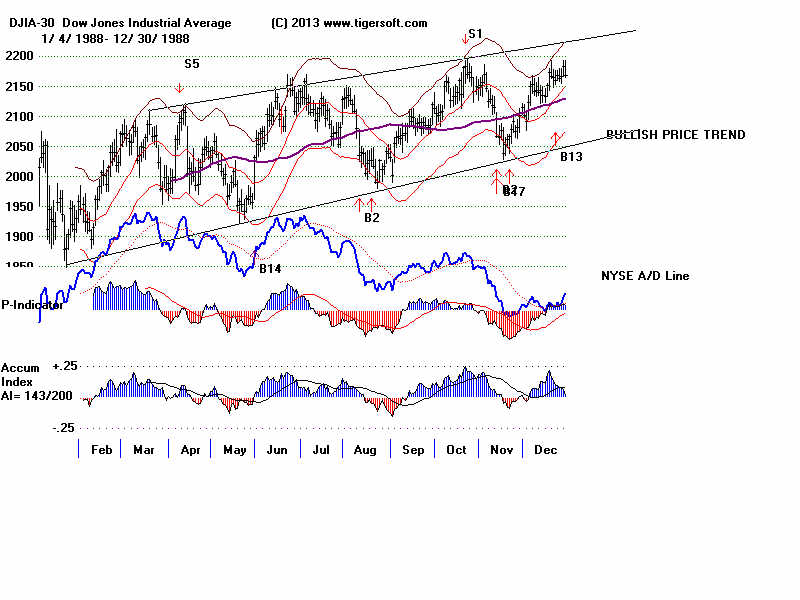
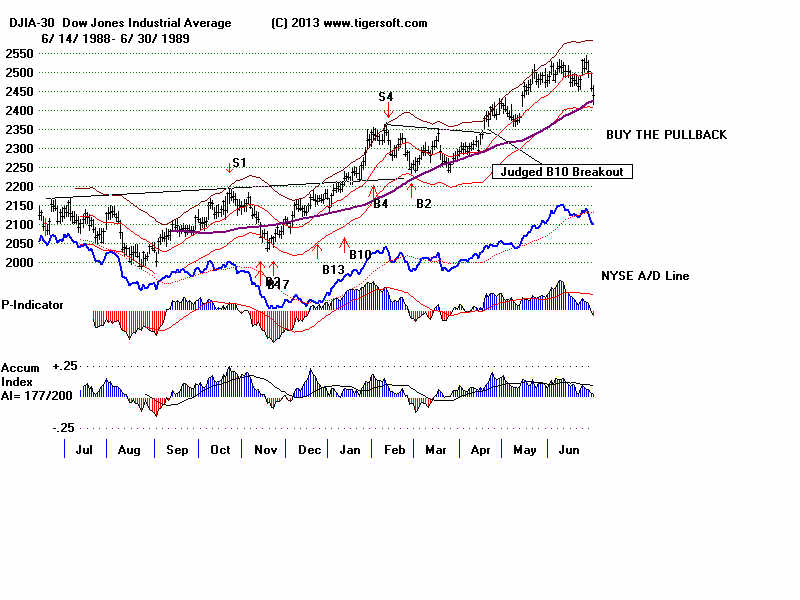
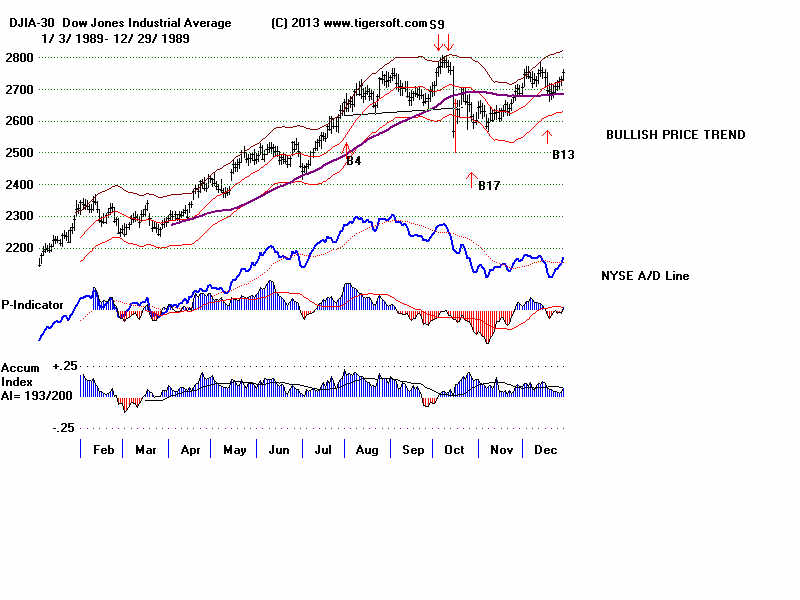
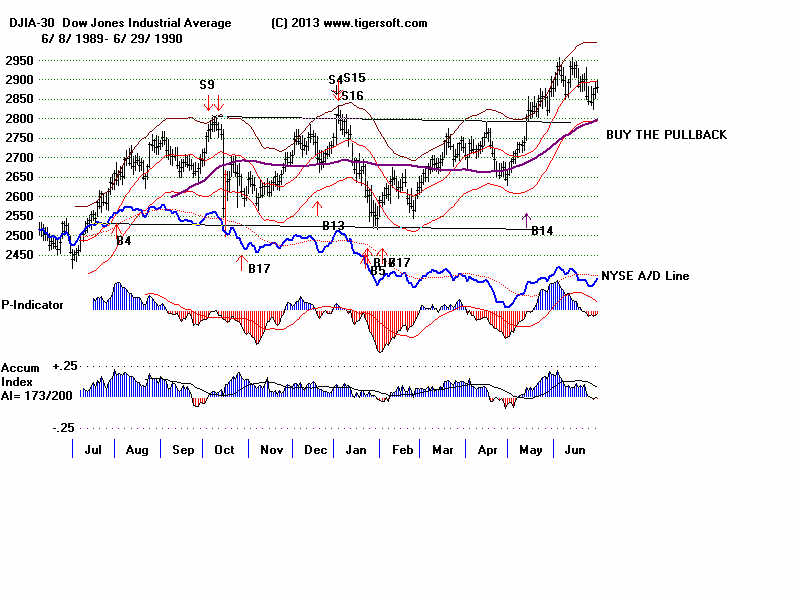
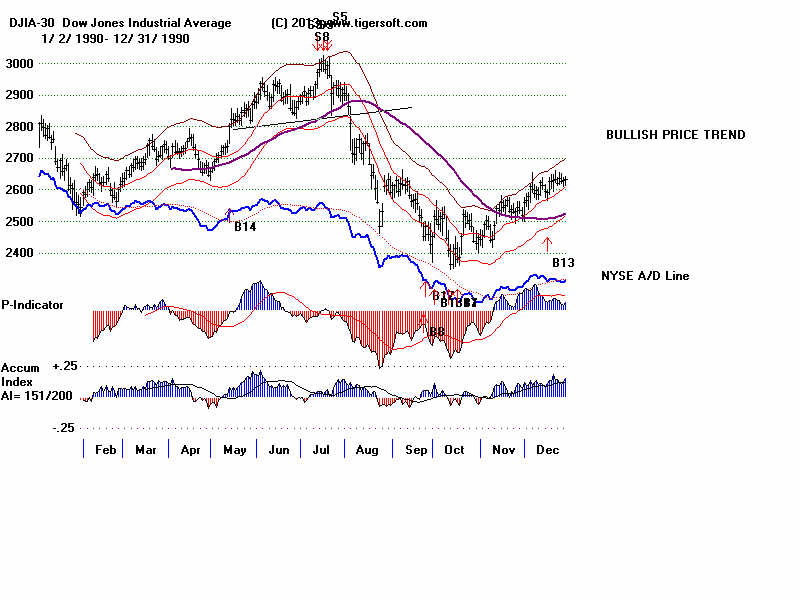
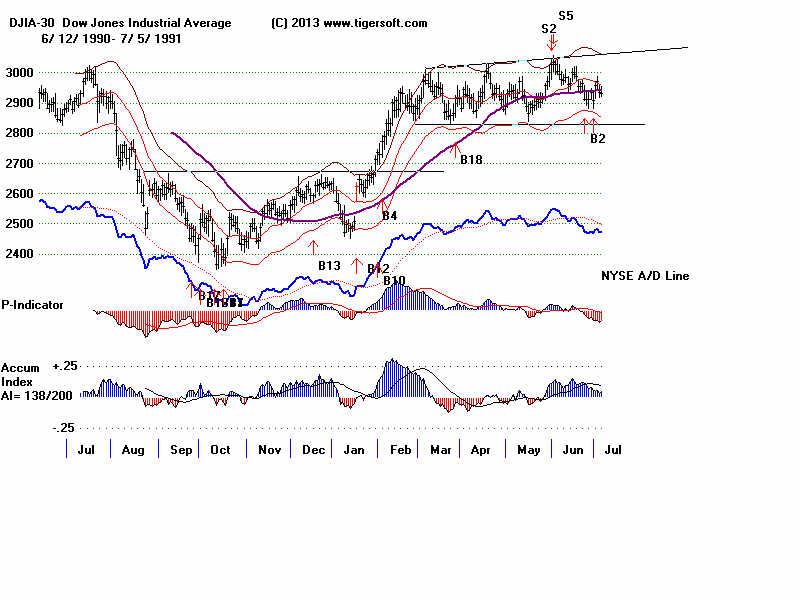
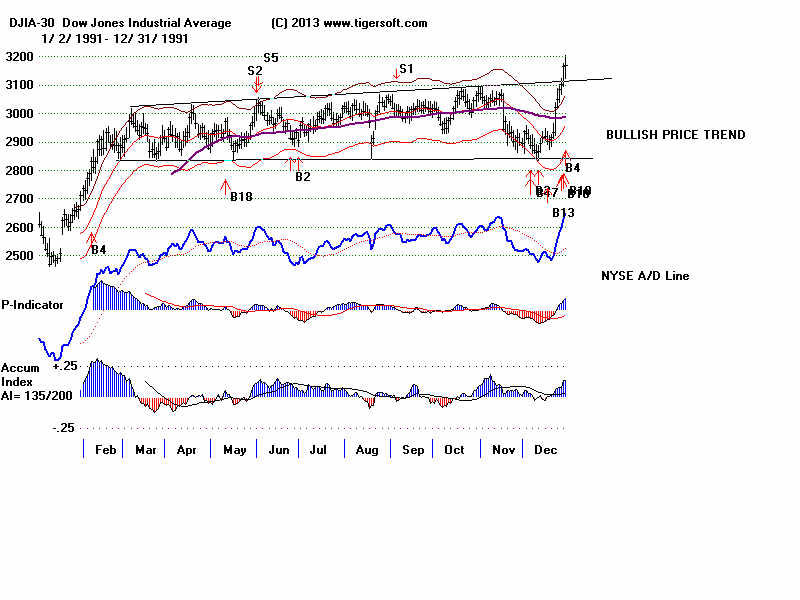
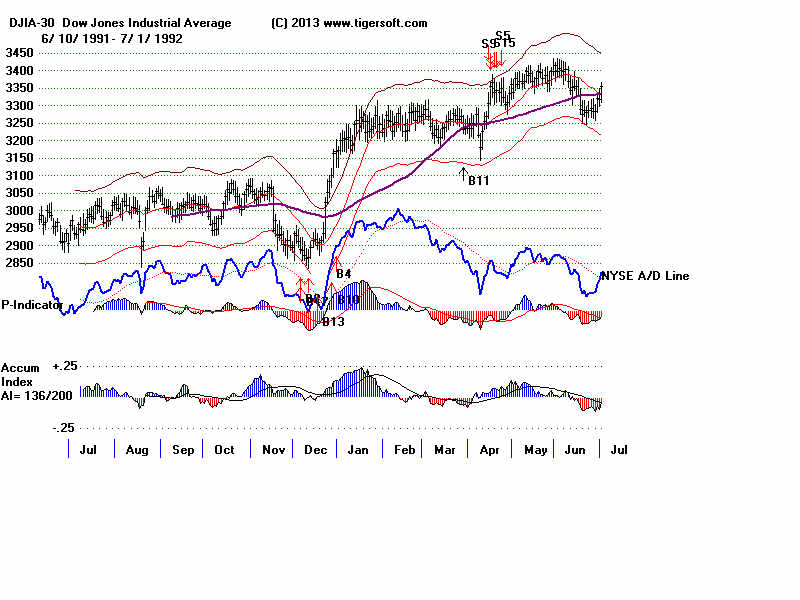
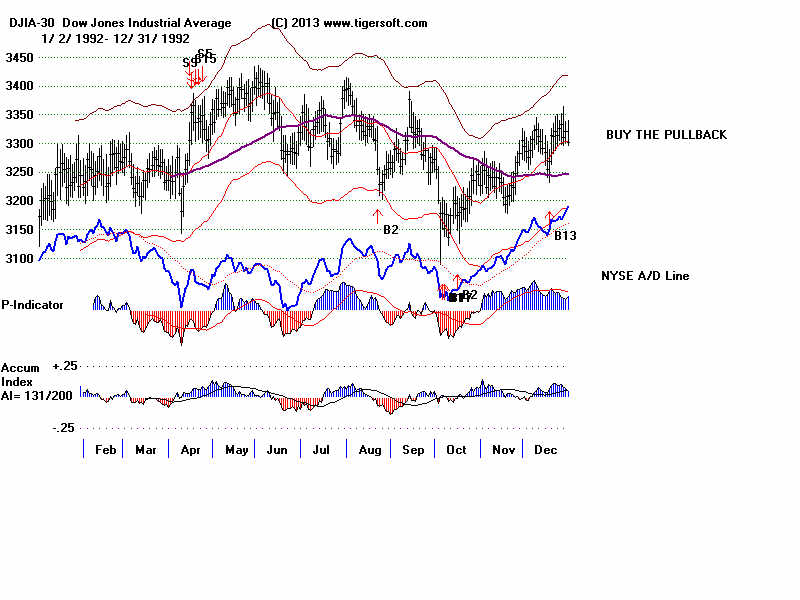
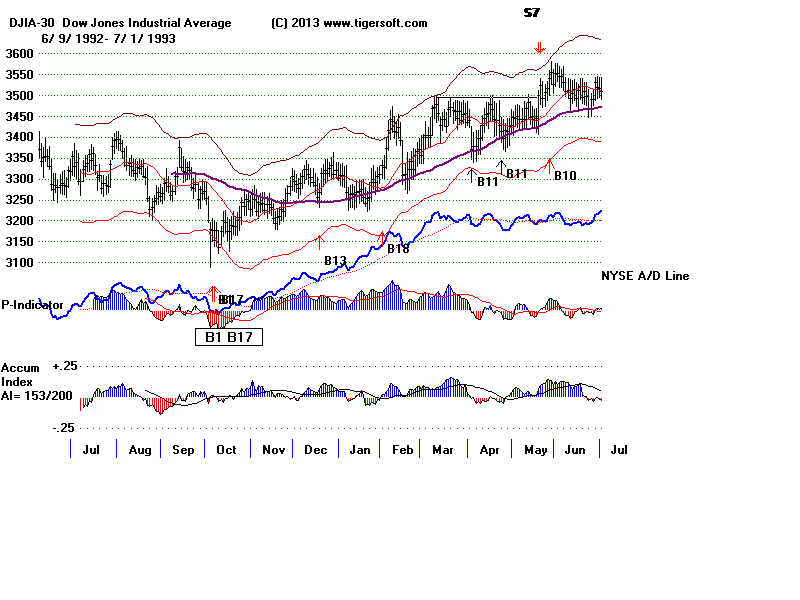
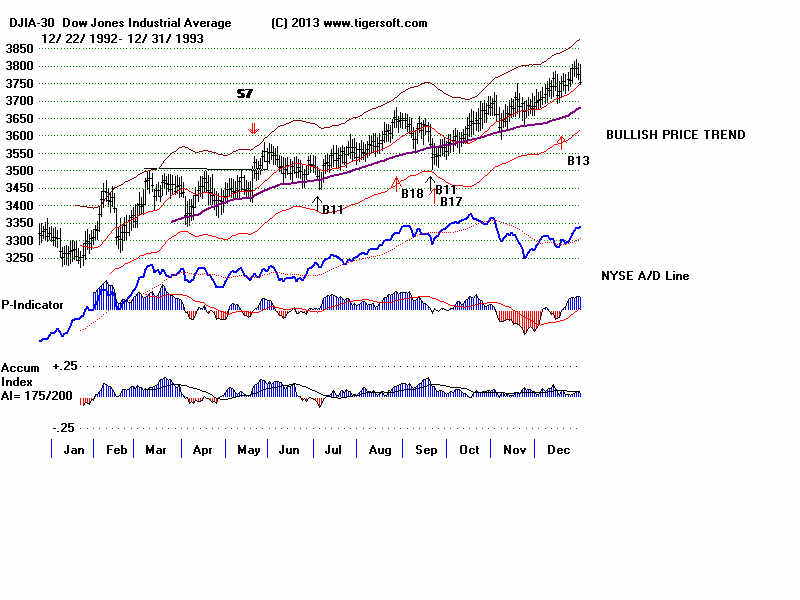
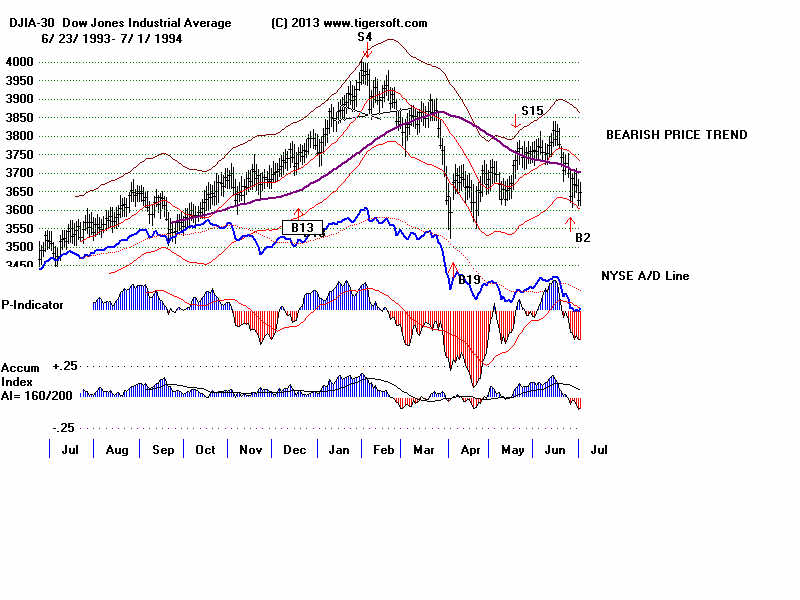
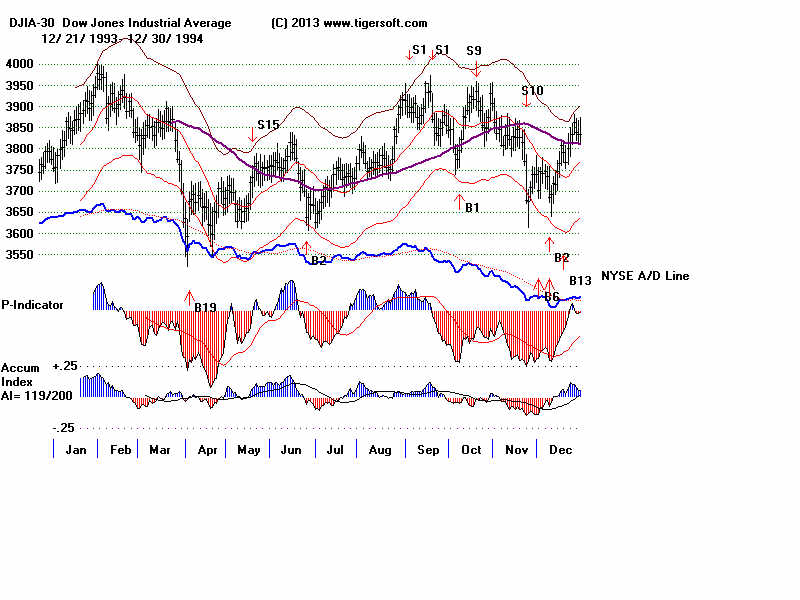
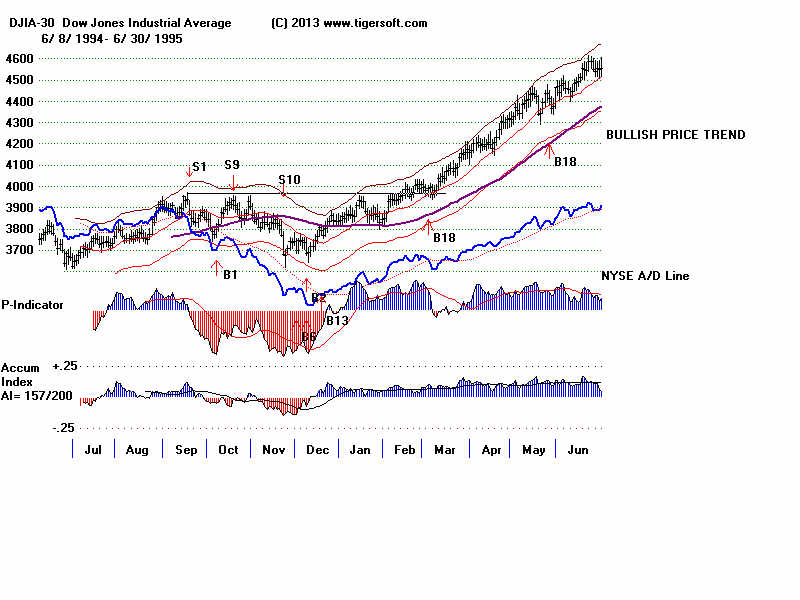
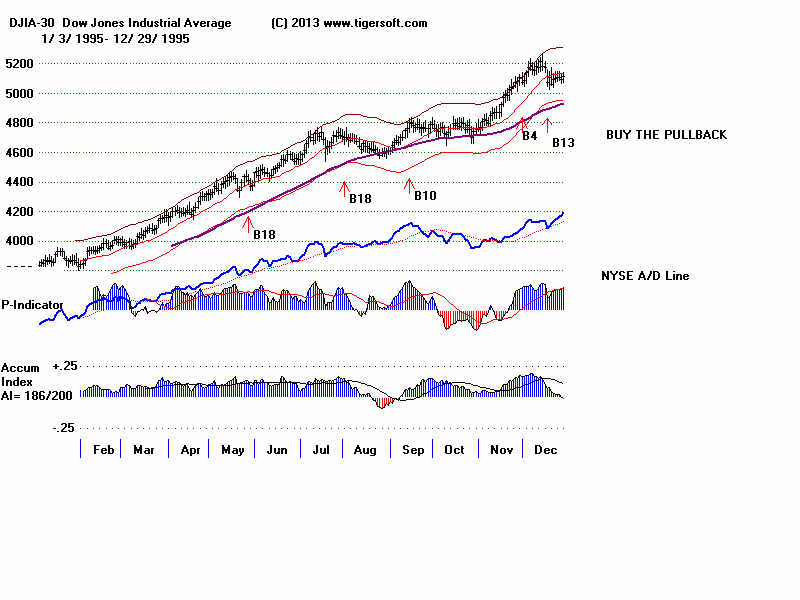
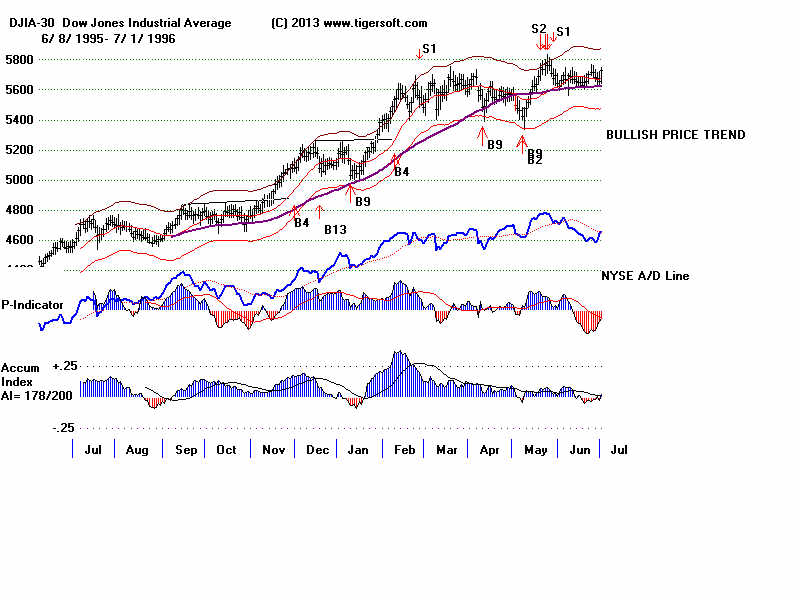
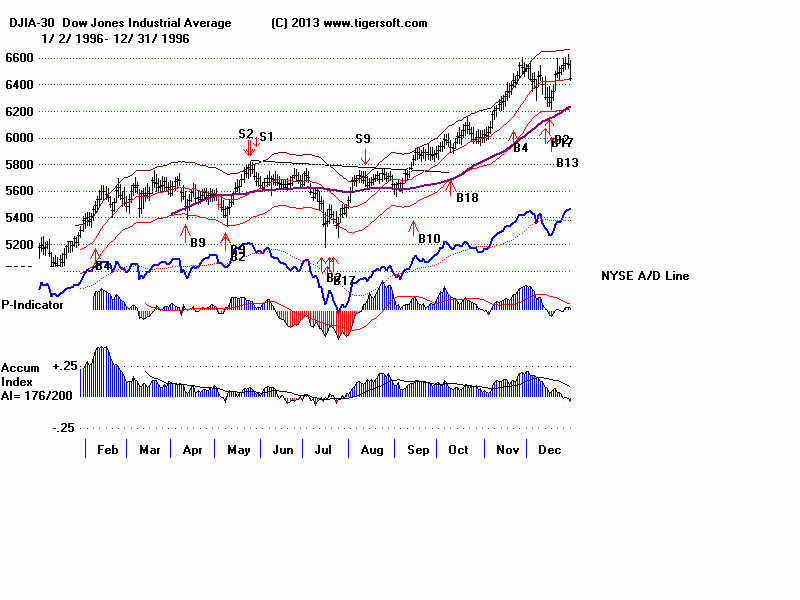
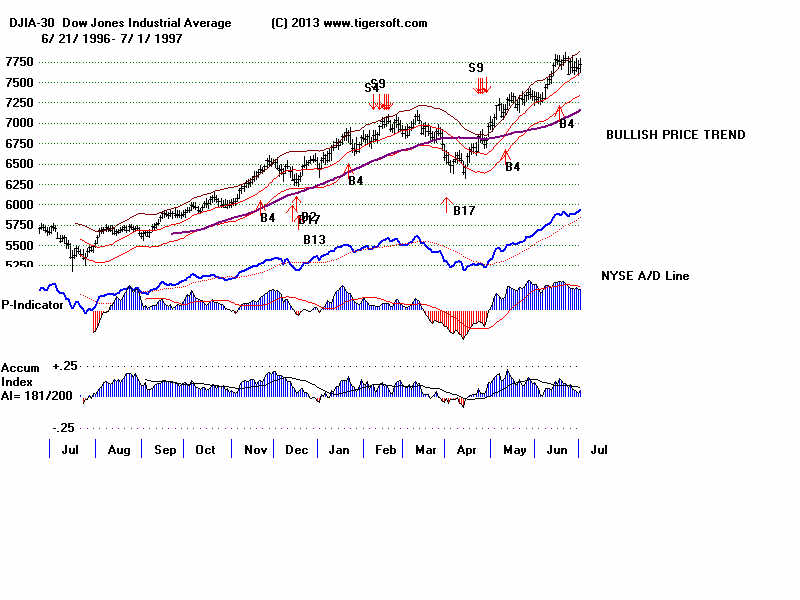
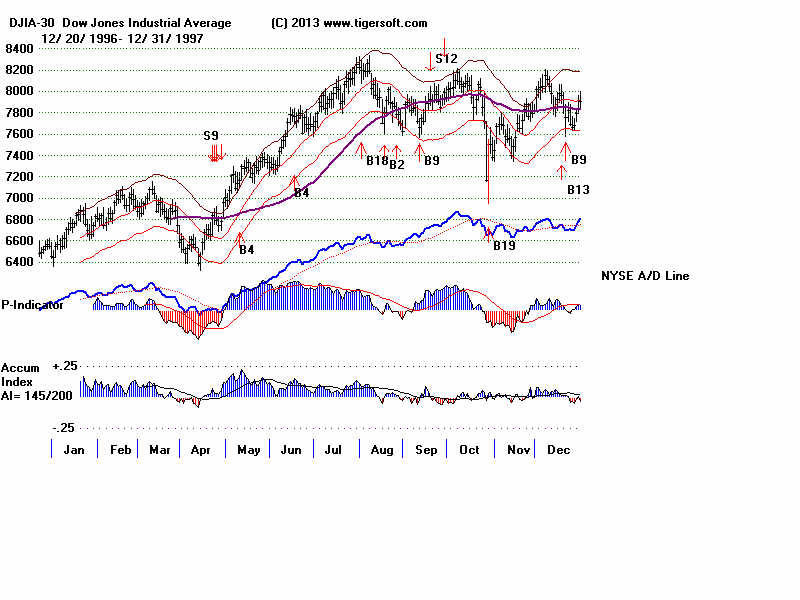
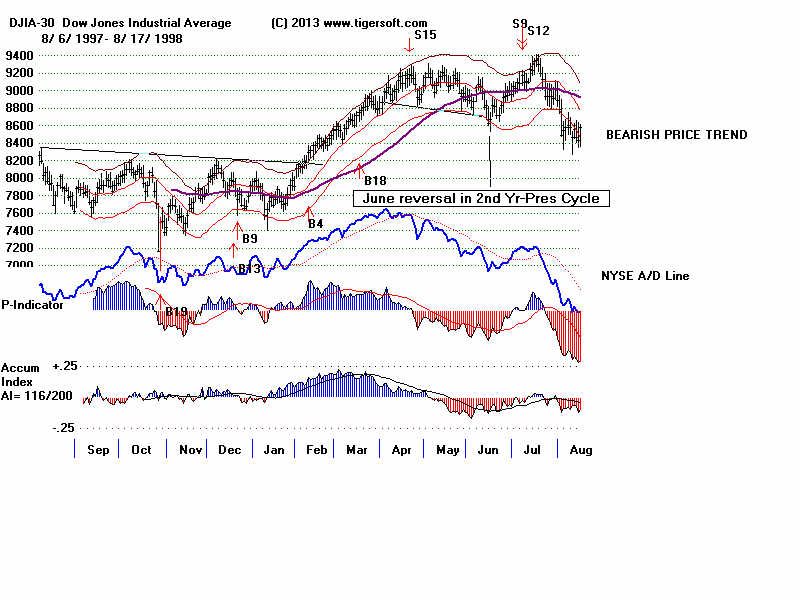
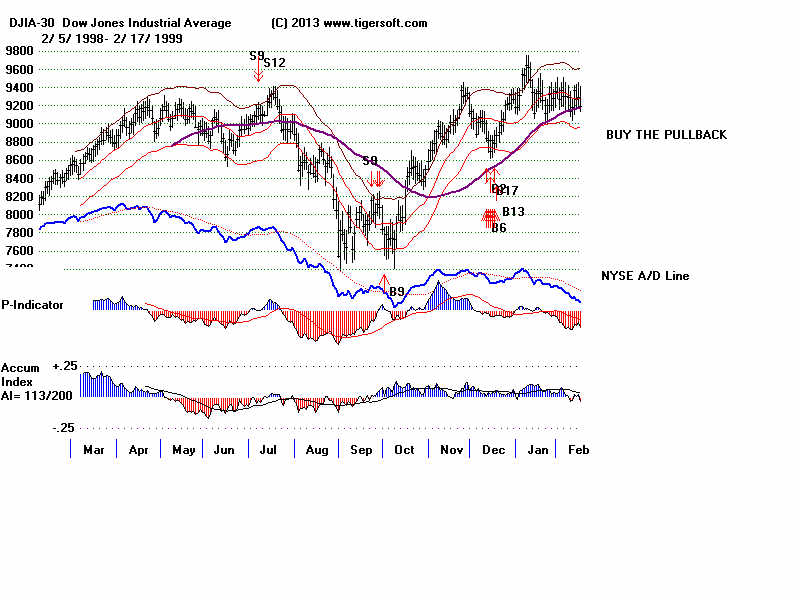
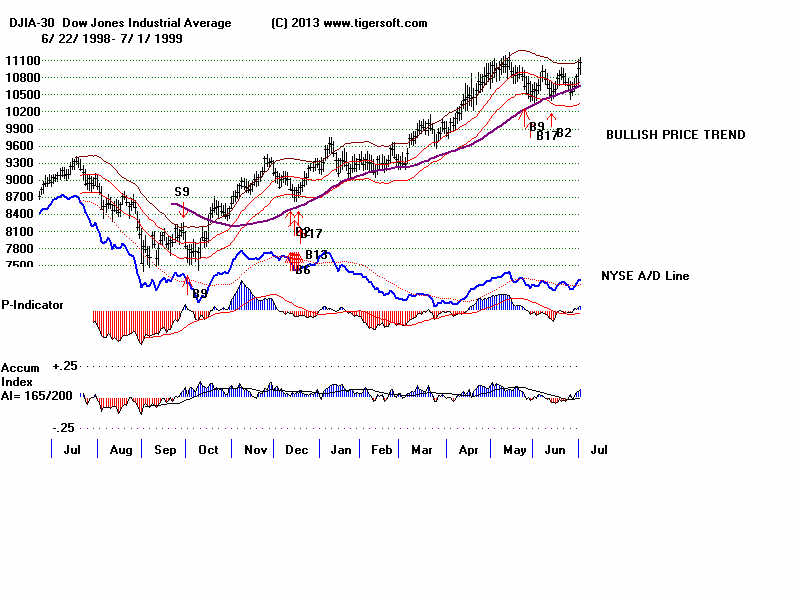
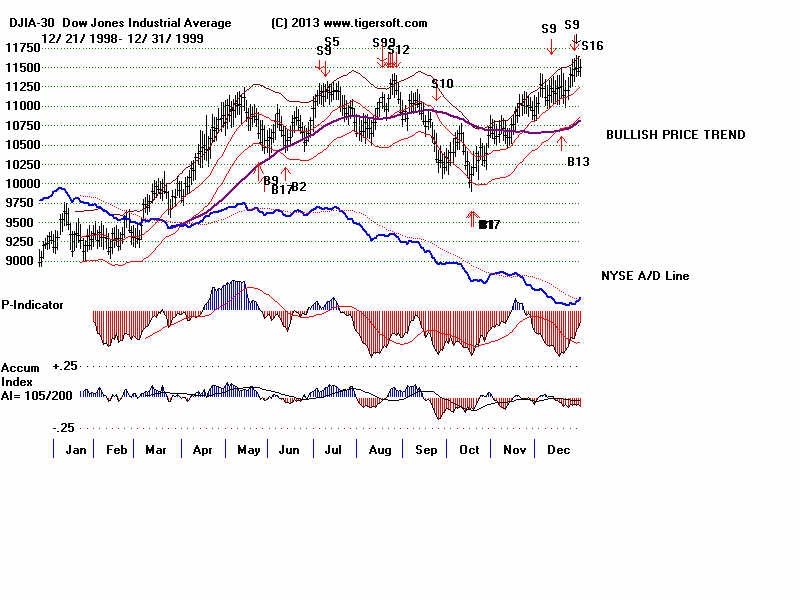
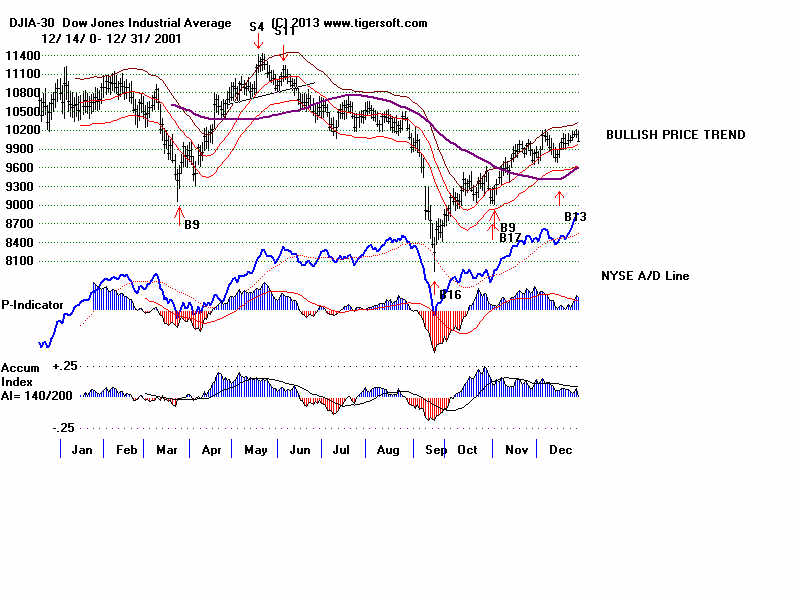
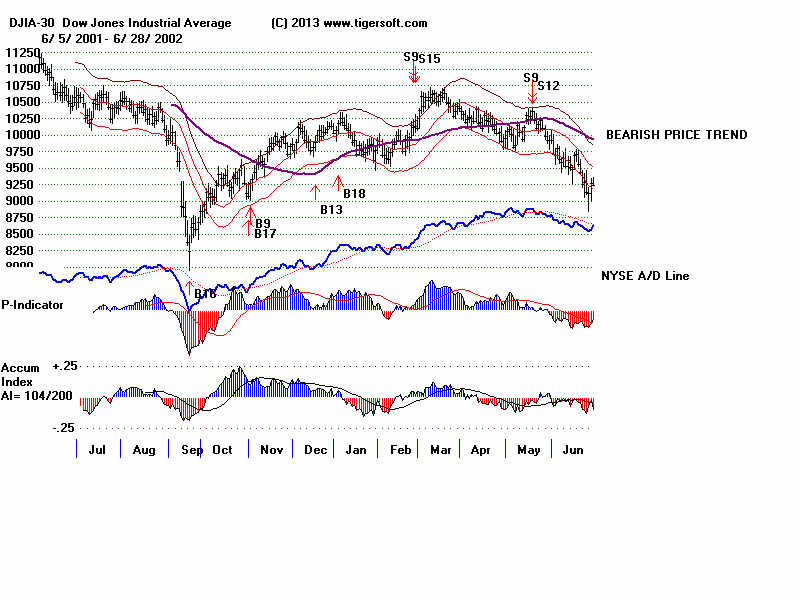
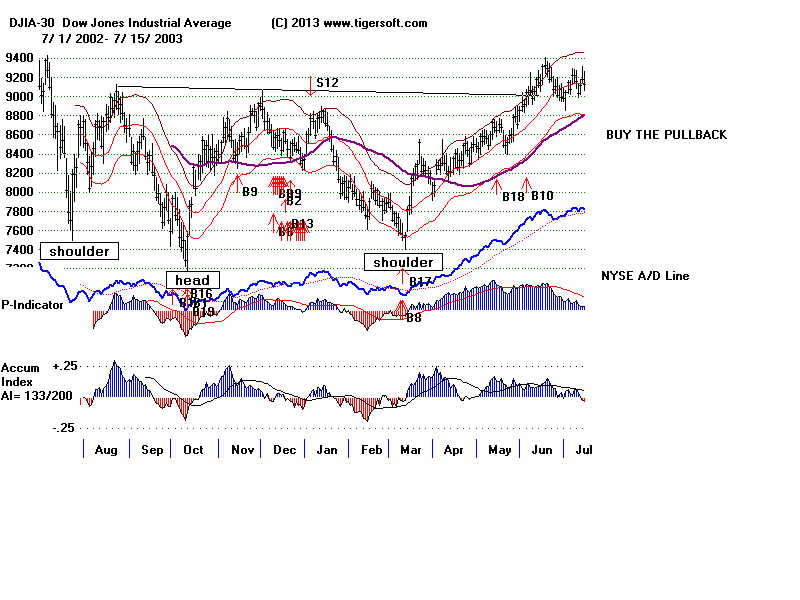
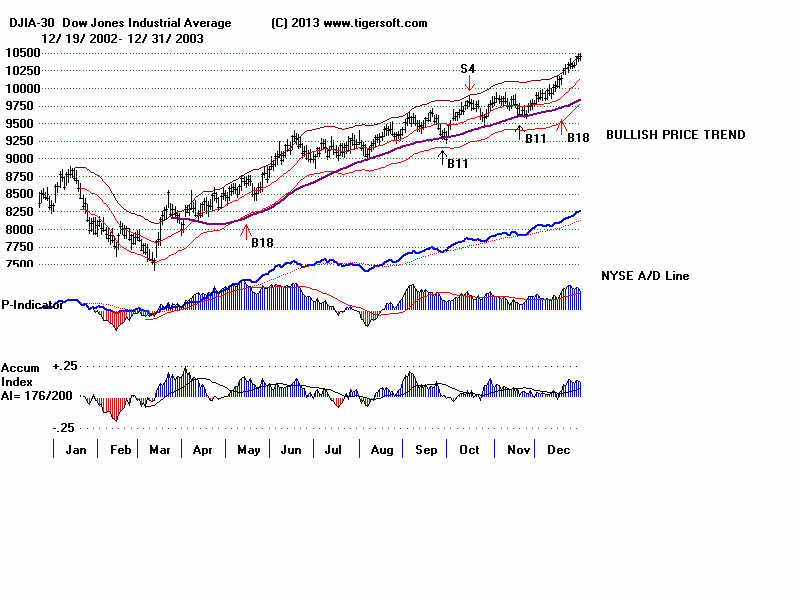
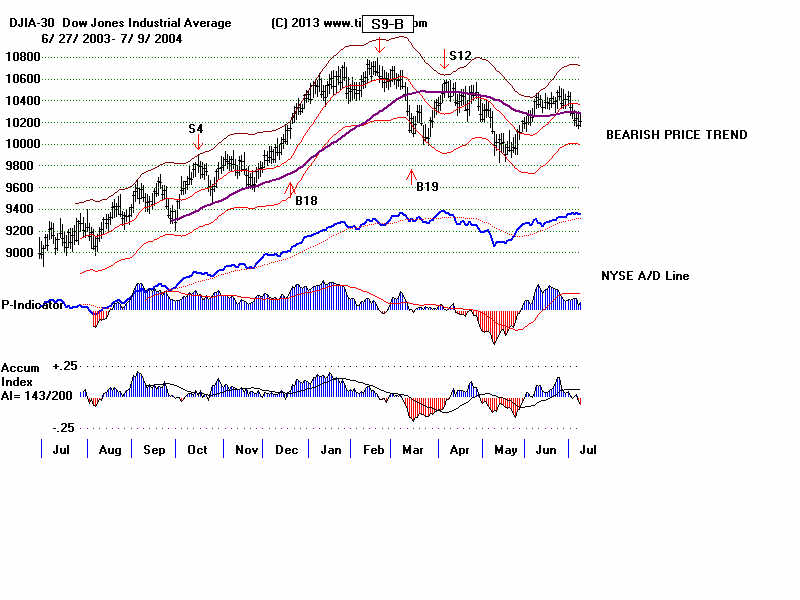
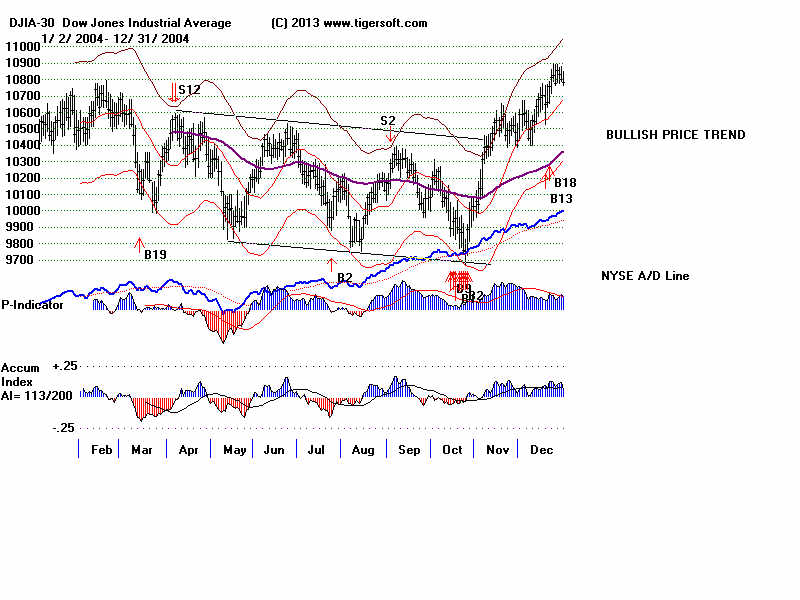
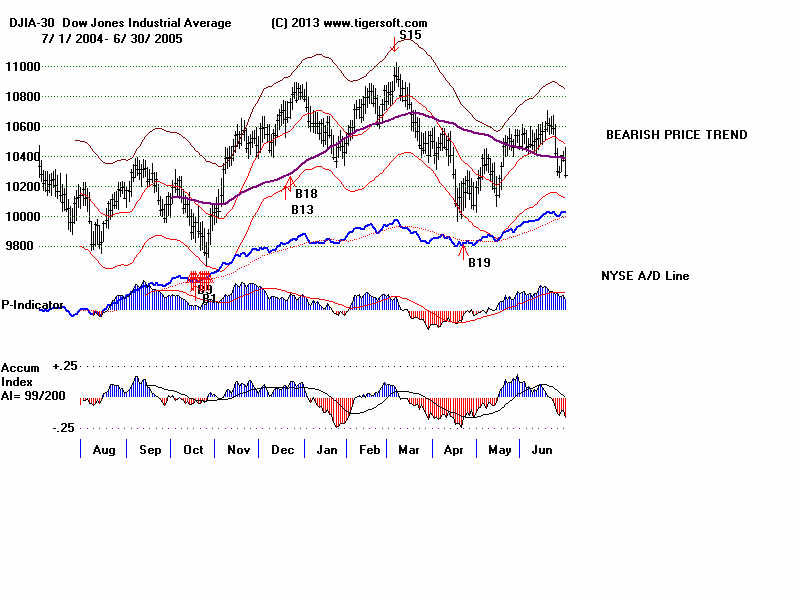
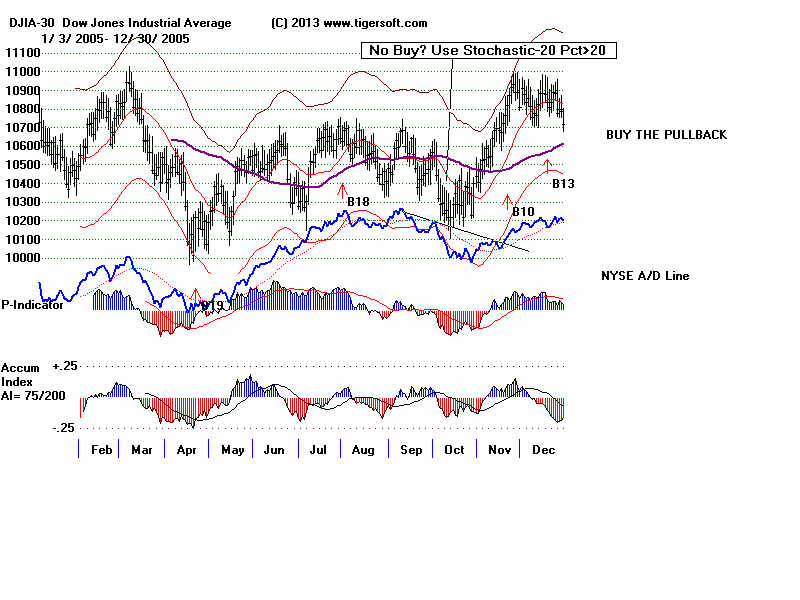
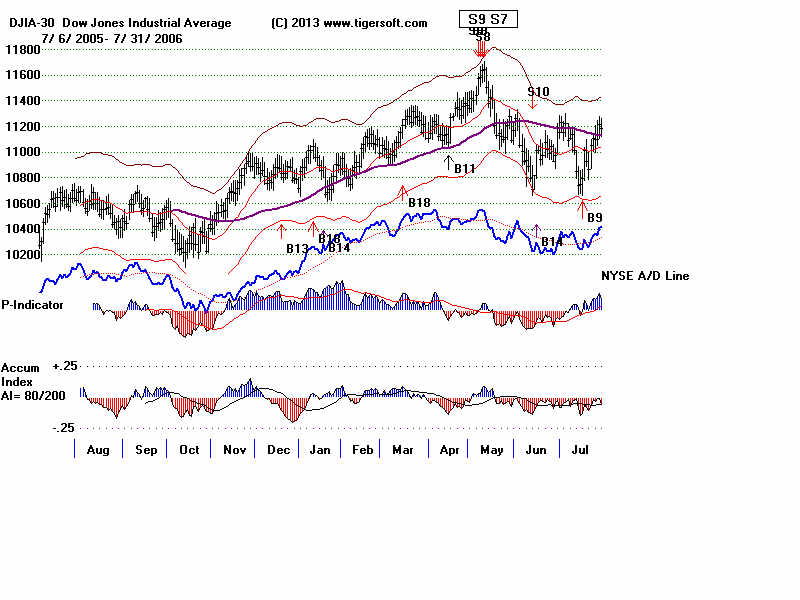
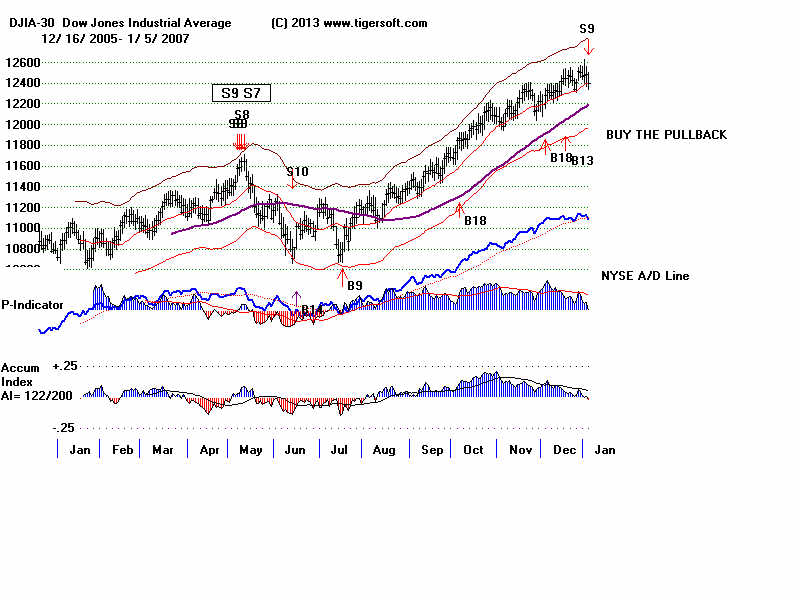
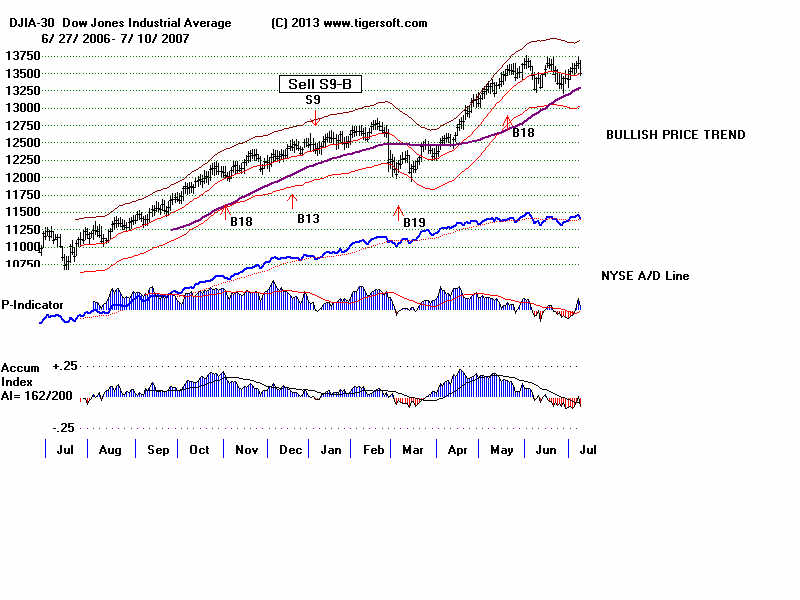
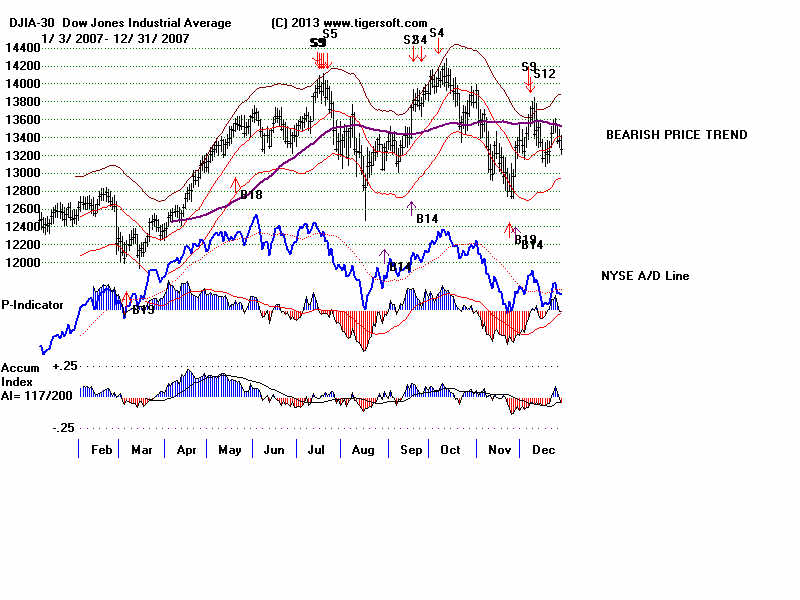
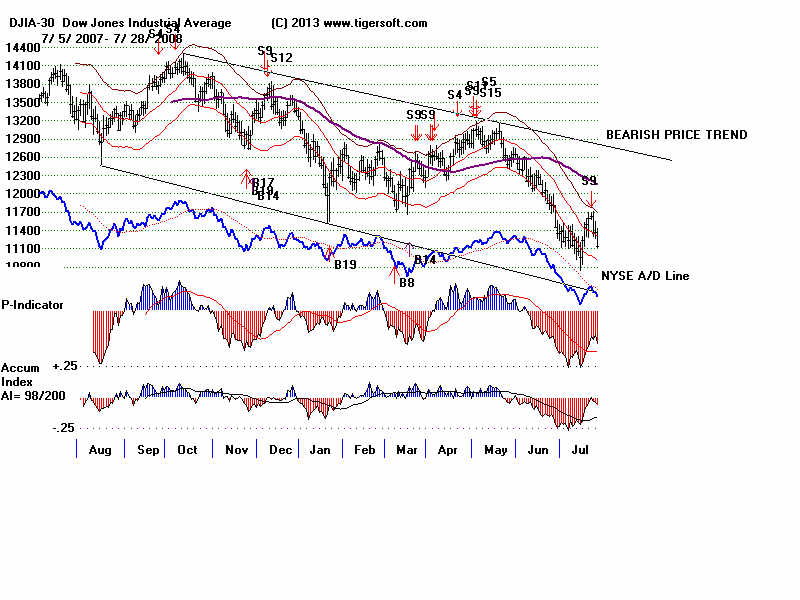
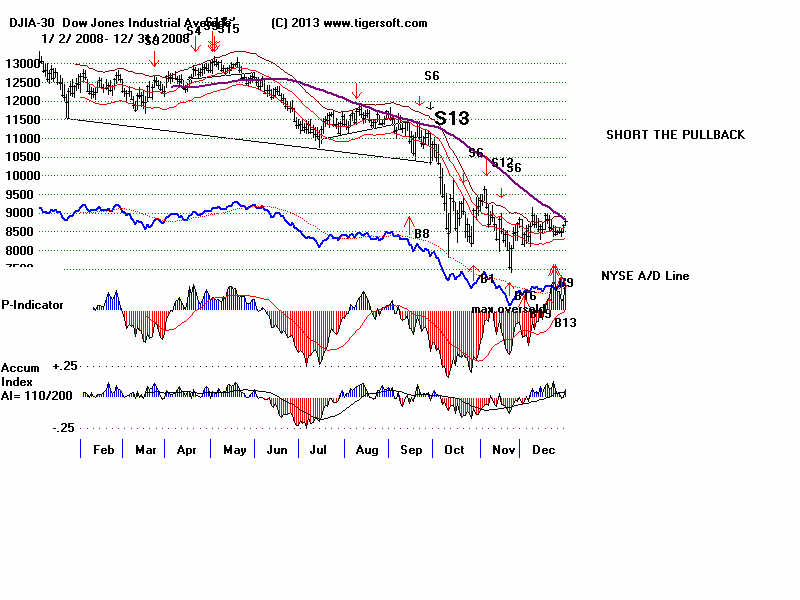
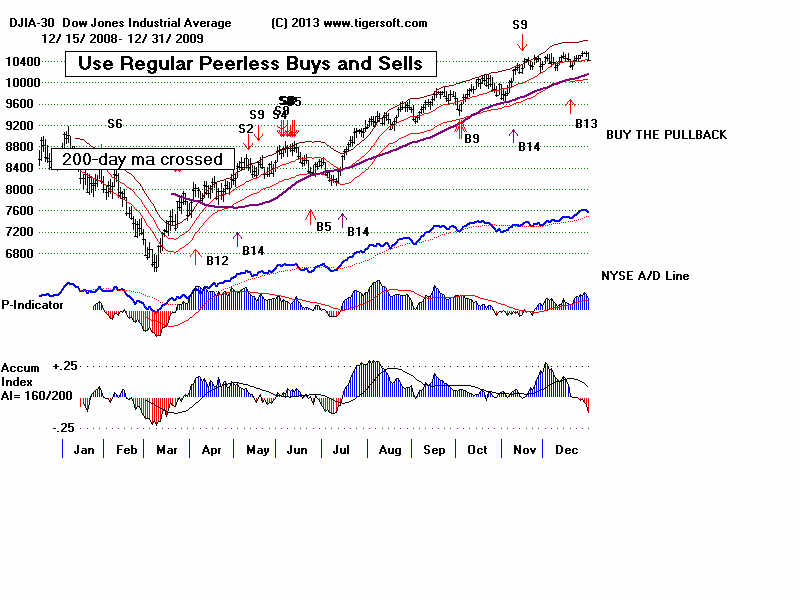
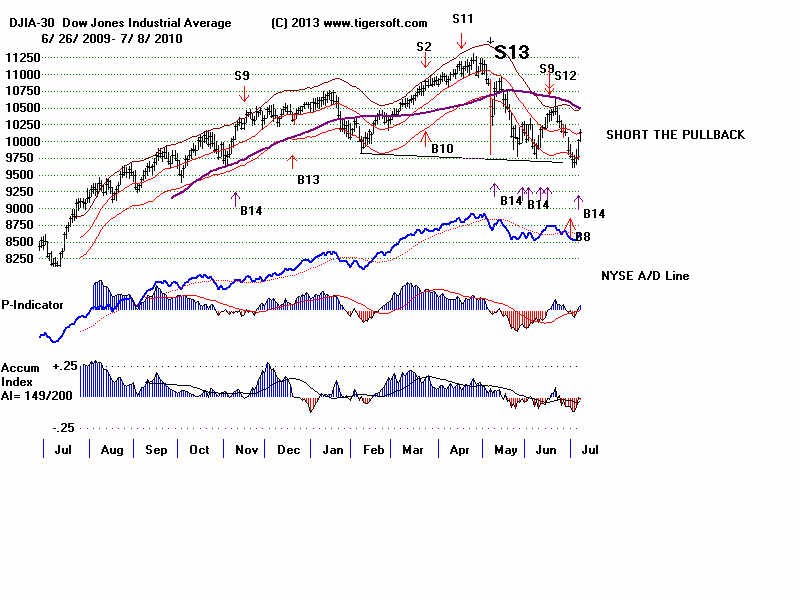
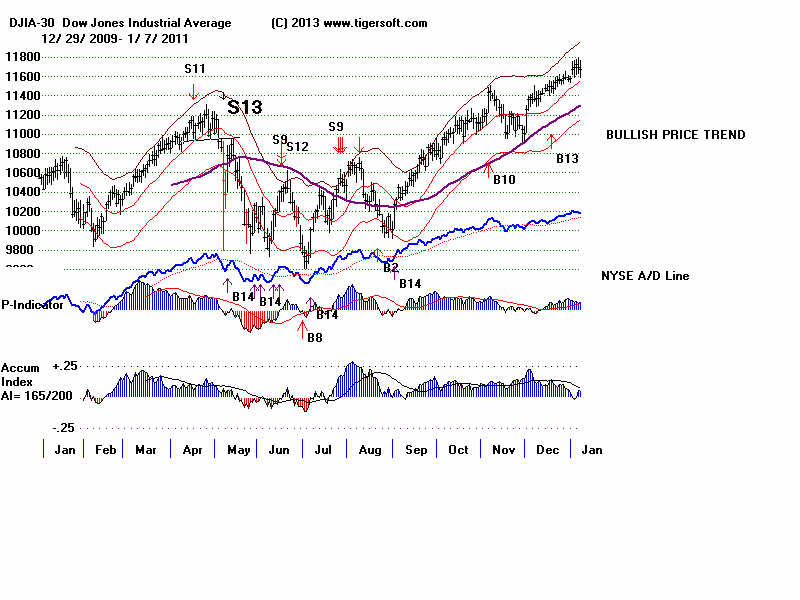
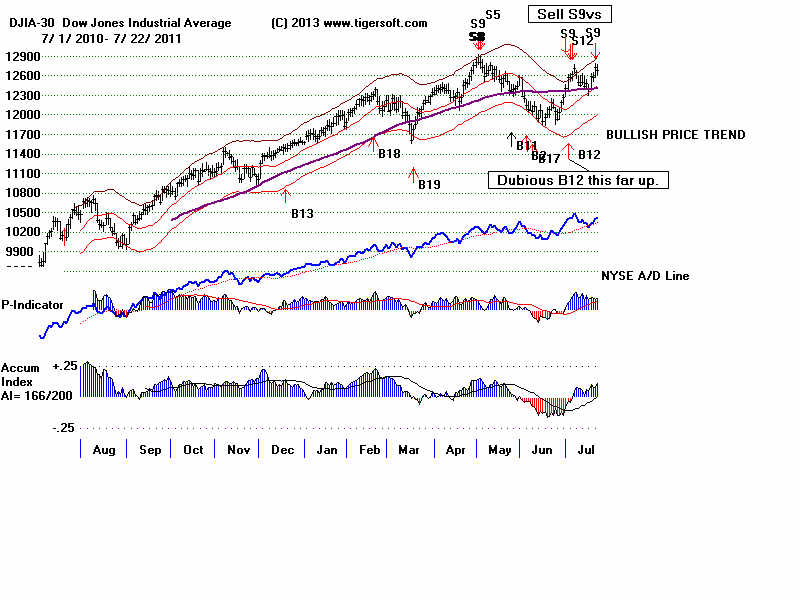
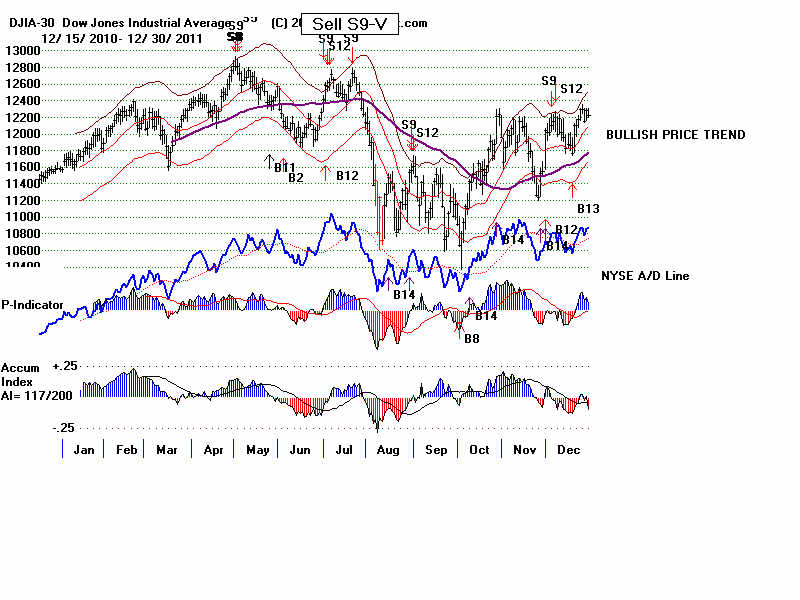
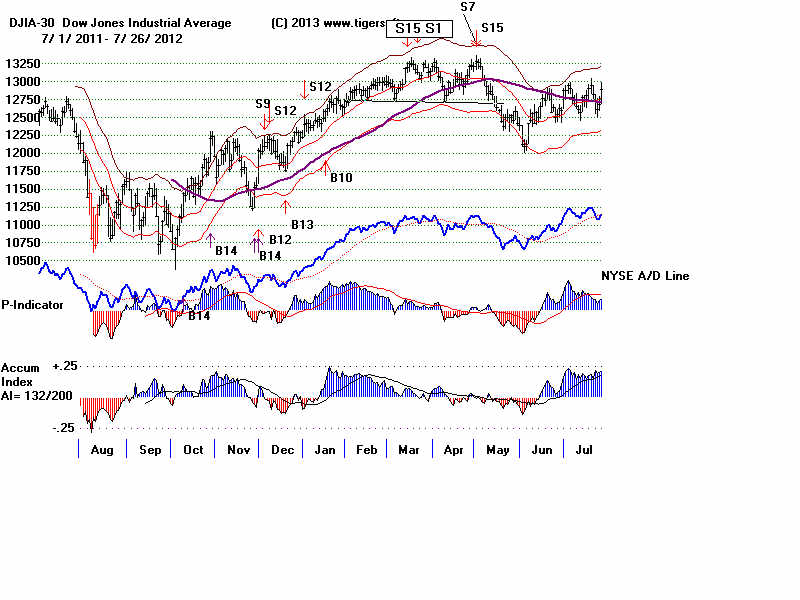
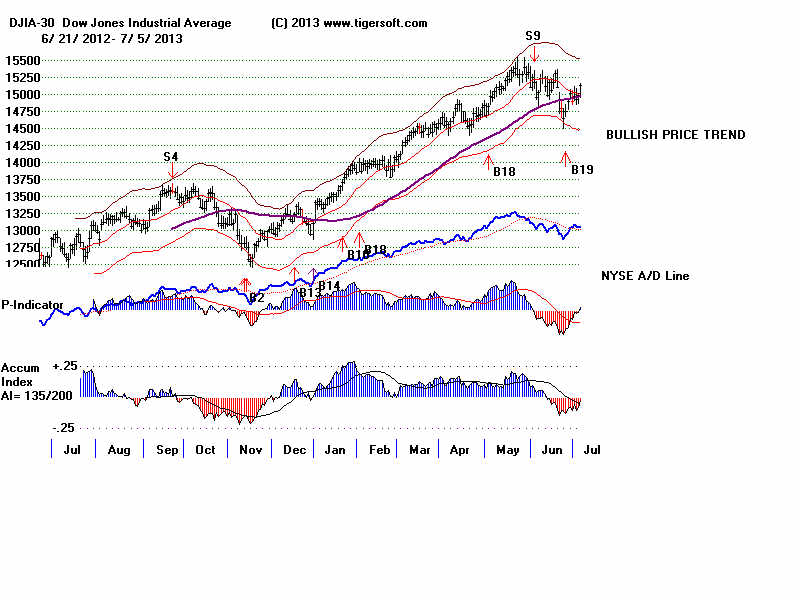
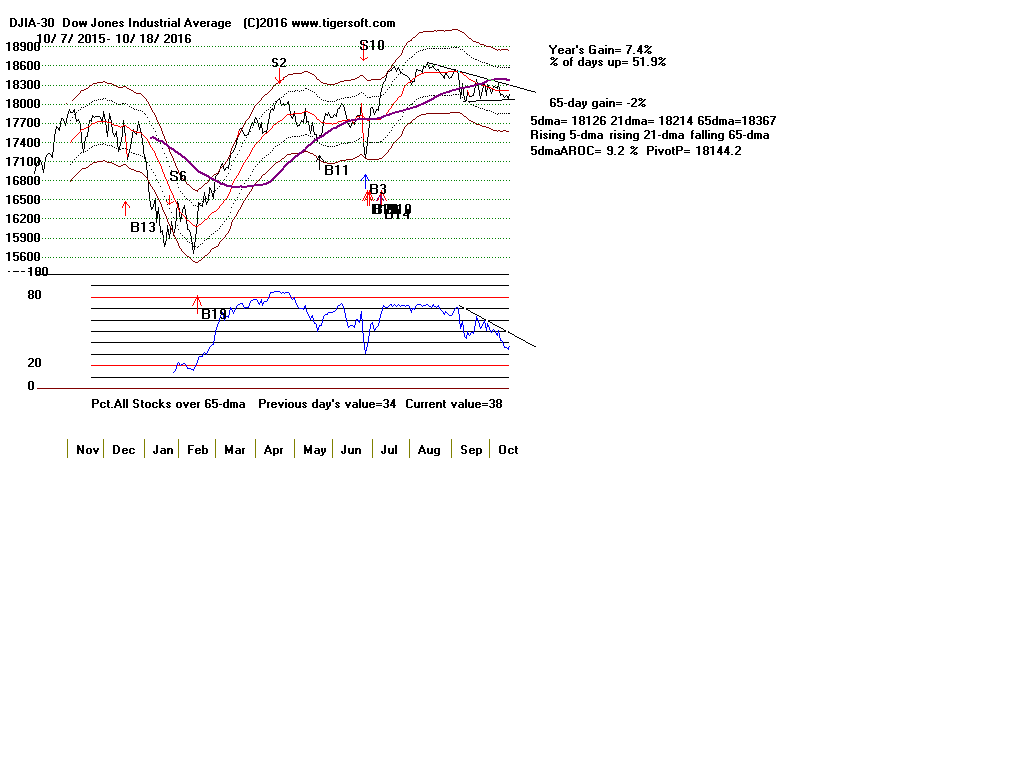
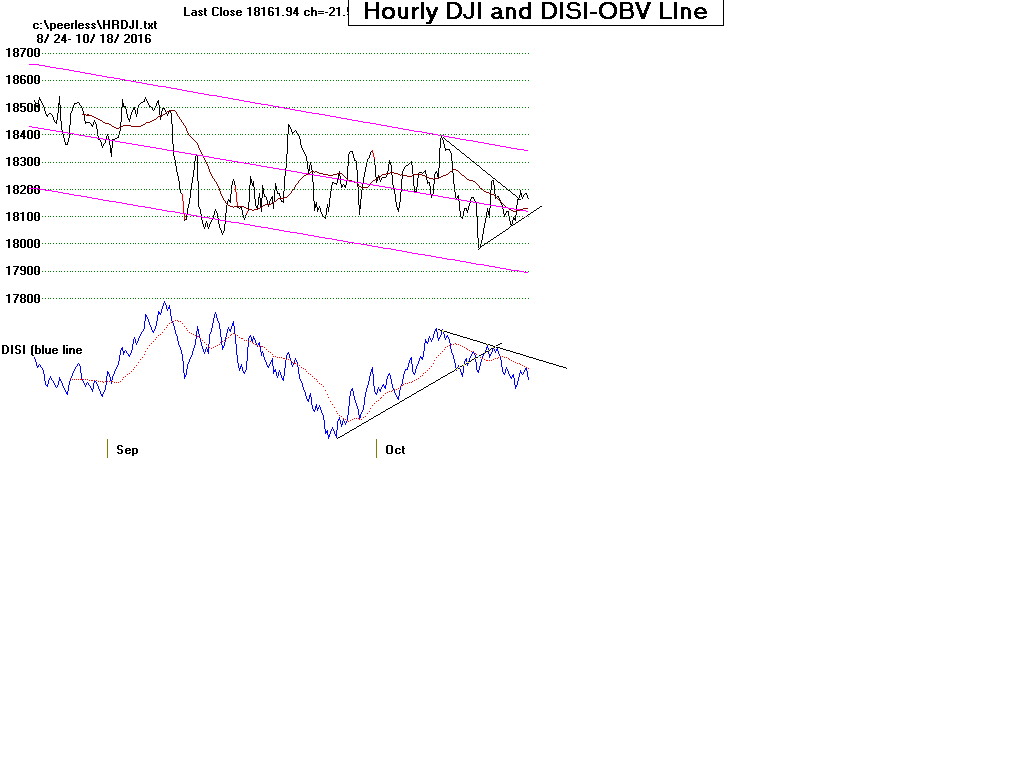
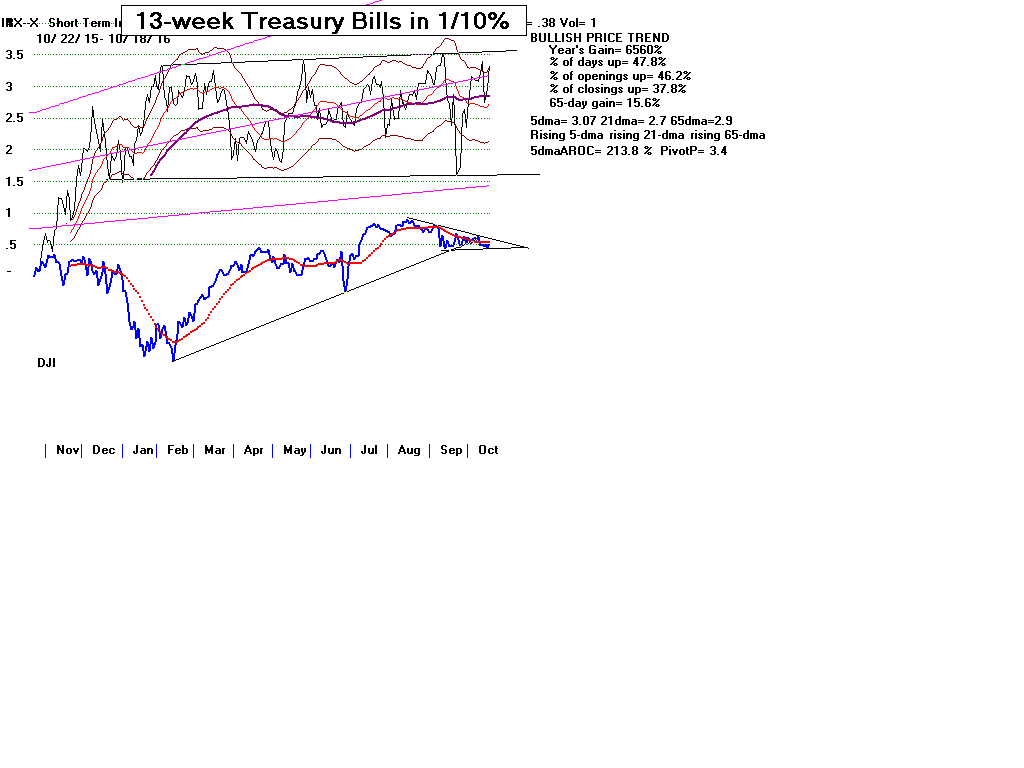
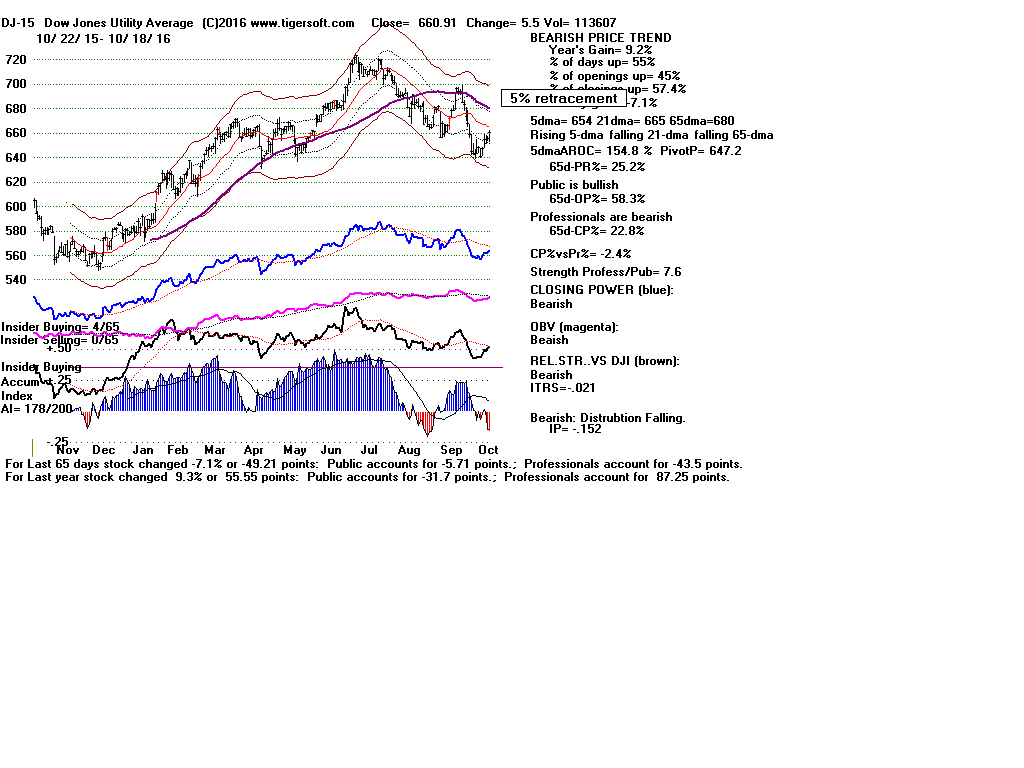
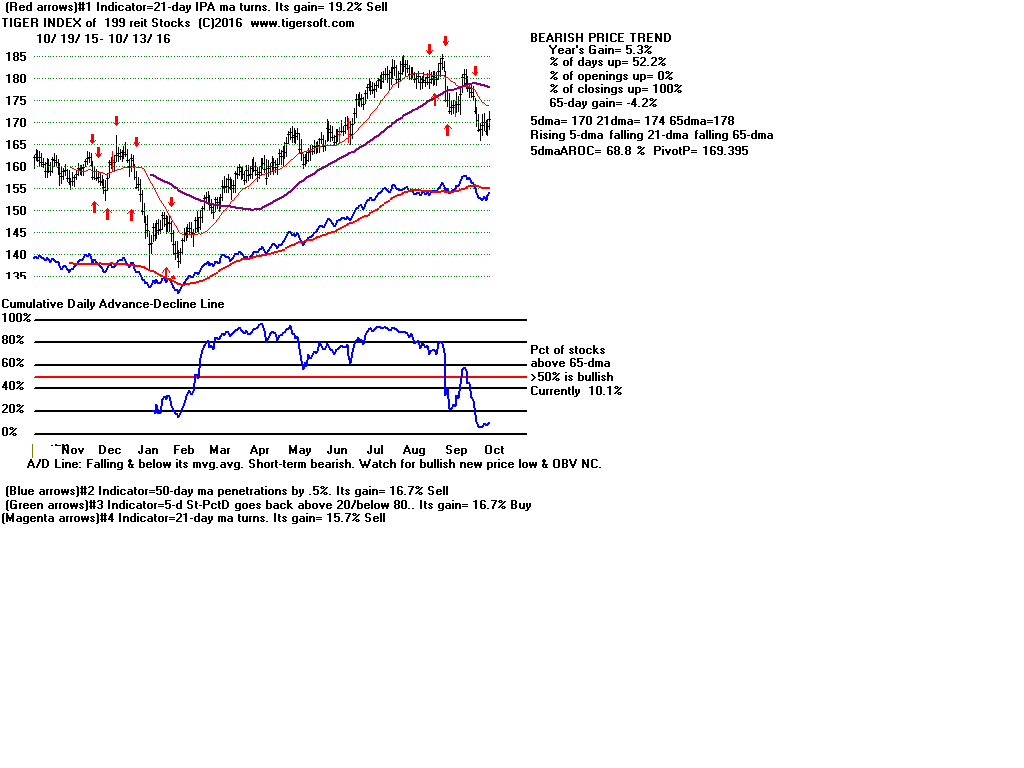
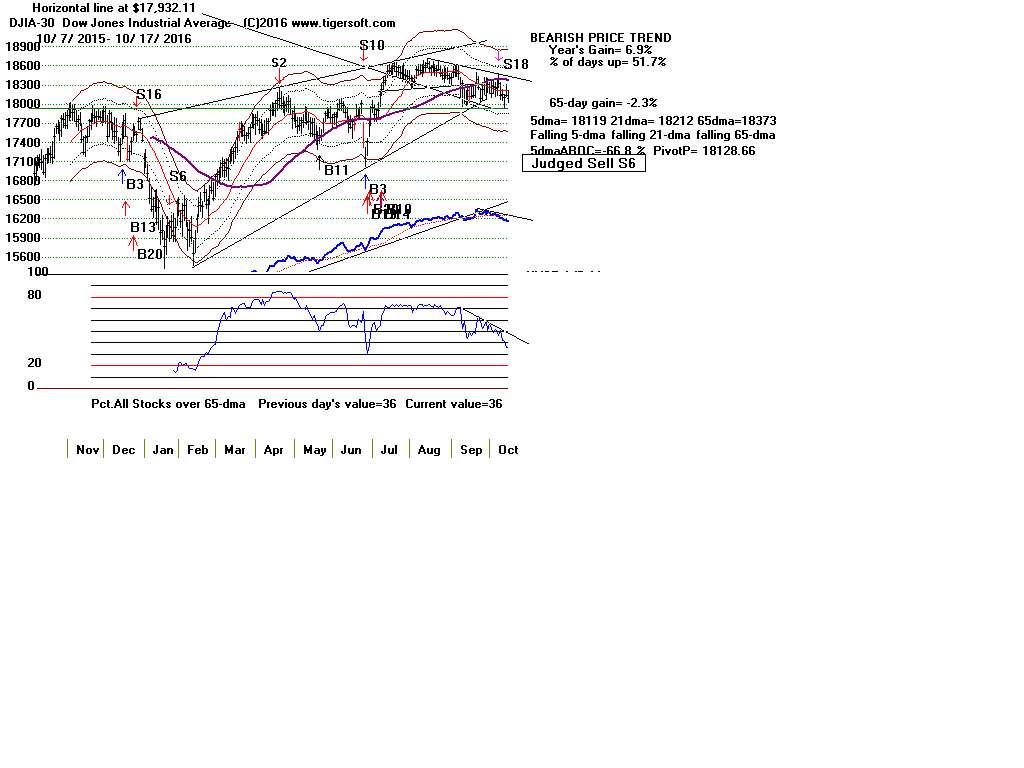
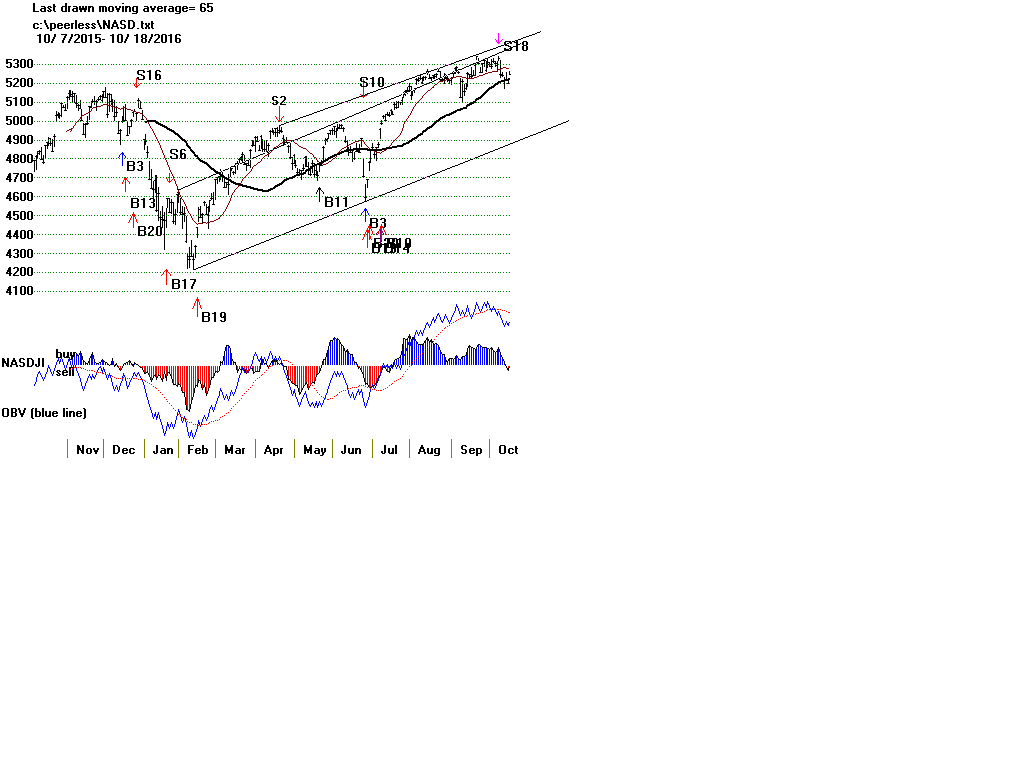
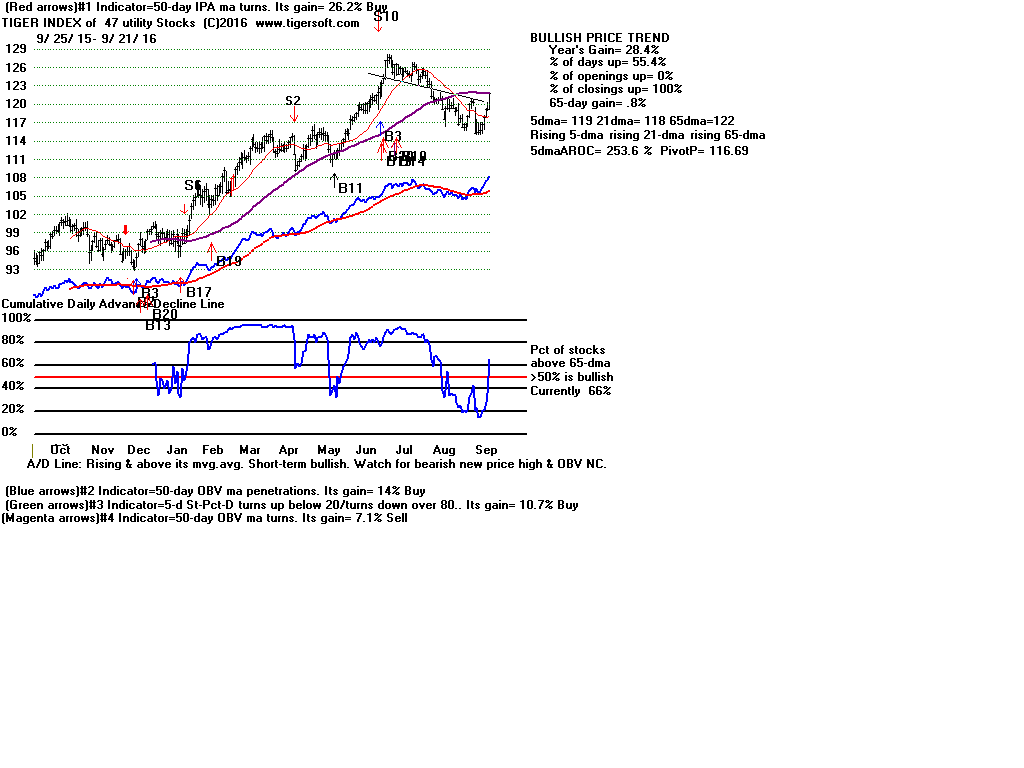
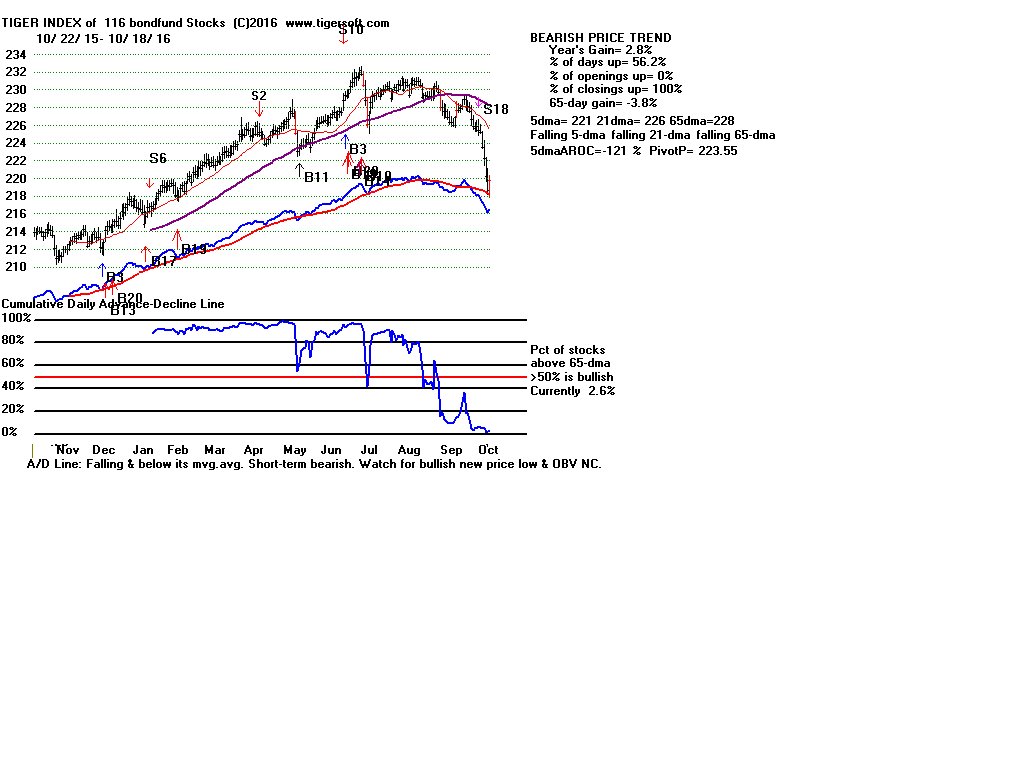
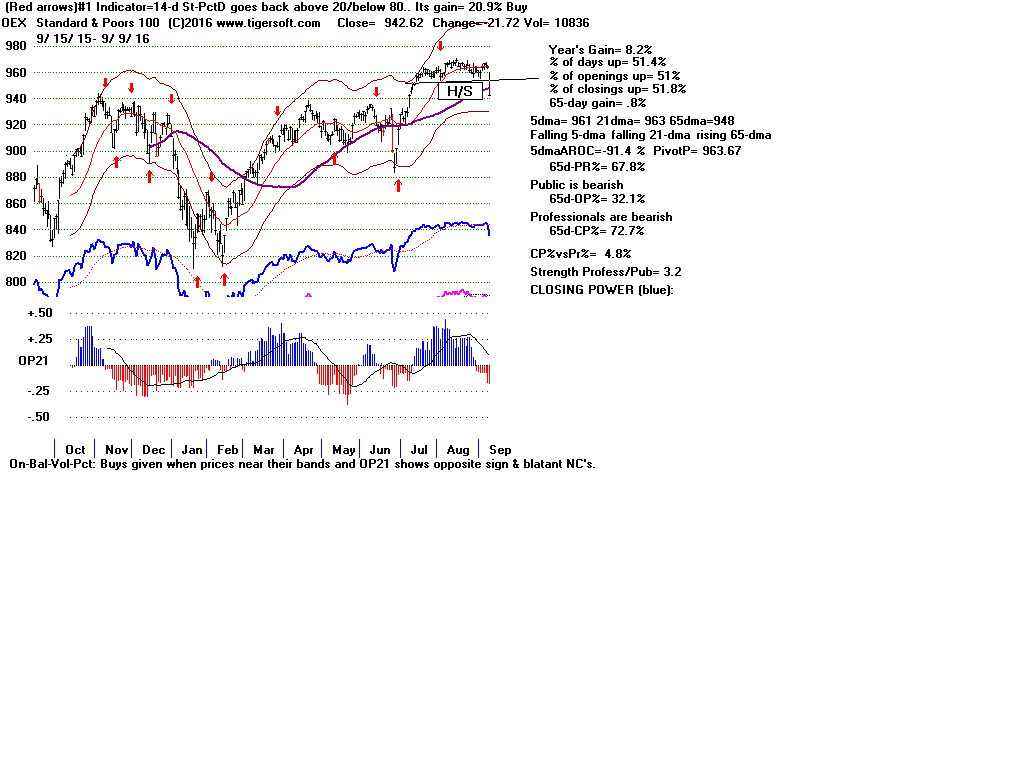
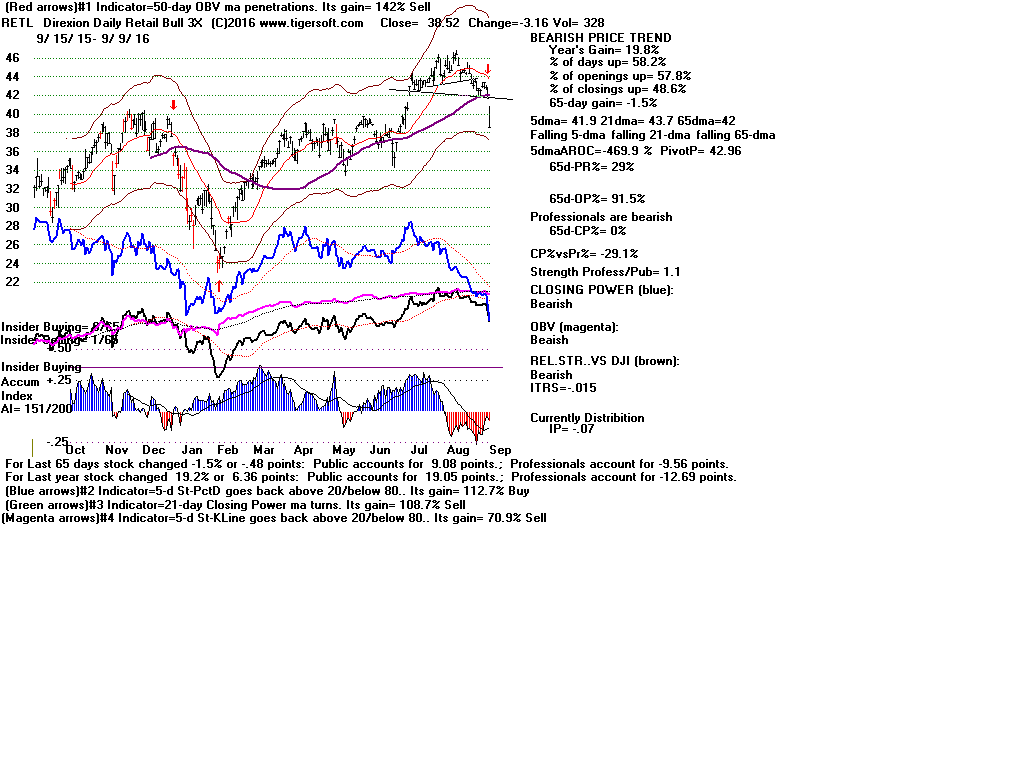
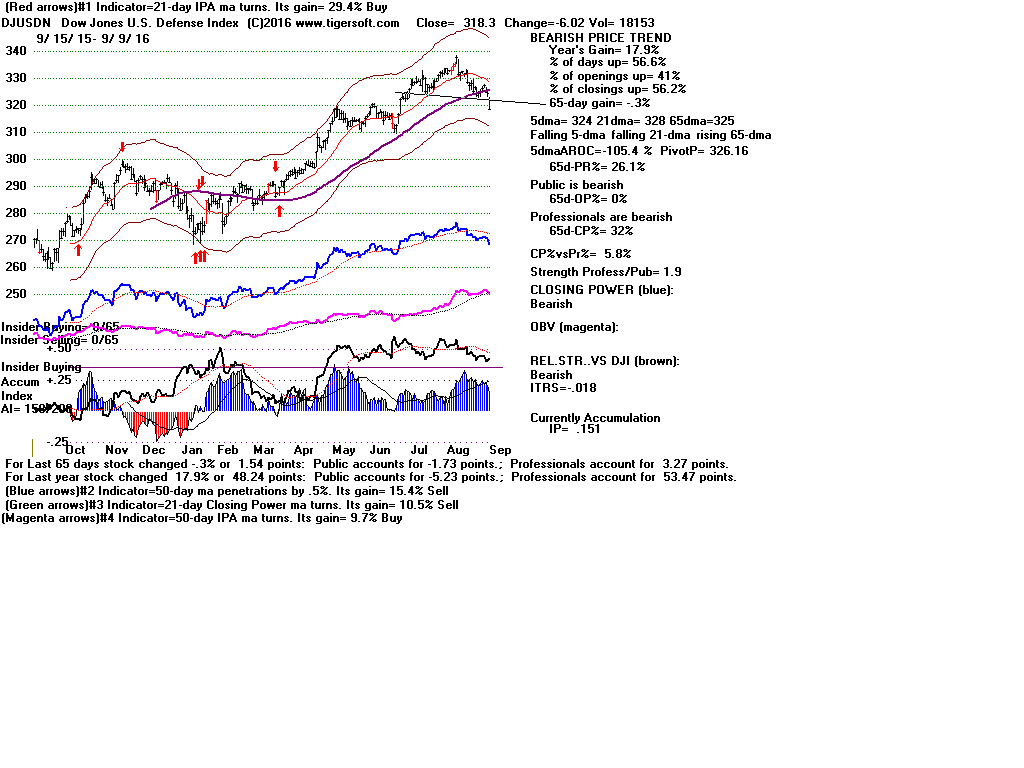
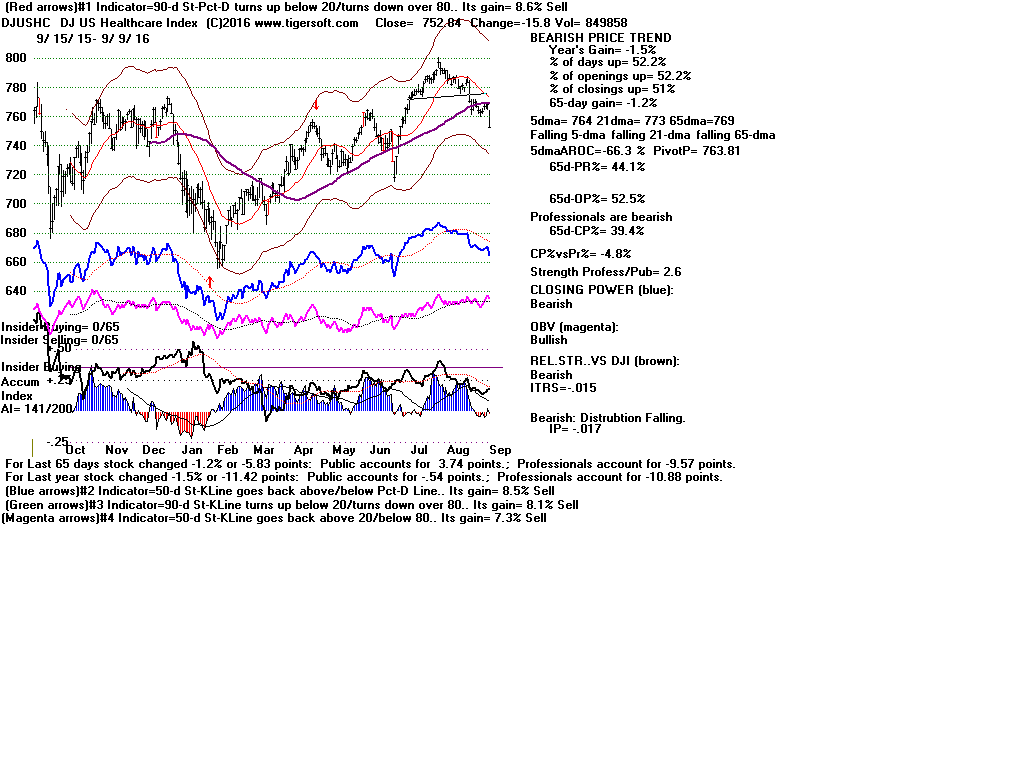
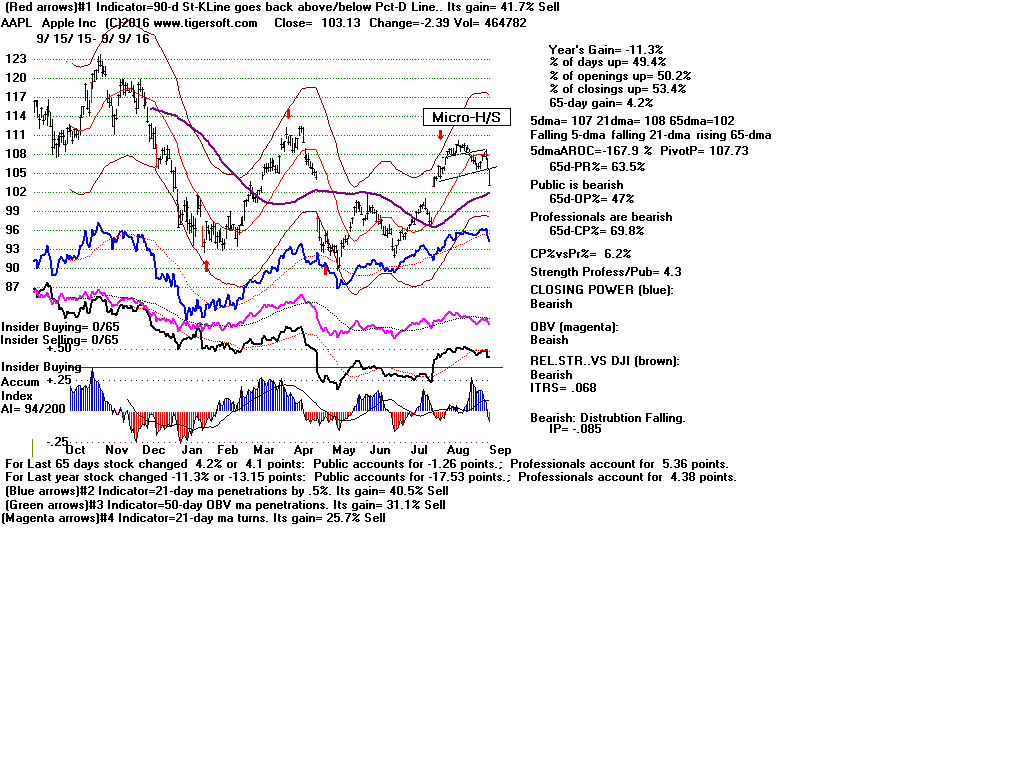
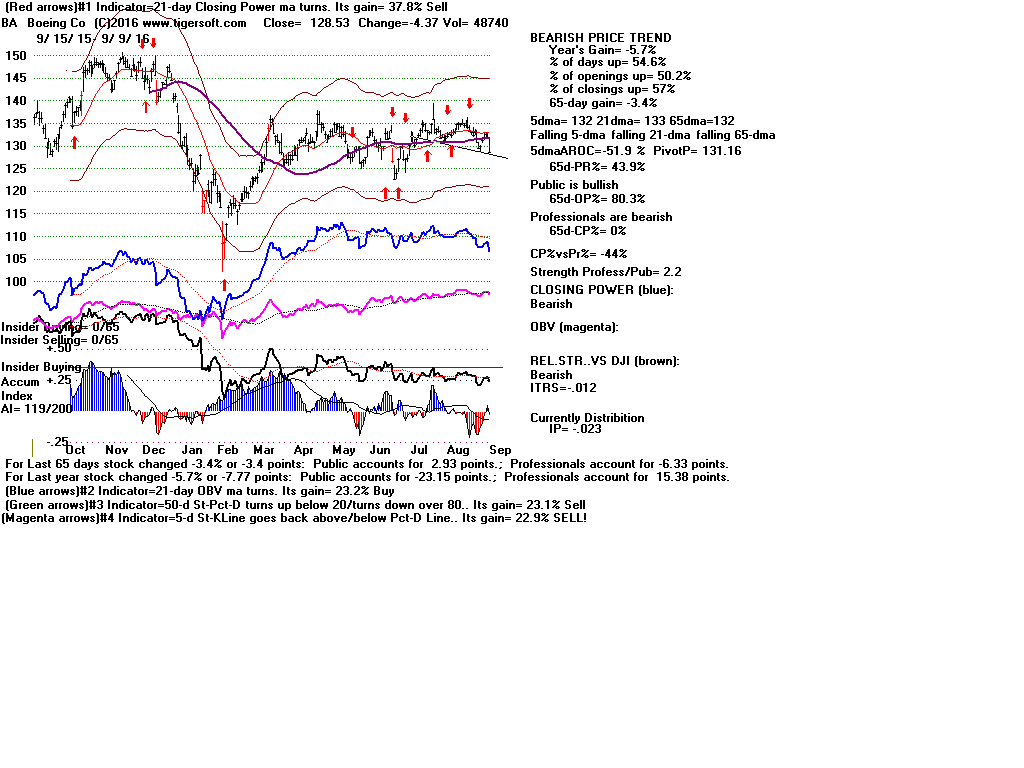
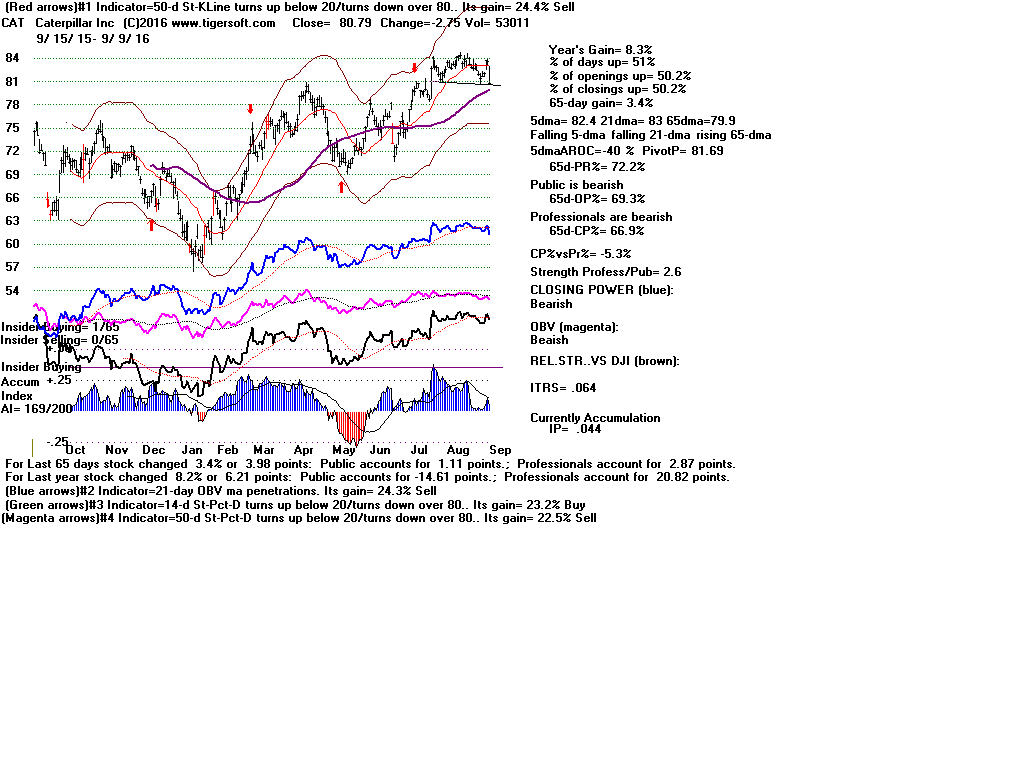
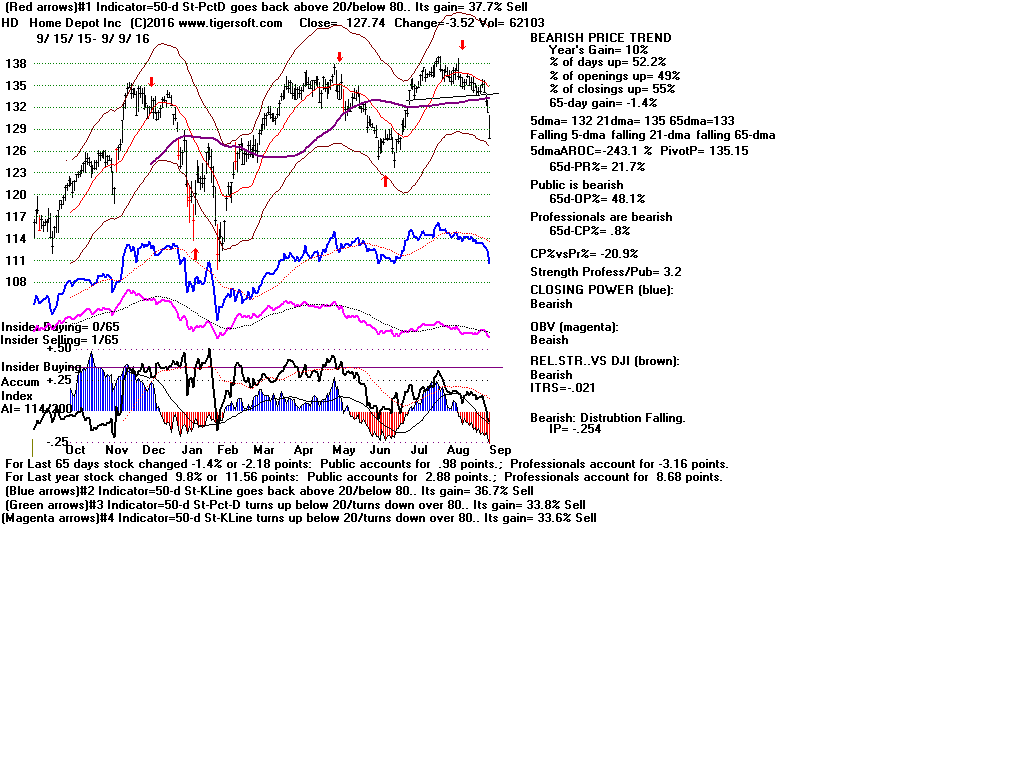
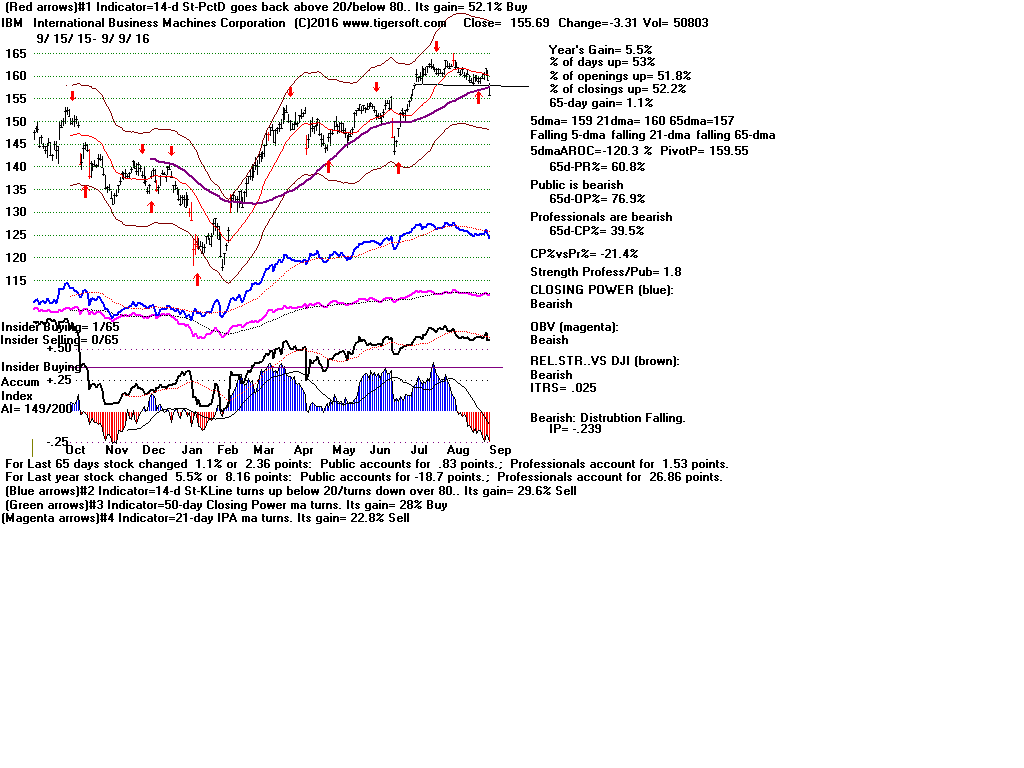
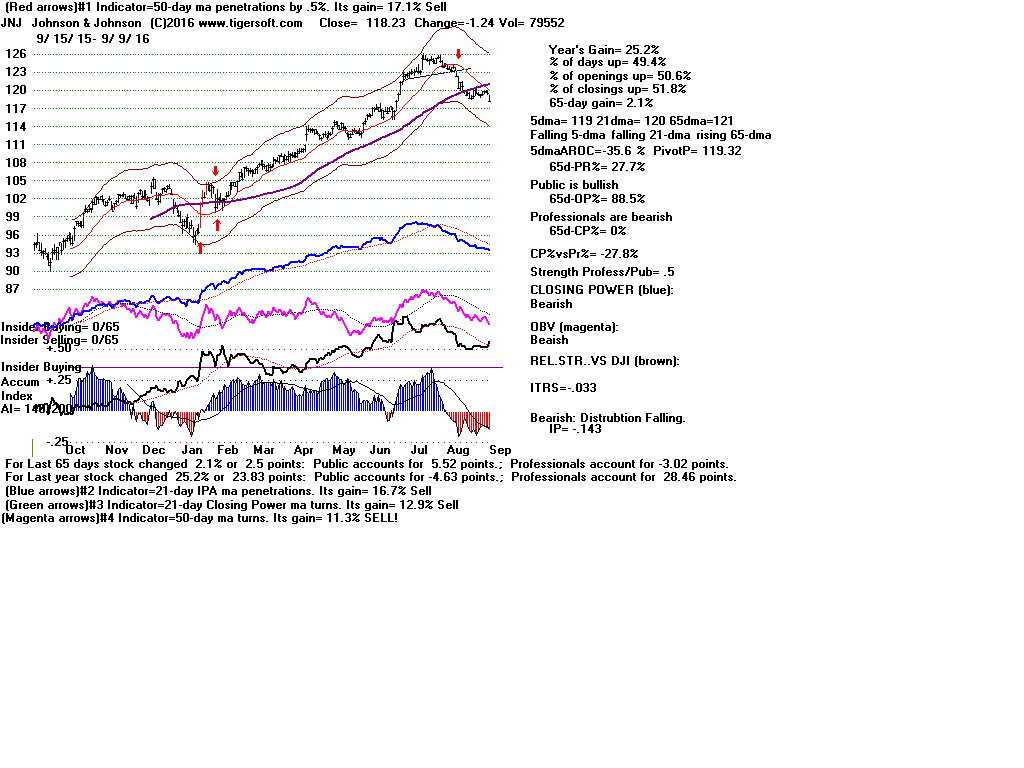
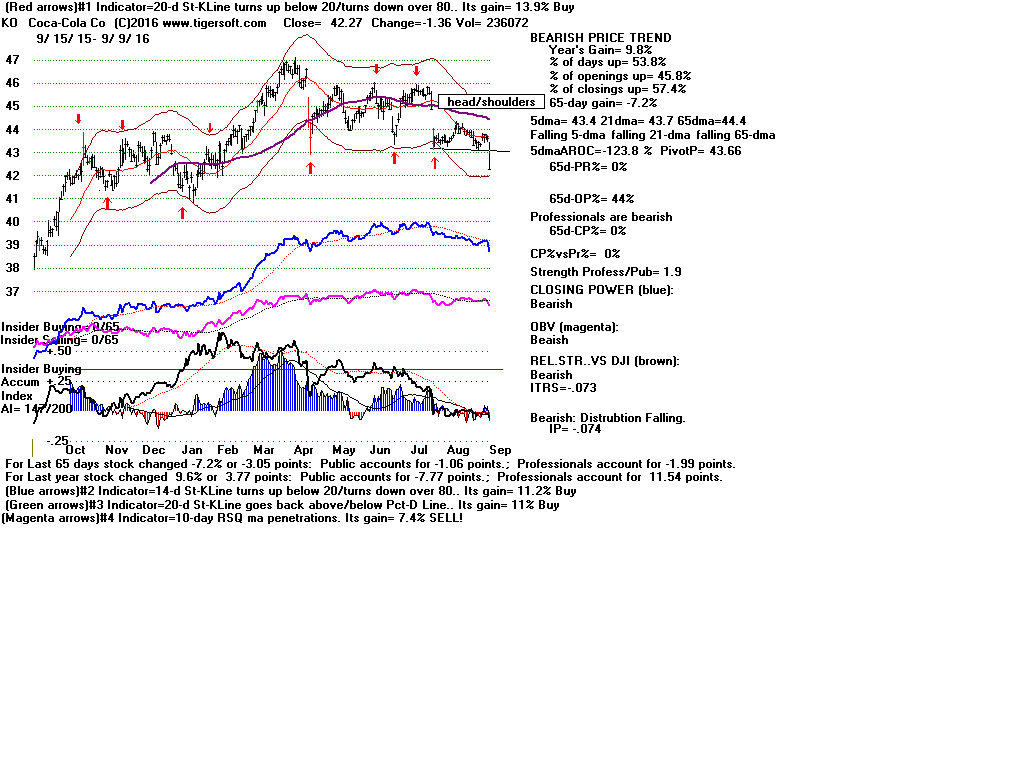
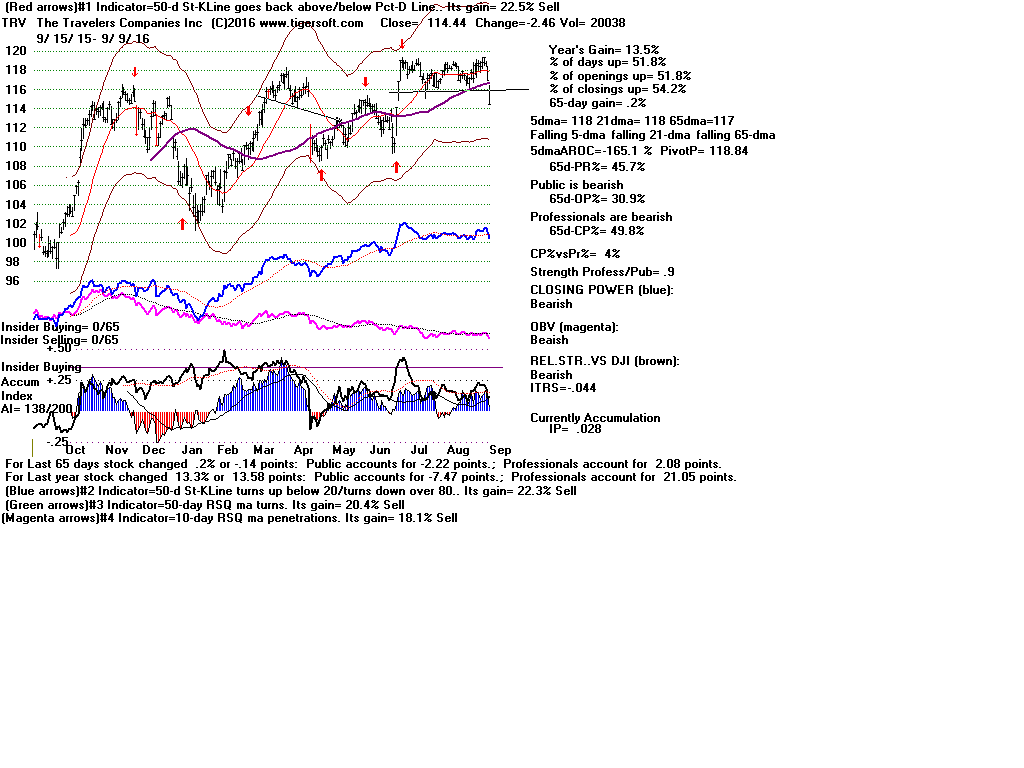
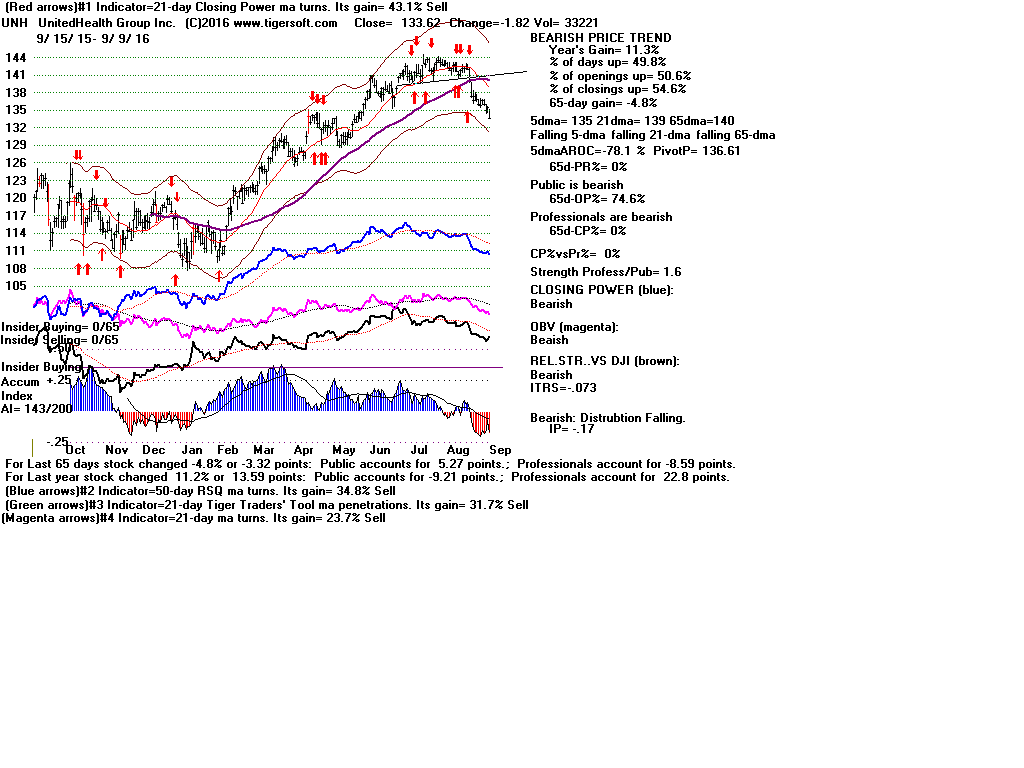
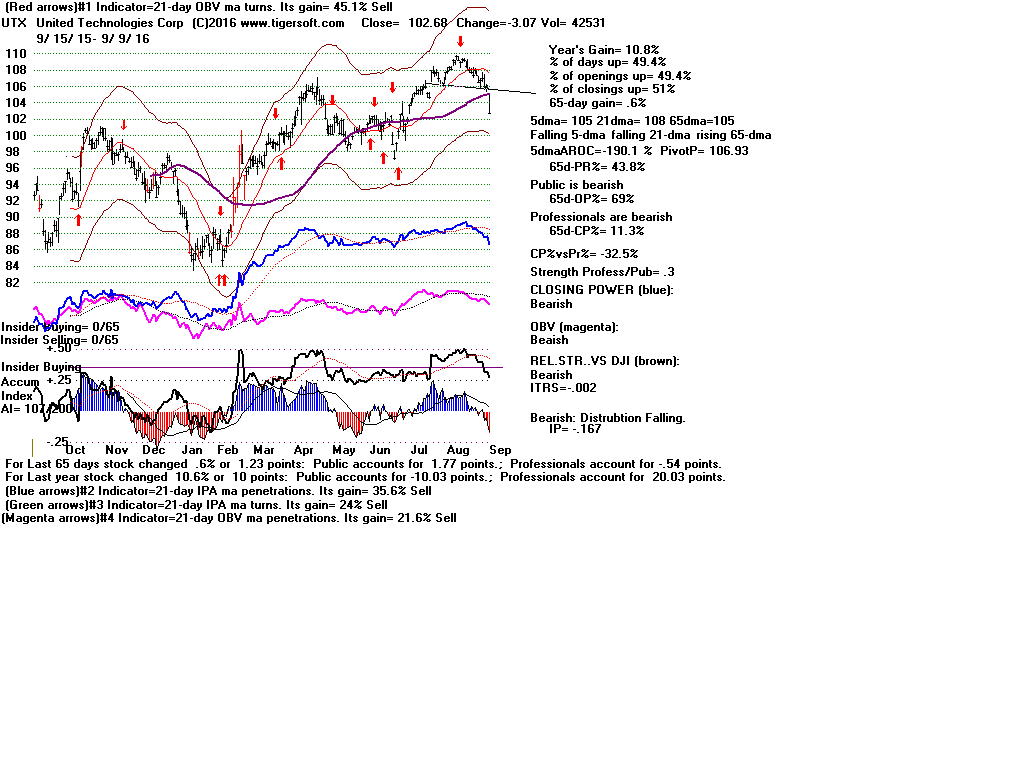
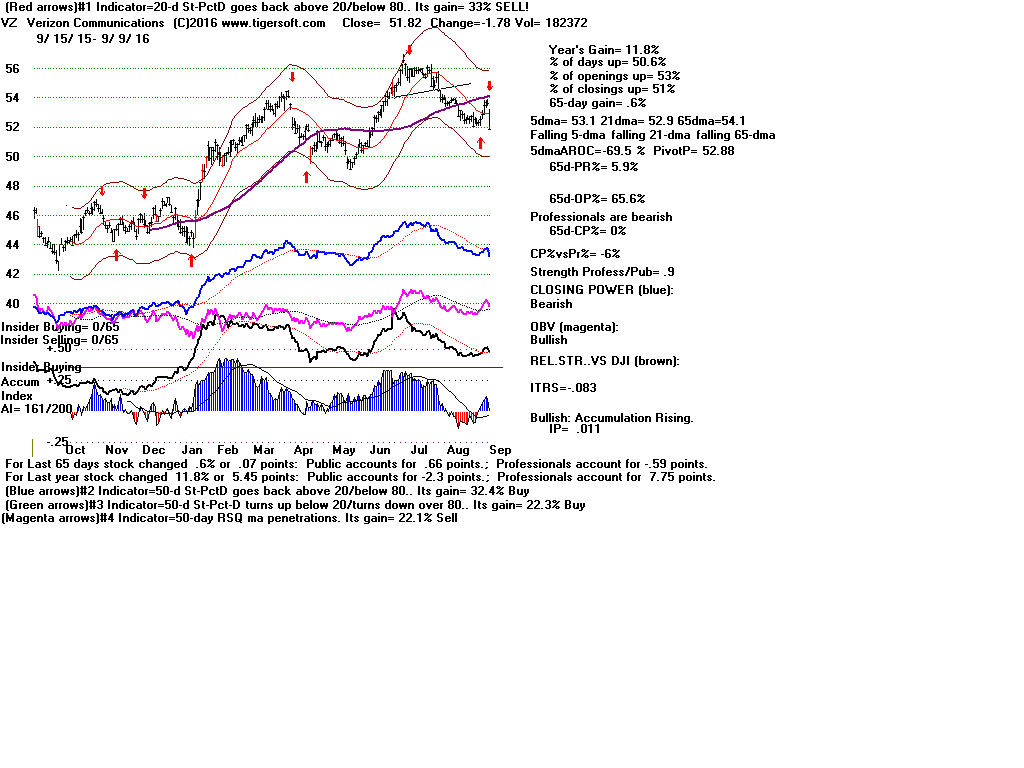
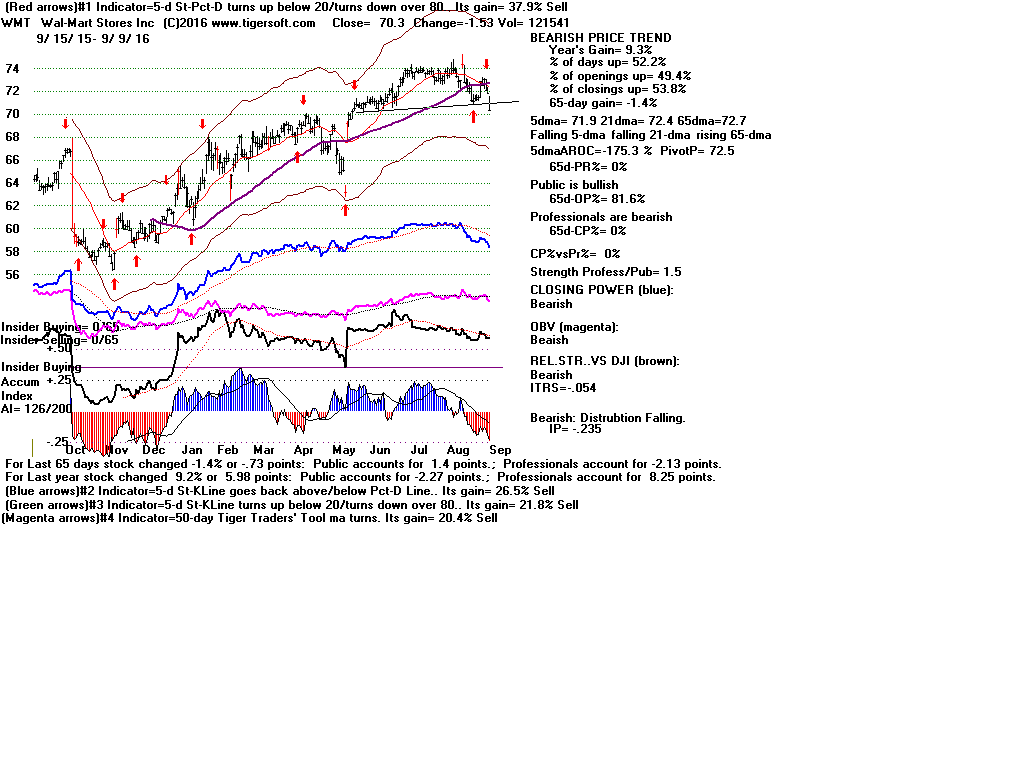
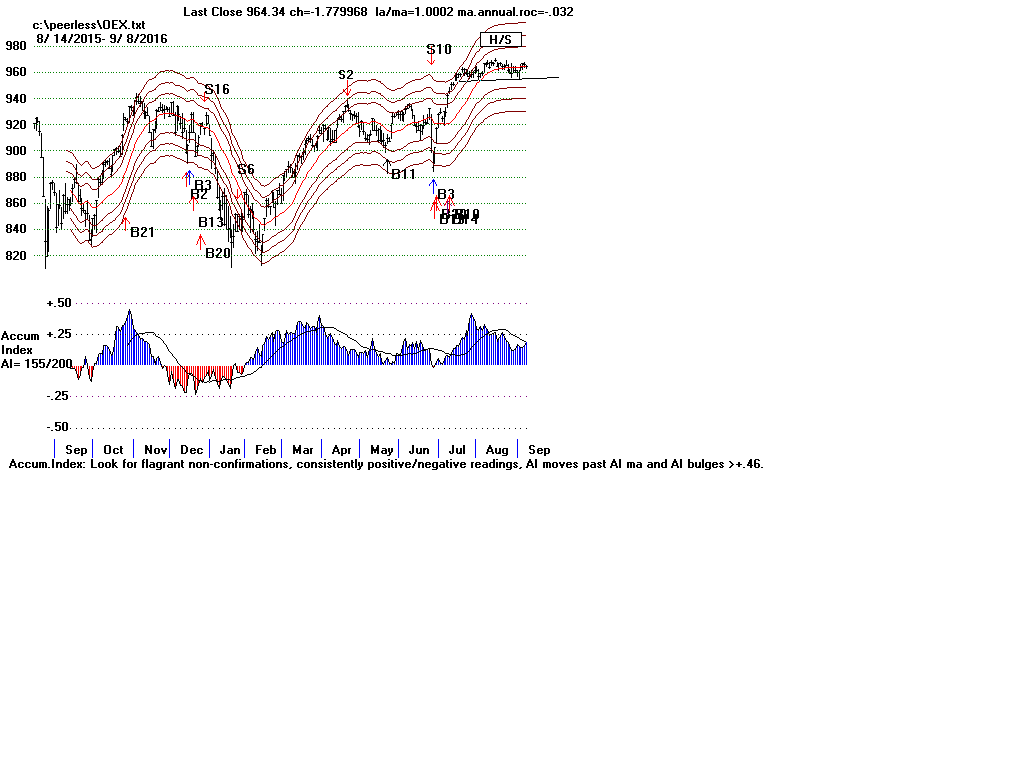
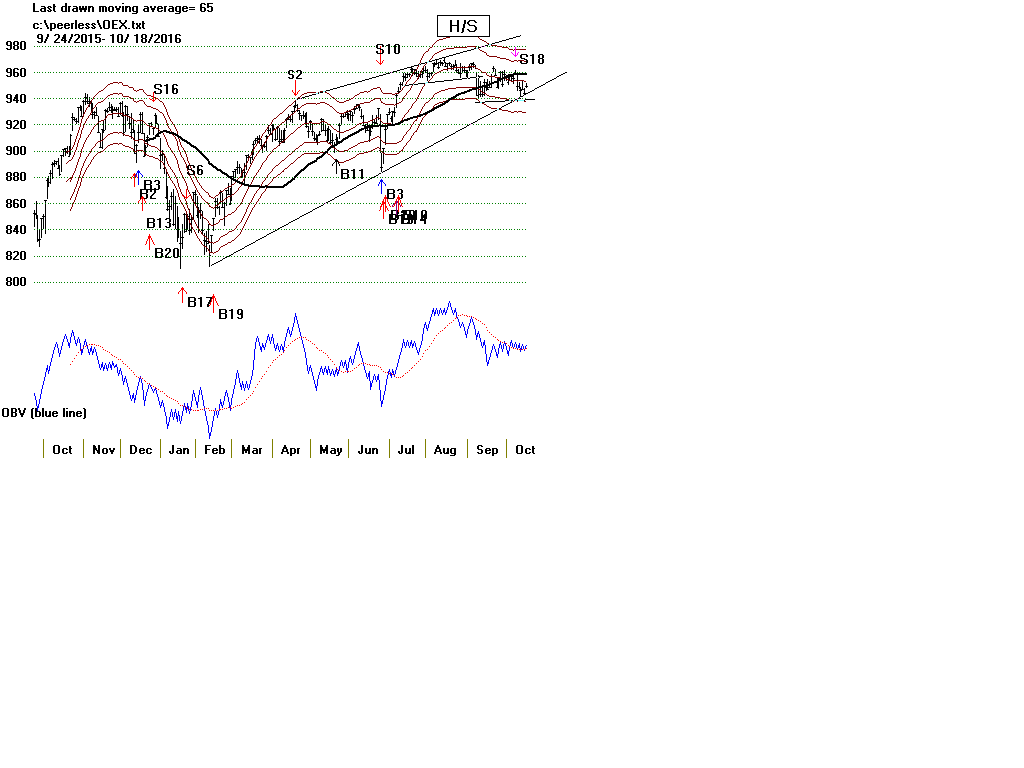
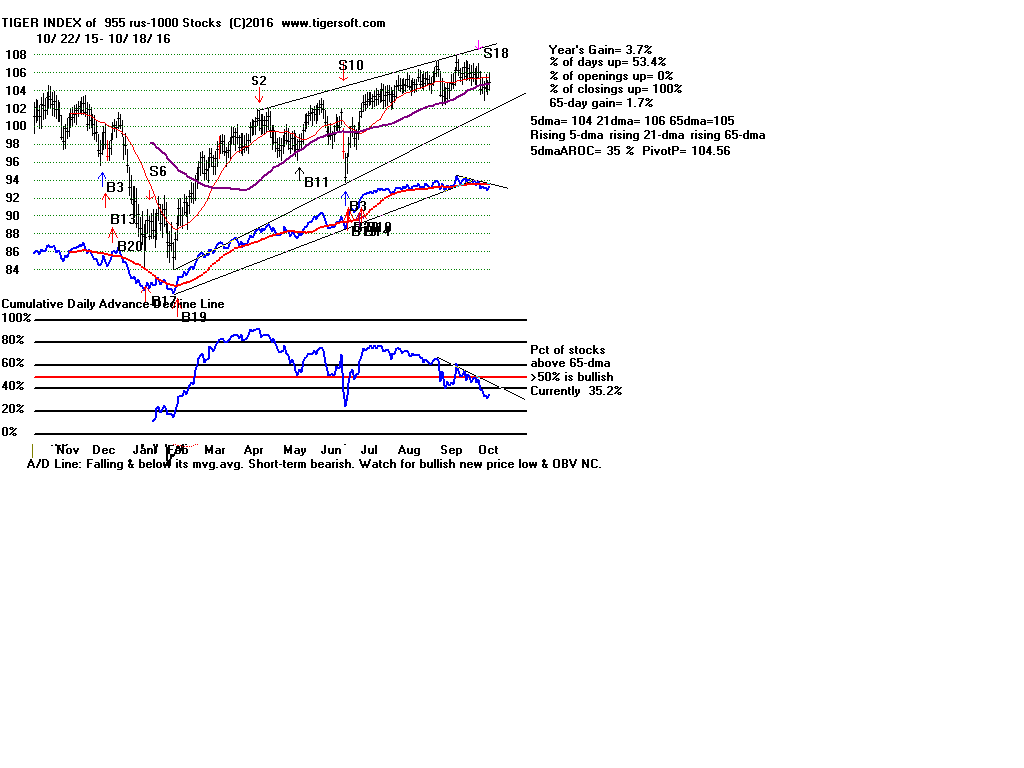
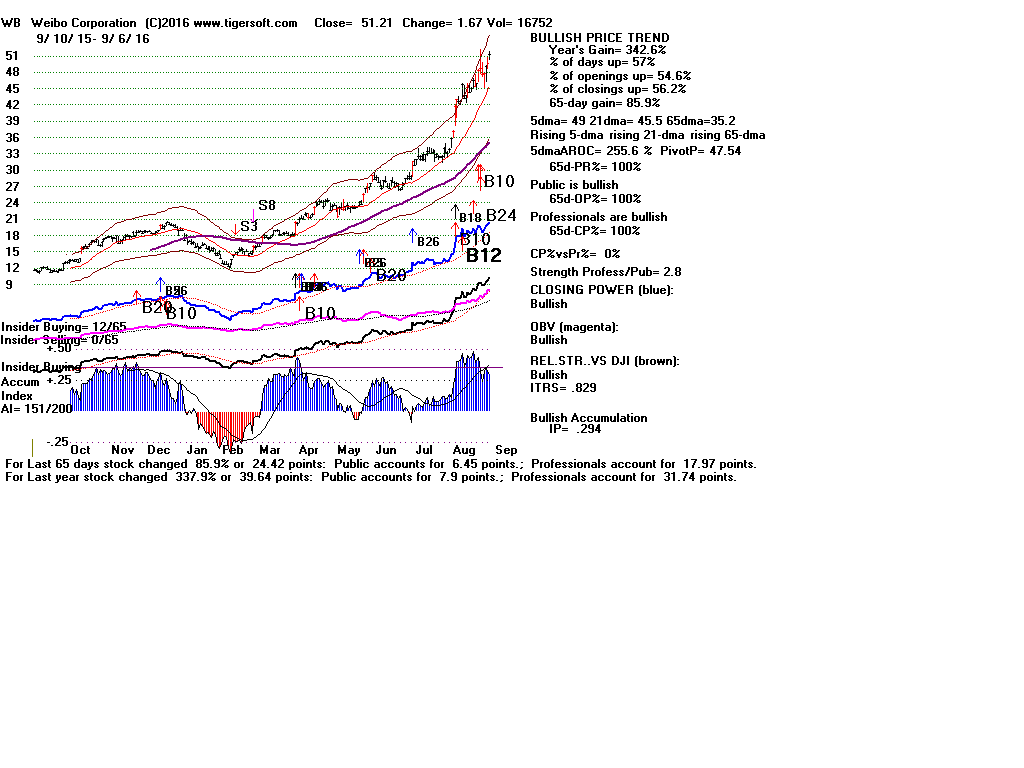
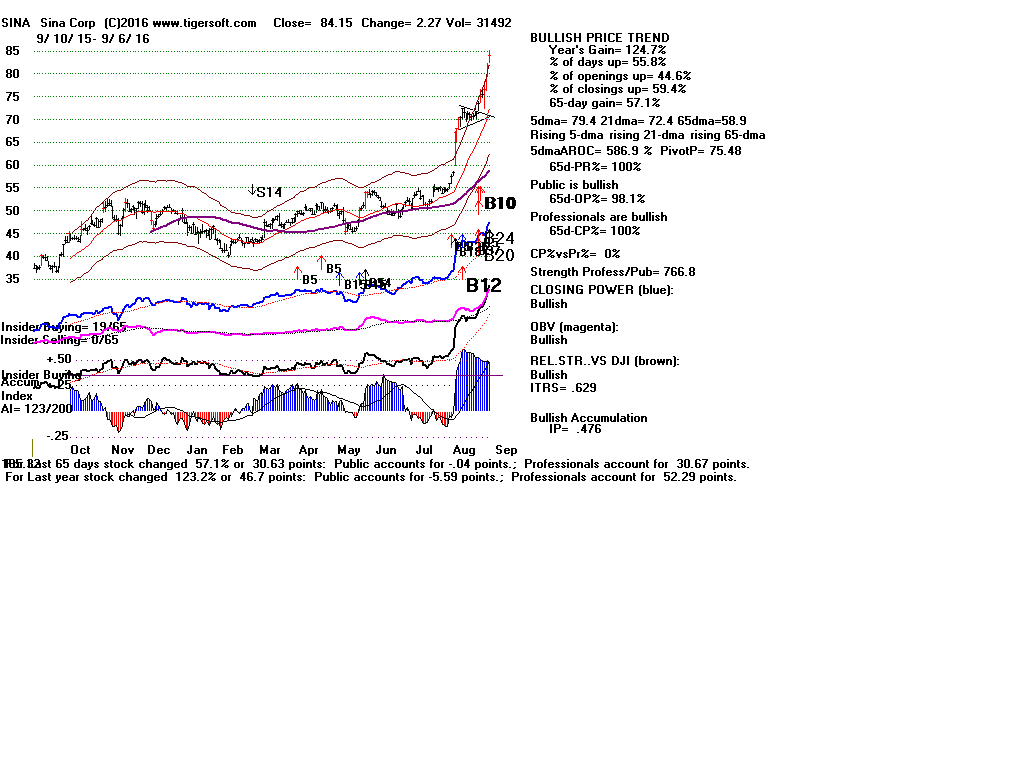
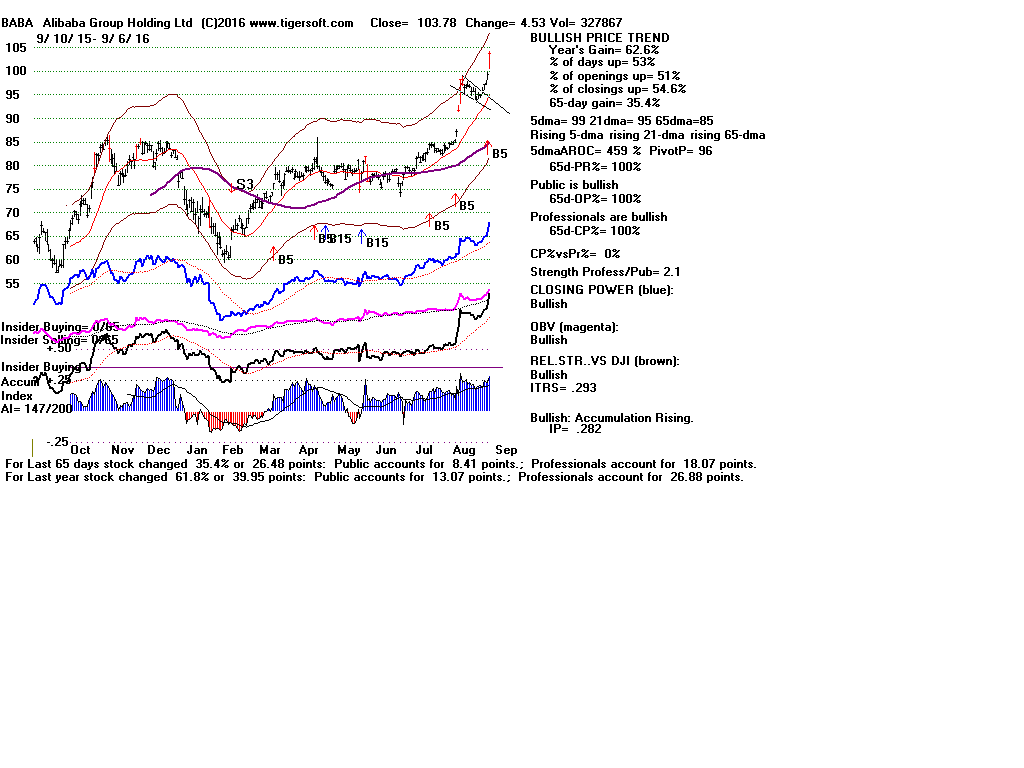
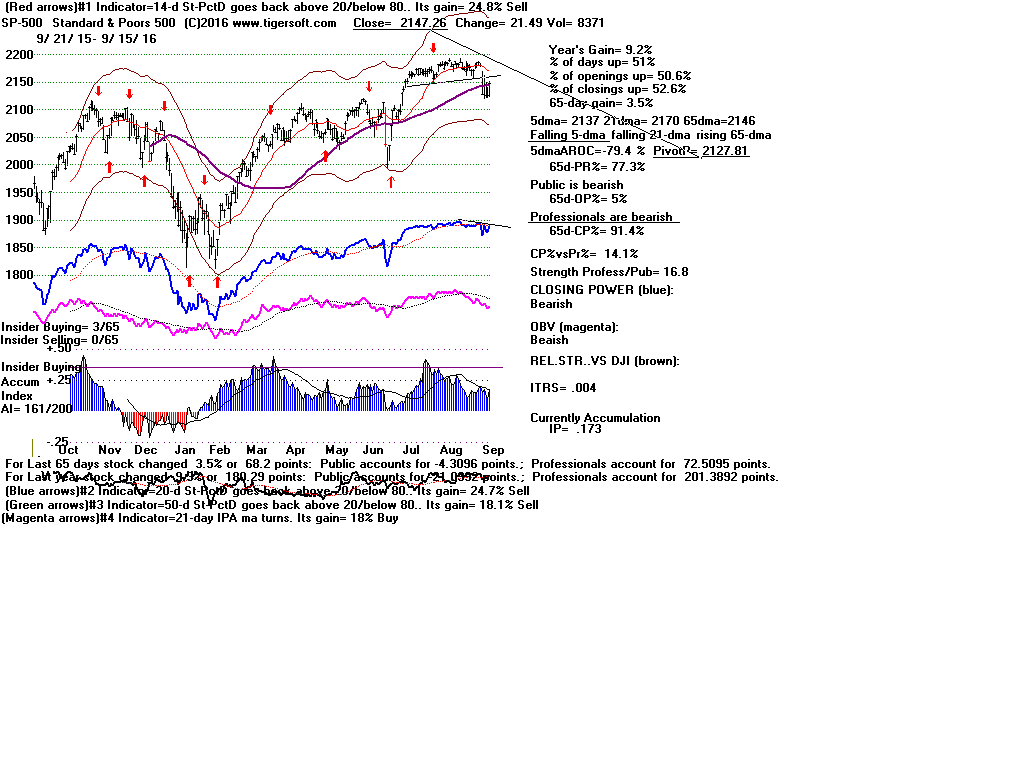
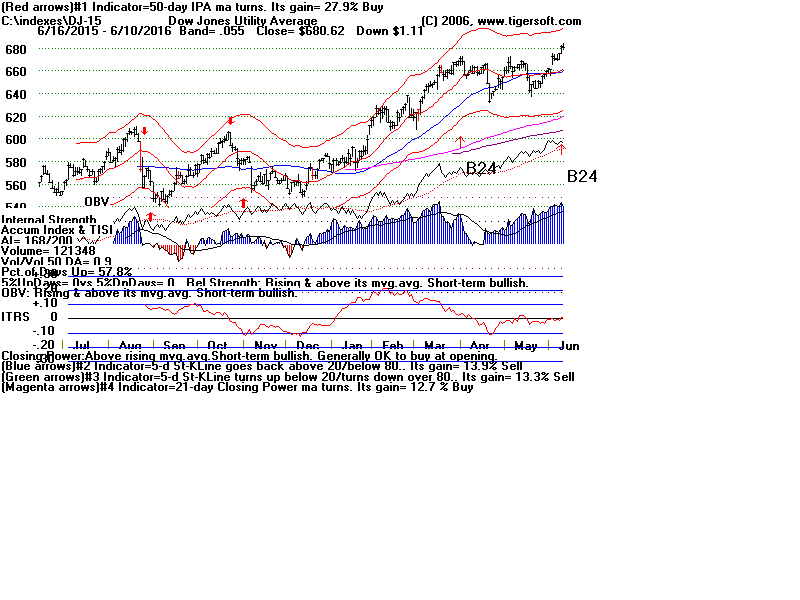
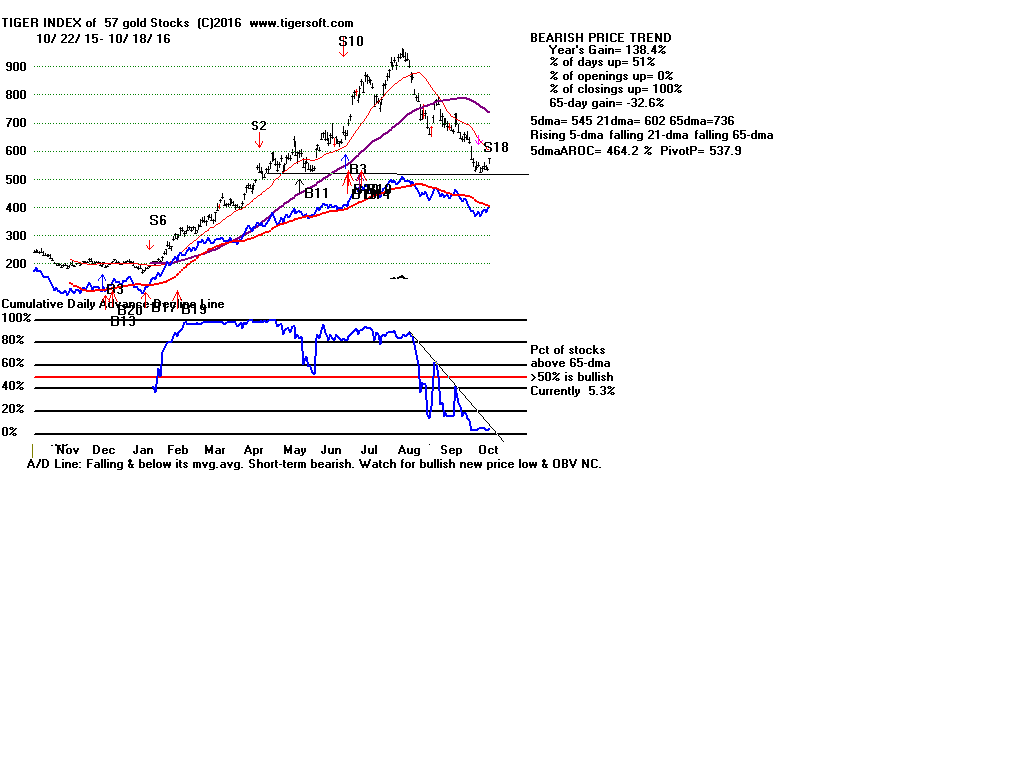
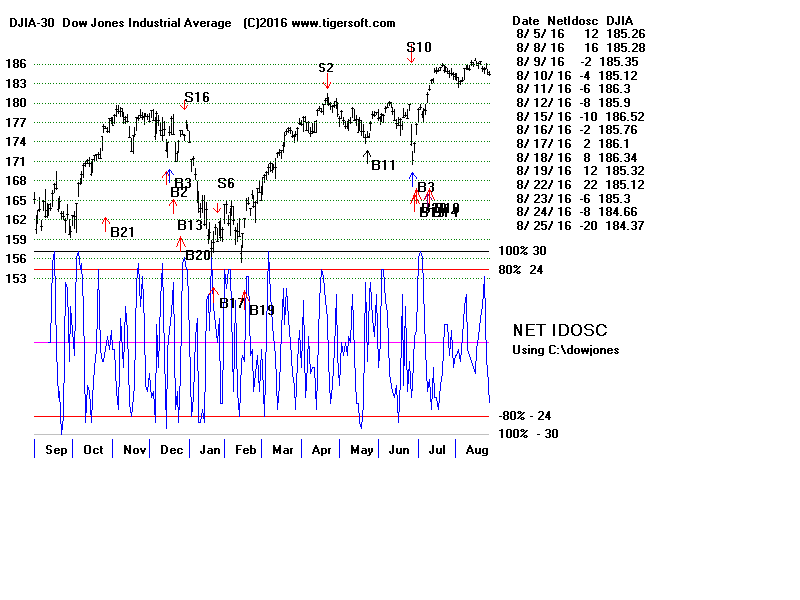
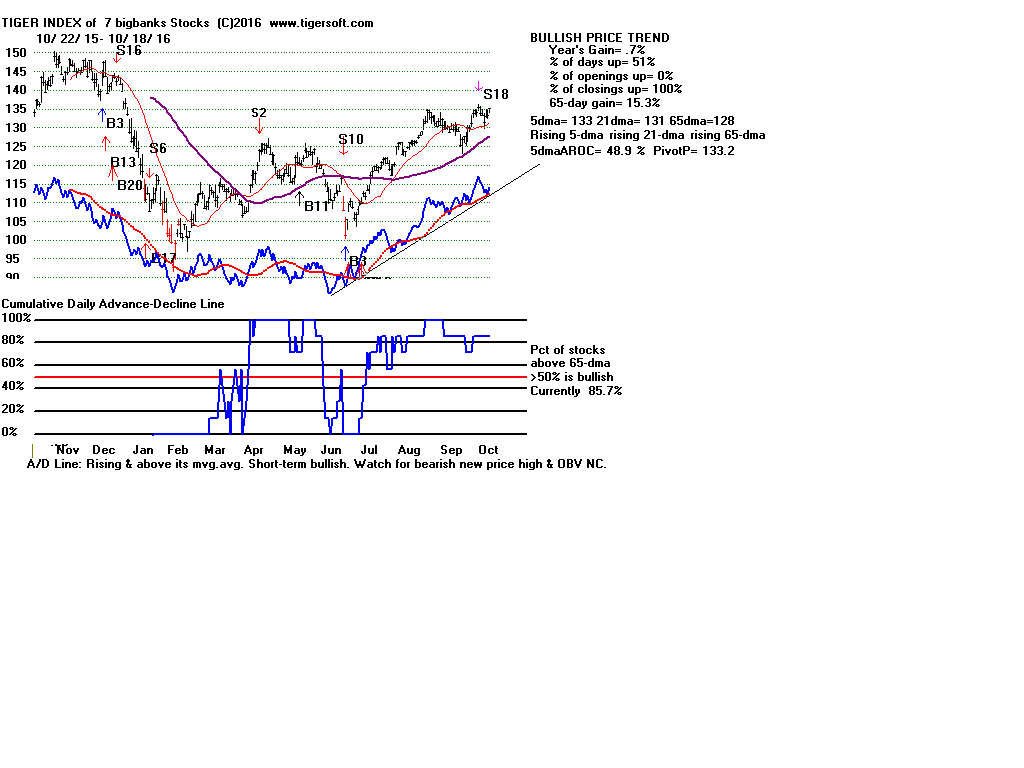
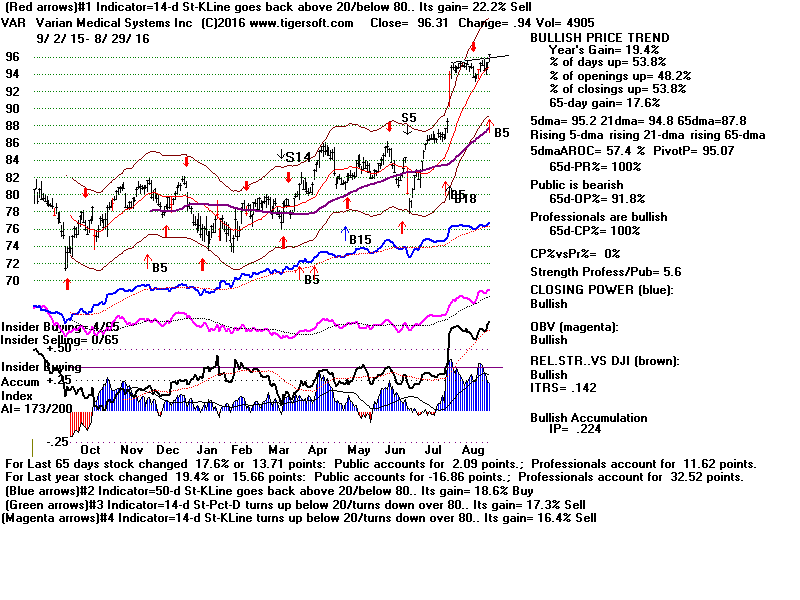
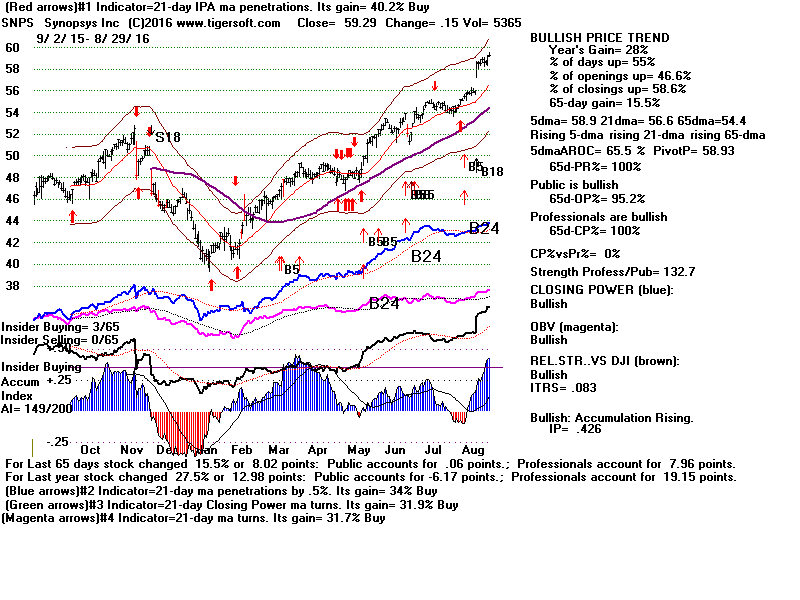
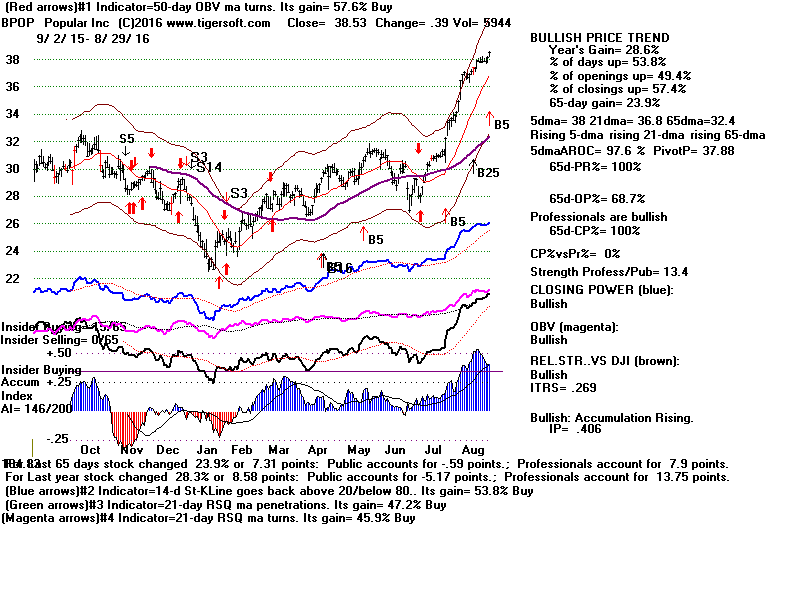
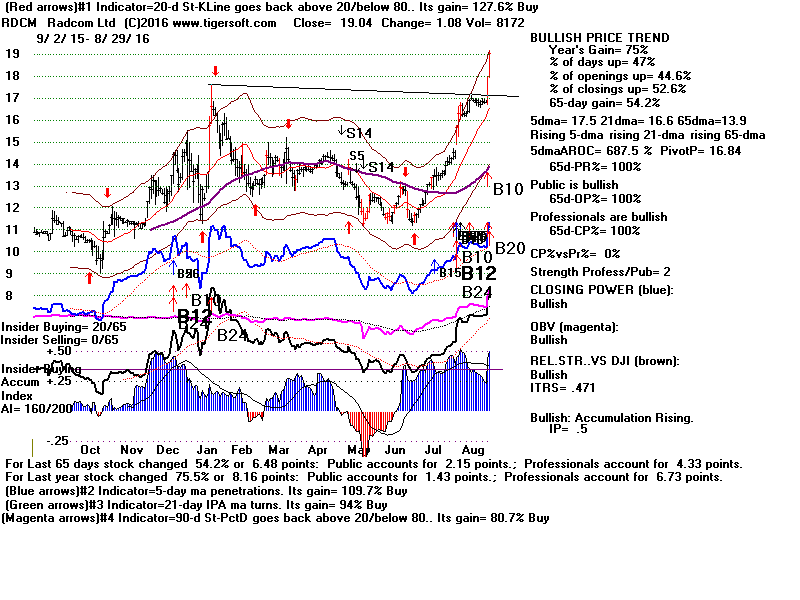
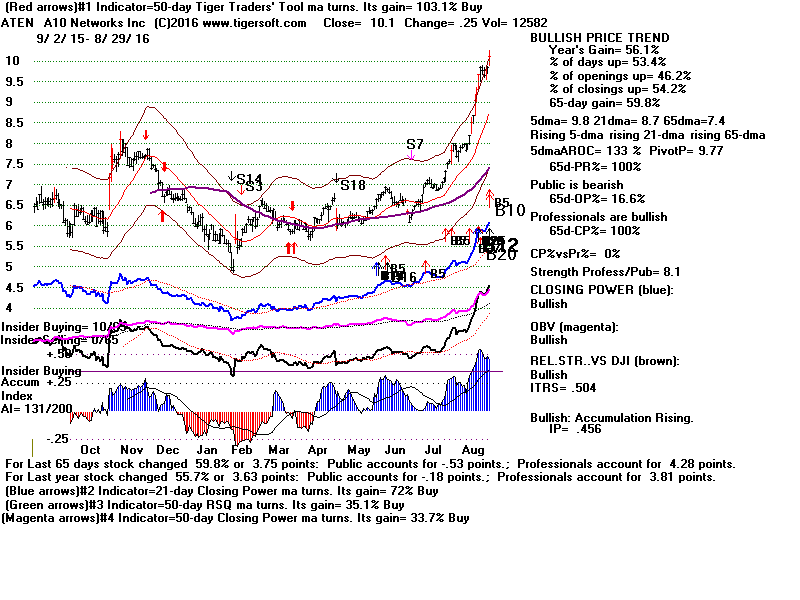
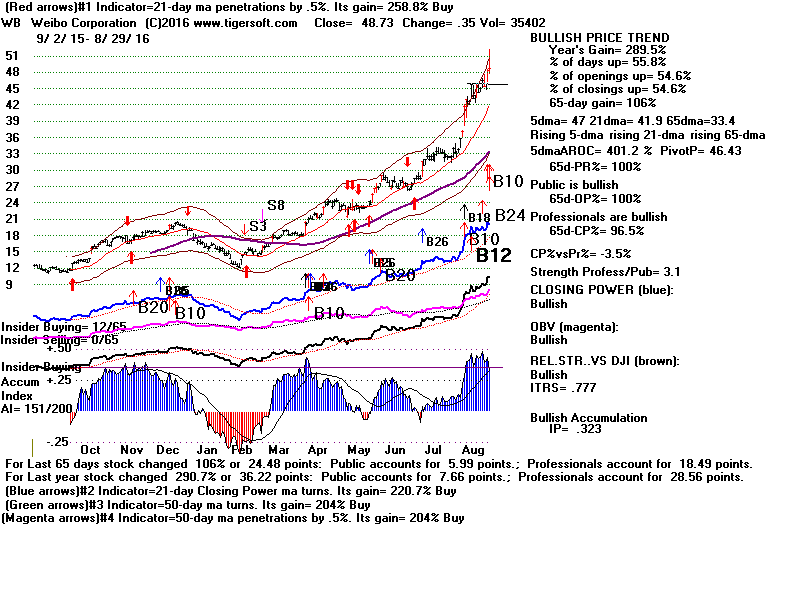
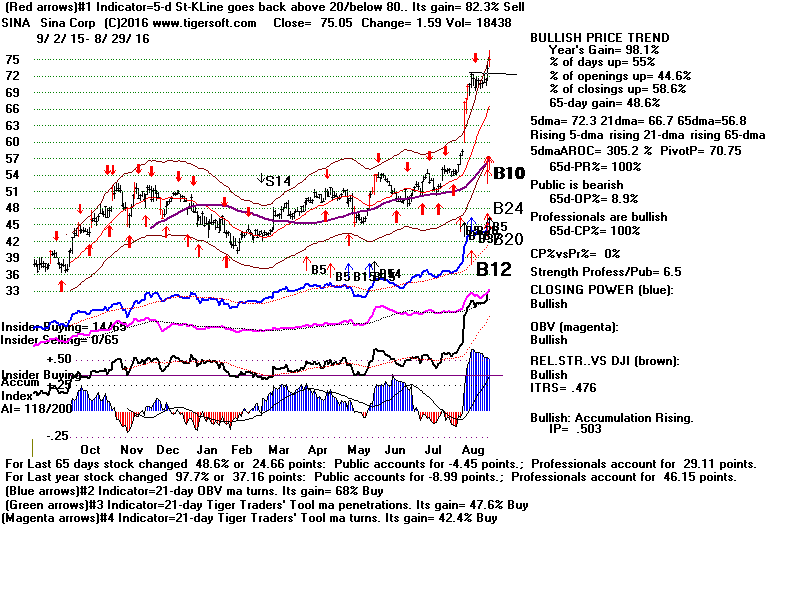
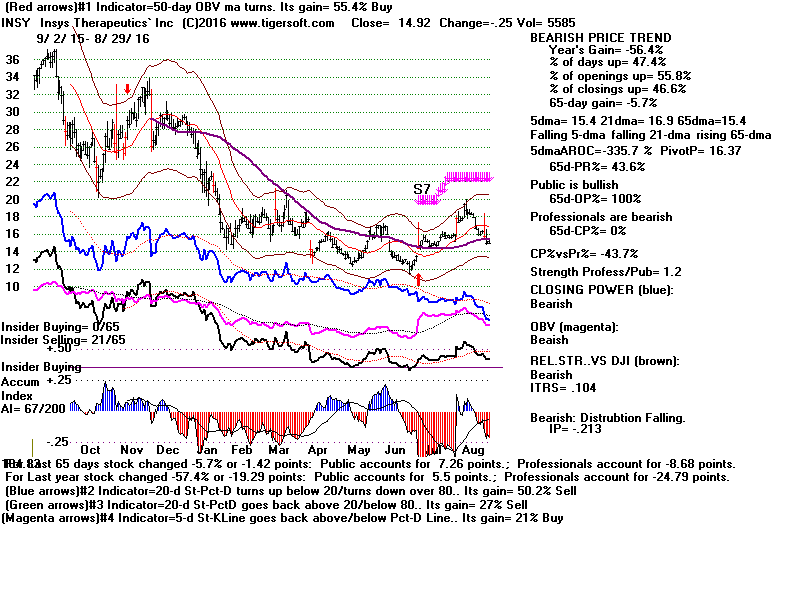
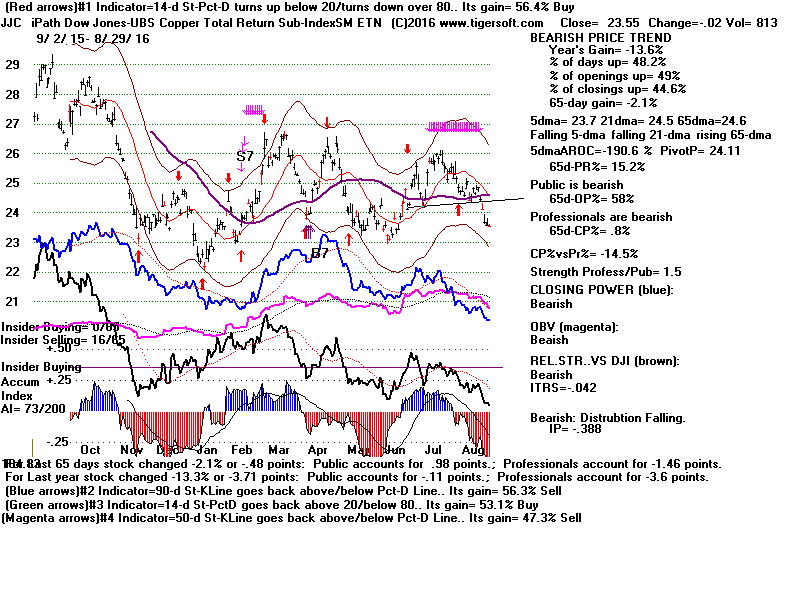
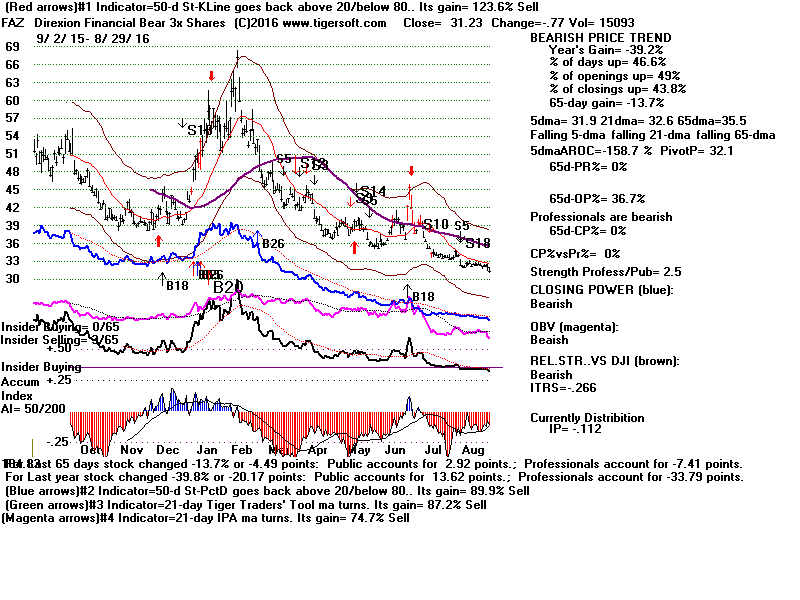
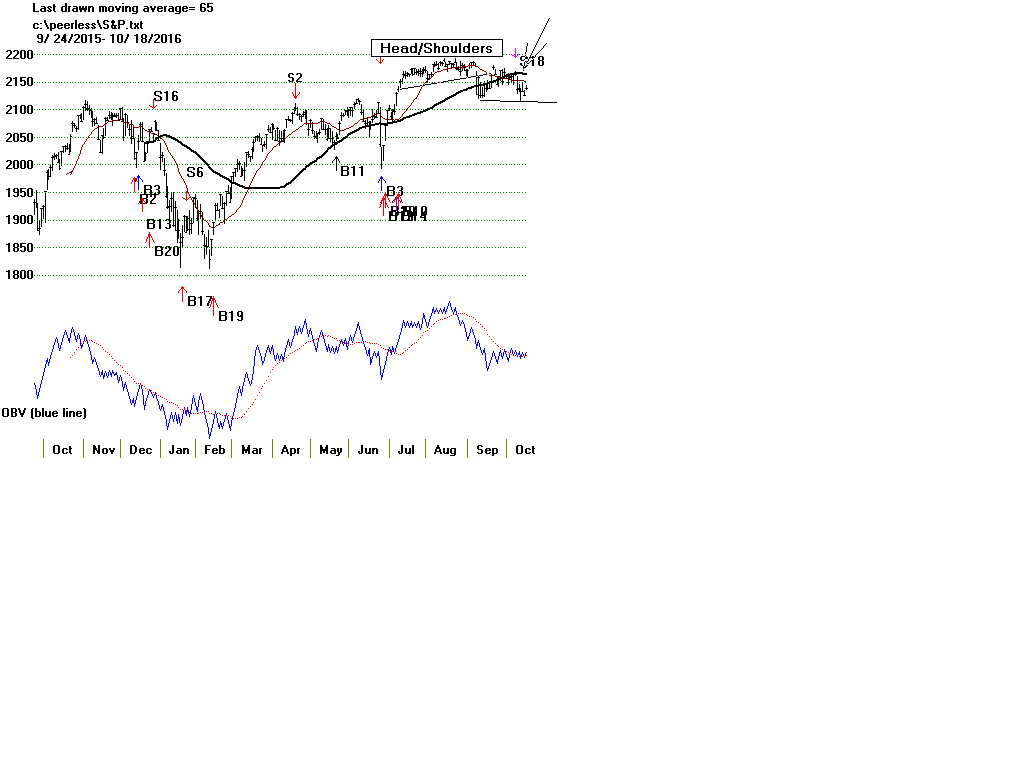
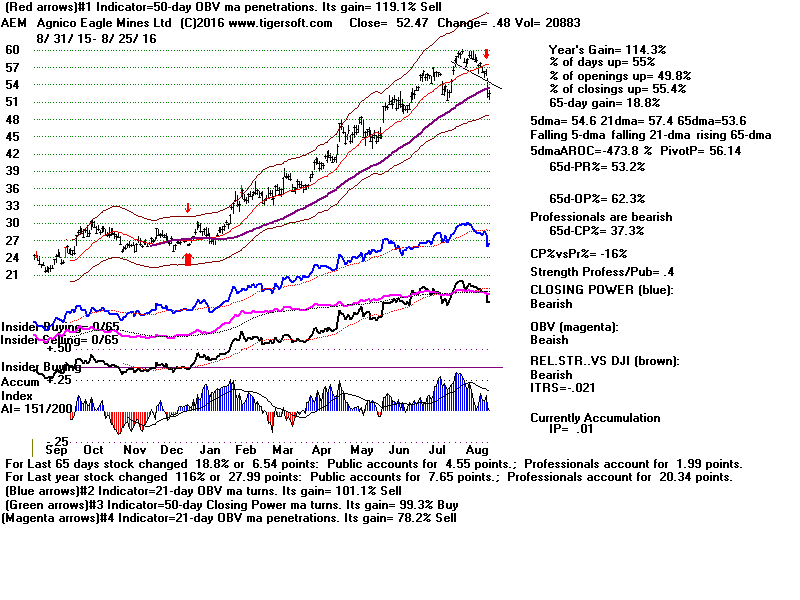
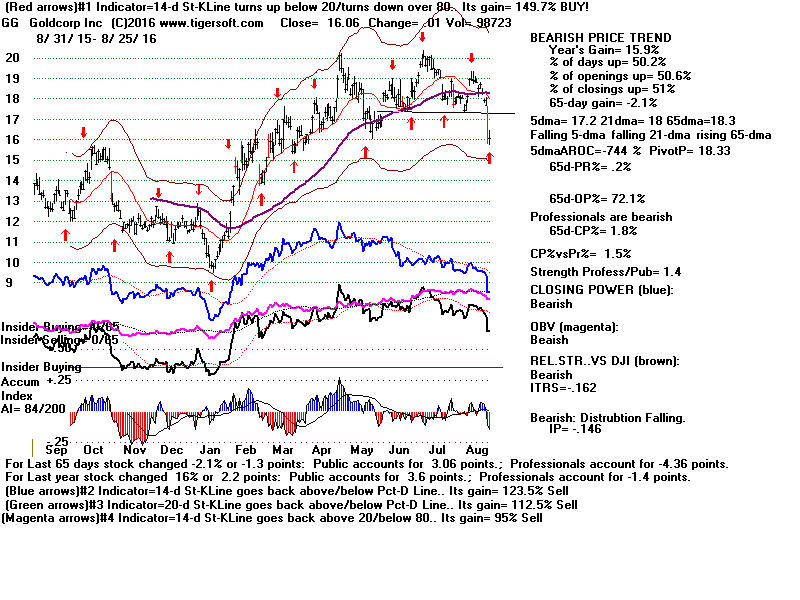
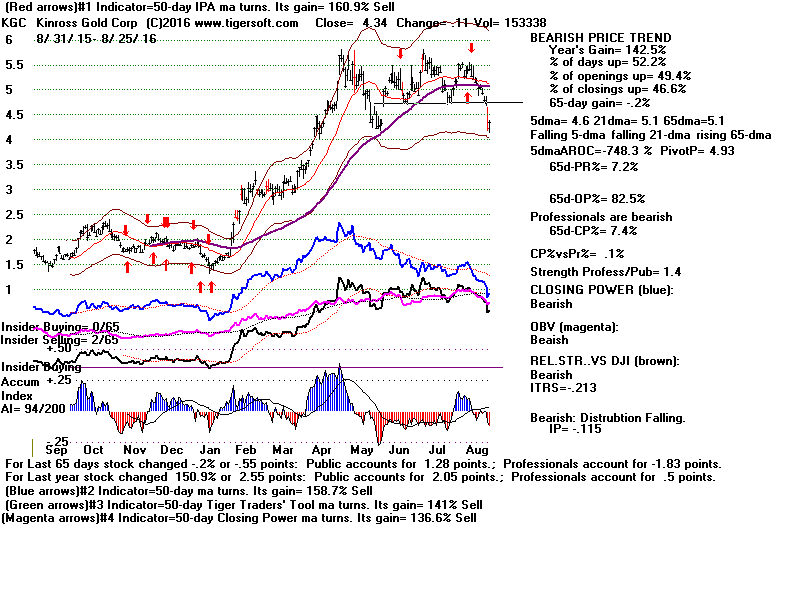
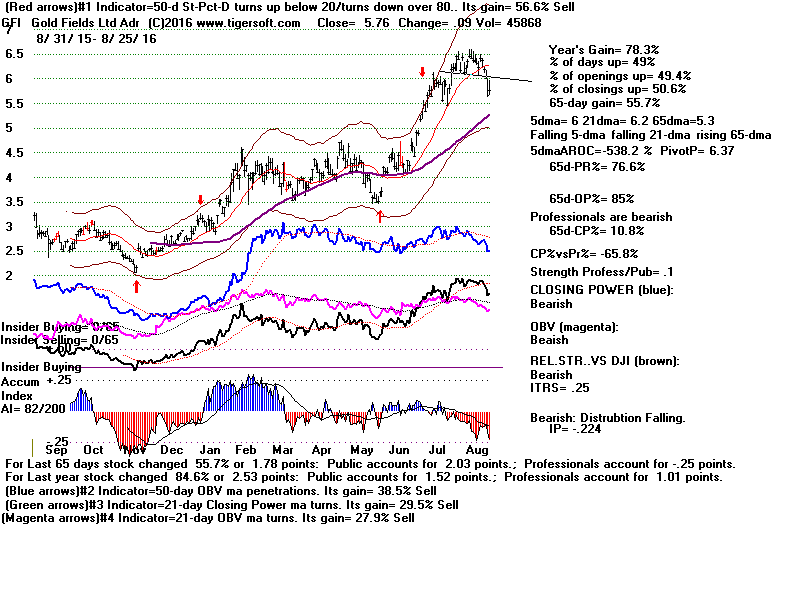
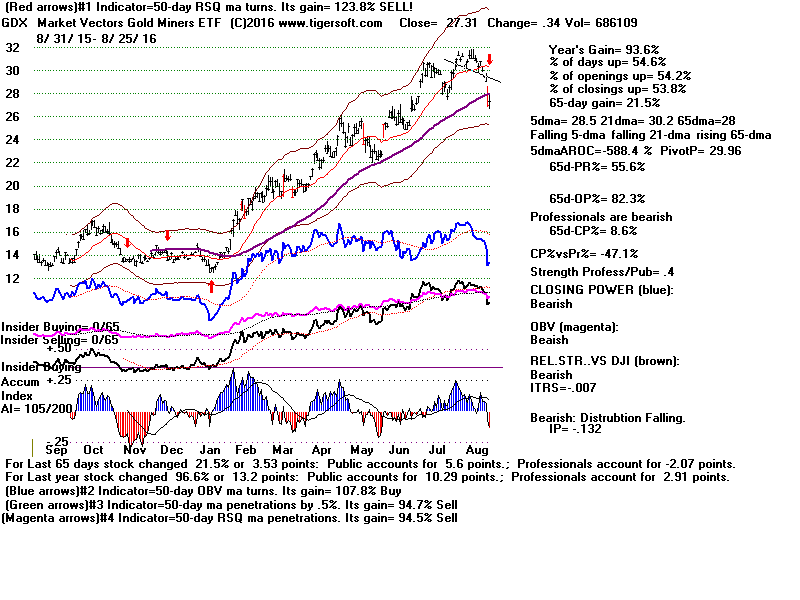
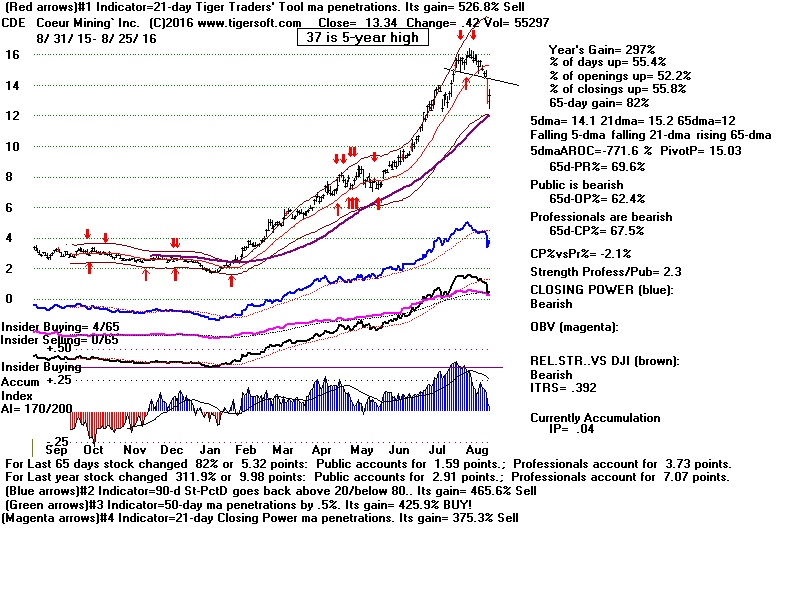
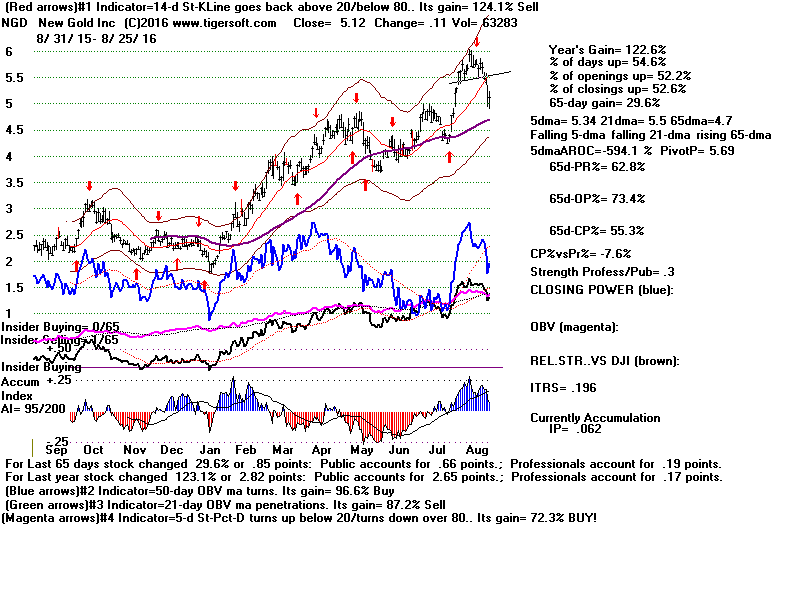
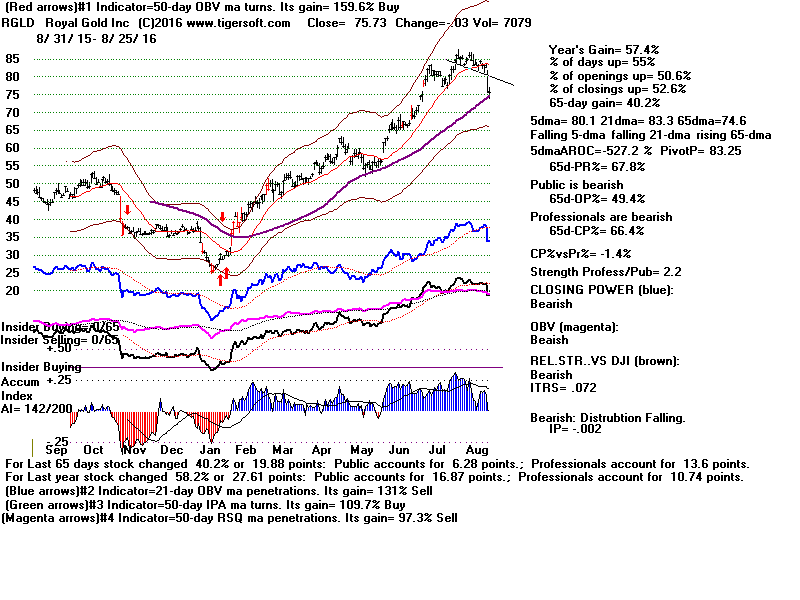
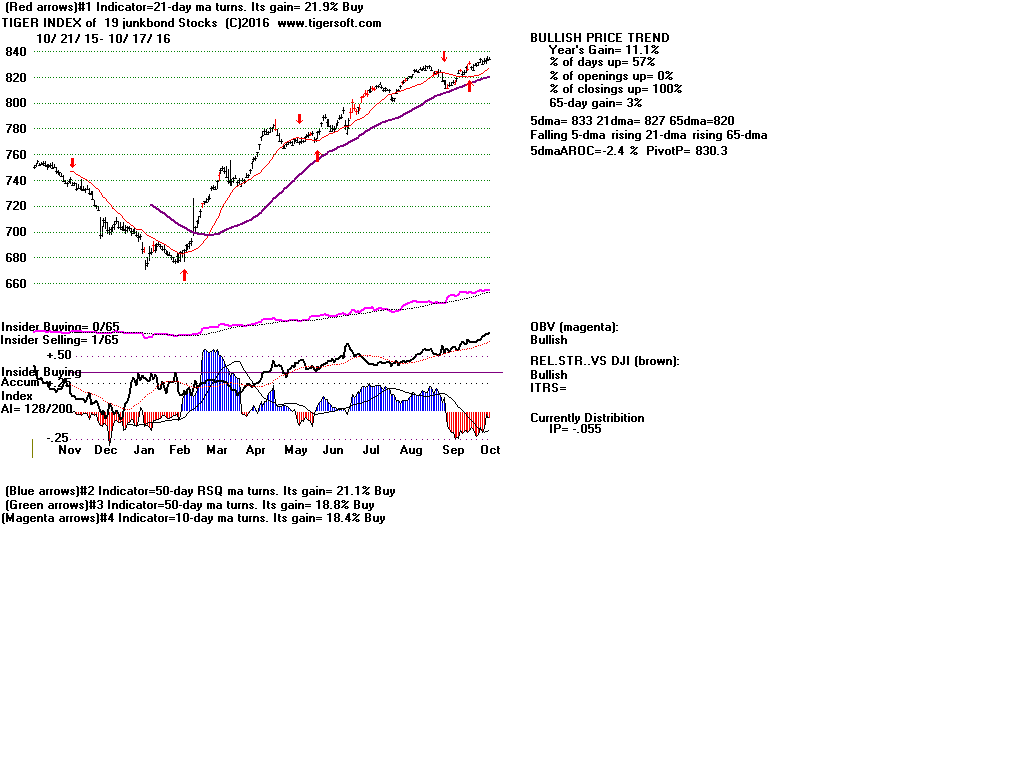
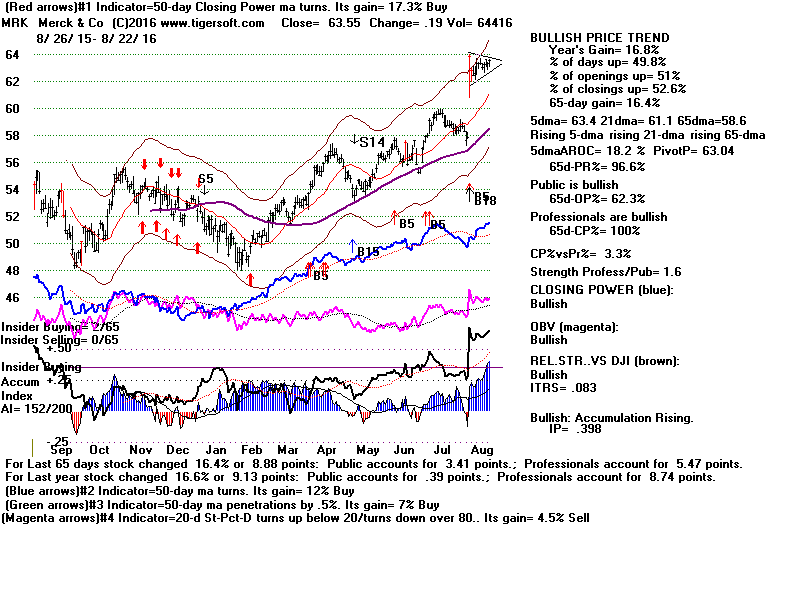
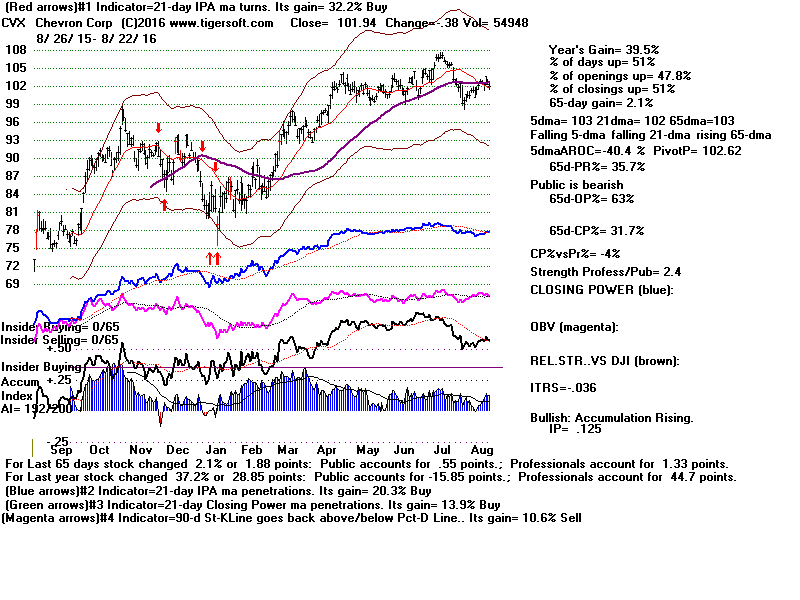
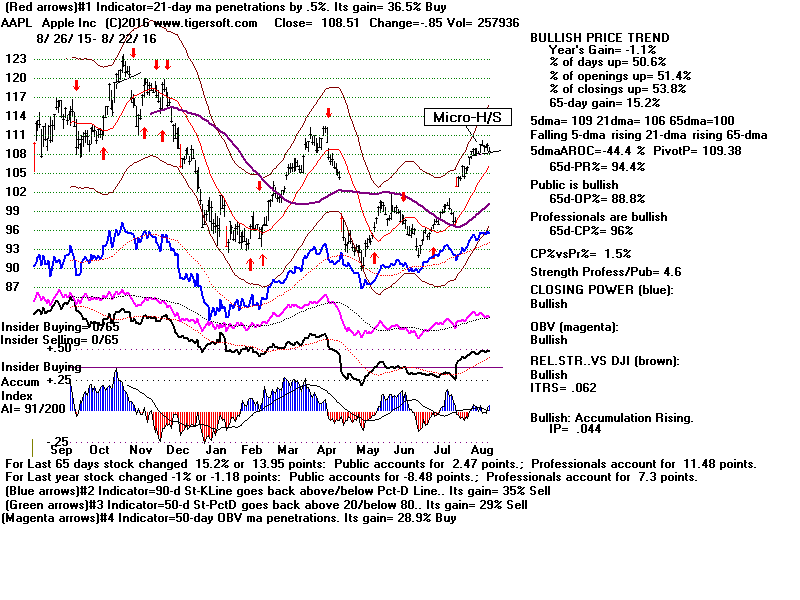
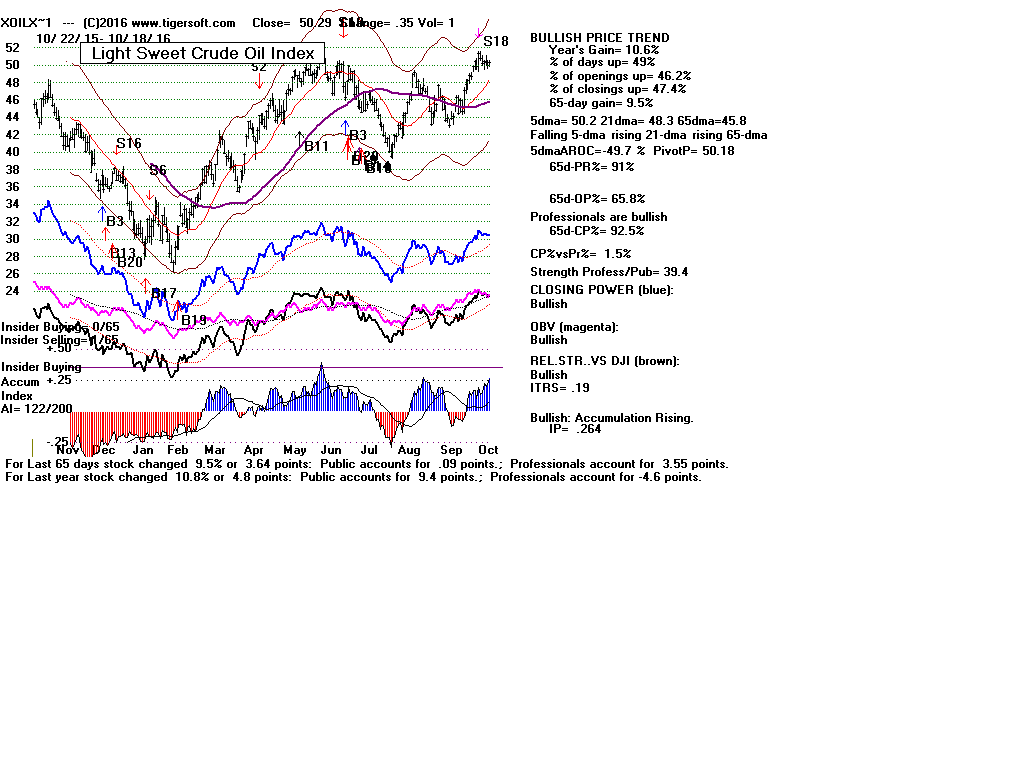
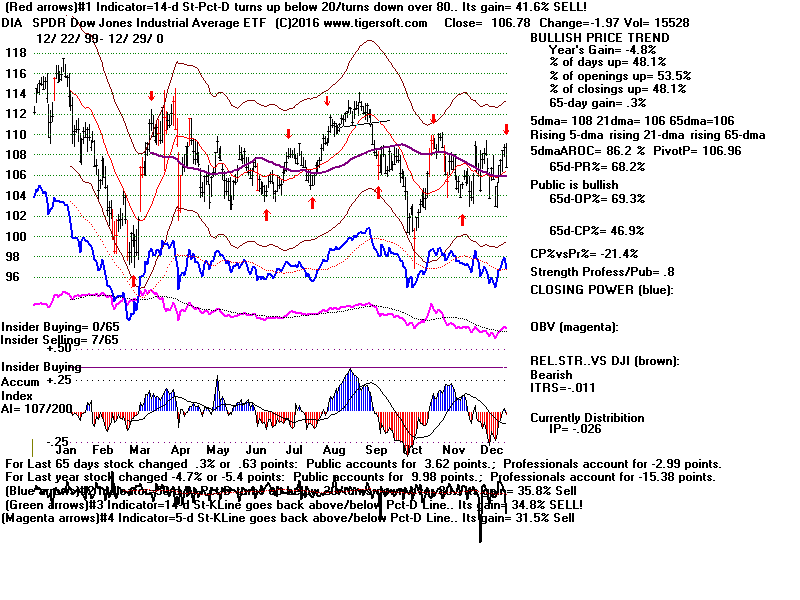
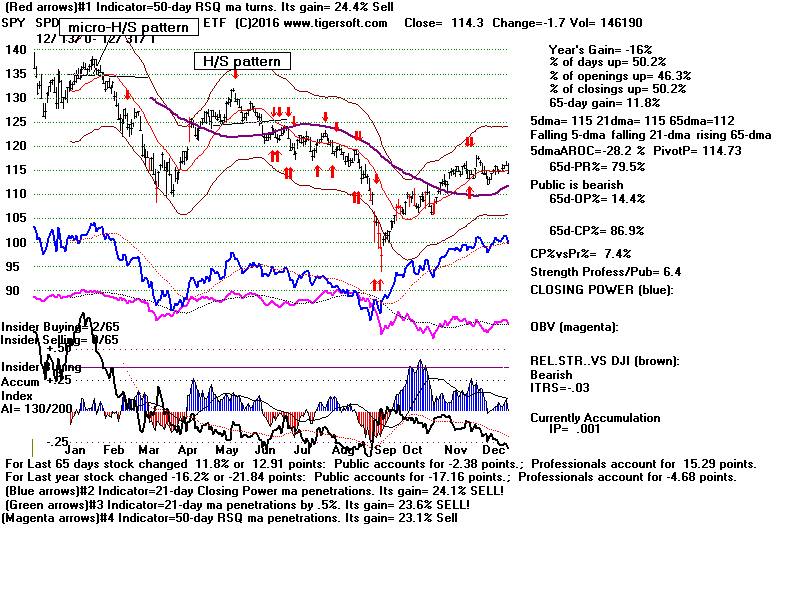
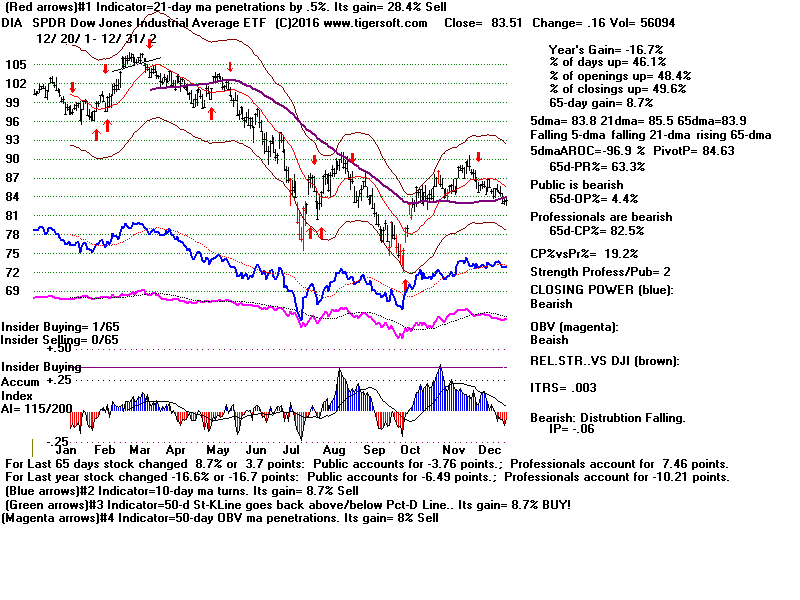
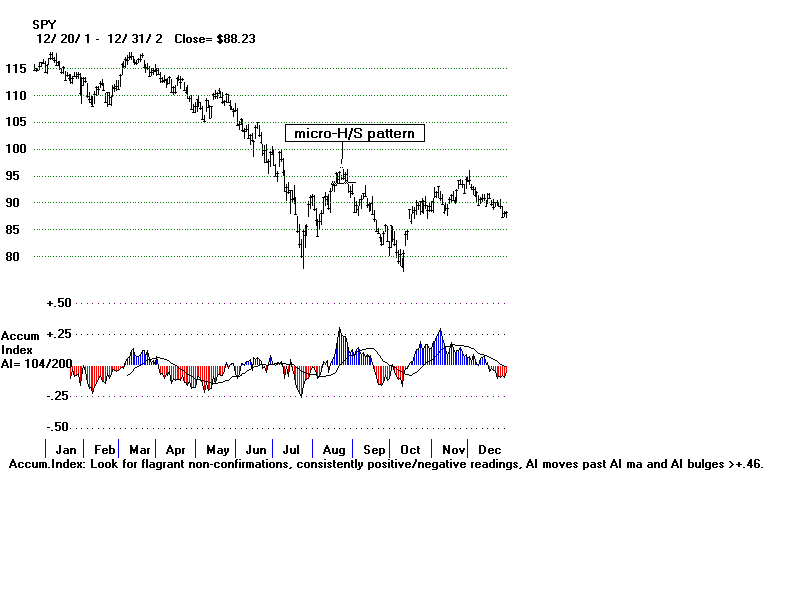
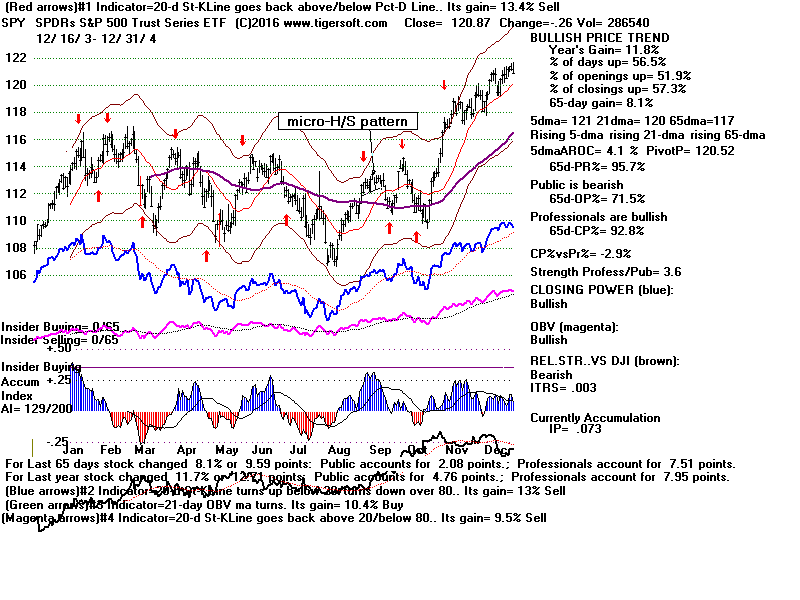
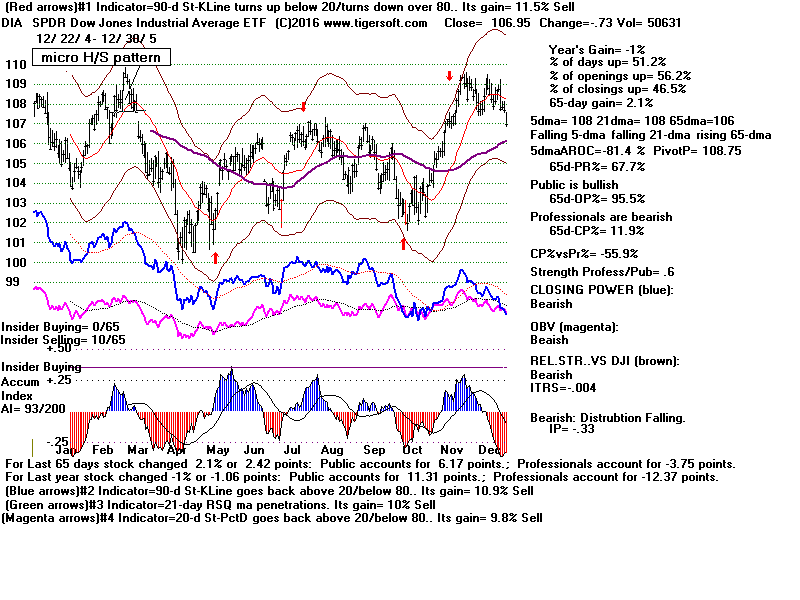
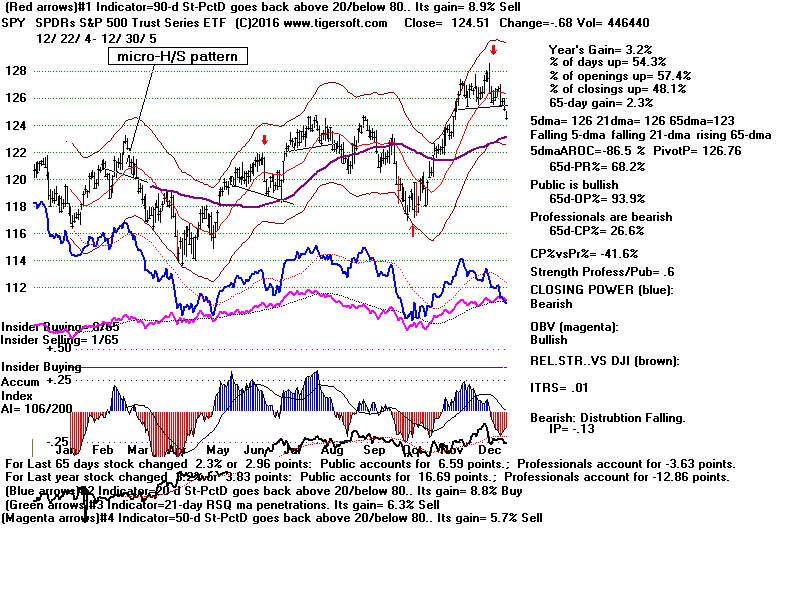
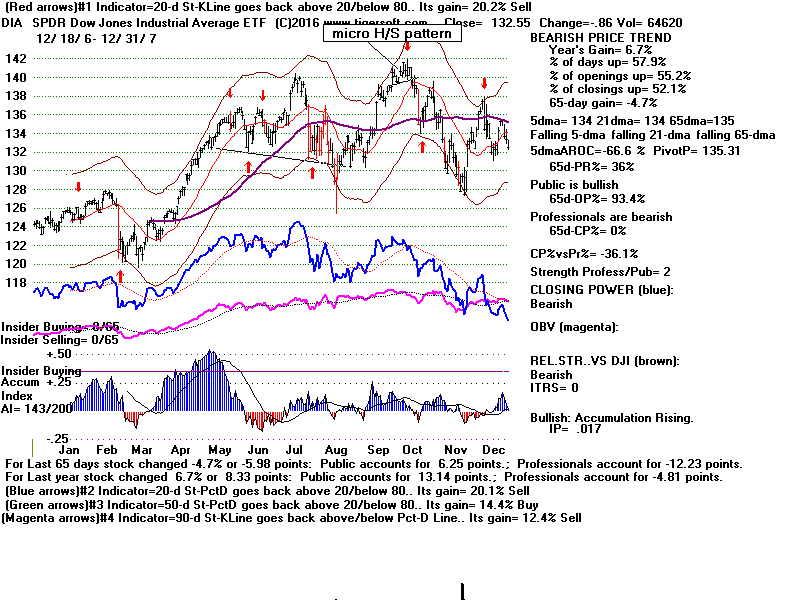
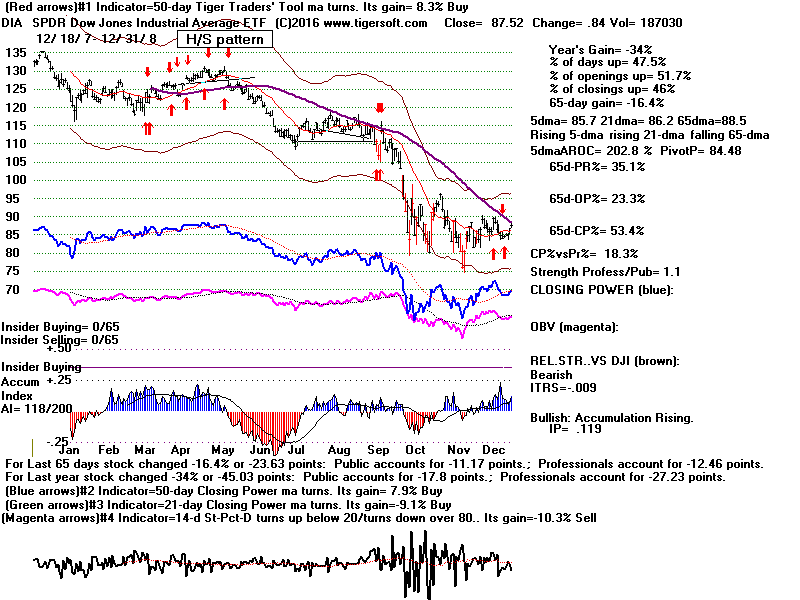
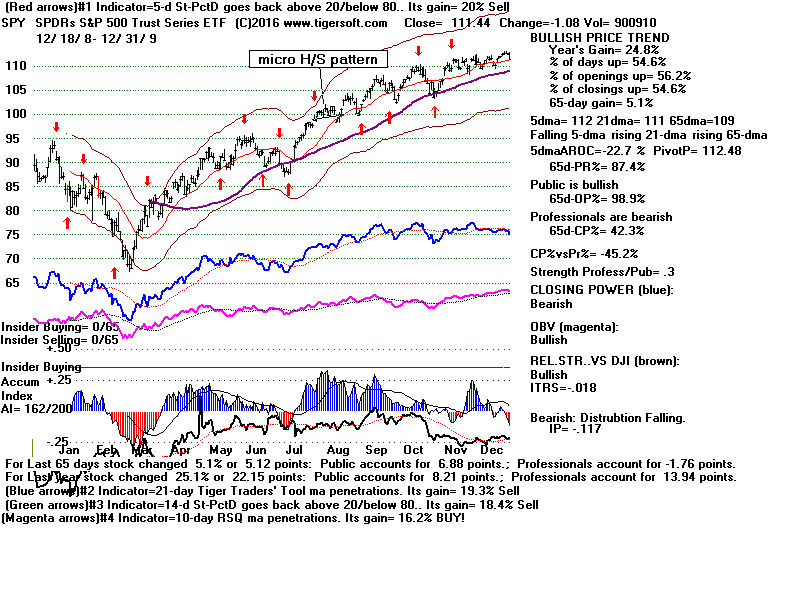
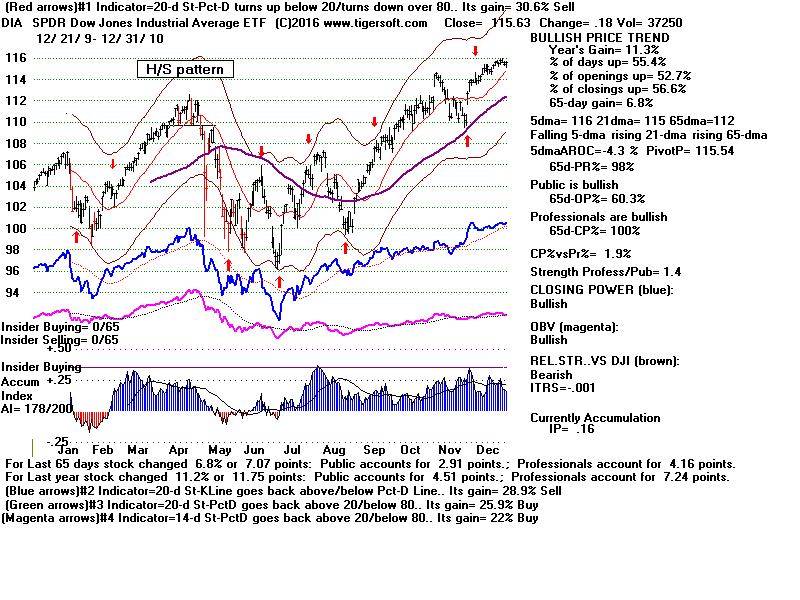
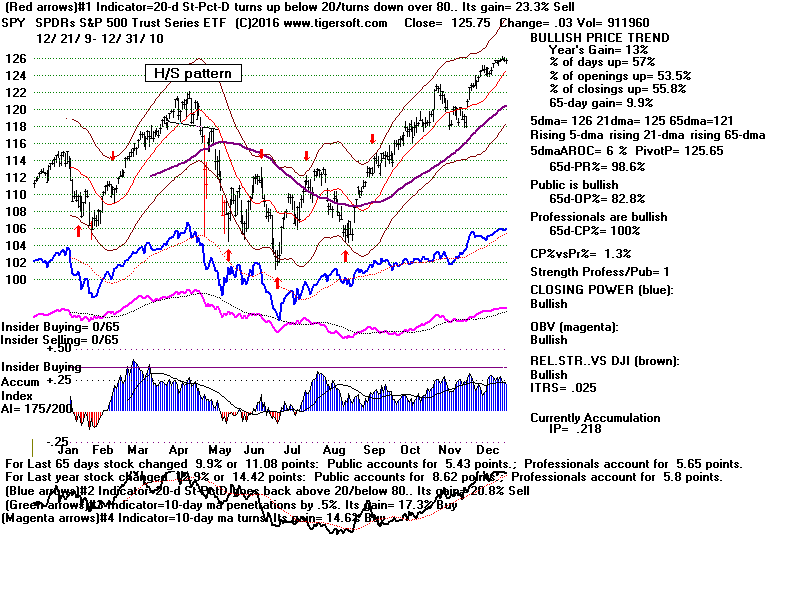
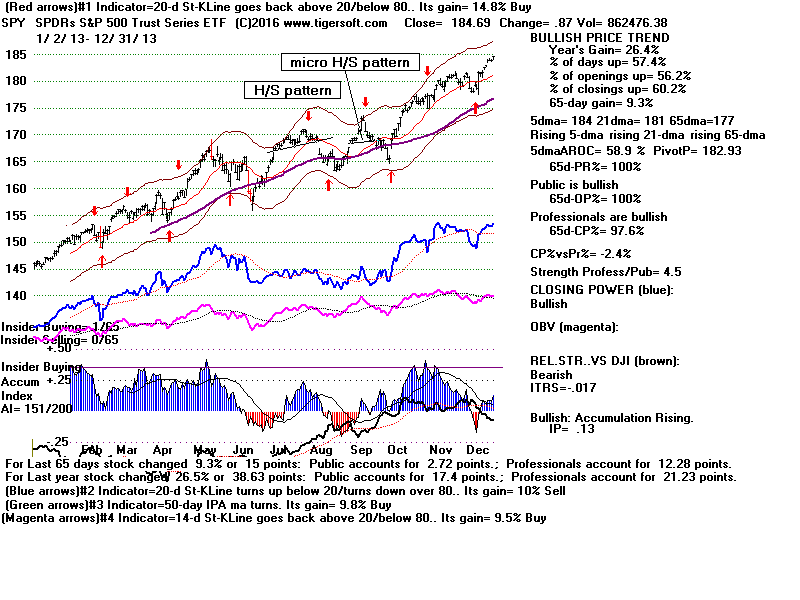
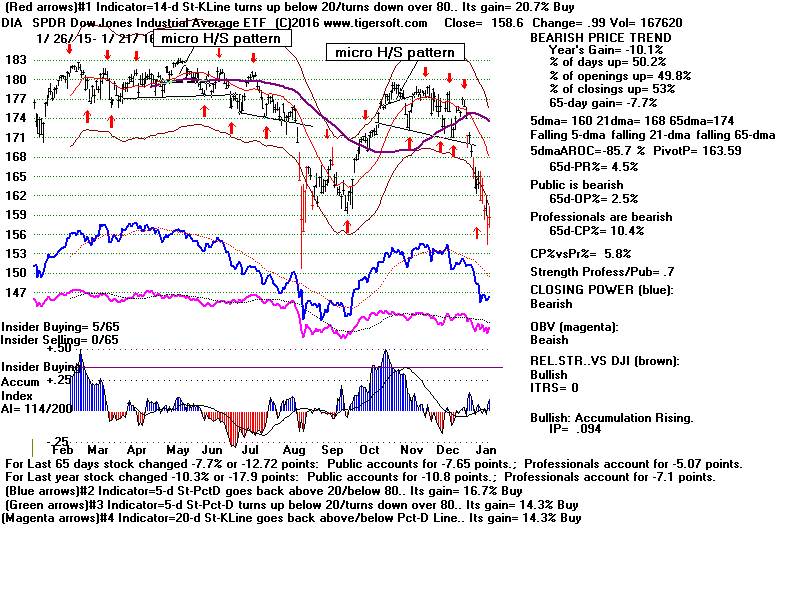
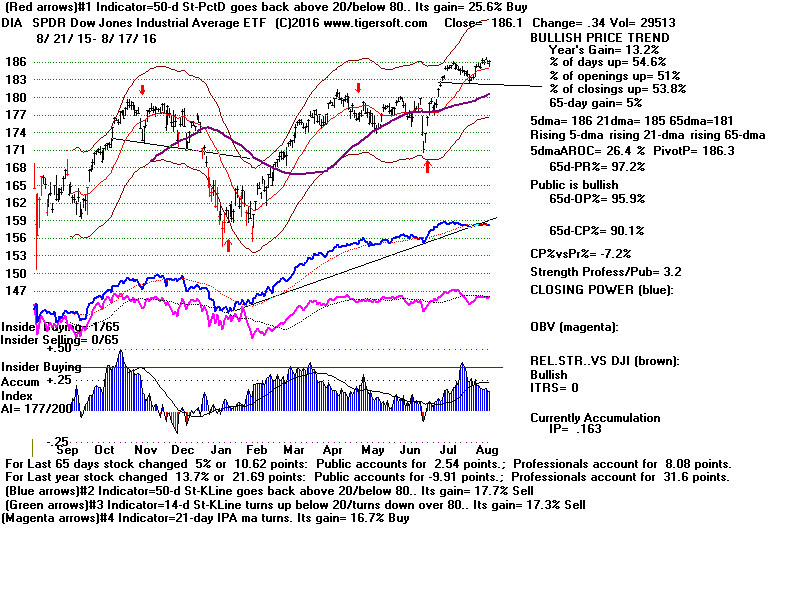
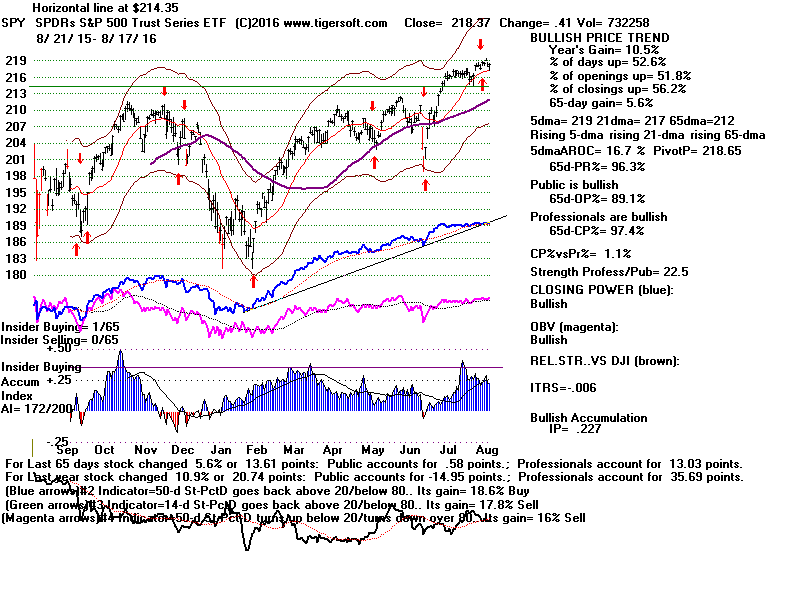
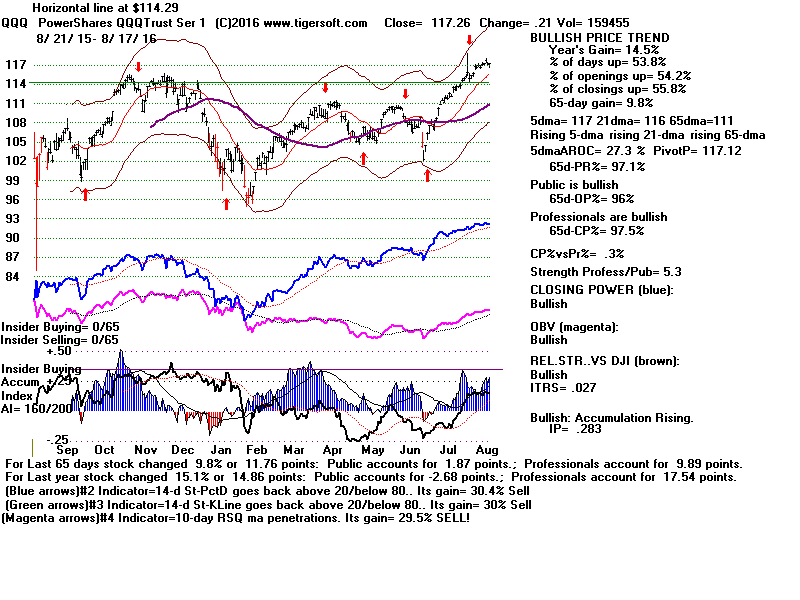
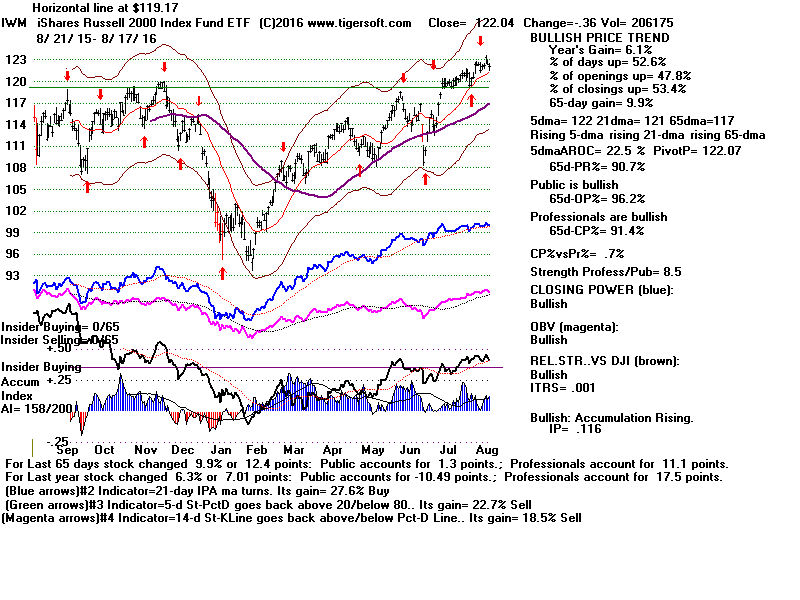
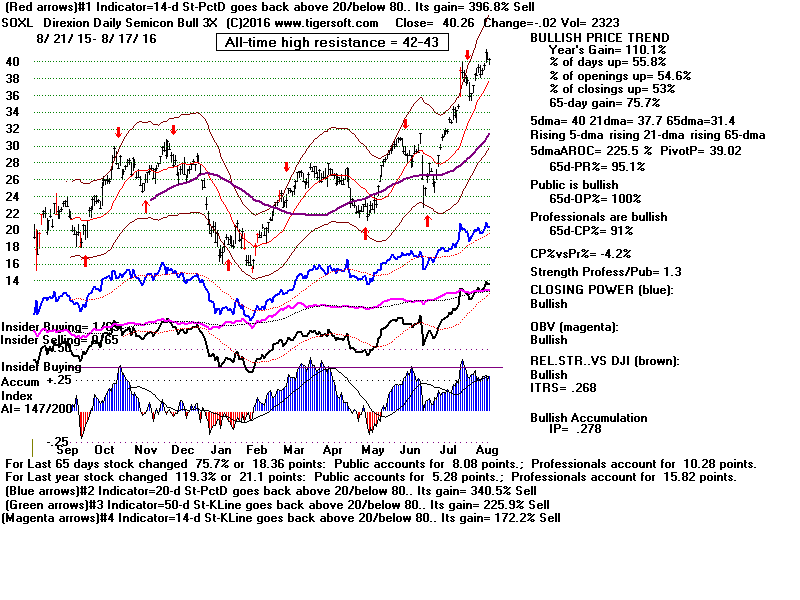
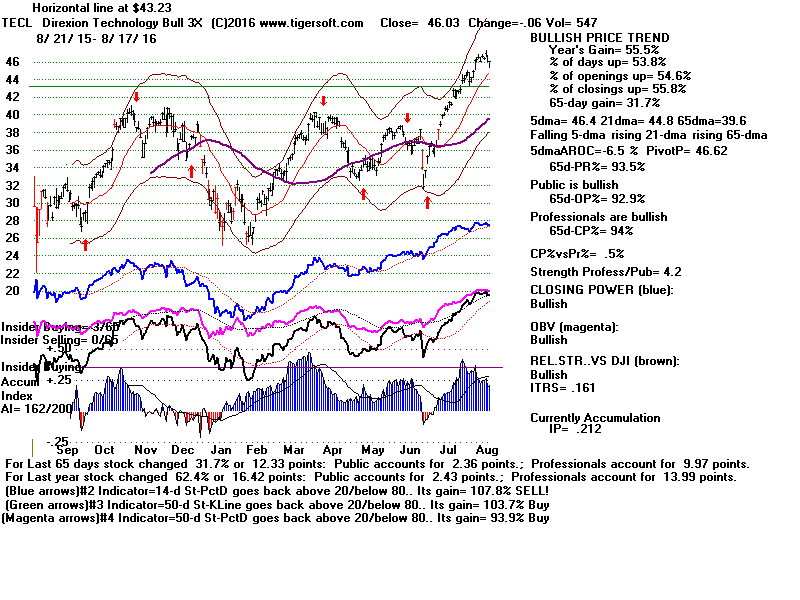
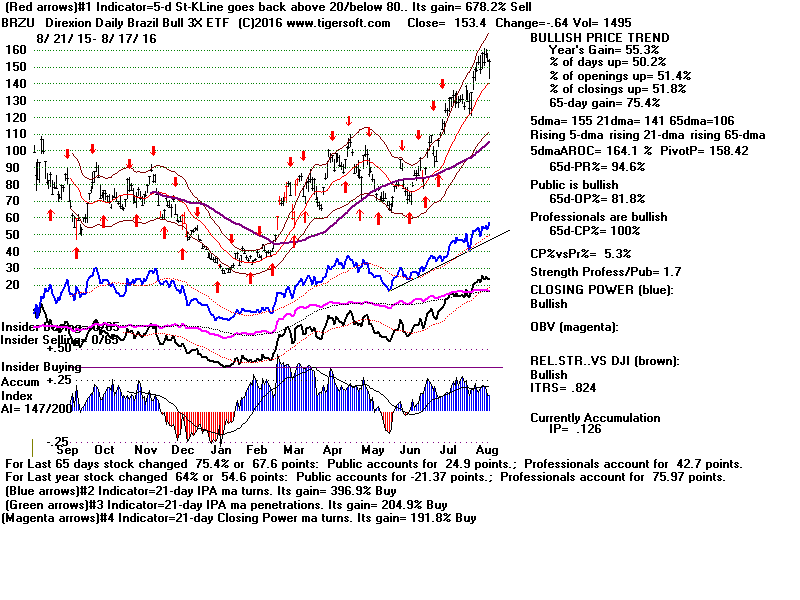
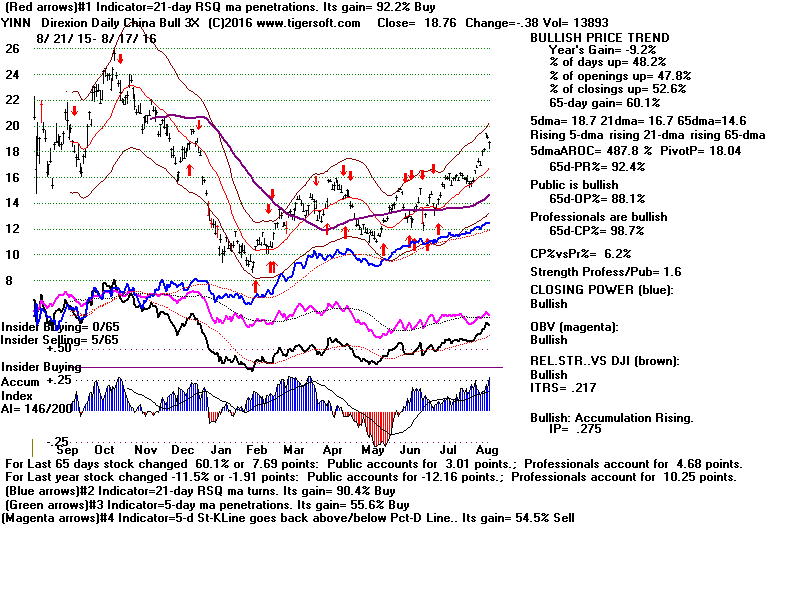
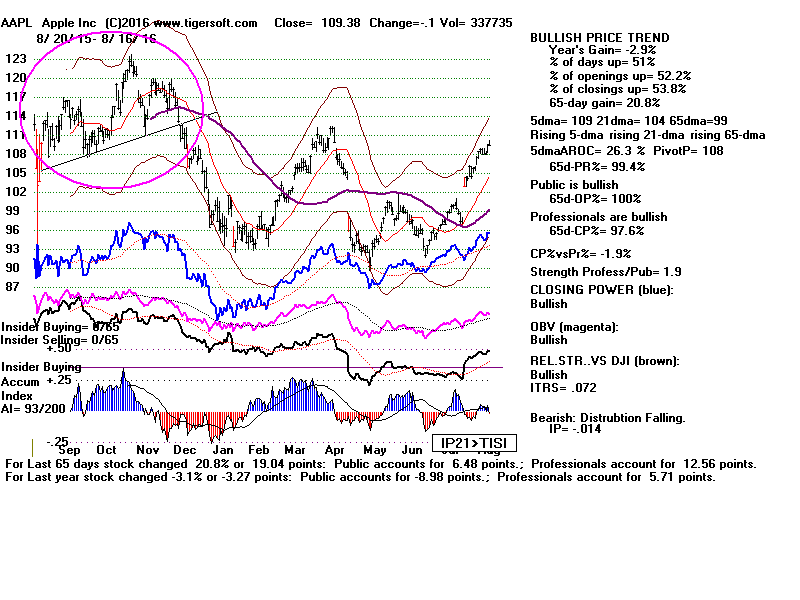
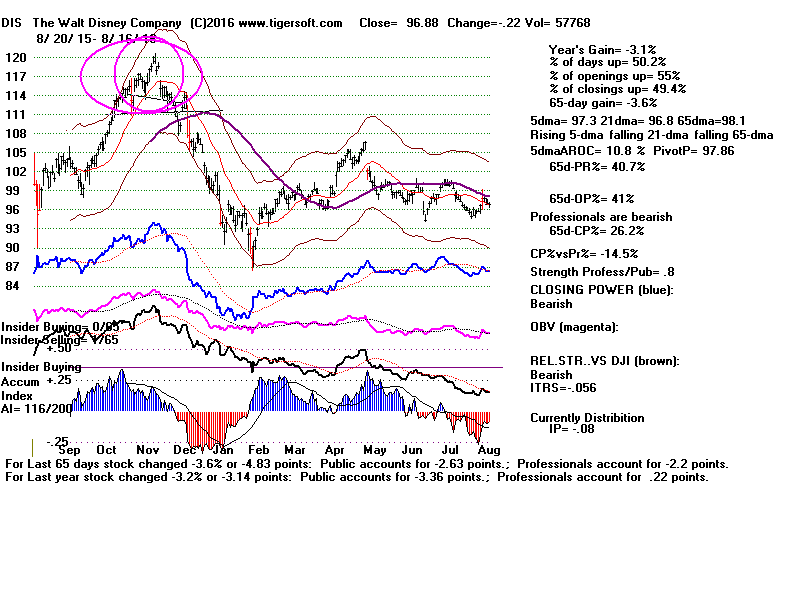
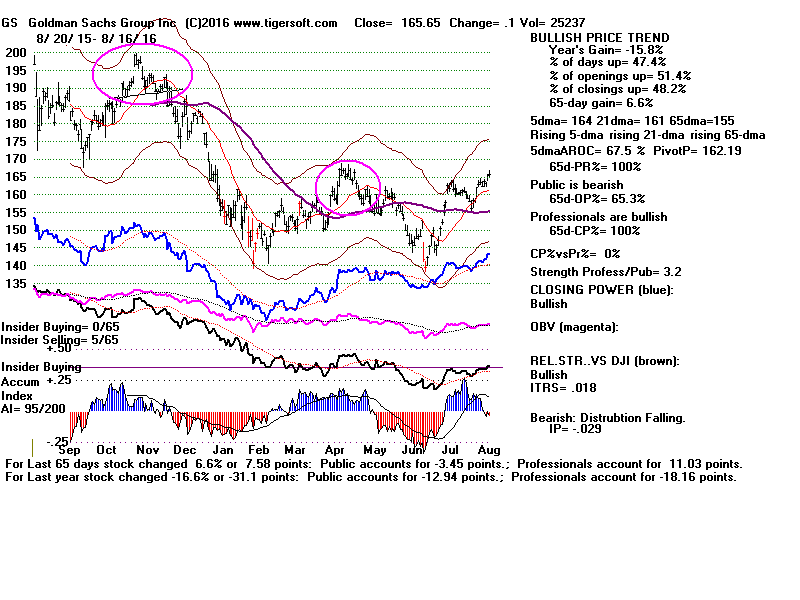
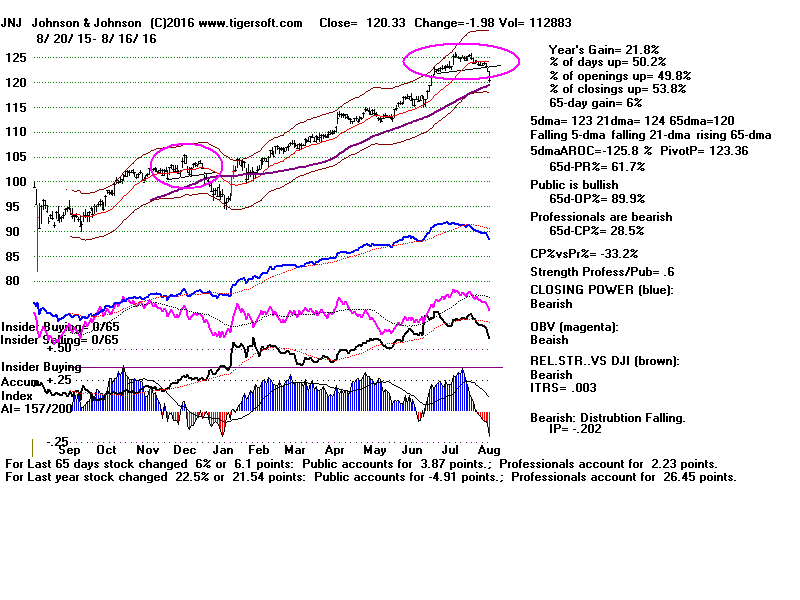
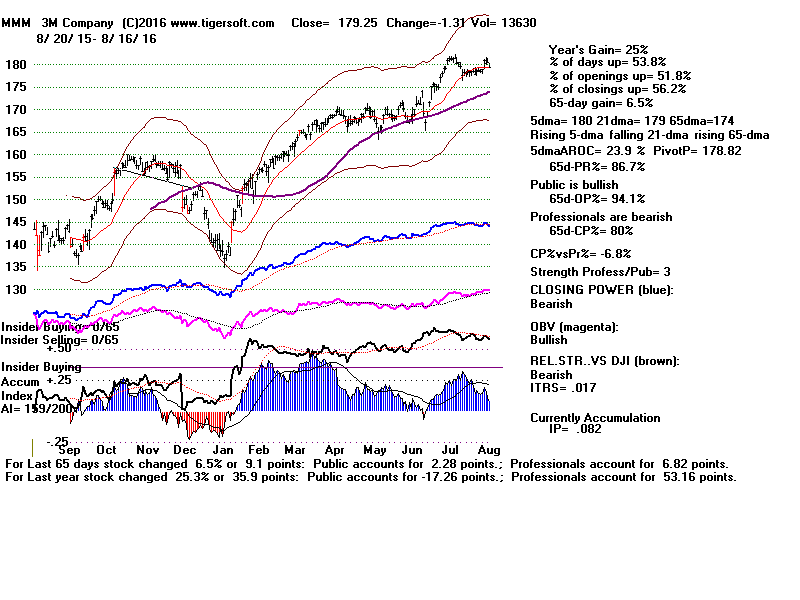
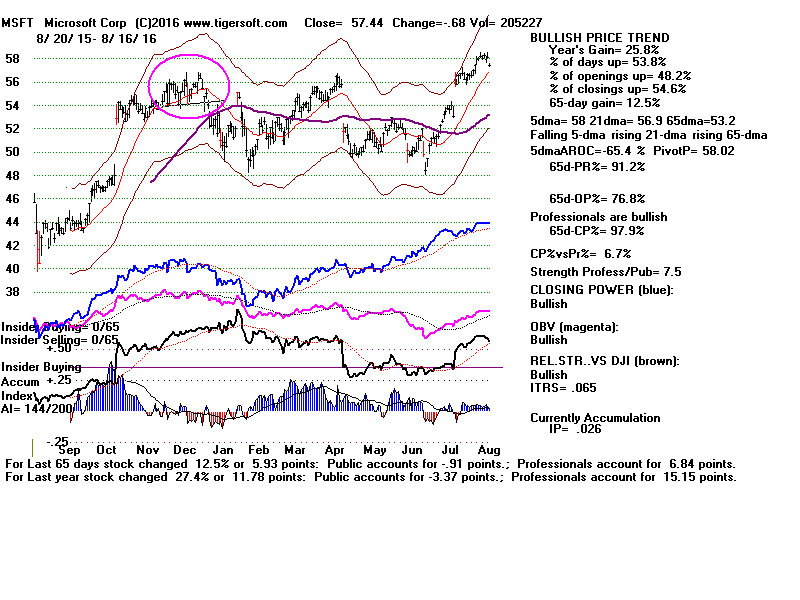
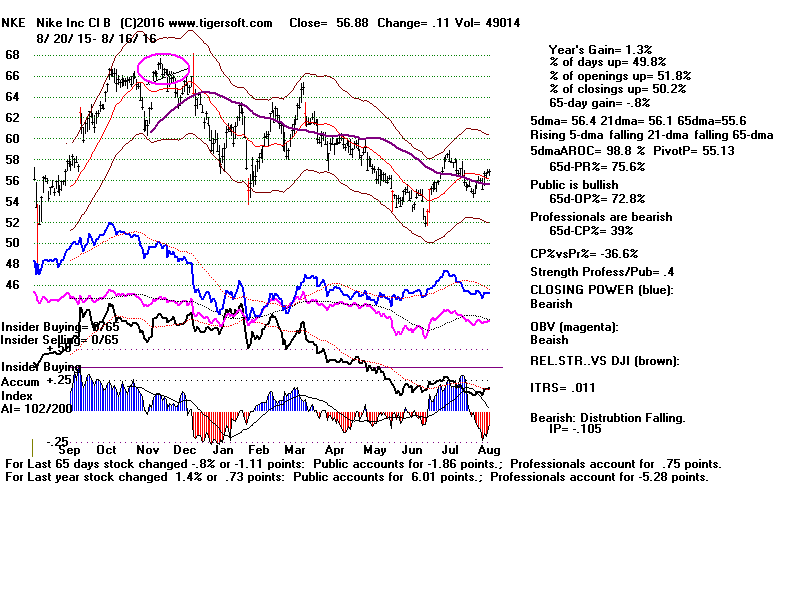
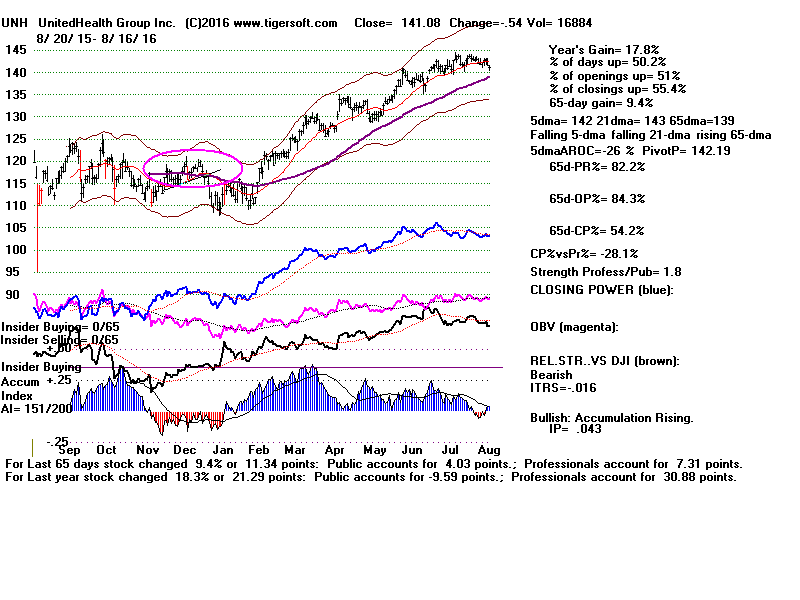
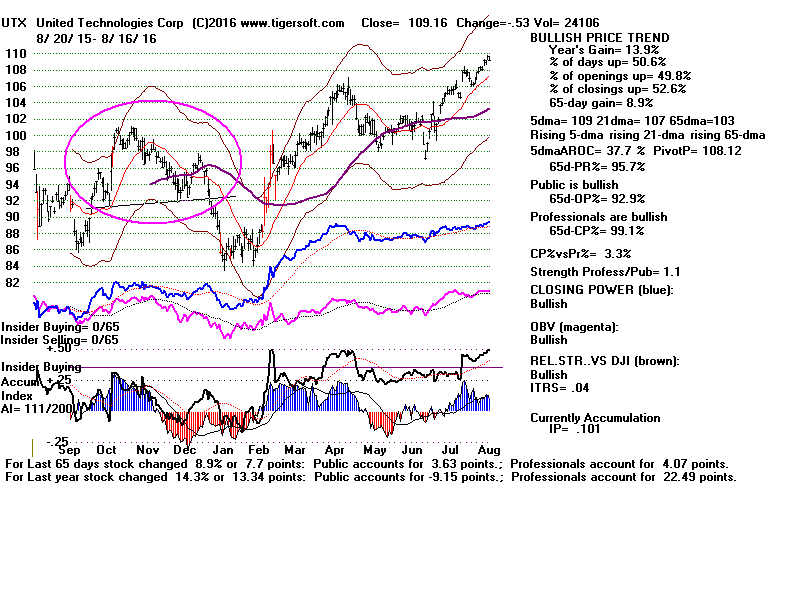
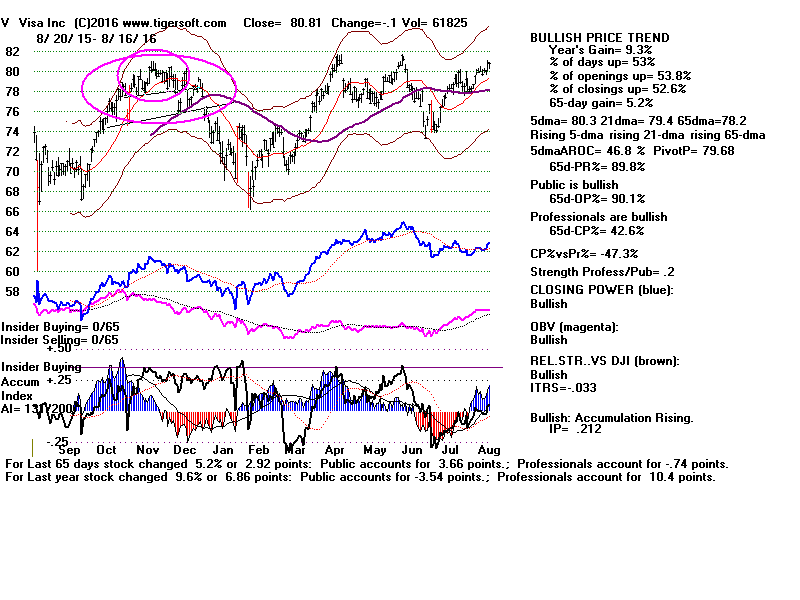
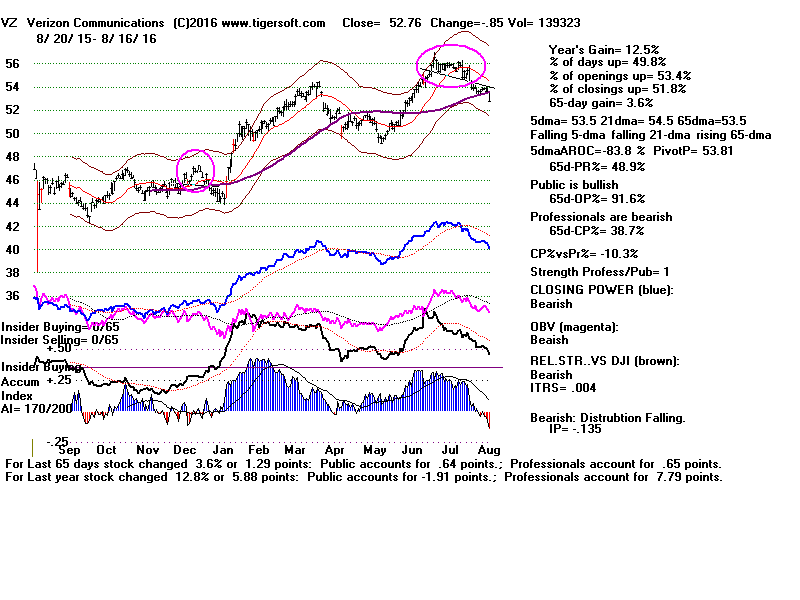
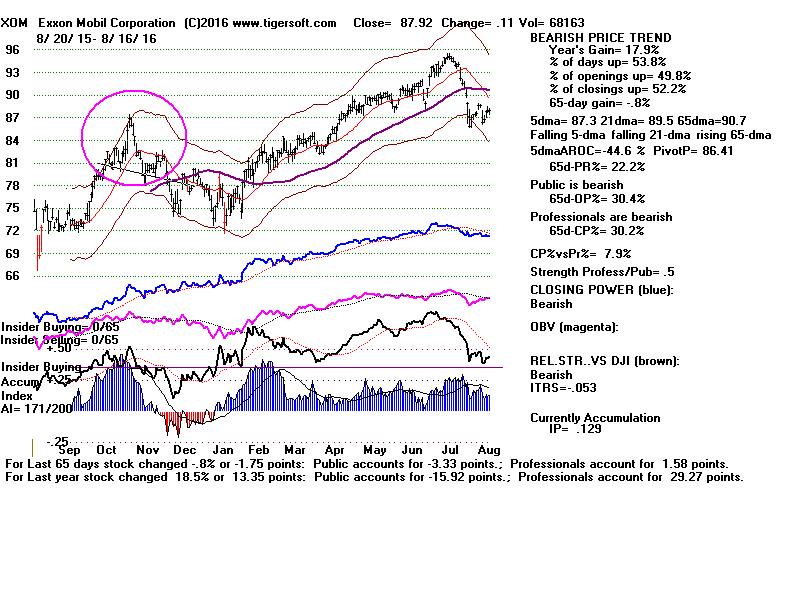
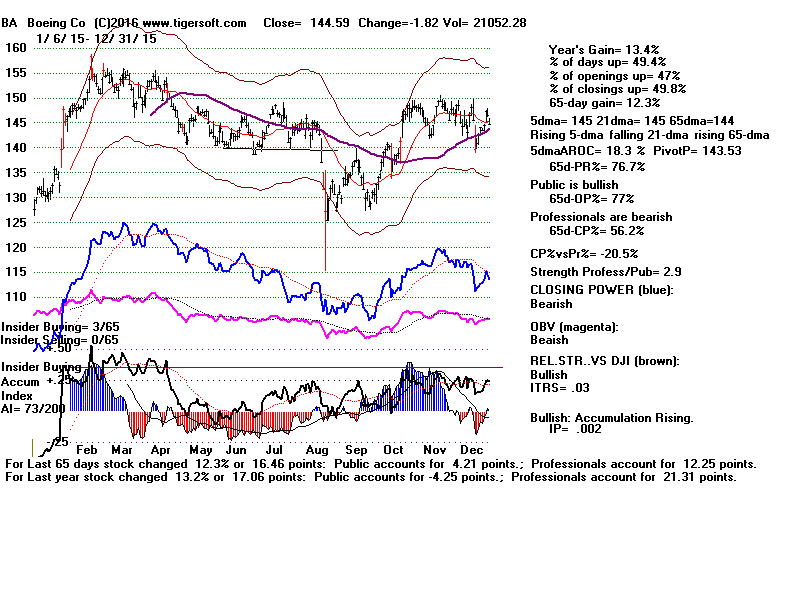
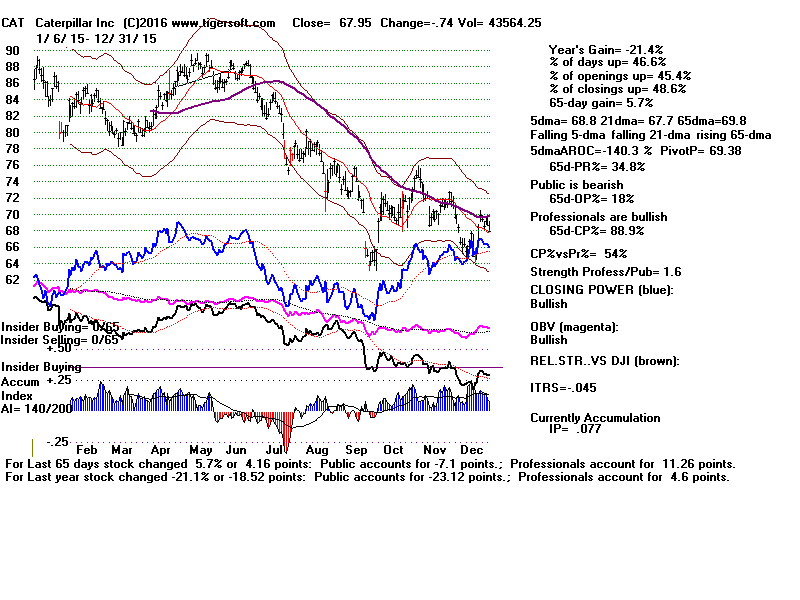
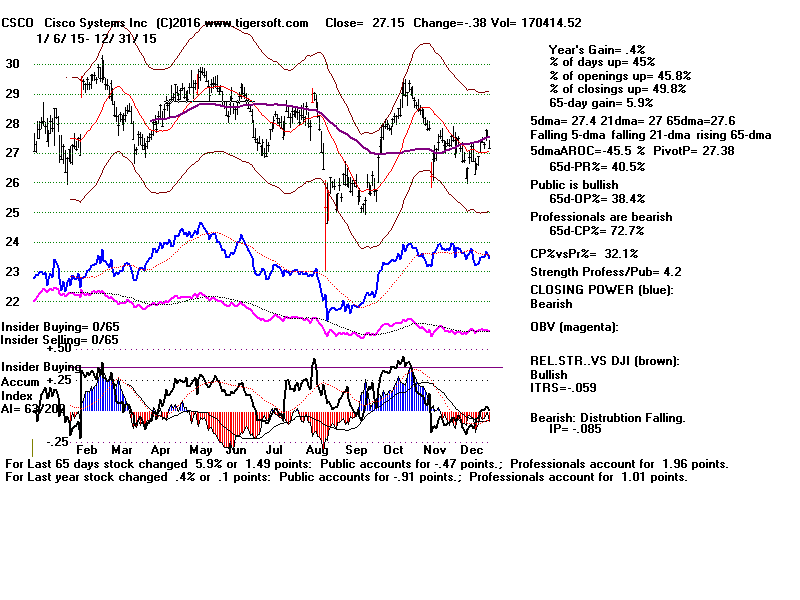
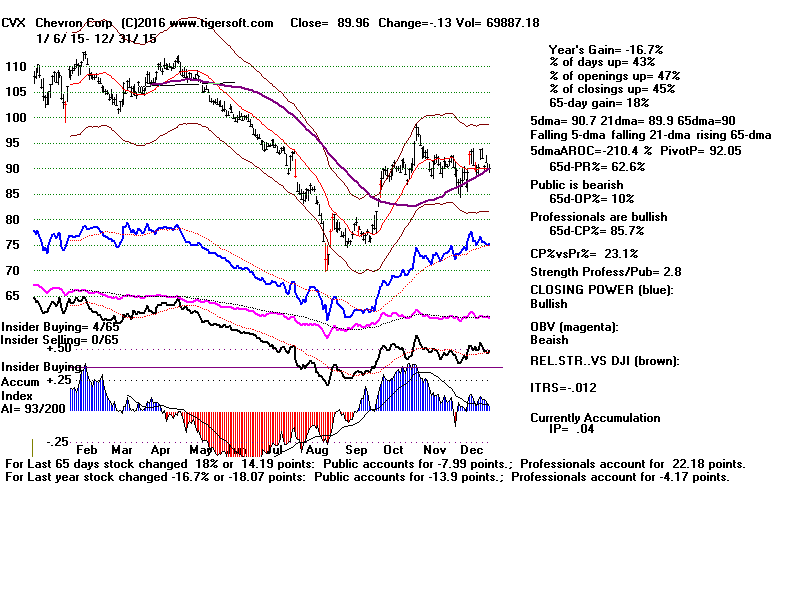
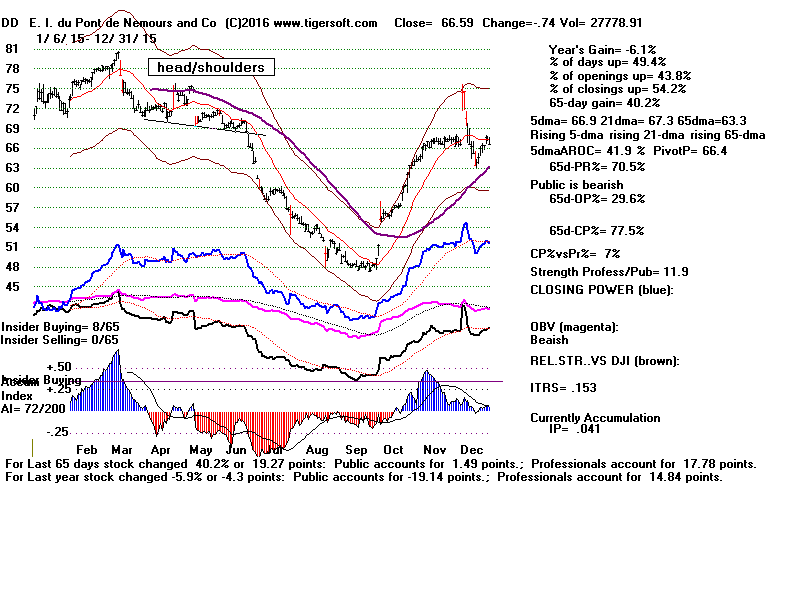
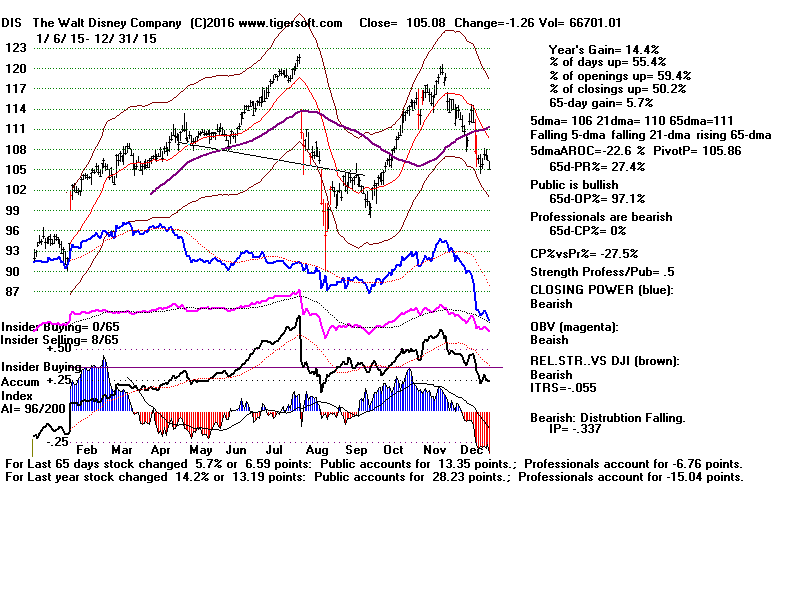
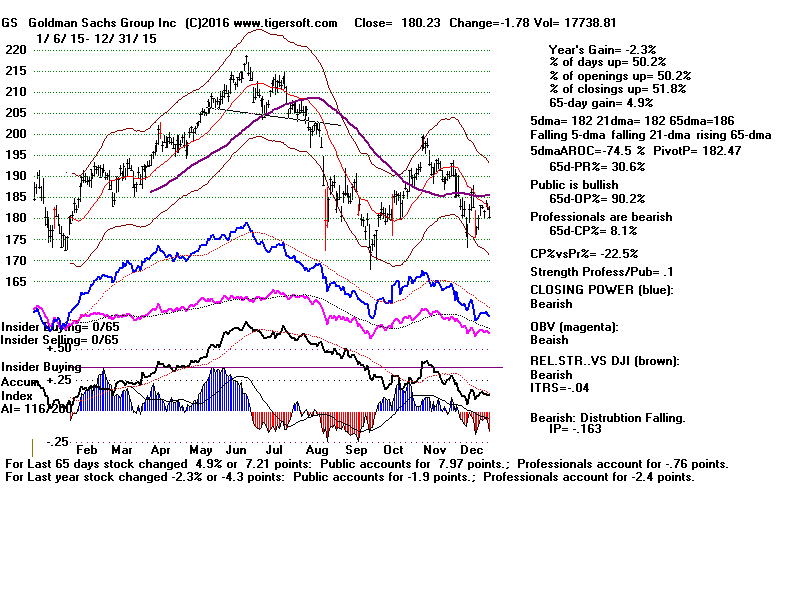
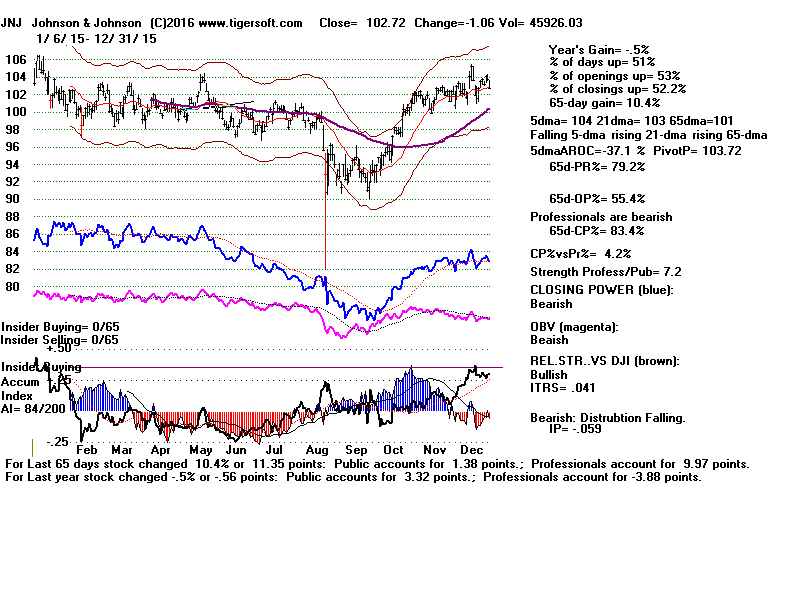
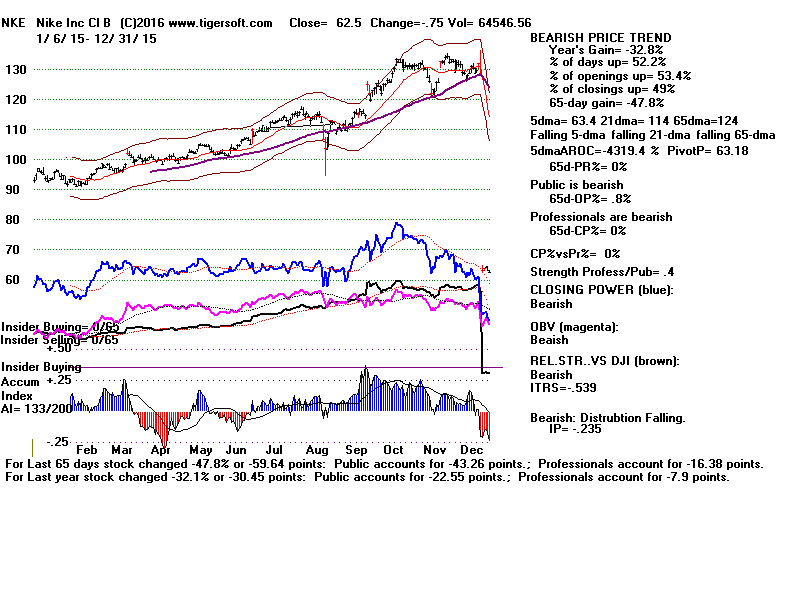
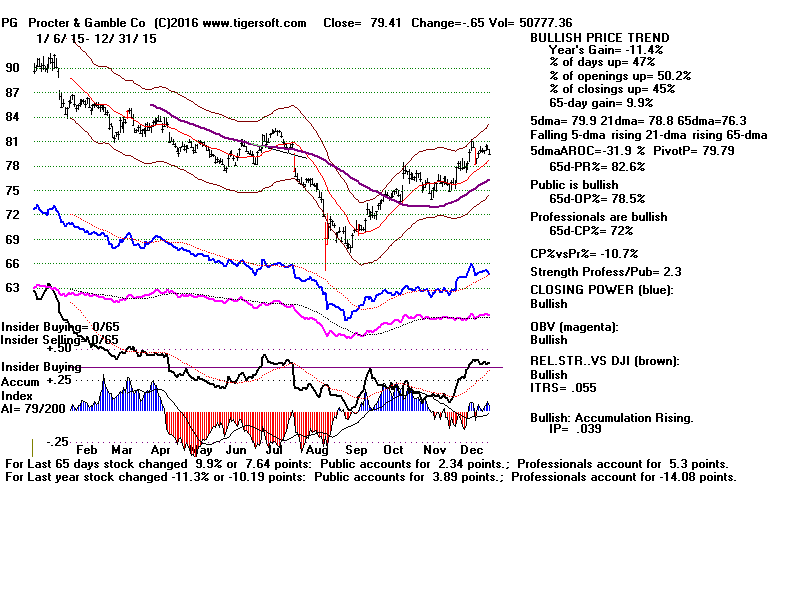
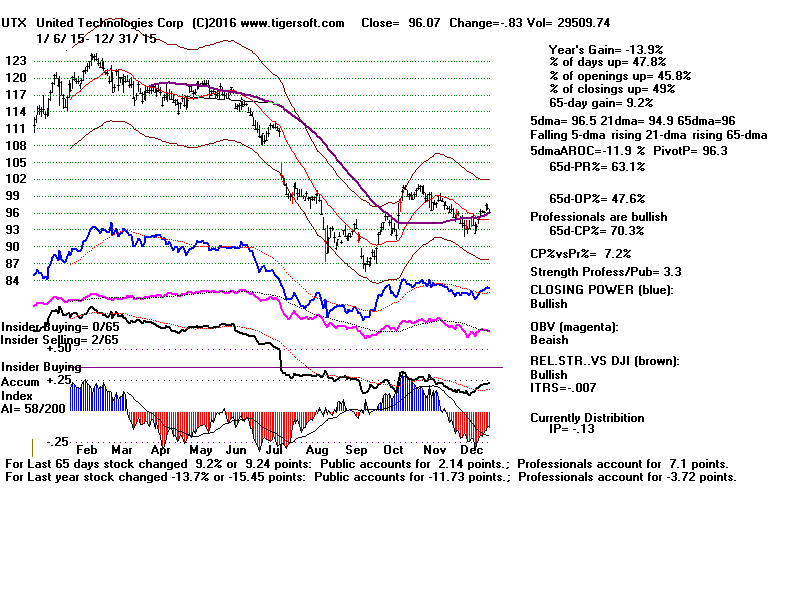
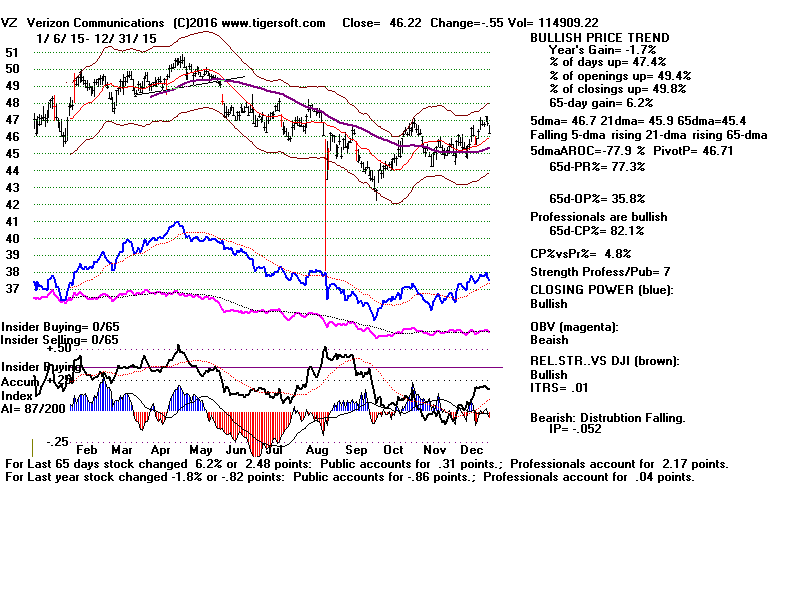
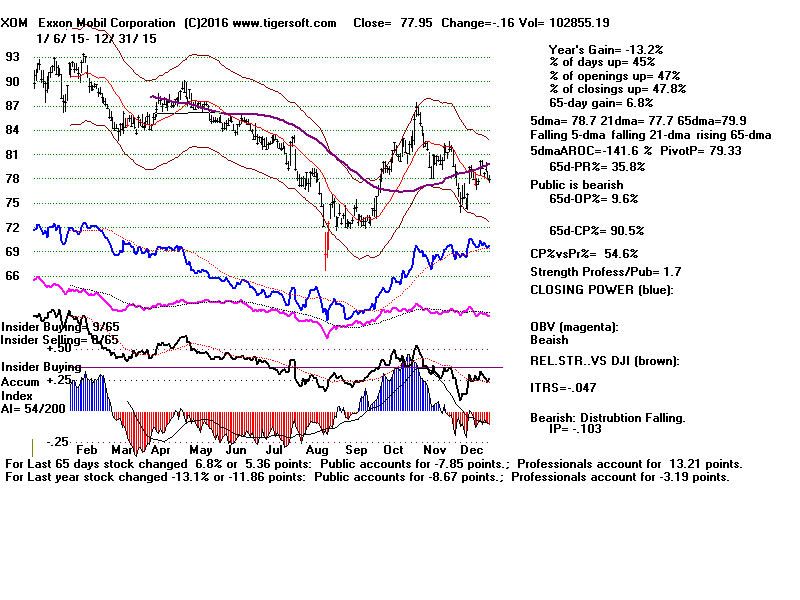
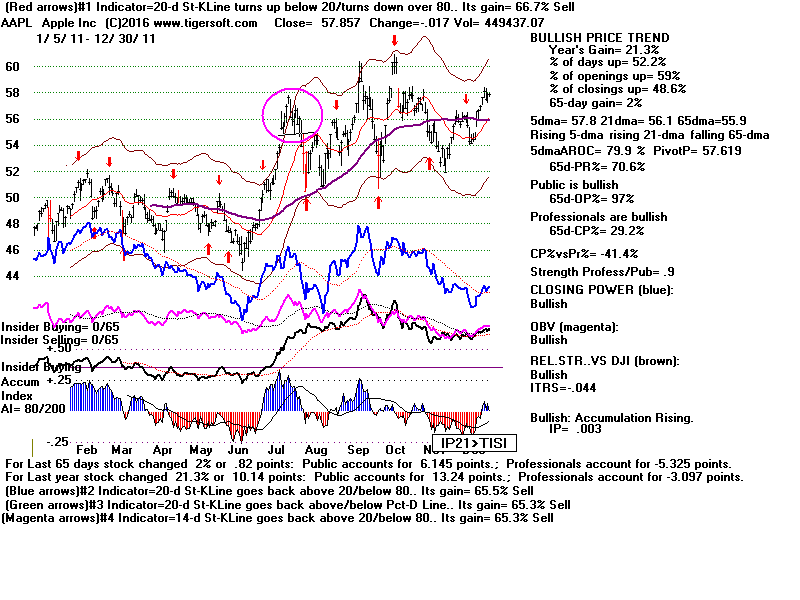
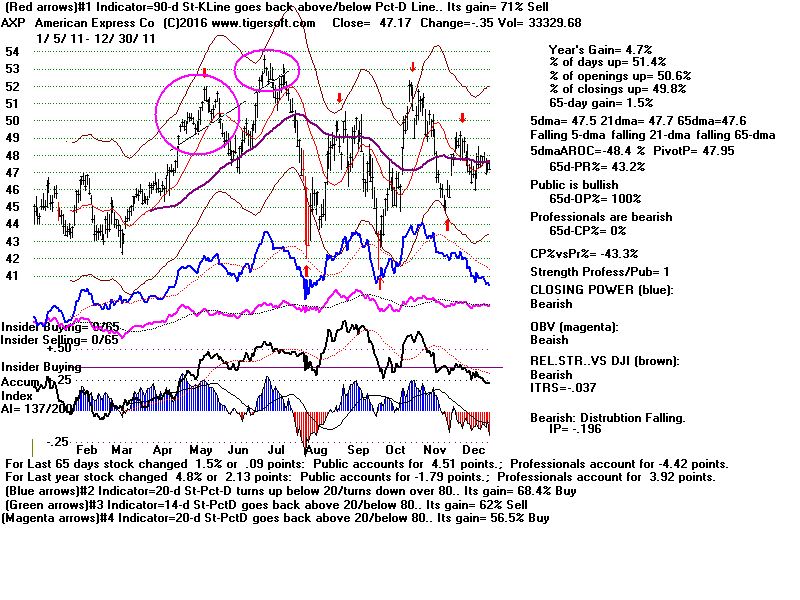
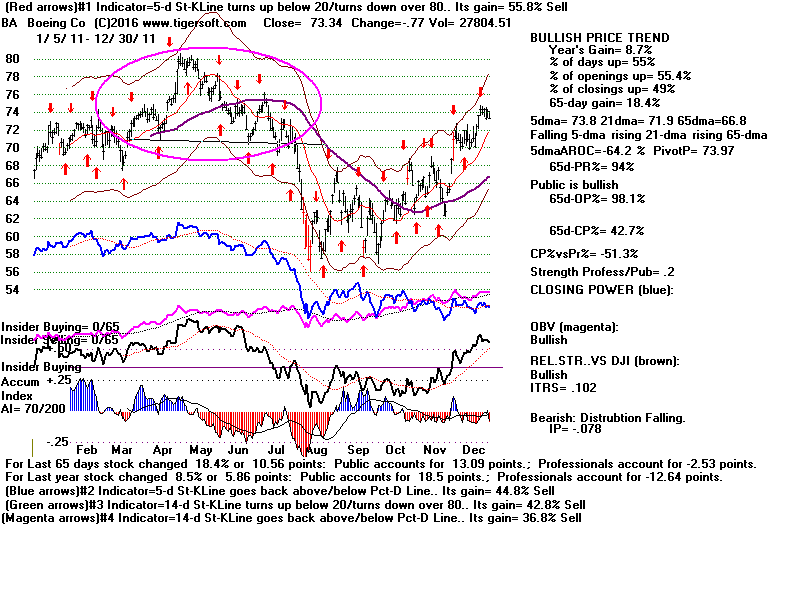
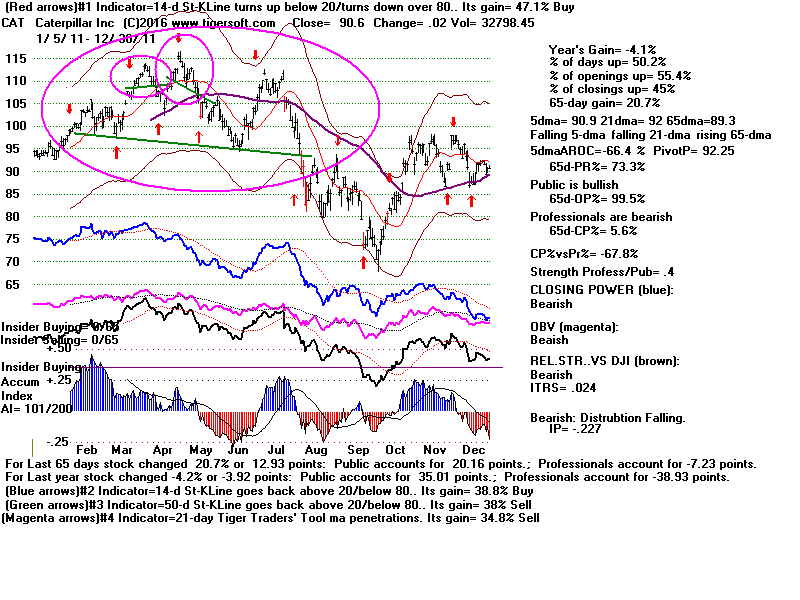
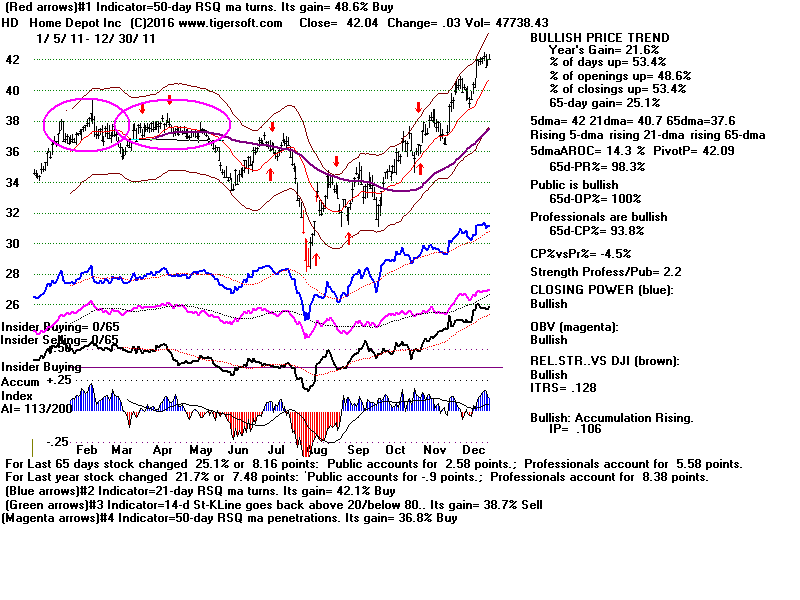
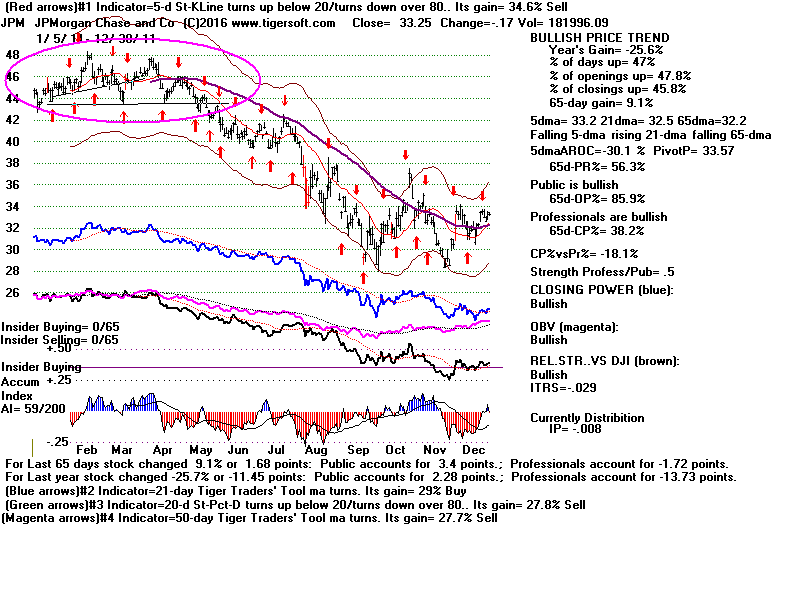
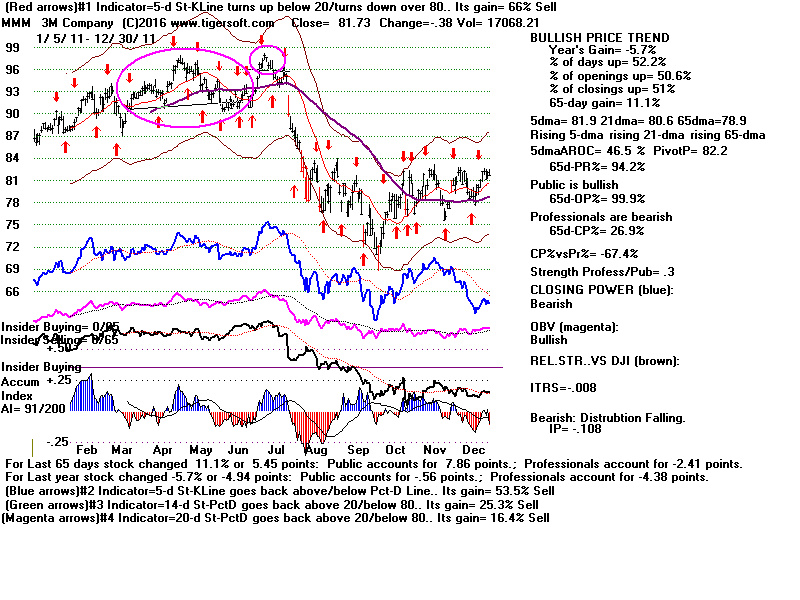
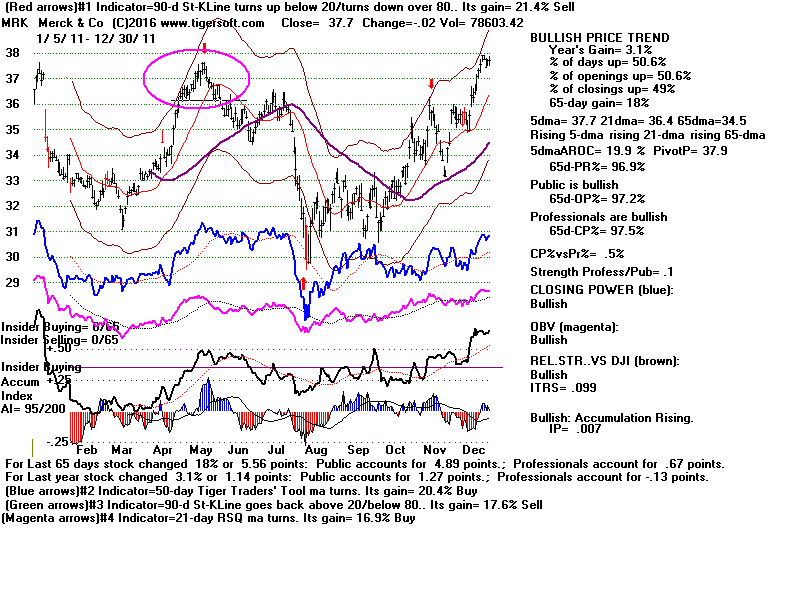
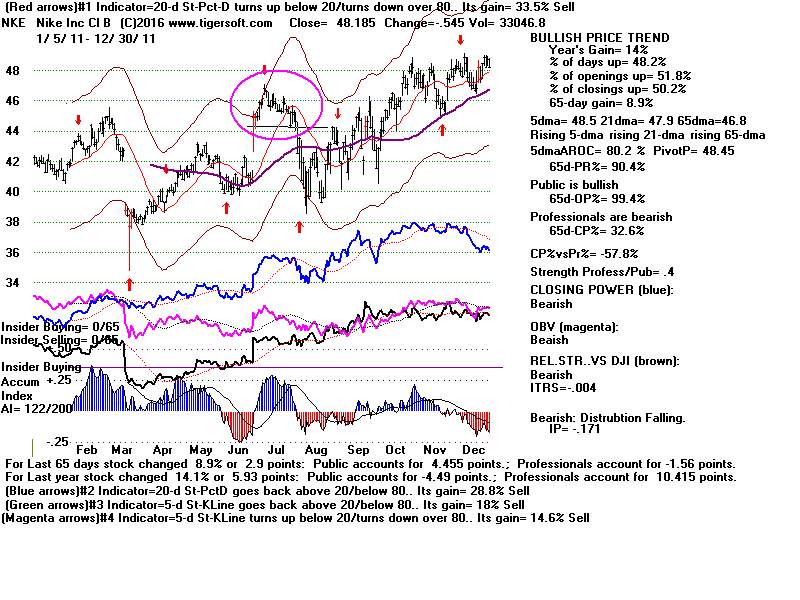
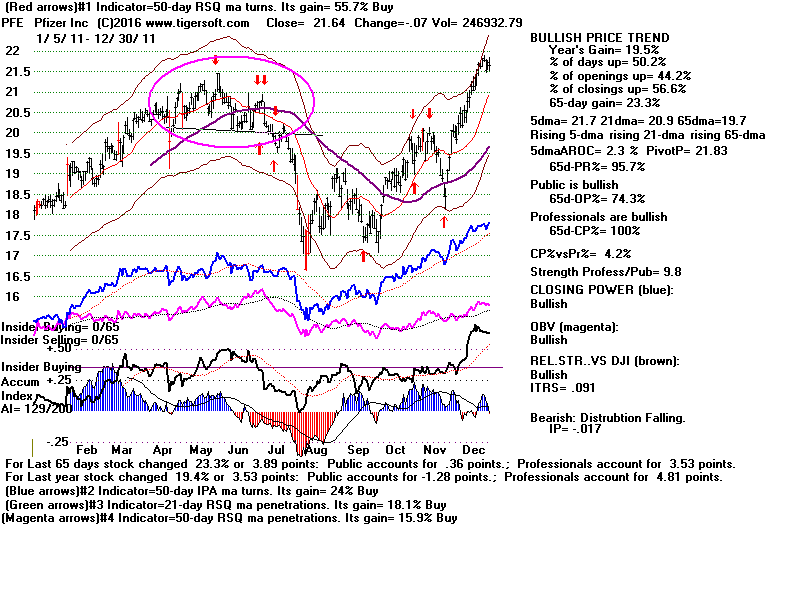
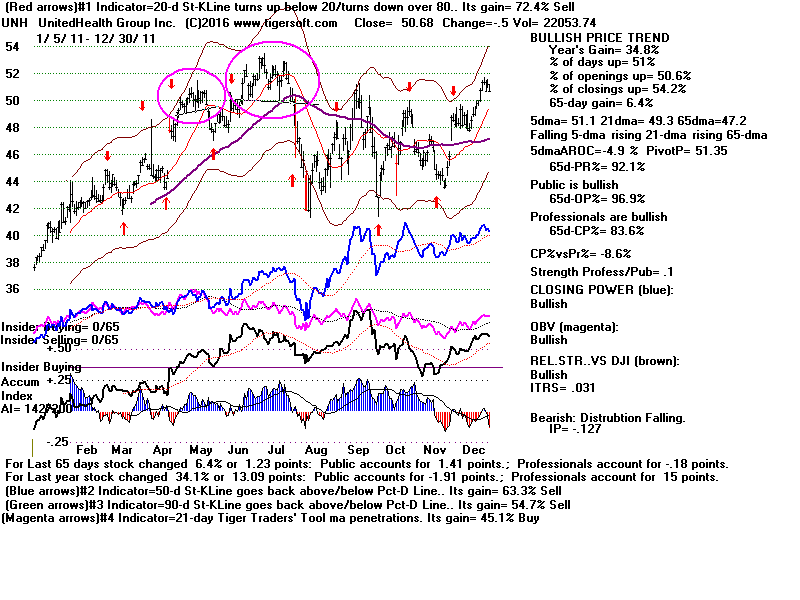
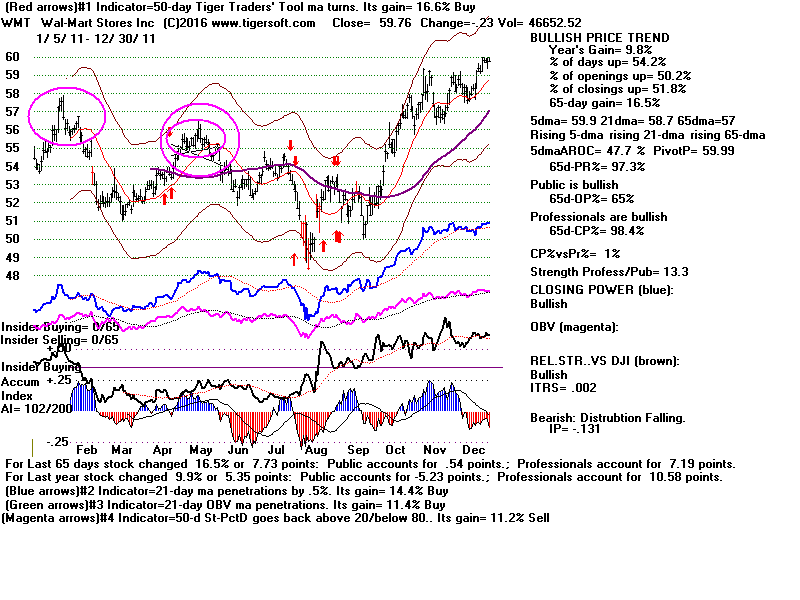
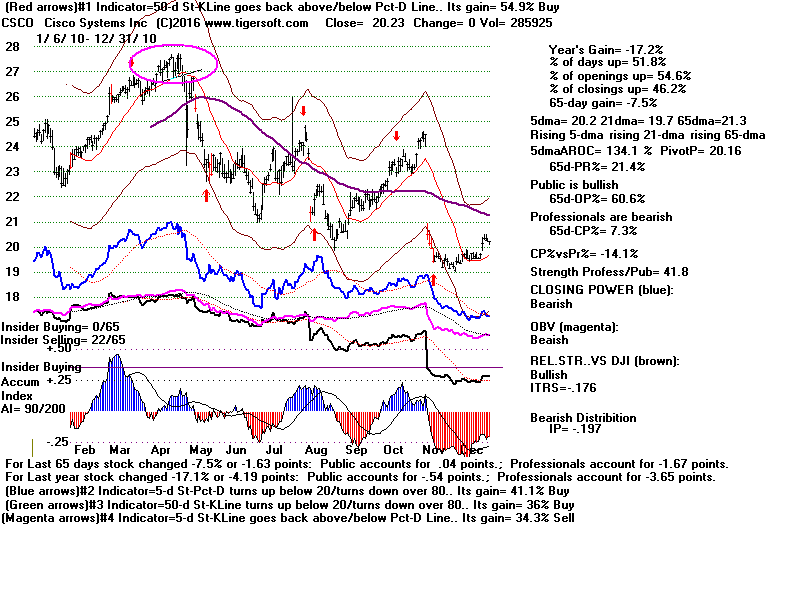
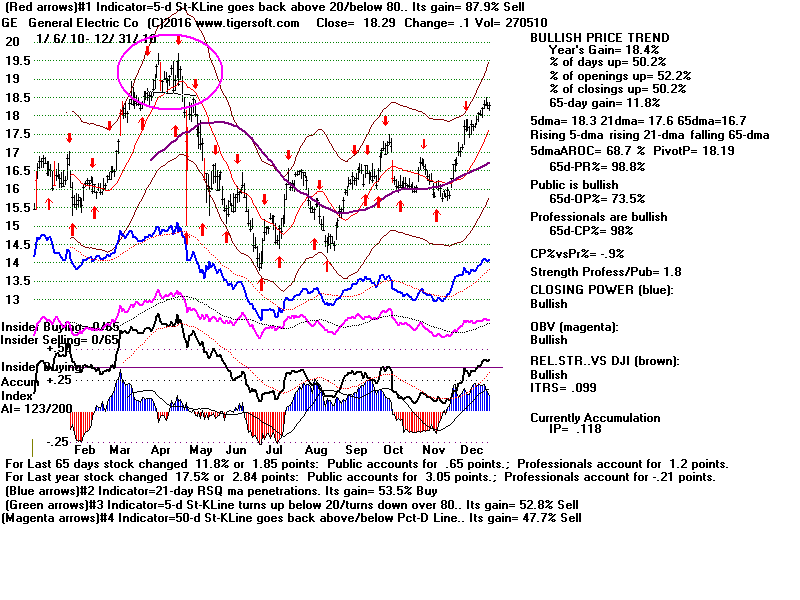
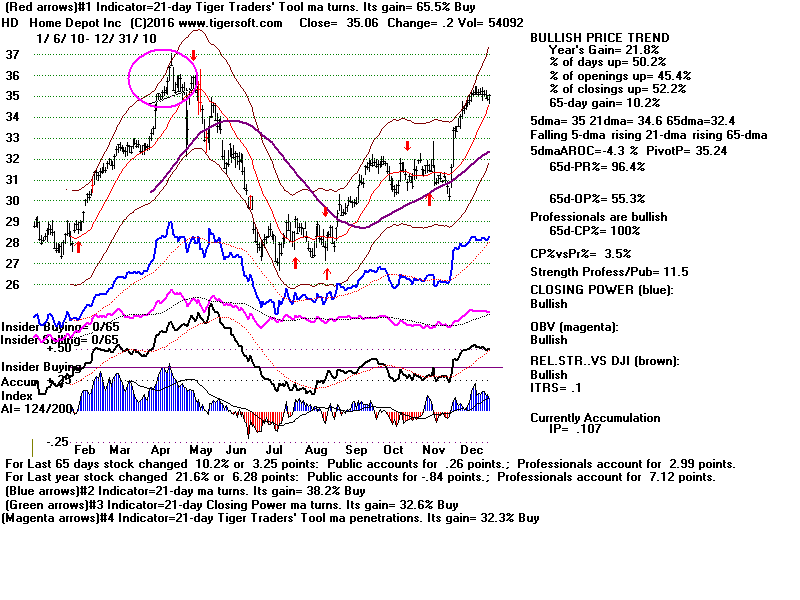
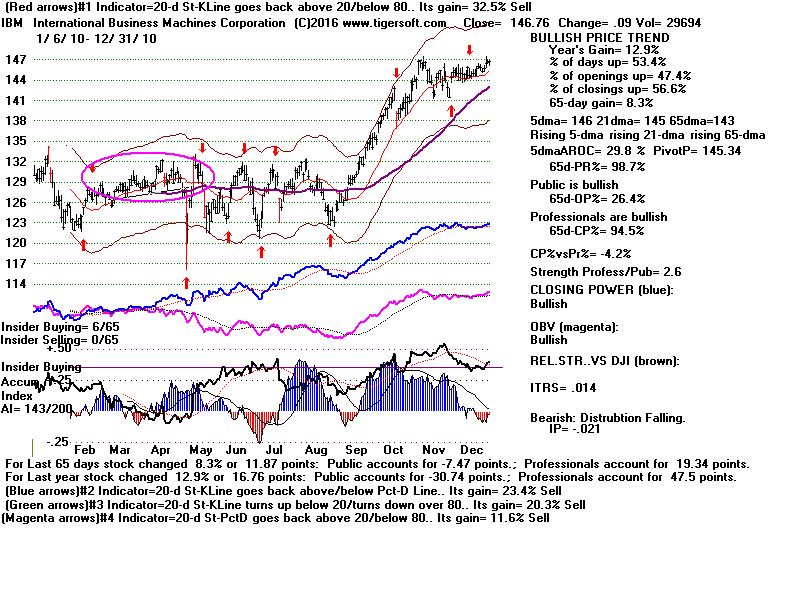
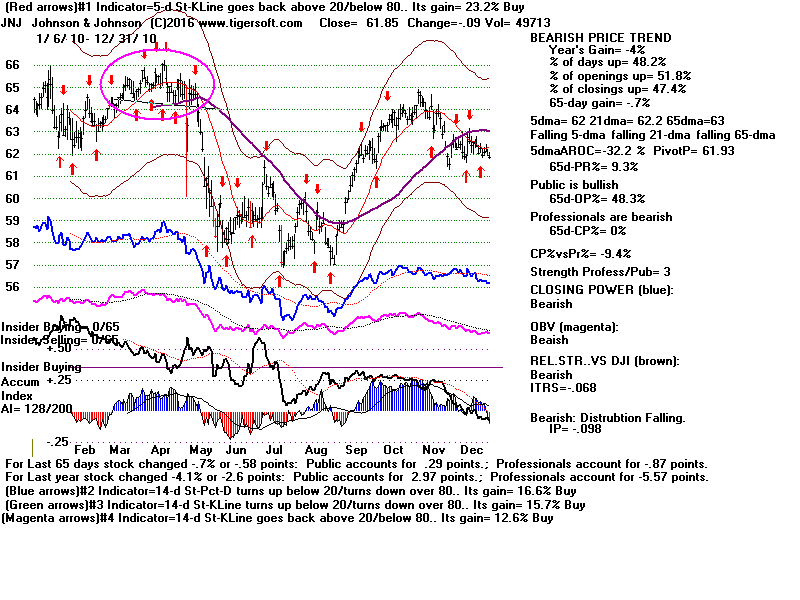
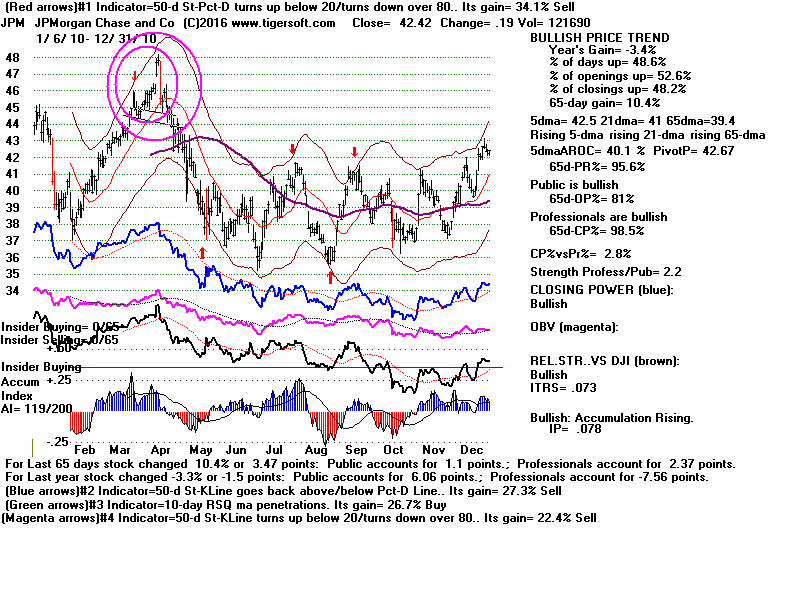
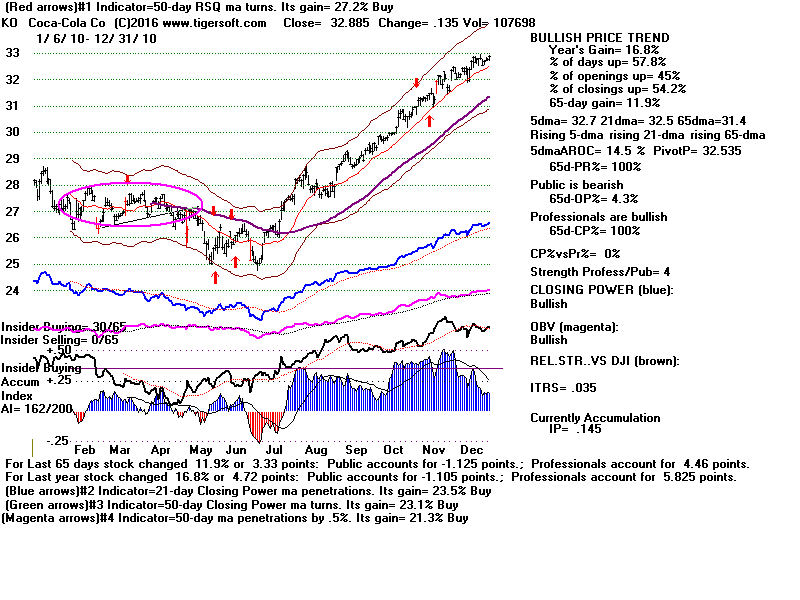
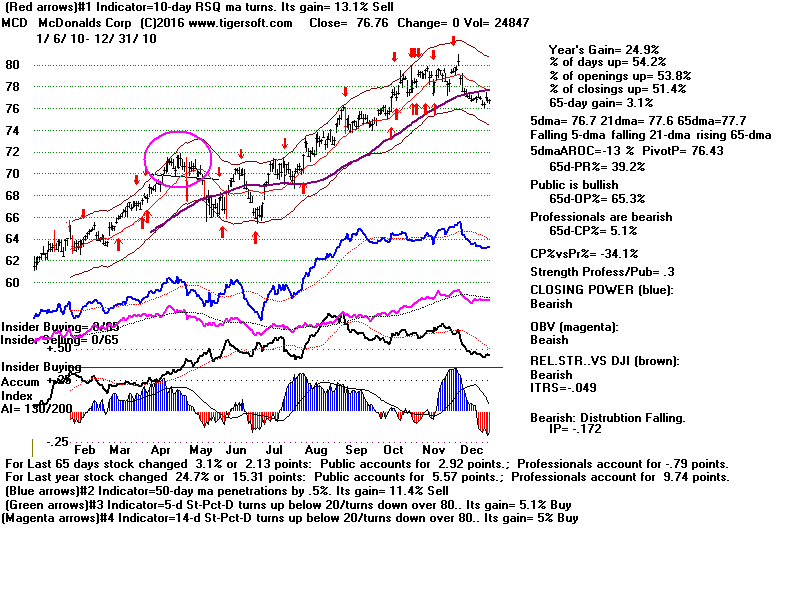
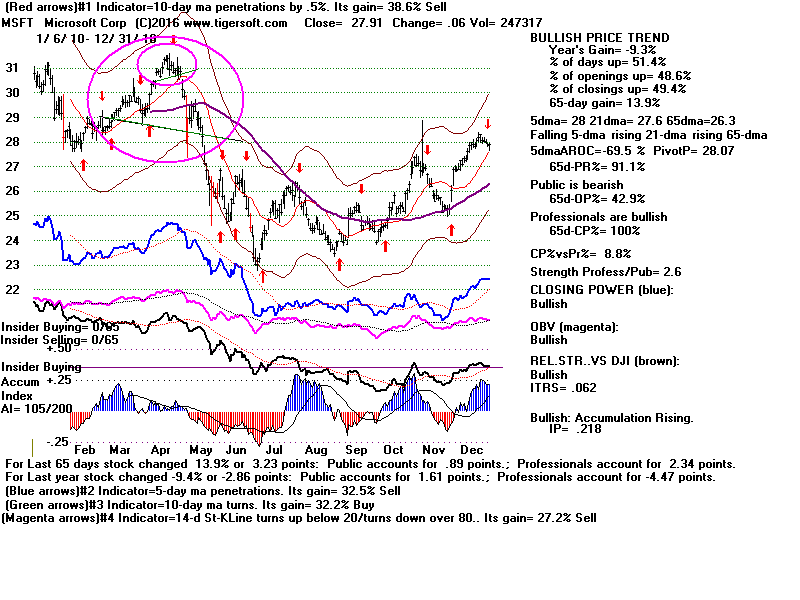
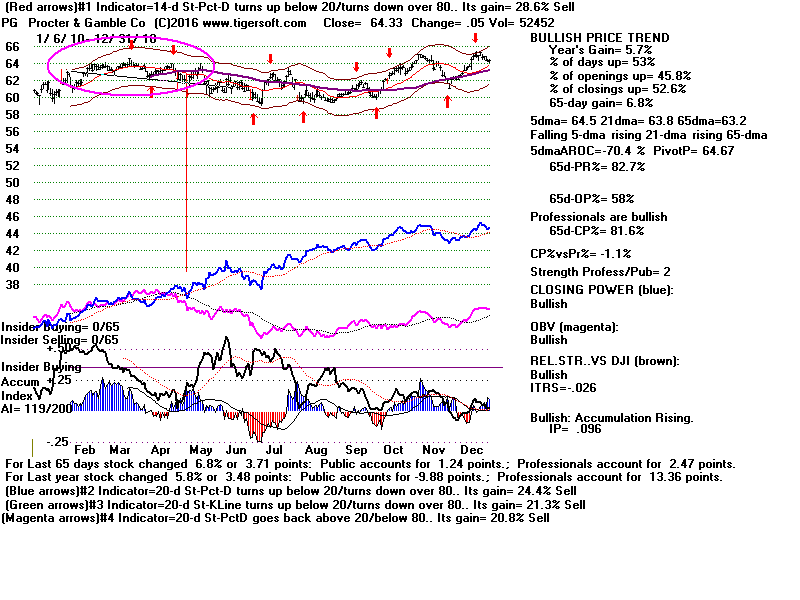
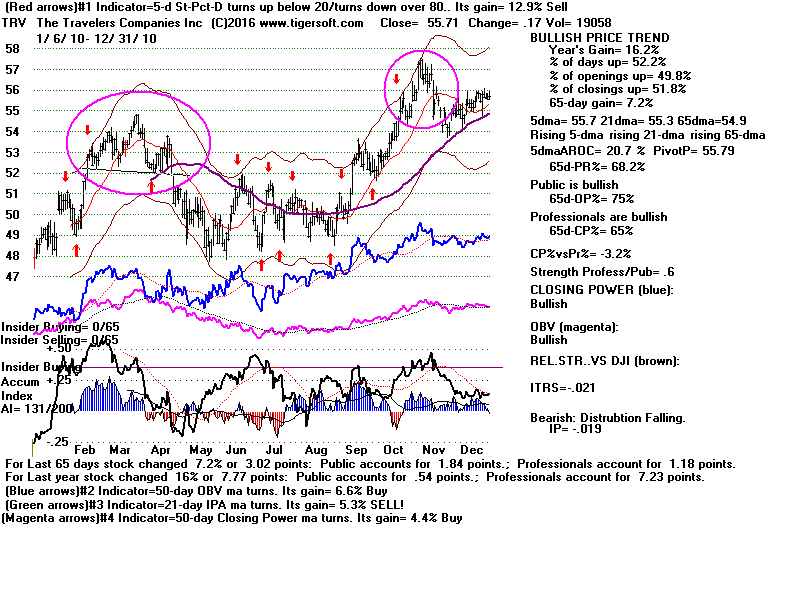
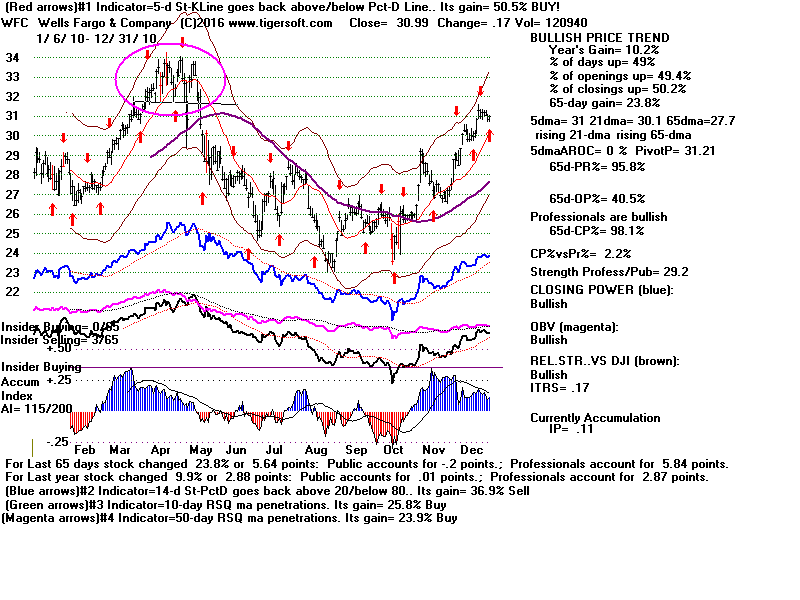
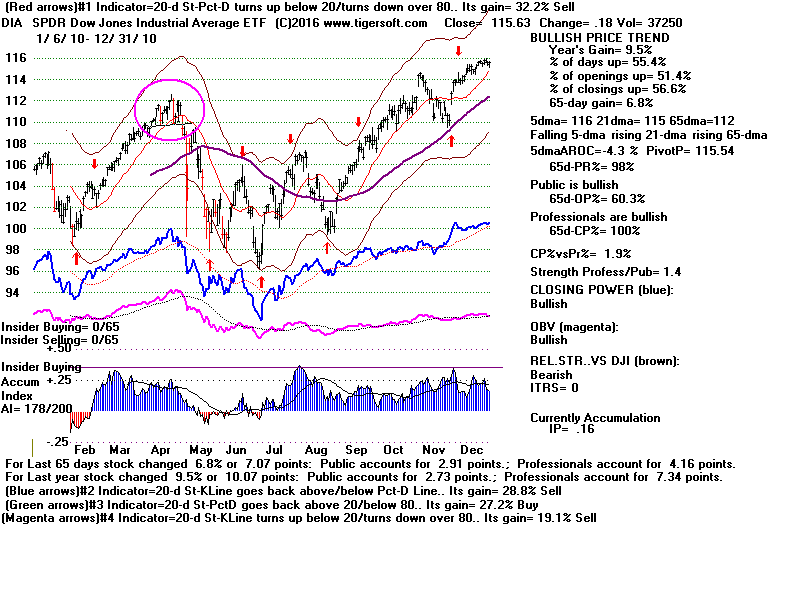
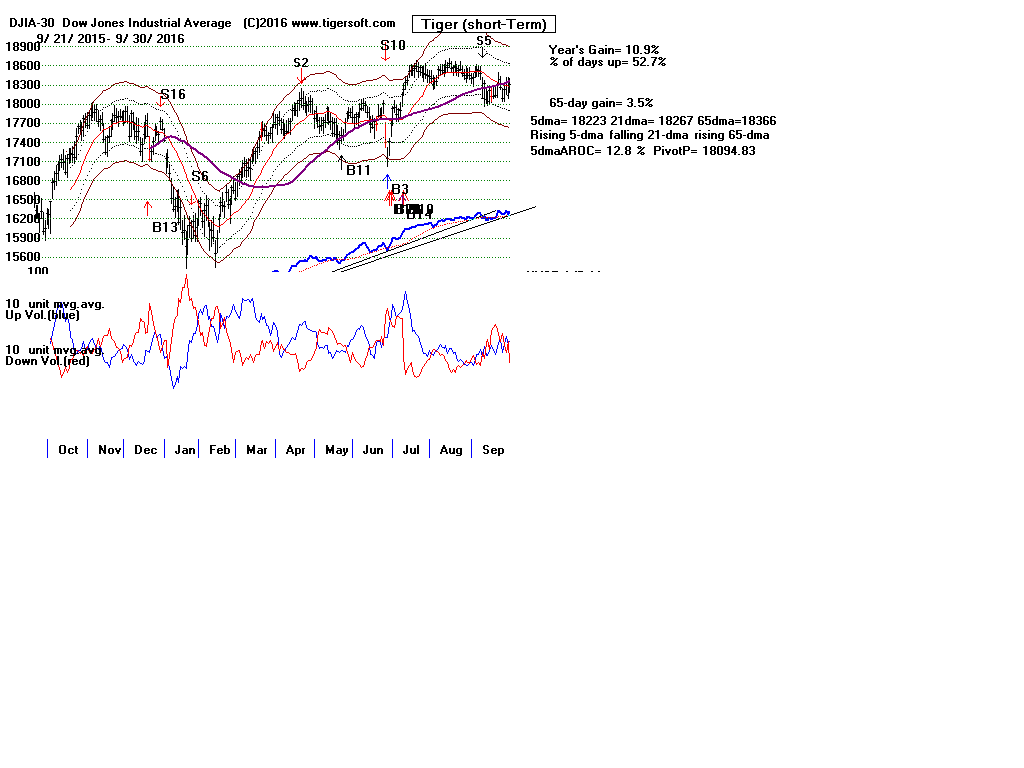
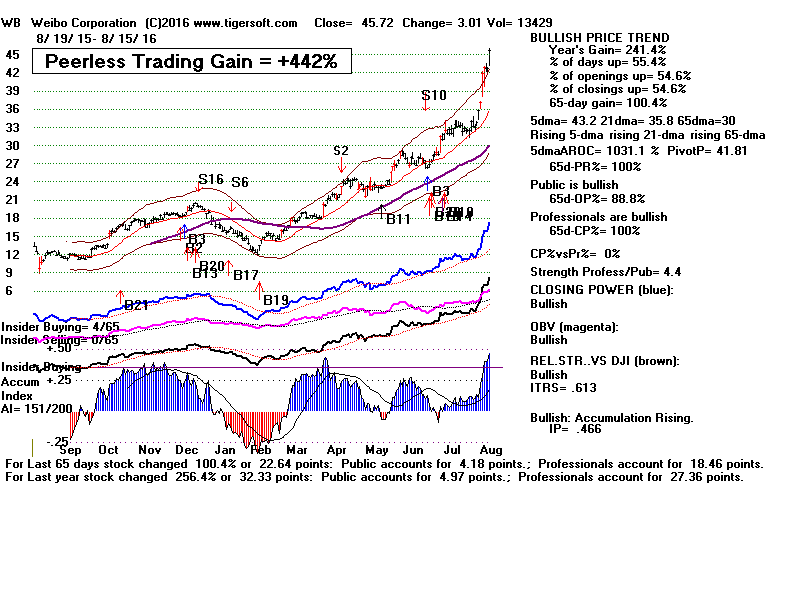
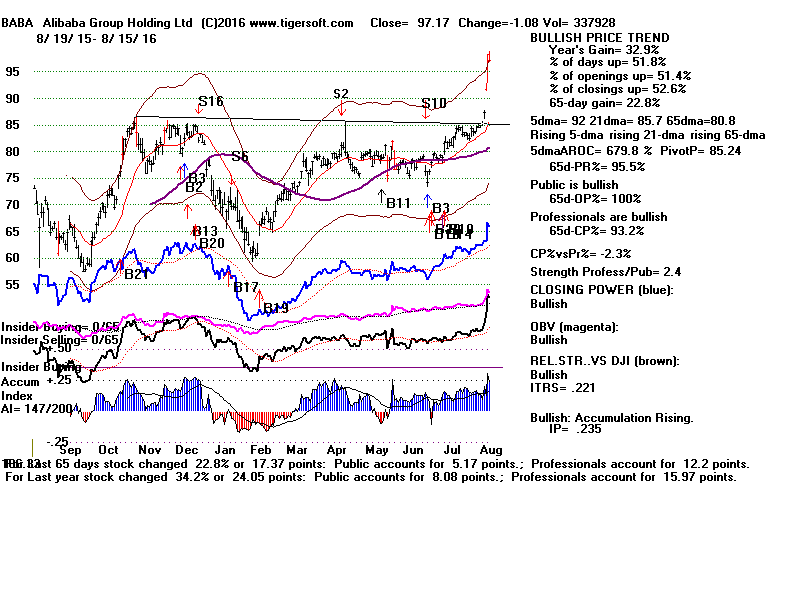
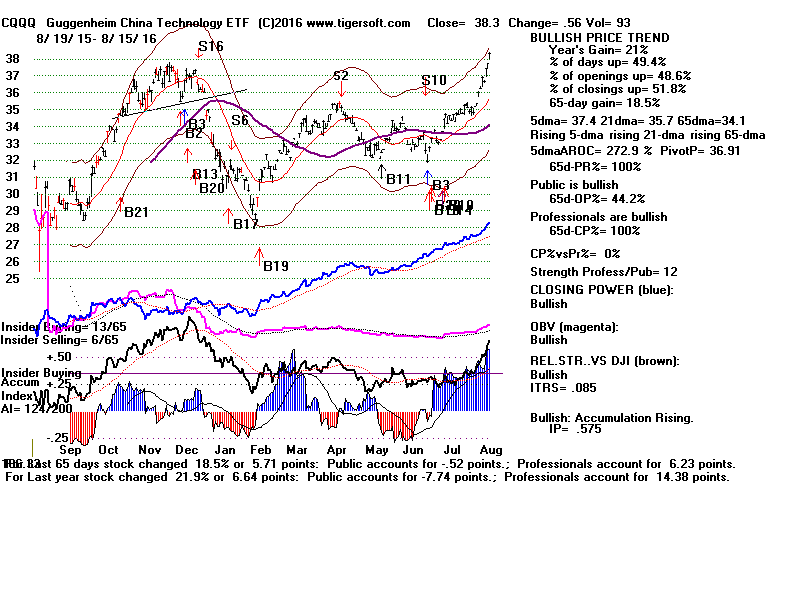
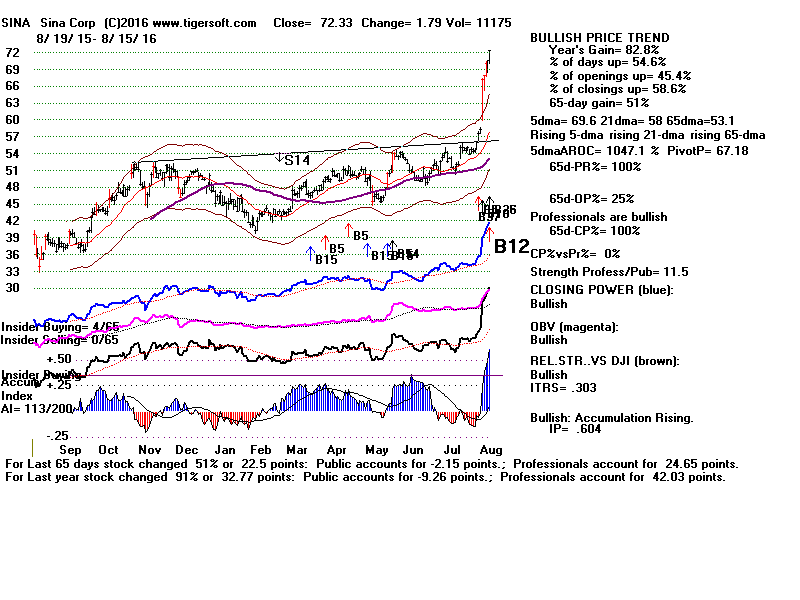
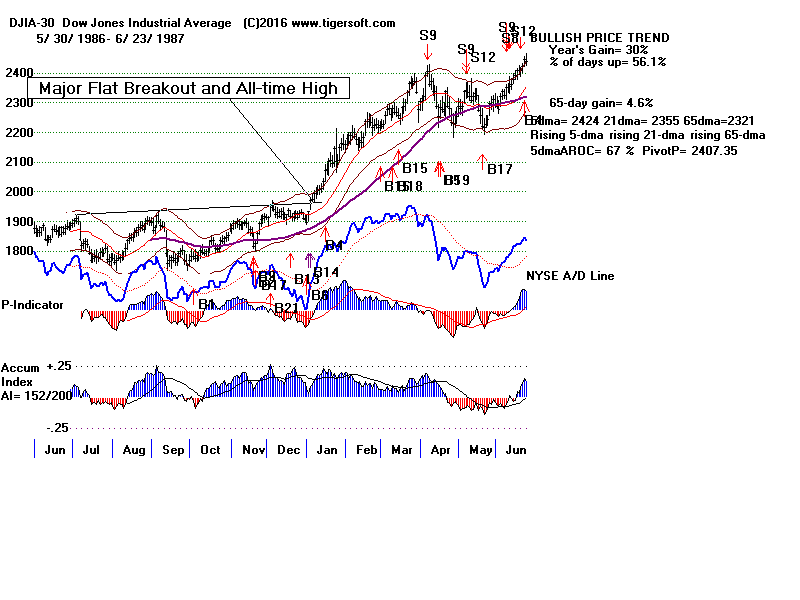
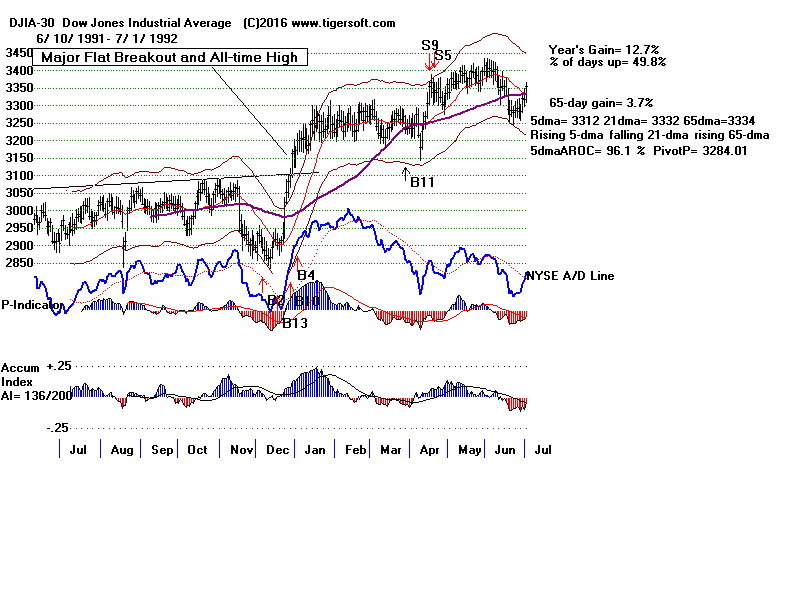
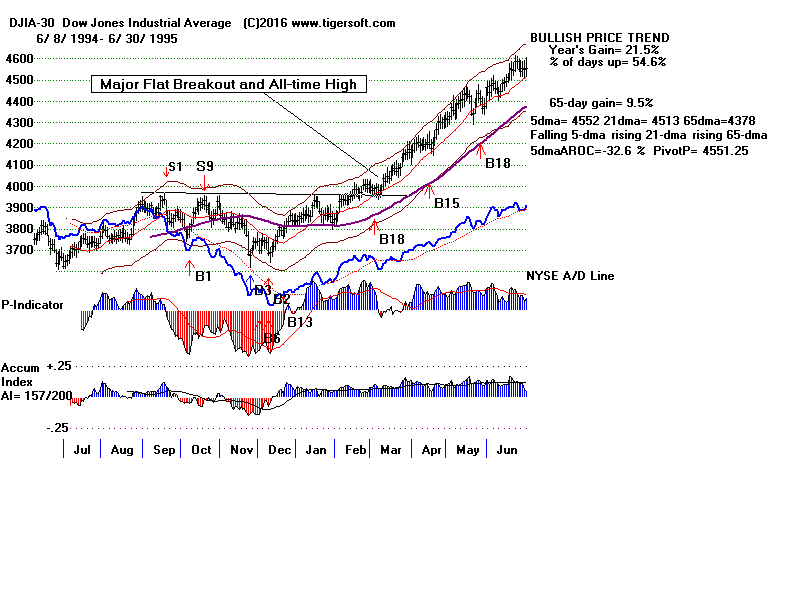
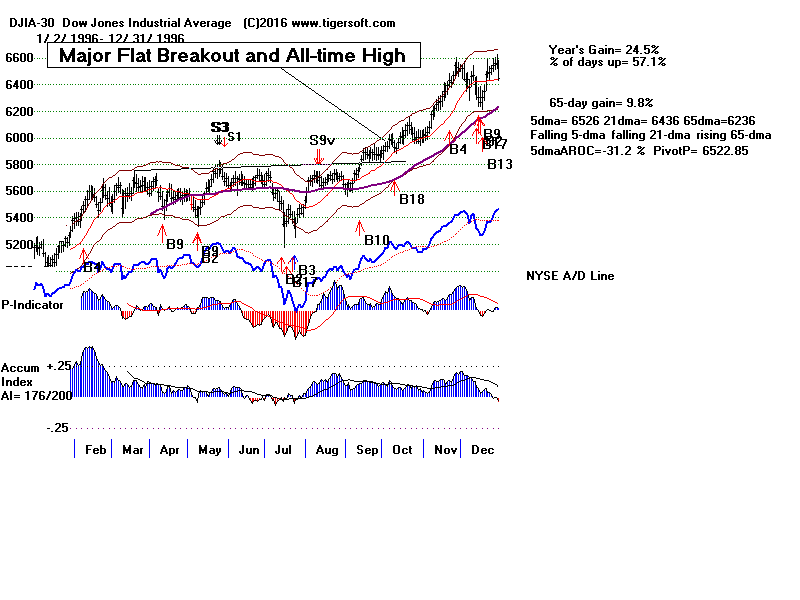
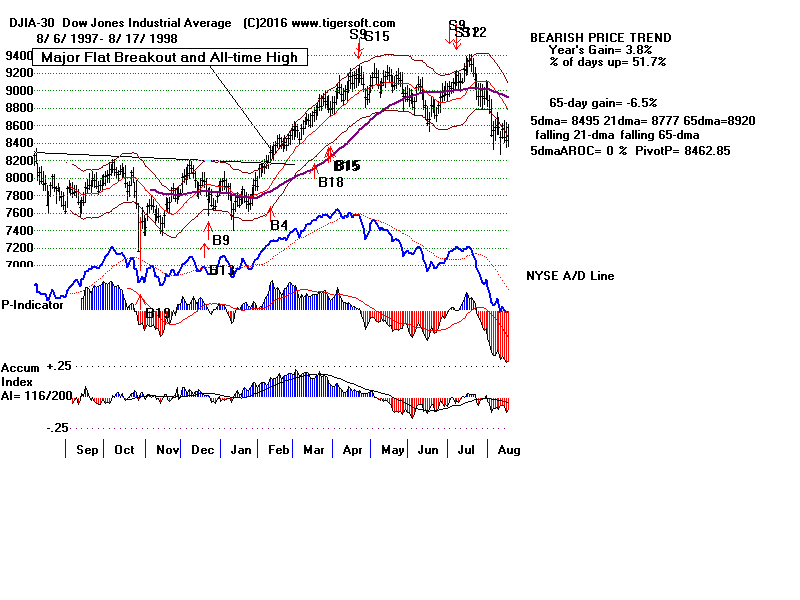
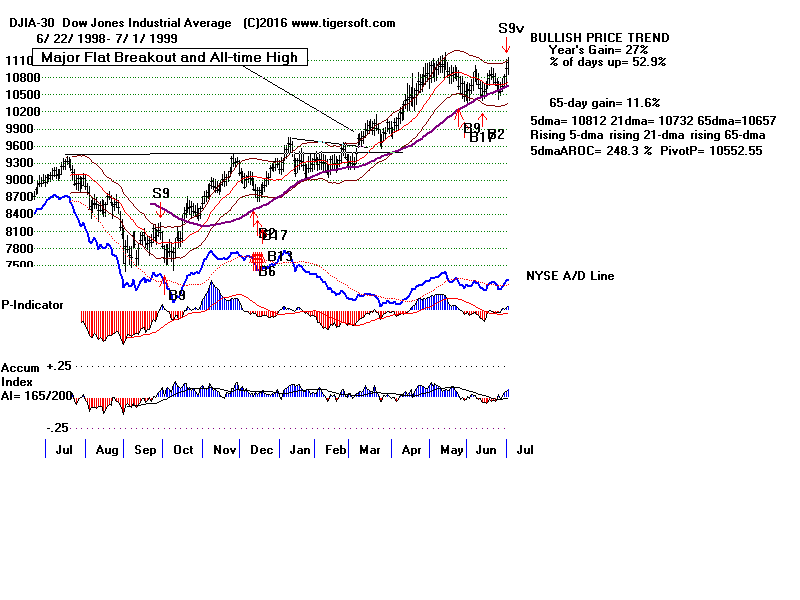
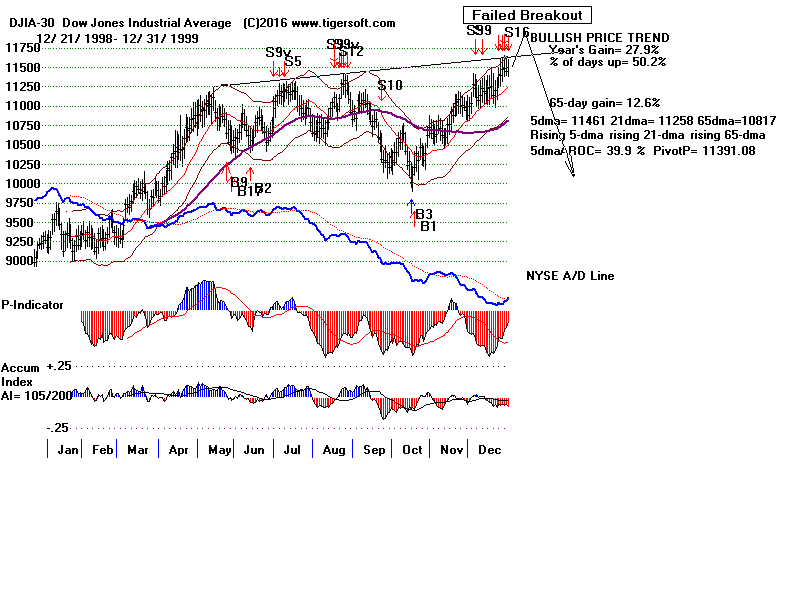
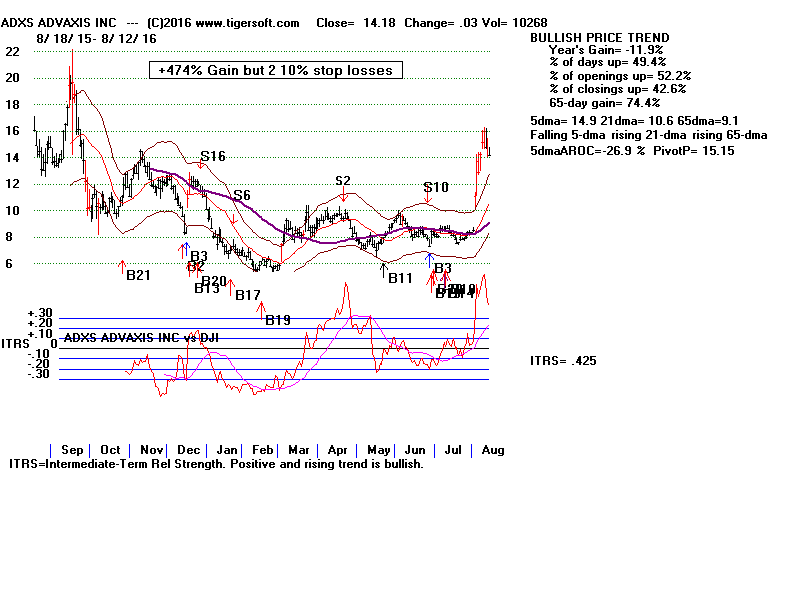
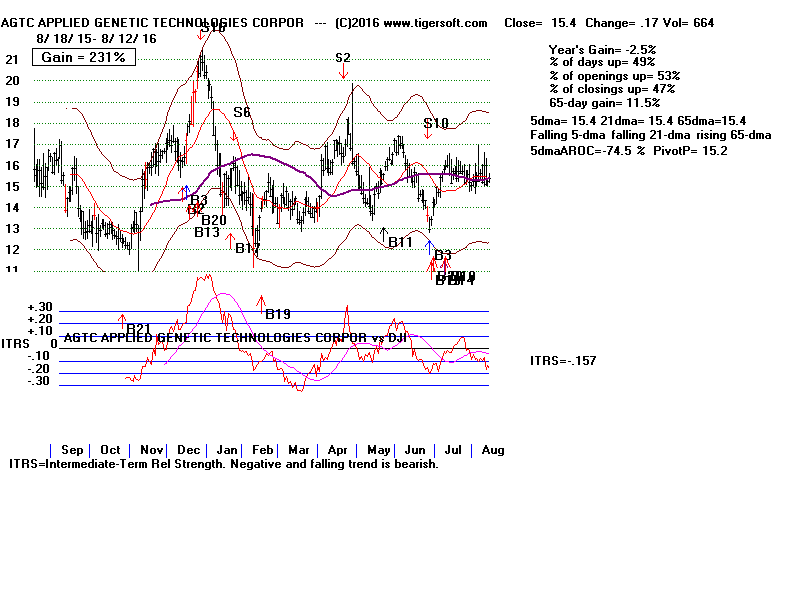
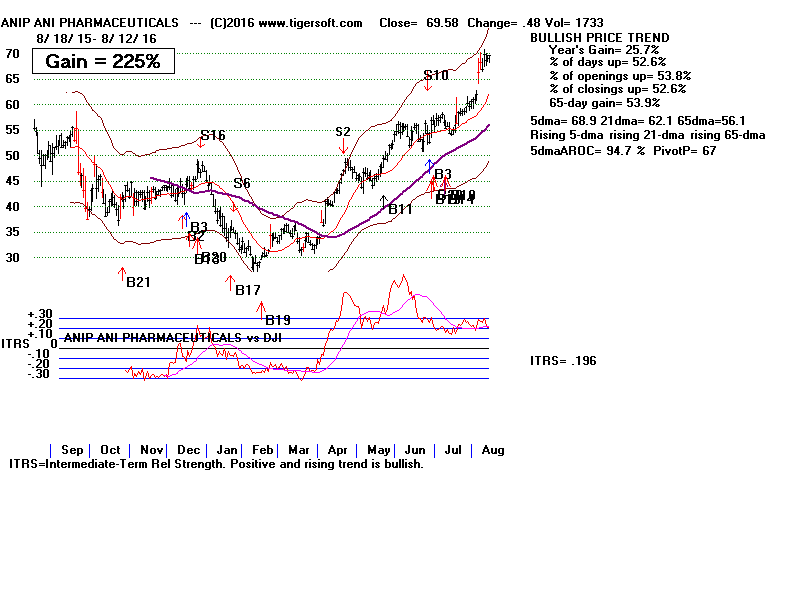
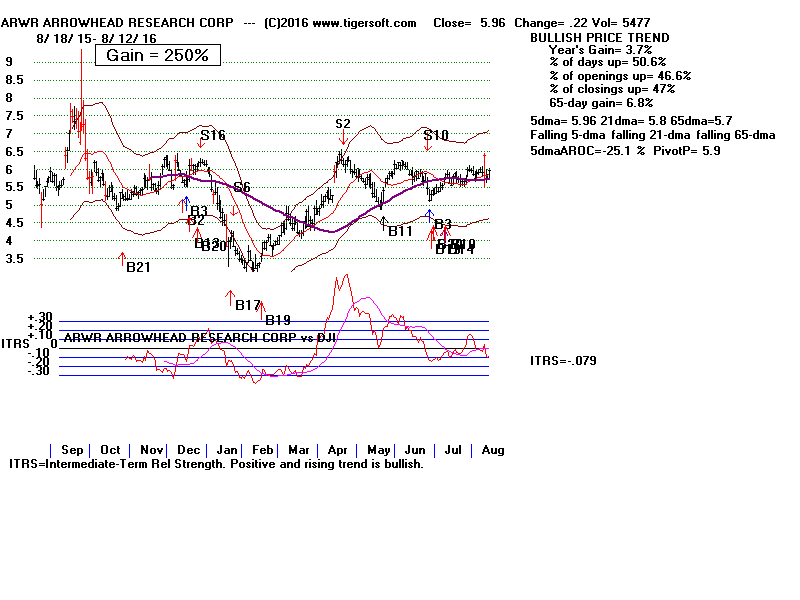
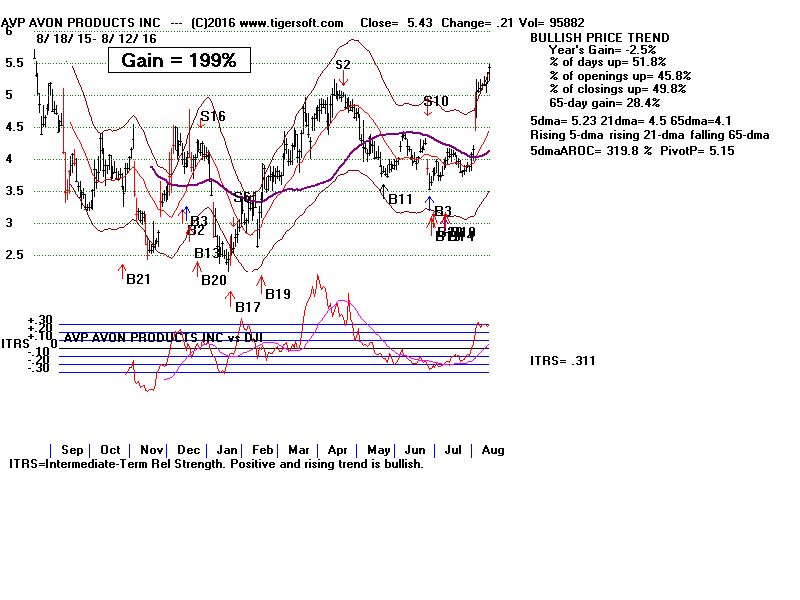
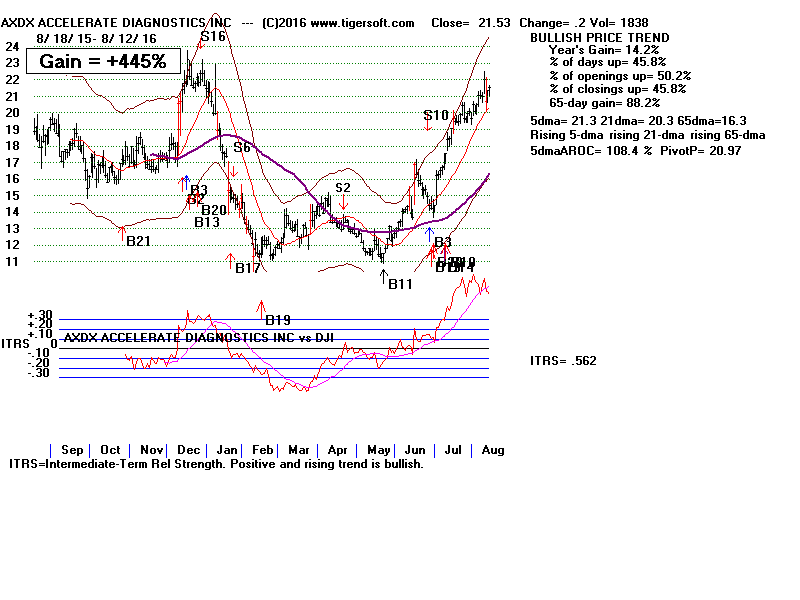
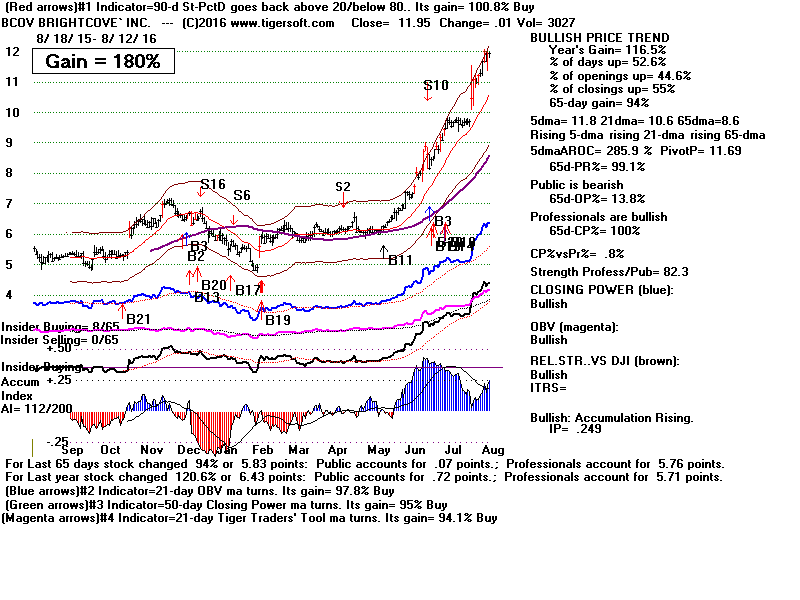
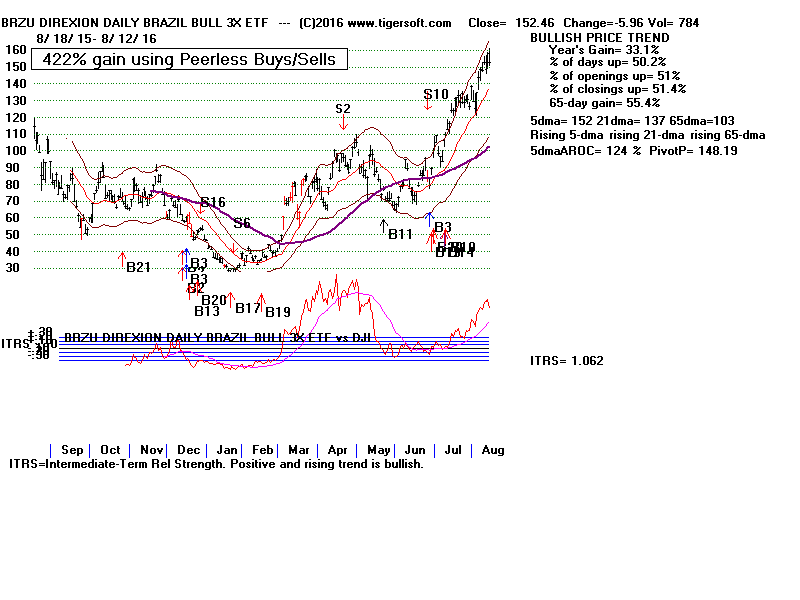
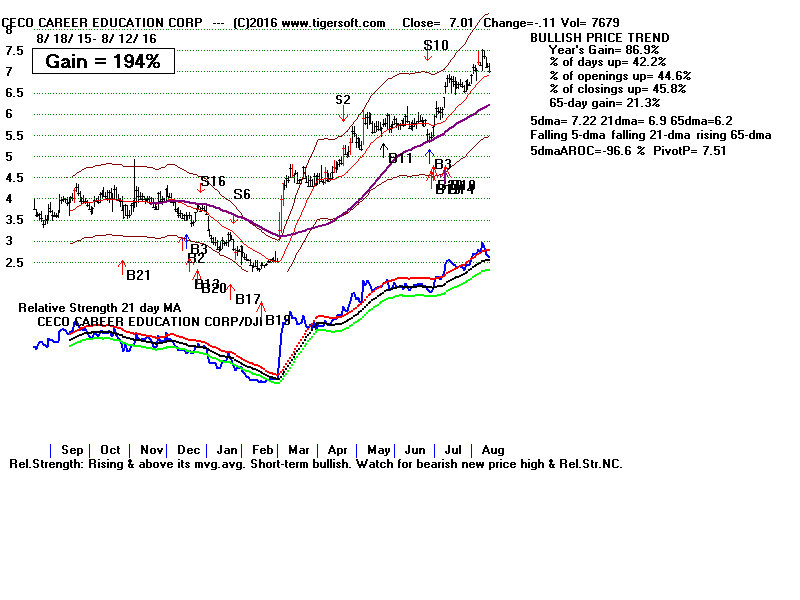
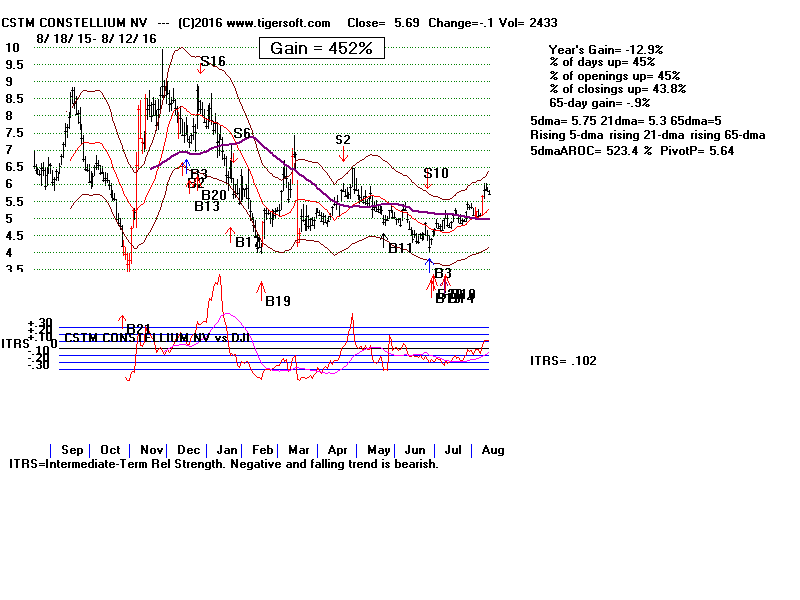
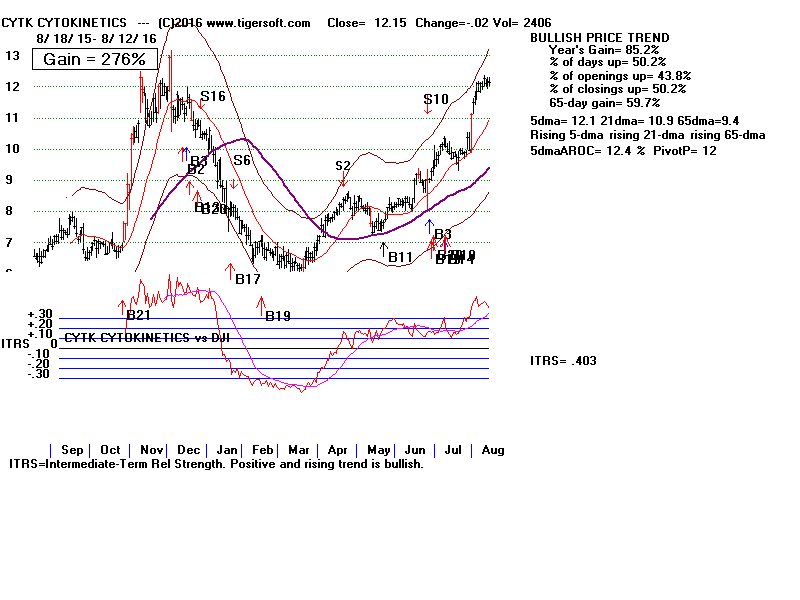
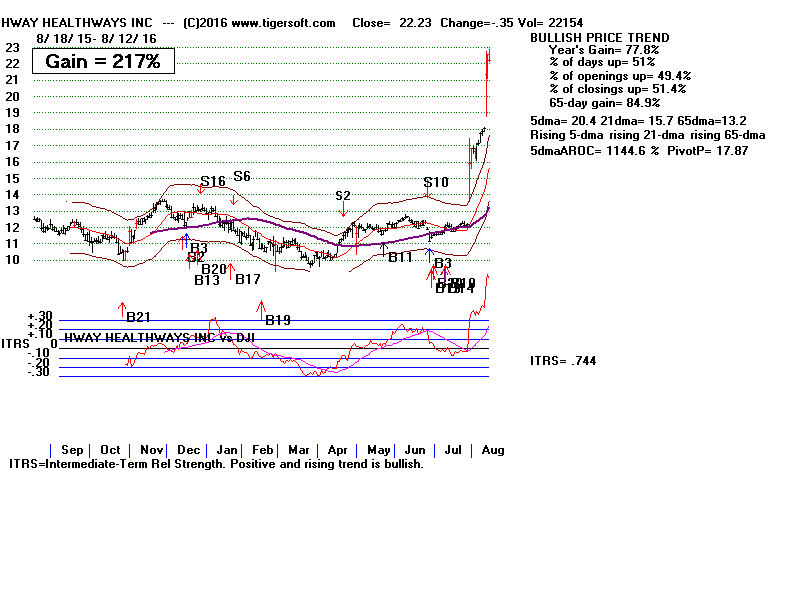
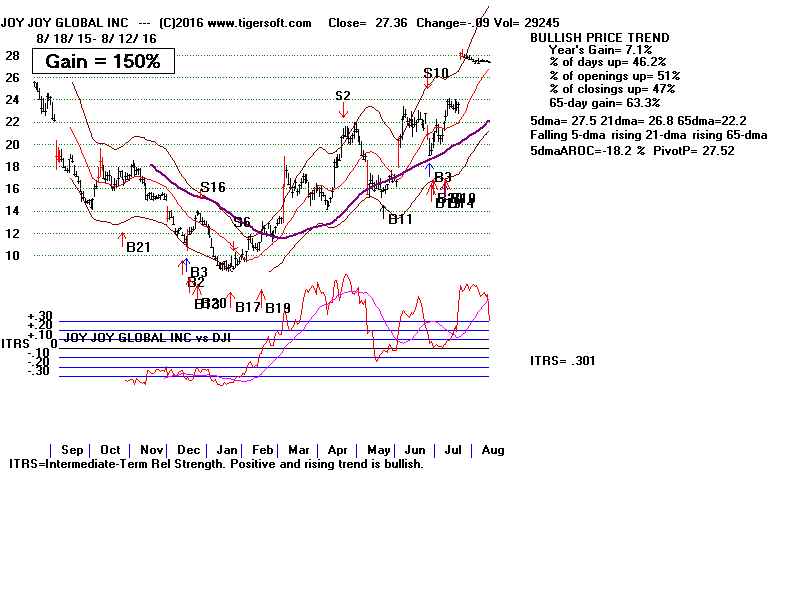
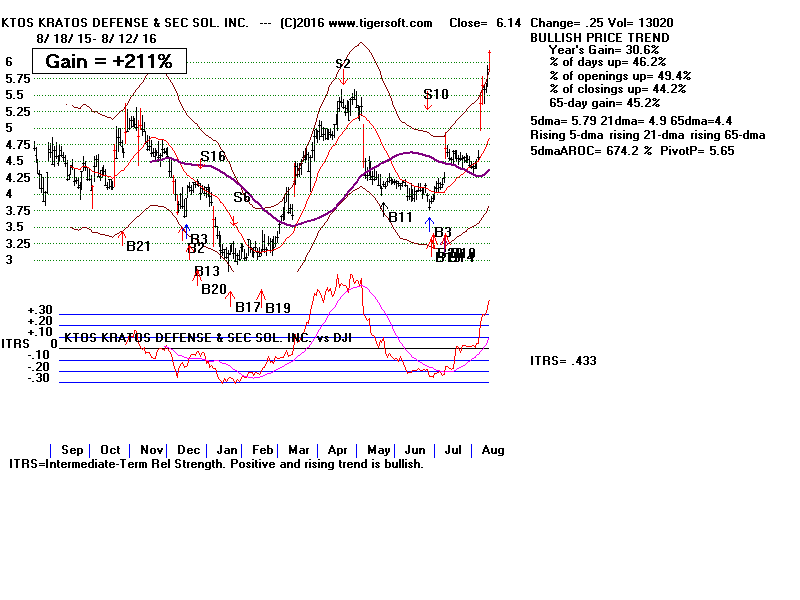
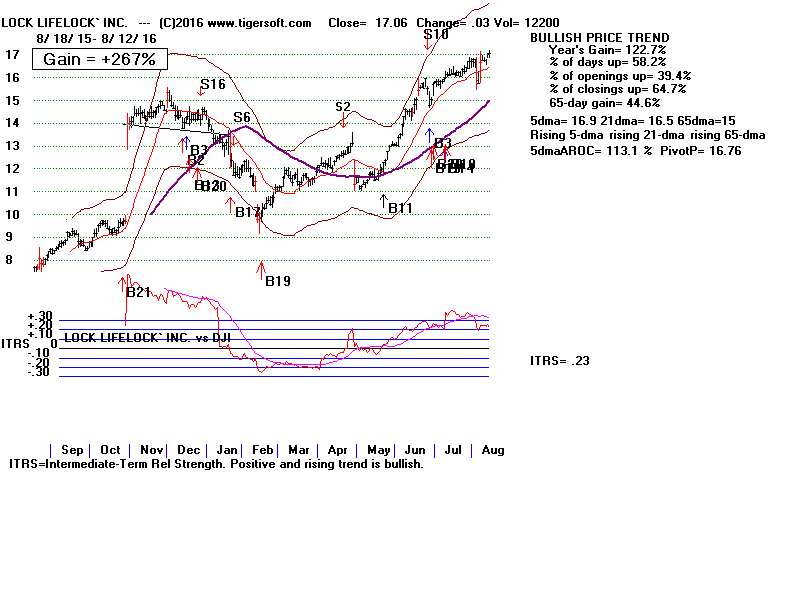
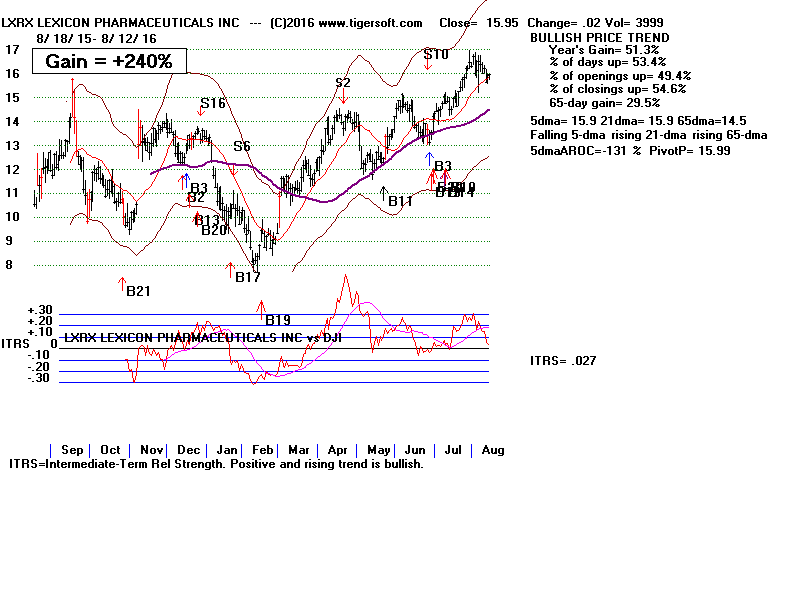
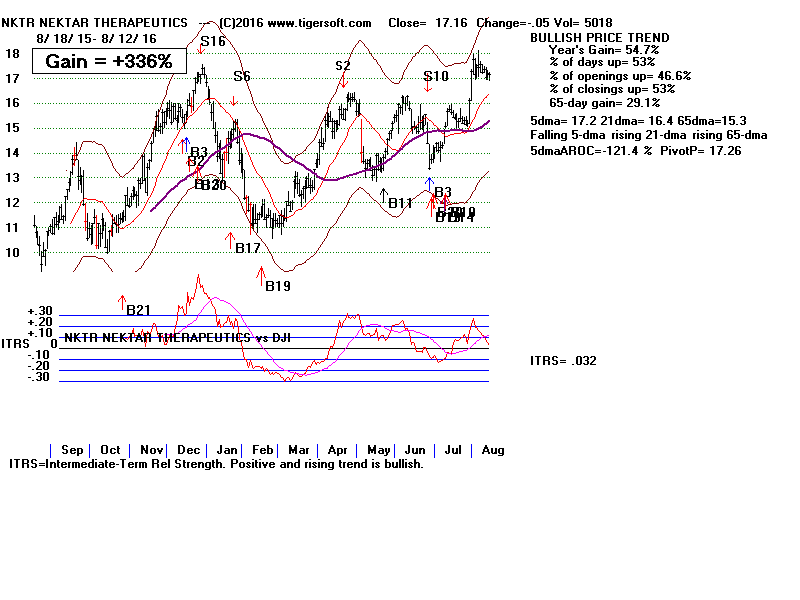
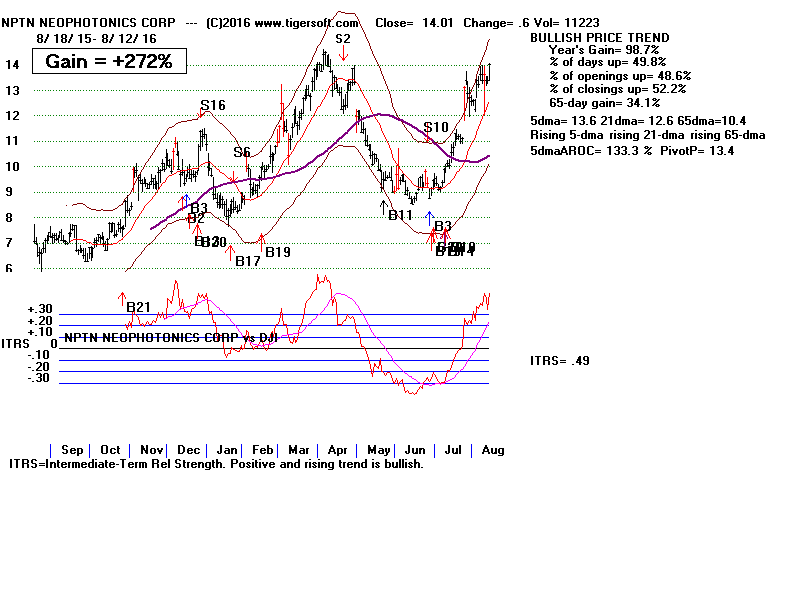
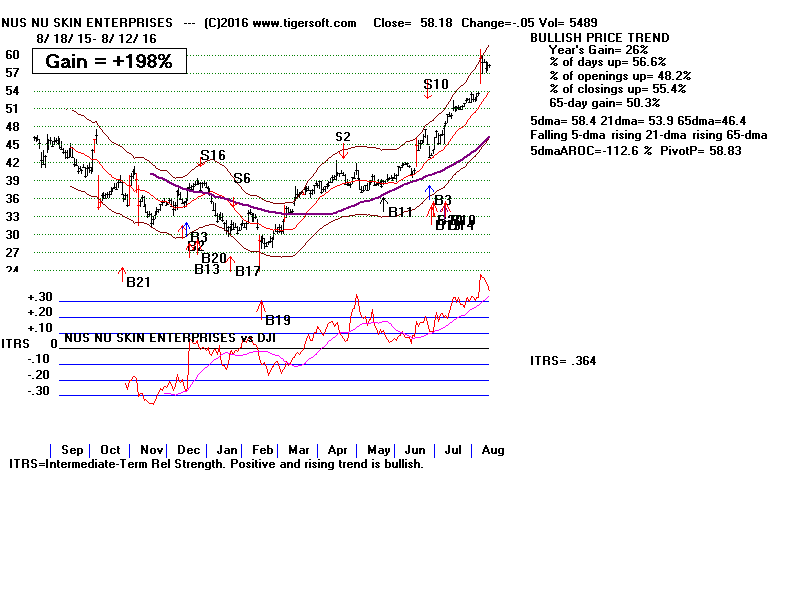
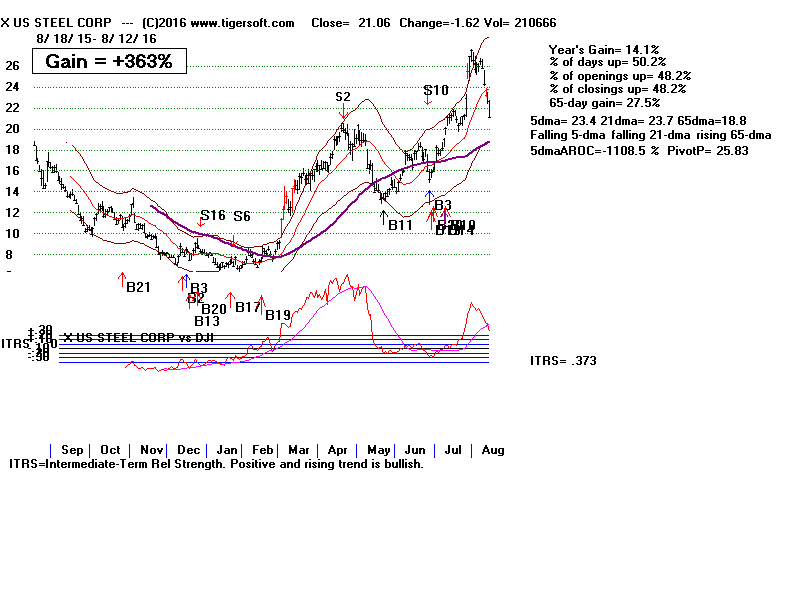
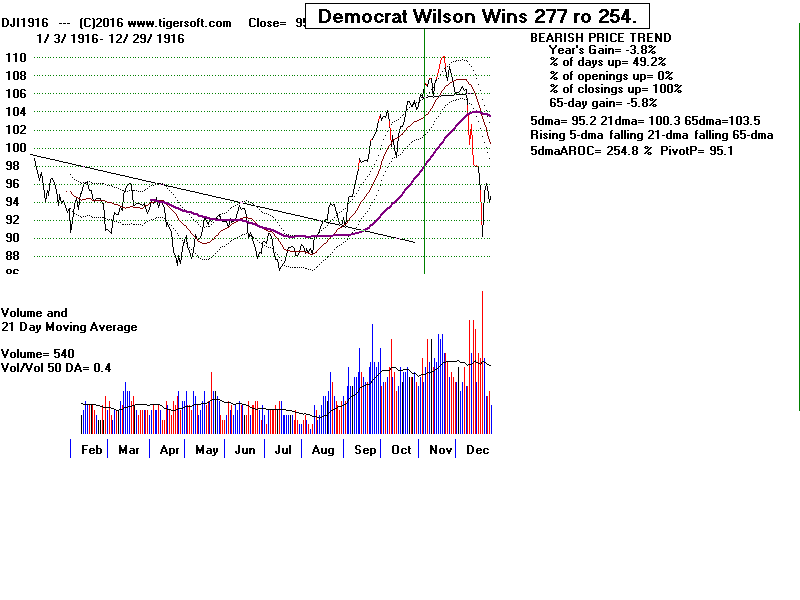
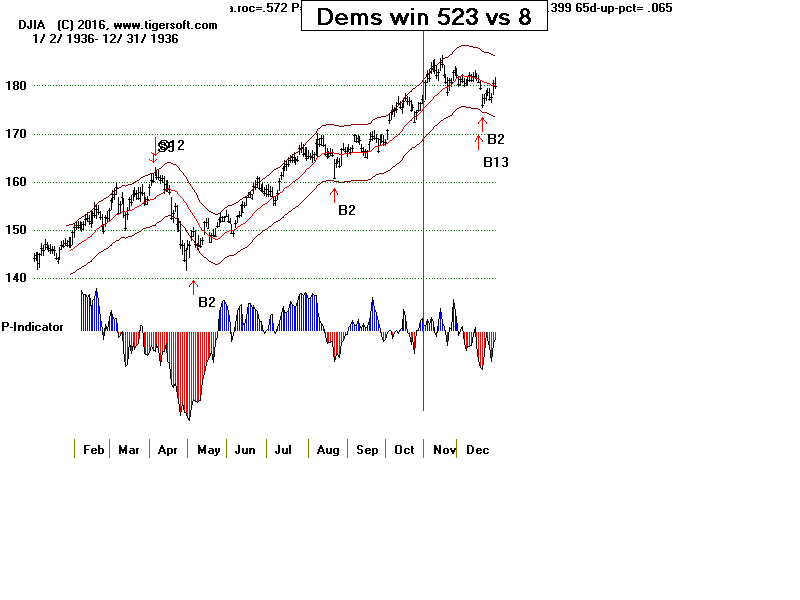
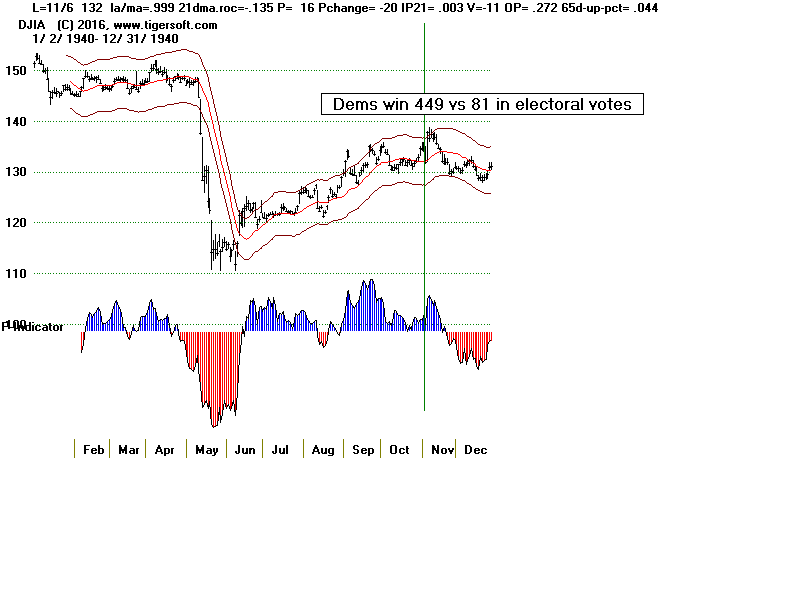
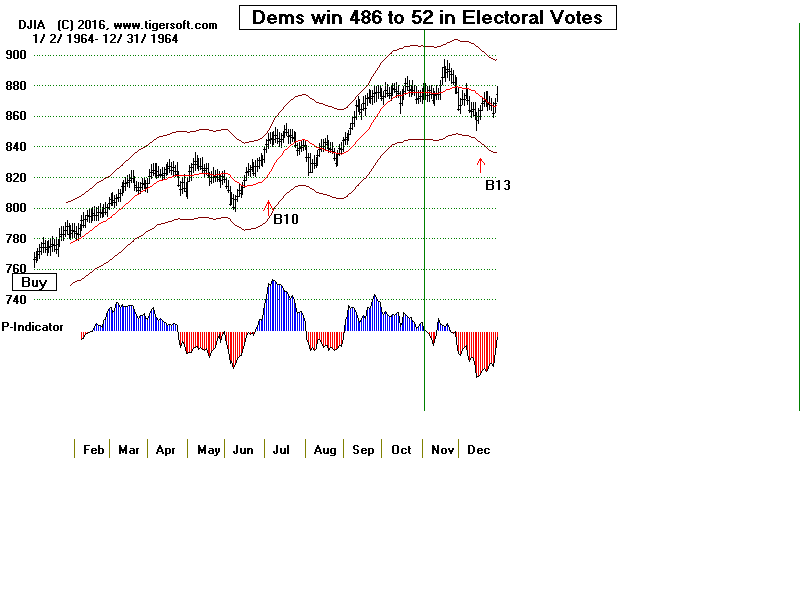
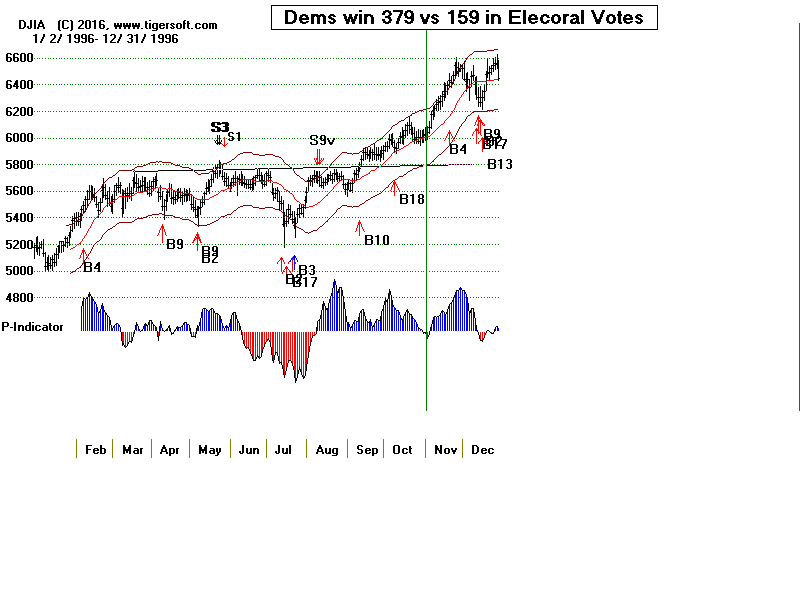
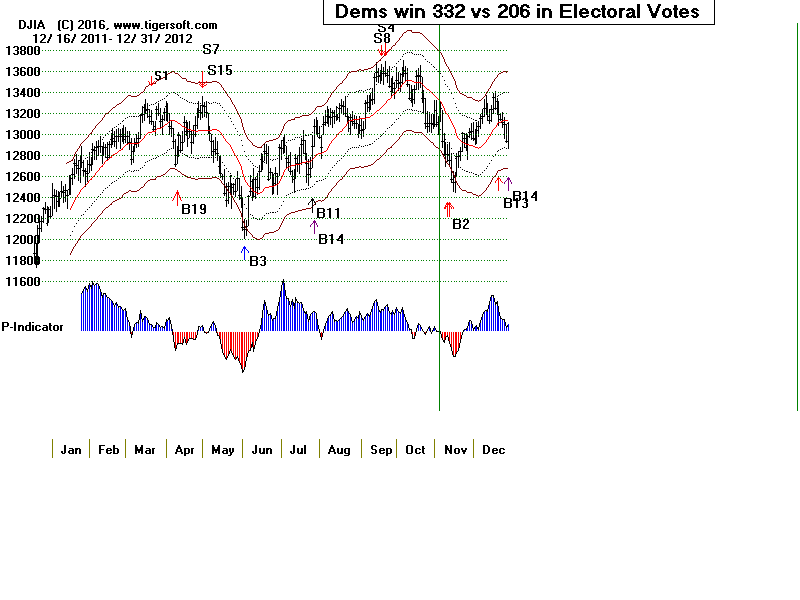
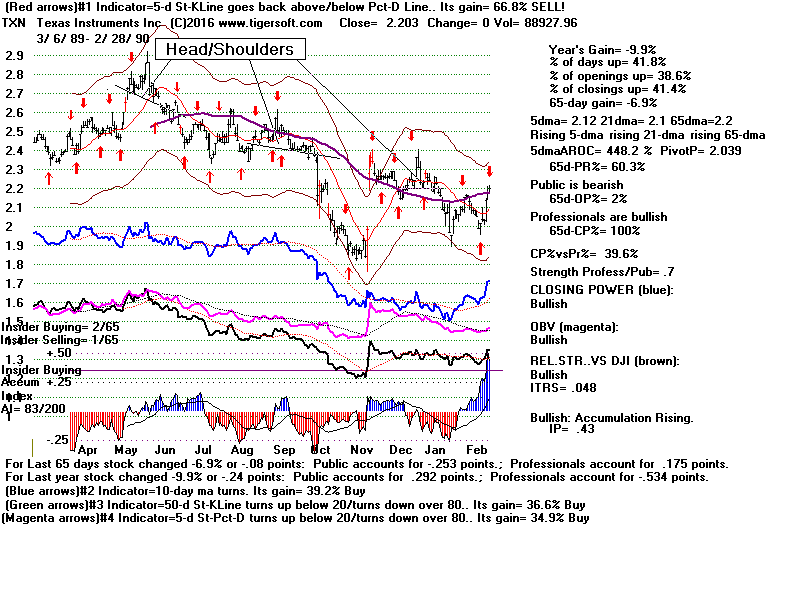
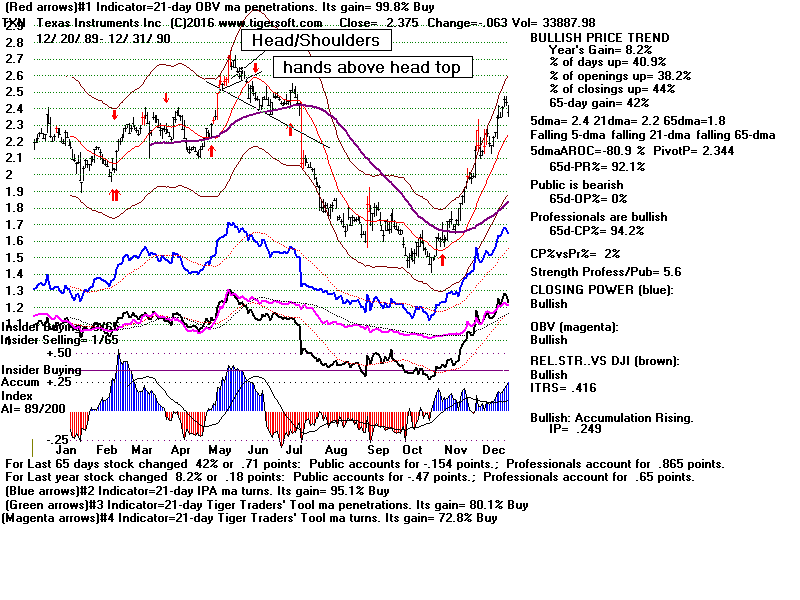
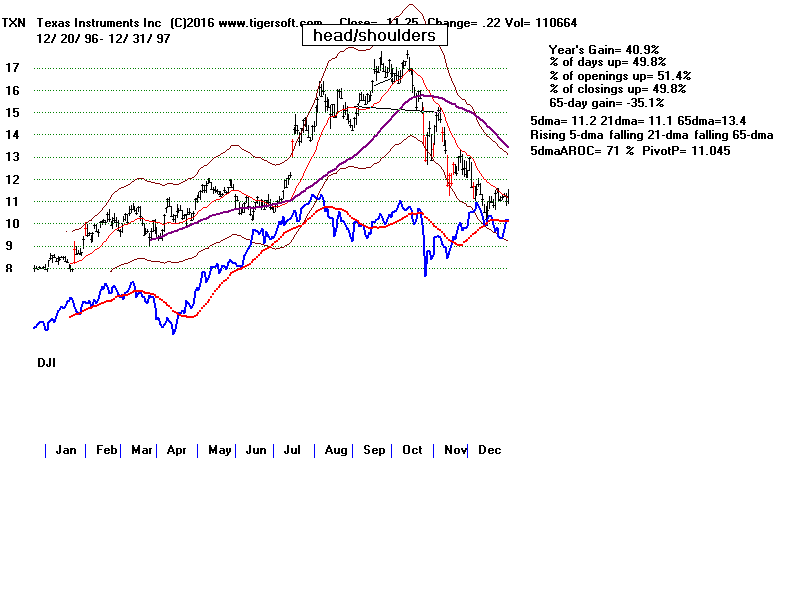
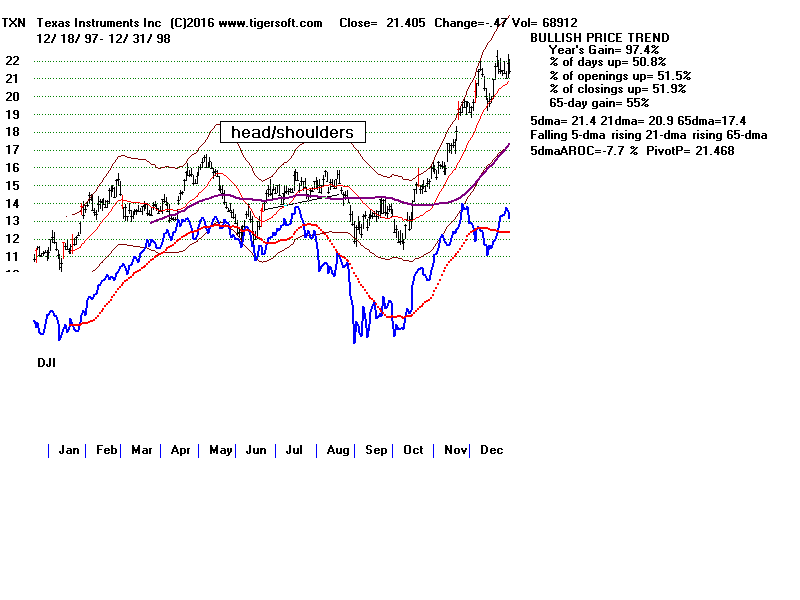
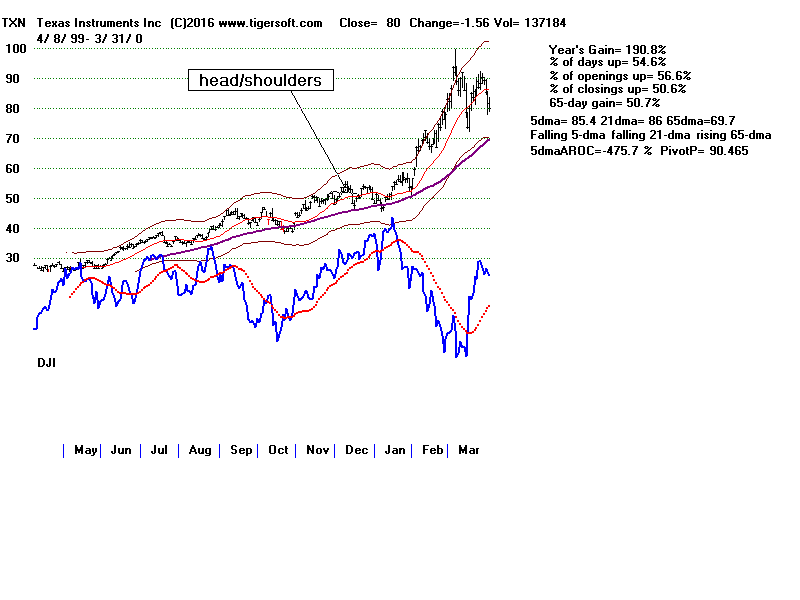
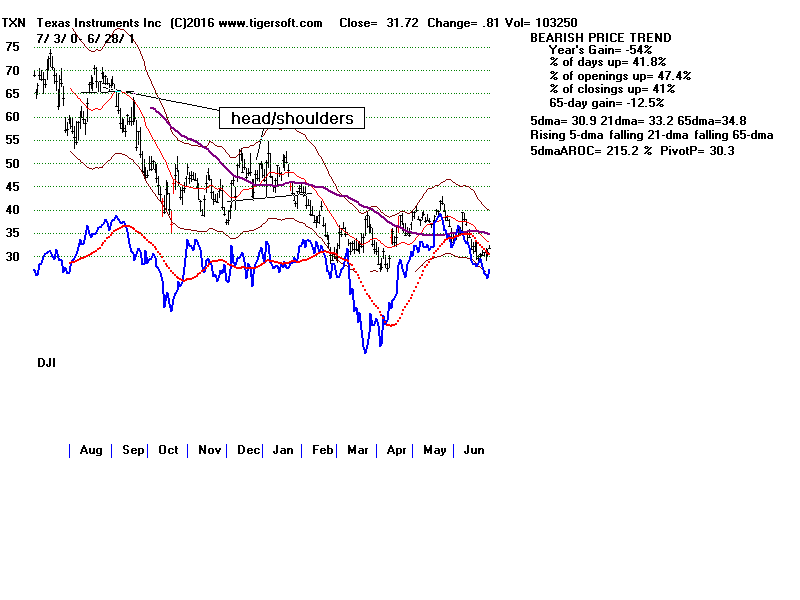
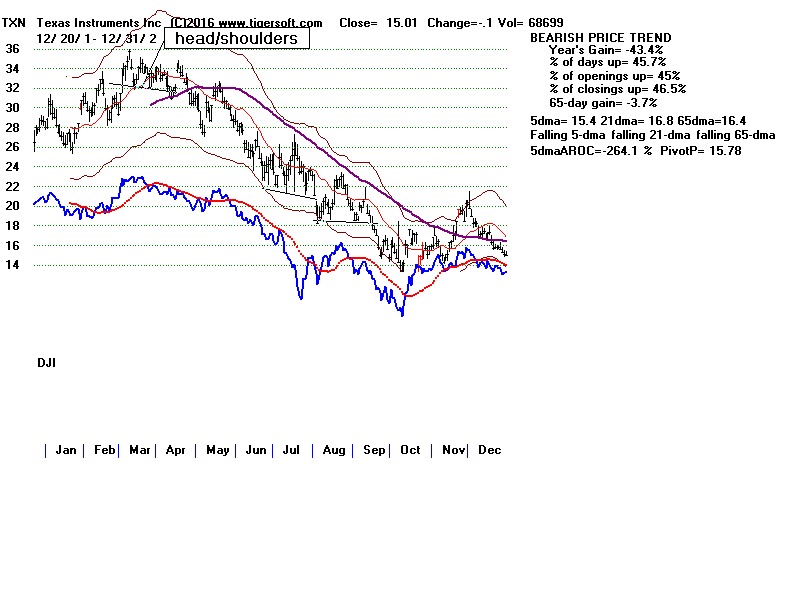
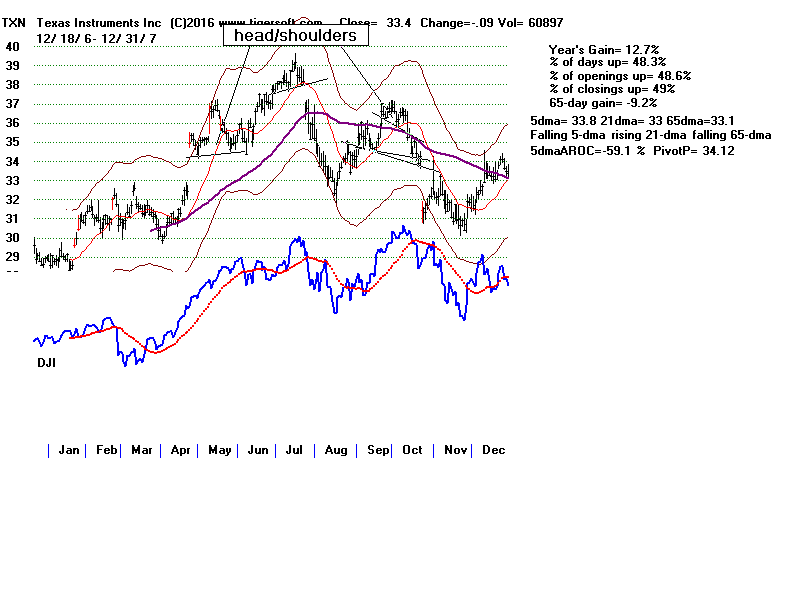
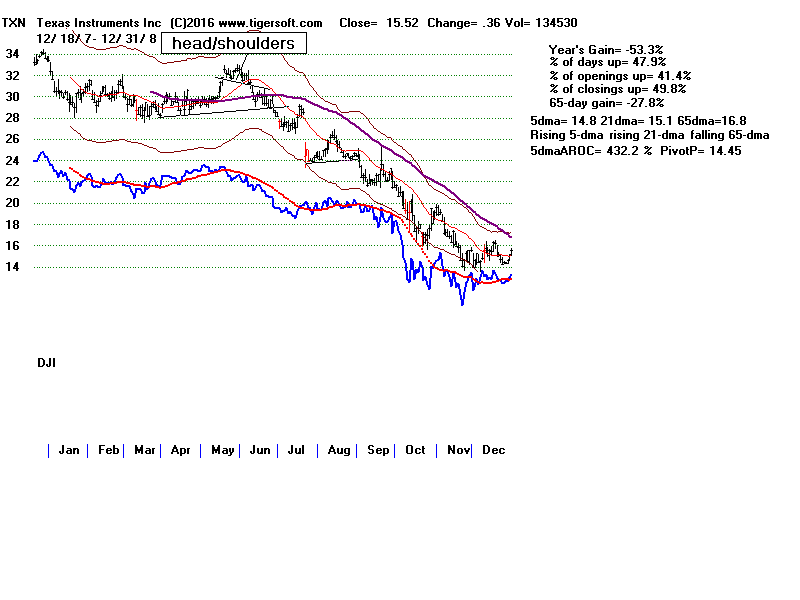
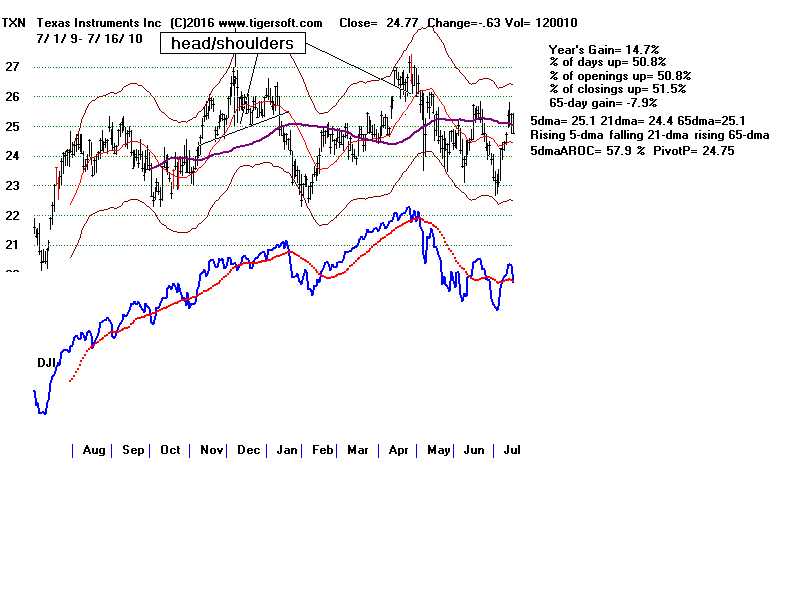
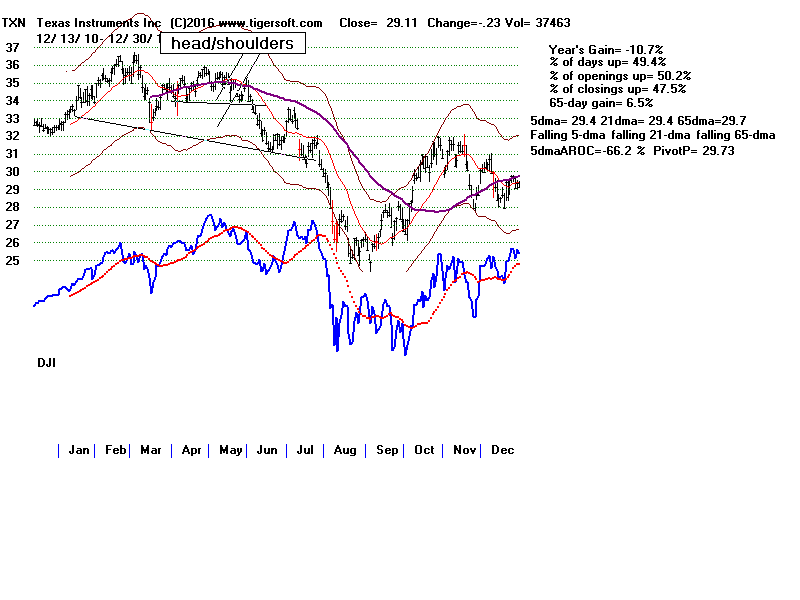
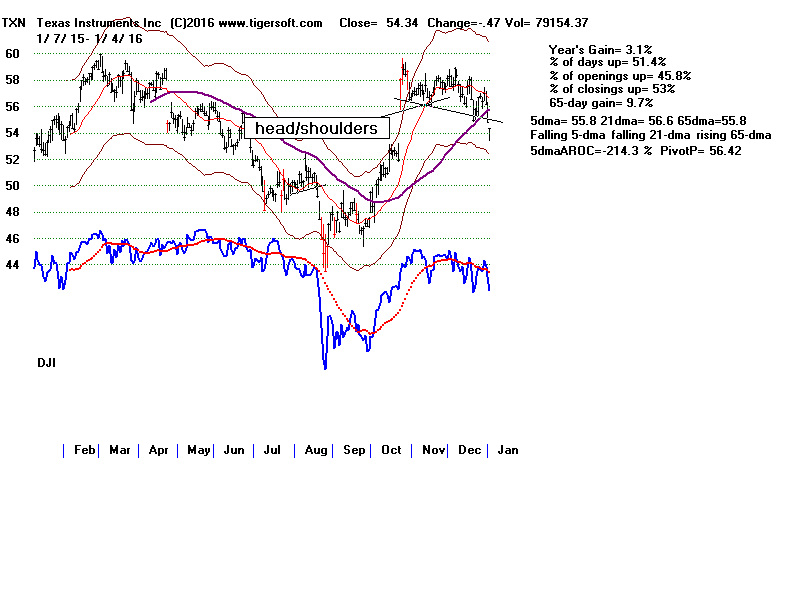
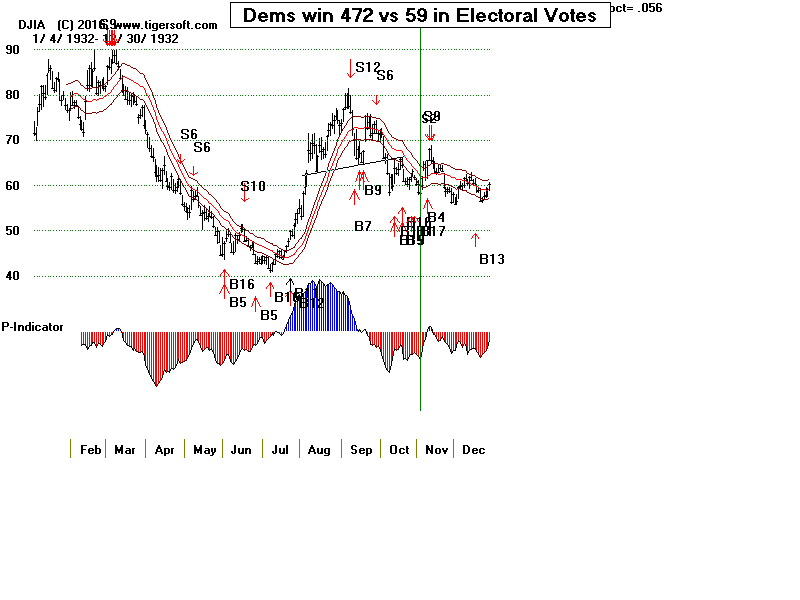
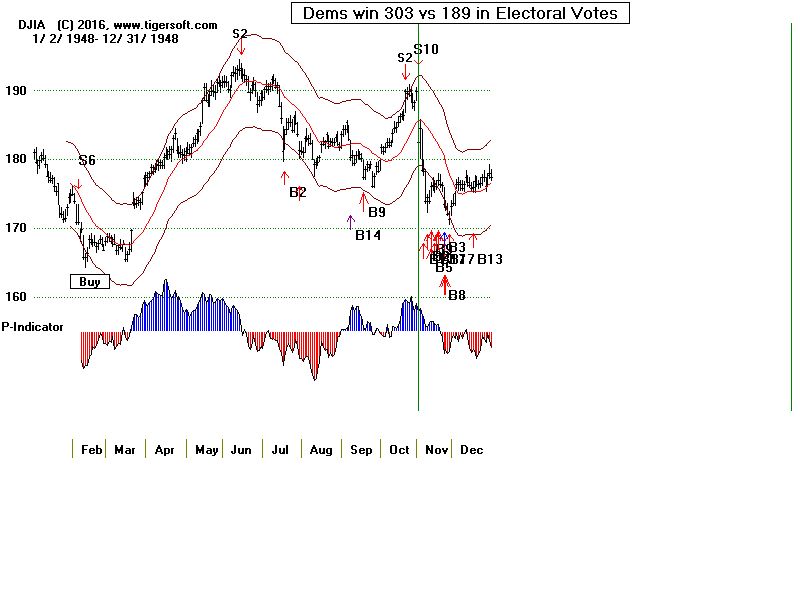
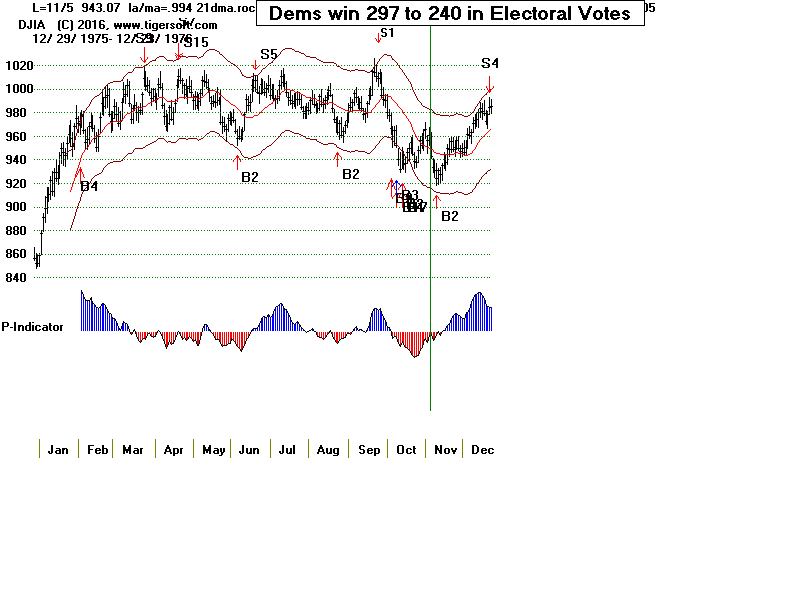
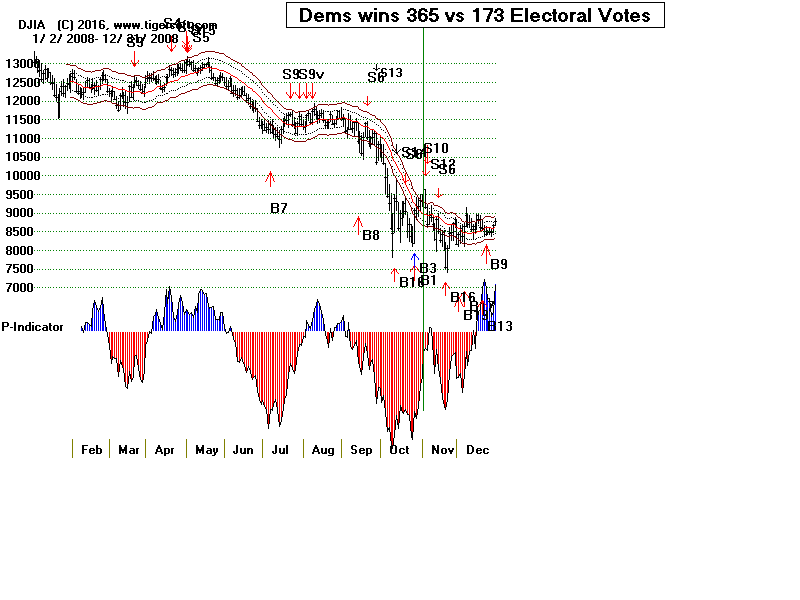
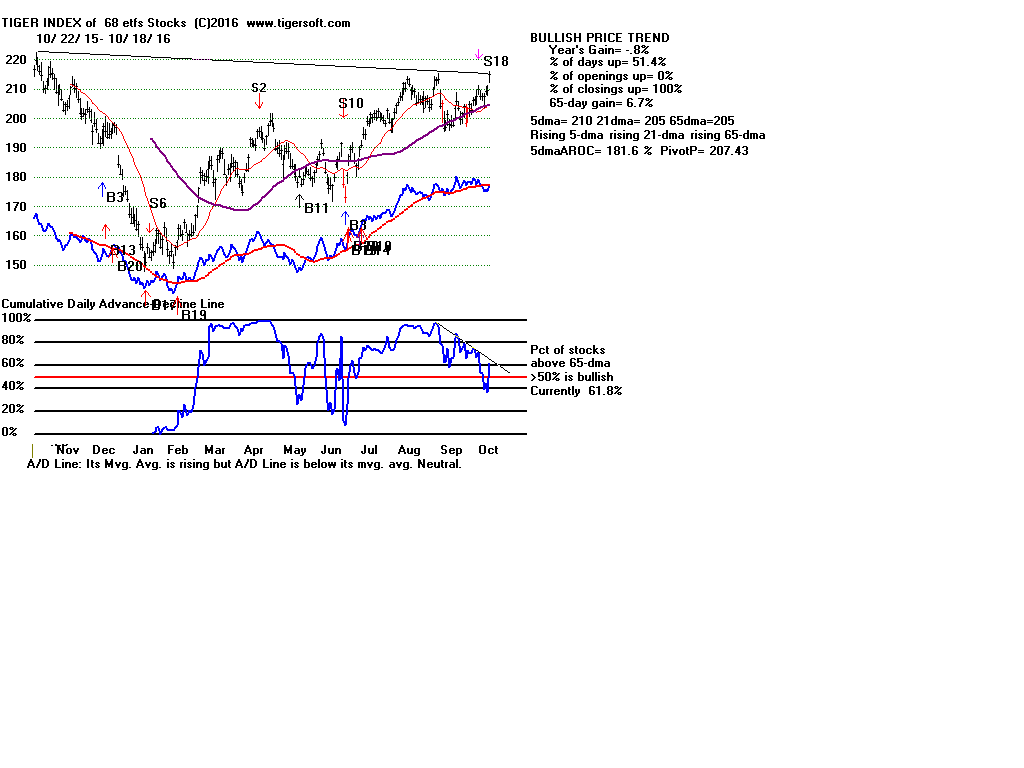
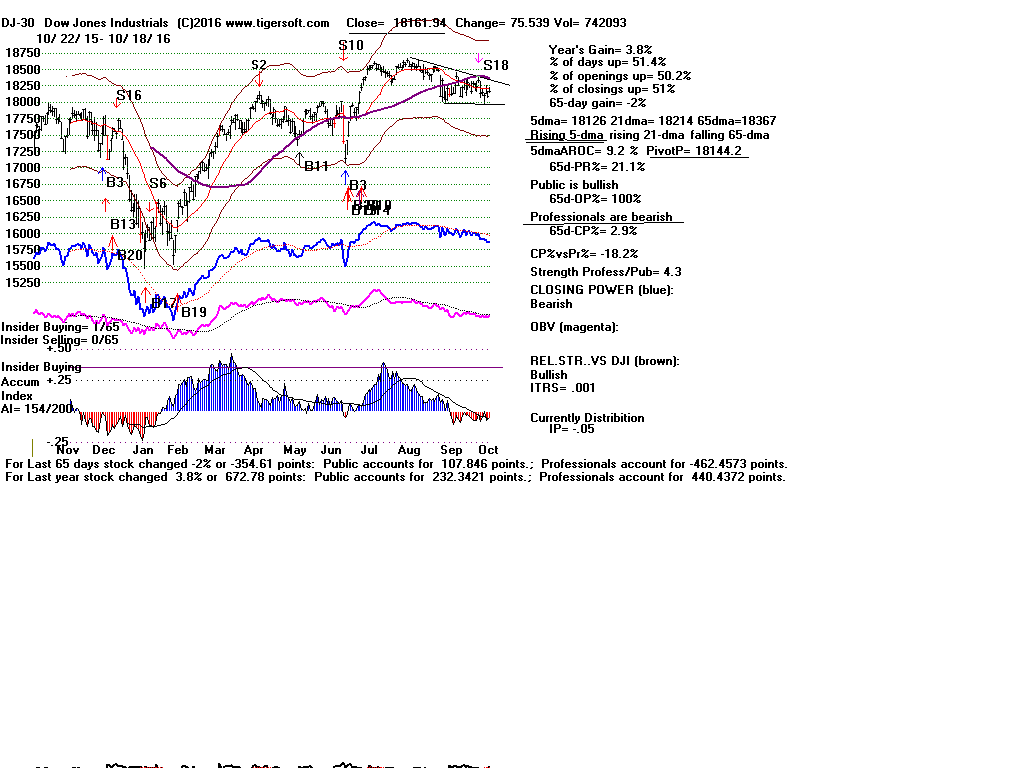
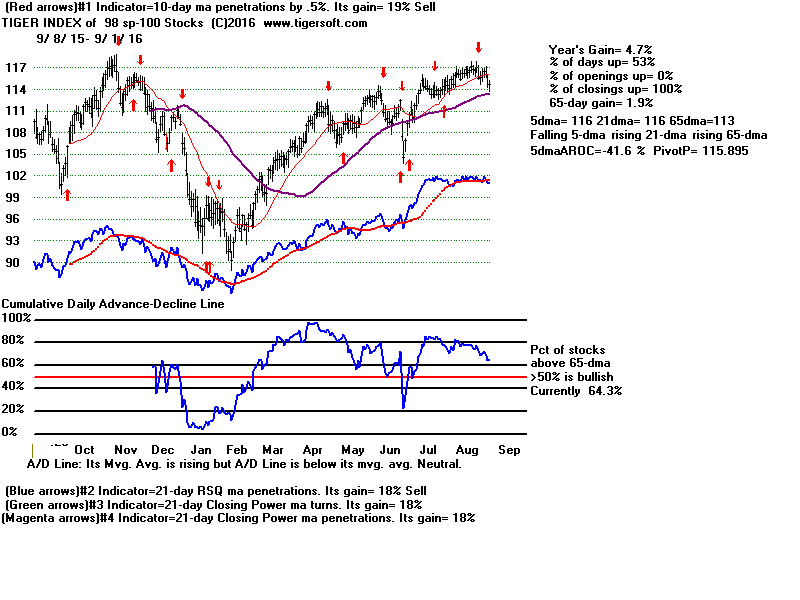
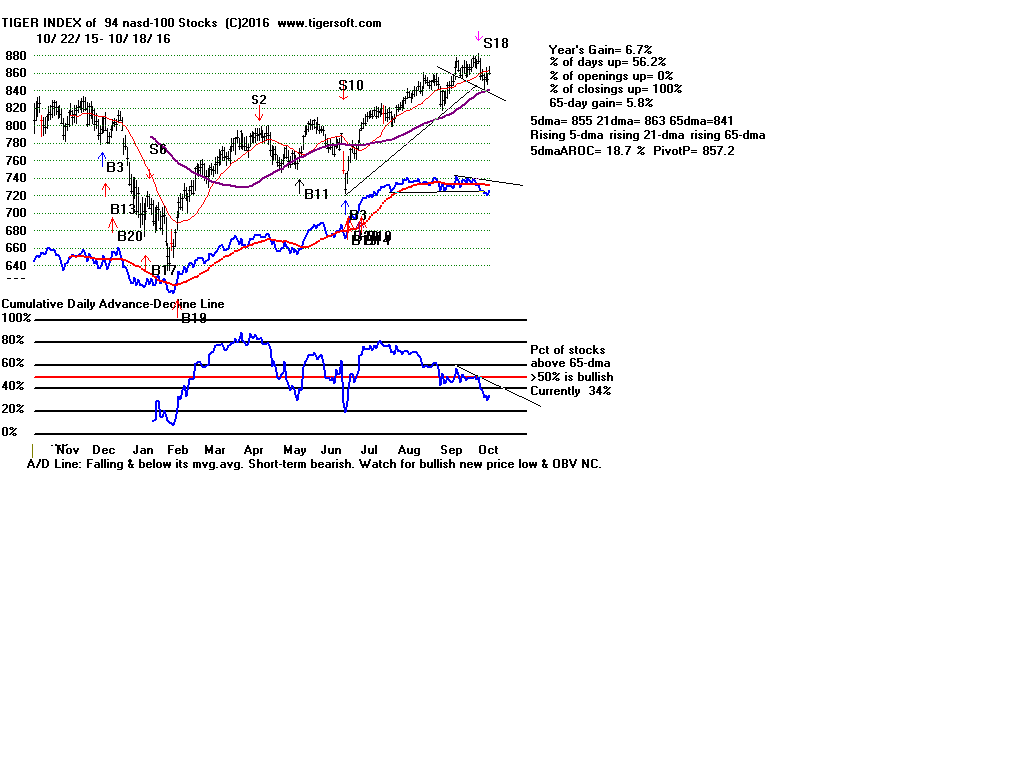
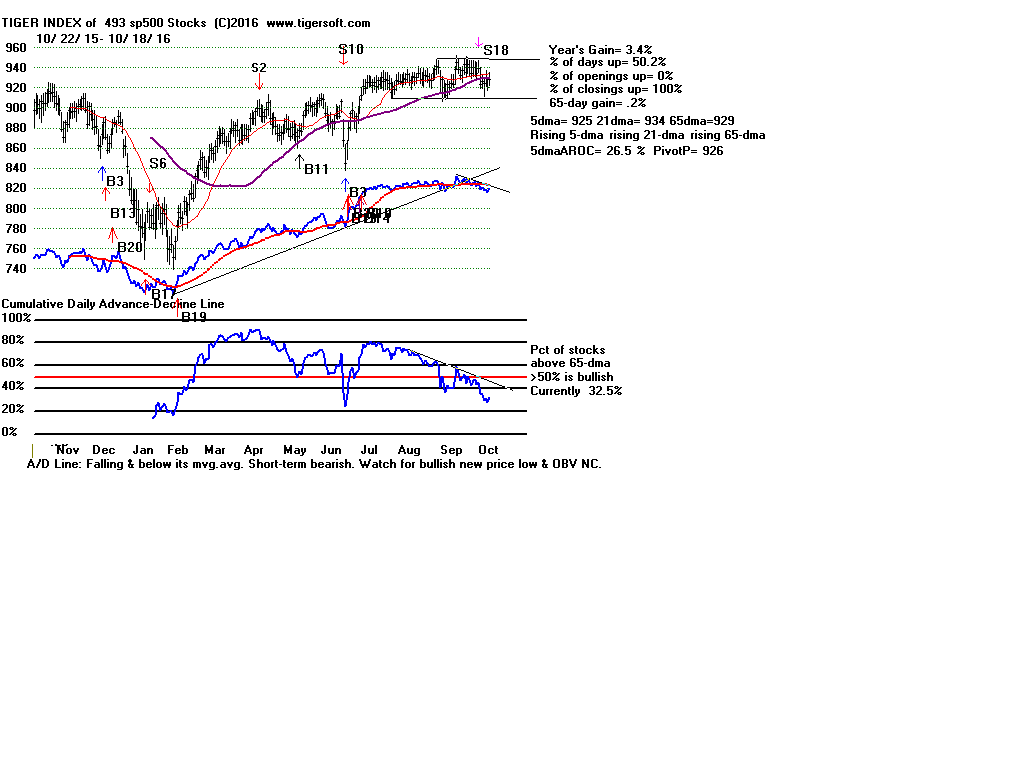
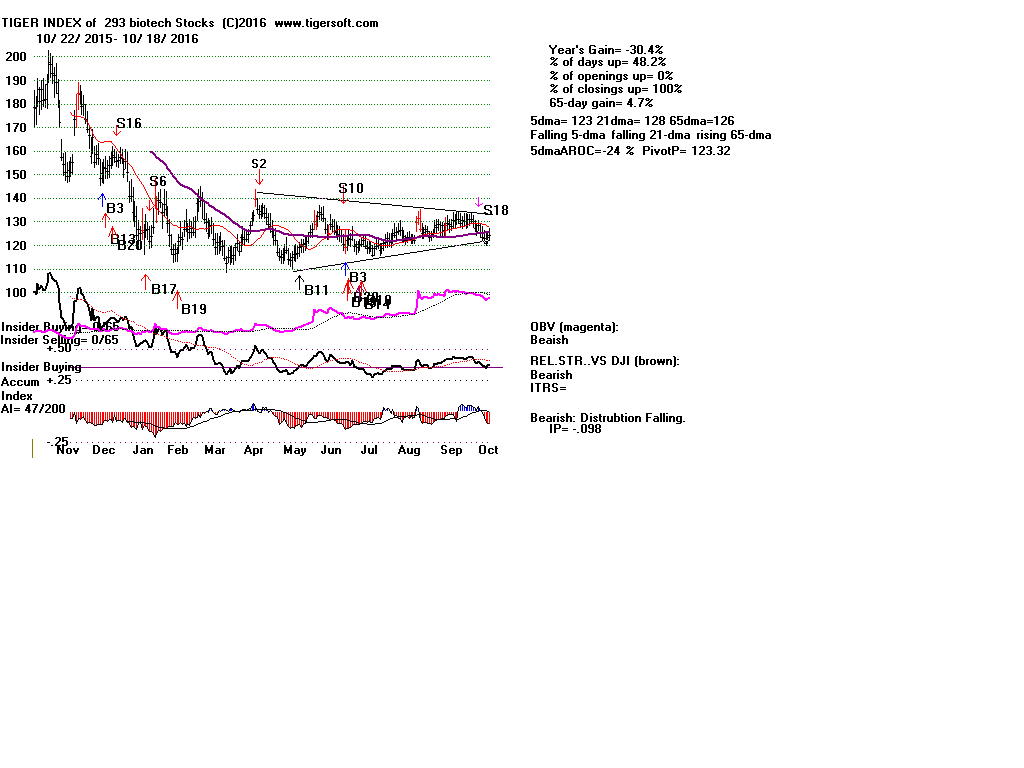
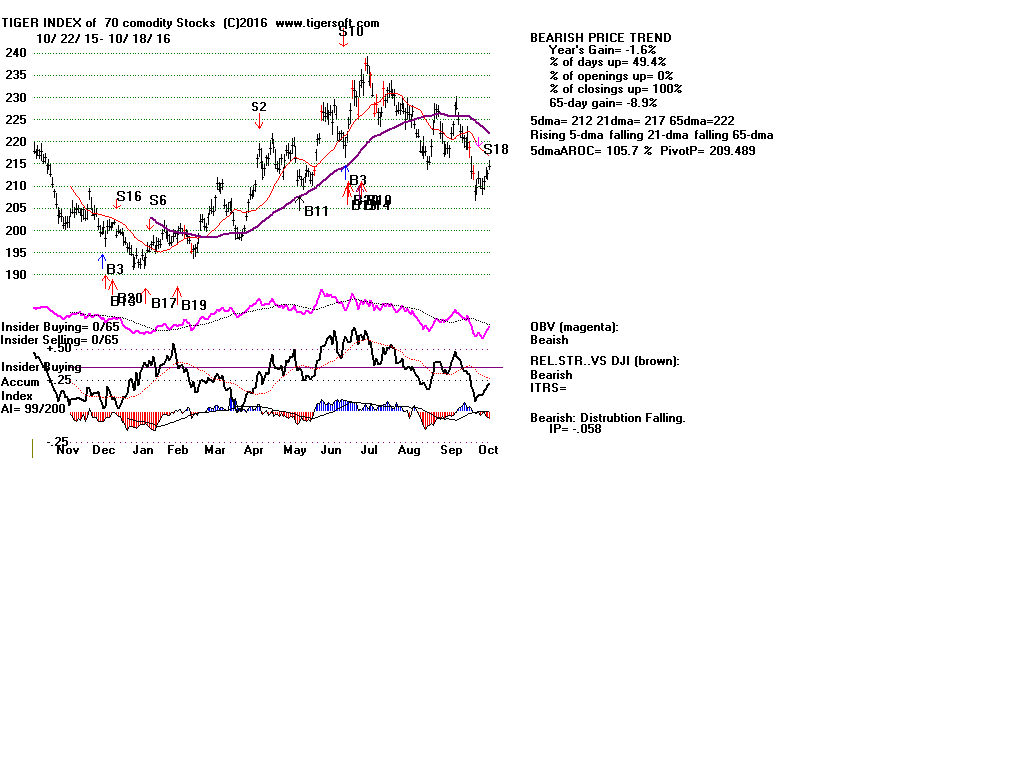
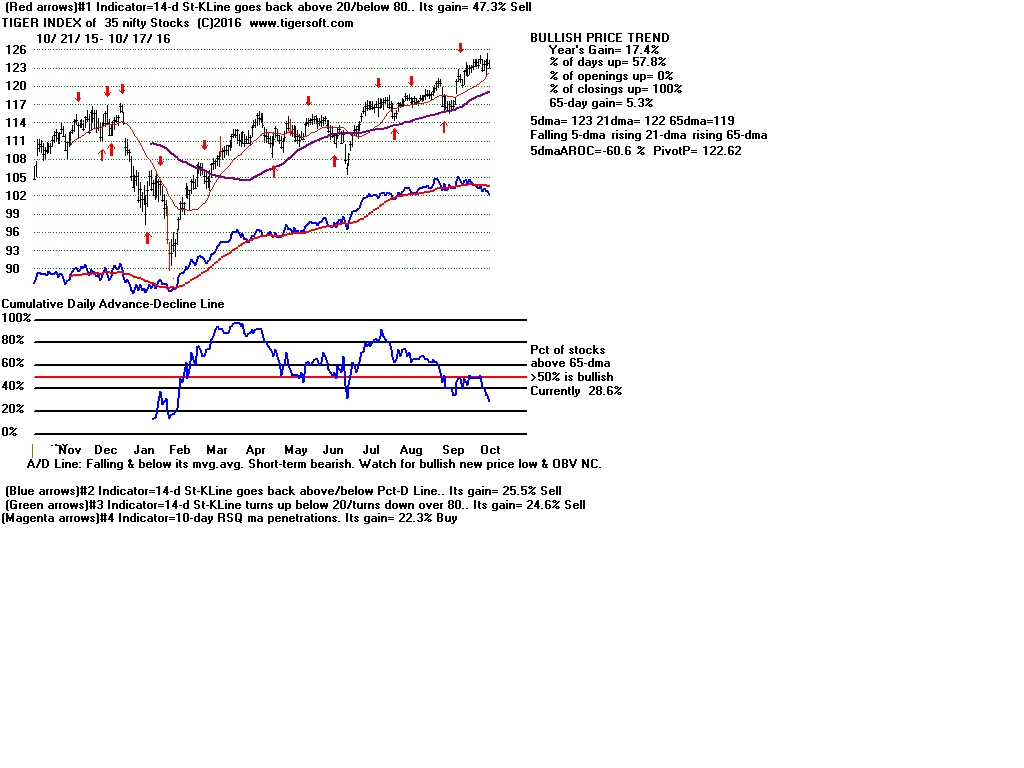
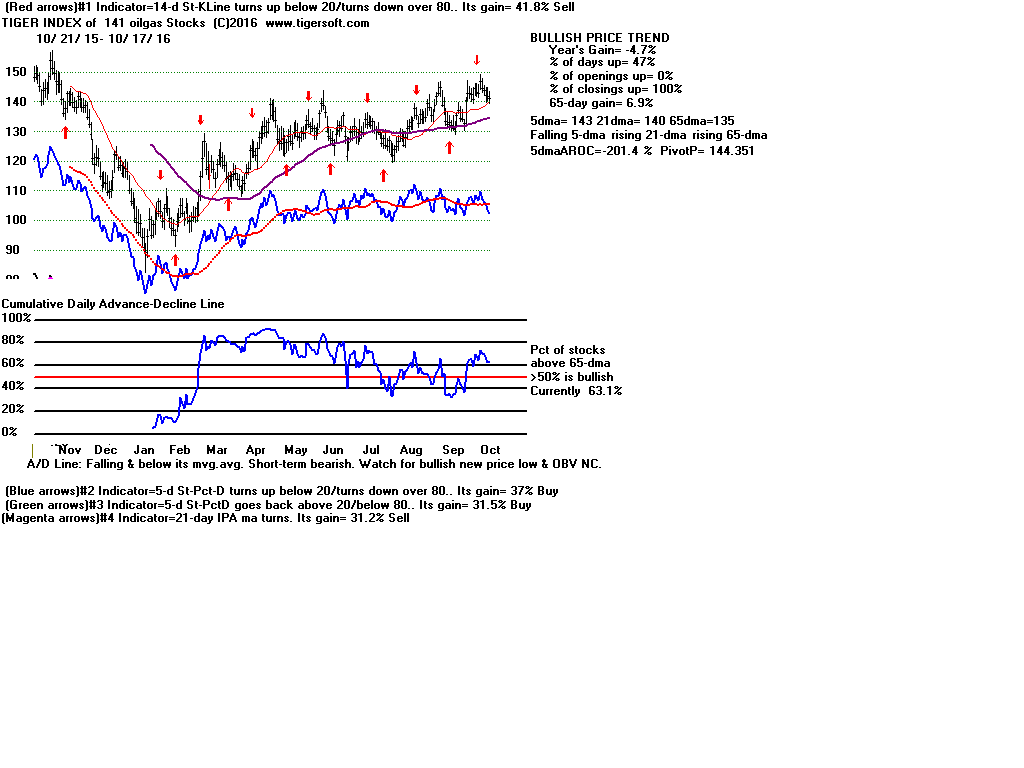
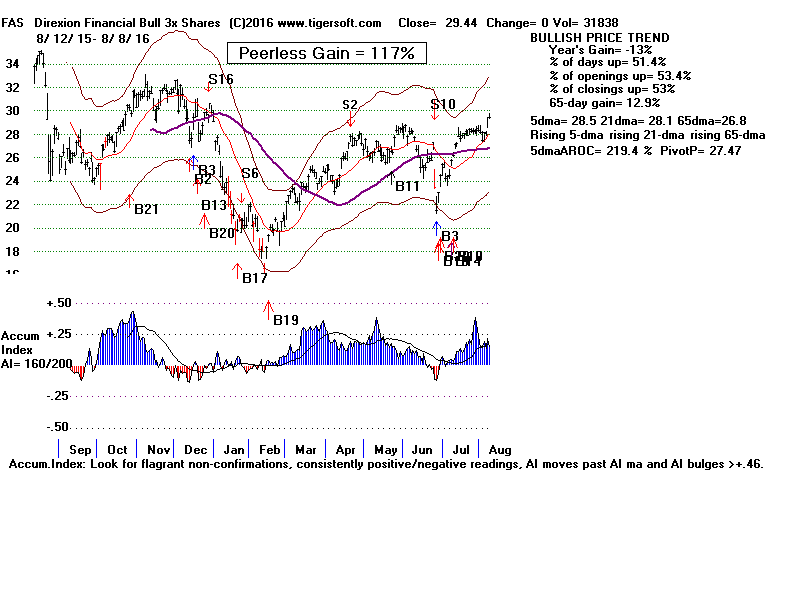
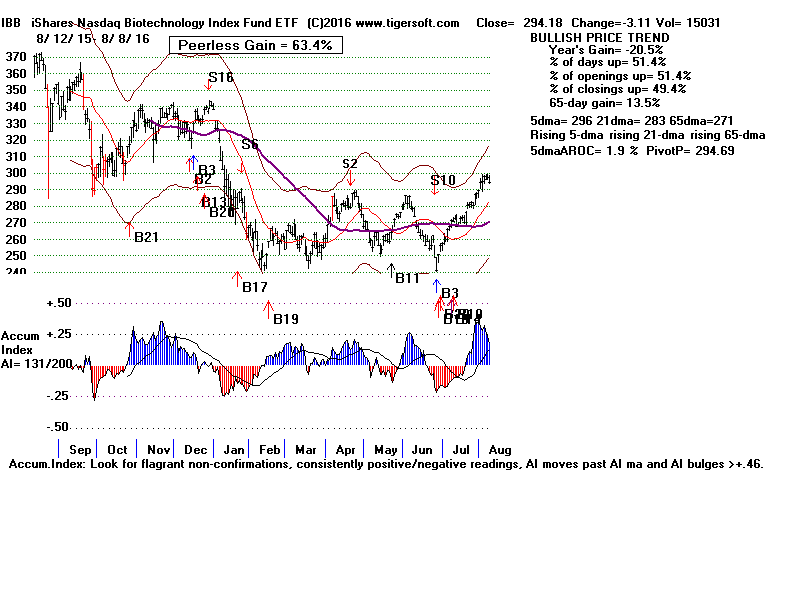
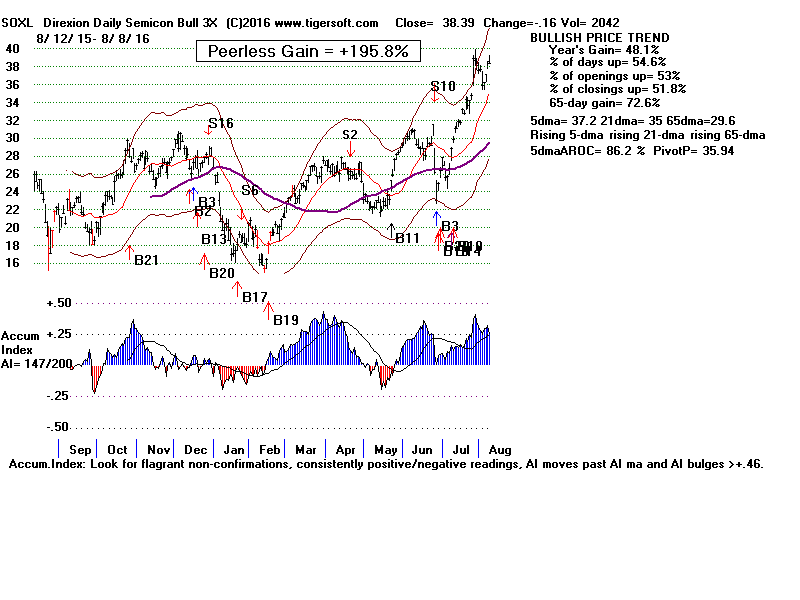
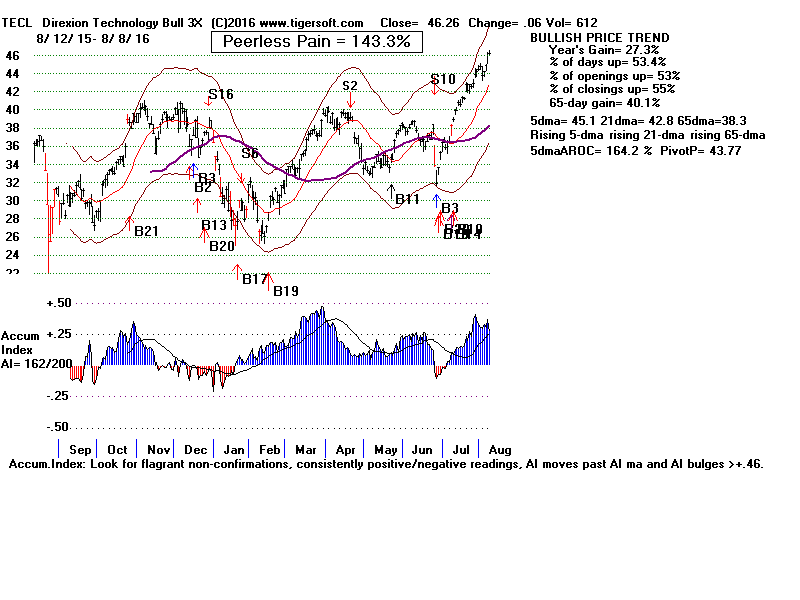
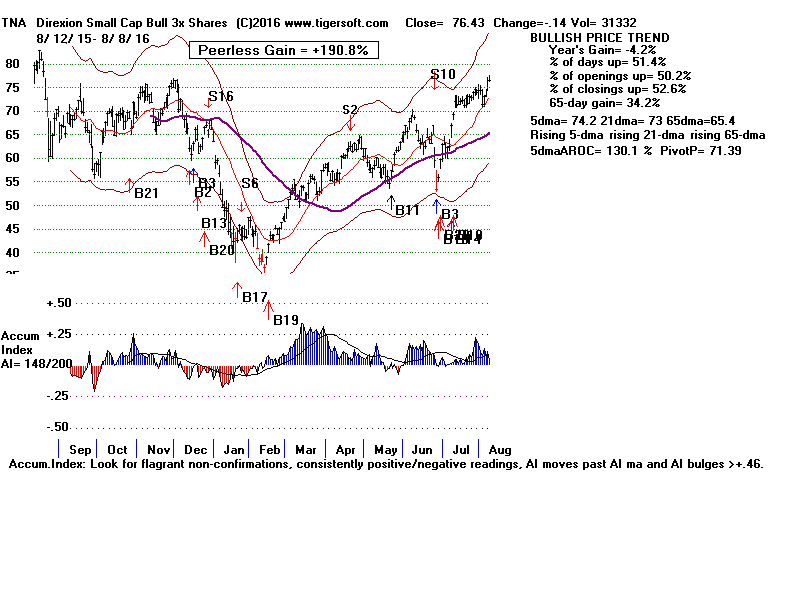