------------ TIGERSOFT/PEERLESS
HOTLINE ----------------
moved

(C) 1985-2017 William Schmidt, Ph.D.
www.tigersoft.com
All rights strictly reserved.
Tiger Software 858-273-5900 PO Box
22784 San Diego, CA 92192 Email
william_schmidt@hotmail.com
-------------------------------------------------------------------------------------------------------------
===> You are here:
www.tigersoft.com/HHH517/INDEX.htm
Earlier Hotlines
www.tigersoft.com/HHH51/XXXIndex.htm
www.tigersoft.com/HHH517/INDEX6917.htm
www.tigersoft.com/HHH517/OLDER.html
www.tigersoft.com/HH747/INDEX.html
www.tigersoft.com/HHLL217/INDEX.html
PREINDEX.html
www.tigersoftware.com/HL/INDEX.html
Most
Recent Hotlines: 2/4/2017 - 2/15/2017
These have somehow become corrupted. Their graphs are missing.
http://www.tigersoft.com/345HLN12/ZINDEX.html
http://www.tigersoft.com/333HLLL/INDEX.html
http://www.tigersoft.com/444HL444/INDEX.html
www.tigersoft.com/119HLPAZ/INDEX.html
http://www.tigersoft.com/888HLAZ/INDEX.html
www.tigersoft.com/821-HL/INDEX.html
http://www.tigersoft.com/816-HLN/INDEX.html
http://www.tigersoft.com/77HL7778/INDEX.html
http://www.tigersoft.com/64HRL/INDEX.html
http://www.tigersoft.com/55HL55/INDEX.html
HELP
A
Guide To Profitably Using The Tiger Nightly HOTLINE
Introduction
to Tiger/Peerless Buys and Sells.
Peerless
Buy and Sell Signals: 1928-2016
Individual Peerless signals explained:
http://tigersoftware.com/PeerlessStudies/Signals-Res/index.htm
http://www.tigersoft.com/PeerInst-2012-2013/
Explanation of each Peerless signal.
http://www.tigersoft.com/PeerInst-2012-2013/
Different
Types of TigerSoft/Peerless CHARTS, Signals and Indicators
Peerless Signals and DJI
Charts - version 7/4/2013
1965
1965-6 1966
1966-7
1967
1967-8
1968
1968-9
1969
1969-70 1970
1970-1
1971
1971-2 1972
1972-3
1973 1973-4
1974
1974-5 1975
1975-6
1976 1976-7
1977
1977-1978
1978
1978-79
1979
1979-80
1980
1980-1
1981
1981-2
1982
1982-1983
1983 1983-1984
1984
1984-1985
1985
1985-1986
1986
1986-1987
1987
1987-8
1988
1988-9 1989
1989-90
1990
1990-1 1991
1991-2
1992
1992-3
1993
1993-4
1994
1994-5
1995
1995-1996 1996
1996-7
1997
1997-8 1998
1998-1999
1999
1999-2000
2000
2000-1 2001
2001-2
2002
2002-3
2003
2003-4
2004
2004-5
2005 2005-6
2006
2006-7
2007
2007-8
2008
2008-9
2009
2009-10
2010
2010-11
2011
2011-12
2012 2012-2013
2013
2013-2014
2014
2014-2015
2015
2015-2016
-----> More HELP LINKS
Documentation for
TigerSoft Automatic and Optimized Signals.
How
reliable support is the DJI's rising 200-day ma?
SPY
Charts since 1994: Advisory Closing Power S7s, Accum. Index, 65-dma, Optimized
Signals.
^^^^^^^^^^^^^^^^^^^^^^^^^^^^^^^^^^^^^^^^^^^^^^^^
1/19/2016 --->
Corrections,Deeper Declines and Bear Markets since 1945.
1/21/2016
--->
High Velocity Declines since 1929
2/12/2016 --->
Presidential Elections Years and Bullish IP21 Positive Non-Confirmations at
Lower Band.
2/12/2016 --->
OBV NNCs on
DJI's Rally to 2.7% Upper Band when DJI's 65-dma is falling.
11/6/2016 --->
Killer Short Selling Techniques:
===>
Order
Here
($42.50)
It's As Easy as 1,2,3
TigerSoft "Combination" Short-Selling...
Easy as 1-2-3 Short Sales
Earlier Q-Answers
QuickSilver
Documentation (1/11/2016)
Our Different Signals
Better
understand the difference between Peerless DJI-based signals,
the one-year optimized red Signals and
the fixed signals based
on technical developments.
Introduction to
Tiger/Peerless Buys and Sells.
Different Types of TigerSoft/Peerless CHARTS, Signals and Indicators
New
TigerPeerless
Installation and Basic Uses' Instruction
(11/25/2016)
See
the re-written materials on TigerSoft Buys and Sells.
A few more pages will be added. But users could print
this
main Installation and Uses' Page for reference.
NEW - 5/7/2017
Trading SPY WITHOUT Peerless - Some Guidelines.
When completed this will be a
new Tiger Trading E-Book.
NEW - 5/10/2017
Examples of "Hands above the Head" top patterns.
===> Please report any broken or
out-of-date links.
william_schmidt@hotmail.com
==============================================================================
==============================================================================
IMPORTANT - The Address for Hotline and Data will
change Early Thursday Morning (24th)
Look for an email giving new address Tuesday afternoon.

===============================================================================
===============================================================================
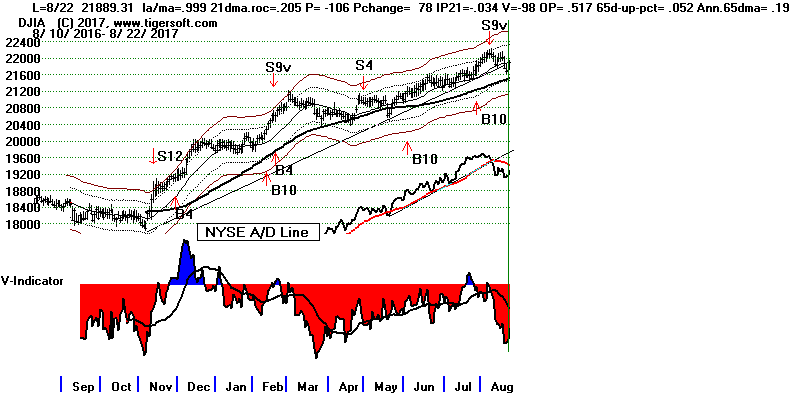
8/22/2017 Peerless remains on a Sell S9-V.
Today's rally appears
to have saved the major ETFs from breaking below their key support
levels. It is not clear that they will attract enough additional buying
to allow all of
them to bounce back and make new highs. All still have
falling Closing Powers; the NYSE A/D Line is still in a minor
downtrend
and our V-Indicator remains very negative, making any DJI vulnerable to
another Sell S9-V. Most stocks are below their key 65-dma support and
MINCPs still outnumber MAXCPs 133 to 99.
A DJI rally of 2%, 440 points up from here, would very probably bring
another S9-V. Perhaps, President Trump will threaten to veto the
legislation|
that Congress produces which allows a larger Budget deficit to try to get his
border wall. Wall Street will not like this. It fell 17% in 2011
after a Sell S9-v
when there was a Congressional stand-off about this. Stay hedged.
Trump threatens to shut down government to build border wall
The foreign ETFs and Chinese stocks offer us a number of good-looking
longs to hold
along with our shorts of weak Oil and Retail stocks plus MDY and IWM
provided they do not break their Closing Power downtrends.
very negative
Next week is seasonally bullish because of the coming 3-day Labor Day
weekend.
The Five Major ETFs
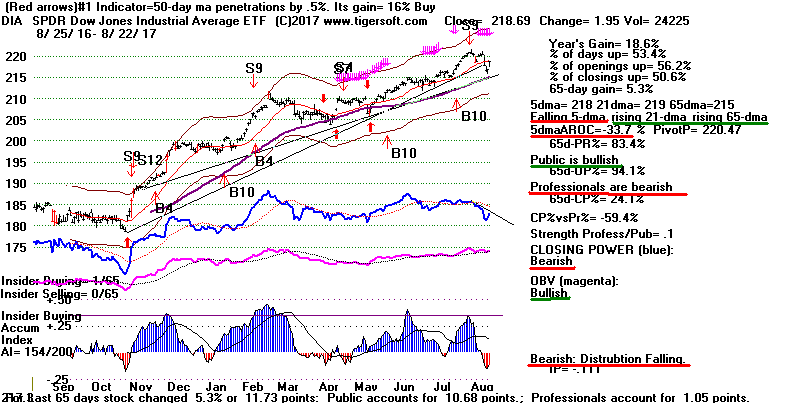
We have to consider them one by one. First, DIA
closed just below its
falling 21-dma. This is apt to act as resistance for tomorrow. DIA
looks
like the strongest of these major ETFs. It did not even retreat as far as
its
65-dma. Another big run by
Boeing could easily take
DIA back to 220. It
would also not take much of a continuation of the rally to destroy the little
top pattern in the DJI-6, the highest priced and most weighty stocks in
in the DJIA.

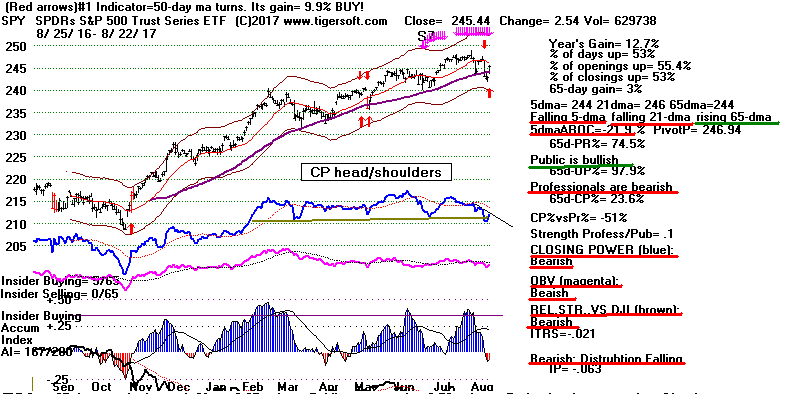
Second, SPY closed back above its flat 65-dma. With
mostly (red)
negative internals, it might bearishly fall back below its 65-dma.
Its falling 21-dma at 246 will likely act as resistance for the rest of
this week. Next week may be better, as this is the week before the
3-day Labor Day weekend.
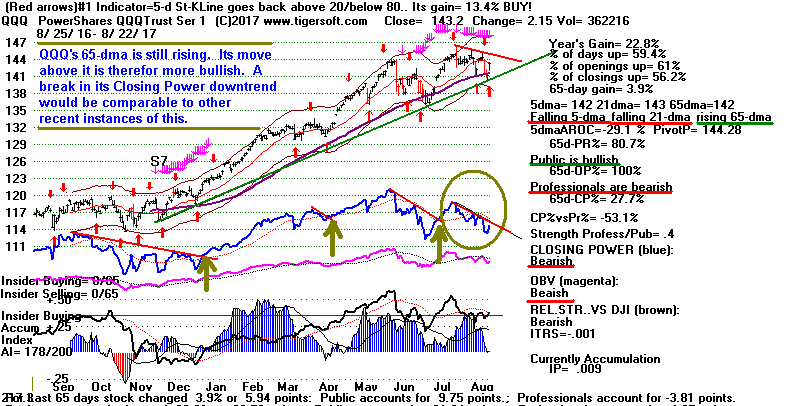
Third, QQQ closed back above its rising 65-dma. A
weak opening
and a very strong close could break its CP downtrend. That should
bring a rally back to its recent highs. Since it has reached its falling
21-dma, tomorrow should bring a decline. I would think next week
it will rally back up to its falling red resistance line.
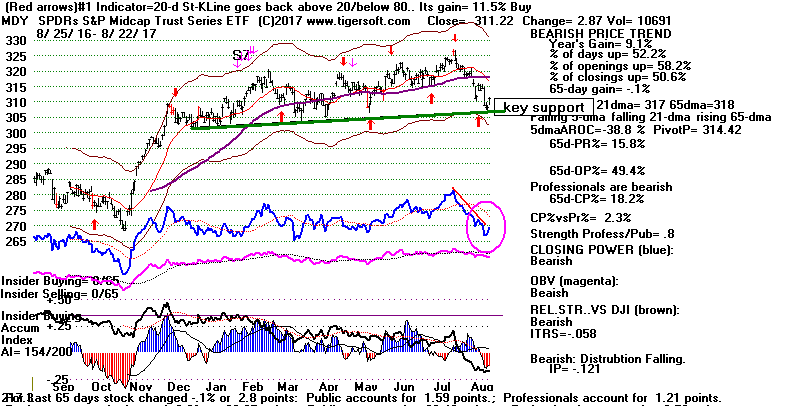
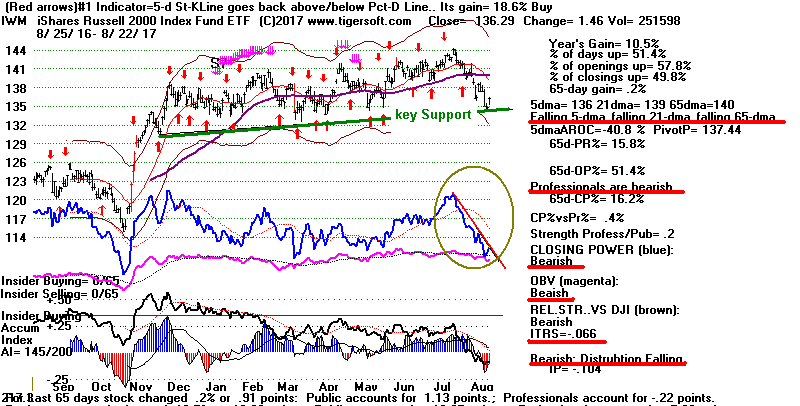
MDY and MDY held at key support.
A close by MDY above its opening
should be considered reason enough to cover our short on MDY.
In that event,
it will most likely rally back to the resistance of its falling 65-dma. IWM's
Closing
Power cannot so easily be violated tomorrow. Hold it short another day.
8/22/2017 Charts
PEERLESS
DJI, Signals, Indicators Daily
DJI Split Volume 10-DayUp/Down
Vol
Hourly DJIA A/D Line
for All Stocks
DJIA
S&P
OEX
NYSE
NASDAQ
COMPQX
with CP
DIA
SPY
QQQ
MDY
IWM-TNA
Short Term Interest Rates
DJI-Utilities
DJI-Transp
Nifty-30 Index
CrudeOil FAS
GLD
BBH
IBB
JETS
JNUG
KOL
NUGT
OIH
OIL
RSX
RETL SDS
SLV
SOXL
TECL
TMF
TNA XIV YINN
Commodities: JJC, NIB,
WEAT UUP (Dollar)
To
STOCKS' CHARTS
AAPL ADBE
ALXN
AMAT
AMGN
AMZN BA
BABA
BIDU
CAT
FB
GOOG
GS
HD
IBM JPM M
(Macy's) MASI
MSFT
NVDA QCOM
TSLA
TXN
new
CMG (Chipotle),
LRCX, SWKS,
TOWN
Ohers REN, CVE
and SWN (very low AI/200 stocks)
Links
fixed
8/22/2017
Bullish MINCPs
Bearish
MINCPs
 RANKING OF KEY DIRECTORIES BASED PCT.OF STOCKS ABOVE 65-DMA
               8/22/17
Bearish =25
Bullish =20
---------------------------------------------------------------------------------------
Directory     Current       day-1         day-2         day-3         day-4         day-5
----------------------------------------------------------------------------------------
ETFS           .863          .787          .742          .727          .863          .803
UTILITY        .822          .8            .8            .733          .822          .822
BEVERAGE       .8            .8            .8            .8            .85           .85
BONDFUND       .794          .767          .714          .642          .651          .517
BIGBANKS       .714          .285          .428          .428          .857          .857
GOLD           .698          .716          .716          .698          .679          .509
N=6
--------------------------------------------------------------------------------------------
GAMING         .642          .464          .535          .607          .642          .678
CHINA          .634          .682          .65           .634          .666          .634
DOWJONES       .633          .533          .533          .566          .766          .733
NIFTY          .633          .633          .633          .666          .7            .7
INSURANC       .617          .529          .588          .558          .676          .676
DJI-13         .615          .461          .538          .538          .692          .692
COMODITY       .605          .549          .605          .507          .535          .549
MILITARY       .577          .466          .488          .533          .577          .555
INDMATER       .561          .53           .5            .469          .54           .469
HOMEBLDG       .555          .555          .5            .611          .722          .722
SP-100         .546          .422          .412          .453          .659          .597
SOLAR          .526          .526          .684          .578          .631          .578
INDEXES        .504          .373          .378          .415          .584          .574
SP500          .501          .426          .424          .438          .547          .527
N=14
------------------------------------------------------------------------------------------
RUS-1000       .466          .414          .415          .424          .519          .5
REIT           .461          .466          .393          .455          .502          .507
FINANCE        .45           .373          .406          .428          .538          .538
NASD-100       .44           .376          .397          .397          .548          .494
BIOTECH        .437          .366          .362          .389          .433          .401
MORNSTAR       .436          .34           .352          .365          .525          .487
CHEM           .43           .361          .347          .291          .444          .402
ELECTRON       .412          .309          .36           .324          .453          .412
SEMI           .396          .31           .362          .318          .474          .448
GREEN          .387          .322          .387          .387          .548          .483
AUTO           .375          .325          .325          .325          .325          .35
INFRA          .363          .272          .363          .363          .454          .454
SOFTWARE       .359          .343          .328          .328          .437          .359
TRANSP         .35           .25           .25           .25           .5            .45
N=14
-----------------------------------------------------------------------------------------
HACKERS        .333          .333          .277          .222          .388          .277
PIPELINE       .333          .333          .222          .222          .222          .222
COMPUTER       .28           .2            .28           .32           .4            .4
RETAIL         .275          .241          .241          .241          .275          .224
OILGAS         .227          .183          .189          .164          .202          .208
REGBANKS       .222          .138          .111          .111          .277          .333
EDU            .166          .166          .166          .166          .166          .166
HOSPITAL       .142          .142          .142          .142          .142          .142
COAL           .111          .111          .222          .111          .111          .111
JETS           .111          .111          .111          .111          .222          .111
FOOD           .071          0             0             .071          .142          .142
N=11
===============================================================================
8/21/2017 Peerless remains on a Sell S9-V.
Short-term, a rally up off key support is being
attempted, even though Big Banks, Oil/Gas stocks, Retailers and Semi-Conductor
stocks remained weak today. The falling Tiger Closing Powers and Day
Trader Tools
warn us not to trust the higher opening tomorrow.
Hold short MDY and MDY even though they will probably bounce tomorrow.
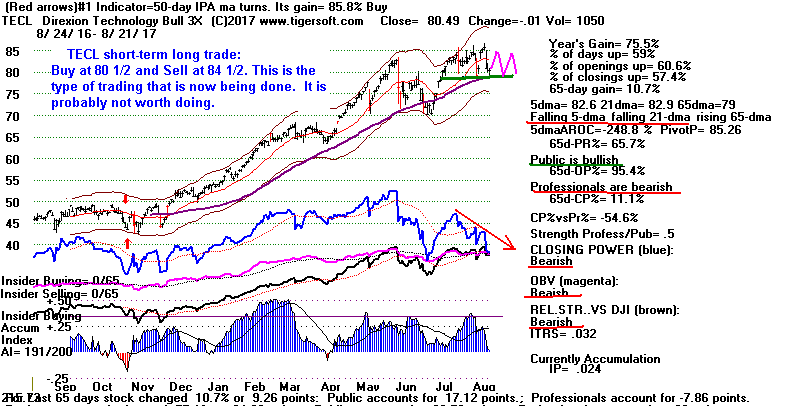
Very short-term traders, if you want to go long an ETF, buy TECL but place a
protective sell stop just below its recent support. See the chart below.
I suspect
that TECL will bounce narrowly up and down in this narrow range for the next
two-three weeks.
The leadership now is entirely defensive.
Look at the groups that still have more
than two thirds of their stocks above the 65-dma. Rallying Chinese stocks,
foreign ETFs
and Utilities will likely not make for much of a rally in US stocks. A 20%
advance in
Gold would actually be a fairly reliable bearish sign.
% of Stocks Various Groups above Their 65-dma.
BEVERAGEs 80%
UTILITies
80%
BIG 5 MILITARY 80% (BA, GD, LMT, NOC and RTN)
FOREIGN ETFs 76.7%
BONDFUND 76.7%
GOLDs
69.8%
CHINA Stocks 68.2%
Watch The FED and the Dollar.
They Hold The Keys Now To The Market.
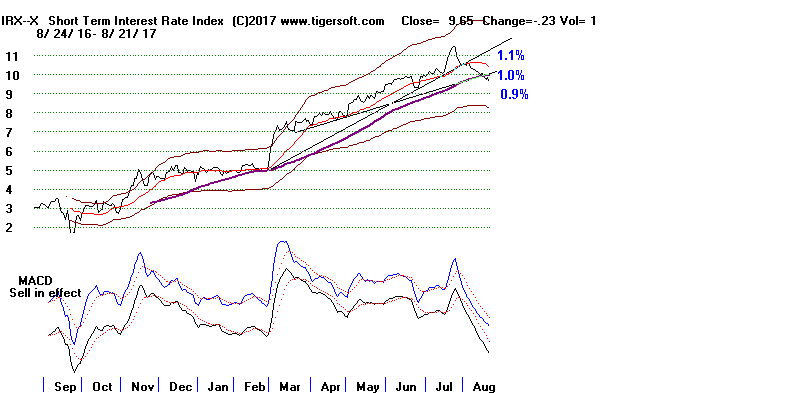
Why is the Fed too scared to raise rates
now? There are three reasons:
Inflation
is still below 2.5%. They fear raising rates in a deflationary period could
bring a serious
recession. Secondly, the FED worries about precipitating a bond collapse.
And thirdly,
Yellen fears that a stock market decline might not be easily managed.
There are too
many leveraged negative trading vehicles. In the hands of huge hedge funds
with computerized
sell programs, her fears are probably quite justified.
So without rates going up, the market
is on hold.
The good news in this is that this will allow Earnings to play catch up with the
high PEs
in growth-stock. It may even allow
low interest rates for another few months and
this will probably hold up the weak-Dollar and dividend plays.
Holding the strong
foreign ETFs has to be recommended in this environment.
But eventually, the FED will defend the Dollar even if Inflation remains
around 2%.
The reason is that the big US Banks will put great pressure on the FED behind
the
scenes if hot international funds are drawn in any great quantity to European
banks
because of the EURO's strength vis-a-vis the Dollar. In all this, the FED
is being saved
by the still weak Pound.
Charts of Short-Term Rates, The Falling Dollar and The
Rising Euro
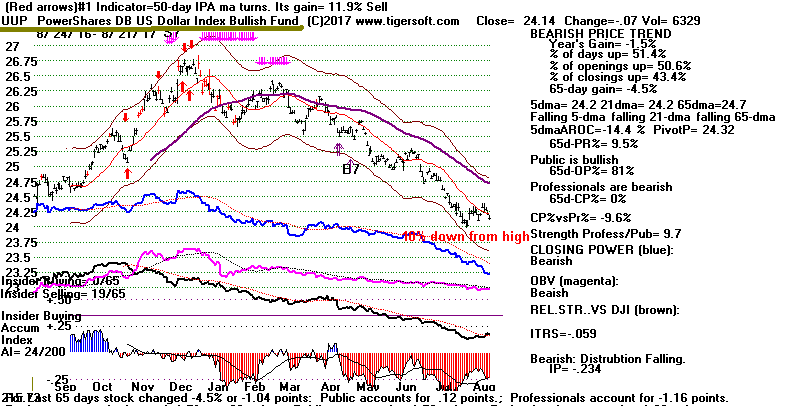
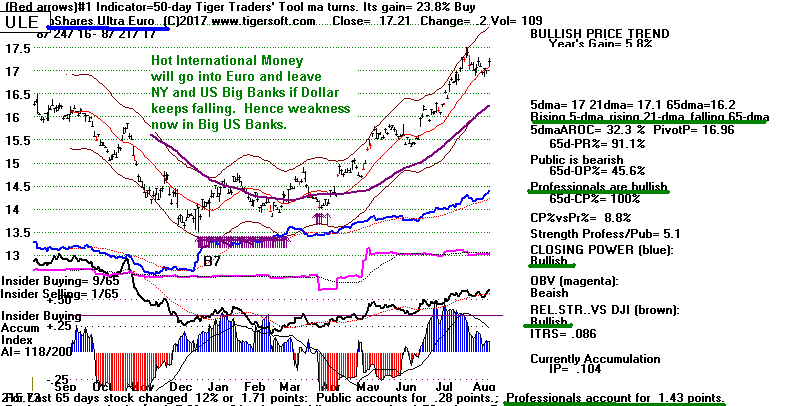
The key now is to see watch a handful of key ETFs and stocks to see if they
can hold up and not break key support. First, SPY is still below its
flattening 65-dma.
If its rally fails to get back above this moving average and then starts down,
there
will be trouble. QQQ is similarly situated.
Secondly, watch IWM and MDY. Bulls know that they must not be allowed to
break "
below their horizontal support. Given their negative relative strength
ITRS numbers and
falling Closing Powers, I would hold them short.
Third, watch to see if Biotech plays IBB and AMGN break their necklines at 302
and.
Fourth, watch the DJI Transportation Index. It is threatening to break a
head/shoulders
neckline.
Fifth, watch the necklines of AMD (11.8), AMZN (947), CAT (112) and FB (165).
8/21/2017 Charts
PEERLESS
DJI, Signals, Indicators Daily
DJI Split Volume 10-DayUp/Down
Vol
Hourly DJIA A/D Line
for All Stocks
DJIA
S&P
OEX
NYSE
NASDAQ
COMPQX
with CP
DIA
SPY
QQQ
MDY
IWM-TNA
Short Term Interest Rates
DJI-Utilities
DJI-Transp
Nifty-30 Index
CrudeOil FAS
GLD
BBH
IBB
JETS
JNUG
KOL
NUGT
OIH
OIL
RSX
RETL SDS
SLV
SOXL
TECL
TMF
TNA XIV YINN
Commodities: JJC, NIB,
WEAT UUP (Dollar)
To
STOCKS' CHARTS
AAPL ADBE
ALXN
AMAT
AMGN
AMZN BA
BABA
BIDU
CAT
FB
GOOG
GS
HD
IBM JPM M
(Macy's) MASI
MSFT
NVDA QCOM
TSLA
TXN
new
CMG (Chipotle),
LRCX, SWKS,
TOWN
Ohers REN, CVE
and SWN (very low AI/200 stocks)
8/21/2017
Bullish MINCPs
Bearish
MINCPs
 RANKING OF KEY DIRECTORIES BASED PCT.OF STOCKS ABOVE 65-DMA
              8/21/17
Bearish = 32
Bullish = 13
---------------------------------------------------------------------------------------
Directory     Current       day-1         day-2         day-3         day-4         day-5
----------------------------------------------------------------------------------------
BEVERAGE       .8            .8            .8            .85           .85           .75
UTILITY        .8            .8            .733          .822          .822          .755
ETFS           .779          .735          .72           .852          .794          .823
BONDFUND       .767          .714          .642          .651          .535          .669
GOLD           .698          .716          .716          .698          .49           .603
CHINA          .682          .65           .634          .666          .634          .619
NIFTY          .633          .633          .666          .7            .7            .733
HOMEBLDG       .555          .5            .611          .722          .722          .777
COMODITY       .549          .605          .507          .535          .549          .633
DOWJONES       .533          .533          .566          .766          .766          .766
INDMATER       .53           .5            .469          .54           .479          .51
INSURANC       .529          .588          .558          .676          .676          .647
SOLAR          .526          .684          .578          .631          .578          .578
N=13
-------------------------------------------------------------------------------------------
GAMING         .466          .533          .6            .633          .666          .6
MILITARY       .466          .488          .533          .577          .555          .622
REIT           .466          .393          .45           .502          .518          .544
DJI-13         .461          .538          .538          .692          .692          .769
SP-100         .422          .412          .453          .659          .628          .649
SP500          .422          .42           .434          .546          .53           .534
RUS-1000       .404          .405          .414          .512          .495          .515
EDU            .375          .375          .375          .375          .375          .375
FINANCE        .373          .406          .428          .538          .538          .56
INDEXES        .373          .378          .415          .584          .57           .593
BIOTECH        .37           .362          .381          .44           .413          .448
CHEM           .361          .347          .291          .444          .416          .402
NASD-100       .355          .377          .377          .533          .488          .488
SOFTWARE       .343          .328          .328          .437          .359          .453
MORNSTAR       .34           .352          .365          .525          .487          .542
N=15
-------------------------------------------------------------------------------------------
HACKERS        .333          .277          .222          .388          .277          .333
AUTO           .325          .325          .325          .325          .35           .375
GREEN          .322          .387          .387          .548          .483          .548
ELECTRON       .309          .36           .329          .453          .407          .458
BIGBANKS       .285          .428          .428          .857          .857          .857
INFRA          .272          .363          .363          .454          .454          .454
SEMI           .272          .327          .281          .445          .409          .454
TRANSP         .25           .25           .25           .5            .45           .45
RETAIL         .241          .241          .241          .275          .224          .327
COMPUTER       .2            .28           .32           .4            .4            .44
OILGAS         .189          .196          .164          .202          .202          .196
HOSPITAL       .142          .142          .142          .142          .142          .142
PIPELINE       .142          .142          .142          .142          .142          .142
REGBANKS       .142          .114          .114          .285          .342          .457
COAL           .111          .222          .111          .111          .111          .111
JETS           .111          .111          .111          .222          .111          .222
FOOD           0             0             .071          .142          .142          .214
N=17
===============================================================================
8/17/2017 Peerless remains on a Sell S9-V.
The DJI and DIA has held up longer
and better than the other major market ETFs. It is still above its rising
65-dma.
But Professionals are net sellers and up-openings now are quite risky and
misleading.
See below how DIA's Tiger Day Traders' Tool made a 12-month low on DIA
and its Closing Power cannot easily turn up. The DJIA looks very tired
from
doing so much heavy-lifting to maintain the appearance that all is still well on
Wall Street.
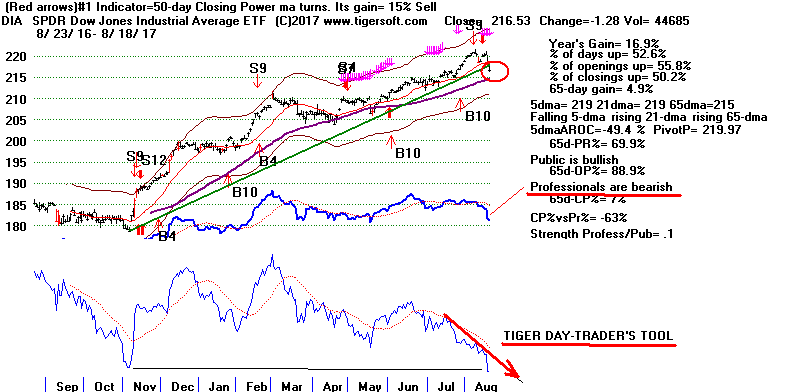
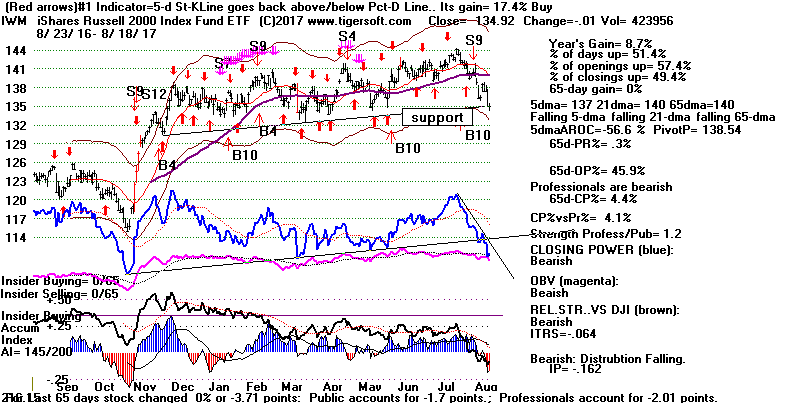
Intermediate-term traders should be
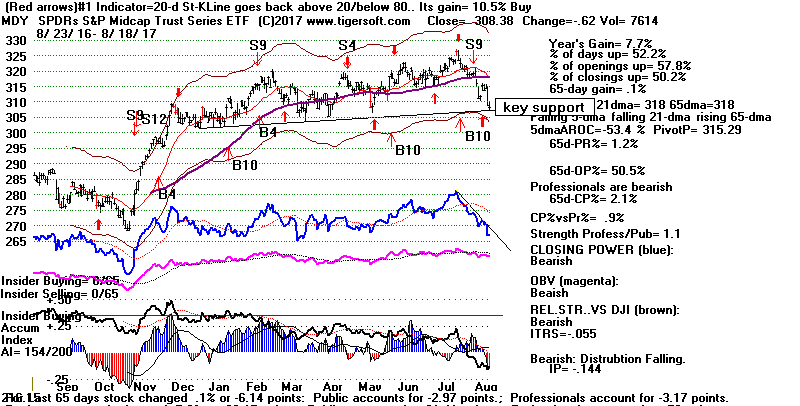
short IWM and MDY
which
are now testing
their key horizontal support levels. Among the
Bearish MINCPs are many very
weak
looking
retail and oil/gas stocks. As oversold as many of these seem, I would hold
these short as long as their Closing Power
downtrends are intact.
IWM
MDY
DJIA
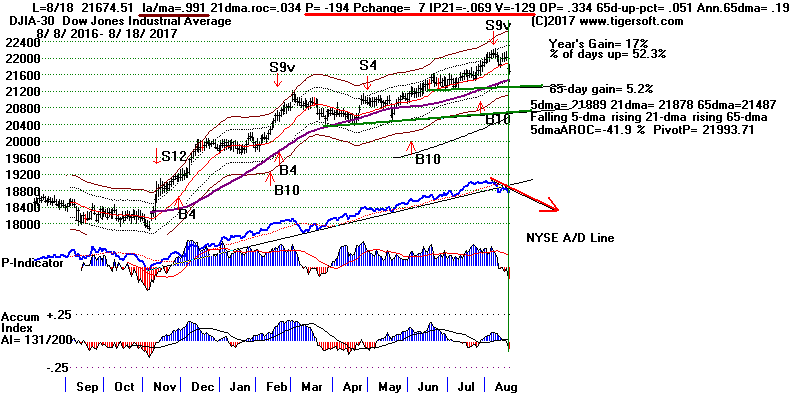
Another recovery in time for Labor Day is certainly a reasonable expectation.
But first the DJI should reach its 2.5% lower band about 340 DJI points below
today's closing and produce a new Peerless Buy signal.
Right now there are many troublesome signs. I don't think we can afford to
overlook
themwith the DJI having not had a decline of more than 18% since the 2007-2009
bear market.
Bearish Signs Are Dominant Now.
1) The V-Indicator is still falling. It
is deeply negative, but not yet oversold in the
sense that it has reached the levels it did at the November and March lows.
And if the the DJI were to rally again from its -0.8% level below the 21-day
ma to its +1.8% band, we would only get another Peerless Sell to lead us into
the often quite bearish month of September.
3) The Closing Powers are falling for all the key US ETFs we follow:
DIA, SPY,
QQQ, IWM,
MDY, SOXL,
TECL, IBB.
Professionals
are still net sellers. Up openings are being heavily sold into. We
should
not be fooled by them.
4) The Tiger Day Traders' Tool for these is at or
very close to making 12-month
lows, showing there is much more downside danger than upside potential
after the opening. Even if the DJI does not open down Monday, the risks
of a subsequent decline are considerable.
5) The Hourly DISI-OBV is making two month lows far
ahead of the DJI itself.
6) 62% of all the stocks and ETFs that we follow now are below the support
of their 65-dma. This means most will stocks have considerable resistance
overhead and will have trouble rallying very far.
7) There are only 13 still "bullish" stock
sectors while there are 30 bearish sectors.
See below.
8) The daily breadth and Tiger statistics
are bearish. (from TigerSoft Data Page)
NYSE new highs = 38 vs new lows 164
NASDAQ new highs = 29 vs new highs = 124
All Closing Power New Highs = 54 vs All
Closing Power New Lows = 354
SP-500 Closing Power New Highs = 4 vs SP-500 CP New Lows = 29
Tiger Traders' Tool New Highs = 40 vs TTT New Lows = 181
SP-500 Tiger Traders' Tool New Highs = 4 vs SP-500 TTT New Lows = 33
8/18/2017 Charts
PEERLESS
DJI, Signals, Indicators Daily
DJI Split Volume 10-DayUp/Down
Vol
Hourly DJIA A/D Line
for All Stocks
DJIA
S&P
OEX
NYSE
NASDAQ
COMPQX
with CP
DIA
SPY
QQQ
MDY
IWM-TNA
Short Term Interest Rates
DJI-Utilities
DJI-Transp
Nifty-30 Index
CrudeOil FAS
GLD
BBH
IBB
JETS
JNUG
KOL
NUGT
OIH
OIL
RSX
RETL SDS
SLV
SOXL
TECL
TMF
TNA XIV YINN
Commodities: JJC, NIB,
WEAT UUP (Dollar)
To
STOCKS' CHARTS
AAPL ADBE
ALXN
AMAT
AMGN
AMZN BA
BABA
BIDU
CAT
FB
GOOG
GS
HD
IBM JPM M
(Macy's) MASI
MSFT
NVDA QCOM
TSLA
TXN
new
CMG (Chipotle),
LRCX, SWKS,
TOWN
Ohers REN, CVE
and SWN (very low AI/200 stocks)
8/18/2017
Bullish MINCPs
Bearish
MINCPs
 RANKING OF KEY DIRECTORIES BASED PCT.OF STOCKS ABOVE 65-DMA
               8/18/17
Bearish = 30
Bullish = 13
---------------------------------------------------------------------------------------
Directory     Current       day-1         day-2         day-3         day-4         day-5
----------------------------------------------------------------------------------------
BEVERAGE       .8            .8            .85           .85           .75           .75
UTILITY        .8            .733          .822          .822          .755          .711
ETFS           .735          .72           .852          .794          .808          .72
BONDFUND       .714          .642          .651          .535          .669          .687
GOLD           .698          .716          .716          .509          .584          .679
SOLAR          .684          .578          .631          .578          .578          .578
-------------------------------------------------------------------------------------------
CHINA          .65           .634          .666          .634          .619          .619
NIFTY          .633          .666          .7            .7            .733          .7
COMODITY       .605          .507          .535          .549          .619          .676
INSURANC       .588          .558          .676          .676          .647          .588
DJI-13         .538          .538          .692          .692          .769          .692
DOWJONES       .533          .566          .766          .766          .766          .7
GAMING         .533          .6            .633          .666          .6            .566
N=13
============================================================================================
HOMEBLDG       .5            .611          .722          .722          .777          .722
INDMATER       .5            .469          .54           .479          .51           .459
============================================================================================
MILITARY       .488          .533          .577          .555          .622          .533
BIGBANKS       .428          .428          .857          .857          .857          .714
SP500          .42           .434          .546          .53           .54           .463
RUS-1000       .416          .424          .519          .503          .527          .45
SP-100         .412          .453          .659          .628          .659          .567
FINANCE        .406          .428          .538          .538          .56           .439
NASD-100       .397          .397          .548          .505          .505          .462
REIT           .393          .455          .502          .518          .538          .388
GREEN          .387          .387          .548          .483          .548          .387
INDEXES        .378          .415          .584          .57           .588          .514
EDU            .375          .375          .375          .375          .375          .375
BIOTECH        .366          .381          .433          .421          .452          .401
INFRA          .363          .363          .454          .454          .454          .363
SEMI           .362          .318          .474          .439          .491          .362
ELECTRON       .36           .329          .458          .407          .463          .345
MORNSTAR       .352          .365          .525          .487          .542          .42
CHEM           .347          .291          .444          .416          .402          .347
N=17
============================================================================================
PIPELINE       .333          .333          .222          .222          .222          .222
SOFTWARE       .328          .328          .437          .359          .453          .281
AUTO           .325          .325          .325          .35           .375          .325
COMPUTER       .28           .32           .4            .4            .44           .36
HACKERS        .277          .222          .388          .277          .333          .222
TRANSP         .25           .25           .5            .45           .45           .3
RETAIL         .241          .241          .275          .224          .327          .293
COAL           .222          .111          .111          .111          .111          .111
OILGAS         .202          .17           .202          .202          .196          .183
HOSPITAL       .142          .142          .142          .142          .142          .142
JETS           .111          .111          .222          .111          .222          .222
REGBANKS       .111          .111          .277          .333          .444          .138
FOOD           0             .071          .142          .142          .214          .285
N=13
==============================================================================
8/17/2017 Peerless remains on a Sell S9-V.
Intermediate-term traders should be
hedged. IWM and MDY
are still below their 65-dma. Among the
Bearish MINCPs are many very
weak looking oil/gas stocks. As oversold as
these oil stocks are, I would hold
these short as long as their Closing Power
downtrends are intact.
I don't think that the terror attacks in Spain caused today's decline.
Spain
is too far away from New York and my reading of history shows that
Wall Street only seems to take notice when the bombing is in New York.
Bombing in Europe, Race riots, burning cities, hurricanes! Tthey just don't
affect the Dow. The market even rose right after WWII was started in
Europe.
Don't Count on the SP-500 and SPY quickly
rebounding.
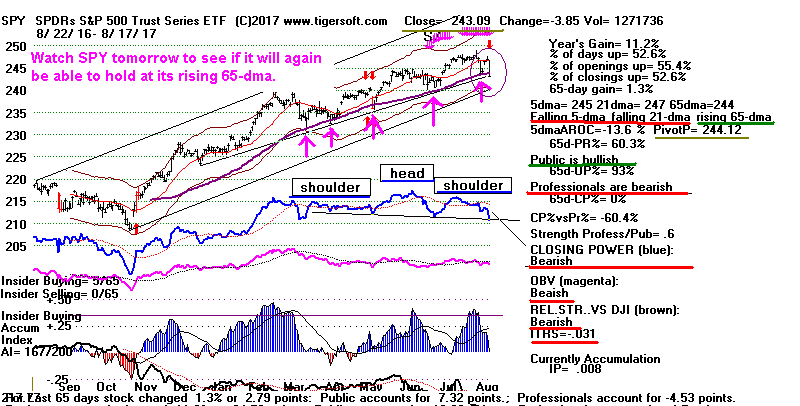
Will SPY and the SP-500 again rebound from their rising 65-dma? I
would not count on it. An effort to support the market here might
be attempted. But the signs of trouble ahead for the market are quite
worrisome, quite apart from any deep-rooted animal fears that might be
imparted on the human psyche during the solar eclipse on Monday.
Anyone astrology-followers out there? See what the venerable Arch
Crawford says:
http://www.marketwatch.com/story/what-the-solar-eclipse-on-aug-21-will-mean-for-stocks-2017-07-25
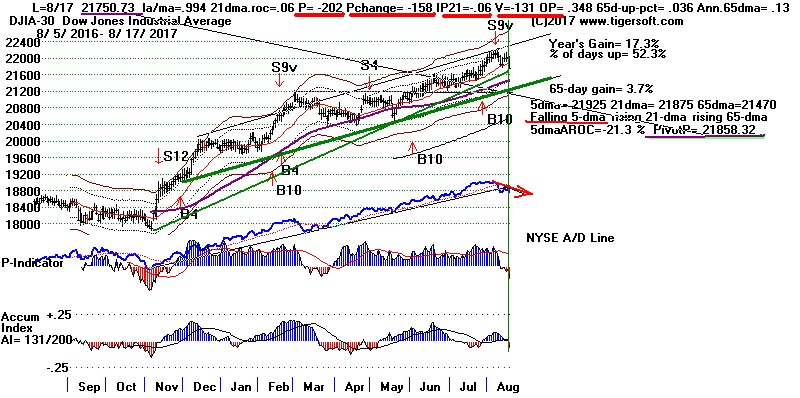
All our Peerless key values are negative. This will make it harder to get
a buy signal on the DJI until it falls to the 3%-3.5% lower band.
Seasonality will work against the DJI for the next two weeks. Since 1965,
the DJI has risen only 36% of the time over the next two weeks in years
after the Presidential Election.
The Closing Powers for the major market ETFs dropped sharply today.
This will make it that much harder for them to break their downtrends.
Clearly, Professionals are becoming anxious about the amount of personal
opposition Trump is creating and how this interferes with the Republican
pro-business legislative agenda. IWM's looks particularly bearish and
SPY's
Closing Power is forming its own bearish head/shoulders pattern.

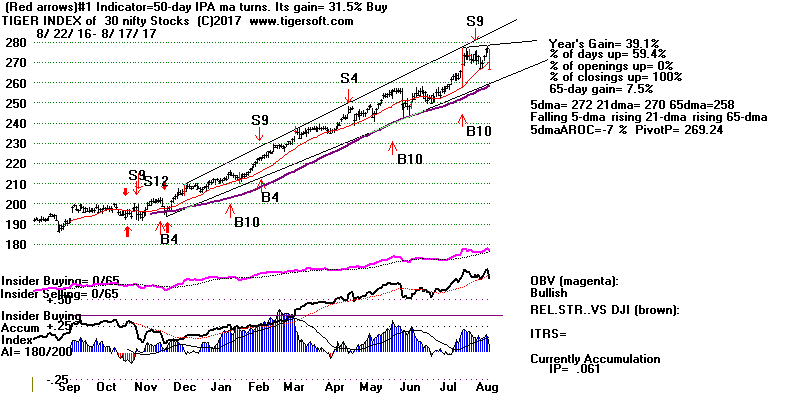
Today the tech-Nifty-50 seemed to give up on its valiant effort of making
the market look still attractive for traders. See how sharply it fell
today on
red high volume. It may still recover, but it won't be breaking out for a
while.
If heavy-handed profit-taking starts in stocks like AMZN
and FB, the selling
will quickly spread. It can't be good that so
many bank and important
tech leaders have suddenly formed head/shoulders patterns. Look at
them: AMGN, AMZN,
BAC, BBH,
FAS, FB,
GS, IBB,
JPM and TXN.
8/17/2017
Charts
PEERLESS
DJI, Signals, Indicators Daily
DJI Split Volume 10-DayUp/Down
Vol
Hourly DJIA A/D Line
for All Stocks
DJIA
S&P
OEX
NYSE
NASDAQ
COMPQX
with CP
DIA
SPY
QQQ
MDY
IWM-TNA
Short Term Interest Rates
DJI-Utilities
DJI-Transp
Nifty-30 Index
CrudeOil FAS
GLD
BBH
IBB
JETS
JNUG
KOL
NUGT
OIH
OIL
RSX
RETL SDS
SLV
SOXL
TECL
TMF
TNA XIV YINN
Commodities: JJC, NIB,
WEAT UUP (Dollar)
To
STOCKS' CHARTS
AAPL ADBE
ALXN
AMAT
AMGN
AMZN BA
BABA
BIDU
CAT
FB
GOOG
GS
HD
IBM JPM M
(Macy's) MASI
MSFT
NVDA QCOM
TSLA
TXN
new
CMG (Chipotle),
LRCX, SWKS,
TOWN
Ohers REN, CVE
and SWN (very low AI/200 stocks)
8/17/2017
Bullish MINCPs
Bearish
MINCPs
 RANKING OF KEY DIRECTORIES BASED PCT.OF STOCKS ABOVE 65-DMA
8/17/17
Bearish = 30
Bullish = 14
---------------------------------------------------------------------------------------
Directory     Current       day-1         day-2         day-3         day-4         day-5
----------------------------------------------------------------------------------------
BEVERAGE       .8            .85           .85           .75           .75           .7
UTILITY        .733          .822          .822          .755          .711          .755
ETFS           .72           .852          .794          .808          .705          .705
GOLD           .714          .714          .51           .612          .693          .653
N=4
---------------------------------------------------------------------------------------------
NIFTY          .666          .7            .7            .733          .7            .666
CHINA          .645          .677          .645          .629          .629          .629
BONDFUND       .642          .651          .535          .669          .696          .633
HOMEBLDG       .611          .722          .722          .777          .722          .666
GAMING         .607          .642          .678          .607          .571          .571
SOLAR          .578          .631          .578          .578          .578          .631
DOWJONES       .566          .766          .766          .766          .7            .733
INSURANC       .558          .676          .676          .647          .588          .617
DJI-13         .538          .692          .692          .769          .692          .769
MILITARY       .533          .577          .555          .622          .533          .533
N=10
---------------------------------------------------------------------------------------------
COMODITY       .5            .528          .542          .614          .671          .657
---------------------------------------------------------------------------------------------
INDMATER       .469          .54           .479          .51           .459          .469
REIT           .455          .502          .518          .538          .388          .455
SP-100         .453          .659          .628          .659          .577          .597
SP500          .44           .547          .531          .541          .47           .476
BIGBANKS       .428          .857          .857          .857          .714          .714
FINANCE        .428          .538          .538          .56           .461          .483
RUS-1000       .425          .519          .503          .527          .453          .451
INDEXES        .411          .584          .57           .588          .518          .485
GREEN          .387          .548          .483          .548          .387          .419
BIOTECH        .385          .433          .413          .46           .397          .358
NASD-100       .377          .533          .488          .488          .444          .411
MORNSTAR       .365          .525          .487          .542          .42           .399
INFRA          .363          .454          .454          .454          .363          .454
N=13
---------------------------------------------------------------------------------------------
PIPELINE       .333          .333          .222          .222          .222          .222
ELECTRON       .329          .458          .412          .463          .35           .345
SOFTWARE       .328          .437          .359          .453          .281          .296
AUTO           .325          .325          .35           .375          .325          .35
COMPUTER       .32           .4            .4            .44           .36           .36
SEMI           .318          .474          .439          .491          .37           .353
CHEM           .291          .444          .416          .402          .347          .347
TRANSP         .25           .5            .45           .45           .3            .3
RETAIL         .241          .275          .224          .327          .293          .327
HACKERS        .187          .375          .25           .312          .187          .25
OILGAS         .177          .208          .202          .196          .183          .221
EDU            .166          .166          .166          .166          .166          .166
HOSPITAL       .142          .142          .142          .142          .142          .142
COAL           .111          .111          .111          .111          .111          .111
JETS           .111          .222          .111          .222          .222          .222
REGBANKS       .111          .277          .333          .444          .194          .277
FOOD           .071          .142          .142          .214          .285          .214
N=17
==============================================================================
8/16/2017 Peerless remains on a Sell S9-V.
Intermediate-term traders should be
hedged. IWM and MDY
are still below their 65-dma. Among the
Bearish MINCPs are many very
weak looking oil/gas stocks. As oversold as
the oil stocks are, I would hold
these short as long as their Closing Power
downtrends are intact.
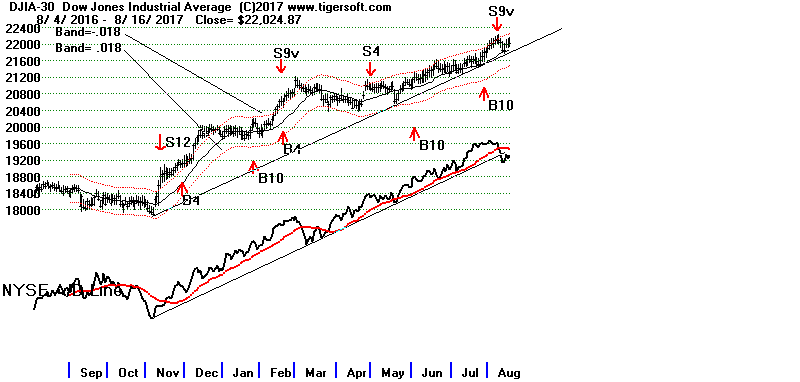
I showed last night that the DJI usually tops out 4-5 months after the NYSE
A/D Line peaks if a major decline is about to unfold. Note that smaller
declines
do not need such lengthy divergences. Right now the NYSE A/D Line is still below
its 21-dma now. Any new DJI high will probably not be confirmed by the A/D Line
along with most other Peerless indicators
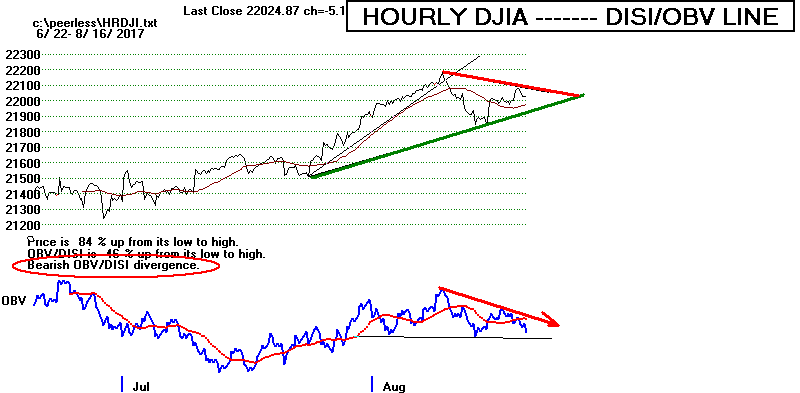
Another short-term warning now comes from the bearish divergence between the
Hourly DISI/OBV and the DJI's price action. A third warning is the sudden
appearance of head/shoulders patterns in the big banks. In this situation,
with
much of the market tiring, it looks like it will be up to the biggest tech
stocks to bring enough new excitement into the market to keep it rising until
September and avoid a break in the 9-month price uptrend-line that started
with Trump's win in November.
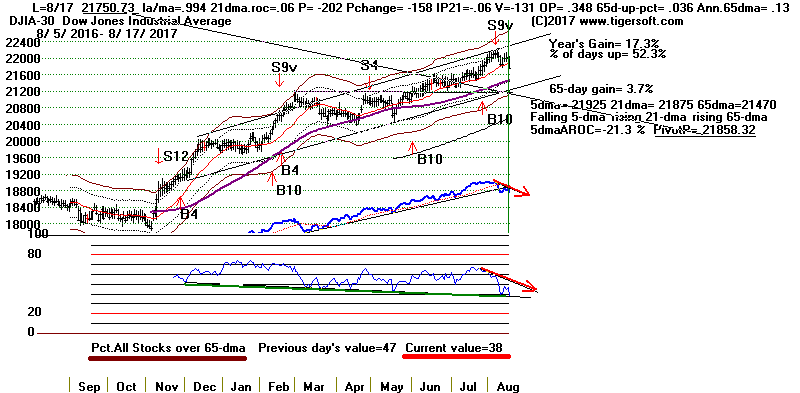
DJI's 7-mo long, well-tested Price Uptrend now crosses at 21800.
 .
.
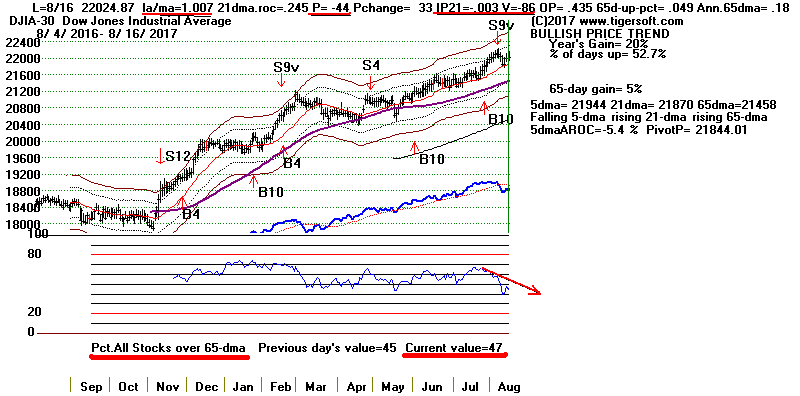
Professionals are not yet convinced the rally will continue. The Closing
Powers
for DIA, SPY and
QQQ are still falling. Until that happens, the odds favor
a
retest by them of their 65-dma.
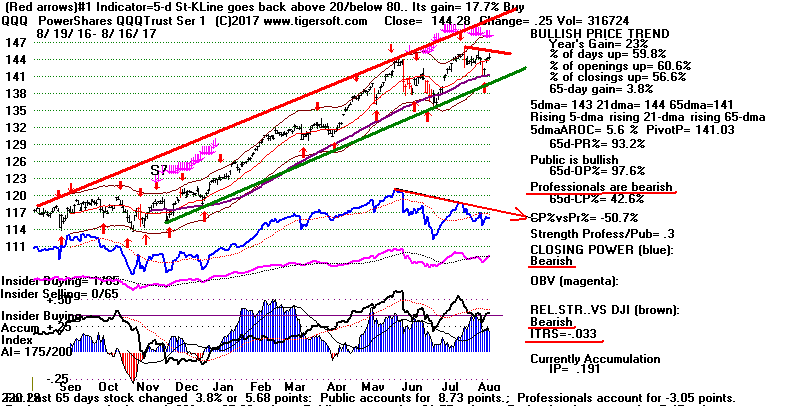
All three three key Peerless indicators (P-I, V-I and IP21) are negative now
even though the DJI is 0.7% over the 21-dma. Very likely a DJI rally to a
nominal new high will bring a Peerless Sell. Perhaps, we will see that if
there is
a Labor Day rally in two weeks.
A new technical problem has emerged. This the head/shoulders patterns
that have suddenly appeared for the big bank stocks:
Close today neckline support
BAC 24.19
23.7
GS 225.78
225.
JPM. 92.09
89-90
Tech Leadership Buys if There is a Tech
Breakout.
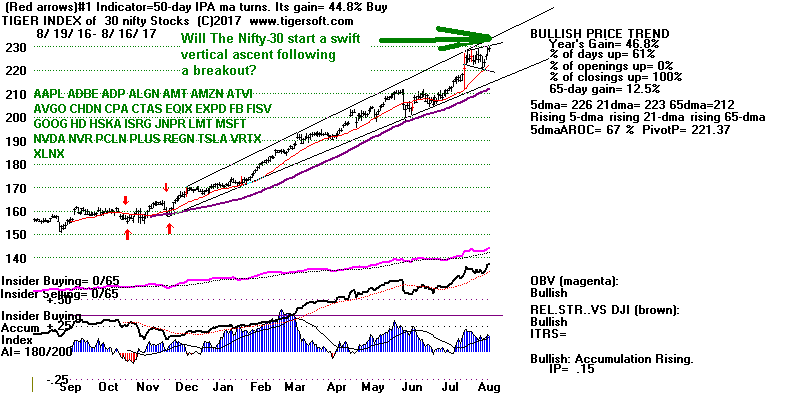
The most bullish aspect of the market now is the chart pattern of our tech-
heavy nifty-30. It seems poised for a breakout. A swift vertical
ascent
would be in keeping with a move by it above its rising resistance level.
In the event of this breakout, it should bring nice gains to
AAPL and MSFT
as well as BABA and
CO among our Chinese MAXCPs. AAPL
has the
highest AI/200 score among the DJI-30.
-----
8/16/2017
Charts
PEERLESS
DJI, Signals, Indicators Daily
DJI Split Volume 10-DayUp/Down
Vol
Hourly DJIA A/D Line
for All Stocks
DJIA
S&P
OEX
NYSE
NASDAQ
COMPQX
with CP
DIA
SPY
QQQ
MDY
IWM-TNA
Short Term Interest Rates
DJI-Utilities
DJI-Transp
Nifty-30 Index
CrudeOil FAS
GLD
BBH
IBB
JETS
JNUG
KOL
NUGT
OIH
OIL
RSX
RETL SDS
SLV
SOXL
TECL
TMF
TNA XIV YINN
Commodities: JJC, NIB,
WEAT UUP (Dollar)
To
STOCKS' CHARTS
AAPL ADBE
ALXN
AMAT
AMGN
AMZN BA
BABA
BIDU
CAT
FB
GOOG
GS
HD
IBM JPM M
(Macy's) MASI
MSFT
NVDA QCOM
TSLA
TXN
new
CMG (Chipotle),
LRCX, SWKS,
TOWN
Ohers REN, CVE
and SWN (very low AI/200 stocks)
8/16/2017
Bullish MINCPs
Bearish
MINCPs
----------------------------------------------------------------------------------------------------------------------
 RANKING OF KEY DIRECTORIES BASED PCT.OF STOCKS ABOVE 65-DMA
               8/16/17
Bullish = 26
Bearish = 18
---------------------------------------------------------------------------------------
Directory     Current       day-1         day-2         day-3         day-4         day-5
----------------------------------------------------------------------------------------
ETFS           .863          .803          .818          .712          .696          .848
BIGBANKS       .857          .857          .857          .714          .714          .857
BEVERAGE       .85           .85           .75           .75           .7            .7
UTILITY        .822          .822          .755          .711          .755          .8
DOWJONES       .766          .766          .766          .7            .733          .733
HOMEBLDG       .722          .722          .777          .722          .722          .777
GOLD           .714          .51           .612          .693          .653          .571
NIFTY          .7            .7            .733          .7            .666          .733
DJI-13         .692          .692          .769          .692          .769          .769
CHINA          .677          .645          .629          .629          .629          .709
INSURANC       .676          .676          .647          .588          .617          .705
N=11
-------------------------------------------------------------------------------------------
SP-100         .659          .628          .659          .577          .597          .68
BONDFUND       .651          .535          .669          .696          .651          .83
GAMING         .642          .678          .607          .571          .571          .607
SOLAR          .631          .578          .578          .578          .578          .631
INDEXES        .588          .57           .588          .518          .49           .64
MILITARY       .577          .555          .622          .533          .533          .644
GREEN          .548          .483          .548          .387          .419          .58
SP500          .546          .53           .54           .467          .469          .569
INDMATER       .54           .479          .51           .459          .469          .51
FINANCE        .538          .538          .56           .461          .483          .615
NASD-100       .533          .488          .488          .444          .411          .5
COMODITY       .528          .542          .614          .671          .657          .728
MORNSTAR       .525          .487          .542          .42           .403          .613
RUS-1000       .52           .503          .527          .453          .451          .565
REIT           .502          .518          .538          .388          .455          .481
N=15
-------------------------------------------------------------------------------------------
TRANSP         .5            .45           .45           .3            .3            .3
--------------------------------------------------------------------------------------------
SEMI           .474          .439          .491          .37           .344          .465
ELECTRON       .458          .412          .469          .35           .34           .453
INFRA          .454          .454          .454          .363          .454          .454
CHEM           .444          .416          .402          .347          .347          .402
BIOTECH        .437          .413          .452          .405          .358          .448
SOFTWARE       .437          .359          .453          .281          .296          .39
COMPUTER       .4            .4            .44           .36           .36           .4
HACKERS        .375          .25           .312          .187          .25           .25
N=8
--------------------------------------------------------------------------------------------
PIPELINE       .333          .333          .222          .222          .222          .222
AUTO           .325          .35           .375          .325          .325          .4
REGBANKS       .277          .333          .444          .194          .277          .444
RETAIL         .275          .224          .327          .293          .31           .465
JETS           .222          .111          .222          .222          .222          .222
OILGAS         .215          .208          .196          .183          .215          .291
EDU            .166          .166          .166          .166          .166          .333
FOOD           .142          .142          .214          .285          .214          .5
HOSPITAL       .142          .142          .142          .142          .142          .142
COAL           .111          .111          .111          .111          .111          .333
N=10
===============================================================================
===============================================================================
8/15/2017 Peerless remains on a Sell S9-V.
Intermediate-term traders should be
hedged. IWM and MDY
are still below their 65-dma. Among the
Bearish MINCPs are many very
weak looking oil/gas stocks. I would hold
these short. Now we must watch to see if the Closing Power downtrends
are broken and Professionals shift and become net buyers.
The DJI, itself, seems likely to go back to its recent high near 22200.
There is ample precedent for this and we know that the very highest priced
and most heavily priced DJI-30 stocks are now performing very well. With
their leadership, the DJI almost seems bound to advance.
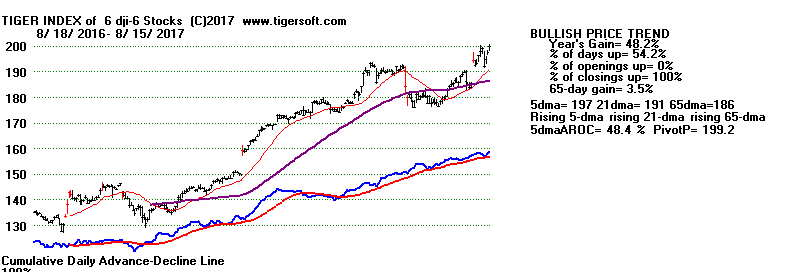
The
six highest priced DJI-30 stocks
may be made into an Index. See how that index
below made a new high today. These six stocks are BA
(239.17 +2.02),
GS (227.59 + 0.59), MMM (207.18 -.19), UNH (194.50
+.79), AAPL (161.60 +1.75)
and MCD (157.62 +.36). Together these rose about 5 points.
Multiplying by 7,
because the divisor is about 1/7, they boosted the DJI by +35 today, which was
a day of profit-taking after Monday's big run-up.
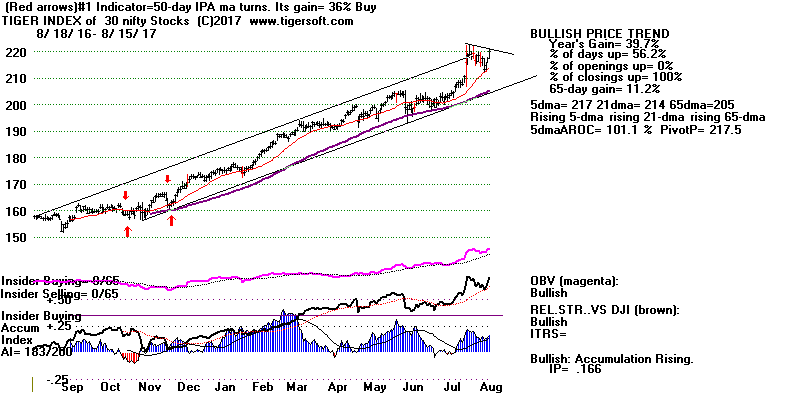
Look also at our Tiger Chart of the
Nifty-30 below.
These are the most powerful
tech stocks in the NASDAQ. They look like they could take off and
start a vertical ascent. If this happens, I would think the QQQ will jump
quickly to new highs. It will not take much move up from the openings for
the QQQ and TECL to break their Closing Power
downtrends and shift
their CP labels from "Bearish" to "Bullish" on our charts. Given, QQQ's high
level of Accumulation, it should be bought if this happens.
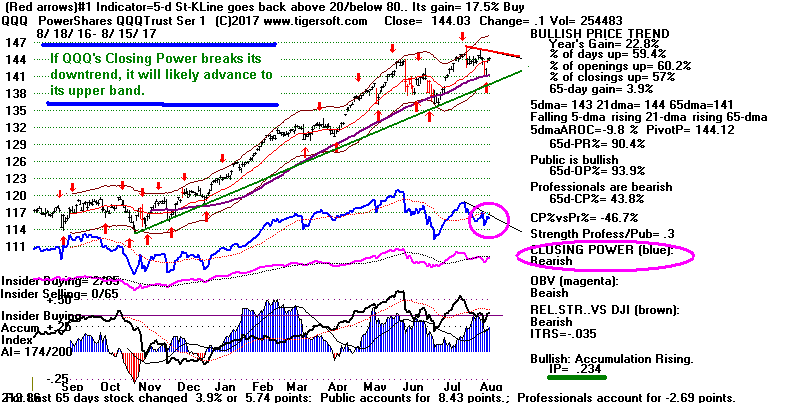
The four stocks in the Nifty-30 that I would watch to see if this breakout
occurs
are ADBE, AAPL,
FB, FISV and NVDA.
Highest Price DJI Stocks and Our Nifty-30
look ready for breakout advances. This will
probably take DIA and QQQ to new highs.
Meanwhile, the Closing Powers are still felling for MDY,
SPY, IWM and
MDY.
Professionals are not comfortable buying them yet and we can see that the rally
on Monday and Tuesday was based completely on higher openings. But these
higher openings can continue a lot longer even though most
NYSE and NASDAQ
stocks are declining.
A Top in January 2018?
We should appreciate, I think, that the DJI very often tops out weeks or even
months after the NYSE A/D Line. Look at the tops just since 1980 before
DJI declines by more than 15%. The DJI, on average, tops out about 4-5
months after the NYSE A/D Line does. Assuming that the NYSE A/D Line's
top was made August 1st, a DJI top that beings a big decline may be 5 months
away and may not occur in September. A decline in September-October would
by this thinking be minor.
A/D Line Top DJI top
Difference
-------------- -------------
------------
9/22/1980
4/27/1981 7+ months
6/16/1983
11/29/1983 5+ months
3/24/1987
8/25/1987 5 months
6/5/1990
7/17/1990 1 1/2 months
4/3/1998
7/17/1998 3 1/2 months
7/16/1999
1/14/2000 6 months
6/4/2007
10/9/2007 5 months
7/7/2011
7/21/2011 1/2 month
----------------------------------------------------
Average 4+ months
Over-Sold or Big Money Selling?
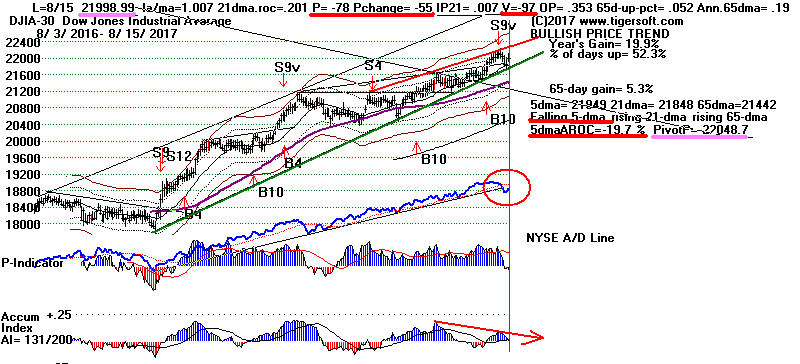
NYSE Up Volume has been regularly lower than NYSE Down Volume for the
last six weeks. Today, for example, NYSE Down volume was 140 million more
than Up Volume despite the DJI's small rise. This may just be a mid-Summer
doldrum's
phenomenon. But it also could be a warning that "Big Money" has become
bearish,
perhaps because they expect much higher interest rates and that would mean and
end to the "Bond Bubble", which could in turn maul those who have wagered too
much on "safe" bonds and some of those selling them.
Below we can see that the Net Unadjusted NYSE Up-Volume minus Down
Volume has reached a level which ordinarily produces an upswing. But if
there is
no upswing from it very soon, it will become much more difficult to say the
heavier
Down Volume is harmlessly part of a normal seasonal cycle. We will watch these
charts.


8/15/2017
Charts
PEERLESS
DJI, Signals, Indicators Daily
DJI Split Volume 10-DayUp/Down
Vol
Hourly DJIA A/D Line
for All Stocks
DJIA
S&P
OEX
NYSE
NASDAQ
COMPQX
with CP
DIA
SPY
QQQ
MDY
IWM-TNA
Short Term Interest Rates
DJI-Utilities
DJI-Transp
Nifty-30 Index
CrudeOil FAS
GLD
BBH
IBB
JETS
JNUG
KOL
NUGT
OIH
OIL
RSX
RETL SDS
SLV
SOXL
TECL
TMF
TNA XIV YINN
Commodities: JJC, NIB,
WEAT UUP (Dollar)
To
STOCKS' CHARTS
AAPL ADBE
ALXN
AMAT
AMGN
AMZN BA
BABA
BIDU
CAT
FB
GOOG
GS
HD
IBM JPM M
(Macy's) MASI
MSFT
NVDA QCOM
TSLA
TXN
new
CMG (Chipotle),
LRCX, SWKS,
TOWN
Ohers REN, CVE
and SWN (very low AI/200 stocks)
8/15/2017
Bullish MINCPs
Bearish
MINCPs
 RANKING OF KEY DIRECTORIES BASED PCT.OF STOCKS ABOVE 65-DMA
              8/15/17
 Bullish = 23
 Bearish = 22
---------------------------------------------------------------------------------------
Directory     Current       day-1         day-2         day-3         day-4         day-5
----------------------------------------------------------------------------------------
BIGBANKS       .857          .857          .714          .714          .857          .857
BEVERAGE       .85           .75           .75           .7            .7            .8
UTILITY        .822          .755          .711          .755          .8            .866
ETFS           .794          .808          .705          .691          .852          .926
DOWJONES       .766          .766          .7            .733          .733          .733
HOMEBLDG       .722          .777          .722          .722          .777          .722
NIFTY          .7            .733          .7            .666          .733          .733
DJI-13         .692          .769          .692          .769          .769          .769
INSURANC       .676          .647          .588          .617          .705          .735
N=9
--------------------------------------------------------------------------------------------
GAMING         .666          .6            .566          .566          .6            .6
CHINA          .634          .619          .619          .619          .698          .746
SP-100         .628          .659          .577          .597          .68           .659
SOLAR          .578          .578          .578          .578          .631          .736
INDEXES        .57           .588          .518          .49           .64           .654
MILITARY       .555          .622          .533          .533          .644          .622
COMODITY       .542          .614          .671          .657          .728          .642
FINANCE        .538          .56           .461          .483          .615          .648
BONDFUND       .535          .669          .696          .651          .83           .875
SP500          .533          .541          .47           .472          .569          .597
REIT           .518          .538          .388          .455          .481          .512
GOLD           .509          .622          .698          .641          .547          .452
NASD-100       .505          .505          .462          .43           .516          .537
RUS-1000       .504          .527          .453          .451          .564          .581
N=14
--------------------------------------------------------------------------------------------
MORNSTAR       .487          .542          .42           .403          .609          .638
GREEN          .483          .548          .387          .419          .58           .645
INDMATER       .479          .51           .459          .469          .51           .5
INFRA          .454          .454          .363          .454          .454          .545
TRANSP         .45           .45           .3            .3            .3            .4
SEMI           .439          .491          .37           .344          .474          .534
BIOTECH        .417          .452          .397          .366          .448          .472
CHEM           .416          .402          .347          .347          .402          .43
ELECTRON       .412          .469          .355          .34           .458          .5
COMPUTER       .4            .44           .36           .36           .4            .44
EDU            .375          .375          .375          .375          .5            .375
SOFTWARE       .359          .453          .281          .296          .406          .437
AUTO           .35           .375          .325          .325          .4            .4
N=13
--------------------------------------------------------------------------------------------
PIPELINE       .333          .333          .222          .222          .222          .222
REGBANKS       .333          .444          .194          .277          .444          .555
HACKERS        .277          .333          .222          .277          .333          .277
RETAIL         .224          .327          .293          .31           .465          .5
OILGAS         .215          .202          .183          .215          .291          .291
FOOD           .142          .214          .285          .214          .5            .428
HOSPITAL       .142          .142          .142          .142          .142          .142
COAL           .111          .111          .111          .111          .333          .222
JETS           .111          .222          .222          .222          .222          .222
N=9
==============================================================================
==============================================================================
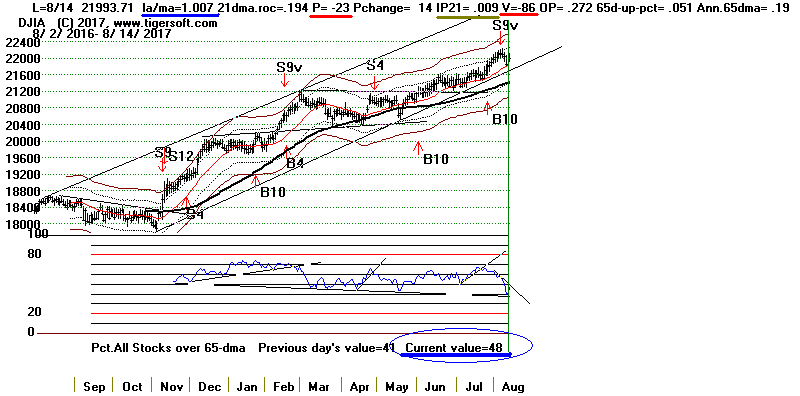
8/14/2017 Peerless remains on a Sell S9-V.
Intermediate-term traders should be
hedged. IWM and MDY
are still below their 65-dma. Among the
Bearish MINCPs are many very
weak looking oil/gas stocks. I would hold
these short.
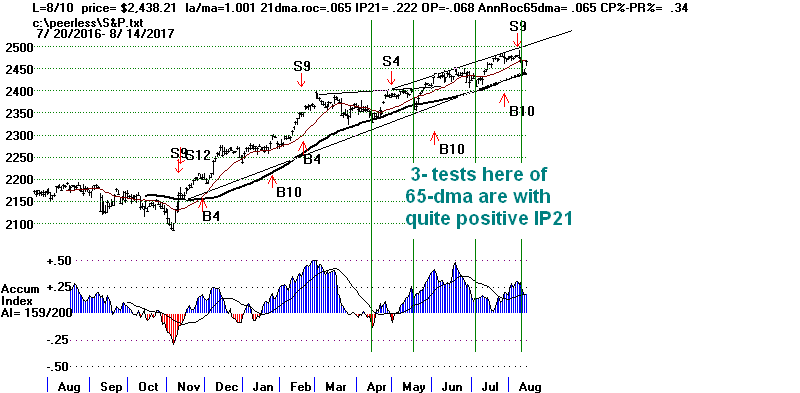
Word
was spread that North Korea will hold-off on testing its new
ICBM. As a result, we saw a big rally from the same key points for
the SP-500, NASDAQ and the QQQ. They all rallied from their
rising 65-day moving averages. This coupled with positive Accumulation,
as shown by our IP21, rallies to new highs often do take place like
we saw today. But if one studies the SP-500 in this matter, we also see
that
there are a number of cases where either there was no bounce or the bounce
quickly failed:
1) 7/29/1986 IP21 = .177 65-dma AROC = +.126
2) 7/9/1986 IP21 = .276 65-dma AROC = +.225
3) 8/1/1986 IP21 = .118 65-dma AROC = +.091
4) 7/28/1998 IP21= .126 65-dma AROC = +.076
5) 7/26/1999 IP21= .232 65-dma AROC = -.032
Altogether, the odds of a rebound making new highs are only about 50:50 for
Julys-Augusts and and about 50:50 when there have already been three
successful tests in the last 8 months. See the
new SP-500 study
tonight.
If the DJI were to rally to a new high, we will probably get a new Sell S9-V.
So, being hedged now seems reasonable.
So what are short-term traders to do? It would be safer to buy on another
test
of the 65-dma. But if North Korea holds off on its ICM test, we could see
a few more higher openings this week. But they cannot be trusted.
The Closing Powers for DIA,
SPY, QQQ, IWM,
MDY and the NASDAQ
are all falling. That warns us not to buy at the opening. The Tiger Day
Traders
tools are also falling for each of these. This warns us that there is more
downside
potential after the opening than upside potential. It also tells us at
this stage
of the market that strong-looking up-openings are quite likely being staged
to give the appearance of market strength. At least, we need more evidence
of Professional buying to trust the market, apart from the DJI-30 which
does often peak after most stocks and ETFs. The short-term 5-day moving
averages are all falling and each of these closed below its pivot-point for
tomorrow.
8/11/2017
To Charts
PEERLESS
DJI, Signals, Indicators Daily
DJI Split Volume 10-DayUp/Down
Vol
Hourly DJIA A/D Line
for All Stocks
DJIA
S&P
OEX
NYSE
NASDAQ
COMPQX
with CP
DIA
SPY
QQQ
MDY
IWM-TNA
Short Term Interest Rates
DJI-Utilities
DJI-Transp
Nifty-30 Index
CrudeOil FAS
GLD
BBH
IBB
JETS
JNUG
KOL
NUGT
OIH
OIL
RSX
RETL SDS
SLV
SOXL
TECL
TMF
TNA XIV YINN
Commodities: JJC, NIB,
WEAT UUP (Dollar)
To
STOCKS' CHARTS
AAPL ADBE
ALXN
AMAT
AMGN
AMZN BA
BABA
BIDU
CAT
FB
GOOG
GS
HD
IBM JPM M
(Macy's) MASI
MSFT
NVDA QCOM
TSLA
TXN
new
CMG (Chipotle),
LRCX, SWKS,
TOWN
Ohers REN, CVE
and SWN (very low AI/200 stocks)
8/14/2017
Bullish MINCPs
Bearish
MINCPs
 RANKING OF KEY DIRECTORIES BASED PCT.OF STOCKS ABOVE 65-DMA
              8/14/17
Bullish = 26
Bearish = 19
---------------------------------------------------------------------------------------
Directory     Current       day-1         day-2         day-3         day-4         day-5
----------------------------------------------------------------------------------------
BIGBANKS       .857          .714          .714          .857          .857          .857
ETFS           .808          .705          .691          .852          .911          .926
HOMEBLDG       .777          .722          .722          .777          .722          .722
DJI-13         .769          .692          .769          .769          .769          .692
DOWJONES       .766          .7            .733          .733          .733          .733
UTILITY        .755          .711          .755          .8            .866          .8
BEVERAGE       .75           .75           .7            .7            .8            .75
NIFTY          .733          .7            .666          .733          .733          .833
BONDFUND       .669          .696          .651          .83           .875          .928
N=9
----------------------------------------------------------------------------------------------
SP-100         .659          .577          .597          .68           .67           .701
INSURANC       .647          .588          .617          .705          .735          .794
MILITARY       .622          .533          .533          .644          .622          .644
COMODITY       .619          .676          .661          .732          .647          .647
CHINA          .612          .612          .612          .693          .758          .693
GOLD           .603          .698          .66           .566          .433          .452
GAMING         .6            .566          .566          .6            .6            .7
INDEXES        .588          .518          .49           .64           .654          .658
SOLAR          .578          .578          .578          .631          .736          .736
FINANCE        .56           .461          .483          .615          .659          .703
GREEN          .548          .387          .419          .58           .612          .645
SP500          .543          .47           .472          .569          .599          .627
MORNSTAR       .542          .42           .403          .609          .634          .71
REIT           .538          .388          .455          .481          .518          .564
RUS-1000       .528          .453          .451          .564          .583          .617
INDMATER       .51           .459          .469          .51           .51           .561
NASD-100       .505          .462          .43           .516          .537          .58
N=17
----------------------------------------------------------------------------------------------
SEMI           .491          .37           .344          .474          .534          .5
ELECTRON       .469          .355          .345          .458          .494          .479
BIOTECH        .456          .397          .358          .456          .472          .515
INFRA          .454          .363          .454          .454          .545          .545
SOFTWARE       .453          .281          .296          .406          .453          .484
TRANSP         .45           .3            .3            .3            .4            .45
REGBANKS       .444          .194          .277          .444          .555          .5
COMPUTER       .44           .36           .36           .4            .44           .4
CHEM           .402          .347          .347          .402          .43           .513
AUTO           .375          .325          .325          .4            .4            .4
EDU            .375          .375          .375          .5            .375          .375
N=11
----------------------------------------------------------------------------------------------
HACKERS        .333          .222          .277          .333          .333          .388
PIPELINE       .333          .333          .222          .222          .222          .222
RETAIL         .327          .293          .31           .465          .5            .517
JETS           .222          .222          .222          .222          .222          .222
FOOD           .214          .285          .214          .5            .428          .5
OILGAS         .208          .189          .215          .291          .297          .297
HOSPITAL       .142          .142          .142          .142          .142          .142
COAL           .111          .111          .111          .333          .222          .333
N=8
==============================================================================
8/11/2017 We can't know yet that
the decline is over. But traders will, no doubt, buy
those ETFs that fell to their 65-dma and rebounded Friday. A further but
limited
recovery is likely for them. But a break later this week in the 65-dma for
the NASDAQ
and SP-500 would be unsettling. Even then,
the DJI-30 may hold up. That
is its job, to maintain the appearance that all is well.
I fear if the DJI were to break below its 65-dma, there would soon be a
flash-crash.
The FED and the Big Banks know this. They will try to hold the DJI up.
Nothing
prevents the FED from even orchestrating the Big Banks' efforts to hold the DJI
up.
They operate in secrecy.
But what if the Korean Missile Crisis is not the main reason the market has
weakened? What if Jamey Diamond and Alan Greenspan are right and we are
approaching a collapse in Bonds because low interest rates will not long
continue? Why with so many Goldman Sachs people in the Trump
Administration
is GS not doing better? Perhaps, they have
relayed scary information back to
Wall Street friends there from their positions in the Trump Administration.
(
Greenspan: Bond bubble about to break Aug 7, 2017
Jamie Dimon: Won't call it a bubble, but I wouldn't buy bonds
)
What might else prick the bubble?
I would guess it will be a Wall Street scandal
of some sort. Regulation and regulators are scarce. The temptation
to get rich
cutting corners, using customers funds inappropriately or fraudulently is just
too
great. The new Enrons and WAMUs are out there. If bond prices break
badly, there
will be big trouble. Back in the Savings & Loan Crisis years, 1988-1991,
there were
more than 1000 felony convictions of bankers. The Federal Government had
to
pour in more than $100 billion into the FDIC to bailout savers in failed banks.
But the regulation and punishment of big bank fraud has come on hard times.
How many
prosecutions were there in 2008-2009? All those "liar' loans", the pumped
up appraisals,
the insider selling at the top, but almost no prosecutions. With Obama, Trump
and
the Fed giving free rides to big bankers, it's hard not see trouble on this
front when
the current "bond bubble" is burst. Listen to
William Black recently. He was
the government's key regulator of banks in the the late 1980s.
22100 Is Likely Resistance on The Next DJI Rally,
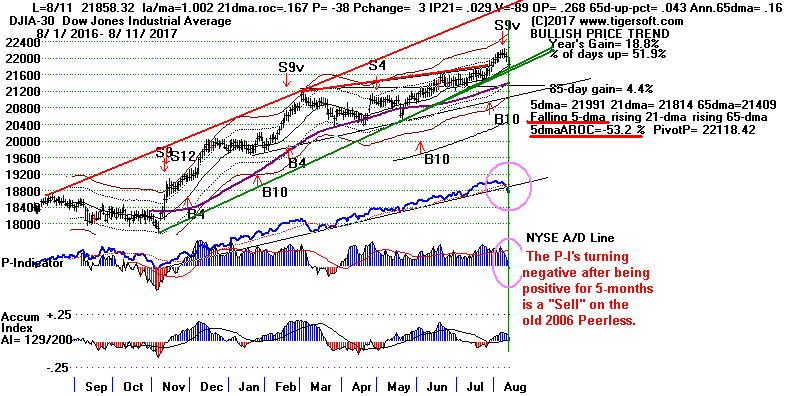
Stay hedged with some shorts.
Breadth is not good and Professionals have
been
net-sellers for more than a month. At a minimum, we will need to see the
Closing
Powers for DIA, SPY and
QQQ break their downtrends, before believing there
can
be much of a rally. There are almost 4x more MINCP stocks than MAXCPs. The
8-month-long A/D uptrendline has been violated. There are 50% more sectors
with
more stocks below their 65-dma than above it. Only 41% of all the stocks
we follow
have a majority of their stocks below their 65-dma.
The operative Peerless
signal is the new Sell S9-V which takes place between
the DJI's 1.8% and 2.3% upper bands.
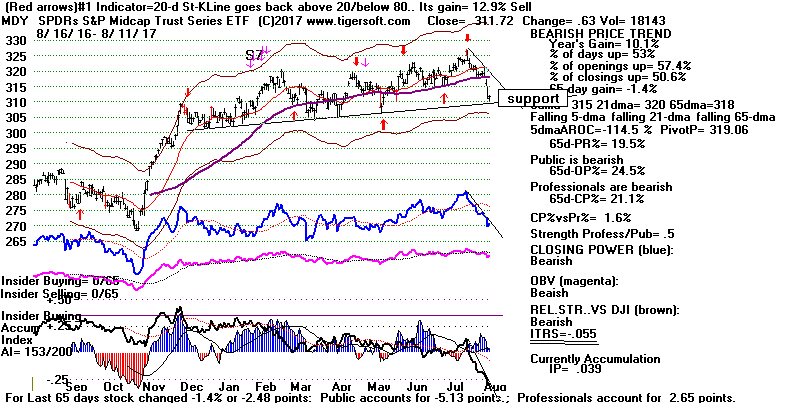
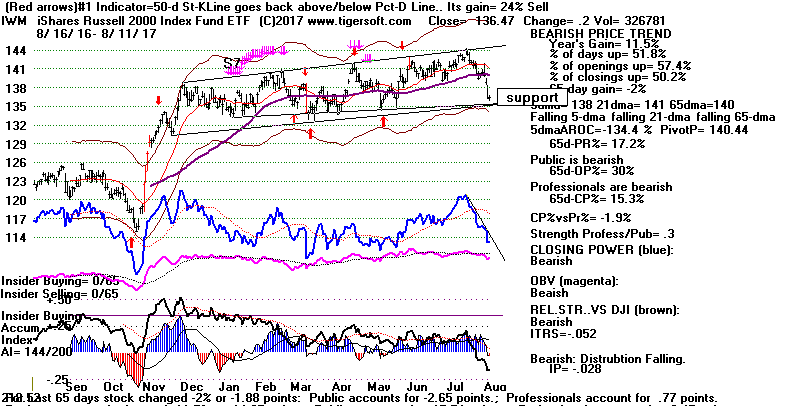
I have suggested going short MDY and
IWM. They are much weaker than the DJI, having broken their 65-dma.
The
Tiger ITRS shows that both the Mid-caps (MDY) and the Russell-2000 (IWM)
have underperformed the DJI by more than 5% over the last 50 trading days.
They also show less "big-money" support. IWM's IP21 (accumulation) is less
than
zero. Only 45.4% of the Russell-1000's stocks are now above their 65-dma.
In other words, most will potentially face resistance from their 65-dma on the
next rally.
The DJI-13 and Nifty-30
At the end of bull markets we usually see just a
handful of high-priced DJI and
tech stocks still rallying. This is what holds up the DJI-30 Index because
of how
it is weighted. This is also what gives the appearance to the Public that
all is
still well. And for performance-minded fund managers, these are the stocks
they play on the long-side until the final collapse.
AAPL is one of those
stocks now.
At the year 2000 market top, AAPL did not top out until March 22, 2000, 14 weeks
after the DJIA peaked.
When in
October 2007 the DJI's long advance from 2003
came to an end,
AAPL did not stop advancing. It did
not make its final high until
December 27th. So, AAPL
may seem an obvious choice
to buy. But it might be
better not to buy it now near its highs for the year. AAPL is, however, the
highest AI/200 stock in the DJI. A safer buy might be
MSFT. It has
tested
its rising 50-day ma and its Closing Power downtrend-line has just been broken.
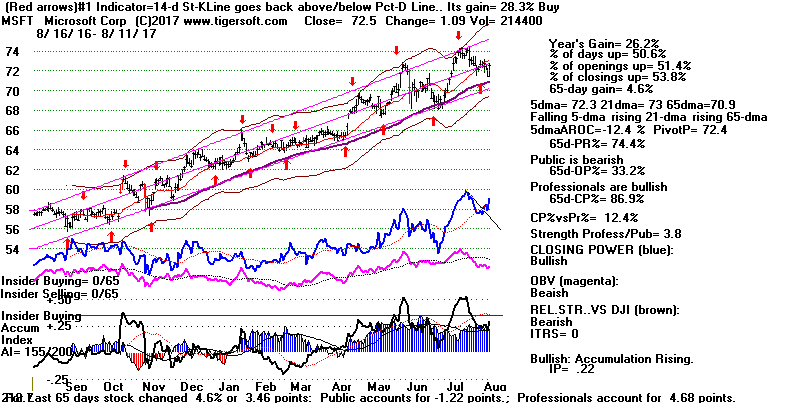
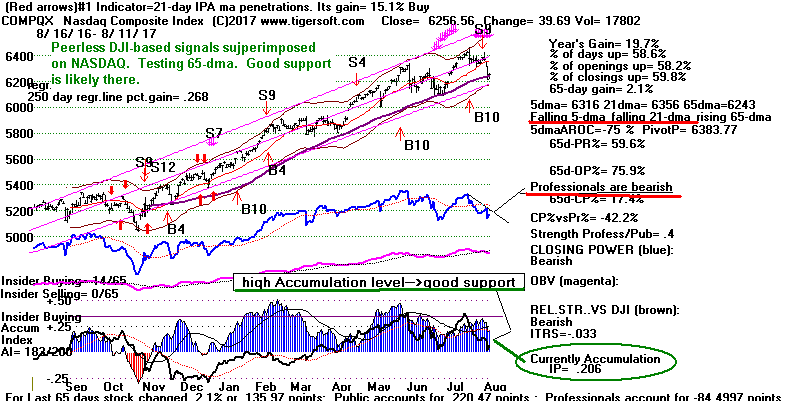
NASDAQ, SPY and QQQ
The NASDAQ refused to break below its 65-dma on Friday. Its high level
of Accumulation shows big buyers are still holding it up.
If there is a
rally from here, as seems likely because of Friday's successful test, it will be
the fourth from the 65-dma since last November. That is "pushing our
luck",
in a manner of speaking. The Closing power is still weak. So, beware
of
an up-opening that goes nowhere afterwards. The 21-day ma at 6356 should
act as resistance.
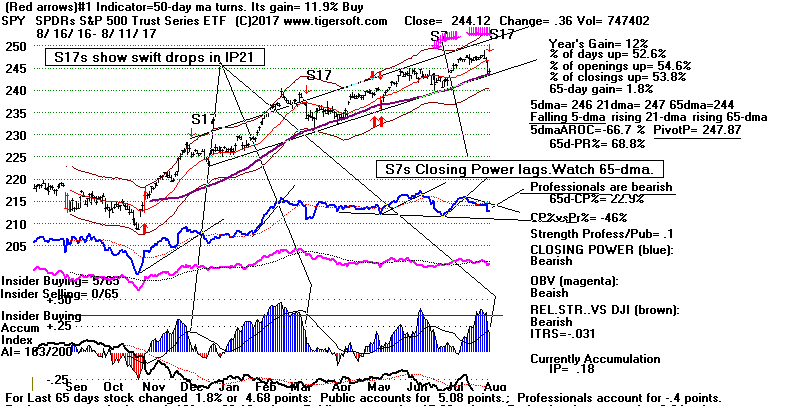
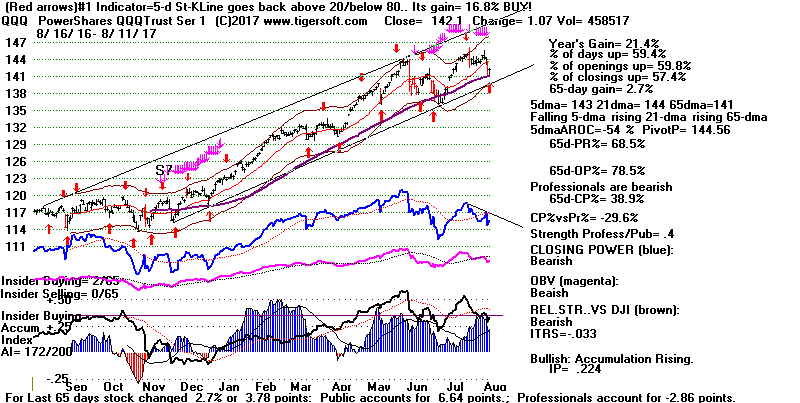
The SP-500, SPY (below) and
QQQ (below) did not break their 65-dma in
the pandemonium of the new Korean Missile Crisis. They will
rally for a day or two,
barring more bellicosities. Both show considerable Accumulation, but their
Closing Powers are still pointed lower. So, it remains to be seen how far
they will
rally. Who are the buyers? Market makers who want to sell some of
the stock
they took in this past week. Big bank program-traders in the futures'
markets.
Folks who have been conditioned to think that every dip is a buying opportunity.
Short-term traders who can work with sell stops just beneath their rising
65-dma.
But don't trust them. They may unwind their long positions very quickly. When we
look at their Tiger Day Traders Tool
indicators, we see
that there has been consistently
more downside potential than upside potential after
the
opening for some time.
So, buying on
a strong opening is probably not a good idea.
Rather,
short-term traders who do not like our Sell S9-V should buy on intra-day
declines back to the level of the previous day's close and then watch to
be sure the 65-day moving averages for NASDAQ, SPY and QQQ are not
violated.


8/11/2017
PEERLESS
DJI, Signals, Indicators Daily
DJI Split Volume 10-DayUp/Down
Vol
Hourly DJIA A/D Line
for All Stocks
DJIA
S&P
OEX
NYSE
NASDAQ
COMPQX
with CP
DIA
SPY
QQQ
MDY
IWM-TNA
Short Term Interest Rates
DJI-Utilities
DJI-Transp
Nifty-30 Index
CrudeOil FAS
GLD
BBH
IBB
JETS
JNUG
KOL
NUGT
OIH
OIL
RSX
RETL SDS
SLV
SOXL
TECL
TMF
TNA XIV YINN
Commodities: JJC, NIB,
WEAT UUP (Dollar)
To
STOCKS' CHARTS
AAPL ADBE
ALXN
AMAT
AMGN
AMZN BA
BIDU
CAT
FB
GOOG
GS
HD
IBM JPM M
(Macy's) MASI
MSFT
NVDA QCOM
TSLA
TXN
new
CMG (Chipotle),
LRCX, SWKS,
TOWN
Ohers REN, CVE
and SWN (very low AI/200 stocks)
8/11/2017
Bullish MINCPs
Bearish MINCPs
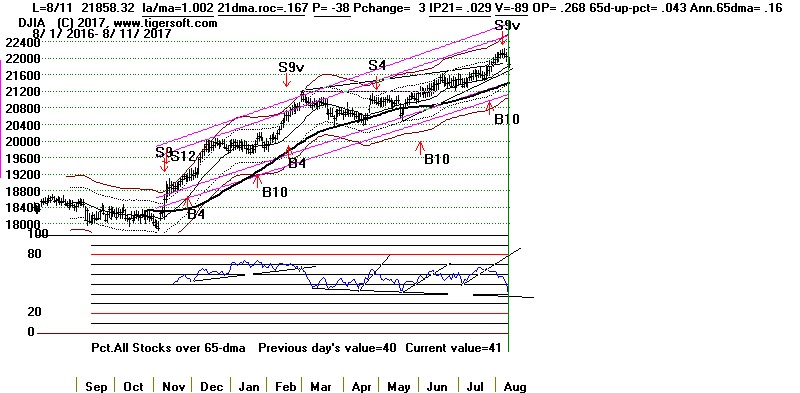
 RANKING OF KEY DIRECTORIES BASED PCT.OF STOCKS ABOVE 65-DMA
               8/11/17
Bearish = 27
Bullish = 18
---------------------------------------------------------------------------------------
Directory     Current       day-1         day-2         day-3         day-4         day-5
----------------------------------------------------------------------------------------
BEVERAGE       .75           .7            .7            .8            .75           .8
HOMEBLDG       .722          .722          .777          .722          .722          .722
BIGBANKS       .714          .714          .857          .857          .857          .857
UTILITY        .711          .755          .8            .866          .8            .777
ETFS           .705          .691          .852          .911          .911          .926
DOWJONES       .7            .733          .733          .733          .733          .8
NIFTY          .7            .666          .733          .733          .833          .733
BONDFUND       .696          .651          .83           .875          .928          .919
DJI-13         .692          .769          .769          .769          .692          .846
GOLD           .679          .66           .584          .452          .433          .452
COMODITY       .676          .661          .732          .647          .647          .633
N=11
==============================================================================================
CHINA          .612          .612          .693          .758          .693          .677
INSURANC       .588          .617          .705          .735          .794          .794
SOLAR          .578          .578          .631          .736          .736          .736
SP-100         .577          .597          .68           .67           .701          .711
GAMING         .571          .571          .607          .607          .714          .678
MILITARY       .533          .533          .644          .622          .644          .666
INDEXES        .518          .49           .64           .654          .654          .649
N=7
==============================================================================================
SP500          .472          .472          .569          .599          .625          .629
FINANCE        .461          .483          .615          .659          .703          .703
INDMATER       .459          .469          .51           .51           .561          .581
RUS-1000       .454          .451          .564          .583          .614          .607
NASD-100       .444          .411          .5            .522          .566          .555
MORNSTAR       .42           .403          .609          .634          .714          .676
BIOTECH        .401          .358          .448          .48           .519          .519
REIT           .388          .455          .481          .518          .575          .564
GREEN          .387          .419          .58           .612          .612          .677
EDU            .375          .375          .5            .375          .375          .625
SEMI           .37           .344          .474          .534          .491          .465
INFRA          .363          .454          .454          .545          .545          .545
COMPUTER       .36           .36           .4            .44           .4            .4
CHEM           .347          .347          .402          .43           .5            .472
N=14
=============================================================================================
PIPELINE       .333          .333          .222          .222          .222          .222
AUTO           .325          .325          .4            .4            .4            .4
ELECTRON       .322          .311          .437          .475          .453          .448
TRANSP         .3            .3            .3            .4            .45           .45
RETAIL         .293          .31           .465          .5            .517          .5
FOOD           .285          .214          .5            .428          .5            .357
SOFTWARE       .281          .296          .406          .453          .484          .453
HACKERS        .222          .277          .333          .333          .388          .277
JETS           .222          .222          .222          .222          .222          .222
OILGAS         .196          .221          .291          .297          .297          .354
REGBANKS       .194          .277          .444          .555          .5            .583
HOSPITAL       .142          .142          .142          .142          .142          .285
COAL           .111          .111          .333          .222          .333          .333
N=13
==============================================================================
8/10/2017 The operative Peerless
signal is the new Sell S9-V that can take place
between the 1.8% and 2.3% upper bands when the V-I is negative and
the A/D Line does not confirm a new DJI price high. In three of the
four previous cases, the DJI declined below its lower band. In the
other case, that is all the further it fell.
Here are the past trading results of this particular type of Sell S9-v:
1) 8/14/1929 - Also
an S4. Huge drop after one last rally.
Peerless Short Sale Gain on DJI = +40.9%
2) 8/10/1936 at peak
Declined only to lower band and quickly reversed upwards.
Peerless Short Gain on DJI = +4.7%
3) 7/6/1943
Declined below lower band after bounce up.
Peerless Gain = +4.7%
4) 7/16/1999
Declined below lower band after bounce up.
Peerless Gain = +10.6%
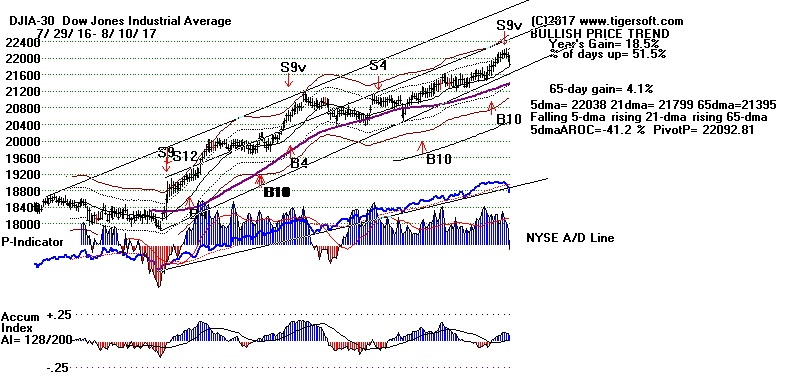

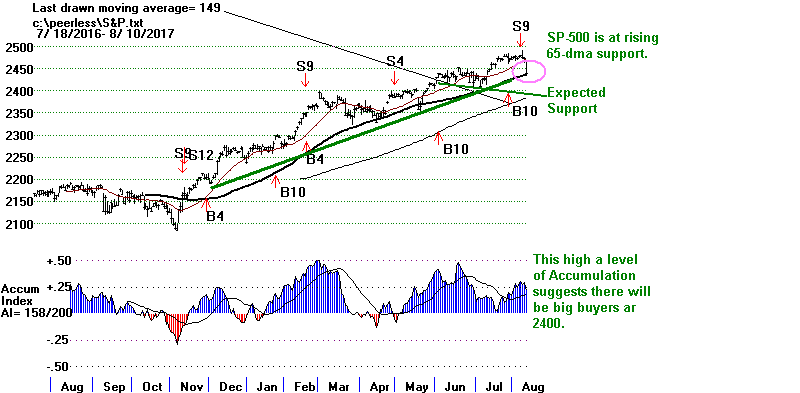
Today's 200 point DJI decline was more than matched by the declines in
IWM and MDY,
which I suggested shorting last night. The DJI remains above its 65-dma
but the NASDAQ
and SP-500 are testing theirs. The Closing Powers are falling for all the
major ETFs: DIA, SPY,
QQQ, IWM and MDY.
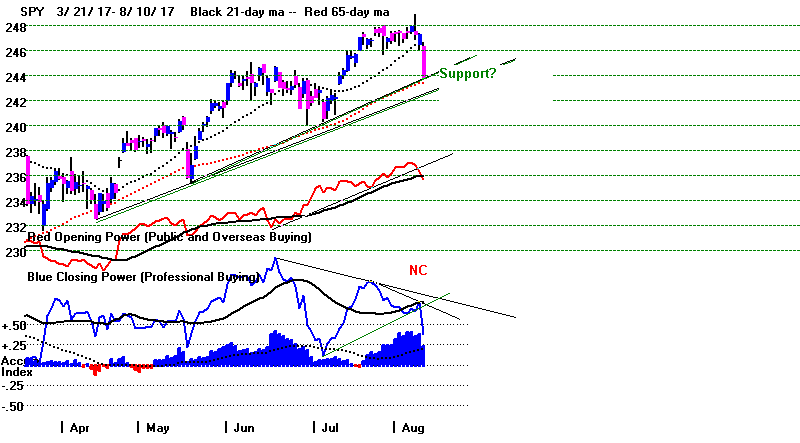
Watch tomorrow to see if the NASDAQ and SP-500 find late support at their
65-dma.
I don't think that they will. The NASDAQ has completed a bearish
"hands-above-the-head"
pattern and is now under-performing the DJI by a wide margin.
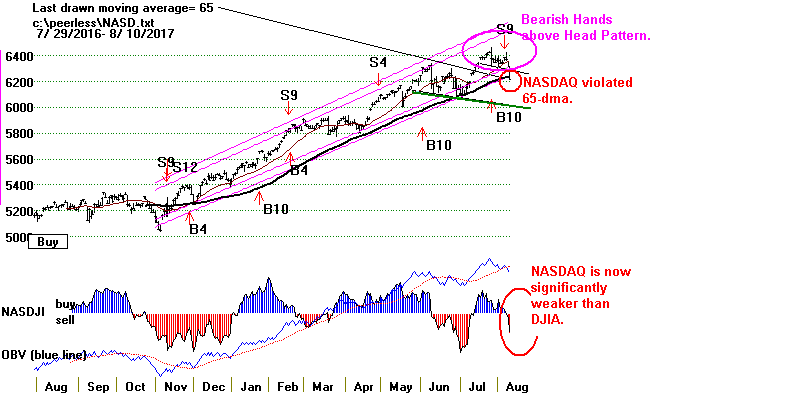
The DJI may try to hold the market up. But
Professionals will not want to hold long
positions on a weekend when nuclear war is a live possibility with two rogue
decision-makers
facing off in a verbal escalation. War is a possibility. No one
wanted or expected war
in August 1914, but bad decision making by autocrats in Austro-Hungry, Germany
and
Russia brought it to pass.
(Listen to
this tragic story:
Sleepwalkers: How Europe Went to War in 1914 - Christopher Clark
)
Even
the Chinese ETFs and NVDA sold off today. There's no point in holding them
if
they cannot hold up any better.
I've noticed that the bids are disappearing in stocks and
ETFs with completed head and
shoulders patterns. Such patterns are commonly seen in the Trap-Door
stocks. We see
these patterns now in
AMD (semi-conductors),
AMGN
(biotechs), DDS
(retail) and MDY.
More and more industry-groups are breaking down.
A Flash Crash
Is Quite Likely
if DJI fails to hold up above its 65-dma.
Based on Wall Street's past behavior in 1987, 1989, 1997, 1999, 2008, 2010,
2011, 2015
and 2016, I would say a "Flash Crash" unleashed by computerized sell programs
and the
use of highly leveraged short ETFs now is likely. At first, it will be
called "investment insurance".
But this behavior is hugely profitable. This, too, is definitely on the
table.
1987 -
http://www.nytimes.com/2012/10/19/business/a-computer-lesson-from-1987-still-unlearned-by-wall-street.html
and
Black Monday (1987)
1989 -
http://www.nytimes.com/1989/10/14/business/the-dow-plunges-190-points-about-7-in-late-selloff-takeover-stocks-hit-hard.html?pagewanted=all
1997 -
Trading Analysis of October 27 and 28, 1997 - SEC.gov
Comparing
This Crisis to Other Financial Crises
1998 -
Timeline Of The Crash
1998 Russian financial crisis
2010 -
https://en.wikipedia.org/wiki/2010_Flash_Crash
2011 -
http://www.motherjones.com/politics/2013/02/high-frequency-trading-danger-risk-wall-street/
2015 -
What happened during the Aug 24 'flash crash' - CNBC.com
2016 -
http://www.investopedia.com/articles/markets/012716/four-big-risks-algorithmic-highfrequency-trading.asp
2017 -
http://www.npr.org/2017/04/12/523534042/as-computer-programs-choose-to-buy-or-sell-wall-street-looks-to-data
and
Algorithmic trading, the Flash Crash, and coordinated circuit breakers
Artificial Intelligence Will Be Crashing The Stock Market In 3-2-1 ...
The
Perils Of Program Trading - Forbes
Too Fast to Fail: How High-Speed Trading Fuels Wall Street
Disasters (Mother Jones)
8/10/2017
PEERLESS
DJI, Signals, Indicators Daily
DJI Split Volume 10-DayUp/Down
Vol
Hourly DJIA A/D Line
for All Stocks
DJIA
S&P
OEX
NYSE
NASDAQ
COMPQX
with CP
DIA
SPY
QQQ
MDY
IWM-TNA
Short Term Interest Rates
DJI-Utilities
DJI-Transp
Nifty-30 Index
CrudeOil FAS
GLD
BBH
IBB
JETS
JNUG
KOL
NUGT
OIH
OIL
RSX
RETL
SLV
SOXL
TECL
TMF
TNA XIV YINN
Commodities: JJC, NIB,
WEAT UUP (Dollar)
To
STOCKS' CHARTS
AAPL ADBE
ALXN
AMAT
AMGN
AMZN BA
BIDU
CAT
FB
GOOG
GS
HD
IBM JPM M
(Macy's) MASI
MSFT
NVDA QCOM
TSLA
TXN
new
CMG (Chipotle),
LRCX, SWKS,
TOWN
Ohers REN, CVE
and SWN (very low AI/200 stocks)
8/10/2017
Bullish
MAXCPs Bearish MINCPs
Only 40% of all stocks and ETFs are above their 65-dma. The 65-dma
is considered the most important probably support level for many stocks.
With so many stocks having broken that level, the next rally or two
will likely face keen resistance.

 RANKING OF KEY DIRECTORIES BASED PCT.OF STOCKS ABOVE 65-DMA
              8/10/17
Bearish =28
Bullish =17
---------------------------------------------------------------------------------------
Directory     Current       day-1         day-2         day-3         day-4         day-5
----------------------------------------------------------------------------------------
DJI-13         .769          .769          .769          .692          .846          .769
UTILITY        .755          .8            .866          .8            .755          .844
DOWJONES       .733          .733          .733          .733          .8            .733
BIGBANKS       .714          .857          .857          .857          .857          .857
HOMEBLDG       .705          .764          .705          .705          .705          .705
BEVERAGE       .7            .7            .8            .75           .8            .75
ETFS           .696          .863          .924          .924          .924          .924
N=7
=============================================================================================
NIFTY          .666          .733          .733          .833          .766          .766
COMODITY       .661          .732          .647          .647          .633          .661
GOLD           .653          .571          .448          .448          .469          .612
BONDFUND       .651          .83           .875          .928          .919          .946
CHINA          .612          .693          .758          .693          .677          .677
INSURANC       .606          .696          .727          .787          .787          .787
SP-100         .597          .68           .67           .701          .711          .659
SOLAR          .578          .631          .736          .736          .736          .684
GAMING         .571          .607          .607          .714          .714          .607
MILITARY       .533          .644          .622          .644          .666          .666
N=10
============================================================================================
INDEXES        .49           .64           .654          .654          .654          .672
FINANCE        .483          .615          .659          .703          .703          .648
INDMATER       .469          .51           .51           .561          .581          .561
SP500          .469          .569          .6            .626          .622          .612
REIT           .455          .481          .518          .575          .575          .575
INFRA          .454          .454          .545          .545          .545          .454
RUS-1000       .443          .558          .578          .609          .601          .594
GREEN          .419          .58           .612          .612          .677          .645
NASD-100       .411          .5            .522          .566          .555          .555
MORNSTAR       .403          .609          .634          .714          .684          .659
BIOTECH        .362          .448          .472          .527          .515          .476
COMPUTER       .36           .4            .44           .4            .4            .36
CHEM           .347          .402          .43           .5            .472          .43

N=13
===========================================================================================
AUTO           .325          .4            .4            .4            .4            .375
ELECTRON       .311          .437          .475          .453          .453          .486
RETAIL         .31           .465          .5            .517          .5            .431
SEMI           .309          .445          .509          .463          .436          .49
TRANSP         .3            .3            .4            .45           .45           .35
SOFTWARE       .296          .406          .453          .484          .453          .453
REGBANKS       .277          .444          .555          .5            .583          .527
HACKERS        .25           .312          .312          .375          .25           .375
OILGAS         .227          .297          .297          .297          .348          .316
JETS           .222          .222          .222          .222          .222          .111
FOOD           .214          .5            .428          .5            .357          .357
EDU            .166          .333          .166          .166          .5            .333
PIPELINE       .142          .142          .142          .142          .142          .142
HOSPITAL       .125          .125          .125          .125          .25           .25
COAL           .111          .333          .222          .333          .333          .222
N=16
==============================================================================
8/9/2017
The operative Peerless signal is the new S9-V. This is a new
signal designed to cope with the DJI's failure in recent years to reach
the full 3.5% band. It can only occur when the DJI makes a new high
1.8% to 2.3% above the 21-day ma and:
1) the V-I is negative,
2) the NYSE A/D Line fails to confirm the DJI new high,
3) there are more decliners than advancers on this day,
4) it is July or August and
5) it is not one of the normally bullish first five days of the month.
MDY
and IWM
are the first big major market ETFs to break the support
of their 65-dma. These should be shorted. Traders may not want to hold
long positions over the weekend because of the threat of war with North Korea
unless prices are lowered quite a bit on Friday.

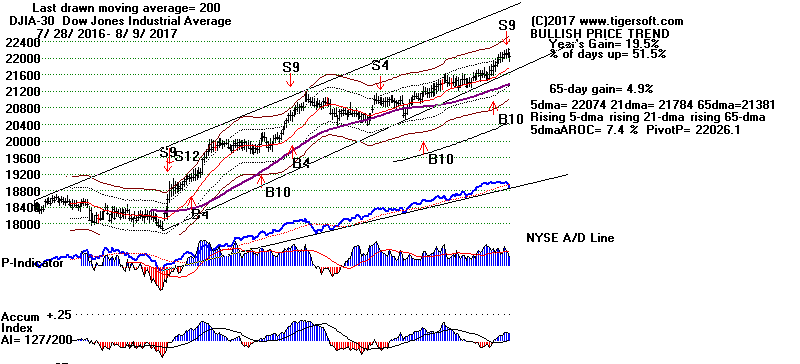

Here are the past trading results of this particular type of Sell S9-v:
1) 8/14/1929 - 20 days before final 1929 peak Also
an S4.
Peerless Gain = +40.9%
2) 8/10/1936 at peak (new signal on this date)
Peerless Gain = +4.7%
3) 7/6/1943 Six trading days before peak.
(new signal on this date)
Peerless Gain = +4.7%
4) 7/16/1999 at peak
Peerless Gain = +10.6%
The DJI has retreated a little since the Sell S9-v. The good news for the
bears is that the long NYSE A/D Line uptrend has been violated. This
usually
brings additional selling in its own right. But bulls will be happy that
the
P-Indicator remains quite positive at +139 and IP21-Accumulation Index
is also positive (+.072). The lower band should hold when tested.
The overall market is weakening. There were more decliners today than
in more than a month. We see a weakening in most of our
general market statistics.
1 The percent of all stocks and ETFs above their 65-dma:
Today just 51%. Yesterday 55%. Downtrending.
See the bearish up-trend-break today. The downtrend
is in control.

2 The number of industry sectors/groups
above their 65-dma:
Only 24 of 45 compared to 28 yesterday. (See table at bottom
of today's Hotline.)
3 Today there were 108 MAXCPs (Closing Power
new highs)
compared with 221 MINCPs (Closing Power new lows).
(This count is derived from the number of stocks in today's
MAXCP and MINCP directories on the Tiger Data Page.)
Professionals are net sellers of a lot more stocks than
than
they are net buyers. This is clearly bearish.
4 Today there were only 46 Tiger
Day-Traders' Tool new highs
compared with 269 Tiger Day-Traders' Tool new highs.
(This count is derived from the number of stocks in today's
TTTNH and TTTNL directories on the Tiger Data Page.)
Day traders are heavily shorting openings now. As long as this
trend continues, there will be weakness. Day Traders were
not fooled by the SPY's last rally. We should look at this
chart more often.
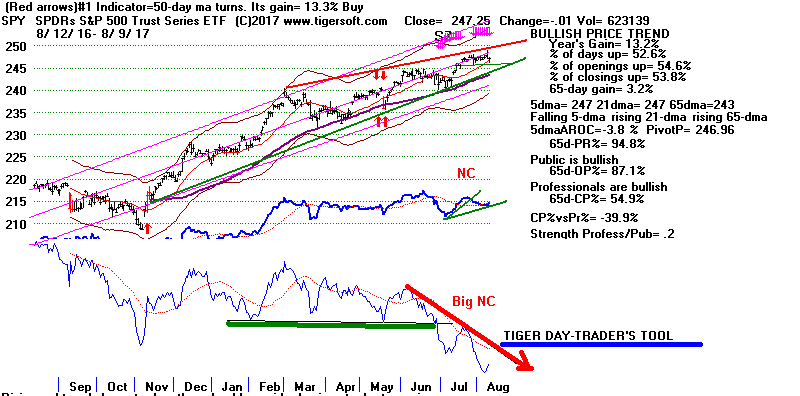
But there remains a plurality of the DJI-30, SP-500 and Russell-1000 stocks
still
are above their 65-dma. Only in the NASDAQ-100 is the percentage
above their 65-dma down to 50%. When this number drops below 50% it
means it that there is more overhead resistance than support and
prices tend to fall most quickly.
Tiger Index of DJI-30 Stocks (weighted by avg price x volume)
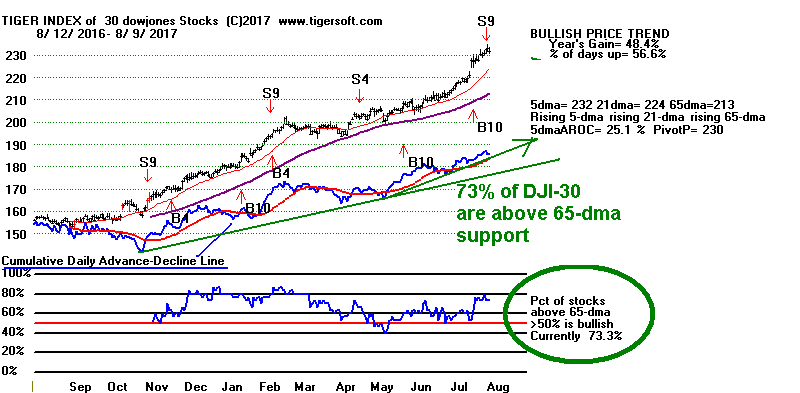 |
Tiger Index of SP-500 Stocks (weighted by avg price x volume)
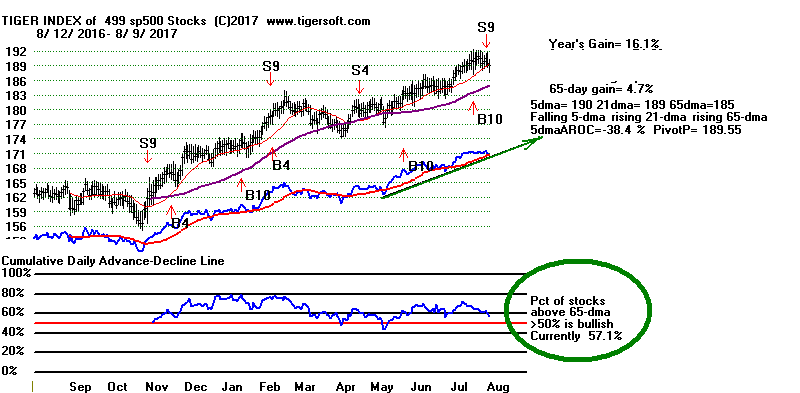 |
Tiger Index of Russell-1000 Stocks (weighted by avg price x volume)
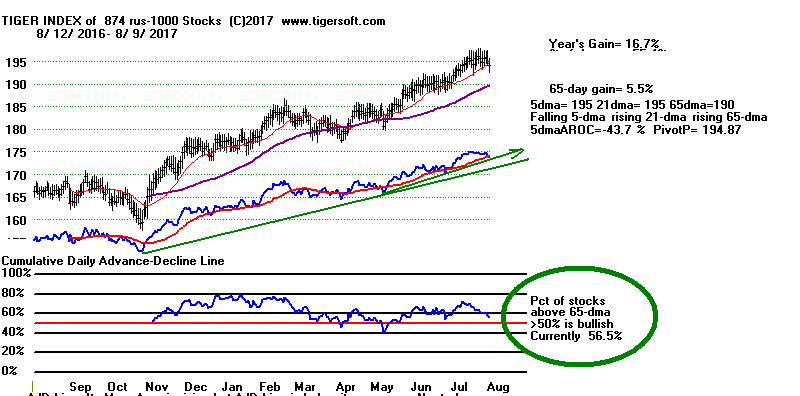 |
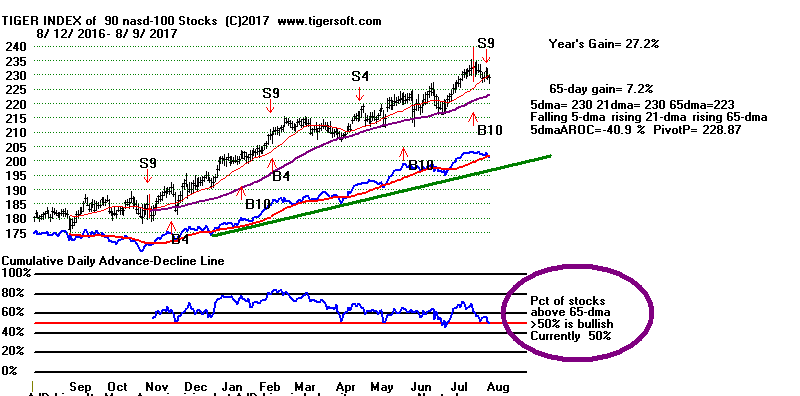
It looks like Mid-Caps (MDY) and the
Russ-2000 (IWM) are the weakest.
We see this in their price charts. They both closed below their 65-dma
today. But even here, they still show bullish blue Accumulation.
From the charts of DIA and SPY,
we still see the notation "Bullish
Closing Power-Professional Buying". This results from the fact that
the Closing Power remains slightly above its rising 21-day ma. Unless
the Closing Powers breakdown for DIA and SPY and return a "bearish"
notation, I would think the markets will turn back up for one more try,
at least, if only not to buckle under the threat of war with North Korea.
65-day ma.
Right now, the Openings have become quite weak. If the Closings also
turn weak, the market will start to fall quite sharply. Let's stay short
a good number of the Bearish MINCPs and take profits in most other
stocks, except the foreign ETFs and Chinese stocks.
MDY and IWM
should be shorted because of their drop below the 65-dma.
8/9/2017
PEERLESS
DJI, Signals, Indicators Daily
DJI Split Volume 10-DayUp/Down
Vol
Hourly DJIA A/D Line
for All Stocks
DJIA
S&P
OEX
NYSE
NASDAQ
COMPQX
with CP
DIA
SPY
QQQ
MDY
IWM-TNA
Short Term Interest Rates
DJI-Utilities
DJI-Transp
Nifty-30 Index
CrudeOil FAS
GLD
BBH
IBB
JETS
JNUG
KOL
NUGT
OIH
OIL
RSX
RETL
SLV
SOXL
TECL
TMF
TNA XIV YINN
Commodities: JJC, NIB,
WEAT UUP (Dollar)
To
STOCKS' CHARTS
AAPL ADBE
ALXN
AMAT
AMGN
AMZN BA
BIDU
CAT
FB
GOOG
GS
HD
IBM JPM M
(Macy's) MASI
MSFT
NVDA QCOM
TSLA
TXN
new
CMG (Chipotle),
LRCX, SWKS,
TOWN
Ohers REN, CVE
and SWN (very low AI/200 stocks)
8/9/2017
Bullish
MAXCPs Bearish MINCPs
 RANKING OF KEY DIRECTORIES BASED PCT.OF STOCKS ABOVE 65-DMA
               8/9/17
Bullish = 24
Bearish = 19
---------------------------------------------------------------------------------------
Directory     Current       day-1         day-2         day-3         day-4         day-5
----------------------------------------------------------------------------------------
ETFS           .863          .924          .924          .924          .924          .924
BIGBANKS       .857          .857          .857          .857          .857          .857
BONDFUND       .83           .875          .928          .919          .946          .919
UTILITY        .8            .866          .8            .755          .844          .8
HOMEBLDG       .777          .722          .722          .722          .722          .722
DJI-13         .769          .769          .692          .846          .769          .769
DOWJONES       .733          .733          .733          .8            .733          .733
NIFTY          .733          .733          .833          .766          .766          .8
COMODITY       .732          .647          .647          .633          .661          .69
BEVERAGE       .7            .8            .75           .8            .75           .8
INSURANC       .696          .727          .787          .787          .787          .878
CHINA          .693          .758          .693          .677          .677          .661
SP-100         .68           .67           .701          .711          .659          .711
N=13
--------------------------------------------------------------------------------------------
SOLAR          .666          .8            .8            .8            .733          .8
MILITARY       .644          .622          .644          .666          .644          .644
INDEXES        .64           .654          .654          .654          .668          .705
FINANCE        .615          .659          .703          .703          .637          .692
MORNSTAR       .609          .634          .714          .684          .659          .697
GAMING         .607          .607          .714          .714          .607          .607
GREEN          .58           .612          .612          .677          .612          .677
GOLD           .571          .448          .448          .469          .612          .673
SP500          .571          .599          .625          .623          .613          .619
RUS-1000       .565          .583          .614          .606          .601          .608
INDMATER       .51           .51           .561          .581          .561          .591
N=11
--------------------------------------------------------------------------------------------
EDU            .5            .375          .375          .625          .5            .625
NASD-100       .5            .522          .566          .555          .555          .522
--------------------------------------------------------------------------------------------
REIT           .481          .518          .575          .575          .575          .606
FOOD           .466          .4            .466          .333          .333          .733
RETAIL         .465          .5            .517          .5            .431          .396
REGBANKS       .457          .571          .514          .6            .542          .657
INFRA          .454          .545          .545          .545          .454          .454
BIOTECH        .452          .472          .519          .523          .476          .515
SEMI           .445          .509          .463          .436          .481          .509
ELECTRON       .437          .475          .453          .453          .475          .502
COMPUTER       .416          .458          .416          .416          .375          .5
CHEM           .402          .43           .5            .472          .43           .458
AUTO           .4            .4            .4            .4            .375          .425
SOFTWARE       .396          .444          .476          .444          .444          .46
COAL           .333          .222          .333          .333          .222          .333
HACKERS        .333          .333          .388          .277          .388          .333
N=14
----------------------------------------------------------------------------------------------
TRANSP         .3            .4            .45           .45           .35           .4
OILGAS         .291          .298          .298          .35           .317          .39
JETS           .222          .222          .222          .222          .111          .111
HOSPITAL       .142          .142          .142          .285          .285          .285
PIPELINE       .142          .142          .142          .142          .142          .285
N=5
==============================================================================
8/8/2017
I take the operative Peerless signal to be the new Sell
S9-V I spoke of
yesterday. This occurs in July and August when the DJI is between the
1.8% and 2.3% bands if the V-Indicator is negative, the NYSE A/D Line
does not confirm the DJI's high and declines outnumber advances on the
NYSE on this day. A close above the 2.4% upper band will invoke
a normal S9-V in the Summer when the V-I is negative.
An additional rally is certainly a possibility now, especially in a handful of
techs,
foreign ETFs and defensive dividend-paying stocks. But the advance
is narrowing or as floor trader Art Cashin admits, the market looks "thin",
meaning the aggressive buyers have limited interests and the sellers more and
more must deal with an absence of big bids, hence the increasing number of
"trap-door stocks". His other comments repeat what has been said here
about
how few stocks are making the DJI-30 look so good.
(
https://www.cnbc.com/video/2017/08/08/veteran-trader-art-cashin-extraordinarily-thin-markets-leading-to-disproportionate-moves.html
)

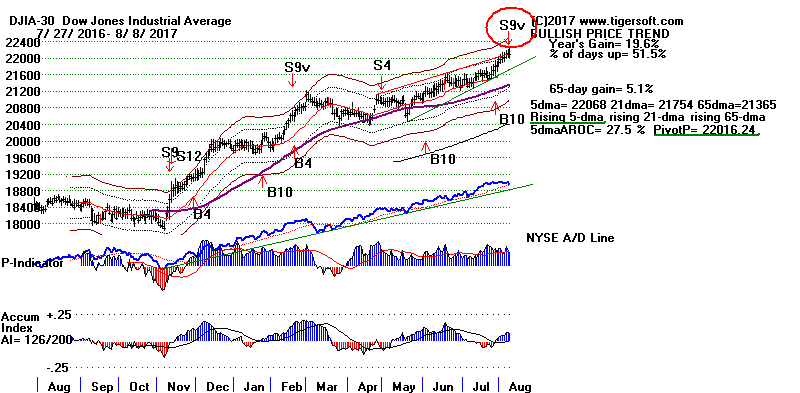

I would add, the market has been rallying much more because of
strong openings rather than strong closings. Our Closing Power theory
warns that too often for comfort this is the result either of rigged higher
openings or impulsive Public/overseas buying. This is emotional and
usually wrong when at the same time there is heavy Professional selling
shown by closings below openings.
For the time being, DIA's Closing Power is still above its rising 21-dma.
It would take a drop by the DJI of more than 100 points tomorrow to
cause its 5-day ma to turn down. So, perhaps it will rise closer to the
3.5% band. But, the risks shown by the trap-door stocks are too great
compared to the upside potential.
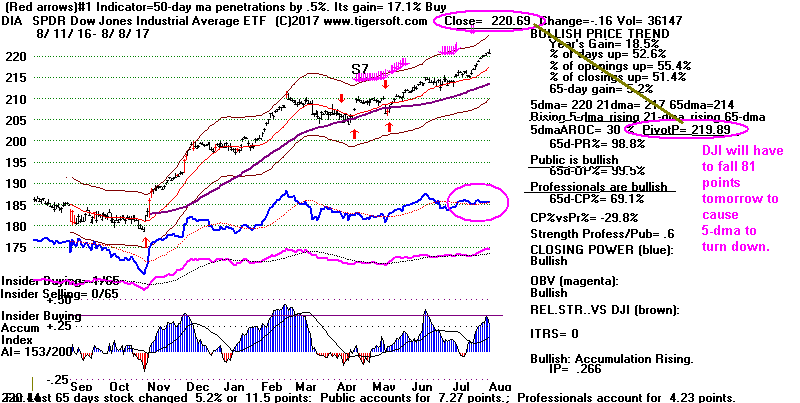
"High Anxieties"
Right now I worry that the DJI will be unable to get up to
the normal
upper 2.4% and give us a regular Sell S9V. I am also concerned about
Peerless users becoming victims of a sudden flash crash caused by
computerized "hedging" and dumping in a market that has now risen more
that eight and a half years without a DJI decline of 20% or more.
It may not take much of a negative surprise to burst the bubble at
this stage. North Korea proved in 1950 that they could upset the
stock market. They could do so again.
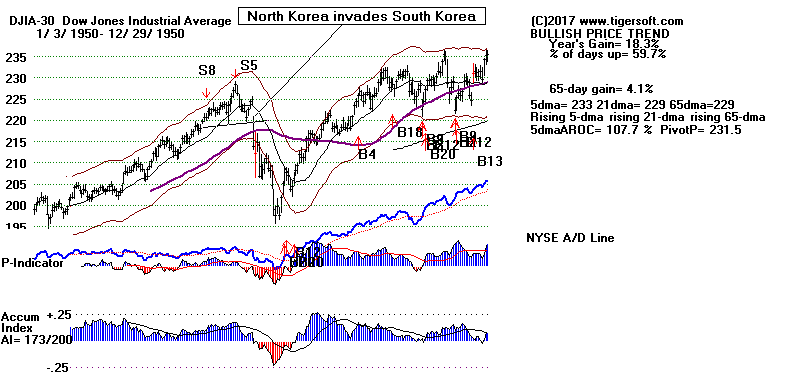

For all these reasons and more, I think we should consider
a revised
Sell S9-V to have been rendered. Below are the rules I have added
to the Sell S9-V tonight.
For i = 1 To rn: adl(i) = adl(i -
1) + adv(i) - dec(i) : next i ' calculates A/D Line values
For i = 22 To rn: XXX=z
If mo(i) < 7 Or mo(i) > 9 Then 818 ' throw out current day if it is not
July or August
If da(i) < 5 Then 818 ' throw out current day it it the
short-term bullish beginning of the month.
If la(i) / ma(i) < 1.0175 Then 818 ' throw out current day if the DJI has close
less than 1.75% above the 21-dma
If la(i) / ma(i) > 1.024 Then 818 ' throw out current day if the DJI has
close is more than 2.40 above the 21-dma
' these cases will be handled by normal S9V rules.
If pvv(i) > 0 Then 818 ' throw out cases where V-Indicator is above 0.
If adv(i) > dec(i) Then 818 ' throw out cases where day's advancers are greater
than decliners.
' routine calculates yearly high and A/D Line high
pricehigh = -999999999
adlhigh = -9999999
For j = 1 To i - 1
If la(j) > pricehigh Then pricehigh = la(j)
If adl(j) > adlhigh Then adlhigh = adl(j)
Next j
If la(i) > pricehigh And adl(i) < adlhigh Then xxx = 123 'OK only if DJI made a
new high and A/D Line did not.
If xxx = 123 Then pi = i: victory = 1: s9(i) = 9: : ms(i) = 9: : : Sells9arrows
(pi): ' puts S9V arrow on screen
818 Next i ' This is the last statement in the loop that looks at days 21
through rn, the length of the file.
Below are the four earlier cases where this would have
applied:
8/24/1929 - two weeks before final 1929 peak
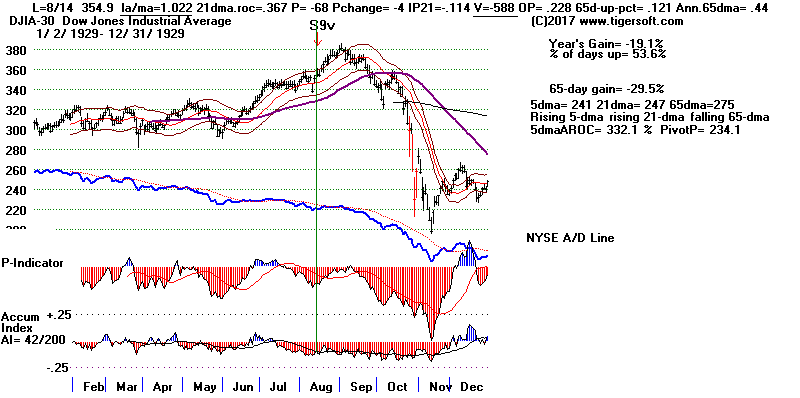 |
8/10/1936 (new signal on this date)
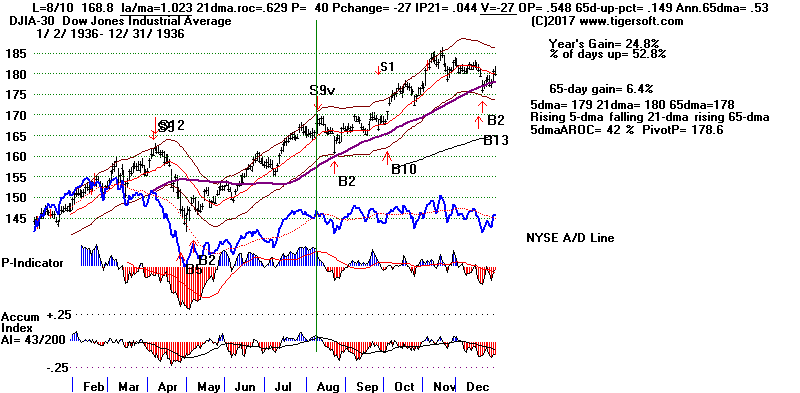 |
7/6/1943 Six trading days before peak.
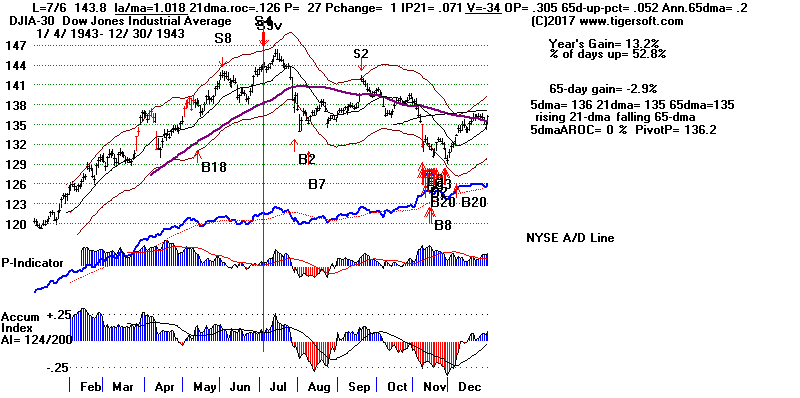 |
7/16/1999
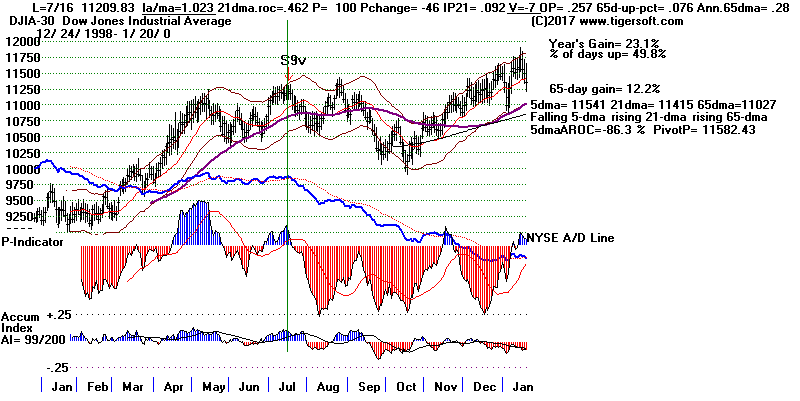 |
8/7/2017
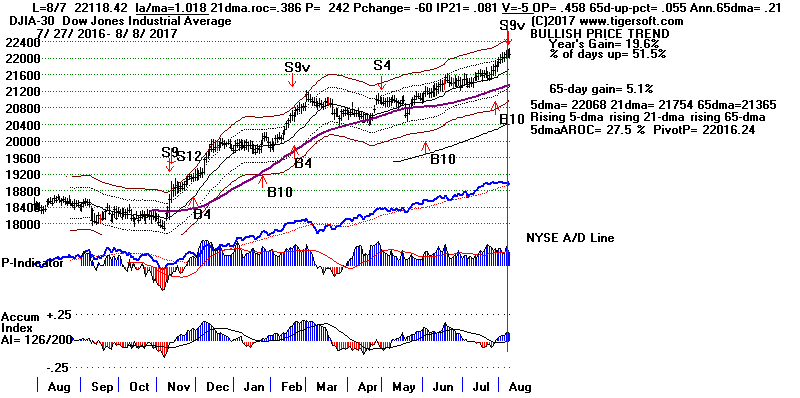 |
8/8/2017
PEERLESS
DJI, Signals, Indicators Daily
DJI Split Volume 10-DayUp/Down
Vol
Hourly DJIA A/D Line
for All Stocks
DJIA
S&P
OEX
NYSE
NASDAQ
COMPQX
with CP
DIA
SPY
QQQ
MDY
IWM-TNA
Short Term Interest Rates
DJI-Utilities
DJI-Transp
Nifty-30 Index
CrudeOil FAS
GLD
BBH
IBB
JETS
JNUG
KOL
NUGT
OIH
OIL
RSX
RETL
SLV
SOXL
TECL
TMF
TNA XIV YINN
Commodities: JJC, NIB,
WEAT UUP (Dollar)
To
STOCKS' CHARTS
AAPL ADBE
ALXN
AMAT
AMGN
AMZN BA
BIDU
CAT
FB
GOOG
GS
HD
IBM JPM M
(Macy's) MASI
MSFT
NVDA QCOM
TSLA
TXN
new
CMG (Chipotle),
LRCX, SWKS,
TOWN
Ohers REN, CVE
and SWN (very low AI/200 stocks)
8/7/2017
Bullish
MAXCPs Bearish MINCPs
 RANKING OF KEY DIRECTORIES BASED PCT.OF STOCKS ABOVE 65-DMA
               8/8/17
Bullish = 28
Bearish = 17
---------------------------------------------------------------------------------------
Directory     Current       day-1         day-2         day-3         day-4         day-5
----------------------------------------------------------------------------------------
ETFS           .911          .911          .911          .911          .911          .941
BONDFUND       .875          .928          .919          .946          .919          .937
UTILITY        .866          .8            .755          .844          .8            .733
BIGBANKS       .857          .857          .857          .857          .857          1
BEVERAGE       .8            .75           .8            .75           .85           .75
DJI-13         .769          .692          .846          .769          .769          .692
CHINA          .758          .693          .677          .677          .661          .709
SOLAR          .736          .736          .736          .684          .736          .736
INSURANC       .735          .794          .794          .794          .882          .882
DOWJONES       .733          .733          .8            .733          .733          .766
NIFTY          .733          .833          .766          .766          .8            .8
HOMEBLDG       .722          .722          .722          .722          .722          .722
SP-100         .67           .701          .711          .659          .721          .731
N=13
-------------------------------------------------------------------------------------------
FINANCE        .659          .703          .703          .637          .692          .747
INDEXES        .654          .654          .654          .668          .71           .728
COMODITY       .647          .647          .633          .661          .69           .69
MORNSTAR       .634          .714          .684          .659          .701          .739
MILITARY       .622          .644          .666          .644          .644          .644
GREEN          .612          .612          .677          .612          .677          .709
SP500          .601          .625          .623          .613          .619          .641
GAMING         .6            .7            .7            .6            .6            .7
RUS-1000       .584          .614          .606          .601          .607          .641
REGBANKS       .555          .5            .583          .527          .611          .638
INFRA          .545          .545          .545          .454          .454          .454
NASD-100       .537          .58           .569          .569          .537          .591
SEMI           .534          .491          .465          .508          .534          .663
REIT           .518          .575          .575          .575          .606          .663
INDMATER       .51           .561          .581          .561          .591          .612
N=15
-------------------------------------------------------------------------------------------
ELECTRON       .5            .479          .479          .494          .52           .613
RETAIL         .5            .517          .5            .431          .396          .534
BIOTECH        .476          .519          .515          .484          .523          .539
SOFTWARE       .453          .484          .453          .453          .468          .562
GOLD           .452          .471          .49           .603          .641          .735
COMPUTER       .44           .4            .4            .36           .48           .52
CHEM           .43           .5            .472          .43           .458          .472
AUTO           .4            .4            .4            .375          .425          .5
FOOD           .4            .466          .333          .333          .733          .6
TRANSP         .4            .45           .45           .35           .4            .4
EDU            .375          .375          .625          .5            .625          .5
N=11
--------------------------------------------------------------------------------------------
HACKERS        .333          .388          .277          .388          .333          .388
PIPELINE       .333          .333          .222          .222          .333          .222
OILGAS         .31           .303          .348          .316          .386          .379
COAL           .222          .333          .333          .222          .333          .333
JETS           .222          .222          .222          .111          .111          .222
HOSPITAL       .142          .142          .285          .285          .285          .285
N=6
==============================================================================
8/7/2017
The two Buy B10s stand un-reversed, but after 10
straight up-days,
a decline is due. Today's DJI rise is worrisome Not only did the DJI
close 1.8% over the 21-day ma, but the V-Indicator slipped back into
negative territory and the A/D Line failed to confirm the DJI's high
since there were 121 more decliners than advancers on the NYSE.
I've previously shown that streaking up-days usually
precede
a top by 2-4 weeks. New research tonight based on today's
non-confirming technicals when they take place with the DJI
1.8% above the 21-dma in the Summer gives only two prior cases
to study, But in both instances, the DJI made one more advance to new
highs
a week later. Then began an intermediate-term decline to
the lower band. This and what I call the new S3 experimental
signals in tonight's research show that there is probably not
much upside potential immediately ahead.
Given the ferocity
of new sell-offs under the influence of computerized program
trading, it seems like it might be a good idea to take some profits
and initiate new short positions in our
Bearish MINCPs.
We cannot help have noticed how difficult it has
been for the
DJI to fully tag the upper 3.5% band these last few years.
I worry that the DJI will not be able to get to the 2.4% upper band
to give us a standard Sell S4. At least, until Professionals become
net buyers and the Closing Power downtrends are broken, we
should be cautious.
The next surge that takes the DJI to the upper
2.4% band or higher will probably feature strength from the
highest priced DJI stocks. I would think that AAPL and the big bank
and semi-conductor stocks will lead such an advance. I would
also stay long the foreign ETFs, especially the Chinese ETFs
and stocks. Watch
to see if NVDA can sustain its breakout today
above 170. If it cannot, that will not be a good sign.
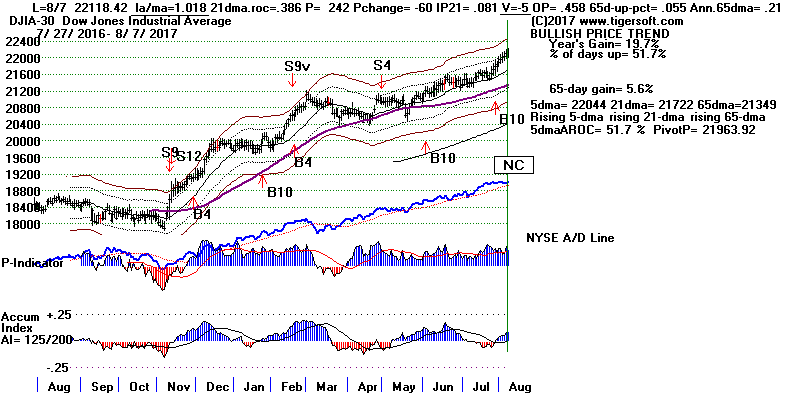

What is the past history when the DJI makes a new high,
1.75% or
more above the 21-dma with the V-I negative and the A/D Line failing
to confirm with more down than up on the NYSE? As with S9-Vs,
we only want to consider the cases between June and September.
A/D Line NC - V-I NNCs
--------------------- Estimated Up and Down Volume
----------------------------------------
1929 4 of these signals appeared from 6/27 to
8/21 2 weeks before top)
1935 Only of the 3 signals would have been profitable. The good one
occurred on 9/12 at the 3.4% upper band. Also a standard S2 there.
1936 8/10 new signal was perfect. No standard Peerless signal.
Occurred at 2.3% upper band. DJI fell to lower band.
1943 7/6 new signal took place a week before final top. DJI then
fell 12%. This signal occurred at the 1.8% upper band (where we
are now).
1954 9/28 new signal immediately followed by a drop to 1.75% lower band.
This took place at the 3.6% upper band. There was no standard Peerless
sell.
--------------------- Reliable Volume Data below
-------------------------------------------------
la/ma V-I P-I IP21 Standard
Signal Also Outcome
7/17/1999 1.0375 -15
16 +.05 yes
decline to lower band
8/16/1999 1.018 -136 -483 -.047
yes
12% decline began a week later.
7/16/2007 1.028 -60
88 -.003 yes
8% decline immediately begun.
9/25/2007 1.025 -39
47 +.027 yes
two weeks before start of bear mkt.
8/2/2017
1.018 -38 183 +.052 No
1943
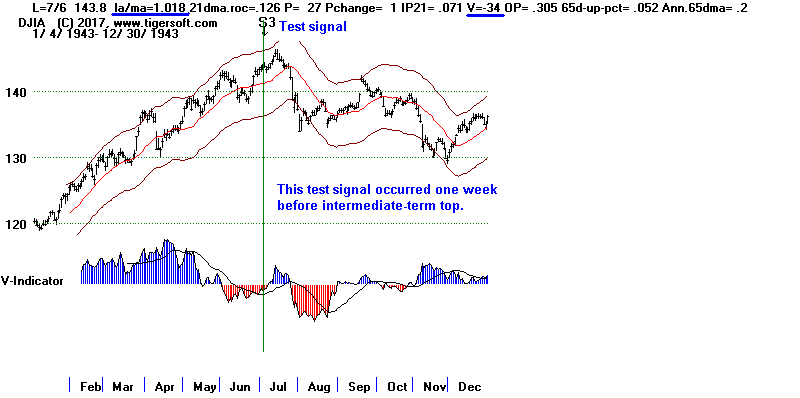 |
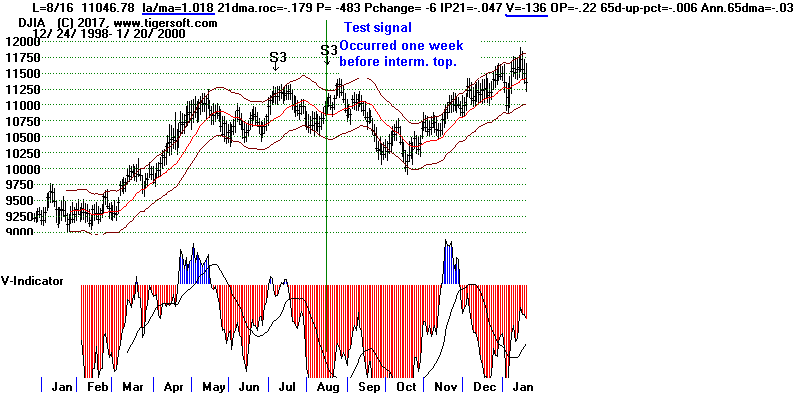 |
8/7/2017
PEERLESS
DJI, Signals, Indicators Daily
DJI Split Volume 10-DayUp/Down
Vol
Hourly DJIA A/D Line
for All Stocks
DJIA
S&P
OEX
NYSE
NASDAQ
COMPQX
with CP
DIA
SPY
QQQ
MDY
IWM-TNA
Short Term Interest Rates
DJI-Utilities
DJI-Transp
Nifty-30 Index
CrudeOil FAS
GLD
BBH
IBB
JETS
JNUG
KOL
NUGT
OIH
OIL
RSX
RETL
SLV
SOXL
TECL
TMF
TNA XIV YINN
Commodities: JJC, NIB,
WEAT UUP (Dollar)
To
STOCKS' CHARTS
AAPL ADBE
ALXN
AMAT
AMGN
AMZN BA
BIDU
CAT
FB
GOOG
GS
HD
IBM JPM M
(Macy's) MASI
MSFT
NVDA QCOM
TSLA
TXN
new
CMG (Chipotle),
LRCX, SWKS,
TOWN
Ohers REN, CVE
and SWN (very low AI/200 stocks)
8/7/2017
Bullish
MAXCPs Bearish MINCPs
 RANKING OF KEY DIRECTORIES BASED PCT.OF STOCKS ABOVE 65-DMA
               8/7/17
Bullish = 28
Bearish = 15
---------------------------------------------------------------------------------------
Directory Current day-1 day-2 day-3 day-4 day-5
----------------------------------------------------------------------------------------
BONDFUND .928 .919 .946 .919 .937 .937
ETFS .911 .911 .911 .911 .926 .926
BIGBANKS .857 .857 .857 .857 1 1
NIFTY .833 .766 .766 .8 .8 .8
UTILITY .8 .755 .844 .8 .733 .644
INSURANC .794 .794 .794 .882 .882 .911
BEVERAGE .75 .8 .75 .85 .75 .8
SOLAR .736 .736 .684 .736 .736 .736
DOWJONES .733 .8 .733 .733 .766 .733
HOMEBLDG .722 .722 .722 .722 .722 .555
MORNSTAR .714 .684 .659 .701 .739 .735
FINANCE .703 .703 .637 .692 .747 .67
SP-100 .701 .711 .659 .721 .731 .721
GAMING .7 .7 .6 .6 .7 .6
CHINA .693 .677 .677 .661 .693 .677
DJI-13 .692 .846 .769 .769 .692 .615
N=16
===========================================================================================
INDEXES .654 .654 .668 .71 .724 .757
COMODITY .647 .633 .661 .69 .69 .788
MILITARY .644 .666 .644 .644 .644 .666
SP500 .627 .623 .613 .619 .639 .645
RUS-1000 .615 .606 .601 .607 .641 .637
GREEN .612 .677 .612 .677 .677 .741
NASD-100 .58 .569 .569 .537 .58 .569
REIT .575 .575 .575 .606 .673 .647
INDMATER .561 .581 .561 .591 .612 .581
INFRA .545 .545 .454 .454 .454 .545
BIOTECH .523 .515 .476 .531 .535 .566
RETAIL .517 .5 .431 .396 .517 .482
N=12
==========================================================================================
CHEM .5 .472 .43 .458 .472 .388
REGBANKS .5 .583 .527 .611 .638 .527
==========================================================================================
SEMI .491 .465 .508 .534 .663 .681
SOFTWARE .484 .453 .453 .468 .578 .531
ELECTRON .479 .479 .5 .52 .613 .623
FOOD .466 .333 .333 .733 .6 .866
GOLD .452 .49 .622 .66 .716 .773
TRANSP .45 .45 .35 .4 .4 .4
AUTO .4 .4 .375 .425 .5 .475
COMPUTER .4 .4 .36 .48 .52 .56
HACKERS .388 .277 .388 .333 .444 .333
EDU .375 .625 .5 .625 .5 .25
N=10
===========================================================================================
COAL .333 .333 .222 .333 .333 .333
PIPELINE .333 .333 .222 .333 .222 .222
OILGAS .31 .354 .316 .386 .367 .398
JETS .222 .222 .111 .111 .222 .222
HOSPITAL .142 .285 .285 .285 .285 .285
N=5
==============================================================================
8/4/2017
PEERLESS remains on two Buy B10s.The odds favor a significant top
not in August but in September if there is to be one. But the DJI is now
1.9% over its 21-day ma. A rally of 120 points will take the DJI to the
2.4% upper band. That will not automatically produce a Peerless Sell.
We will only get a Sell if the V-Indicator drops back below 0. Watch
the NYSE Up and Down volume at the close on Monday. If they are about
the same tomorrow, it will cause the V-I to drop back from +4 to below 0
and this will allow a Sell S9-V if the DJI closes above the 2.4% upper band.
We should believe such a Sell signal. The A/D Line did not confirm the
DJI's new high. Only the DIA among the major ETFs is making new highs.
Professionals are not bullish. The Closing Powers are falling for MDY, QQQ,
IWM, SOXL and IBB. A weak close would turn the Closing Powers down below
its 21-dma for DIA and SPY. On Friday, there were twice as many MINCPs than
MAXCPs. And, the Hourly DISI-OBV is bearishly lagging the DJI rising prices.
The most bearish statistic is that the number of Tiger Day Traders' Tool
lows was 312. There were only 37 TTT new highs.
With the DJI now up 9 straight days, we know that some kind of a pullback
is due soon. How soon will it lead to a decline below the lower band?
We also understand that a bear market (DJI >20% decline) has not been seen
since 2009.A bull market that lasts 8 1/2 years is rare. So one would seem to
be over-due. Couple this with the tendency for DJI declines to quickly become
"flash crashes" because of computerized program trading and we know we
have to be concerned now that the DJI has risen nine straight days.
Nothing will prevent mutual fund managers from loading up on leveraged
short ETFs if that occurs.
NEW STUDY of Streaking Up-Days before Major Tops:
But there is good news for the bulls here. It turns out that in
only 2 of the 17 instances when the DJI rose 8 or more straight days
before a major peak was the top a week or less away. In 12 of the 17
cases, the top was two to fours weeks away. In the three other
cases it was more than two months away. This study reinforces the
conclusion drawn from another study I did a week ago that showed that
September peaks are 50% more likely than August tops.
Days before DJI Peaks following long Up-Day Streaks.
For up-day streaks of 8 or more: 17 cases.
Top immediately: 1 case ( 71)
Top followed in 1 week: 1 case (67)
Top followed in 2-weeks to 4 weeks: 12 cases (6 29 48 59 61 66 68 87 89 90 07 10)
Top followed in 5-12 weeks 2 cases (68 00)
Top followed in more than 3 months. 1 case (66)
8/4/2017
PEERLESS DJI, Signals, Indicators Daily DJI Split Volume 10-DayUp/Down Vol
Hourly DJIA A/D Line for All Stocks
DJIA S&P OEX NYSE NASDAQ COMPQX with CP
DIA SPY QQQ MDY IWM-TNA
Short Term Interest Rates DJI-Utilities DJI-Transp
Nifty-30 Index
CrudeOil FAS GLD BBH IBB JETS JNUG KOL NUGT OIH OIL
RSX RETL SLV SOXL TECL TMF TNA XIV YINN
Commodities: JJC, NIB, WEAT UUP (Dollar)
To STOCKS' CHARTS
AAPL ADBE ALXN AMAT AMGN AMZN BA BIDU CAT FB GOOG GS
HD IBM JPM M (Macy's) MASI MSFT NVDA QCOM TSLA TXN
CMG (Chipotle), LRCX, SWKS, TOWN
Others REN, CVE and SWN (very low AI/200 stocks)
8/4/2017 Bullish MAXCPs Bearish MINCPs
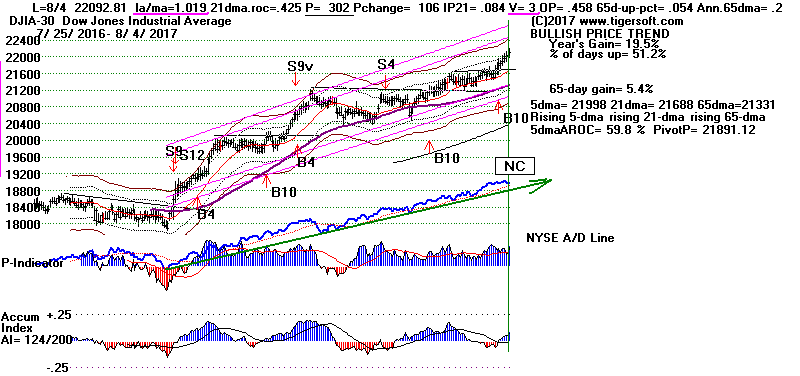

8/4/2017 Bullish MAXCPs Bearish MINCPs
 RANKING OF KEY DIRECTORIES BASED PCT.OF STOCKS ABOVE 65-DMA
               8/4/17
Bullish = 29
Bearish = 15
---------------------------------------------------------------------------------------
Directory     Current       day-1         day-2         day-3         day-4         day-5
----------------------------------------------------------------------------------------
BONDFUND       .919          .946          .919          .937          .937          .892
ETFS           .911          .911          .911          .926          .911          .926
BIGBANKS       .857          .857          .857          1             1             .857
DJI-13         .846          .769          .769          .692          .615          .692
BEVERAGE       .8            .75           .85           .75           .8            .8
DOWJONES       .8            .733          .733          .766          .733          .766
INSURANC       .794          .794          .882          .882          .911          .911
NIFTY          .766          .766          .8            .8            .8            .833
UTILITY        .755          .844          .8            .733          .644          .622
SOLAR          .736          .684          .736          .736          .789          .789
HOMEBLDG       .722          .722          .722          .722          .555          .666
SP-100         .711          .659          .721          .731          .711          .721
FINANCE        .703          .637          .692          .747          .681          .593
GAMING         .7            .6            .6            .7            .633          .6
MORNSTAR       .684          .659          .701          .739          .735          .743
CHINA          .677          .677          .661          .693          .677          .741
GREEN          .677          .612          .677          .677          .741          .709
N=17
==========================================================================================
MILITARY       .666          .644          .644          .644          .666          .666
INDEXES        .654          .668          .71           .724          .757          .771
COMODITY       .633          .661          .69           .69           .788          .76
EDU            .625          .5            .625          .5            .25           .375
SP500          .625          .613          .619          .639          .643          .641
RUS-1000       .607          .601          .607          .641          .635          .632
REGBANKS       .583          .527          .611          .638          .527          .444
INDMATER       .581          .561          .591          .612          .581          .612
REIT           .575          .575          .606          .673          .658          .59
NASD-100       .569          .569          .537          .58           .58           .612
INFRA          .545          .454          .454          .454          .545          .272
BIOTECH        .519          .476          .523          .543          .562          .614
N=12
==========================================================================================
RETAIL         .5            .431          .396          .517          .465          .517
==========================================================================================
ELECTRON       .479          .5            .525          .613          .628          .67
CHEM           .472          .43           .458          .472          .388          .486
GOLD           .471          .622          .679          .735          .754          .773
SEMI           .465          .508          .534          .663          .689          .715
SOFTWARE       .453          .453          .468          .578          .531          .578
TRANSP         .45           .35           .4            .4            .4            .4
AUTO           .4            .375          .425          .5            .475          .475
COMPUTER       .4            .36           .48           .52           .56           .56
OILGAS         .36           .322          .386          .367          .392          .398
N=9
===========================================================================================
COAL           .333          .222          .333          .333          .333          .222
FOOD           .333          .333          .733          .6            .866          .733
PIPELINE       .333          .333          .333          .222          .222          .222
HOSPITAL       .285          .285          .285          .285          .285          .285
HACKERS        .277          .388          .333          .444          .333          .444
JETS           .222          .111          .111          .222          .222          .333
N=6
==============================================================================
8/3/2017
Peerless remains on the double Buy B10s. The DJI made its eighth straight
up-day,
As happened with yesterday's DJI rally, there were a lot more down than up.
Down Volume is picking up dangerously. The 10 day ma of NYSE Down Volume
is now above Up-Volume despite the DJI new high. And the number of
"Trap-door" stocks today rose to 25 from 18. (These are stocks over $5
that
fall 8% or more.)
With the DJI now 1.8% over the 21-day ma, we are only 0.6% away from a
Peerless Sell S9-V. Clearly, the risk of a pullback to the DJI's lower
band would
seem to be quite high. But the DJI is running in all-time high territory.
Hot money
from overseas (because the Dollar looks cheap) and from performance institutions
is being channeled into the higher priced DJI stocks each day now, largely
because this
is where the quickest gains are to be found. So, when we ask: "What is
holding the
market up?", we should see that the DJI's strength is actually not surprising.
It helps
to appreciate that the DJI's most important function is to maintain an
appearance of
market strength to the broad public. Historically, the discrepancy between
the DJI
and the broad market can get much bigger and much more grotesque. (That is
what
distinguished the tops in September 1929, January1973 and January 2000.)
So, intermediate-term Peerless investors in the DJI should not sell yet.
Wait for Peerless to
give a Sell. A top in September is 50% more likely than one in August.
Short-term traders,
however, should be guided by the direction of the Closing Powers and 5-day ma
trends.
Only FAS shows a rising Closing Power and 5dma now. The high (>+.15)
levels of IP21
for DIA, SPY, QQQ, SOXL and TECL do offer us hope that all these ETFs will find
good support at horizontal and 65-dma support.
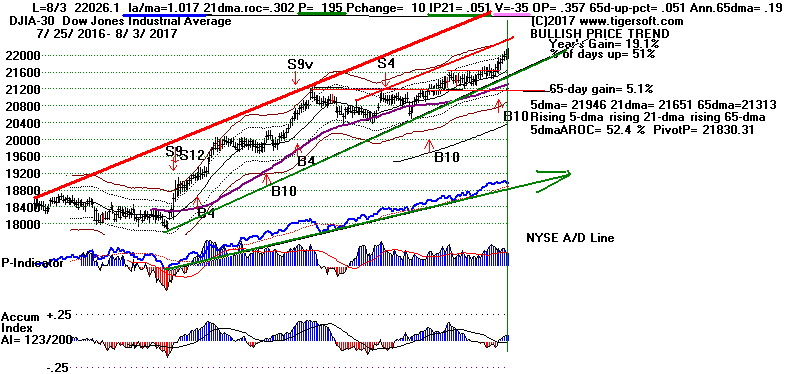

We will watch SOXL tomorrow with interest because expected support should come
in where
it is now, at its rising 65-dma. On the other hand, the Closing Powers for
DIA and SPY
are sitting on their 21-day ma. This acts as CP support. A violation
would show Professionals
expect lower prices over the next week or two.
KEY ETFS
ETF Closing Power 5-dma
8/3/2016 5-dma Pivot
IP21 ITRS
Trend
Trend<> Close
Price for 8/4/2016
50-day rel.str. vs DJI
--------------------------------------------------------------------------------------------
DIA
?
+53.5% 220+.06
218.02
+.276
------
SPY
?
-4.9%
246.96
-.48 246.91
+.353
-.024
QQQ
Falling
-19.8%
143.39 -.56
143.84
+.304
-.022
MDY
Bearish
-67.8%
318.06 -.88 320.88
+.062
-.039 at 65-dma
IWM
Bearish
-99.2%
139.53 -.70
141.96
+.081
-.037 broke 65-dma
SOXL
Falling
-245.7%
91.61 -1.10
95.31
+.231
-.041 at 65-dma
TECL
Falling
-16.3%
82.59 -.85
82.52
+.321 +.036
IBB
Bearish
-82.2%
314.55 -2.49
321.82 +.018
+.029
FAS
Bullish
+92.5%
52.65-.64
52.52
+.134 +.138
YINN
<> Annualized rate of change. 250 times current pct change from previous
day.
(With foreign ETFs, Closing Power is less
important than simple momentum, chart patterns
and the level of intra-day Accumulation (IP21).)
June's new Job number's remain over +200,000.
This seems solid but not so high
as to call for a rate hike.
| |
| Year |
Jan |
Feb |
Mar |
Apr |
May |
Jun |
Jul |
Aug |
Sep |
Oct |
Nov |
Dec |
| 2007 |
240 |
89 |
190 |
80 |
143 |
75 |
-34 |
-20 |
88 |
84 |
114 |
98 |
| 2008 |
17 |
-84 |
-78 |
-210 |
-186 |
-162 |
-213 |
-267 |
-450 |
-474 |
-766 |
-694 |
| 2009 |
-793 |
-702 |
-823 |
-687 |
-349 |
-471 |
-329 |
-213 |
-220 |
-204 |
-2 |
-275 |
| 2010 |
23 |
-68 |
164 |
243 |
524 |
-137 |
-68 |
-36 |
-52 |
262 |
119 |
87 |
| 2011 |
43 |
189 |
225 |
346 |
77 |
225 |
69 |
110 |
248 |
209 |
141 |
209 |
| 2012 |
358 |
237 |
233 |
78 |
115 |
76 |
143 |
177 |
203 |
146 |
132 |
244 |
| 2013 |
211 |
286 |
130 |
197 |
226 |
162 |
122 |
261 |
190 |
212 |
258 |
47 |
| 2014 |
190 |
151 |
272 |
329 |
246 |
304 |
202 |
230 |
280 |
227 |
312 |
255 |
| 2015 |
234 |
238 |
86 |
262 |
344 |
206 |
254 |
157 |
100 |
321 |
272 |
239 |
| 2016 |
126 |
237 |
225 |
153 |
43 |
297 |
291 |
176 |
249 |
124 |
164 |
155 |
| 2017 |
216 |
232 |
50 |
207 |
145 |
231(P) |
209(P) |
|
|
|
|
|
| P : preliminary |
|
|
Links To Charts
8/3/2017
PEERLESS
DJI, Signals, Indicators Daily
DJI Split Volume 10-DayUp/Down
Vol
Hourly DJIA A/D Line
for All Stocks
DJIA
S&P
OEX
NYSE
NASDAQ
COMPQX
with CP
DIA
SPY
QQQ
MDY
IWM-TNA
Short Term Interest Rates
DJI-Utilities
DJI-Transp
Nifty-30 Index
CrudeOil FAS
GLD
BBH
IBB
JETS
JNUG
KOL
NUGT
OIH
OIL
RSX
RETL
SLV
SOXL
TECL
TMF
TNA XIV YINN
Commodities: JJC, NIB,
WEAT UUP (Dollar)
To
STOCKS' CHARTS
AAPL ADBE
ALXN
AMAT
AMGN
AMZN BA
BIDU
CAT
FB
GOOG
GS
HD
IBM JPM M
(Macy's) MASI
MSFT
NVDA QCOM
TSLA
TXN
new
CMG (Chipotle),
LRCX, SWKS,
TOWN
Others REN, CVE
and SWN (very low AI/200 stocks)
8/3/2017
Bullish
MAXCPs Bearish MINCPs
 RANKING OF KEY DIRECTORIES BASED PCT.OF STOCKS ABOVE 65-DMA
               8/3/17
---------------------------------------------------------------------------------------
Directory     Current       day-1         day-2         day-3         day-4         day-5
----------------------------------------------------------------------------------------
BONDFUND       .946          .919          .937          .937          .892          .821
ETFS           .924          .924          .939          .924          .924          .924
BIGBANKS       .857          .857          1             1             .857          .857
UTILITY        .844          .8            .733          .644          .622          .711
INSURANC       .794          .882          .882          .911          .911          .852
DJI-13         .769          .769          .692          .615          .692          .615
NIFTY          .766          .8            .8            .8            .833          .833
BEVERAGE       .75           .85           .75           .8            .8            .8
DOWJONES       .733          .733          .766          .733          .766          .633
HOMEBLDG       .722          .722          .722          .555          .666          .666
SOLAR          .684          .736          .736          .789          .789          .736
CHINA          .677          .661          .693          .677          .725          .709
INDEXES        .668          .71           .724          .757          .771          .766
N=13
============================================================================================
COMODITY       .661          .69           .69           .788          .76           .69
MORNSTAR       .659          .701          .739          .735          .747          .789
SP-100         .659          .721          .731          .711          .721          .68
MILITARY       .644          .644          .644          .666          .644          .666
FINANCE        .637          .692          .747          .681          .593          .659
SP500          .615          .619          .639          .643          .639          .663
GREEN          .612          .677          .677          .741          .709          .645
GOLD           .603          .679          .754          .773          .754          .622
RUS-1000       .602          .607          .641          .635          .629          .664
GAMING         .6            .6            .7            .633          .6            .733
REIT           .562          .595          .666          .65           .59           .628
INDMATER       .561          .591          .612          .581          .612          .693
NASD-100       .555          .522          .566          .566          .6            .644
REGBANKS       .542          .628          .657          .542          .457          .514
N=14
============================================================================================
EDU            .5            .625          .5            .25           .375          .25
============================================================================================
SEMI           .481          .509          .645          .672          .7            .727
BIOTECH        .475          .525          .537          .566          .616          .583
ELECTRON       .475          .502          .601          .617          .655          .677
INFRA          .454          .454          .454          .545          .272          .545
SOFTWARE       .453          .468          .578          .531          .562          .625
RETAIL         .431          .396          .517          .465          .517          .534
CHEM           .43           .458          .472          .388          .472          .513
HACKERS        .388          .333          .444          .333          .444          .444
AUTO           .375          .425          .5            .475          .475          .55
COMPUTER       .36           .48           .52           .56           .6            .56
TRANSP         .35           .4            .4            .4            .4            .3
N=11
============================================================================================
FOOD           .333          .733          .6            .866          .733          .666
OILGAS         .329          .392          .367          .392          .392          .373
HOSPITAL       .285          .285          .285          .285          .285          .285
COAL           .222          .333          .333          .333          .222          .222
PIPELINE       .142          .285          .142          .142          .142          .142
JETS           .111          .111          .222          .222          .333          .222
N=6
================================================================================
8/2/2017
Peerless remains on the double Buy B10s. But now the DJI has closed 1.8%
over the 21-day ma and the DJI's 52 point rally today to a new high looked false
and potentially dangerous. For one thing, AAPL, by itself, accounted
for all but 4 of the
points gained today. For another, only four of the 30 DJI stocks made new highs
today.
What's more, there were 593 more NYSE decliners than advancers and on the
NASDAQ there was almost 1200 more down than up. MDY (midcaps) and IWM
(Russell-2000) fell today and the NASDAQ closed unchanged even with
AAPL's big jump.
But most bull markets end in excess. A climactic vertical ascent by the
Nifty-30
might be what is in store for us now. I've previously explained the
dynamics
of how this works. We want to watch our Tiger Index of the Nifty-30 for a
breakout above the top of its price channel. This could start a violent
vertical ascent.
The big advance of BA this year may be a foretaste of
what lies ahead.
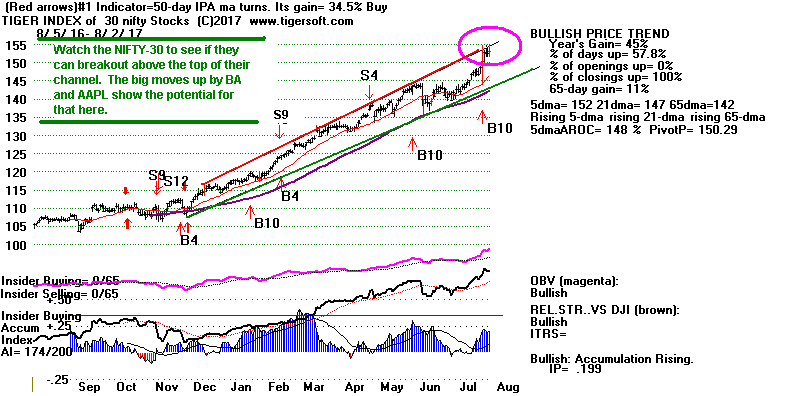
Much depends now on whether the DJIA does not get much further ahead of the
rest of the market. Another 170 point burst upwards tomorrow will likely
bring a
reversing Sell S9V. Until then, intermediate-term investors in the DJIA or
DIA
should wait to sell. Here traders should be watching the trend DIA's
Closing Power
and the trend of the 5-day ma. DIA's Closing Power is still rising and its
5-day ma
upswing will not easily be reversed tomorrow.
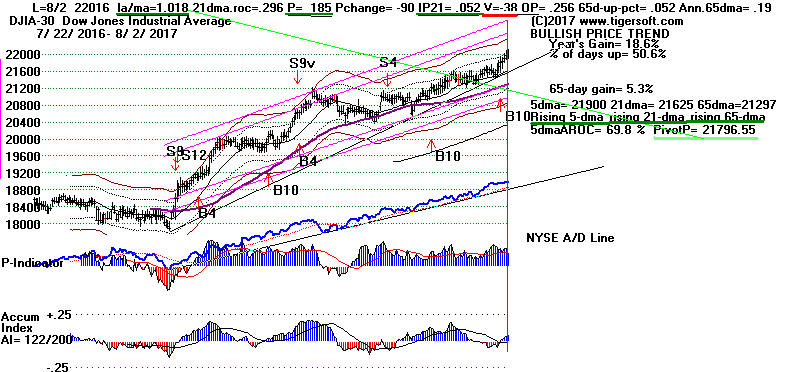


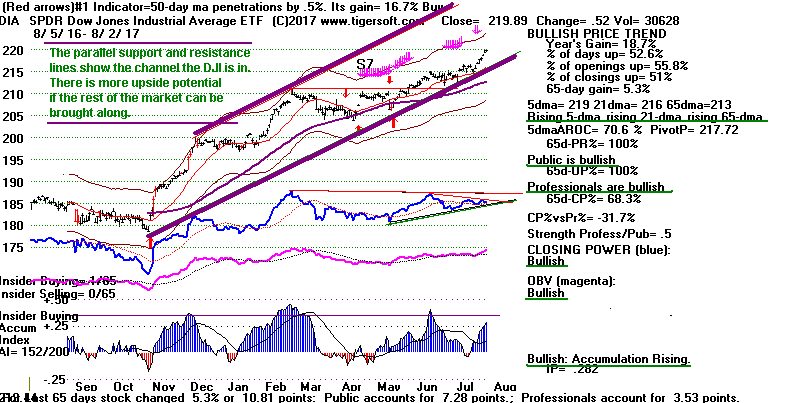
SPY needs to improve relative to the DJI. See
below how SPY has under-performed
DIA over the last 50 trading days by 2.1%. In addition, a weak closing
vis-a-vis
its opening tomorrow will probably cause its Closing Power to drop bearishly
below
its 21-day ma. A weak close tomorrow will also cause its 5-day ma to turn
down.
That would warn of an SPY decline to its rising 65-dma support.
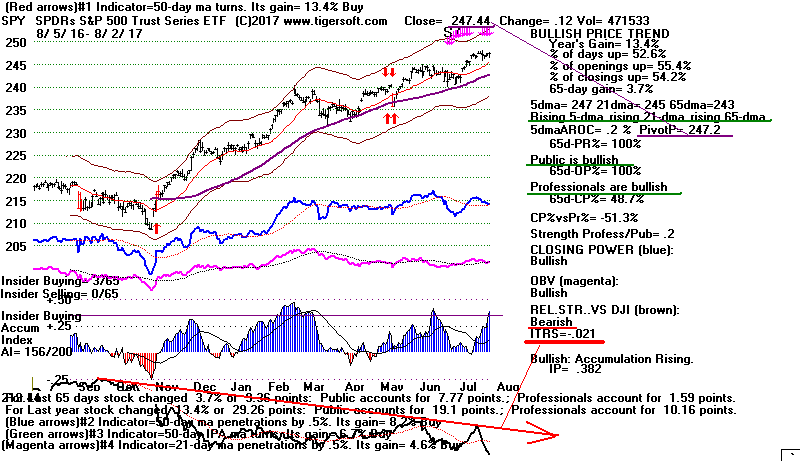
QQQ is also under-performing the DJIA. Its
Closing Power is in a downtrend.
But its Accumulation Index is also quite high, like SPY's If it does turn
down,
I would think that were will be very good support at its rising 65-dma.
I would avoid it for now.
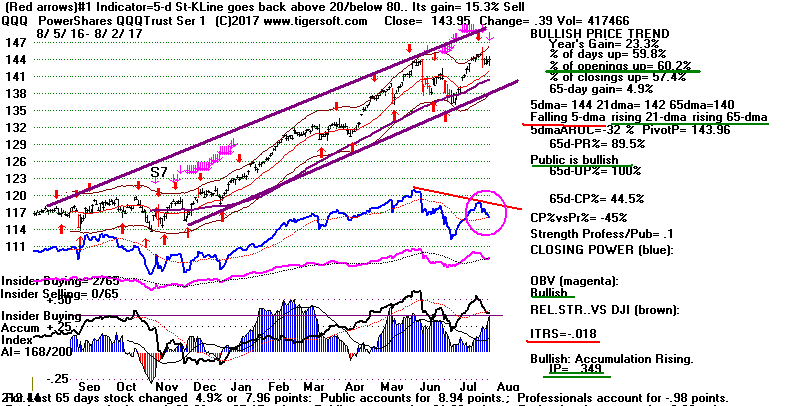
Links To Charts
8/2/2017
PEERLESS
DJI, Signals, Indicators Daily
DJI Split Volume 10-DayUp/Down
Vol
Hourly DJIA A/DLine
for All Stocks.
DJIA
S&P
OEX
NYSE
NASDAQ
COMPQX
with CP
DIA
SPY
QQQ
MDY
IWM-TNA
Short Term Interest Rates
DJI-Utilities
DJI-Transp
CrudeOil FAS
GLD
BBH
IBB
JETS
JNUG
KOL
NUGT
OIH
OIL
RSX
RETL
SLV
SOXL
TECL
TMF
TNA XIV YINN
Commodities: JJC, NIB,
WEAT UUP (Dollar)
To
STOCKS' CHARTS
AAPL ADBE
ALXN
AMAT
AMGN
AMZN BA
BIDU
CAT
FB
GOOG
GS
HD
IBM JPM M
(Macy's) MASI
MSFT
NVDA QCOM
TSLA
TXN
new
CMG (Chipotle),
LRCX, SWKS,
TOWN
Others REN, CVE
and SWN (very low AI/200 stocks)
8/2/2017
Bullish
MAXCPs Bearish MINCPs
 RANKING OF KEY DIRECTORIES BASED PCT.OF STOCKS ABOVE 65-DMA
              8/2/17
33 BULLISH
13 BEARISH
---------------------------------------------------------------------------------------
Directory     Current       day-1         day-2         day-3         day-4         day-5
----------------------------------------------------------------------------------------
BONDFUND       .919          .937          .937          .892          .821          .875
ETFS           .911          .926          .911          .911          .926          .97
INSURANC       .882          .882          .911          .911          .852          .941
BIGBANKS       .857          1             1             .857          .857          .857
BEVERAGE       .85           .75           .8            .8            .8            .8
NIFTY          .8            .8            .8            .833          .833          .933
UTILITY        .8            .733          .644          .622          .711          .711
DJI-13         .769          .692          .615          .692          .615          .461
SOLAR          .736          .736          .789          .789          .736          .789
DOWJONES       .733          .766          .733          .766          .633          .533
FOOD           .733          .6            .866          .733          .666          .466
HOMEBLDG       .722          .722          .555          .666          .666          .666
SP-100         .721          .731          .711          .721          .68           .639
INDEXES        .71           .724          .757          .771          .761          .757
MORNSTAR       .701          .739          .735          .747          .785          .777
COMODITY       .7            .7            .8            .771          .7            .642
FINANCE        .692          .747          .681          .593          .659          .714
GREEN          .677          .677          .741          .709          .645          .709
N=19
===========================================================================================
CHINA          .661          .693          .677          .725          .709          .774
GOLD           .66           .754          .792          .773          .603          .773
MILITARY       .644          .644          .666          .644          .666          .666
EDU            .625          .5            .25           .375          .25           .375
SP500          .618          .638          .642          .64           .657          .669
REGBANKS       .611          .638          .527          .444          .444          .611
REIT           .606          .673          .658          .601          .637          .611
RUS-1000       .602          .638          .631          .625          .655          .674
GAMING         .6            .7            .633          .6            .733          .766
INDMATER       .591          .612          .581          .612          .683          .683
SEMI           .534          .663          .689          .715          .732          .818
BIOTECH        .527          .535          .562          .618          .574          .653
ELECTRON       .525          .618          .634          .664          .68           .747
NASD-100       .522          .566          .566          .6            .622          .7
N=14
===========================================================================================
COMPUTER       .48           .52           .56           .6            .56           .64
SOFTWARE       .468          .578          .531          .562          .625          .703
CHEM           .458          .472          .388          .472          .513          .527
INFRA          .454          .454          .545          .272          .454          .454
PIPELINE       .444          .333          .222          .222          .222          .222
AUTO           .425          .5            .475          .475          .55           .6
TRANSP         .4            .4            .4            .4            .3            .45
OILGAS         .398          .373          .392          .392          .373          .398
RETAIL         .396          .517          .465          .517          .534          .482
N=9
===========================================================================================
COAL           .333          .333          .333          .222          .222          .444
HACKERS        .333          .444          .333          .444          .444          .666
HOSPITAL       .285          .285          .285          .285          .285          .428
JETS           .111          .222          .222          .333          .222          .333
N=4
==============================================================================
8/1/2017
Peerless remains on the double B10s. We have to expect higher prices.
Remember that prices run most easily when they are making all-time highs
and sellers cannot easily concentrate their offerings.
The DJI will have to rally 188 points higher tomorrow to get a Sell.
A DJI close above 22150 will produce a Sell S9-V, assuming the accompanying
NYSE breadth and Up and Down Volume are similar to today's numbers.
A new study tonight suggests that tops are 50% more likely to occur
in September than August.
However, there are worrisome signs. The Hourly
DISI/OBV Line is much
weaker than the DJIA's price chart. And why are Professionals net sellers?
This we judge from the fact that the TigerSoft Opening Powers for DIA, SPY
and QQQ are much stronger than the down-trending blue Closing Powers.
I take this to mean either foreigners are buying US stocks or market makers
are rigging higher openings to better distribute their positions.
If the Closing Powers for DIA, SPY and QQQ start making new 12-month
highs, or just break their downtrends, it will be bullish. It will mean
Professionals
have switched to becoming aggressive buyers again. Another thing to watch
is
how our Nifty-30 Index does. Specifically, it will be bullish if this
Index can
breakout above the top of its price-channel resistance line.
Should We Wait for September To Sell?
Historically, we are 50% likely to see a top in September than August.
Looking back at ball markets when the DJI pulls back more than 5%, we
see 13 August peaks since 1929 and 20 September peaks. The subsequent
August declines are generally shallower than the September peaks. There
are a few cases where Peerless did not give a Sell at the August peak.
There
are no such cases in September. The DJI tends to move further from the
21-dma at the September peaks. See the
new study here.
The DJI typically rises at the end of bull market while most other stocks
lag. Normally, the A/D Line's non-confirmation of DJI highs at the end
of the advance are the market's "tell" that the end is near. Red
distribution
and an S12 are the next most common way bull market's signal they are
ready to reverse. After these two signs of a top, head/shoulders tops are
the next most common warnings. Last, but not least, are Sell S9Vs, where
the DJI closes above the 2.4% (usually) band with the V-I negative. It
is this last type of reversal we might be getting in a few days.
But it hasn't happened yet and I don't think we should anticipate it.
Because of the weak Dollar and pullback in short-term rates, we have
been given some trends to play. Those are Chinese stocks, ETFs and Gold.
Meanwhile, there are many oil/gas stocks in our Bearish MINCPs.
Usually when one industry dominates the Bearish MINCPs, the downtrend
in these stocks will continue long enough to make good trades. But we
do want to close out most short sales when the Closing Power downtrend
is violated.
Most likely, the leading tech stocks and ETFs will stay in their trading ranges.
I have suggested buying NVDA at 160 or when it
closes above its 5-day ma
pivot point.
8/1/2017
PEERLESS
DJI, Signals, Indicators Daily
DJI Split Volume 10-DayUp/Down
Vol
Hourly DJIA A/DLine
for All Stocks.
DJIA
S&P
OEX
NYSE
NASDAQ
COMPQX
with CP
DIA
SPY
QQQ
MDY
IWM-TNA
Short Term Interest Rates
DJI-Utilities
DJI-Transp
CrudeOil FAS
GLD
BBH
IBB
JETS
JNUG
KOL
NUGT
OIH
OIL
RSX
RETL
SLV
SOXL
TECL
TMF
TNA XIV YINN
Commodities: JJC, NIB,
WEAT UUP (Dollar)
To
STOCKS' CHARTS
AAPL ADBE
ALXN
AMAT
AMGN
AMZN BA
BIDU
CAT
FB
GOOG
GS
HD
IBM JPM M
(Macy's) MASI
MSFT
NVDA QCOM
TSLA
TXN
new
CMG (Chipotle),
LRCX, SWKS,
TOWN
Others REN, CVE
and SWN (very low AI/200 stocks)
8/1/2017
Bullish
MAXCPs Bearish MINCPs
 RANKING OF KEY DIRECTORIES BASED PCT.OF STOCKS ABOVE 65-DMA
               8/1/17
34 Bullish
10 Bearish
---------------------------------------------------------------------------------------
Directory     Current       day-1         day-2         day-3         day-4         day-5
----------------------------------------------------------------------------------------
BIGBANKS       1             1             .857          .857          .857          .857
ETFS           .939          .924          .924          .939          .969          .909
BONDFUND       .937          .937          .892          .821          .875          .758
INSURANC       .882          .911          .911          .852          .941          .941
NIFTY          .8            .8            .833          .833          .933          .933
DOWJONES       .766          .733          .766          .633          .533          .533
GOLD           .76           .8            .8            .62           .8            .4
BEVERAGE       .75           .8            .8            .8            .8            .7
FINANCE        .747          .681          .593          .659          .714          .769
MORNSTAR       .739          .735          .747          .785          .777          .819
SOLAR          .736          .789          .789          .736          .789          .789
UTILITY        .733          .644          .622          .711          .711          .555
SP-100         .731          .711          .721          .68           .639          .68
INDEXES        .724          .757          .771          .761          .757          .757
HOMEBLDG       .722          .555          .666          .666          .666          .611
GAMING         .714          .642          .607          .75           .785          .785
CHINA          .693          .677          .725          .709          .758          .725
DJI-13         .692          .615          .692          .615          .461          .461
COMODITY       .69           .788          .76           .69           .633          .549
GREEN          .677          .741          .709          .645          .709          .709
REIT           .673          .658          .601          .637          .606          .58
N=21
============================================================================================
MILITARY       .666          .692          .666          .692          .692          .794
SEMI           .663          .689          .715          .732          .827          .741
REGBANKS       .657          .542          .457          .457          .6            .742
RUS-1000       .643          .635          .629          .659          .677          .707
SP500          .638          .642          .64           .657          .673          .683
INDMATER       .612          .581          .612          .683          .673          .755
ELECTRON       .601          .617          .655          .672          .748          .693
FOOD           .6            .866          .733          .666          .466          .333
SOFTWARE       .578          .531          .562          .625          .703          .718
NASD-100       .566          .566          .6            .622          .7            .666
BIOTECH        .539          .562          .61           .582          .661          .653
COMPUTER       .52           .56           .6            .56           .64           .64
RETAIL         .517          .465          .517          .534          .482          .482
N=13
===========================================================================================
AUTO           .5            .475          .475          .55           .625          .65
===========================================================================================
CHEM           .472          .388          .472          .513          .527          .666
INFRA          .454          .545          .272          .454          .454          .727
HACKERS        .437          .312          .437          .437          .687          .687
TRANSP         .4            .4            .4            .3            .5            .55
OILGAS         .377          .397          .397          .377          .39           .397
COAL           .333          .333          .222          .222          .444          .444
EDU            .333          0             .166          0             .166          .333
HOSPITAL       .285          .285          .285          .285          .428          .714
JETS           .222          .222          .333          .222          .444          .555
PIPELINE       .142          .142          .142          .142          .142          .285
N=10
==============================================================================
7/31/2017 No Peerless Sell, so expect the DJI
to rally higher.
It would
now take a DJI rally to 22126 where the 2.4% crosses now to get Peerless
to give a Sell. The DJI would have to rally 235 points to achieve a Sell
S9-v,
which would be based on the negative readings from the V-Indicator.
I would
not try to anticipate the Sell. Many times, even with a Sell S9-V attached, the
DJI must still tag the upper 3.5% for a few days before reversing.
The Tiger Nifty-30 are positioned now to have a
wild vertical ascent if thisindex
moves higher. NVDA is the #1 stock in this group. If there is a
strong close
tomorrow, things will may get very exciting for the top performers. Shorts
will be run in mercilessly.
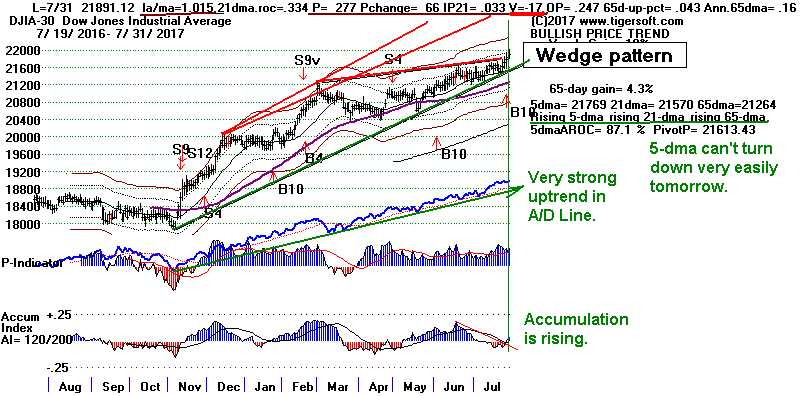
The rally has become defensive and based on the expectation that the
Fed will not be raising rates this month and perhaps not even in September.
Short-term rates appear to be in only a temporary
pull-back, but the
bullish behavior of defensive stocks (shown below) suggests the rate decline
may continue longer than most expect. That interpretation, at least
explains
the falling Dollar and the rallying now seen in
Utilities and Bonds. Immediately
below are the industry groups with the highest percentage of their component
stocks above their 65-dma.
Groups with Highest Pct of Their Components
over 65-dma
BONDFUND
93.7%
FOREIGN ETFS 91.1%
INSURANCE
91.1%
FOOD
86.6%
BEVERAGE
80.0%
NIFTY-30
80.0%
GOLD
79.2%
The one non-defensive exception here are the NIFTY-30 stocks. These
are the
super performers of our era. They will hold up or keep rising until the
bitter end because
institutional money managers keep piling new money into this group. Why?
Because
these money mangers need to have their portfolios perform really well if they
are going
to get bonuses. Of course, they are hoping that they will get out before
these stocks
turn down very far. But they also understand that even if they do not get
out before
prices in these high-fliers drop drastically, no one will be able to take back
all the
lavish pay and bonuses that they have already received. I this explains
Boeing's super
rise in the last week.
In Tiger's composite chart of our
Tiger-30 Index below, see how close the group
is to making a breakout above the top of its price-channel. If this
happens,
expect an exciting and steep rally.

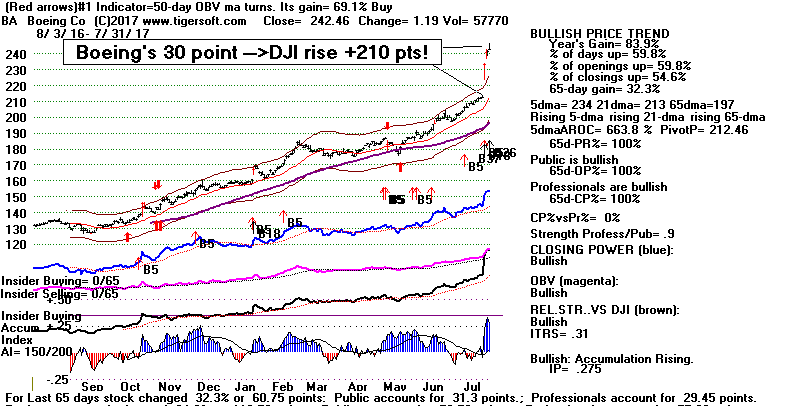
              Performance of NIFTY-30 Stocks    Days back= 249
                                8 / 3 / 2016 - 7 / 31 / 2017
Rank          Symbol        Name                         Price        Pct.Gain
---------     -----------------------------------       ----------    -----------
 1            NVDA          NVIDIA Corporation           162.51        189%
 2            HSKA          Heska Corp                   109.54        125%
 3            PLUS          Eplus Inc                    92            92%
 4            CPA           Copa Holdings S.A.           125.46        91%
 5            ALGN          Align Tech Inc               167.23        81%
 6            NVR           Nvr Inc                      2610.44       55%
 7            ATVI          Activision Blizzard` Inc     61.78         52%
 8            ADBE          Adobe Systems Inc            146.49        51%
 9            VRTX          Vertex Pharmaceuticals Inc   151.82        51%
 10           AVGO          Avago Technologies Limited   246.66        50%
 11           PCLN          Priceline Group Inc          2028.5        47%
 12           TSLA          Tesla Motors Inc             323.47        43%
 13           AAPL          Apple Inc                    148.73        40%
 14           CHDN          Churchills Downs Inc         187.05        40%
 15           FB            Facebook Inc                 169.25        38%
 16           ISRG          Intuitive Surgical Inc       938.26        36%
 17           ADP           Automatic Data Processing    118.91        34%
 18           AMZN          Amazon.Com Inc               987.78        30%
 19           MSFT          Microsoft Corp               72.7          27%
 20           CTAS          Cintas Corp                  134.85        26%
 21           XLNX          Xilinx Inc                   63.26         24%
 22           FISV          Fiserv Inc                   128.5         23%
 23           JNPR          Juniper Networks             27.95         23%
 24           EQIX          Equinix Inc                  450.73        21%
 25           GOOG          Google Inc                   930.5         20%
 26           AMT           American Tower Corp          136.33        17%
 27           EXPD          Expeditors International     58.88         15%
 28           LMT           Lockheed Martin Corp         292.13        13%
 29           REGN          Regeneron Pharm Inc          491.62        11%
 30           HD            Home Depot Inc               149.6         9%                           49%           51%
7/31/2017
PEERLESS
DJI, Signals, Indicators Daily
DJI Split Volume 10-DayUp/Down
Vol
Hourly DJIA A/DLine
for All Stocks.
S&P
OEX
NYSE
NASDAQ
COMPQX
with CP
DIA
SPY
QQQ
MDY
IWM-TNA
Short Term Interest Rates
DJI-Utilities
DJI-Transp
CrudeOil FAS
GLD
BBH
IBB
JETS
JNUG
KOL
NUGT
OIH
OIL
RSX
RETL
SLV
SOXL
TECL
TMF
TNA XIV YINN
Commodities: JJC, NIB,
WEAT UUP (Dollar)
To
STOCKS' CHARTS
AAPL ADBE
ALXN
AMAT
AMGN
AMZN BA
BIDU
CAT
FB
GOOG
GS
HD
IBM JPM M
(Macy's) MASI
MSFT
NVDA QCOM
TSLA
TXN
new
CMG (Chipotle),
LRCX, SWKS,
TOWN
Others REN, CVE
and SWN (very low AI/200 stocks)
7/31/2017
Bullish
MAXCPs Bearish MINCPs
 RANKING OF KEY DIRECTORIES BASED PCT.OF STOCKS ABOVE 65-DMA
              7/31/17
Bullish = 34
Bearish = 11
---------------------------------------------------------------------------------------
Directory     Current       day-1         day-2         day-3         day-4         day-5
----------------------------------------------------------------------------------------
BIGBANKS       1             .857          .857          .857          .857          .857
BONDFUND       .937          .892          .821          .875          .758          .83
ETFS           .911          .911          .926          .955          .897          .911
INSURANC       .911          .911          .852          .941          .941          .852
FOOD           .866          .733          .666          .466          .333          .8
BEVERAGE       .8            .8            .8            .8            .65           .65
NIFTY          .8            .833          .833          .933          .933          .933
GOLD           .792          .792          .622          .773          .396          .471
SOLAR          .789          .789          .736          .789          .789          .736
COMMODITY      .788          .76           .69           .633          .549          .633
INDEXES        .757          .771          .761          .757          .752          .7
GREEN          .741          .709          .645          .709          .709          .677
MORNSTAR       .735          .747          .785          .777          .815          .794
DOWJONES       .733          .766          .633          .533          .533          .633
SP-100         .711          .721          .68           .639          .68           .649
SEMI-CONDUCTORS.689          .715          .732          .827          .758          .75
FINANCE        .681          .593          .659          .714          .769          .67
CHINA          .677          .725          .709          .758          .725          .709
N=18
=============================================================================================
MILITARY       .666          .644          .666          .666          .733          .777
REIT           .658          .601          .637          .606          .585          .569
SP-500         .645          .639          .655          .671          .683          .677
UTILITY        .644          .622          .711          .711          .555          .644
RUS-1000       .636          .629          .659          .677          .705          .684
ELECTRON       .634          .67           .685          .752          .711          .716
GAMING         .633          .6            .733          .766          .766          .733
DJI-13         .615          .692          .615          .461          .461          .615
INDMATER       .581          .612          .683          .673          .734          .704
NASD-100       .58           .612          .634          .709          .677          .688
BIOTECH        .566          .61           .574          .669          .661          .669
COMPUTER       .56           .6            .56           .64           .68           .68
HOMEBLDG       .555          .666          .666          .666          .666          .666
INFRA          .545          .272          .454          .454          .818          .545
SOFTWARE       .531          .562          .625          .703          .703          .703
REGBANKS       .527          .444          .444          .583          .722          .611
N=16
===========================================================================================
AUTO           .475          .475          .55           .625          .65           .6
RETAIL         .465          .517          .534          .482          .482          .344
OILGAS         .405          .398          .373          .386          .392          .329
TRANSP         .4            .4            .3            .5            .55           .55
CHEM           .388          .472          .513          .527          .666          .638
COAL           .333          .222          .222          .444          .444          .444
HACKERS        .333          .444          .444          .666          .666          .666
PIPELINE       .333          .333          .222          .222          .333          .333
HOSPITAL       .285          .285          .285          .428          .714          1
EDU            .25           .375          .25           .375          .5            .5
JETS           .222          .333          .222          .444          .555          .555
N=11
============================================================================================
===============================================================================
7/28/2017 No Peerless Sell, so expect
the DJI to rally more. I would prefer to buy
the leading Chinese stocks now instead of tech ETFs, which show a need
to consolidate. But NVDA is the strongest of
the techs. It shows no willingness
to stay down. As such, it is the real leader of this group. Despite, the
mid-week
tech retreat, traders seem ready now to make NVDA breakout from its recent
140-170 Darvas box. Good support for it is now at 160, just above its
21-dma.
A close only two points higher will turn up its 5-day ma and give our
QuickSilver
traders a Buy signal on it.
The general market's rally is getting a lot of help from signs that the
Fed will not be raising rates as soon as was previously expected.


Two Buy B10s' History
The second Buy B10 on the DJI's chart should allow it to move somewhat higher.
We gauge this from the three cases since 1965 when there was a pair of Buy B10s.
In two of the three cases, there was no sell signal until the DJI closed 2.5%
over the
21-dma. In the third case, a reversing Sell S12 occurred with the DJI only
1.8%
above the 21-dma. Since the DJI's key values show the DJI now 1.3% above
21-dma,
we could get a reversing Sell if the DJI advances 0.5% to 0.6% higher and the
DJI's IP21 turns negative. It now stands at a +.014. A Sell S9-V is
more likely.
Our V-I readings are quite negative, -30. This means on a DJI close 1.2%
to 1.3%
higher, we will probably get a Sell S9V.
Signal
Gain Internals
8/17/1965 B10 +.102
9/16/1965 B10 +.058
1/6/1966 S12
la/ma = 1.025 P=34 IP21=-.042 V=+6
-------------------------------------------------------------------------
1/9/2006 B10 +.051
3/16/2006 B10 +.029
5/5/2006 S9
la/ma=1.026 P=-10 IP21 = +.035 V = -62
----------------------------------------------------------------------------
1/18/2012 B10 +.043
3/14/2012 B10 -.005
5/1/2012 S12
la/ma=1.018 P=78 IP21=-.003
V=-87
----------------------------------------------------------------------------
6/2/2017 B10
7/27/2017 B10
7/28/2017 No signal
la/ma=1.013 P=211
IP21= .014 V=-30

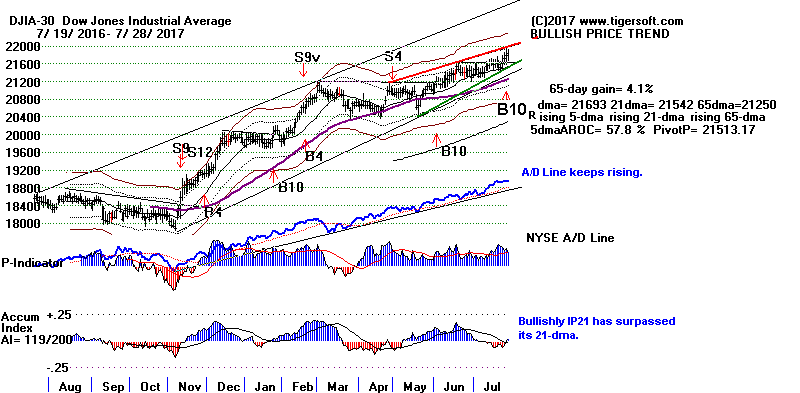
The Dollar Is Falling, Yet No
Interest Rate Hike Seems in Sight.
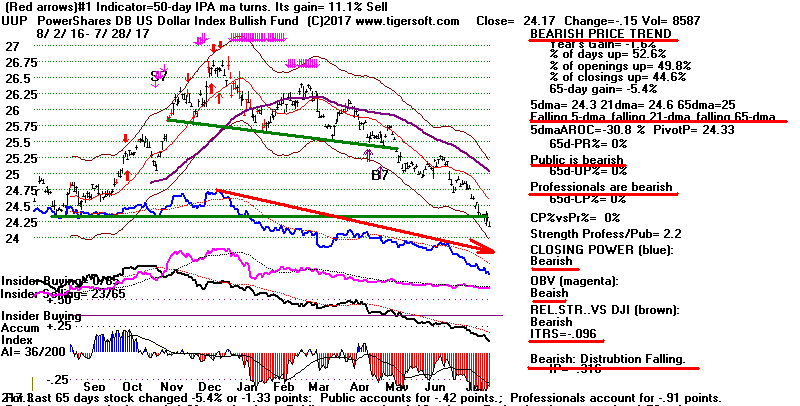
The market is apparently being held up by a belief that the FED will not
soon be raising
interest
rates. See at top of Hotline tonight how the Short-term rates' chart now
shows
a pull back
is starting. This has caused the Dollar to breakdown to 12-month lows
boosted
foreign ETFs
and Chinese stocks, in particular. It is also causing
Gold and gold stocks to rebound.
I believe
these trends will likely continue. It looks like the FED is not yet willing to
defend the Dollar
and is afraid
to raise interest rates until there is more evidence of inflation. With
Crude Oil rising,
we will want
to watch to see what the next CPI figures show. The different outlook for
interest rates
has been a
big help to some retail stocks. Many consumers very dependent on how large
the
charges are
on their credit cards. But I would not buy the big retailers yet.
The falling Dollar makes
the imports
that retailers sell more expensive. This is especially evident with
Home Depot.
Chinese
Stocks Should Keep Rising.
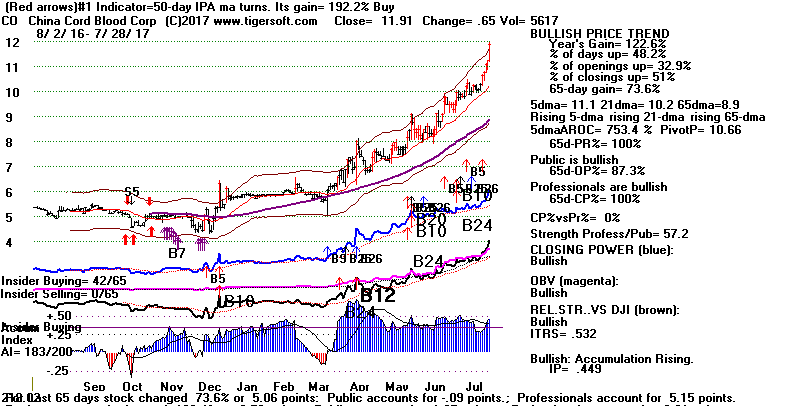
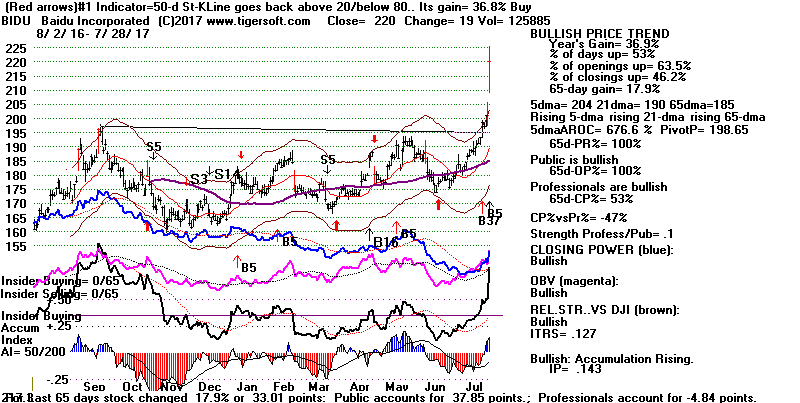
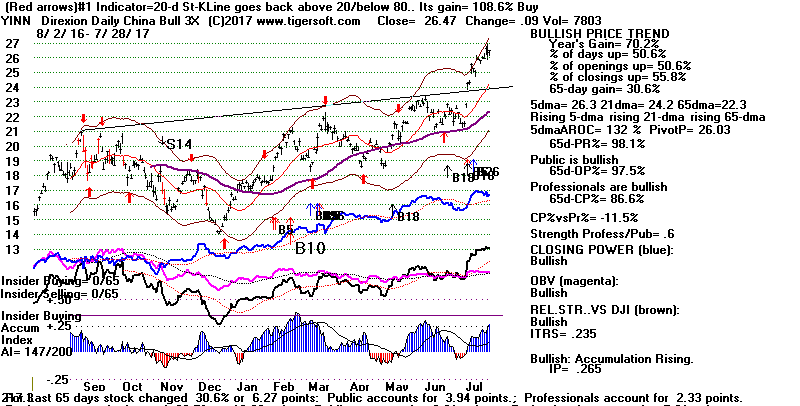
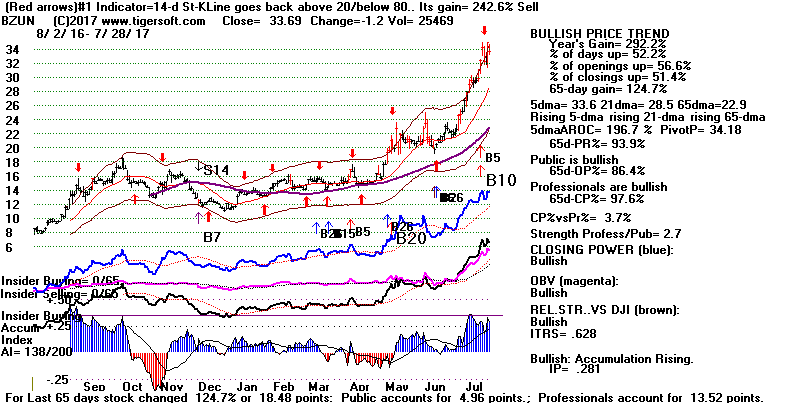
The NASDAQ Needs to Consolidate Its Gains
Thursday's red popsicles are a warning to us, I think, to avoid the
NASDAQ and most
high tech ETFs.
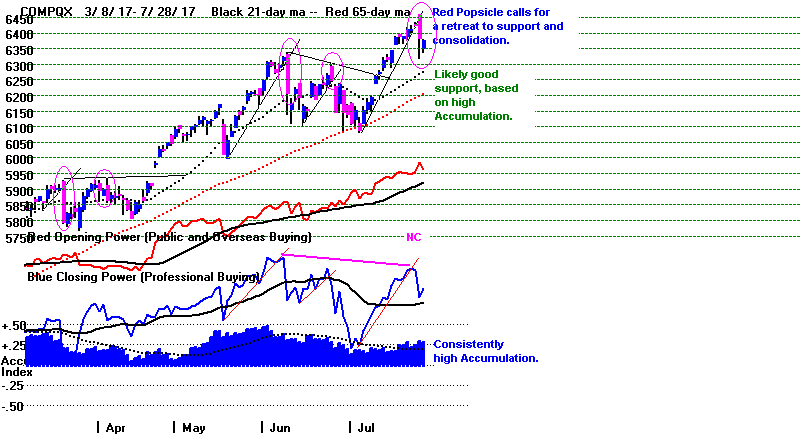
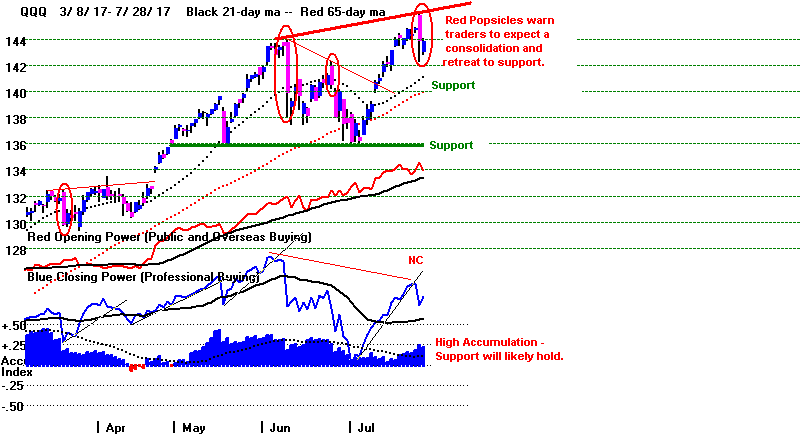
NVDA appears ready to breakout above its 170
resistance.
A close 2 points above Friday's close will turn up its 5-dma.
Expect its Closing Power to break its recent down-trend to
confirm the breakout over 170.
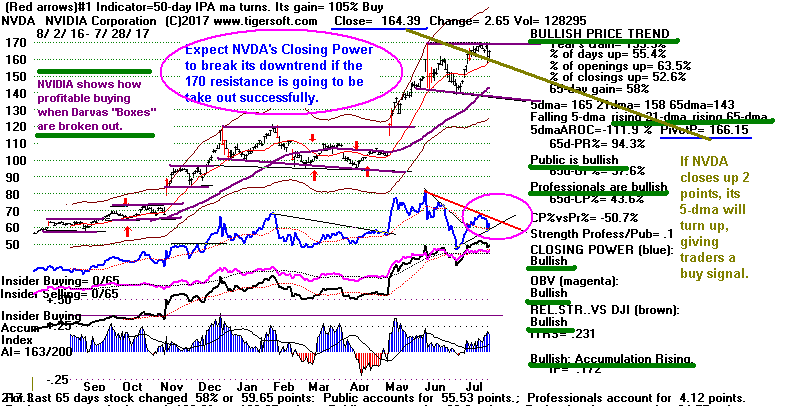
7/28/2017
PEERLESS
DJI, Signals, Indicators Daily
DJI Split Volume 10-DayUp/Down
Vol
Hourly DJIA A/DLine
for All Stocks.
S&P
OEX
NYSE
NASDAQ
COMPQX
with CP
DIA
SPY
QQQ
MDY
IWM-TNA
Short Term Interest Rates
DJI-Utilities
DJI-Transp
CrudeOil FAS
GLD
BBH
IBB
JETS
JNUG
KOL
NUGT
OIH
OIL
RSX
RETL
SLV
SOXL
TECL
TMF
TNA XIV YINN
Commodities: JJC, NIB,
WEAT UUP (Dollar)
To
STOCKS' CHARTS
AAPL ADBE
ALXN
AMAT
AMGN
AMZN BA
BIDU
CAT
FB
GOOG
GS
HD
IBM JPM M
(Macy's) MASI
MSFT
NVDA QCOM
TSLA
TXN
new
CMG (Chipotle),
LRCX, SWKS,
TOWN
Others REN, CVE
and SWN (very low AI/200 stocks)
7/28/2017
Bullish
MAXCPs Bearish MINCPs
 RANKING OF KEY DIRECTORIES BASED PCT.OF STOCKS ABOVE 65-DMA
              7/28/17
Bullish = 33
Bearish = 18
---------------------------------------------------------------------------------------
Directory     Current       day-1         day-2         day-3         day-4         day-5
----------------------------------------------------------------------------------------
ETFS           .911          .926          .955          .897          .897          .926
INSURANC       .911          .852          .941          .941          .852          .852
BONDFUND       .892          .821          .875          .758          .83           .883
BIGBANKS       .857          .857          .857          .857          .857          .857
NIFTY          .833          .833          .933          .933          .933          .9
BEVERAGE       .8            .8            .8            .65           .65           .75
GOLD           .792          .622          .792          .396          .433          .584
SOLAR          .789          .736          .789          .789          .736          .736
INDEXES        .771          .761          .757          .752          .7            .728
DOWJONES       .766          .633          .533          .533          .633          .6
COMODITY       .757          .685          .628          .542          .628          .614
MORNSTAR       .747          .785          .777          .815          .802          .806
FOOD           .733          .666          .466          .333          .8            .8
CHINA          .725          .709          .758          .725          .709          .758
SP-100         .721          .68           .639          .68           .649          .649
SEMI           .715          .732          .827          .758          .75           .75
GREEN          .709          .645          .709          .709          .677          .709
DJI-13         .692          .615          .461          .461          .615          .615
ELECTRON       .67           .685          .757          .711          .716          .721
N=19
===========================================================================================
HOMEBLDG       .666          .666          .666          .666          .666          .666
MILITARY       .644          .666          .666          .733          .777          .777
SP500          .641          .655          .671          .683          .675          .699
RUS-1000       .627          .656          .675          .704          .68           .698
UTILITY        .622          .711          .711          .555          .666          .755
BIOTECH        .614          .574          .661          .669          .669          .673
INDMATER       .612          .683          .673          .734          .704          .724
REIT           .601          .637          .606          .585          .569          .616
COMPUTER       .6            .56           .64           .68           .68           .72
GAMING         .6            .733          .766          .766          .766          .733
NASD-100       .6            .622          .7            .666          .666          .666
FINANCE        .593          .659          .714          .769          .692          .648
SOFTWARE       .562          .625          .703          .703          .718          .703
RETAIL         .517          .534          .482          .482          .344          .396
N=14
===========================================================================================
AUTO           .475          .55           .625          .65           .6            .7
CHEM           .472          .513          .527          .666          .638          .625
HACKERS        .444          .444          .666          .666          .666          .611
REGBANKS       .444          .444          .583          .722          .611          .472
OILGAS         .405          .379          .386          .392          .329          .335
TRANSP         .4            .3            .5            .55           .55           .6
EDU            .375          .25           .375          .5            .5            .5
N=7
==========================================================================================
JETS           .333          .222          .444          .555          .555          .666
PIPELINE       .333          .333          .222          .333          .333          .333
HOSPITAL       .285          .285          .428          .714          1             .857
INFRA          .272          .454          .454          .818          .545          .545
COAL           .222          .222          .444          .444          .444          .444
N=11
==============================================================================
7/27/2017 Peerless is stubbornly
bullish in here. It cannot easily give a Sell without the DJI closing
well above 22000. Let's not try to predict that it advance, as we do not
know
what the accompanying internals will be. The DJI often stays strong when
other
segments of the market weaken. That is it's job. It is keeping up
the appearance
of strength before the public, saying in effect: "All is well. See how the
DJIA is now
rising to new all-time highs".
The existing Peerless Buy was
nominally augmented with a Buy B10 today.
But without the big gains of BA (+7.55) and VZ
(+3.41), the DJI would have
been up less than 10 points. When we take into the huge +21 point gain of
Boeing
yesterday, we get the sense that this a highly suspicious advance, especially
since today there were 290 more decliners than advancers on the NYSE ,
Besides that, NYSE Down Volume was once again higher than Up Volume.
Making matters worse, most big tech stocks and ETFs today produced
what we call "red popsicles" as well as Closing Power uptrend-breaks
following new highs that their Closing Power failed to confirm.
We know that selectivity is especially important now. With the
Dollar so weak,
stick with the high Accumulation ETFs, especially CHN and
YINN. Stay
clear of the tech stocks for now. I would think that
GLD and JNUG must rise
as the Dollar declines. I see no signs that the FED is about to raise
rates to change
this picture. Shorting some of the weakest
MINCPs now should help, too.
Note the new B10.

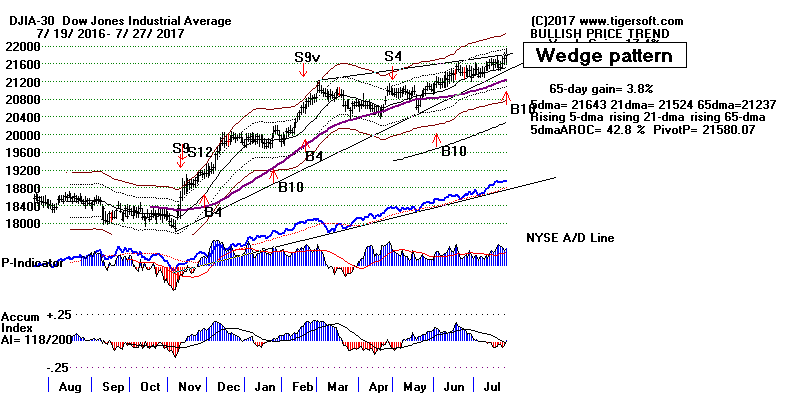
Red Popsicles can end a long bull market!
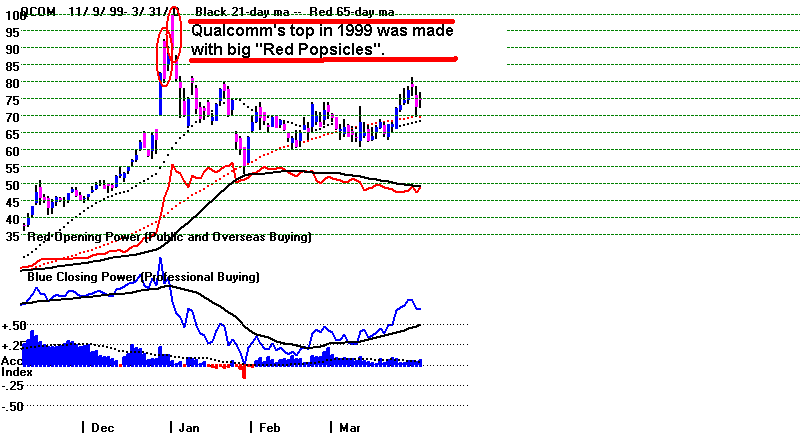
"Red popsicles"
appear on the Tiger candle-stick charts when the closing price
is significantly below the opening price. These are reliably bearish in
advancing stocks
when the opening is up for the day by a good amount, but then prices fade badly
and drop way below the previous day's close. They are especially bearish
if the
prices end near the day's low. That last condition produces the "red popsicles"
as opposed to the "red rolling pins".
Today shows how important it is for traders
to be on the look out for these
false up-openings in those stocks that have previously been rallying with the
the stock closing regularly above the opening day after day. Where the
stock
is rallying on weak Closing Power, there is added vulnerability. Traders
should
understand what makes a red Candle-Stick in these CP NC stocks. Another
thing, the amount of the red in the candle-stick chart will frequently dwarf the
bodies
of blue seen in any of the preceding days. This shows the advance is in trouble
and a decline is likely.
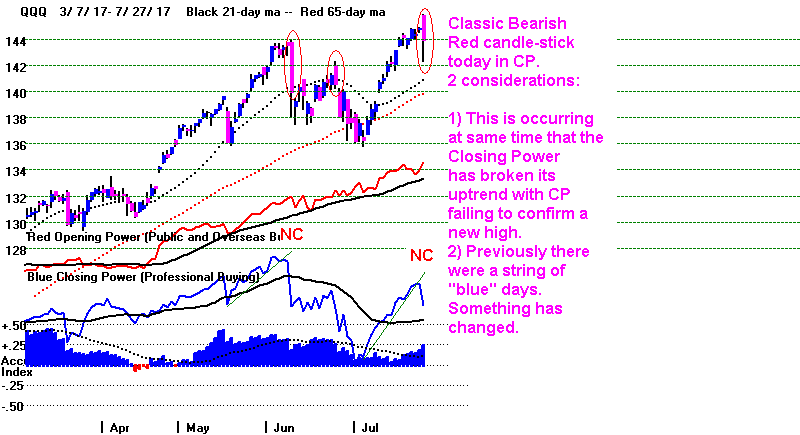
We see this clearly now in tech leaders, AAPL, AMAT, AMZN, MSFT and NVDA.
We suspect that traders became aware of the DJI's irregular and probably false
advance Wednesday and Thursday and were quick to sell when today's higher
opening was reversed.
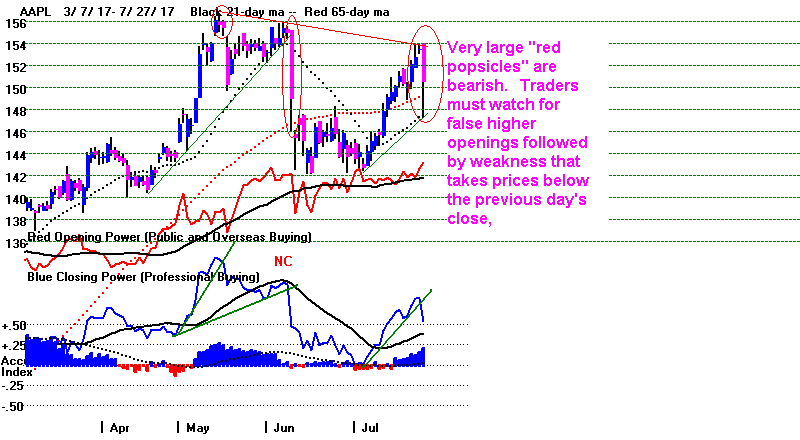
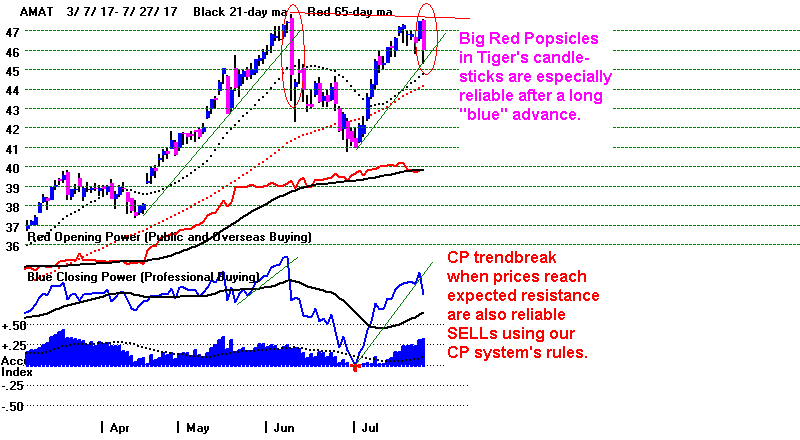
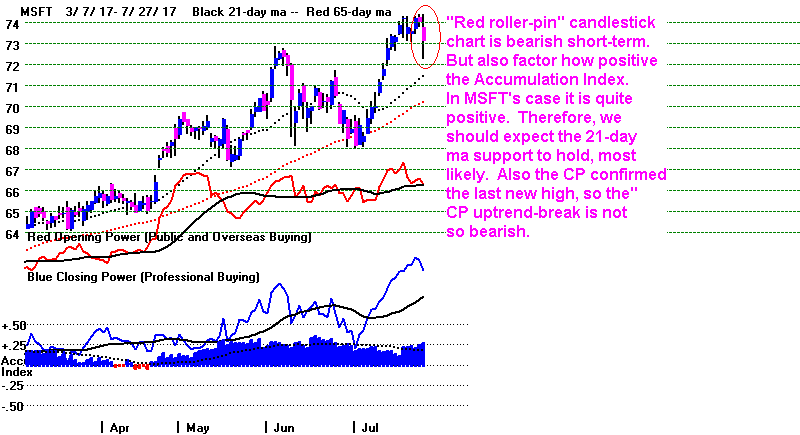
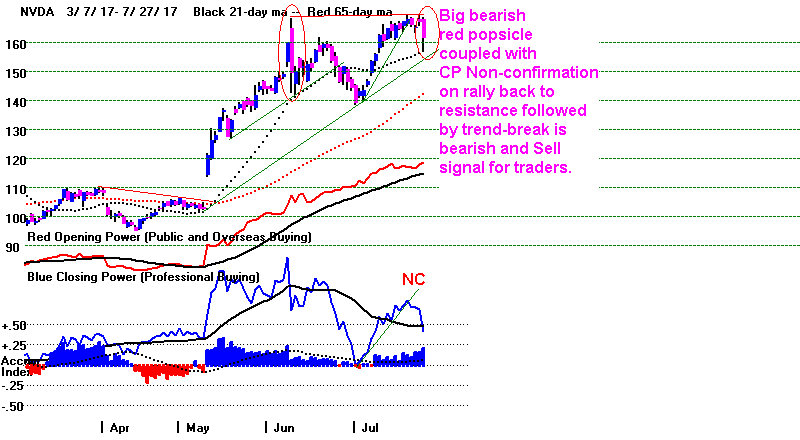
7/27/2017
PEERLESS
DJI, Signals, Indicators Daily
DJI Split Volume 10-DayUp/Down
Vol
Hourly DJIA A/DLine
for All Stocks.
S&P
OEX
NYSE
NASDAQ
COMPQX
with CP
DIA
SPY
QQQ
MDY
IWM-TNA
Short Term Interest Rates
DJI-Utilities
DJI-Transp
CrudeOil FAS
GLD
BBH
IBB
JETS
JNUG
KOL
NUGT
OIH
OIL
RSX
RETL
SLV
SOXL
TECL
TMF
TNA XIV YINN
Commodities: JJC, NIB,
WEAT UUP (Dollar)
To
STOCKS' CHARTS
AAPL ADBE
ALXN
AMAT
AMGN
AMZN BA
BIDU
CAT
FB
GOOG
GS
HD
IBM JPM M
(Macy's) MASI
MSFT
NVDA QCOM
TSLA
TXN
new
CMG (Chipotle),
LRCX, SWKS,
TOWN
Others REN, CVE
and SWN (very low AI/200 stocks)
7/27/17
Bullish
MAXCPs Bearish MINCPs
 RANKING OF KEY DIRECTORIES BASED PCT.OF STOCKS ABOVE 65-DMA
               7/27/17
Bullish = 35
Bearish = 10
---------------------------------------------------------------------------------------
Directory     Current       day-1         day-2         day-3         day-4         day-5
----------------------------------------------------------------------------------------
ETFS           .926          .955          .897          .897          .911          .941
BIGBANKS       .857          .857          .857          .857          .857          .857
INSURANC       .852          .941          .941          .852          .852          .882
NIFTY          .833          .933          .933          .933          .9            .9
BONDFUND       .821          .875          .758          .83           .883          .883
BEVERAGE       .8            .8            .65           .65           .75           .8
MORNSTAR       .785          .777          .815          .802          .806          .823
INDEXES        .761          .757          .752          .7            .728          .719
SOLAR          .736          .789          .789          .736          .736          .736
GAMING         .733          .766          .766          .766          .733          .733
SEMI           .732          .827          .758          .75           .75           .784
UTILITY        .711          .711          .555          .666          .755          .688
CHINA          .709          .758          .725          .709          .758          .741
COMODITY       .685          .628          .542          .628          .614          .585
ELECTRON       .685          .757          .716          .716          .721          .747
INDMATER       .683          .673          .734          .704          .734          .734
SP-100         .68           .639          .68           .649          .649          .69
N=17
============================================================================================
FOOD           .666          .466          .333          .8            .8            .8
HOMEBLDG       .666          .666          .666          .666          .666          .666
MILITARY       .666          .666          .733          .777          .777          .777
RUS-1000       .66           .677          .705          .681          .694          .71
FINANCE        .659          .714          .769          .692          .648          .736
SP500          .657          .671          .683          .675          .693          .709
GREEN          .645          .709          .709          .677          .709          .709
REIT           .637          .606          .585          .569          .595          .595
NASD-100       .634          .709          .677          .677          .655          .709
DOWJONES       .633          .533          .533          .633          .6            .6
SOFTWARE       .625          .703          .703          .718          .703          .75
GOLD           .622          .792          .415          .433          .566          .452
DJI-13         .615          .461          .461          .615          .615          .615
BIOTECH        .578          .661          .661          .677          .669          .681
COMPUTER       .56           .64           .68           .68           .72           .68
AUTO           .55           .625          .65           .6            .675          .725
RETAIL         .534          .482          .482          .344          .396          .379
CHEM           .513          .527          .666          .638          .638          .666
N=18
===========================================================================================
INFRA          .454          .454          .818          .545          .545          .454
REGBANKS       .444          .583          .722          .611          .472          .583
HACKERS        .437          .687          .687          .687          .625          .687
OILGAS         .386          .392          .392          .329          .335          .405
===========================================================================================
PIPELINE       .333          .333          .333          .333          .333          .333
TRANSP         .3            .5            .55           .55           .6            .65
HOSPITAL       .285          .428          .714          1             .857          .857
EDU            .25           .375          .5            .5            .5            .75
COAL           .222          .444          .444          .444          .444          .444
JETS           .222          .444          .555          .555          .666          .777
N=10
===============================================================================
7/26/2017
The Peerless Buy still stands. Without today's
21 point leap up
by Boeing, the DJI would actually have
been down more than 40
points. Boeing has now taken over
from Goldman Sachs the position
of being the DJI-30's highest priced
and therefore most influential
stock. Boeing's earnings are hot from
military spending and from
better foreign sales of jets because
of a weaker Dollar.
Keep in mind that the A/D Line remains bullishly
pointing up,
there is no head and shoulders pattern
yet, the DJI is still 400
points below the upper band and a
declining Dollar is not automatically
bearish and will help American
exporters, though Big Bankers
and Bond Holders will loudly complain
to the Fed.
But the number of Trap-Door stocks is
rising and anything
that looks like a head/shoulders
pattern is causing traders to
dump. Hedge and buy Chinese ETFs
because of the falling
Dollar. JNUG is also recommended for
those with strong nerves.

NYSE Down volume was 100 million higher than Up
Volume, too.
Our Accumulation Index (IP21) is now
-.043. So, with the DJI rising
so artificially, how much more of a
DJI rally would it take to produce
a Peerless major Sell? Assuming
breadth and volume are like today,
the DJI will have to rally above 22055
to bring a Sell S9-V. At that point,
it would be 2.4% over its 21-dma. But
before it gets there, it will produce
a Buy B10 on only a close above
21790. If the DJI closed tomorrow
above 22055, we would have the unusual
situation where we would
have contradictory signals. By our
system, they would cancel each
other out. This happened in May
1993. The S7 and B10 cancelled
each other out.
However, if the DJI first gave a Buy
B10 and then a day or two later reached
the 2.4% band, then we will likely
have a separate Sell S9-V. That Sell would
become the operative signal.
Contradictory
Signals in 1993

DOLLAR BREAKDOWN

I would buy GLD or one of the gold
stocks' ETFs like JNUG, which jumped
today back above its 65-dma. Foreign
ETFs are strong as a result of the
Dollar's decline. I recently
suggested buying YINN (below). It still looks good.
It should be noted that the growth
rate for China's GNP is now +6.9%.
Ours is +1.9% or 2.0%.

How Much Lower Can IBM Go?

Cloud computing is competing with big IBM computers as never before.
Between 1991 and 1993, IBM plunged
from 34 to 10.25 in 18 months.
This was in a bull market, too. When
stocks show as much Red Distribution
as IBM shows, they become very
vulnerable. Big institutional money
wants out of them. If the
Professionals, representing Specialists and market
makers, are also bearish, stock like
these make very good short sales.
The number of Trap Door stocks rose to
14 today. The stock market like
the economic system as a whole is
polarizing. This is a time when hedging
would seem to be very profitable. See
how weak many of the bearish MINCPs
are and note how the appearance of a
head/shoulders causes traders to
"shoot first and ask questions later".
This weekend we'll go looking for these
patterns.


7/26/2017
PEERLESS
DJI, Signals, Indicators Daily
DJI Split Volume 10-DayUp/Down
Vol
Hourly DJIA A/DLine
for All Stocks.
S&P
OEX
NYSE
NASDAQ
COMPQX
with CP
DIA
SPY
QQQ
MDY
IWM-TNA
Short Term Interest Rates
DJI-Utilities
DJI-Transp
CrudeOil FAS
GLD
BBH
IBB
JETS
JNUG
KOL
NUGT
OIH
OIL
RSX
RETL
SLV
SOXL
TECL
TMF
TNA XIV YINN
Commodities: JJC, NIB,
WEAT UUP (Dollar)
To
STOCKS' CHARTS
AAPL ADBE
ALXN
AMAT
AMGN
AMZN BA
BIDU
CAT
FB
GOOG
GS
HD
IBM JPM M
(Macy's) MASI
MSFT
NVDA QCOM
TSLA
TXN
new
CMG (Chipotle),
LRCX, SWKS,
TOWN
Others REN, CVE
and SWN (very low AI/200 stocks)
7/26/17
Bullish
MAXCPs Bearish MINCPs
Trapdoors.
 RANKING OF KEY DIRECTORIES BASED PCT.OF STOCKS ABOVE 65-DMA
               7/26/17
34 Bullish sectors
10 Bearish sectors
---------------------------------------------------------------------------------------
Directory     Current       day-1         day-2         day-3         day-4         day-5
----------------------------------------------------------------------------------------
ETFS           .955          .897          .897          .911          .926          .941
INSURANC       .941          .941          .852          .852          .882          .882
NIFTY          .933          .933          .933          .9            .9            .933
BONDFUND       .875          .758          .83           .883          .883          .866
BIGBANKS       .857          .857          .857          .857          .857          1
SEMI           .827          .758          .75           .75           .784          .784
BEVERAGE       .8            .65           .65           .75           .8            .75
GOLD           .792          .415          .452          .566          .452          .433
SOLAR          .789          .789          .736          .736          .736          .736
MORNSTAR       .777          .815          .802          .806          .823          .836
GAMING         .766          .766          .766          .733          .733          .733
CHINA          .758          .725          .709          .758          .741          .758
ELECTRON       .757          .716          .721          .721          .747          .747
INDEXES        .757          .752          .7            .728          .719          .738
FINANCE        .714          .769          .692          .648          .736          .769
UTILITY        .711          .555          .666          .755          .688          .555
GREEN          .709          .709          .677          .709          .709          .741
NASD-100       .709          .677          .677          .655          .709          .731
SOFTWARE       .703          .703          .718          .703          .75           .781
RUS-1000       .678          .705          .681          .694          .709          .726
INDMATER       .673          .734          .704          .734          .744          .795
SP500          .673          .683          .675          .693          .709          .719
N=22
=============================================================================================
HACKERS        .666          .666          .666          .611          .666          .777
HOMEBLDG       .666          .666          .666          .666          .666          .666
MILITARY       .666          .733          .777          .777          .777          .8
BIOTECH        .665          .661          .669          .677          .681          .661
COMPUTER       .64           .68           .68           .72           .68           .72
SP-100         .639          .68           .649          .649          .701          .711
COMODITY       .633          .549          .633          .619          .577          .605
AUTO           .625          .65           .6            .675          .725          .75
REIT           .606          .585          .569          .595          .585          .606
REGBANKS       .583          .722          .611          .472          .583          .583
DOWJONES       .533          .533          .633          .6            .6            .633
CHEM           .527          .666          .638          .638          .666          .736
N=12
=============================================================================================
TRANSP         .5            .55           .55           .6            .65           .7
=============================================================================================
RETAIL         .482          .482          .344          .396          .379          .362
FOOD           .466          .333          .8            .8            .8            .8
DJI-13         .461          .461          .615          .615          .615          .692
INFRA          .454          .818          .545          .545          .454          .636
COAL           .444          .444          .444          .444          .444          .444
JETS           .444          .555          .555          .666          .777          .777
HOSPITAL       .428          .714          1             .857          .857          .857
OILGAS         .398          .398          .329          .335          .386          .436
EDU            .375          .5            .5            .5            .75           .625
PIPELINE       .333          .444          .333          .333          .333          .444
N=10
==================================================================================
==================================================================================
Go too
www.tigersoft.com/HHH51/XXXIndex.htm


