TigerSoft Hotline
(C) 2016 William Schmidt, Ph.D.
www.tigersoft.com
william_schmidt@hotmail.com

This address must change early Thursday AM
Look for our email (Tuesday or Wednesday) giving the new
address.
Current Hotline Address
http://www.tigersoft.com/816-HLN/INDEX.html
Previous
Addresses - http://www.tigersoft.com/77HL7778/INDEX.html
http://www.tigersoft.com/64HRL/INDEX.html
http://www.tigersoft.com/55HL55/INDEX.html
----->
TIGER Data Page Users. <-----
Read about the new Data Download - WEEKHIAI
I think it will make you money with less
risk.
----->
Suggestion <-----
A number of your email accounts are putting emails from me
using william_schmidt@hotmail into
the Junker folder. Please
"be-friend" an email from me so that you promptly get change
of address information regarding new Hotline links.
-----------------------------------------------------------------------------------------------------------------
HELP
A
Guide To Profitably Using The Tiger Nightly HOTLINE
Introduction
to Tiger/Peerless Buys and Sells.
Peerless
Buy and Sell Signals: 1928-2016
Individual Peerless signals explained:
http://tigersoftware.com/PeerlessStudies/Signals-Res/index.htm
http://www.tigersoft.com/PeerInst-2012-2013/
Explanation of each Peerless signal.
http://www.tigersoft.com/PeerInst-2012-2013/
Different
Types of TigerSoft/Peerless CHARTS, Signals and Indicators
Peerless Signals and DJI
Charts - version 7/4/2013
1965
1965-6 1966
1966-7
1967
1967-8
1968
1968-9
1969
1969-70 1970
1970-1
1971
1971-2 1972
1972-3
1973 1973-4
1974
1974-5 1975
1975-6
1976 1976-7
1977
1977-1978
1978
1978-79
1979
1979-80
1980
1980-1
1981
1981-2
1982
1982-1983
1983 1983-1984
1984
1984-1985
1985
1985-1986
1986
1986-1987
1987
1987-8
1988
1988-9 1989
1989-90
1990
1990-1 1991
1991-2
1992
1992-3
1993
1993-4
1994
1994-5
1995
1995-1996 1996
1996-7
1997
1997-8 1998
1998-1999
1999
1999-2000
2000
2000-1 2001
2001-2
2002
2002-3
2003
2003-4
2004
2004-5
2005 2005-6
2006
2006-7
2007
2007-8
2008
2008-9
2009
2009-10
2010
2010-11
2011
2011-12
2012
2012-2013
Documentation for
TigerSoft Automatic and Optimized Signals.
How reliable
support is the DJI's rising 200-day ma?
SPY
Charts since 1994: Advisory Closing Power S7s, Accum. Index, 65-dma, Optimized
Signals.
Previous Hotlines -
www.tigersoft.com/55HL55/INDEX.html
^^^^^^^^^^^^^^^^^^^^^^^^^^^^^^^^^^^^^^^^^^^^^^^^
1/19/2016
--->
Corrections,Deeper Declines and Bear Markets since 1945.
1/21/2016
--->
High Velocity Declines since 1929
2/12/2016 --->
Presidential Elections Years and Bullish IP21 Positive Non-Confirmations at
Lower Band.
2/12/2016 --->
OBV NNCs on
DJI's Rally to 2.7% Upper Band when DJI's 65-dma is falling.
Earlier
Q-Answers
New
QuickSilver Documentation
(1/11/2016)
Our Different Signals
Better
understand the difference between Peerless DJI-based signals,
the one-year optimized red Signals and
the fixed signals based
on technical developments.
Introduction to
Tiger/Peerless Buys and Sells.
Different Types of TigerSoft/Peerless CHARTS, Signals and Indicators
===================================================================================
Peerless/TigerSoft Hotlines and Links
8/11/2016 Our Peerless Buys (Buy B3,
Buy B19,
Buy B20 and
Buy-B1) has been
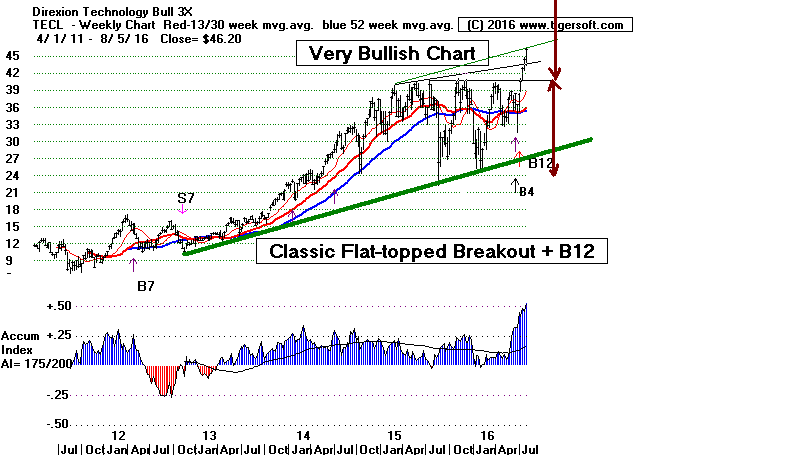
productive. We see no reason to sell. In particular, the signals
have
brought about a very bullish flat topped breakout on the powerhouse
high tech, TECL. This is a classic and very bullish weekly breakout.
It even has a very bullish weekly Buy B12. The track record of Peerless
with TECL looks much too good to argue with. See this track record further
below and read up on the
Powerful Longer Term Weekly Buy B12 Signals
of
TigerSoft
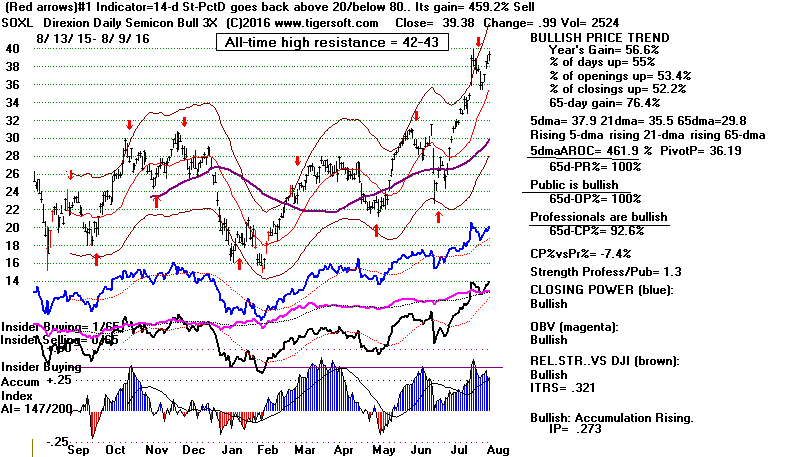
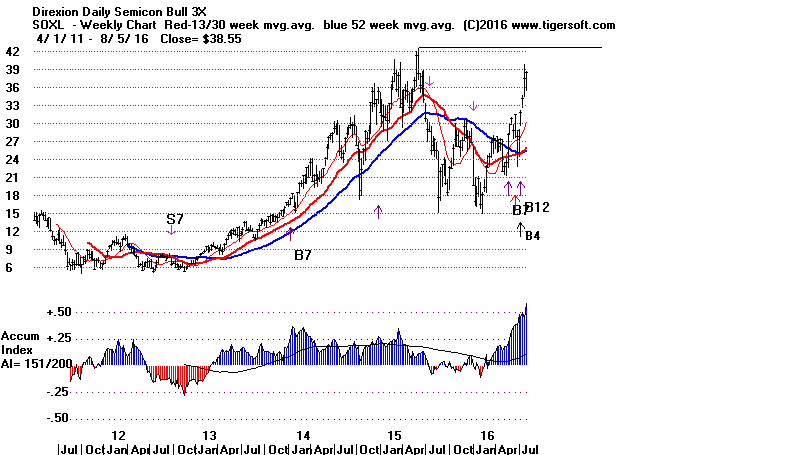
Now we must watch SOXL to see if it can make a similar breakout into
7 year all-time high territory. SOXL (Semiconductors) has been lagging,
but the very positive Jobs' data are giving a big boost to this industry's
outlook.
My Explosive Super Stocks book makes much of the semi-conductor
group's historical importance in confirming a big move by the overall market.
This I have suggested owes to the industry's high fixed costs and
volatile earnings. So, until SOXL shows it is unable to move higher, I think
we can assume there is more to this bull market. See the weekly SOXL
and TECL charts at the bottom of today's Hotline.
Will TECL's Breakout Next Be Matched
by SOXL Making a comparable breakout?
Once again I can report that there were
more up than down on the
NYSE and that the Hourly
DISI/OBV trend is still rising, too.
The DIA's Closing Power's trend is no longer
up, but this indicator
is decidedly pointing higher for the OEX,
SPY, QQQ,
IWM, TECL,
SOXL, IBB
and FAS.
Charts: Peerless
DJIA Hourly DJIA
DIA
NetIDOSC for DJI-30
SPY QQQ
IWM
DJI-Utilities REITS
A/D Line-6000 Stocks
SOXL TECL
IBB
FAS
Crude Oil
Major Indexes and A/D Lines.
Key Tiger
Software ETF Charts
Bullish MAXCPs
Bearish MINCPs
Charts of Key ETFs
TECL and Peerless Signals
Trading Results
1) Peerless Buys and Sells are super-imposed on yearly TECL charts
2) Results are based on Opening prices after a reversing Peerless signal:
Sell to Buy to establish a long position and Buy to Sell to establish a short
position.
3) Though TECL is thinly traded, the paper losses are small and
it should be used to trade reversing Peerless signals.
4) The results start after the first six weeks of each year because programming
limitations presently prevent the signals at the start of the year to be
superimposed.
5) It is assumed that one starts with $10,000 and all proceeds are fully
invested
with each trade. A round trip commission of $40 is assumed.
TECL Trading Gain: 2009-2016
from Peerless Reversing Buys and Sells
2009 +568%
2010 +639%
2011 +179%
2012 +187%
2013 +113%
2014 + 110%
2015 +146%
2015-2016 +145%
====================================================================================
8-8-2016 Our Peerless Buys (Buy B3,
Buy B19,
Buy B20 and
Buy-B1
still stand. Though the DJI
slipped back a little, there were
more up than down and the Hourly
DISI/OBV trend is still rising, too.
The DIA's Closing Power's trend is no longer
up, but this indicator
is decidedly pointing higher for the OEX,
SPY, QQQ,
IWM, TECL,
SOXL, IBB
and FAS. Also making recovery highs
today were
the foreign ETFs,
Brazil,
emerging markets and YINN.
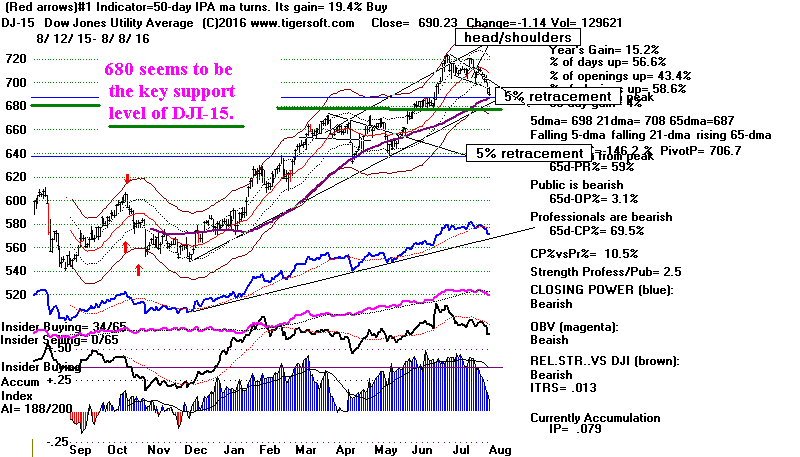
I doubt if a turn downwards now by the DJI or the Utilities will stop
the general movement higher. There are enough periods when
the DJ-15 falls while the DJI-30 rises , so that I think we should not
place too much emphasis on it. See
Utilities since 1988 study.
Generally speaking, Wall Street is probably pleased that Trump
is dropping in the recent polls. I also continue to believe that the
FED will not raise rates until November, after the Presidential
Election.
Charts: Peerless
DJIA Hourly DJIA
DIA
NetIDOSC for DJI-30
SPY QQQ
IWM
DJI-Utilities REITS
A/D Line-6000 Stocks
SOXL TECL
IBB
FAS
Crude Oil
Major Indexes and A/D Lines.
Key Tiger
Software ETF Charts
Bullish MAXCPs
Bearish MINCPs
Charts of Key ETFs
The Peerless Buys and Sells have worked well for most of the
last year. "It's important to do nothing if nothing needs to be done"
(JFK, the conservative.)
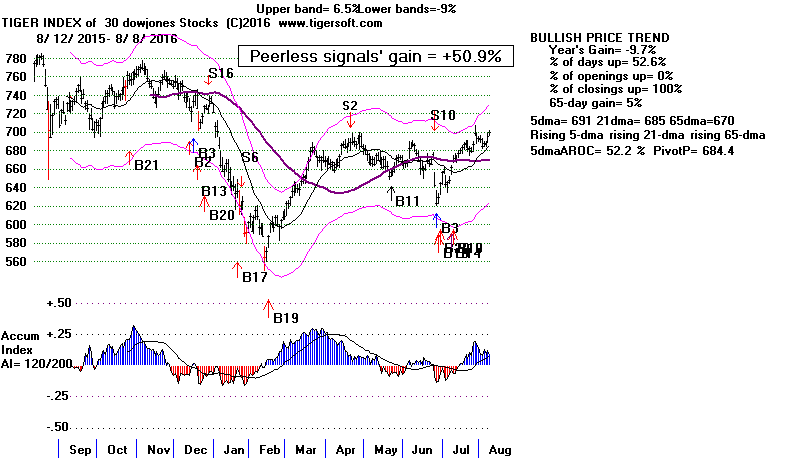
Tiger Index of Stocks
Peerless Signals' Gain
since Oct 28, 2015
(Buying and Selling Short
at opening the day after
a reversing Peerless signal)
DJI-30
50.9%
OEX-100
51.1%
QQQ-100
48.2%
SP-500
44.3%
RUSS-1000
46.7%
BIG BANKS
91.0%
BIOTECHS
106.2%
COMMODITIES
only +12.5%
FOREIGN ETFS
136.6%
GOLD
only 15.1%
NIFTY-35
54.7%
OIL STOCKS
only 14.0%
FAS
+117%
IBB
+63.4%
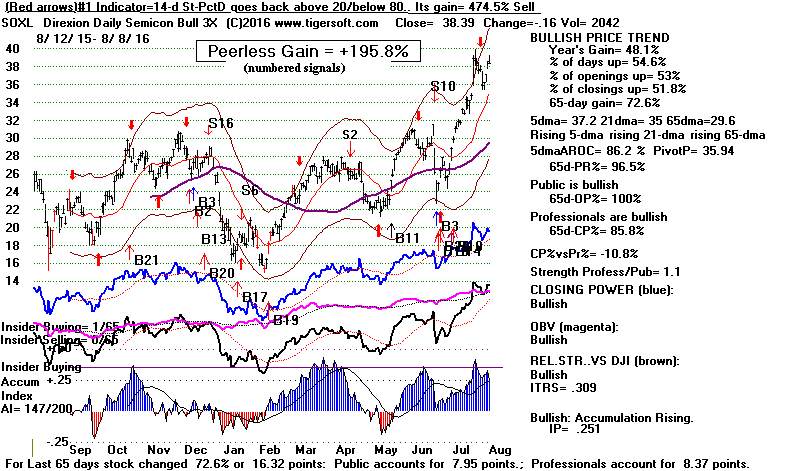
SOXL
+195.8%
TECL
+143.3%
TNA
+190.8%
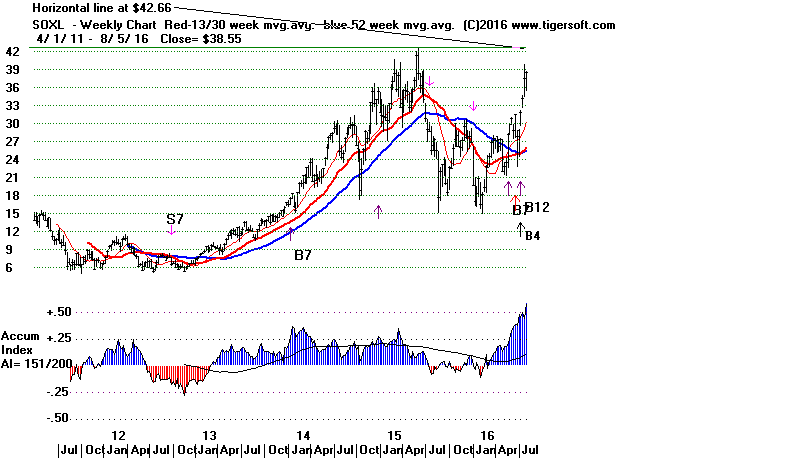
Tiger says to sell SOXL. Peerless does not say to sell it yet.
42.6 is its 5-year high. See second weekly chart below. We
should get back there on this advance.
Weekly Resistance on SOXL
===================================================================================
8-5-2016 Our Peerless Buys (Buy B3,
Buy B19,
Buy B20 and
Buy-B14 appear
to have done what they were supposed to and told us to expect
higher prices. The DJI's 5-day ma has turned up. The NYSE
A/D Line made a 12-month high ahead of the DJI itself, this
despite the shift out of some leading NYSE dividend stocks (Utilities
REITs). I view a less defensive market as a good sign.
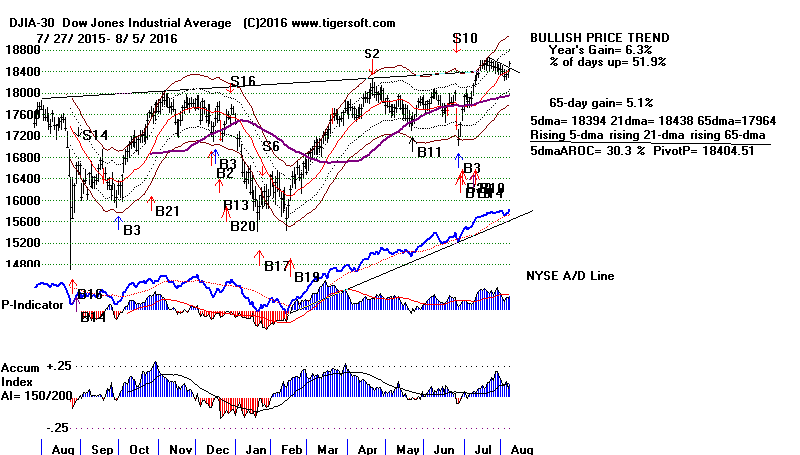
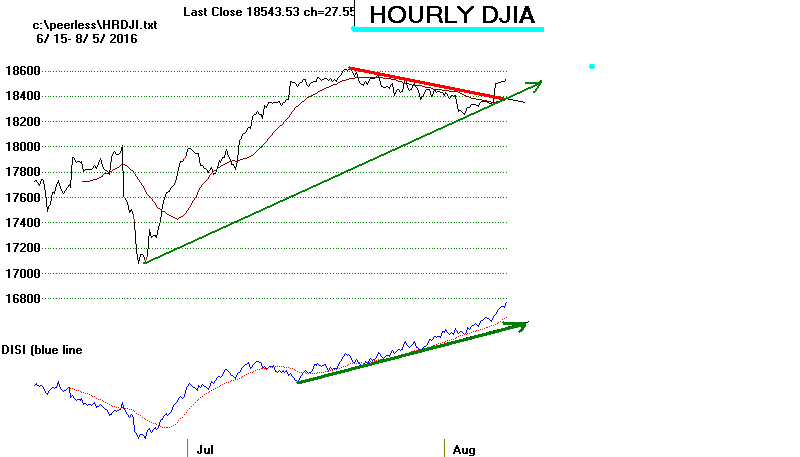
The Hourly DJI's OBV/DISI is also bullishly making new highs ahead of
prices. The DJI certainly looks like it will reach 19000 soon and if it
gets
there, why not 20,000 just in time for the partisan celebration
that usually occurs just after the Election?
Hourly DJI's DISI-OBV is in uptrend.
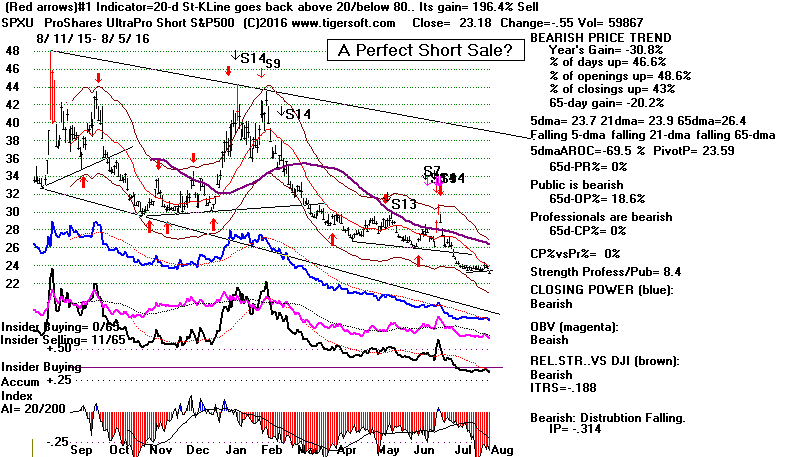
It has to be very bullish now that so many of the short ETFs for
the DJI, SP-500, QQQ, Russell-2000, Banks, Emerging Markets
look terrible: new 12-month lows confirmed by heavy red Distribution
below its 21-day ma with their Closing Powers making new lows.
See the BEARISH MINCPs
tonight.
Charts: Peerless
DJIA Hourly DJIA
DIA
NetIDOSC for DJI-30
SPY QQQ
IWM
DJI-Utilities REITS
A/D Line-6000 Stocks
SOXL TECL
IBB
FAS
Crude Oil
Major Indexes and A/D Lines.
Key Tiger
Software ETF Charts
Bullish MAXCPs
Bearish MINCPs
Charts of Key ETFs
Utilities' Declined Friday
But DJI-15 is still above its 65-dma, key price-uptrend
and hasnot declined more than 5% below its
recent highs. A decline now below 680 could
set up a 100-point DJI-15 decline even as DJI
continues to rise.
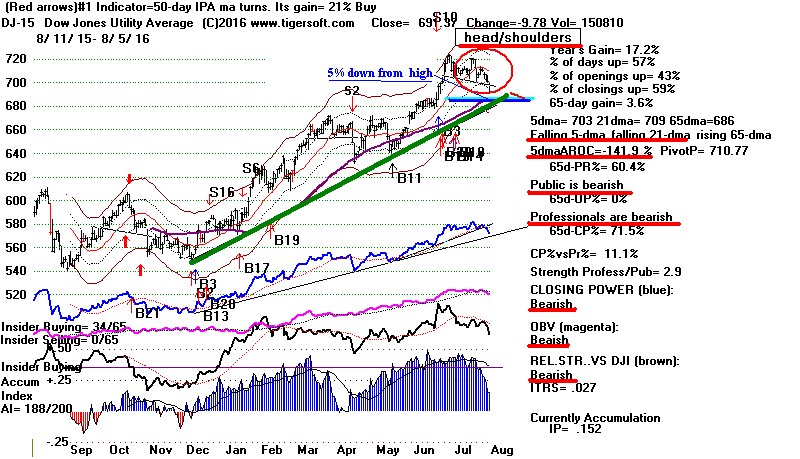
Our chart of the DJI-15 (Utilities) above shows that 680 is the key level
to watch. A decline below 680 would cause a number of bearish
technical developments even if Peerless gives no sell signal.
1) The Bearish Head/Shoulders top pattern in DJI-15 has already
been completed. A close below 680 would put this Average down
more than 10% from its high. This is a handy way to clinch
Head/Shoulders patterns in the DJI-15.
If you own Utilities, see the
DJI-15 study for the period 1988-2016 tonight.
2) The Utility Average's long price uptrend would be violated.
3) The support of the DJI-15's 65-dma would then be oversome.
4) And the DJI-15's Closing Power would then have decisively
turned down.
July Jobs Report Was Bullish
Friday's 200+ point jump owed to the nice July Jobs' Report/
According to it, 255,000 new Jobs were created by US private industry.
No doubt, some "hawks" will conclude that two straight numbers over
250,000 'should allow' the FED to safely raise interest rates. This view
explains the sell-off in Golds, REITs and utilities. Will Utilities keep
going down? The DJI-20 is still in an uptrend, above its 65-dma and
has not fallen 5% from its highs. .
Hot Money seems to be shifting into tech stocks and smaller stocks.
See the big gains below made Friday by TECL
(leveraged Techs) and
TNA (leveraged Russell-2000).
| |
| Year |
Jan |
Feb |
Mar |
Apr |
May |
Jun |
Jul |
Aug |
Sep |
Oct |
Nov |
Dec |
| 2006 |
278 |
316 |
281 |
183 |
23 |
82 |
207 |
181 |
158 |
4 |
208 |
171 |
| 2007 |
240 |
90 |
189 |
79 |
143 |
78 |
-33 |
-24 |
88 |
85 |
115 |
97 |
| 2008 |
19 |
-86 |
-78 |
-210 |
-185 |
-165 |
-209 |
-266 |
-452 |
-473 |
-769 |
-695 |
| 2009 |
-791 |
-703 |
-823 |
-686 |
-351 |
-470 |
-329 |
-212 |
-219 |
-200 |
-7 |
-279 |
| 2010 |
28 |
-69 |
163 |
243 |
522 |
-133 |
-70 |
-34 |
-52 |
257 |
123 |
88 |
| 2011 |
42 |
188 |
225 |
346 |
73 |
235 |
70 |
107 |
246 |
202 |
146 |
207 |
| 2012 |
338 |
257 |
239 |
75 |
115 |
87 |
143 |
190 |
181 |
132 |
149 |
243 |
| 2013 |
190 |
311 |
135 |
192 |
218 |
146 |
140 |
269 |
185 |
189 |
291 |
45 |
| 2014 |
187 |
168 |
272 |
310 |
213 |
306 |
232 |
218 |
286 |
200 |
331 |
292 |
| 2015 |
221 |
265 |
84 |
251 |
273 |
228 |
277 |
150 |
149 |
295 |
280 |
271 |
| 2016 |
168 |
233 |
186 |
144 |
24 |
292(P) |
255(P) |
|
|
|
|
|
|
==================================================================================
8/4/2016 With Peerless Buys (Buy B3,
Buy B19,
Buy B20 and
Buy-B14) in
place, we want to find good re-entry points to buy the major ETFs.
Our Buy signals are fortified by the NYSE A/D Line's continuing
strength and the bullish divergence between the up-trending Hourly
DJI's DISI-OBV
and the steady, low volume retreat in the DJIA.
Goldman Sachs and others have made dismal forecasts for the
market recently. With volume nearly the lowest of the year, it
would seem that the bears cannot induce any more significant
selling. If the DJI can now get past its downtrend and turn up its
5-day ma, I would think it will quickly get back to its highs at 18600.
Augusts in Presidential Election years typically produce Summer
Rallies, not major tops. 2008 was the big exception. Let's hope
the FED has learned their lesson from this year.
The DJI does seem to be about to reverse its downtrend. But we
still need to see it surpass its downtrend-resistance line and have
its 5-day ma turn up again.
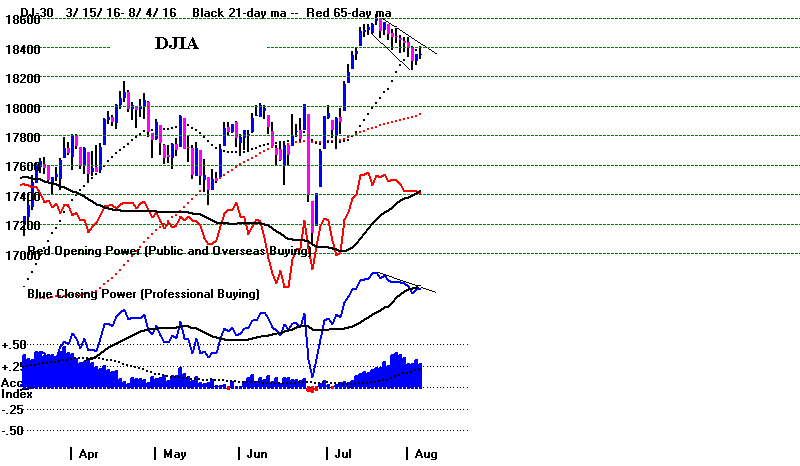
TECL looks like the best of the major ETFs to buy now.
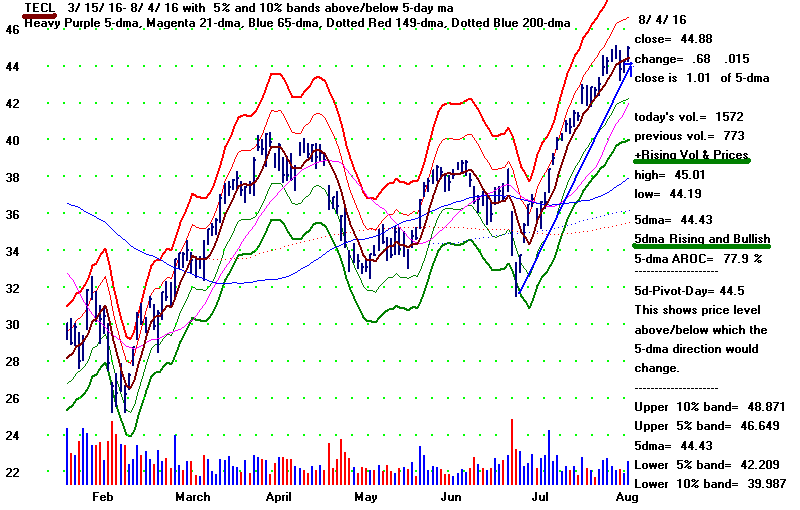
To better time purchases of DIA,
SPY, QQQ,
IWM, SOXL and
TECL
we want to see new optimized Red Buy signals, a rising 5-day ma,
a break in the Closing Power downtrend, positive IP21 (Accumulation),
positive ITRS (relative strength) and an increase in volume on the
day's advance. The QuickSilver program gives us all these numbers.
But we can also get most of them from the basic Tiger graph. Using
this approach only TECL rates a Buy now.
Buy/ 5-dma
Closing IP21 ITRS
Volume Pivot
Sell AROC
Power (Current (Relative
Point
trend Accum.) Strength
to Turn 5-dma up
--------------------------------------------------------------------------------------------------------------------------------------
DIA
50-dStoc Buy
-25.3% ?
+.196
------- falling
0.68 above today's close
SPY
21-d CP Buy
-8.3% Up
+.256 +.004 falling
0.71 above today's close
QQQ
20-dStoc Sell
+29.9%
Up +.182
+.029 falling
0.44 below today's close
IWM
14-dStoc Buy
-11.2% Up
+.088 +.030
falling 0.51 above today's close
SOXL
14-dStoc Sell
-134.7% Up
+.298 +.305
rising 0.42 below today's close
TECL
14-dStoc Buy
+77.9% Up
+.310 +.188
rising 0.38 below today's close
SLV
50-dma Buy
+36.1% Up
+.152 +.218
falling Close
was at key 5dma pivotp
GLD
50-dma Buy
+85.6% Up
+.166 +.070
falling 0.89
below today's close
Charts: Peerless
DJIA Hourly DJIA
DIA
NetIDOSC for DJI-30
SPY QQQ
IWM
DJI-Utilities REITS
A/D Line-6000 Stocks
SOXL TECL
IBB
FAS
Crude Oil
Major Indexes and A/D Lines.
Key Tiger
Software ETF Charts
Bullish MAXCPs
Bearish MINCPs
Charts of Key ETFs
QUICKSILVER
RANKING
APPLIED TO ALL STOCKS
The key idea behind the QuickSilver strategy
is for traders
to stay long the very strongest stocks for as long as their
5-dma is rising or until a sufficient trading profit is achieved
from one their vertical advances. The ranking is by the 5-day
ma annualized rate of change. We want confirmation by having
both Opening and Closing Power rising, seeing the IP21 is above
+.16 and volume rising on daily advances. In this situation, they
usually bounce up off their 5-dma. The pivot-point lets us sell
on the same day that the 5-dma turns down.
See the 6-month charts by clicking on the symbols below
C:\fastup - 08/04/16
5DAROC        Symbol        Last          5-dma         Pivot         Change
..............................................................................................
IP21          AI/200        OP-PWR        CP-PWR        PCT-Up   Daily Vol. notes
==============================================================================================
1540.5        CLD           3.75          3.48          3.41          .2
.35           83            Rising        Rising        .502          bullish
---------------------------------------------------------------------------------------------
1360.5        NAK           .68           .62           .54           .03
.19           92            Rising        Rising        .361          bullish
---------------------------------------------------------------------------------------------
1153.6        EXEL          11.07         9.61          9.18          1.68
.24           133           Rising        Rising        .526          bullish
---------------------------------------------------------------------------------------------
1087.5        STAA          8.24          7.1           6.84          1.61
.24           110           Rising        Rising        .45           bullish
---------------------------------------------------------------------------------------------
1027.8        CHGG          6.5           5.98          5.39          .2
.2            96            Rising        Rising        .466          bullish
---------------------------------------------------------------------------------------------
967.2         PODD          41.84         36.67         35.39         6.39
.24           131           Rising        Rising        .506          bullish
---------------------------------------------------------------------------------------------
957.8         PCRX          44.63         38.81         36.25         7.14
.18           117           Rising        Rising        .518          bullish
---------------------------------------------------------------------------------------------
================================================================================
8/3/2016 The Peerless Buys (Buy B3,
Buy B19,
Buy B20 and
Buy-B14) are
still operative. No intermediate-term Sell signal looms ahead.
If the DJI does continue to retreat, the additional weakness
should be limited. The Hourly DJI's DISI-OBV is in an uptrend
and the DJI is close to reaching an oversold technical status.
The DJI's small recovery today relieved some of the over-sold
tension from the 7-day decline. It did bring optimized, short-term
red Buy signals on the Tiger charts of IWM (Russell-2000) and
MDY (Midcaps). The DJI's 5-day Stochastics are still not yet in
oversold (<20) territory and it will take a 100 point gain tomorrow
to cause the DJI's key short-term, 5-day ma to turn up.
Such
a move back upwards will also likely cause the Closing Power to
break its down trend, thus signaling what can then be considered
a successful test of its 21-day ma. Such action should be used
buy DIA, IWM or
MDY.
Charts: Peerless
DJIA Hourly DJIA
DIA
NetIDOSC for DJI-30
SPY QQQ
IWM
DJI-Utilities REITS
A/D Line-6000 Stocks
SOXL TECL
IBB
FAS
Crude Oil
Major Indexes and A/D Lines.
Key Tiger
Software ETF Charts
Bullish MAXCPs
Bearish MINCPs
Charts of Key ETFs
7 Straight Down Days Near The Year's Highs.
What Is Its Significance?
Seeing the DJI decline 7 straight days is disconcerting and
scary in view of how long the DJI has been rising and because
so much of the advance owes to the wholly artificial help from the
FED, which has purchased trillions and trillions of dollars worth
of government bonds and mortgages. But if we leave out the FED's
involvement as a consideration, and go back over the history of
the DJI since 1929, we find that the DJI's falling 7
straight days
when it is still less than 5% from its yearly highs nearly always sets
up a good short-term buying situation. See
tonight's new Study
of this.
7 Straight DJIA Down Days
Those with DJI not 5% below 12-month DJI high.
1929 - quick recovery from lower band with new highs
following..
1951 -
recovered only back to previous highs.
1959 -
quick recovery from lower band with new highs following.
1963 -
after a few more down-days, recovery from lower band with new highs following.
1973 - bear market follows immediately.
Here there were multiple Sell S9s.
1976 - another month of
weakness followed,
then rally back to resistance. Sell S9V at top.
1989 -
quick recovery from rising 21-dma with new highs following. This
seems similar
to current case by virtue of the decline stopping at the 21-day ma.
Cases where DJI was down slightly more than 5% from highs.
(2011 -
Deeper 13.5% decline from highs followed. DJI was down slightly more than
5% from high.)
(2015 -
Deeper 13.5% decline from highs followed. DJI was down slightly more than
5% from high.)
==================================================================================
8/2/2016 The Peerless Buys (Buy B3,
Buy B19,
Buy B20 and
Buy-B14) are
still operative. No intermediate-term Sell signal looms close ahead.
The
10-day Red NYSE Down Volume is in the ascendant,
but the DJIA and DIA
are close to registering "oversold".
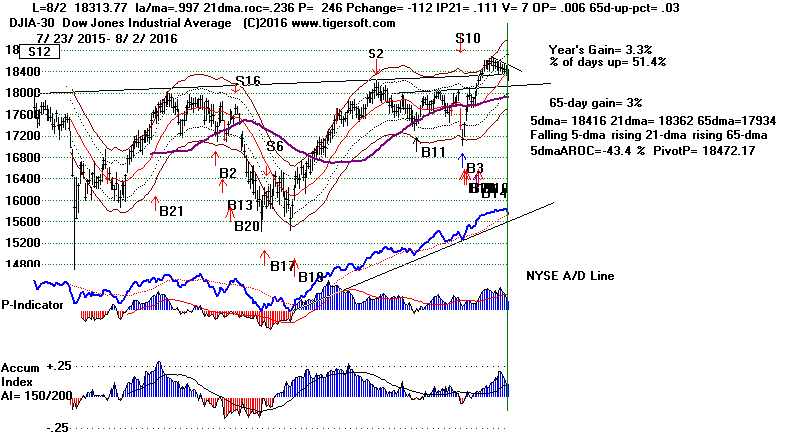


When we go back over the last 15 years of SP-500 charts, we see
that "high diving-board" patterns, like we have now, have always brought
additional
advances. Only when they take the shape of a head/shoulders
pattern have they brought intermediate-term declines.
We do see short-term, optimized red Sell signals on the Tiger Indexes
of the Big Banks, on the
SP-500 and
NYSE.
More
of a decline is
certainly possible, though the
Hourly DISI-OBV's strength continues
to deny that it will be lengthy or deep. My guess is that the
DJI will
find strong support at its recent breakout point at 18000 if it should fall
that far. But, it has already fallen seven straight days and is still only
0.3% below its dma. So far, this seems like a carefully staged
retreat
in a bull market. Another day or two down should set up a good rally
from a technically oversold condition using the 5-day Stochastic on the
DIA.
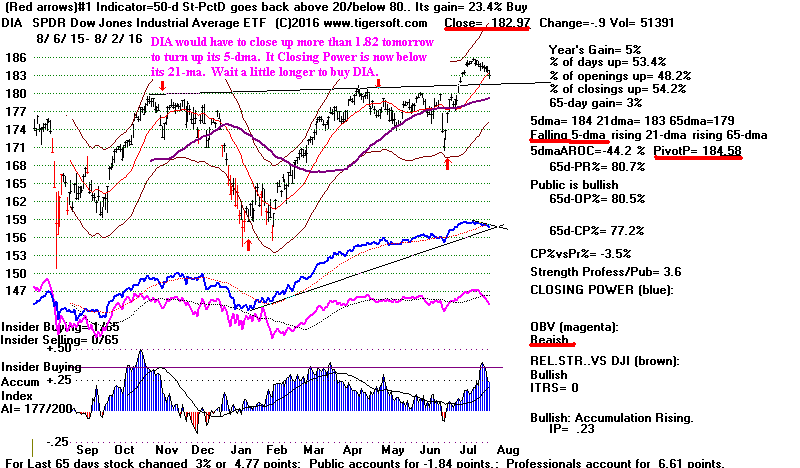
What To Do?
If you are nervous, and I think we have to be considering the length of
the bull market and how the DJI has now fallen 7 straight days,
take profits in TECL and sell short some the Bearish
MINCPs listed
tonight. All of these show heavy red Distribution and
made 12-month
lows far ahead of the overall-market. We
will buy DIA when its
Closing Power breaks its current downtrend.
Charts: Peerless
DJIA Hourly DJIA
DIA
NetIDOSC for DJI-30
SPY QQQ
IWM
DJI-Utilities REITS
A/D Line-6000 Stocks
Crude Oil
SOXL TECL
IBB
Major Indexes and A/D Lines.
Key Tiger
Software ETF Charts
Bullish MAXCPs
Bearish MINCPs
Charts of Key ETFs
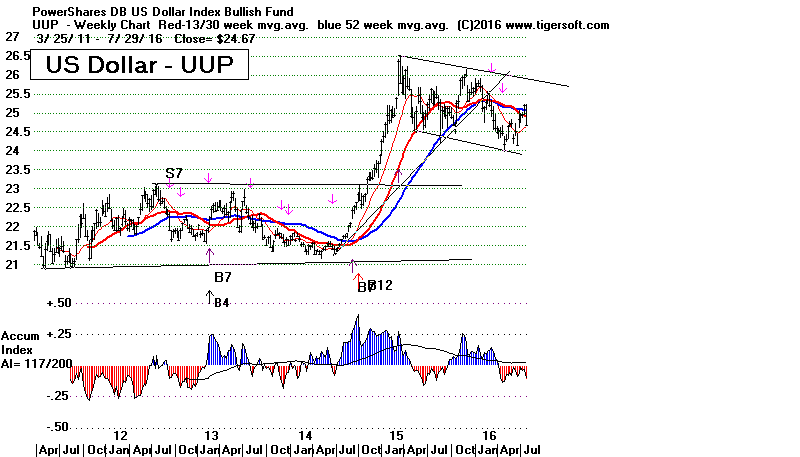
The continuing weakness in Crude Oil warns that world deflationary
problems still pose a threat. The meager 1% growth in the US economy
is witness to that. The Dollar has fallen below its rising 52-week ma.
It moves slowly and is still locked in its 2-year trading range, so I doubt
that weakness here will worsen much or adversely affect the dividend
plays that have been so popular. Short-term interest rates would have
breakout of their own trading range before we need worry about a
Fed rate hike. The Dollar's weakness this past week is good news for
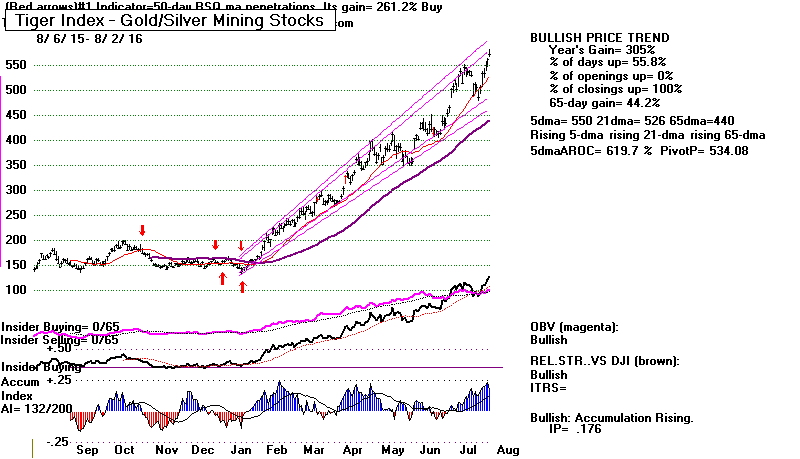
Gold and Silver stocks, except that they could use a week of constructive
consolidation, I would say.
================================================================================
8/1/2016 The Peerless Buys (Buy B3,
Buy B19,
Buy B20 and
Buy-B14) are
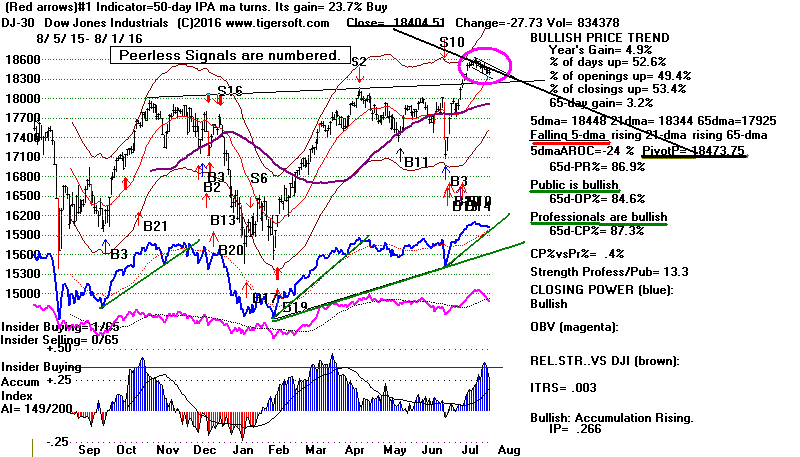
still operative. No intermediate-term sell seems to be approaching.
Give the best performing "long" plays now more time to keep running.
The DJI itself is slowly falling back to its rising 21-dma
while its Closing Power seems set to test its rising 21-day ma.
The DJI will need to rise by 70 points at tomorrow's close to
turn up its falling 5-day ma. But I doubt if the decline we are
seeing will be very deep. The
Hourly DJI's DISI is uptrending.
We have not yet seen NYSE Down-Volume
rise by much.
The NYSE A/D Line's uptrend keeps
making new highs ahead
of the DJI. In the Presidential Election years since 1968, the
DJI has risen 70.8% of the time over the next week, 66.7% of the
time over the next two weeks and 79.2% of the time over the
next month.
Federal Reserve "Smoke"
Over the weekend, NY Fed Governor Dudley warned investors
not to
rule out an interest-rate hike this year. His actual remarks were
jarringly nebulous and indefinite. They had no effect on interest
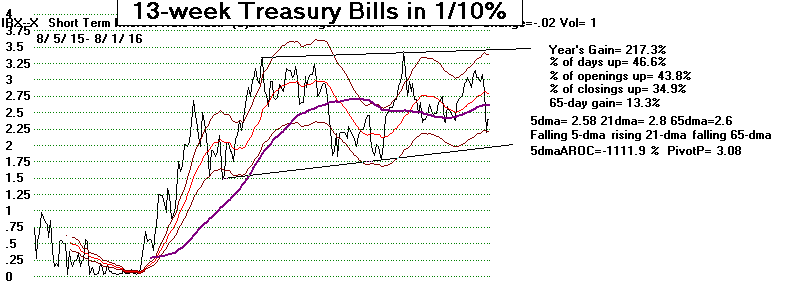
rates, as far I can tell. Its not likely the FED will raise rates
before November for fear of causing another violent market decline
and thereby becoming a campaign issues, themselves.

Falling Light Crude Is A Problem
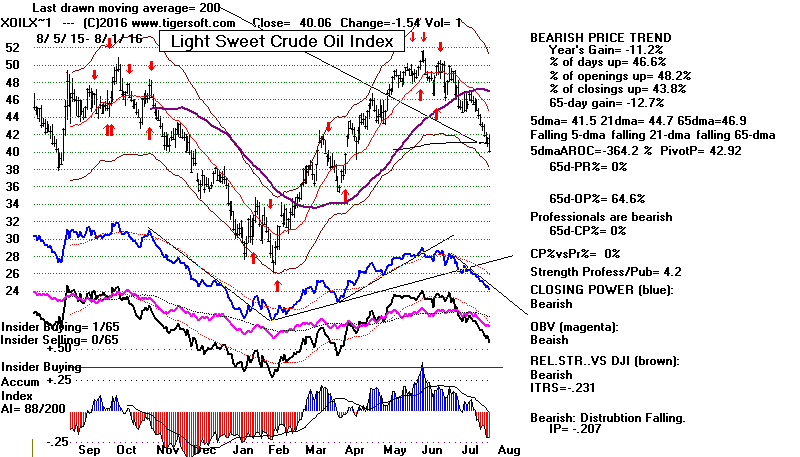
Light Crude fell below its 200-day ma today. If it fails to turn
up tomorrow, this can be construed as a Sell. Will Crude Oil keep
falling? Is it doing this because world-demand is lagging due to a
weakened world economy? Today this produced selling in
YINN (China),
Foreign ETFs and turned the
FTSE back down at the resistance
of its falling 65-dma.
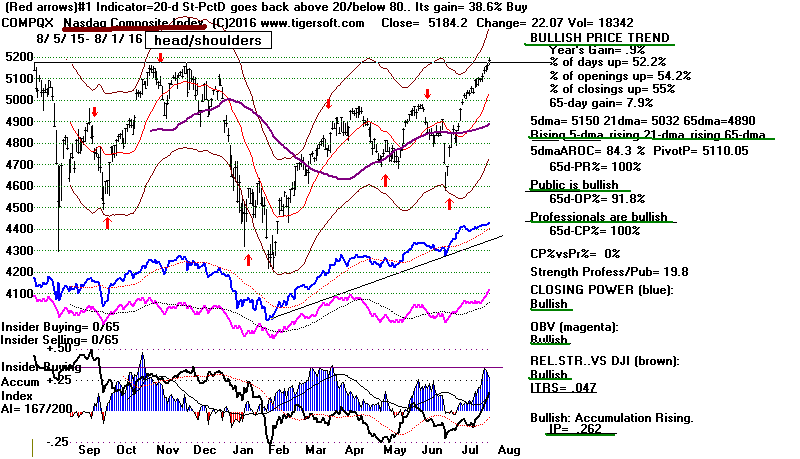
The NASDAQ rose today to 5184.20. It has almost reached its all-time high
from last summer, 5231.94. It should, at least, make a nominal
closing
high. Note that its has not produced a red Sell yet. Definitely
continue
to hold TECL and
SOXL.
Charts: Peerless
DJIA Hourly DJIA
DIA
NetIDOSC for DJI-30
SPY QQQ
IWM
DJI-Utilities REITS
A/D Line-6000 Stocks
Crude Oil
SOXL TECL
IBB
Major Indexes and A/D Lines.
Key Tiger
Software ETF Charts
Bullish MAXCPs
Bearish MINCPs
Charts of Key ETFs
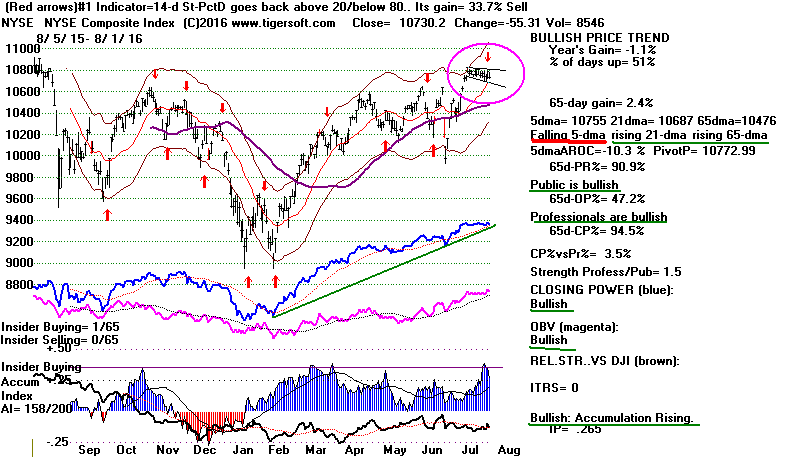
"High Diving" or "Spring Board FLAG Patterns"?
Because Peerless is on BUYs and because I can find
no bearish
"high diving-board narrow flat tops that last two weeks, I have to expect
we will see upside breakouts in the
SP-500, OEX,
NYSE and
MDY. Of the
indexes with this flat pattern, only the NYSE has switched to a new,
automatic, optimized Red short-term Sell.
ed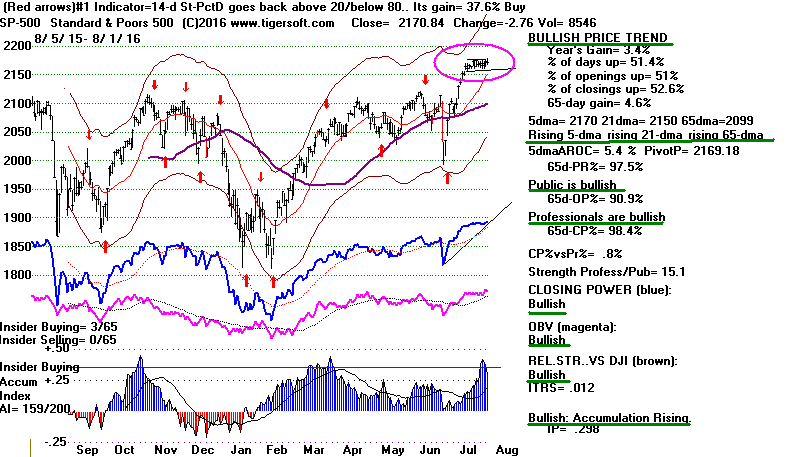
==============================================================================
7/29/2016 Our Peerless Buys
(Buy B3,
Buy B19,
Buy B20 and
Buy-B14) are telling
us to give the market every chance now to show what it can do on the upside.
We have seen flat topped breakouts by the
DJI,
SP-500
and TECL.
Now we should expect bullish short-term flat topped,
flag-pattern
breakouts by SPY,
MDY, IWM and
VWO (emerging Markets).
For the major ETFs, like DIA and
QQQ, both the Opening and the Closing Powers
are rising. This very bullish situation can last another four weeks.
At some point,
it will end, probably when the Closing Power turns weak. But not very
soon,
I believe. The Hourly
DJI's DISI-OBV Line is rising nicely. Before the
last three
big intermediate-term declines took place, the DJI's DISI-OBV Line started
making 2 month
lows far ahead of prices.
What's driving the advance? The FED is
afraid to raise rates. Wall Street must
think that the Clinton-Kaine ticket will give them what they want, but it could
also
live happily with the pro-Business Trump, too. There is also a good chance
that a Trump
Administration would work out a big Infrastructure spending plan with the next
Congress, something the Obama Presidency could not do. This would amount
to
a huge fiscal stimulus to the US Economy. Meanwhile, terrorism
overseas keeps
bringing big Investment sums into the US. Whatever is out
there that will
change all these positives, I don't see it yet.
Charts: Peerless
DJIA Hourly DJIA
DIA
NetIDOSC for DJI-30
SPY QQQ
IWM
DJI-Utilities REITS
A/D Line-6000 Stocks
Crude Oil
SOXL TECL
IBB
Major Indexes and A/D Lines.
Key Tiger
Software ETF Charts
Bullish MAXCPs
Bearish MINCPs
Charts of Key ETFs
Most Bullish Industry Groups:
Based on Power Ranking
(Mornstar - 8/29/2016)
AI/200 IP21 ITRS
(Stk vs DJI
50-days)
----------------------------------------------------------------------------------------------------------------------
MG521 Medical Instruments 190
.224 +.072
Both Up. Flag pattern breakout.
MG522 Medical Appliances/Eq. 175 .185
+.061
Both Up. Running to new yr highs.
MG821 Water Utilities
192 .133 +.105
Professions-bullish. Public-bearish.
MG914 Multimedia Graphics 172
.215 +.056
Both Up. Consolidating.
MG442 Diversified Utilities
178
.322 +.04
Professions-bullish. Public-bearish.
Most Bullish Industry Groups:
Based on 100-Day Pct Change Ranking
100-day
Pct Change
-------------------------------------------------------------
MG136 Silver 124%
MG135 Gold
54%
MG752 Building Materials 42%
MG131 Steel
41%
MG315 Electron Equip.
36%
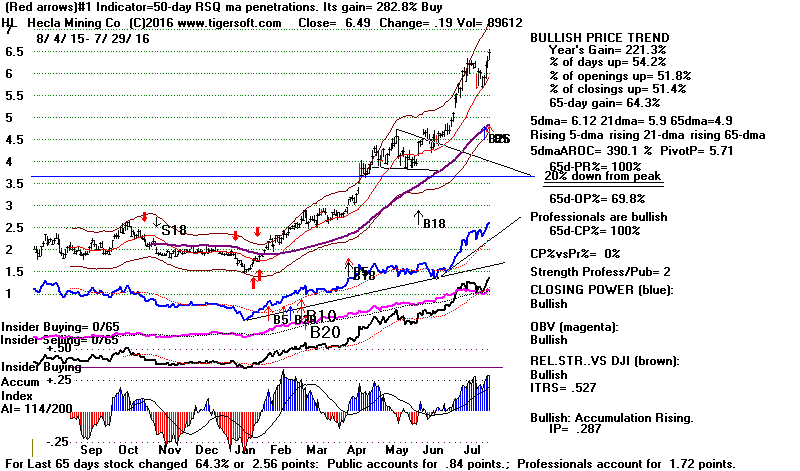
Highest Ranked Mining Stocks: RIC,
AG, CDE
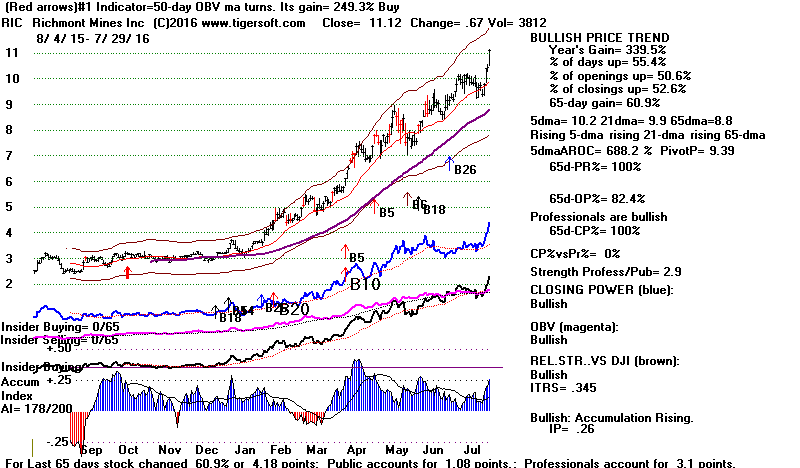
When To Take Profits in Mining Stocks
Mining stocks periodically go wild on the upside. They
are typically responding to the hyperbolic advances of gold or
silver. So, when would we want to sell them?
My 35-year study of HL (Hecla Mining)
suggests we have to
watch for tops in the following ways: Head/Shoulders tops,
Big Red Volume Down-Days, Closing Power failures-to-confirm
warnings/ IP21 NNCs...
Waiting for the
stock's 65-dma to be penetrated or to turn
down is risky. Too often in big runs-up such a strategy means selling 25%
or
more down from the highest closing price. It, therefore, seems to me
that it is much better to watch for the tell-tale signs of a top in progress
and sell when they appear.
Going back over a lot of a stock's history helps a lot, I think.
We could do
a study like this this one
on HL for you as a special
project. If interested, email me.
william_schmidt@hotmail.com
=================================================================================
7/28/2016 Our Peerless Buys
(Buy B3,
Buy B19,
Buy B20 and
Buy-B14)
coupled with the classic, flat topped breakouts by the
DJI,
SP-500
and TECL suggest much high prices.
The earnings for tech leaders
AMZN and GOOG came out today. They were very good. This
should cause the NASDAQ to challenge
its all-time high.
NY Times articles: (Click on titles for article.)
--> Google Silences Doubters With Blockbuster Quarter.
-->
Amazon's Profits Grow More Than 800 Percent,
Lifted by Cloud Services.
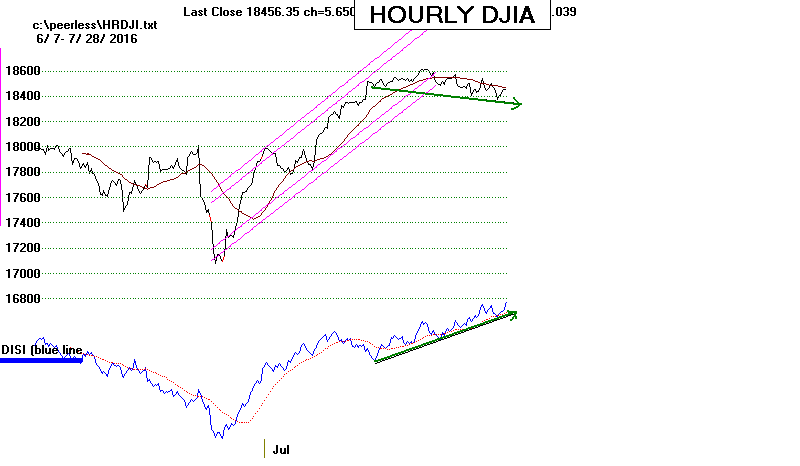
The DJI has been gradually weakening by small amounts for a
week. This may be a warning that it will have to test 18000-18300
again. But the Hourly DISI/OBV is more bullish than that. It
is uptrending. I doubt if there will be enough selling pressure to
drive the DJI down.
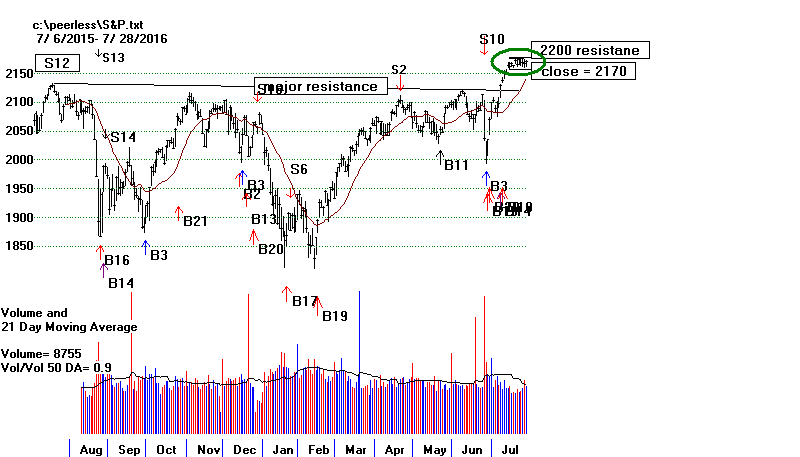
Meanwhile, we are watching to see which way the SP-500 springs
from its very narrow "high diving board pattern". There are not many of
price
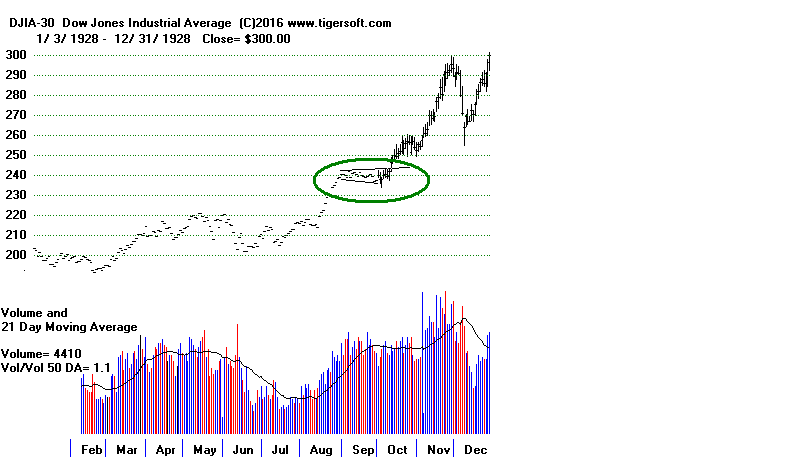
patterns that are so perfectly formed. The one that seems closest
in resemblance occurred with the DJI is 1928, just before it went
wildly up for another 10 months.
The Dow Jones Journal switched from providing only closings
to highs, lows and closes in 1928. The DJI's pattern below shows
that the "diving board" could last as long as 5 weeks.
The volatility for the DJI has been particularly low for the last
two weeks. I have checked back to 1930 to see what happened
in the past when volatility was this low. See
study. It's
true that
this is somewhat more likely to bring declines to the lower band
than rallies, but this bearish tendency disappears in Presidential Election
years.
Charts: Peerless
DJIA Hourly DJIA
DIA
NetIDOSC for DJI-30
SPY QQQ
IWM
DJI-Utilities REITS
A/D Line-6000 Stocks
Crude Oil
SOXL TECL
IBB
NEW -
Morningstar: Railroads
Internet Software
Housing Construction
Major Indexes and A/D Lines.
Key Tiger
Software ETF Charts
Bullish MAXCPs
Bearish MINCPs
Charts of Key ETFs
Presidential Election Year
Stock Markets Are Different!
I believe the stock market will be shaped by the FED and the
Presidential Election Year's politics. The FED does not want Trump to
win. So, there will be no rate hike until after November. They will
do whatever it takes to hold the market up.
The financial "powers-that-be", as illustrated by the New York Times
are clearly in the pro-Clinton, pro-Bank, pro-Corporate Democrat camp.
They are pretty smart. They believe that enough Democrats will vote for
her
to beat Trump in November. But just to be sure, I think that their
campaign
will turn to "infrastructure spending" because they want blue collar voters
in the "rust belt". Trump will up their ante, I believe. That
could mean
a very strong fiscal stimulus, as after 1954.
====================================================================================
7/27/2016 Our Peerless Buys
(Buy B3,
Buy B19,
Buy B20 and
Buy-B14)
coupled with the classic, flat topped breakouts by the
DJI,
SP-500
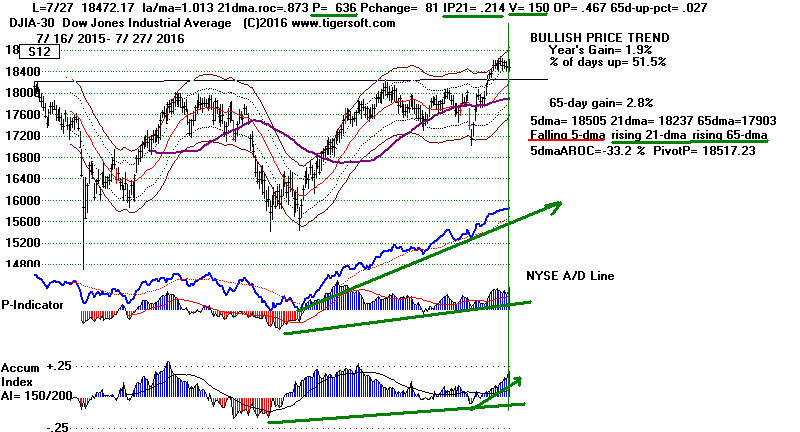
and TECL suggest much high prices. The
DJI's internals are
positive and improving. It looks like we are in a holding period,
but I expect an upside breakout from it.


The FED kept rates the same today, as expected. This encouraged
buyers of GOLDS and
SILVERS.
UTILITIES weakened a little more
today,
but are still in an uptrend.
REIT and
Bonds enthusiasts saw no reason
to lock in their sizable profits. These three groups have
constituted the
leadership for many months. Any change here would probably require
new leadership to come forward. Semi-conductor (SOXL)
and Tech (TECL)
stocks are vying to become the new leadership. Better than expected
earnings seems to be the reason. Last week it was MSFT that lifted the
market and the DJI-30. Tuesday, it was AAPL's turn. Tomorrow we get
to see if FB and GOOG can continue the tech rally. TECL is now running
in all-time high territory. SOXL closed at 38.74, about 3 3/4 points
away from
making an all-time high. Crude Oil
weakness is holding the DJI back at
this time.
Tomorrow evening the political conventions will end. Next Friday, we get
see if June's big jump in Jobs was the start of an economic upswing.
On August 8th, Food Store workers vote on whether to go on strike
out here in California. Other than that, August is usually a quiet month.
Someone on Yahoo noted that Augusts have had a poor track record for the
last 10 years. The data below show the author exaggerated August's
recent bearishness. It's dismaying to have Yahoo spread inaccurate
information. I would simply trust Peerless at this stage to tell
us when to sell. In the years when there was a decline, Peerless always
came through for us.
Charts: Peerless
DJIA Hourly DJIA
DIA
NetIDOSC for DJI-30
SPY QQQ
IWM
DJI-Utilities
DJI-Rails
A/D Line-6000 Stocks
Crude Oil
SOXL TECL
Major Indexes and A/D Lines.
Key Tiger
Software ETF Charts
Bullish MAXCPs
Bearish MINCPs
Charts of Key ETFs
How The DJI Behaved in
Augusts and Septembers since 2006
July 31 August 31 September 30
2006 11186
11381
11679
2007 13212
13358
13896
2008 11378
11544
10851
2009 9172
9496
9712
2010 10466
10014
10788
2011 12144
11614
10913
2012 13009
13091
13437
2013 15500
14810
15130
2014 16563
17098
17043
2015 17690
16528
16284
===================================================================================
7/26/2016
Our Peerless Buys
(Buy B3,
Buy B19,
Buy B20 and
Buy-B14)
coupled with the classic, flat topped breakouts by the
DJI,
SP-500
and TECL suggest much high prices.
The uptrend in Utilities, Reits and
Bonds is intact. It is not expected
that the FED will raise rates for a while. If I am correct, the FED will
not raise rates until after the November Election, for fear of
precipitating another 2008 Crash.
I also believe that there is a good chance that both Trump and
Clinton will start talking about infrastructure spending and jobs
to try to get votes in the "rust belt". This would be a very bullish
development for the market. It would be reminiscent of 1954-1956
when the Federal Inter-State Highway Program was launched.
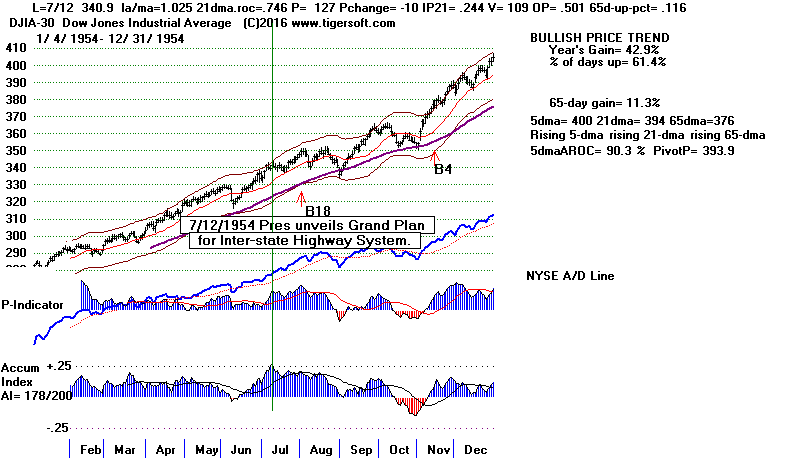
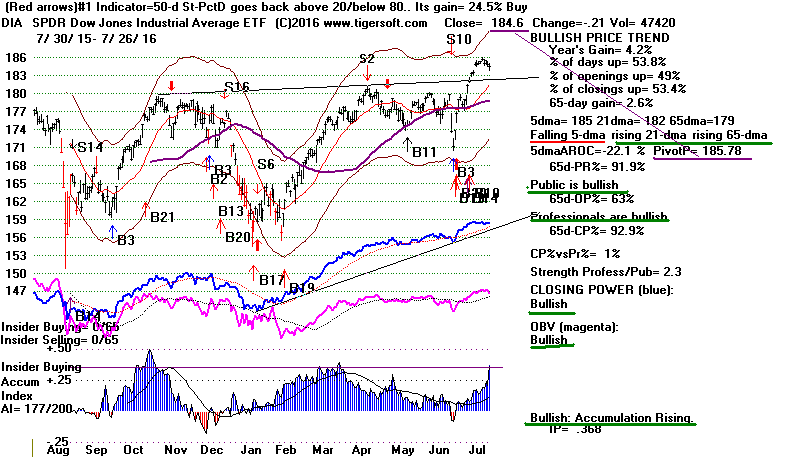
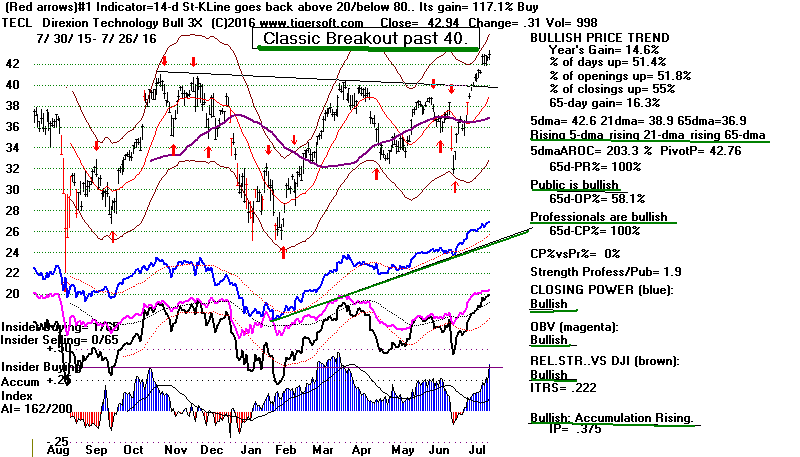
We do need to soon
see the NASDAQ,
QQQ, IWM (Russell-2015)
and
SOXL
make their own breakouts and make all-time highs. This
will keep the breadth very positive and prevent Sell signals.
It is acceptable that they lag the DJI for as much as six weeks, but
a failure to breakout in that time period will start to look technically
"problematic".
Charts: Peerless
DJIA Hourly DJIA
DIA
NetIDOSC for DJI-30
SPY QQQ
IWM
DJI-Utilities
DJI-Rails
A/D Line-6000 Stocks
Crude Oil
SOXL TECL
Major Indexes and A/D Lines.
Key Tiger
Software ETF Charts
Bullish MAXCPs
Bearish MINCPs
Charts of Key ETFs
AAPL's sales and earnings were better than expected. At this
point AAPL is up 6 in pre-opening trading. This will lift the
DJI up about 36 at the opening. Semi-conductors were very
strong today. These developments should boost our TECL.
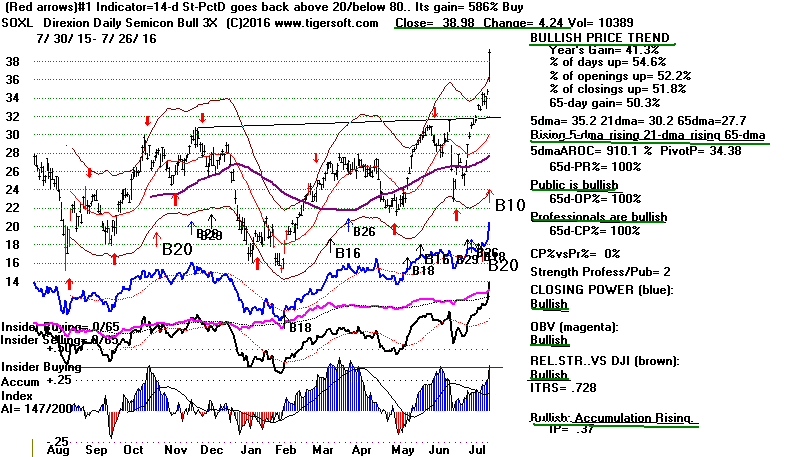
Major ETFS/INDEXES That Lag DJIA
Current All-time
Price high
QQQ 113.79 +.13
120.5 (March 24, 2000).
NASDAQ 5110.05 +12.42
5240 (July 20, 2015)
IWM 120.8 +.58
125.86 (July 20, 2015)
SOXL 38.98 +4.24
42.11 (June 1, 2015)
FAS 28.37 +.14
35.72 (July 22, 2015)
IBB 280.28 -1.98
400.79 (July 20, 2015)
It used to be that folks worried about any DJI new high that was not
confirmed by the Transports, but that dates back to the Industrial
days of America. They peaked at some point in the 1960s.
I would not yet be concerned about the failure of
the NASDAQ to make a new high. NYSE breadth is
what we pay most attention to and the A/D Line is still in
a very strong uptrend. Moreover, NASDAQ failures to
confirm can be quite misleading, as in early 1987 when the
DJI broke out above 2000 and advanced for more than 7
months afterwards, even though the NASDAQ did not confirm
the advance until mid-February. In any case,
significant non-confirmations
by the NASDAQ have otherwise always brought normal Peerless
automatic Sells.
See the charts were the NASDAQ lagged DJI
new highs since 1986.
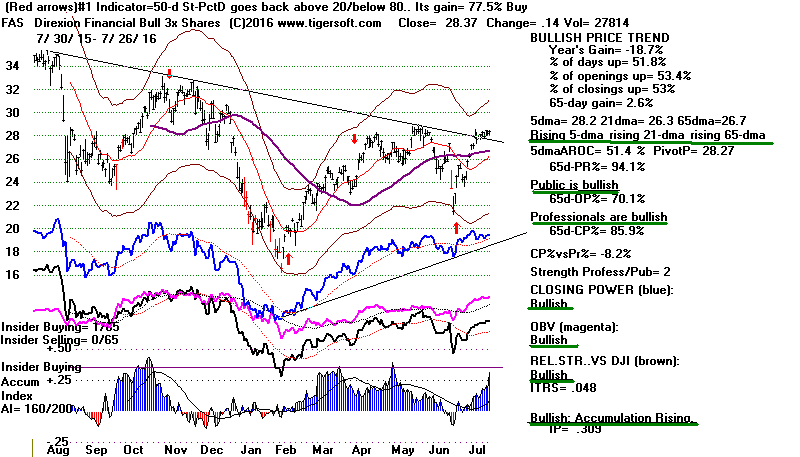
I think we are better off watching Financials and FAS (the 3x Banks'
ETF. It is still lagging the DJI by a wide margin. It should
recover.
But FAS should be watched daily. A head/shoulders top in it, a Closing
Power uptrend-break and big volume (S14s) on down-days would
be a important warnings for us. We know from the 2007-2009 experience,
that
it is vital for the stock market that the Big Banks and FAS (their ETF)
not top out and start dropping on heavy volume.
.
===================================================================================
7/25/2016 I think we have to stick with our Peerless Buys
(Buy B3,
Buy B19,
Buy B20 and
Buy-B14).
Until Peerless gives us a Sell, lets give the market more chance to advance!
Charts: Peerless
DJIA Hourly DJIA
DIA
SPY QQQ
IWM
DJI-Utilities
DJI-Rails
A/D Line-6000 Stocks
Crude Oil
SOXL TECL
Major Indexes and A/D Lines.
Key Tiger
Software ETF Charts
Bullish MAXCPs
Bearish MINCPs
Charts of Key ETFs
A minor retreat this week - probably because of new polls showing wild-man Trump
is ahead of banker-friendly Hillary - could be shaping up for the DJI. The
Brexit vote
came as a shock to PM David Cameron. Hillary may be in for a shock, too.
The
disappearance of good-paying middle class jobs is every bit as evident here as
it
has been in England.
The stock market is adjusting to these considerations. The DJI sometimes
does so
first. Thus, we see a very small head/shoulders pattern that may play out
on the daily DJI
and DIA. The 5-day ma for DJI and DIA have pivoted down. Earnings
uncertainties this
week for AAPL, AMZN, FB and GOOG may explain this weakness.
The recent declines in Gold,
Silver and
Crude Oil could be signs that world-wide Deflationary
forces are reasserting themselves. YINN
(China) has just given a red Sell at its well-tested
resistance. This hurts overseas markets, but it is not affecting the
continuing bullishness
of Bonds, REITS and Utilities. If anything, it just increases
the interest in American
dividend-paying stocks and debt instruments and reduces pressure on the FED to
raise
interest rates.
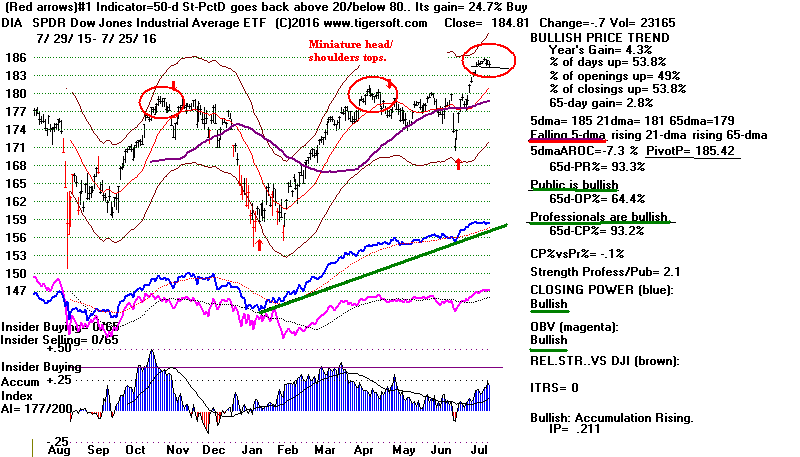
A DJI close decisively below 18400 will probably bring a few days more decline.
There should be very good support for the DJI near 18000, if the declines
worsens. Recent breadth (NYSE A/D
Line for the last week) has deteriorated some. But
a decline for a few days would most likely just set up another rally, judging
from
the 5-day Stochastic.
Seasonality is bullish at this time for Presidential Election Years. Since
1968, the DJI
has risen 70.8% of the time over the next five trading days, 67.7% over
the next
ten trading days and 79.2% over the next month in Presidential Election years.
The earnings' reports this week may be a bullish surprise. Keep in mind
that
MDY (Mid Caps), SPY (SP-500) and IWM (Russell-2000) do not show minor tops.
Instead, we see bullish-looking flag patterns and still rising 5-day ma.
Upside breakouts
most often follow patterns like they show.
7/25 Resistance
5-dma pivot-points
Close
that would turn down their
rising 5-dma.
--------------------------------------------------------------------
MDY 281.47
283
280.72
IWM 120.22
120.83 119.30
SPY
216.65 217.41
216.91
===================================================================================
7/22/2016 Stick with our Peerless Buys
(Buy B3,
Buy B19,
Buy B20 and
Buy-B14).
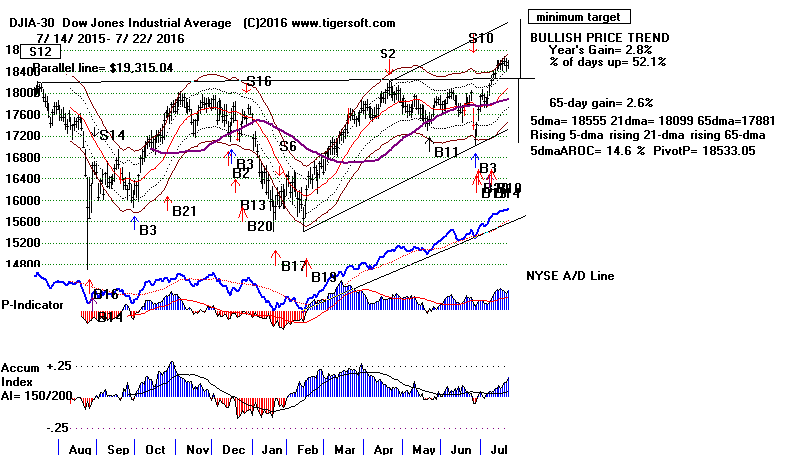
The weekly charts of DIA,
SP-500 and TECL look superb. They show
near-perfect flat-topped breakouts and high Accumulation.
The short-term is still positive. The NYSE A/D Line is rising. The
keys
ETFs' CLosing Powers and 5-day ma are all rising. In addition, the DJI's
NET IDOSC is still rising.
This week we get to see if the biggest tech stocks, AAPL, AMZN, FB and
GOOG, can report good enough earnings to allow the
NASDAQ to join
the DJI and SP-500 in their breakouts into all-time territory.
There still seems to be ample upside potential for the market. My guess
is that the market will not top out until November, when either partisan
Democrats or partisan Republicans celebrate their victory and chase up
up stocks to a crescendo and climax. I still must recommend buying
water utilities, Chevron (CVX) - the highest AI/200 stock in the DJIA-30
by a wide margin and TECL (the 3x leveraged ETF for high techs).
Charts: Peerless
DJIA Hourly DJIA
DIA
SPY QQQ
IWM
DJI-Utilities
DJI-Rails
A/D Line-6000 Stocks
Crude Oil
SOXL TECL
Major Indexes and A/D Lines.
Key Tiger
Software ETF Charts
Bullish MAXCPs
Bearish MINCPs
Charts of Key ETFs

Will The Democrats Turn on Each Other?
Hillary's pick for her running mate, Tim Kaine, should
please Wall Street very much.
He is a free-Trader who has always supported NAFTA, etc. He has called his
opponents in these matters, "losers". And last week he warned regulators
not
to pick on the Big Banks when it came to their use of leverage for "risk
management"
purposes and to give much more freedom to regional banks in their handling of
consumer debt and credit cards. He joins Hillary in not wishing to return
to the days
of Glass Steagall when big banks were not allowed to be brokerages or insurance
companies.
The problem with her pick is that it may alienate so many Sanders' progressives
that Trump could win the key "rust belt" states that the Democrats need to
win. This week's Democratic Convention should let us
get a better understanding
if Progressive Democrats are sufficiently upset
with Hillary to refuse to support her in November.
See
Progressives warn Hillary Clinton: Don't pick Tim Kaine for vice president
====================================================================================
7/21/2016 Stick with our Peerless Buys
(Buy B3,
Buy B19,
Buy B20 and
Buy-B14).
We cannot easily get a Sell signal here. The next Peerless Sell
will probably be based on the V-Indicator turning negative with
the DJI still 2.5% above its 21-dma or the IP21 (Accum. Index)
falling back below its 21-day ma. Neither condition appears to be
imminent.
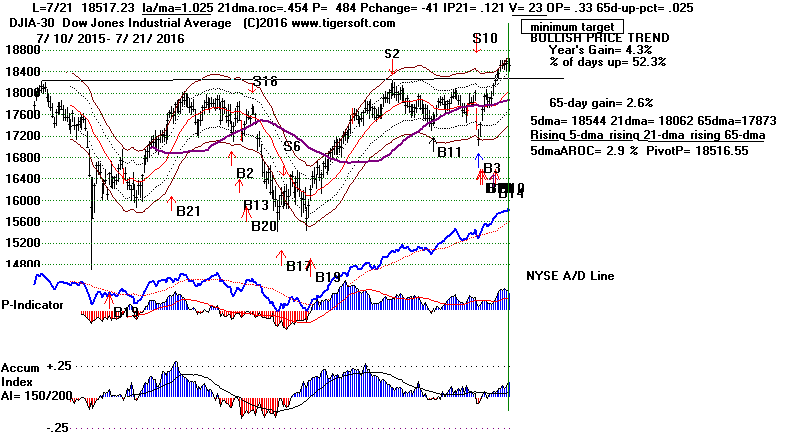

Summer Doldrums
I would not be surprised by a small retreat. After 9 straight up-days,
the DJ finally pulled back a little today. I would not rule out some
more hesitation. Since 1965, the DJI has only been able to rally 45%
of the time over the 5 trading days following July 21st. Tomorrow
may be quiet, simply because a lot of traders like to take Friday
off in the Summer.
It's true the NASDAQ has not made a new high in here and today
Intel took a hit, thereby bruising SOXL and
TECL. So, by in large,
this still remains a bull market for Bonds, Utilities and REITS...
As long as their uptrends remain intact,
I would think that general
market is safe,
too. Only if the Fed changes
its collective "dovishness"
will there be a change
to this picture. What we see
now is probably
what will
get for another four to six weeks. September
tends to bring
trouble for the market.
QuickSilver - All Stocks
For those who want quick trades, download the FASTUP.exe from
the Tiger Data page. Change to c:\fastup.
Run the Power Ranker.
Then look at the most "Bullish" from this group. Require them
to show both Rising Opening and Closing Power, an IP21 greater
than +.15, rising up-day volume (or a decline to and reversal from
the 5-dma) and an AROC greater than 500% for the annualized
rate of change for the 5-day ma. This is what
we came up with tonight.
Still The Best Three Games in Town... for Now:
Bonds, Utilities and REITs.
As long as Banks can borrow and borrow for 1% from the Fed
and get 2.5% to 5% on their money from many of the premier
dividend plays, what will cause them to stop supporting the
current market leadership. (This weekend we will run the Tiger
Power Ranker against these dividend pays and report what we
find.)
Tiger Index of Bonds
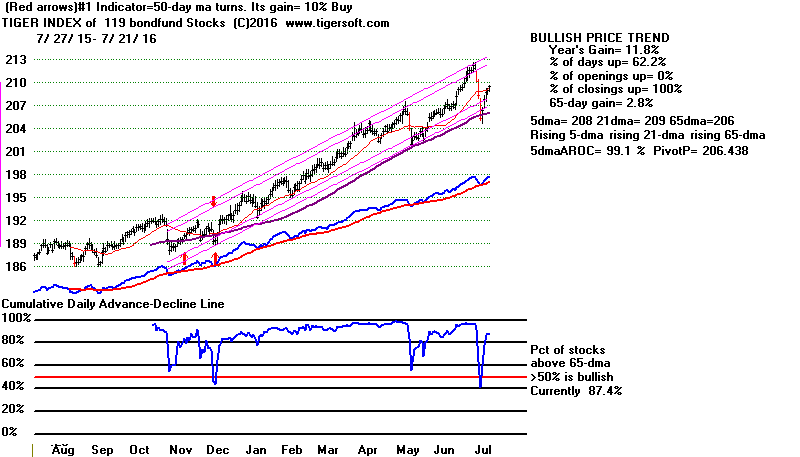
|
Dow Jones Utilites Index
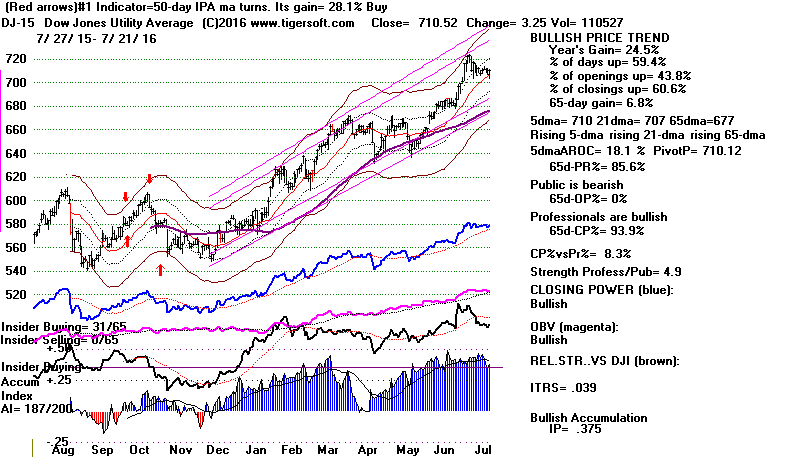 |
Morningstar Reits
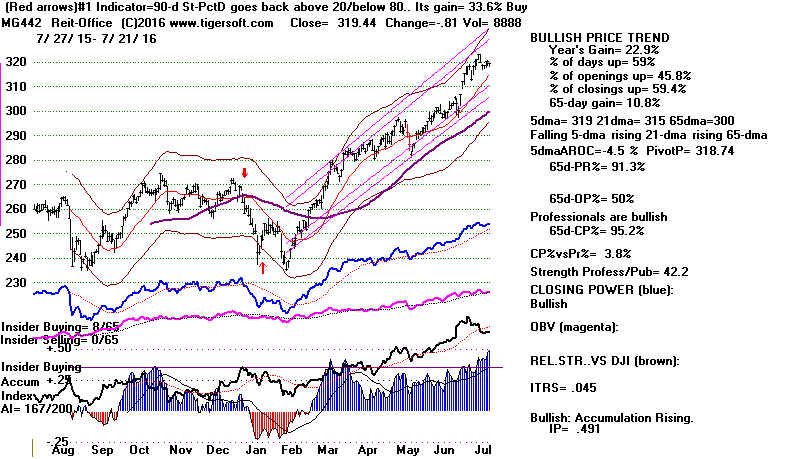 |
"BOTH UP" Is Good!
Both the Opening and Closing Power are rising for
DIA, SPY,
QQQ,
and IWM. In these circumstances, the
tendency is for them to rise
at most openings and then rise still further by the close. How can
we beat that?
The absence of ugly-looking
Bearish MINCP stocks also prevents
me from suggesting any short sales.
Charts: Peerless
DJIA Hourly DJIA
DIA
SPY QQQ
IWM
DJI-Utilities
DJI-Rails
A/D Line-6000 Stocks
Crude Oil
SOXL TECL
Major Indexes and A/D Lines.
Key Tiger
Software ETF Charts
Bullish MAXCPs
Bearish MINCPs
Charts of Key ETFs
===================================================================================
7/20/2016 Stick with our Peerless Buys
(Buy B3,
Buy B19,
Buy B20 and
Buy-B14).
REITs, Biotechs,
Semi-Conductors and Software companies led
today's
rally. Our TECL breakout advanced
nicely, too.
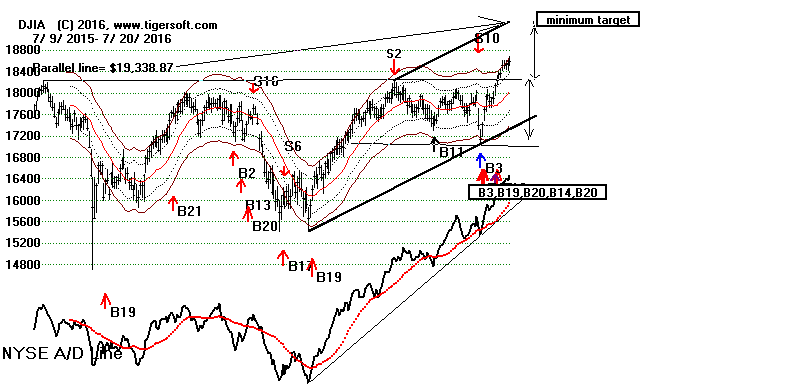
The NYSE A/D Line made another 12-month high. This is bullish.
Most tops occur only after:
1) the market shows a bearish breadth divergence,
2) a head/shoulders top appears in the DJI,
3) the DJI's Accumulation Index (IP21) turns negative with the DJI
more than 2% above the 21-day ma, or
4) the V-Indicator turn negative with the DJI more than 2.5%
over the 21-day ma. None of these conditions is true now. Our market
is still too strong to sell. A review of what brings tops from Peerless
can be
seen here:
http://tigersoft.com/Intro/Peerless/index.htm



Charts: Peerless
DJIA Hourly DJIA
DIA
SPY QQQ
IWM
DJI-Utilities
DJI-Rails
A/D Line-6000 Stocks
Crude Oil
SOXL TECL
Major Indexes and A/D Lines.
Key Tiger
Software ETF Charts
Bullish MAXCPs
Bearish MINCPs
Charts of Key ETFs
New Sector Rankings
Another bullish thing I noted tonight is how broad the advance has been
for the last 16 trading days, since the BREXIT bottom. I have started
to rank the 238 Morningstar sector funds. (This data will
be posted for
Tiger Users tomorrow night. See
Morningstar Sectors Rankings.)
Since the bottom 3 weeks ago, no fewer than 111 of the 238 Morningstar
Sector funds are up more than 10%. 220 are up more than 5%.
The Closing Powers and 5-day ma are bullishly rising for
DIA and SPY.
We have no new red short-term Sells on them. It's true Volume could
be higher, but sellers do not know where to concentrate their selling
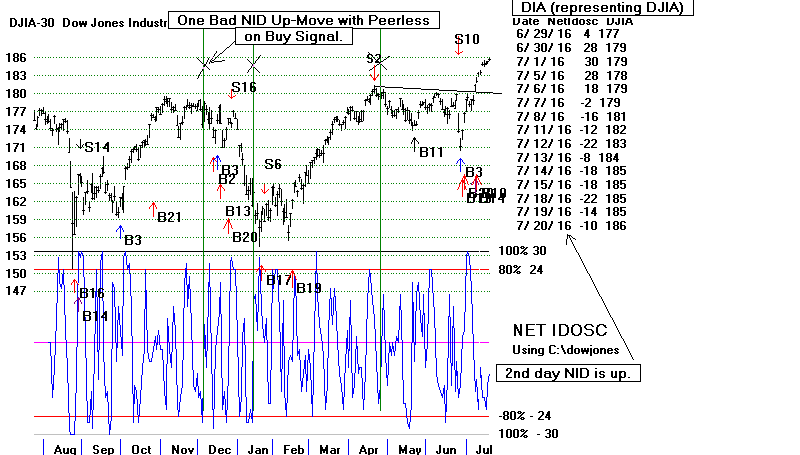
with the DJI in all-time high territory. The NET-IDOSC
for the DJI
rose some more today. This is still bullish.
=====================================================================================
7/19/2016 Our cluster of Peerless Buys
(Buy B3,
Buy B19,
Buy B20 and
Buy-B14)
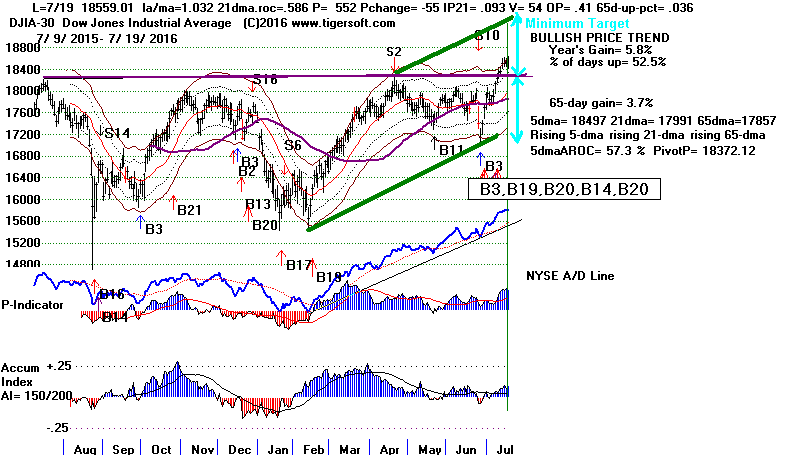
has served us well as the DJI keep rising in the aftermath of the
BREXIT vote. I see no reason to disturb current long
positions.
DJI
 |
DIA
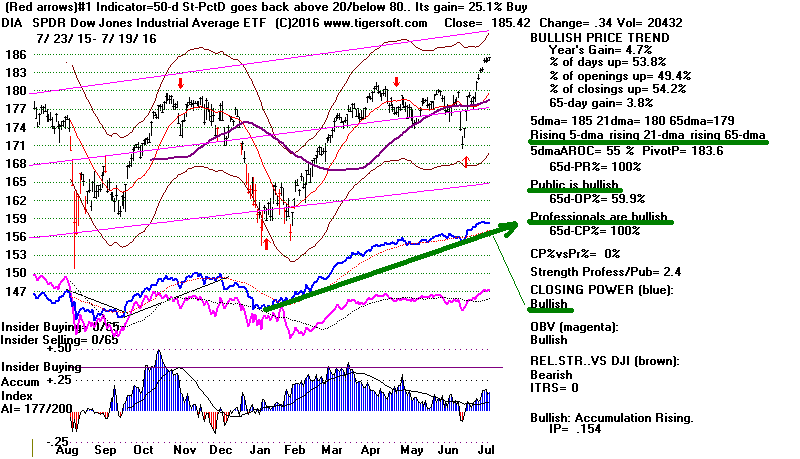 |
I was asked about how we can judge the direction of the market
the next day. There are many elements in this: Peerless signals,
A/D Line trend, Closing Power direction, 5-day ma direction,
Stochastics, Hourly DJI's OBV/DISI trend, Support, Resistance,
Chart Patterns ... and Net IDOSC on the 30-DJI stocks.
Hourly DJIA and Trend of OBV/DISI
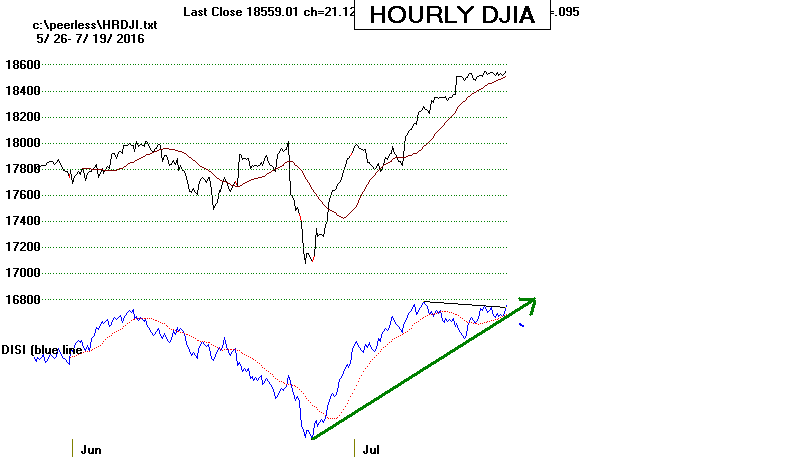
|
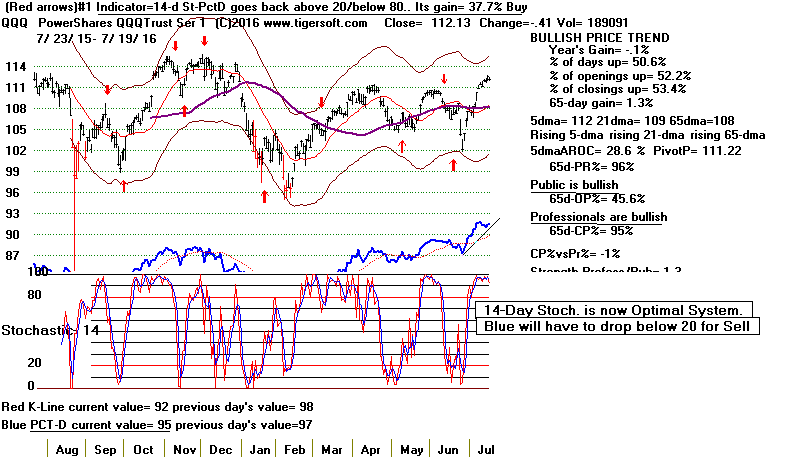
QQQ's Optimal Trading System is now based on 20-day Stochastic Pct-D
Line (Blue)
 |
I'm sure this leaves out many other factors like Seasonality,
Fed pronouncements, Jobs' Report, world events... But this is a
working
list of what I think about each night in writing this Hotline.
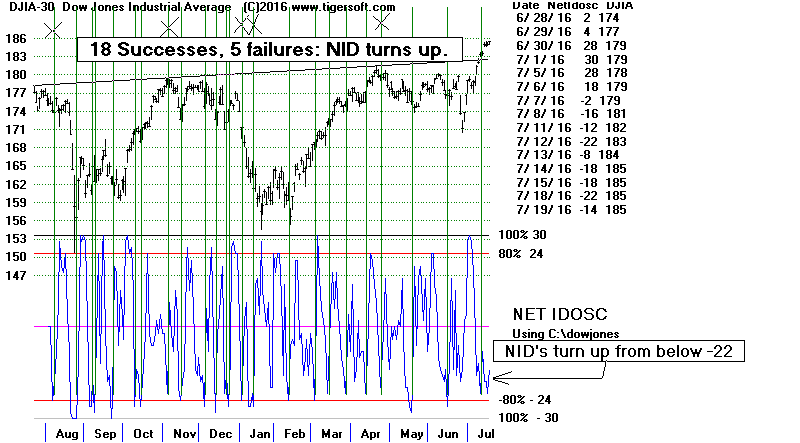
What I want to point out tonight is that our NET IDOSC has turned up
from an oversold-level. In the past year, such turns upward have predicted
a short-term rally in 18 of 23 instances, a success rate of 78%. We do
much better than this, trading only such turns-up when Peerless is on a Buy.
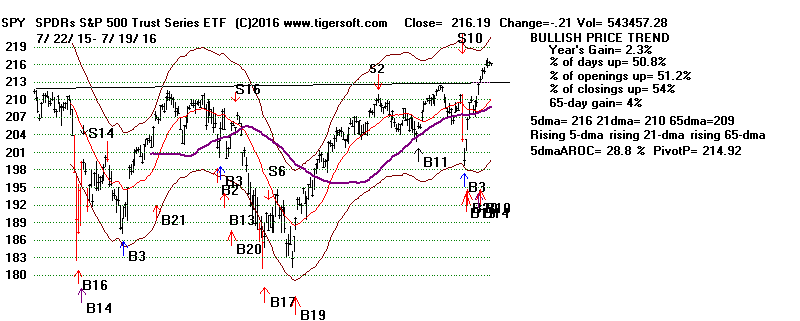
I think it is, therefore, significant that the NET IDOSC on the 30-DJI stocks
and the 500 stocks in the S&P have just today turned up from their
near over-sold conditions. See further below.
Charts: Peerless
DJIA Hourly DJIA
DIA
SPY QQQ
IWM
DJI-Utilities
DJI-Rails
A/D Line-6000 Stocks
Crude Oil
SOXL TECL
Major Indexes and A/D Lines.
Key Tiger
Software ETF Charts
Bullish MAXCPs
Bearish MINCPs
Charts of Key ETFs
TIGER's NET IDOSC
IDOSC was invented by Marc Chaikin. Tiger, in 1986, decided to count the
number of individual DJI stocks with rising and falling IDOSC readings
compared to the day before. The net of these two numbers is the daily
Net IDOSC. It ranges from -30 to +30 for the DJIA-30. Its direction
moving from oversold to overbought, and back is helpful day to day. We
also look for divergences from price, especially after an over-bought or
over-sold reading develops. One could get the data from TC-2000 just
before the close and run the Net IDOSC to get a better sense of what
to expect the next day.
Net IDOSC for DJI-30 (using DIA's chart)
Net IDOSC for SP-500 (Using SP-500 charts)

------------------------------------------------------------------------------------------------------------------------------------------------------
7/18/2016 Our cluster of Peerless Buys
(Buy B3,
Buy B19,
Buy B20 and
Buy-B14)
has served us well as the DJI keep rising in the aftermath of the
BREXIT vote. I see no reason to disturb long
positions. If the
DJI does pullback here, it will
probably only retreat to 18300.
My guess is that even if it does pull back,
SOXL, TECL
and
now IWM will still move up.
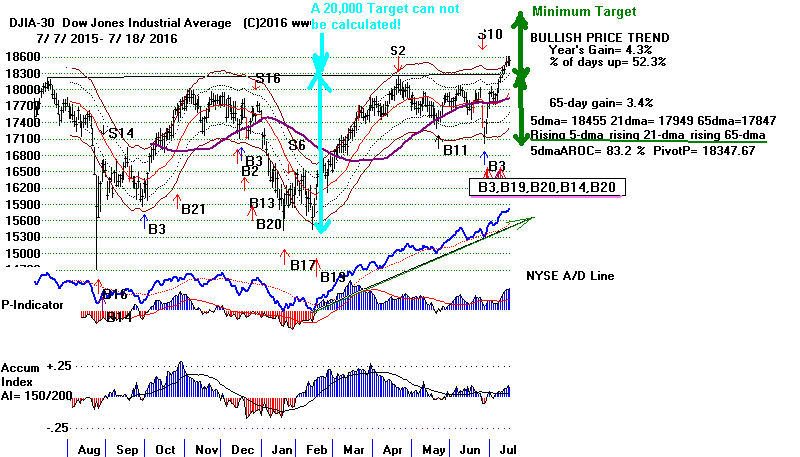
The width of each trading range that the
DJI breaks out of is very important. The recent breakout above 18300 sets
up a minimum upside objective of well over 19,000. Of course, something
unexpected could occur to change this rosy picture, but right now it would,
I think, be a mistake not to be quite bullish.
Charts: Peerless
DJIA Hourly DJIA
DIA
SPY QQQ
IWM
DJI-Utilities
DJI-Rails
A/D Line-6000 Stocks
Crude Oil
SOXL TECL
Major Indexes and A/D Lines.
Key Tiger
Software ETF Charts
Bullish MAXCPs
Bearish MINCPs
Charts of Key ETFs
Price
Patterns To Look for When The Market
Refuses to Sell-Off after a Big Advance.
The DJI and the overall-market are now refusing to sell-off. They
are
hovering near their all-time highs now on reduced volume. It is
usually bullish when leading segments of the market form compact
trading ranges that can be called "pennants" and "flags".
It often happens after a long advance that the market only reaches a
peak
after some of its leading component consolidate, breakout and then make a
steep, red high volume, final advance, This was certainly true of the
leading
tech stocks in 2000. But, as you can see
here there are just many cases,
probably many more, of these pattern that appear in the middle and even
the early stages of a bull market.
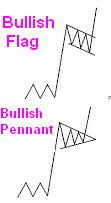
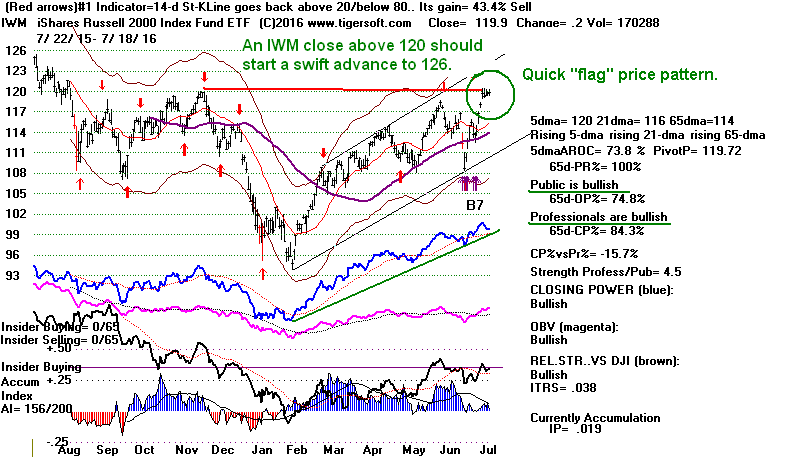
There is a good chance we will soon see breakouts from a number
of short-term consolidation trading patterns. This will add to the
gains expected of SOXL and
TECL, which recently bullishly broke
above flat tops. IWM (the ETF representing
the Russell-2000) now shows
a beautiful little continuation "flag" pattern. A close by it above
126 should make it jump to 127 and then 132. The trading concept
here is that the "flag flies at half mast" and the length of the
most recent quick advance will be repeated on the breakout.
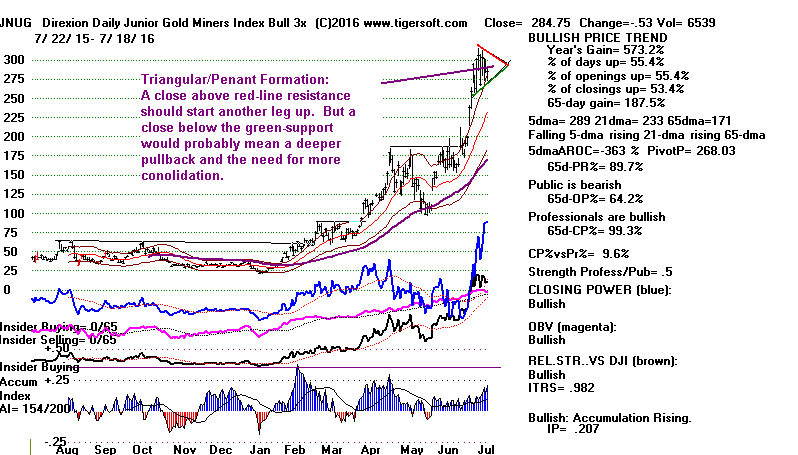
NUGT (the wild-swinging 3x junior gold stock ETF)
shows a more
down-sloping flag.
------------------------------------------------------------------------------------------------------------------------------------------------------
7/15/2016 Our cluster of Peerless Buys
(Buy B3,
Buy B19,
Buy B20 and
Buy-B14)
has served us well as the DJI keep rising in the aftermath of the
BREXIT vote. I see no reason to disturb long
positions. We do want to
keep an eye on short-term rates. As long as they stay in their trading
range, let's give the DJI and
SPY every chance to rally further. Their
breakouts on our weekly Tiger charts which emphasize weekly Tiger Accumulation
really could not look much more bullish. TECL has achieved a similarly
bullish breakout past 40. Military stocks benefit from the fact that
both Clinton and Trump are 'hawks'. Since a rate hike seems unlikely,
Golds, Utilities and
Water Stocks should start another advance soo,
Charts: Peerless
DJIA Hourly DJIA
DIA
SPY QQQ
IWM
DJI-Utilities
DJI-Rails
A/D Line-6000 Stocks
Crude Oil
SOXL TECL
Major Indexes and A/D Lines.
Key Tiger
Software ETF Charts
Bullish MAXCPs
Bearish MINCPs
Charts of Key ETFs
In Presidential Election Years, seasonality is quite bullish after July 17th.
Since 1968 we see the following patterns.
Presidential Election Years since 1968:
DJI Avg. Probability
Gain of a DJI Advance
-------------------------------------------------------------------------------
5 trading days after 7/17
1%
70.8%
10 trading days after 7/17 1%
66.7%
21 trading days after 7/17 1.9%
79.2%
(In the
Presidential Election Years between 1932 and 1964, the
DJI rose 5 times and fell 4. The biggest gain was the huge rise
from 45.5 to 67.1 on August 9, 1932. However, the 4 pre-1968
Presidential Election Year declines were uniformly 3%-4% in 1944,
1948, 1960 and 1964.)
If this were not a Presidential Election Year, I would much more
concerned.
Non-Presidential Election Years since 1965:
DJI Avg. Probability
Gain of a DJI Advance
-------------------------------------------------------------------------------
5 trading days after 7/17 -0.8%
36.7%
10 trading days after 7/17
-0.3%
51.8%
21 trading days after 7/17 -0.5%
45.7%
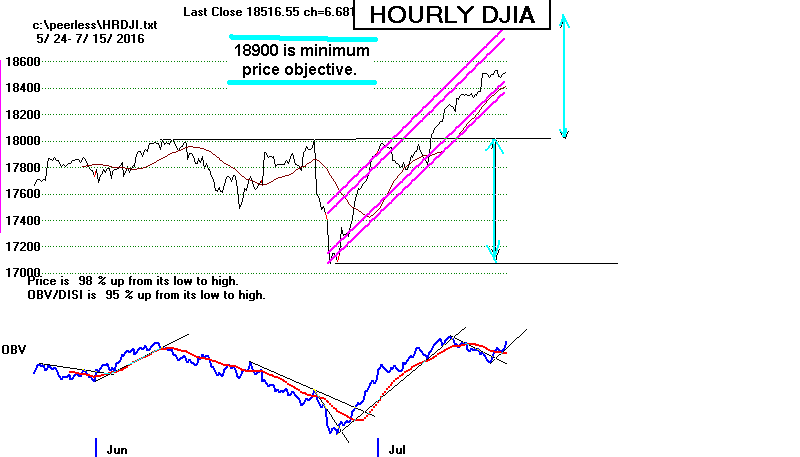
No Sell from Hourly DJIA
Just before last August's big sell-off and before the sell-offs
of January and the BREXIT, the Hourly DJI's DISI/OBV was
making new 2 month lows far ahead of the DJI itself. This
is not true now.
------------------------------------------------------------------------------------------------------------------------------------------------------
7/14/2016 The cluster of
Peerless Buys
(Buy B3,
Buy B19,
Buy B20 and
Buy-B14)
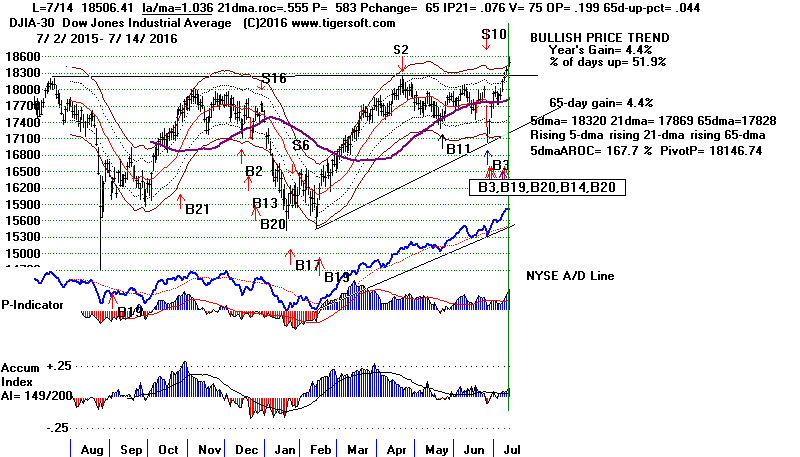
have now taken the DJI up to its 3.6% band. Simply using
bands around a 21-day ma, we are now as "over-bought" as we
"over-sold" just after the BREXIT vote. But the Peerless
Buy signals have created a DJI breakout to an all-time high
above a series of tops at 18000 going back more than a year.
Some of you may remember how bullish it was when we had similar
breakouts above 1000-1050 in late 1982, above 2000 in January 1987,
above 3000-3100 in December 1991. above 4000 in March 2005,
above 5000 in November 1996 and 6000 in October 1996. The DJI's
surpassing a round number like 18000 is, I think, similarly bullish.
Certainly, with the NYSE A/D Line and Closing Powers for
DIA
and SPY in uptrends, I think we have to
trust the active Peerless Buys
now.
Charts: Peerless
DJIA Hourly DJIA
DIA
SPY QQQ
IWM
DJI-Utilities
DJI-Rails
A/D Line-6000 Stocks
Crude Oil
SOXL TECL
Major Indexes and A/D Lines.
Key Tiger
Software ETF Charts
Bullish MAXCPs
Bearish MINCPs
Charts of Key ETFs
That does not mean there might not be a few down days. But I
think the trend for quality stocks and major market ETFs is clearly
up and we should not argue with it.
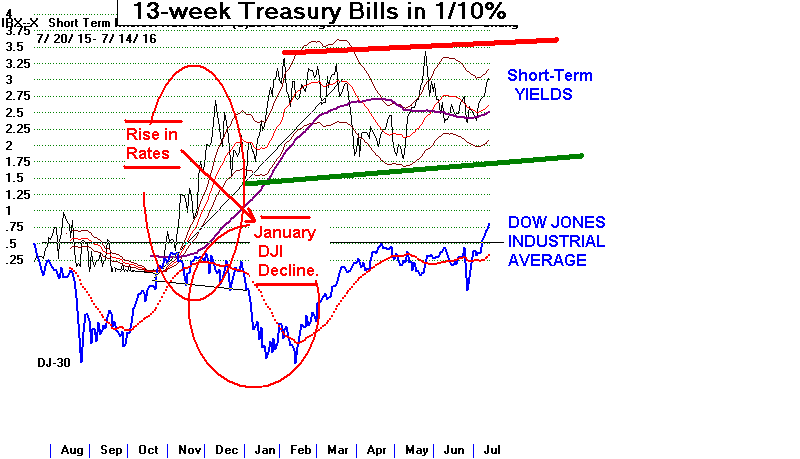
The same cannot be said for bonds.
They are falling back. So far,
I see no sign that short-term Treasury yields are going to make
new highs. Utilities and
Reits have not sold off, as one might expect
if the FED were about to raise rates. Rather, I think the decline
in Municipal Bonds for the last
week owes to a realization by wealthy
bond holders that they can make more money in stocks. It may
also grow out of some fears that the Republican Convention next week
will throw a number of sharp criticisms at the FED's policy of low
interest rates.
Interest rates will, of course, some day go up. But
a lot of people
have prematurely called for this to happen and based their assessments
on the periodic plunges in the Municipal Bond market.
My view remains that the FED will most likely not dare raise rates
until after the Presidential Election in November. In any case,
I do not think we have to worry about this until short-term rates
make new 12-month highs.
 ,
,
====================================================================================
7/13/2016 The rare cluster
of Peerless Buys
Buy B3,
Buy B19,
Buy B20 and
Buy-B14)
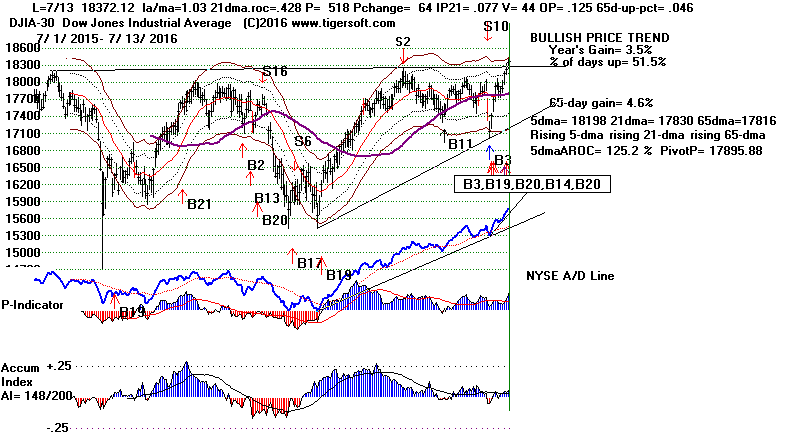
have propelled the DJI up to its 3% band. Will this bring a
reversal back down? I don't think so.
True, there are lots of such reversals in July. And true, there were
slightly more stocks down than up as profit-taking hit Bonds and some
dividend stocks. But that will turn out to be a healthy shift into
more speculative technology stocks, if Peerless is right. On the positive
side, too, the V-Indicator has turned even more positive, thereby greatly
reducing the chances of a Sell S9V.
Charts: Peerless
DJIA Hourly DJIA
DIA
SPY QQQ
IWM
DJI-Utilities
DJI-Rails
A/D Line-6000 Stocks
Crude Oil
SOXL TECL
Major Indexes and A/D Lines.
Key Tiger
Software ETF Charts
Bullish MAXCPs
Bearish MINCPs
Charts of Key ETFs
Low volume - a problem? It hasn't been so far
this year. Breadth
is more important. The low volume on the NYSE is being made up by
overseas' buying of US stocks. The causes for this transfer of investment
capital are not about to quickly change. And, in any case, NYSE Volume
may not be high, but Down Volume there is even lower and now falling
rapidly.
A DJI Breakout Is Slowly Emerging,
to the Amazement and Disbelief of Many.
That's partly why the DJIA may reach 20,000 by
Election Time. The present Bears and Skeptics must
be converted into buyers before there can
be a real top.

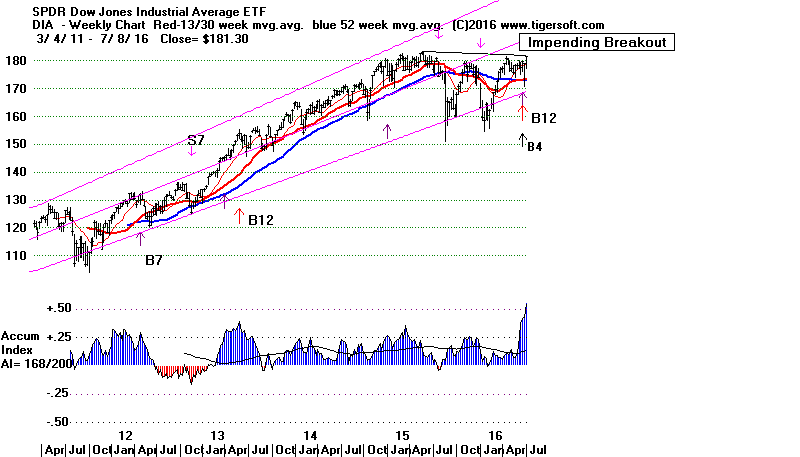
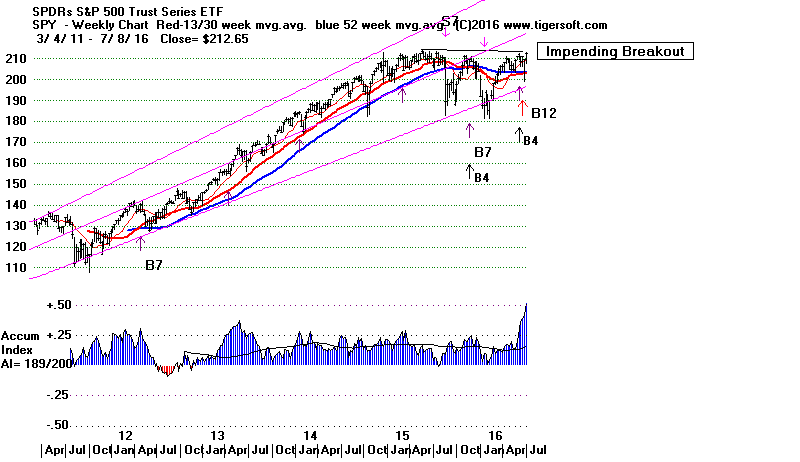
The more the DJI and the SP-500 can advance, the better their
breakouts above flat tops look on their weekly charts.
Weekly DIA - Look at all the Accumulation!
 |
Weekly SPY - Look at all the Accumulation!
 |
Two Bullish Plays
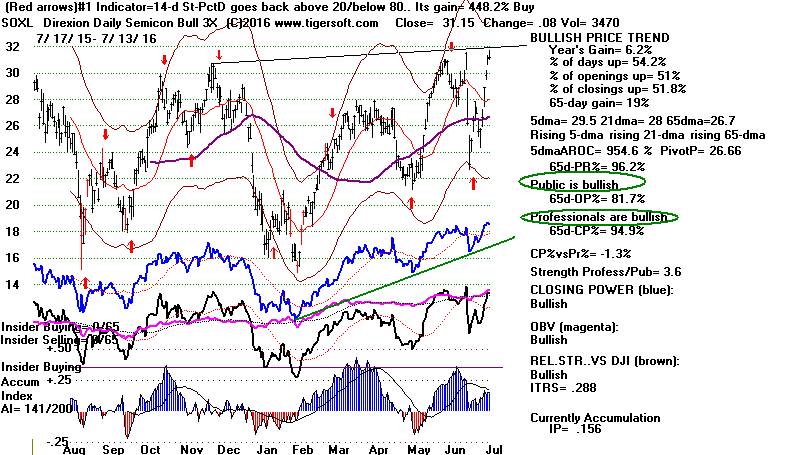
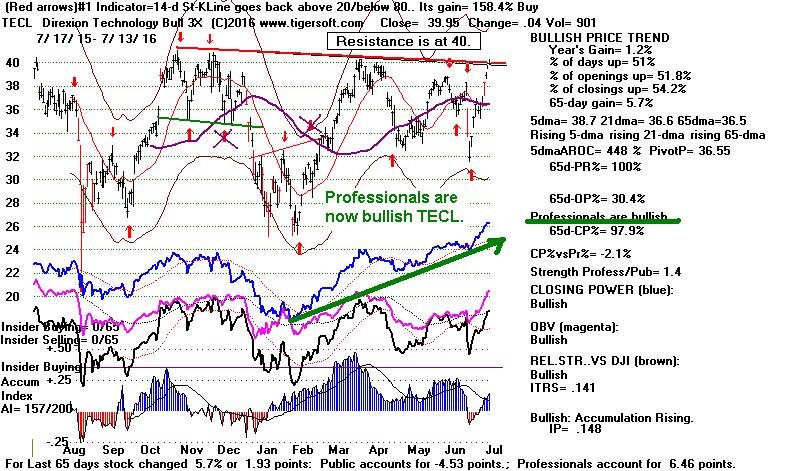
For this market to have "legs" and show it can keep rising,
we probably do need to see technology stocks breakout above their
recent tops. I would like to see SOXL
(3x semi-conductors)
and TECL ( 3x technology) get past their flat resistance levels.
Even if it broke out, SOXL would still have more resistance at
40. See how it now shows the very bullish "BOTHUP" condition
(both Opening and Closing Power are in rising trends) and it has a
flat ("easy to sell") set of tops.
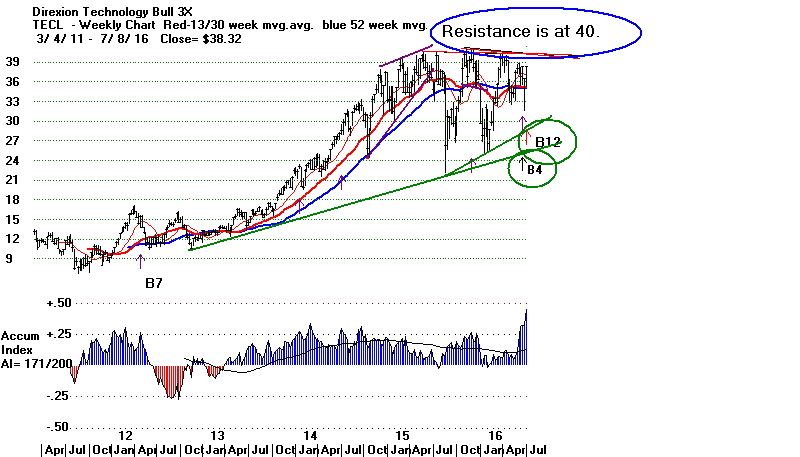
Even more bullish is TECL. It would score an important all-time,
flat top breakout if it can get past 40. Professionals are quite
busy buying it now, judging from the way its Closing Power is running
to new highs ahead of its price action. I would Buy
TECL in anticipation
of a surge past 40. Remember the Tiger adage: "Flat tops beckon
for a breakout in a bull market."
SOXL - daily
 |
TECL - daily
 |
TECL - weekly
 |
====================================================================================
7/12/2016 Let's Watch Volume Closely. The market
is likely to
pause now. But I think we have to remain bullish for the same
reasons mentioned yesterday.
(1) the current cluster of Peerless Signals
(Buy B3,
Buy B19,
Buy B20 and
Buy-B14)
(2) the rising Closing Powers for DIA,
SPY and QQQ,
(3) the steeply rising NYSE A/D Line,
(4) Friday's unusually high ratio of up to down volume
and its power to prevent subsequent S9vs as well as its
unusual reliability. (See again all the cases
of this here since 1965.)
(5) a puzzlement, what would we go short? All the
Bearish MINCPs
now are shorts of general market ETFs.
(6) the Fed dares not raise rates.
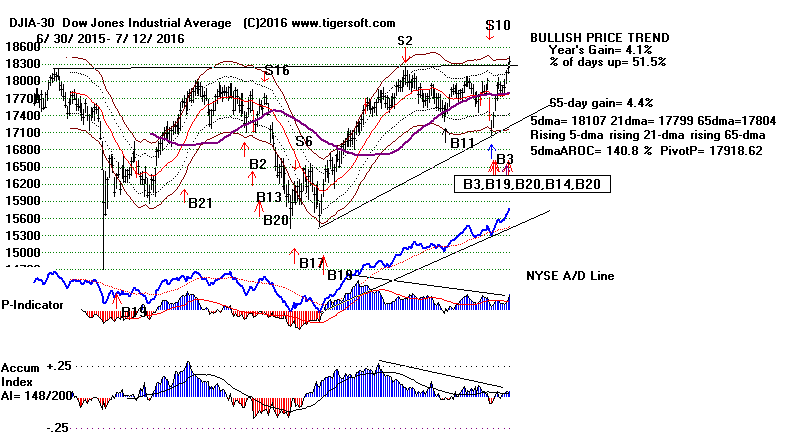
NYSE volume was again low. but the DJI made an all-time high
today. To be successful, such breakouts ordinarily require a surge
in trading volume. Today's volume improved on yesterday's and
the Peerless V-I even jumped into positive territory, but new research
done tonight on yesterday's Buy
B10 (a DJI close above well-tested, flat
resistance) makes me again doubt how much higher the markets can
go right now unless volume rises. Yesterday, the Buy B10 occurred
with a V-Indicator reading of only -30.
There have been 5 earlier cases of Buy B10s with accompanying
negative V-I readings. Only in one instance did the DJI subsequently
gain more than +1.6% when reversed. Twice there were small losses.
What's worse is that the IP21 reading yesterday, when the B10 occurred,
was only +.039. This is quite a bit lower than in any of these 5 cases.
Just by itself, I would say that this argues for a pullback. But the six
bullish considerations mentioned above are weightier. In addition, the
fact that the DJI is now at an all-time high is also an important consideration.
When prices start running in all-time high territory, sell orders are not
usually bunched at key price-levels. In this environment, it's difficult
to know where to see. So, prices usually keep rising more easily.
We have not yet escaped the gravity of 18000, but a few more good
days would accomplish that.
Let's just watch and see what happens tomorrow. Utilities, bonds and
golds fell to profit-taking while Chinese, foreign and oil/gas stocks
came on strong.

Charts: Peerless
DJIA Hourly DJIA
DIA
SPY QQQ
IWM
DJI-Utilities
DJI-Rails
A/D Line-6000 Stocks
Crude Oil
SOXL TECL
Major Indexes and A/D Lines.
Key Tiger
Software ETF Charts
Bullish MAXCPs
No stock Bearish MINCPs
Charts of Key ETFs
Buy B10s with negative V-I Readings
should not be considered Buy B10s.
That is the conclusion the new
research points to.
There were 5 earlier cases where Buy B10 showed a V-I that
was less than 0. None of these had nearly as low an IP21 level, as in
our present case, a +.039.
Yesterday's Buy B10
7/11/2016 VI=-30 (negative)
IP21 = +.039 (unusually low)
Earlier B10 Cases where V-I was negative
V-I Gain
IP21
----------------------------------------
3/16/1950 -22
+.061 +.203
6/11/1957 -216 +.015
+.063
3/4/2005 -15
-.003 +.093
3/14/2012 -24
-.005 +.069
9/18/2014 -28
+.011 +.103
----------------------------------------
Avg. = +.016
July Buy B10s
Gain
19640706 B10 + .112
20070712 B10 +
.006
---------------------------------------
Avg = +.059 (just one week before major S9 at market top.)
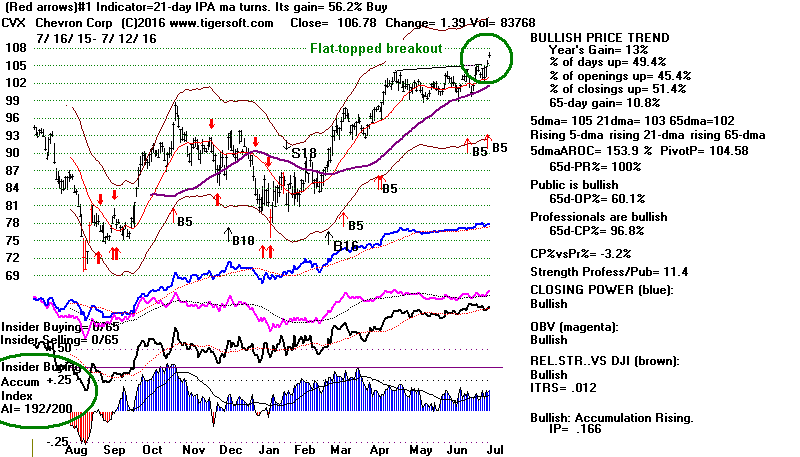
CXV (Chevron) Is Our New "Tahiti" Stock in the
DJI.
====================================================================================
7/11/2016 NYSE
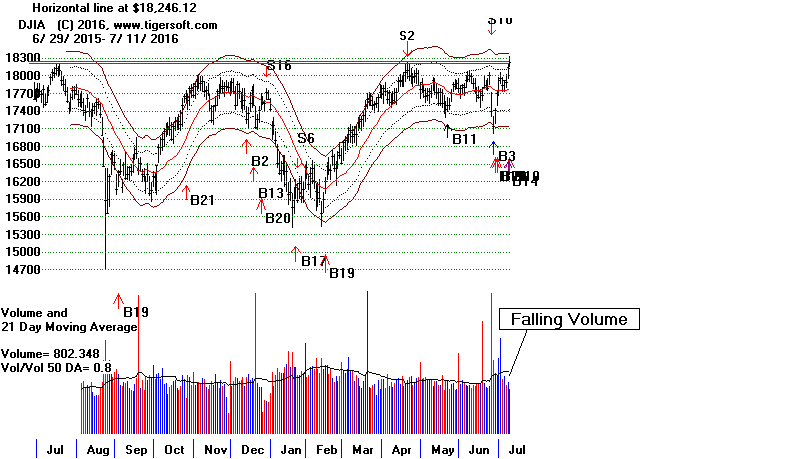
Volume is low, but the advance continues most steadily.
A DJI breakout move, such as one
above 18300 this week,
would normally require a big increase in daily volume. We
see no signs of that.
I would not turn bearish because of the low volume now.
We see a world-wide advance. The US market is rising
because of overseas' and Futures' buying in the trading
before the NY market opens. Even if there is a weak opening,
the odds favor NY Professionals supporting the market after
an early decline.
As long as the Hourly DJI's DISI/OBV
does not start to show an
extreme bearish divergence from the DJIA itself, as it just did before
the last 3 breaks in the market, I think we have to accept the
bullishness of
(1) the current cluster of Peerless Signals
(Buy B3,
Buy B19,
Buy B20 and
Buy-B14)
(2) the rising Closing Powers for DIA,
SPY and QQQ,
(3) the steeply rising NYSE A/D Line,
(4) Friday's unusually high ratio of up to down volume
and its power to prevent subsequent S9vs as well as its
unusual reliability. (See again all the cases
of this here since 1965.)
(5) a puzzlement, what would we go short? All the
Bearish MINCPs
now are shorts of general market ETFs.
How Can The Market Keep Rising?
Put yourself in the place of someone who can borrow unlimited funds
for 1/2% or less. What would you do? All around the world rates are
very, very low.
As David Stockman says:
"When you put interest rates at zero, youíll buy anything thatís
going up and fund it with zero cost money. You will buy anything with a
yield and fund it 98 percent, $0.98 on the dollar with zero cost money.
So what this is, is a gamblerís dream. The 1 percent are just laughing
all the way to the bank."
http://davidstockmanscontracorner.com/david-stockman-were-blind-to-the-debt-bubble-pbs/
Charts: Peerless
DJIA Hourly DJIA
DIA
SPY QQQ
IWM
DJI-Utilities
DJI-Rails
A/D Line-6000 Stocks
Crude Oil
SOXL TECL
Major Indexes and A/D Lines.
Key Tiger
Software ETF Charts
Bullish MAXCPs Bearish
MINCPs
Charts of Key ETFs
The Myth of Higher Rates!
What Might Happen if the FED Really Did Raise Rates?
I get the feeling that the FED keeps talking about the possibility
of raising rates for three main reasons:
(1) to satisfy stubborn "hawks" that it still listens to their concerns,
(2) to try to keep the bond and dividend stocks' bubble from blowing up
even faster and, most important,
(3) to keep up the pretense that it is still willing to raise rates.
But I don't think it dares. The January sell-off showed what would
happen if it even looks in that direction. It could not handle a bigger
sell-off.
It has no monetary tools left.
Most Americans are in no position to ride out even a recession.
http://theeconomiccollapseblog.com/archives/tag/debt-bubble
Moreover, at this juncture, it would make the publicly super-bearish
Donald Trump look like a "seer". A Crash would surely elect him, something
Wall Street, in general, is not willing to chance.
But there's more than that. If they raise interest rates, bonds could
collapse. Interest rates might rise uncontrollably. So would the
cost of maintaining the US Debt. There would then be little the FED
could do but to print lots of money to pay off its debt. Around the
world, the same scenarios would all occur at once. What a mess!
====================================================================================
7/8/2016 Peerless Buying Cluster
Predicts Breakout. If Breadth
stays super-positive, a DJI target above 20,000 becomes
reasonable. Are Wall Street and Washington working
together to make sure Trump does not become President?
That would be my guess...
The DJI will need to muscle past 18300 with superb breadth
and much improved volume. But let's give it a chance; a
Buy B14 like the one we got Friday properly over-powered
and prevented a Sell S9v in mid-2009.


The huge jump in the monthly Job's
report boosted the
DJI 250 and 140 points above the 18000 round number
resistance. It is still a few points below its high last July.
The ratio of NYSE up-volume to down-volume was 19:4.
This brought a new Buy B14 Friday and not a Sell S9V
even though the DJI closed 2.1% over the 21-day ma
with the Peerless V-Indicator still negative.
Buy B14 history -
http://www.tigersoft.com/PeerInst-2012-2013/-Buy-B14.html
A 19.41 or higher ratio of NYSE ratio Up Volume to Down Volume
often starts very big advances.
See all the cases here since 1965,
when such data was first reported. These Buy B14s seem to
always work when the DJI is not considerably below a falling
21-day ma. Often they call very big advances.
Sell S9V? Friday's Buy B14 Prevents It for A Week
We do have to worry about getting an
S9V in the days to
come. The S9V occurs because the DJI closes 2.4% over the 21-day
ma with the VI negative. With this signal, the P-I and IP21 do not
factor in. But careful consideration shows the following
conditions should probably be applied. Because we
had a Buy B14
on Friday, a Sell S9v cannot occur for 5 days.
The data below
show that we want to better refine the S9V by:
1) excluding cases after 9/16
2) excluding cases where ANROC is below .170
3) excluding case where ANROC is above .648
4)
excluding case where the ratio of Up Volume to Down Volume was greater
than 18:1 in last 5 days. This prevents the S9V on 7/16/2009
where the
day before there had been a Buy B14.
Without this exclusion, we
would have missed the very big advance that started with the
Buy B14 of July 15, 2009. See this 2009 chart just below.
2009: Buy B14 Prevents Sell S9V on 7/16/2009
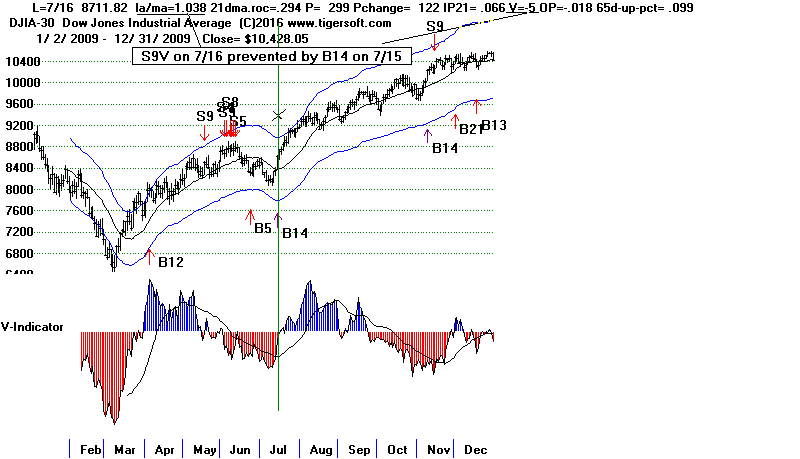
Presently the key values for the DJI are now:
LA/MA
ANNROC P-I V-I IP21
OPMA 65-day Pct Change
----------------------------------------------------------------------------------------------
1.022 (low) .095 (low) 216 -59
.054 -.094 .024
Charts: Peerless
DJIA Hourly DJIA
DIA
SPY QQQ
IWM
DJI-Utilities
DJI-Rails
A/D Line-6000 Stocks
Crude Oil
SOXL TECL
Major Indexes and A/D Lines.
Key Tiger
Software ETF Charts
Bullish MAXCPs Bearish
MINCPs
Charts of Key ETFs
Are the Fed and The Labor Department
Conspiring To Make Donald Trumps' Talk
of A Stock Market Crash Look like More
of His "Crazy Talk"?
They definitely do not like such talk.
What Better Way To Defeat Him Than To
Make The DJI Advance To 20,000 by November?
Volume is low but breadth has been superb. Note that the Opening
Powers (showing Public net buying) are falling while all the major
ETFs Closing Powers are rising (showing strong and steady Professional
buying. I suspect Professionals believe that the Federal Reserve
does not want rogue Donald Trump to win the Presidency and
they are going all out to show that his predictions of an economic
collapse are wildly off. Adding to my sense that there is an Establishment
conspiracy is how wildly the Employment numbers changed. We are
told that the Jobs' number for May was 11,000 and somehow the
Jobs' number for June was 287,000. How can we interpret these
wildly swinging numbers other than that they are serving a political
purpose.
The Weekly Charts of DIA and SPY Look Very Bullish.
- Steadily High Accumulation.
- Very High Current Accumulation - Weekly Tiger Buy B12s
- Flat Top making premature profit-taking tempting and easy.
- Lengthy Consolidation.
- Impending Breakout
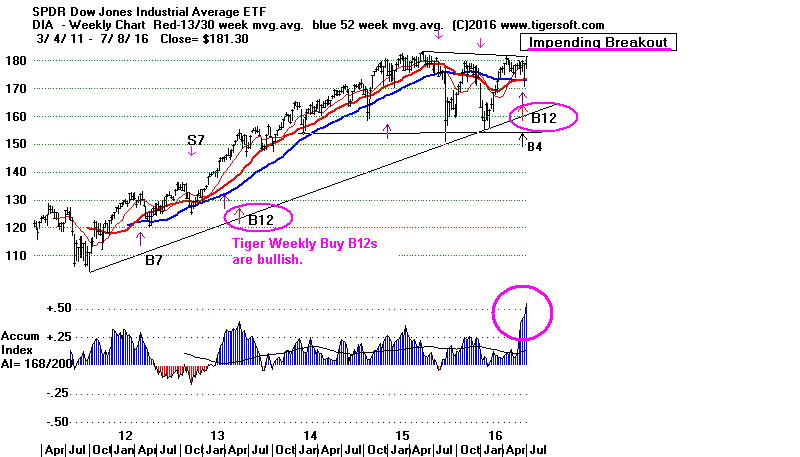 |
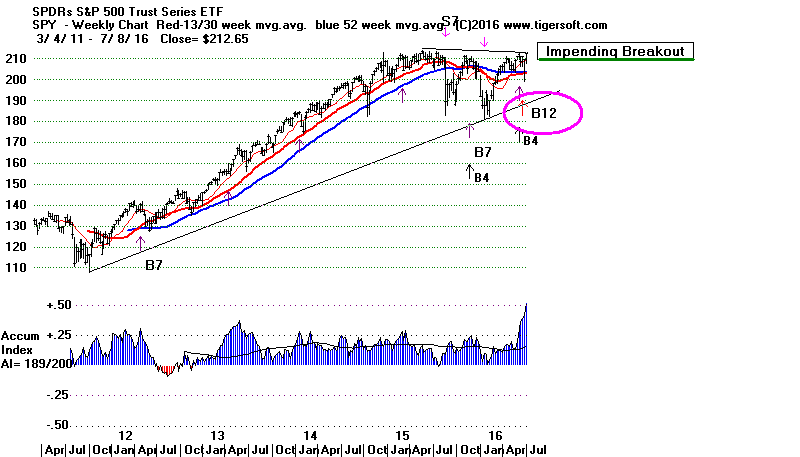 |
====================================================================================
7/7/2016 The shootings are terrible and tragic.
But urban
unrest and mass demonstrations do not usually spook
the market, unless they occur right on Wall Street or
in Washington, D.C.
The DJI shook off a 100 point decline today and fell back
only 23. Again there were more up than down on the NYSE,
though many of the leading Golds and Utilities were hit with
profit-taking because of the uncertainty that tomorrow's June
Jobs' numbers brings.
Peerless remains on Buy signals: a Buy B3,
a
Buy B19 and
a
Buy B20
The
NYSE A/D Line made another new 12-month high, thereby
placing it bullishly far ahead of where the DJI's price are. The
Closing Powers for DIA and SPY are rising. The Hourly DJI's
OBV/DISI is also still in a short-term uptrend.
But waiting to buy the ETFs again still seems best. Most of the Red
5-day
Stochastics for the major market ETFs show Sells.
There is probably still a lot of resistance at 18000. Waiting for a
retreat
and new red Buys would give us more "head-room". At that point,
I would think the DJI will be positioned to more profitably move
above 18000. Unless, the Jobs' numbers are very good, I would think
that we should probably wait to buy again, until we see more red
short-term Buys. As it is right now, a 250-300 point DJI jump will most
likely bring a Sell S9V.
Charts: Peerless
DJIA Hourly DJIA
DIA
SPY
QQQ IWM
DJI-Utilities
DJI-Rails
A/D Line-6000 Stocks
Crude Oil
SOXL TECL
Major Indexes and A/D Lines.
Key Tiger
Software ETF Charts
Bullish MAXCPs
Bearish MINCPs
Charts of Key ETFs
UDOW,
SDS, EURL
(See red arrows on these charts.)
June Jobs' Numbers
Tomorrow's June Job numbers might be able to un-stick the DJI
from its narrow range 17500-18000. See how flat the 65-day moving
averages have become for the major indexes.
A really positive June Jobs' number, above 200,000, would likely give the
market an upward surge. Very quick traders can play that, as it would
suggest that last month's very low number of 39,000 was a misleading "fluke".
Since the FED has already indicated that they would not be raising rates in July
because of the BREXIT vote, I would take a number like 225,000 to be
very bullish short-term for the market as a whole.
On the other hand, a very low number, one below 50,000, would push
up Utilities and Gold Stocks, because it would mean the FED will almost
certainly do nothing to raise interest rates. You recall how last month's
meager 39,000 new jobs gave an immediate lift to the Bonds, Utilities and
Gold stocks because it showed the Fed could not safely raise rates for fear of
pushing the US economy over the edge into a recessionary trend.
When the number comes out tomorrow, plug it into the June 2016 cell in the
table below. See that I show the monthly numbers in red when they
are were
below the same month's figure from a year earlier. Nine of the last 12
months have
been red. This definitely shows a weakening US economy. Back in 2007, the
July 17th top occurred after 10 of the previously reported 12 months were
lower than a year before. The July 2007 number, which was reported in
early
August of that year, was actually negative. No one is expecting this low a
number
tomorrow, but it's hard to make a case for much of a surge in stocks prices
from Jobs' numbers' in a declining trend for the last year.
I would think that any June number below 100,000 would be problematic
for the market. While such a low number would help ensure that the Fed
does
not raise rates this month, it would also show that the US economy is
too weak to allow much profits' growth and thus warn that a Recession is not
far away. By August 2016, we may again be looking at 10 of 12 falling
monthly
numbers, comparing the current month with the same month a year before.
Perhaps, as in 2007, there will this year be Summer Rally's spike up to the
upper 3.5%
band. If the V-Indicator remains quite negative, this could easily bring a
Peerless
Sell S9V. We should trust such a signal. There is a strong
historical tendency
for Summer Rallies to fail. I showed this last night. We might,
however, also
wait for the NYSE A/D Line uptrend to be broken.
Monthly
Jobs Numbers |
| Year |
Jan |
Feb |
Mar |
Apr |
May |
Jun |
Jul |
Aug |
Sep |
Oct |
Nov |
Dec |
| 2006 |
278 |
316 |
281 |
183 |
23 |
82 |
207 |
181 |
158 |
4 |
208 |
171 |
| 2007 |
240 |
90 |
189 |
79 |
143 |
78 |
-33 |
-24 |
88 |
85 |
115 |
97 |
| 2008 |
19 |
-86 |
-78 |
-210 |
-185 |
-165 |
-209 |
-266 |
-452 |
-473 |
-769 |
-695 |
| 2009 |
-791 |
-703 |
-823 |
-686 |
-351 |
-470 |
-329 |
-212 |
-219 |
-200 |
-7 |
-279 |
| 2010 |
28 |
-69 |
163 |
243 |
522 |
-133 |
-70 |
-34 |
-52 |
257 |
123 |
88 |
| 2011 |
42 |
188 |
225 |
346 |
73 |
235 |
70 |
107 |
246 |
202 |
146 |
207 |
| 2012 |
338 |
257 |
239 |
75 |
115 |
87 |
143 |
190 |
181 |
132 |
149 |
243 |
| 2013 |
190 |
311 |
135 |
192 |
218 |
146 |
140 |
269 |
185 |
189 |
291 |
45 |
| 2014 |
187 |
168 |
272 |
310 |
213 |
306 |
232 |
218 |
286 |
200 |
331 |
292 |
| 2015 |
221 |
265 |
84 |
251 |
273 |
228 |
277 |
150 |
149 |
295 |
280 |
271 |
| 2016 |
168 |
233 |
186 |
123(P) |
38(P) |
|
|
|
|
|
|
|
| P : preliminary |
|
|
====================================================================================
7/6/2016
The basics here remain the same as last night:
The operative signals remain a Buy B3,
Buy B19 and
Buy B20.
These Buys would seem to apply best to the
Bullish MAXCPs and the
highest
relative strength New Highs in the strongest groups (JNUG
for example).
Because of the overhead resistance, some of us will want to wait for another
pullback to buy DIA and
SPY.
However, it sure seems that the DJI
wants to get back above 18000. That's what
the Peerless Buy signals are telling us. There are 15 times more
MAXCPs
than MINCPs. Tonight
all the Bearish MINCPs are short ETFs.
The Closing Powers for DIA and SPY keep rising, showing that early
weakness from overseas trading can be reversed given some reason. In
addition, the Hourly DJI is rising
nicely now.
I think this means that as long as the
NYSE A/D Line is rising, there will
not be much of a decline. But the upside also appears limited for the DJI.
Any 2% DJI rally from here will probably find the Peerless V-Indicator negative.
That will produce a Sell S9v. (The V-I is the the 21-day ma of 85%
of Advancing
NYSE Volume less 100% of Declining NYSE Volume.)
While, there is always talk of a Summer Rally, my studies of July price
breakouts
below suggest the odds are only 1 in 3 of such a breakout succeeding. It
would therefore, seem, better to wait for a little more of a retreat to buy the
major market ETFs again. Perhaps, in a week, we may start getting Red Buys
from them again.
Today one of the Federal Reserve's many spokesmen told investors.
that there would almost certainly not be a rate hike in July because
the Fed wants to wait until overseas markets settle down after the
BREXIT vote. (This hardly comes as a surprise.) Friday we get the
June Jobs'
numbers. Let's hope the number of new jobs are above May's. The FED
has no
ammunition left to bolster a weakening economy and Congress has little
inclination
to provide fiscal stimulus.
Charts: Peerless
DJIA Hourly DJIA
DIA
SPY
QQQ IWM
DJI-Utilities
DJI-Rails
A/D Line-6000 Stocks
Crude Oil
SOXL TECL
Major Indexes and A/D Lines.
Key Tiger
Software ETF Charts
Bullish MAXCPs
Bearish MINCPs
Charts of Key ETFs
July Breakouts and
Well-Tested Resistance Challenged in July
I reckon the historical odds are about 2:1 against a successful price breakout
in July, even when the A/D Line is confirming the price action.
Since 1929, there have been 7 July price breakouts. 3 times the
DJI fell back from well-tested overhead resistance that is comparable
to what we see now. And 10 times the DJI made a brief breakout
and then fell back.
The A/D Line is very strong now, stronger than in any of these earlier
cases. But considering where the A/D Line was confirming: there were
3 breakouts, 2 retreats from resistance and 5 false breakout even though
the A/D Line was confirming the DJI's strength on the breakout.
Breakouts (7)
1929 - lagging
internals. FED injects money through Open Market buying Govt securities.
1936 - A/D Line
lagging.
1938 - A/D Line
lagging.
1980 - A/D Line
Confirming.
1987 - A/D Line
lagging. Finally A/D Line trend-break
1989 - A/D Line
Confirming
1992 - A/D Line
Confirming
Challenges and retreats from very well-tested resistance
(3)
1976 - A/D Line
uptrend break
1991 - A/D Line
uptrend break
1996 - A/D Line
lagging.
Breakout Failures (10)
1947 - A/D Line
lagging and then A/D Line uptrend break.
1952 - A/D Line
lagging and then A/D Line uptrend break.
1957 - A/D Line
lagging and then A/D Line uptrend break. Sell S9
1959 - A/D Line
lagging and then A/D Line uptrend break. Sell S9
1964 -
Confirming...A/D Line uptrend break
1967 -
Confirming...A/D Line uptrend break. Later ... Sell S9
1975 -
Confirming...A/D Line uptrend break
1978 -
Confirming...A/D Line uptrend break
1985 -
Confirming...A/D Line uptrend break
1990 - A/D Line
lagging and then A/D Line uptrend break. Sell S9
===========================================================================
7/5/2016 The operative signals remain a Buy B3,
Buy B19 and
Buy B20.
These would seem to apply best to the
Bullish MAXCPs and the
highest
relative strength New Highs in the strongest groups (JNUG
for example),
more than to the DJI, SP-500, QQQ, IWM and the various country funds.
Super-imposed Numbered Peerless signals and Red Tiger Signals
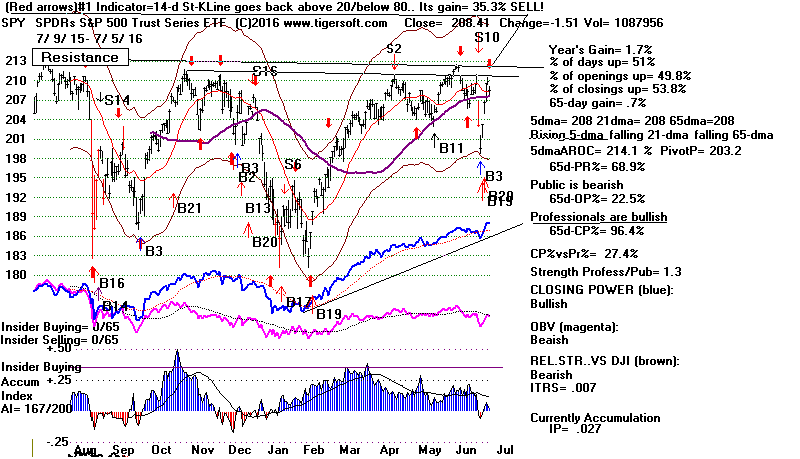
Having met overhead resistance, many of the major market ETFs
must now fall back. Because of the excellent breadth and
buy signals, expect only a limited decline in the strongest groups.
We will be watching our Short-term Red signals to see when the
ETFs' decline is likely over.
The DIA and SPY are on a short-term red Sells. So are 2/3 of the major
market and country ETFs. See the list below. A successful DJI
retest of 17500 or a decline limited to three days could be quite constructive,
if it permitted the DJI's internals to all be positive if the DJI
can surpass the 18000 resistance.
The
continuing strength in Gold/Silver stocks, Utilities and Water
Stocks shows the the market is again in a defensive mode. Each
breakout after a consolidation starts the Gold/Silver stocks up on
a new run, Darvas style. I hope you have played the Utility rally.
See how the highest Pct.Up (percentage of daily advances for the year)
are highest in the Water Stocks: AWK
(63.5%),CWT (62.2%),
WTR (61%).
But general two utilities also rate high on this score:
PCG (61%) and
PNM (61%).
With the major market indexes unable to make new highs and struggling
to stay above their 65-dma, I have suggested we use the short-term Red
Buys and Sells. As we expected last night, today's weakness brought
a number of new Red short-term sells:
Signal Gain/Yr System
CP 5-dma
DIA
Sell! +23.2%
50-d K-Line Rising
Rising
SPY
Sell! +35.3%
14-d K-Line Rising
Rising
QQQ Buy
+40.1% 20-Pct-D
Rising Rising
Just below 65-dma
IWM Sell!
+40.5% 14-d K-Line
Rising Rising
BRZUSell!
+855.7% 5-d K-Line Rising
Rising
EWG Buy
+65.1% 5-Pct-D
Rising Rising
ITRS=-11
EWI Buy
+73.0% 14-Pct-D
Rising Rising
ITRS=-16
EWU
Sell! +159.6% 5-d K-Line
Rising
Rising ITRS=-.068
FAS
Sell! +88.2% 5-d
K-Line
Falling
ITRS=-.112
OIH
Sell! +128.9% 5-d K-Line
Rising
ITRS=-.017
RSX
Sell! +62.6% 5-d
K-Line
Rising
Rising
ITRS=+.007
SOXL Buy
+309.3% 20-Pct-D
Falling
Rising ITRS=-003
TECL
Buy
+131.9% 14-Pct-D
Rising Rising
ITRS=-018
VGK
Sell! +98.1% 5-d
K-Line
Rising Rising
ITRS=-.083
YINN
Sell! +147% 21-RSQma
Rising
Rising ITRS=-.067
-----------------------------------------------------------------------------------------
10 Sells and 5 on Buys.
1992 British Pound Plunge's Effect on DJIA
8%-9% Correction from High
This was also in a Presidential Election Year.
(Details:
https://en.wikipedia.org/wiki/Black_Wednesday
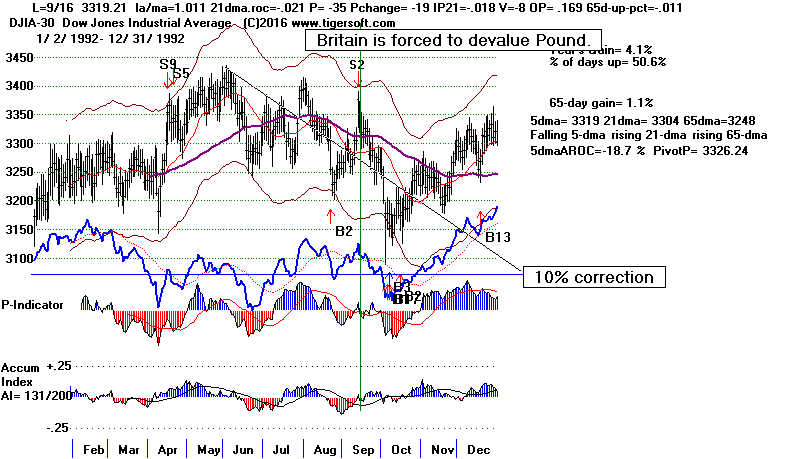
What's Ahead? More of The Same!
The Bank of England is assuring investors that it stands ready to
provide lots of liquidity even if the Pound falls further and even as
more UK real-estate funds panic and refuse to allow investors
to pull out their money. This will further weaken the Pound
and seems bound to bring more "hot" European money into US bonds,
utilities, Reits and Gold. What you are seeing now should continue
until the end of the year. But next year could be ugly.
The Market May Have Four More Years
of Gridlock. With the FED out of monetary
ammunition to save the market from a big
decline, next year could be pretty awful.
Today Queen Hillory escaped criminal indictment for her careless disregard for
national security. If Trump could show restraint and not keep alienating
new groups of Americans almost each day with ill-considered shots
from the hip at minorities and women, he could become President.
But what we saw of him in the primaries was apparently no act. So,
Hillory will probably be the next President. This should make Wall
Street happy for a while. It should bring an August and an end-of-the
year Partisan rally. But neither candidate inspires trust. And
without trust,
there can be very little leadership. So, I expect another 4 years of
grid-lock
I doubt if the US can afford another 4 years of grid-lock.

=============================================================================
7/4/2016 The operative signals now are
Buy B3,
Buy B19 and
Buy B20.
The A/D Line roared to a new high far ahead of the DJI. With breadth
this good, we do not want to sell too soon. Now that it's July, there
is precedent for a breakout in the Presidential Election Year. Seasonality
is bullish. Since 1965, the DJI has risen 67% of the time over the 5
trading
days after July 4th and 61% over the next month.
The DJI is now 1.1% over its 21-dma. Another 200 point rally would
bring the DJI up to the top of its resistance zone and to the 2% upper
band. Such a move could bring a Sell S9V, since the V-I is still negative.
A short-term pullback now could be constructive if it allows the V-I to
turn positive. However, seasonality is bullish. Since 1965, the DJI
has risen
67% of the time over the 5 trading days after July 4th and 61% over the
next month.
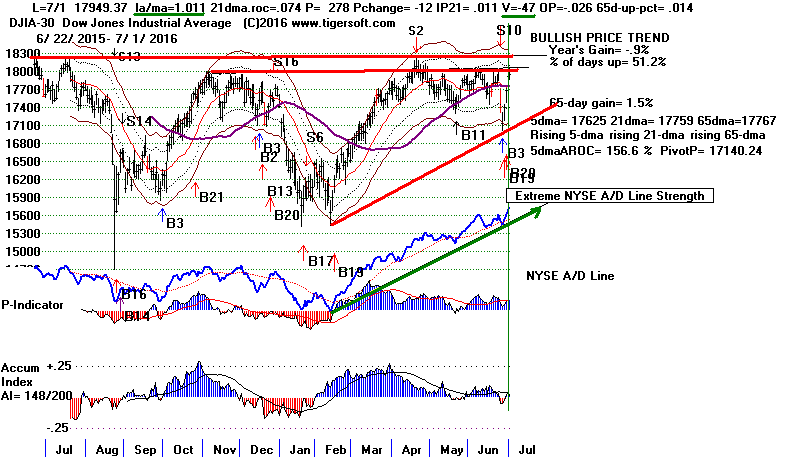
A Short-Term Pullback?
The "Fast-Fivers" below show
13 Red Buys and 7 Sells. However, there are
8 in this group that could
easily
switch to Sells on Tuesday.
Banks turned weak
on Friday. Deutsche Bank is the weakest.
This
gives Bears ammunition. Deutsche Bank's US operations have failed two
"stress tests". We also watch the Big Banks closely because of 2007-2009
and now because of their holdings in Sovereign Bonds from financially
troubled Greece, etc. JPM,
MS and WFC gave red Sell on Friday.
We pay special attention to Bank Stocks because they are the most
closely correlated to Peerless and the DJIA. So, seeing DB and GS make
new lows this week would definitely be scary and reminiscent of 2007-2008.
Expect London banks and insurance stocks to show weakness. I mentioned
a week ago that London's real estate bubble might be broken. See tonight's
NY Times article on the subject. Apparently a big insurance company will
no long allow investors to withdraw funds invested in its Commercial Real Estate
fund. Click on
Standard Life Fund Halts Withdrawals After 'Brexit' Vote
By LANDON THOMAS Jr.
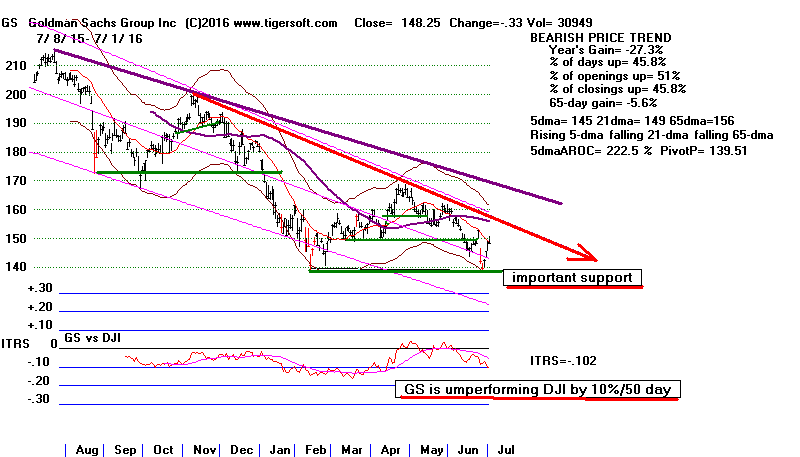
Charts: Peerless
DJIA Hourly DJIA
DIA
SPY
QQQ IWM
DJI-Utilities
DJI-Rails
A/D Line-6000 Stocks
Crude Oil
SOXL TECL
Major Indexes and A/D Lines.
Key Tiger
Software ETF Charts
Bullish MAXCPs
Bearish MINCPs
Charts of Key ETFs


"FAST-FIVERS" - Those ETFs/Stocks
that give red Buys and Sells based on K-Line turning
up from below 20 and above 80, respectively. These
are the most sensitive trading vehicles at this time.
The other 5-day Stochastics are short-term, too, but
it takes more of reversal to give a signal.
We want to use red Stochastic Buys and Sells is
trading range markets mostly and when other
technical conditions are most favorable. Buys, for
example, are best made at support and when there
has recently been a bulge of Accumulation. Very
weak Closing Power and Heavy distribution favor
the red Sells. Relative Strength should be factored
in, too. The beauty of Tiger is that you can scan a
a directory of stocks and get a list of all the stocks
with new Red Buys or Sells, what system is used and
what the track record is.
Peercomm + Older Charting + Run/Setups +
Run Best Indicators + OK + X
Peercomm + Charts-2016 + Tiger Selections + #1 Indicators' Results
See BRZU below. It was recommended here based on its
excellent momentum, internals and the expectation that there
would be a market rally due to the Peerless Buy B3.
We would have done even better buying BRZU at the close
on June 27, the day of the Buy B3 at 79.16 instead of
buying it at the opening the next day, which was 85.66.
This slippage is very common with the short-term Red
Buy and Sells. Over a year, there is a big difference in the
results: Buy on the close of the day the red Buy with
BRZU and selling on the close of the day of the next
red Buy would have gained a trader 396%, Trading at
the next day's opening would have still gained 191% with
75% of the trades being profitable. This shows the advantage
of running Tiger yourself, but further below I list the
FAST-FIVE K-Line values tonight, to illustrate how one
can trade on the close the same day as the signal.
The 5-day Stochastic Buy/Sell systems are the most likely
to be the optimum system when you look at large numbers
of stocks. But the 5-day Stochastics are not always the
best and when a stock starts a powerful new uptrend, the
5-day Stochastic Sells appear too early and vice verse
when prices start a severe downtrend. In all of 2015,
BRZU's
system was the same optimized system that it is no. But
in 2014, this system failed repeatedly because of broken
support levels and because the Relative Strength ITRS
was either above a +.30 to use a Red Sell or below -.30,
thus making a Red Buy unsafe.
Red Buys Work Best
When Peerless, Momentum, Internals
and Relative Strength Are Favorable.
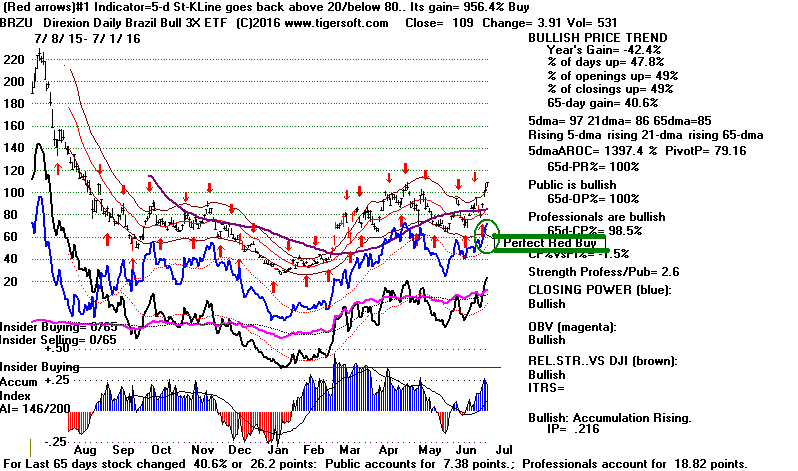
The graphs linked to here are not updated.
7/1/2016
Gain 5-day K Tomorrow?
OKS Buy
249% 90
Sell possible. +.28 today
DZK Buy
236% 97
Sell possible. +.56 today
AKBA Sell
207% 78
No buy is possible...
SLCA Buy
210% 98
Sell possible. +1.05 today
EWU Buy
154% 95
New Red Sell
IPGP Buy 143%
75 No sell is possible...
CXO Buy
115% 66
No sell is possible....
ITT Buy 122%
66 No sell is possible....
CRZO Buy
113% 85
Sell possible. +.83 today
DO Buy
134% 98
Sell possible.. +1.09 today
/
VRTX Buy
108% 92
Sell possible tomorrow +1.72
ATW Buy
145% 95
Sell possible tomorrow +1.14
SAN
Sell
90% 86
New Sell -.01 today
ERX
Sell 109%
95
New Sell +.48 today
BEAV Buy
89% 78
No Sell possible...
FAS
Sell 82%
89 New Sell -.28 today
TGA Sell
75% 71 No Buy
possible
MA Buy 65% 24
No sell possible
MSFT Sell
44% 85
New Sell -.01 today
JPM
Sell
42% 82
New Sell -.88 today
---------------------------------------------------------------
Totals
13 red Buys 7 red Sell
8 could give Red Sells if their 5-dy Stoch.K-Line falls tomorrow.
===================================================================================
6/30/2016 The operative signals now are
Buy B3,
Buy B19 and
Buy B20.
Relax and enjoy
the rally. CVX (our Tahiti
stock), UCO,
BRZU and
the ETFs on RED buys have done
quite well. Some of these ETFs
have reached over-sold status. If they give red Sells tomorrow, I
would take profits in them.
NYSE A/D Line made a 12-month high
ahead of the DJI. The FED is probably on hold
and US bonds and utilities look like a good place
to park EUROs and POUNDS in light of
continuing weakness in both.
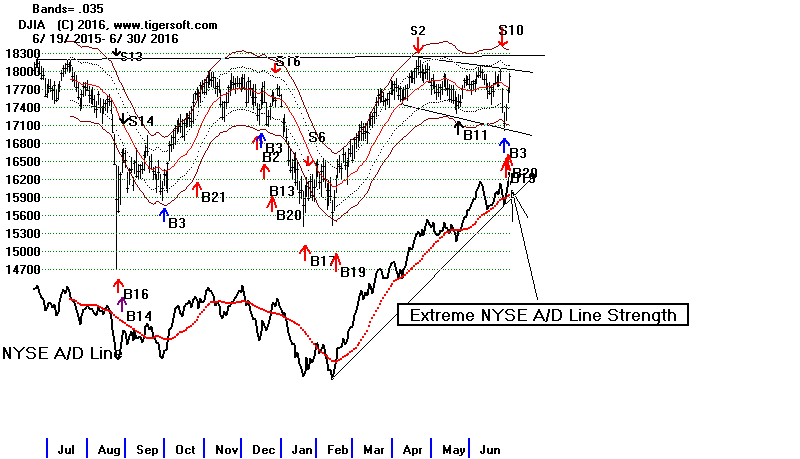
Super Breadth: US Stocks Are The Place To Be, Apparently
and The FED will do its best to boost the market for the
remainder of this Presidential Election Year, With July
will come the historical possibility of a DJI new high, as
in 1964 and 1980.
The ratio of NYSE advancers to decliners was better than 3.75 today.
Tuesday and Wednesday this week, this ratio was above 5:1. Three
such consecutive good days has not occurred since 1950. It has only
been seen on seven earlier occasions. In each case the DJI rose at least
10% more over the next 4 to 16 weeks. Only twice (2/7 or 28.6%) was
there a retest of the lower band before the big rally. The risk:reward
ratio
now looks quite favorable. Continue to hold long positions and phase
out most short sales, especially those whose Closing Power breaks above
its downtrendline.
Earlier Cases of 3-StraightExtremely
Good Breadth Days
10/25/1934
Pullback but 18% rally in 2 months.
6/ /1938
No pullback. 12% rally in one month.
9/ /1938 Pullback
and then 12% rally in six weeks.
9/30/1938
No pullback.
and 10% rally in six weeks.
8/27/1945 No
pullback. and 14% rally in 14 weeks.
7/ /1950
Shallow pullback and 10% rally in 4 months
11/9/1950
Shallow pullback and 10% rally in 3 months
Charts: Peerless
DJIA Hourly DJIA
DIA
SPY
QQQ IWM
DJI-Utilities
DJI-Rails
A/D Line-6000 Stocks
Crude Oil
SOXL TECL
Major Indexes and A/D Lines.
Key Tiger
Software ETF Charts
Bullish MAXCPs
Bearish MINCPs
Charts of Key ETFs


"FAST-FIVERS"
(See discussion of last night for background.)
The graphs linked to here are not updated.
Gain 5-day K Tomorrow?
OKS Buy
246% 79
No sell possible tomorrow.
DZK Buy
232% 96
Sell possible. +1.29 today
AKBA Sell
209% 61
No buy is possible...
SLCA Buy
202% 91
Sell possible. +.27 today
EWU Buy
154% 98
Sell possible. +.40 today
IPGP Buy 143%
39 No sell is possible...
CXO Buy
115% 39
No sell is possible....
ITT Buy 115%
36 No sell is possible....
CRZO Buy
112%
DO Buy
124% 60
No sell possible...
GMT Buy
110% 61 No
sell possible...
/
VRTX Buy
107% 91
Sell possible tomorrow +1.02
ATW Buy
102% 86
Sell possible tomorrow +.12
SAN Buy
93% 97
Sell possible. +.03 today
ERX Buy 106%
100 Sell likely tomorrow
+.77
BEAV Buy
90% 70
No Sell possible...
FAS Buy
85% 100
Sell likely tomorrow +.94
TGA Buy
75% 67 No Sell
possible
MA Buy 64%
8 No sell possible -4.07
MSFT Buy
48% 96
Sell possible... +.63
JPM Buy
44% 99
Sell possible ... +.94
---------------------------------------------------------------
Totals
20 red Buys 1 red Sell
8 could give Red Sells if their 5-dy Stoch.K-Line falls tomorrow.
2 have a K-Line value of 100. K-Line will fall unless they show
extreme strength and close at day's high. With these, I think
I would wait an additional day.


