+TigerSoft Hotline
(C) 2017 William Schmidt, Ph.D.
www.tigersoft.com
william_schmidt@hotmail.com

You are here:
www.tigersoft.com/345HLN12/INDEX.html
Previous Addresses
http://www.tigersoft.com/333HLLL/INDEX.html
http://www.tigersoft.com/444HL444/INDEX.html
www.tigersoft.com/119HLPAZ/INDEX.html
http://www.tigersoft.com/888HLAZ/INDEX.html
www.tigersoft.com/821-HL/INDEX.html
http://www.tigersoft.com/816-HLN/INDEX.html
http://www.tigersoft.com/77HL7778/INDEX.html
http://www.tigersoft.com/64HRL/INDEX.html
http://www.tigersoft.com/55HL55/INDEX.html
----->
Suggestion <-----
A number of your email accounts are putting emails from me
using
william_schmidt@hotmail into
the Junker folder. Please
"be-friend" an email from me so that you promptly get change
of address information regarding new Hotline links.
-----------------------------------------------------------------------------------------------------------------
HELP
A
Guide To Profitably Using The Tiger Nightly HOTLINE
Introduction
to Tiger/Peerless Buys and Sells.
Peerless
Buy and Sell Signals: 1928-2016
Individual Peerless signals explained:
http://tigersoftware.com/PeerlessStudies/Signals-Res/index.htm
http://www.tigersoft.com/PeerInst-2012-2013/
Explanation of each Peerless signal.
http://www.tigersoft.com/PeerInst-2012-2013/
Different
Types of TigerSoft/Peerless CHARTS, Signals and Indicators
Peerless Signals and DJI
Charts - version 7/4/2013
1965
1965-6 1966
1966-7
1967
1967-8
1968
1968-9
1969
1969-70 1970
1970-1
1971
1971-2 1972
1972-3
1973 1973-4
1974
1974-5 1975
1975-6
1976 1976-7
1977
1977-1978
1978
1978-79
1979
1979-80
1980
1980-1
1981
1981-2
1982
1982-1983
1983 1983-1984
1984 1984-1985
1985
1985-1986
1986
1986-1987
1987
1987-8
1988
1988-9 1989
1989-90
1990
1990-1 1991
1991-2
1992
1992-3
1993
1993-4
1994
1994-5
1995
1995-1996 1996
1996-7
1997
1997-8 1998
1998-1999
1999
1999-2000
2000
2000-1 2001
2001-2
2002
2002-3
2003
2003-4
2004
2004-5
2005 2005-6
2006
2006-7
2007
2007-8
2008
2008-9
2009
2009-10
2010
2010-11
2011
2011-12
2012 2012-2013
2013
2013-2014
2014
2014-2015
2015
2015-2016
Documentation for
TigerSoft Automatic and Optimized Signals.
How reliable
support is the DJI's rising 200-day ma?
SPY
Charts since 1994: Advisory Closing Power S7s, Accum. Index, 65-dma, Optimized
Signals.
Previous Hotlines -
www.tigersoft.com/55HL55/INDEX.html
^^^^^^^^^^^^^^^^^^^^^^^^^^^^^^^^^^^^^^^^^^^^^^^^
1/19/2016
--->
Corrections,Deeper Declines and Bear Markets since 1945.
1/21/2016
--->
High Velocity Declines since 1929
2/12/2016 --->
Presidential Elections Years and Bullish IP21 Positive Non-Confirmations at
Lower Band.
2/12/2016 --->
OBV NNCs on
DJI's Rally to 2.7% Upper Band when DJI's 65-dma is falling.
11/6/2016 --->
Killer Short Selling Techniques:
===>
Order Here
($42.50)
It's As Easy as 1,2,3
TigerSoft "Combination" Short-Selling...
Easy as 1-2-3 Short Sales
Earlier
Q-Answers
QuickSilver Documentation
(1/11/2016)
Our Different Signals
Better
understand the difference between Peerless DJI-based signals,
the one-year optimized red Signals and
the fixed signals based
on technical developments.
Introduction to
Tiger/Peerless Buys and Sells.
Different Types of TigerSoft/Peerless CHARTS, Signals and Indicators
New
TigerPeerless Installation and Basic
Uses' Instruction
(11/25/2016)
See
the re-written materials on TigerSoft Buys and Sells.
A few more pages will be added. But users could print this
main Installation and Uses' Page for reference.
12-7-2016 The
Tiger Elite Page will have a revised Peerless later tonight.
It gives the new Peerless Buy B4, not to be confused with
the
revised Tiger Buy B4 for stocks and ETFs (buy at rising 65-dma)
and a revised Sell S7 (sell at
falling 65-dma.
Do not confuse TigerSoft Buys/Sells
with Peerless which are based on DJI and back-tested to 1928.
Examples: CP-Divergence B7/S7
Buy B4 at rising 65-dma
Sell S7 at falling 65-dma
=========================================================================================================
1-17-2017
>
Breadth Is Bullish but Professionals Remain Bearish.
> Respect
The Outcome of The Battle Going on between
Bulls and Bears in DJI-30.
>
Watch Goldman Sachs (GS) Tomorrow.
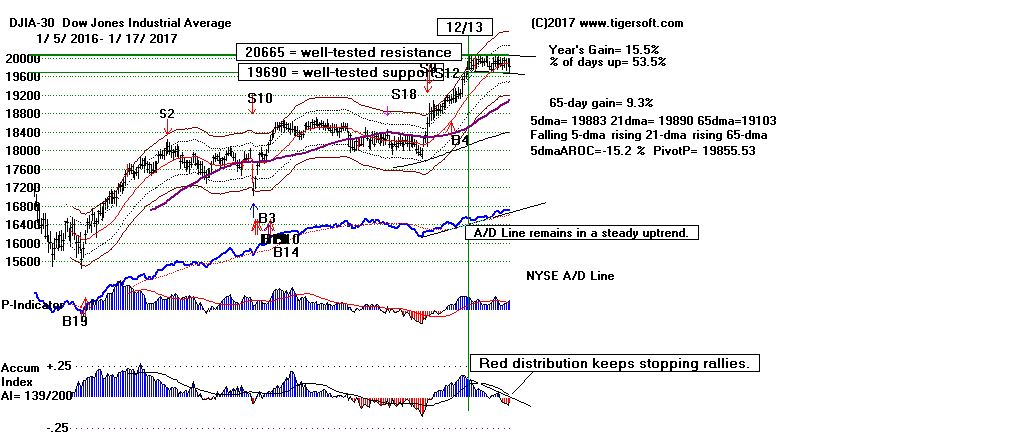
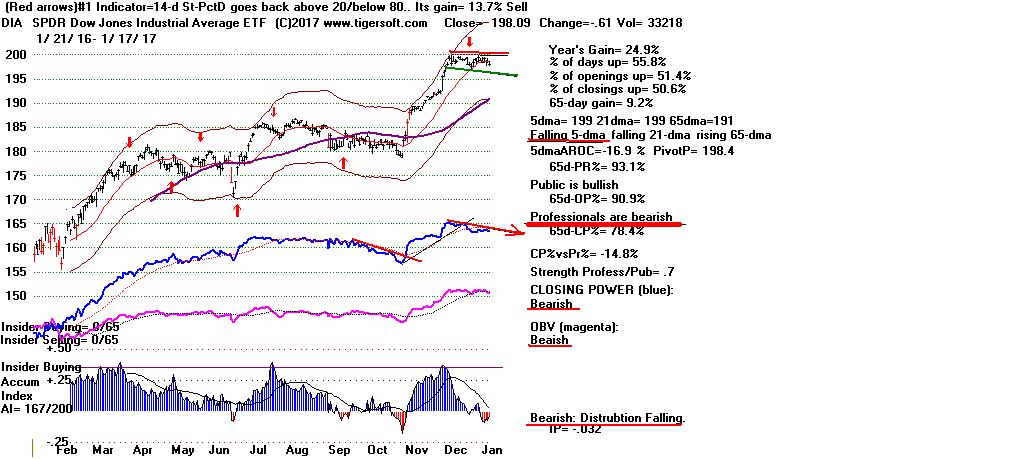
The DJI is moving farther and farther out to the end of
what will either be
a flat and narrow trading range
to propel itself higher on an upside breakout
or a high diving board
from which a steep sell-off will soon follow. A breakout
decisively above 20000 will bring a judged Peerless
Buy B10
. A breakdown
close below 19680 will bring a Peerless
Judged S10 . The DJI's
tight price range
that we are watching so closely started on December 13th. If it is not
resolved
by the end of this week, it will be more than 5-weeks old. Such longevity
is
usually bearish in these patterns.

High-Priced DJI Stocks Must Rally Tomorrow.
Their
importance is directly related to their price. No other stock is
nearly as important as GS, which declined much more than the others today.
                 DJI-13     One Day Performance
                                       1 / 13 / 2017 - 1 / 17 / 2017
Rank          Symbol        Name                         Price        Pct.Gain
---------     -------------------------------------------------------------------
 1            MCD           McDonalds Corp               122.75        1-2%
 2            IBM           Int Business Machines        167.89        0-1%
 3            HD            Home Depot Inc               135.93        0-1%
 4            TRV           The Travelers Companies Inc  117.46        0-1%
 5            JNJ           Johnson & Johnson            114.87        0-1%
 6            AAPL          Apple Inc                    120           0-1%
 7            MMM           3M Company                   177.26       -1%
 8            UNH           UnitedHealth Group Inc.      160.66       -1%
 9            BA            Boeing Co                    157.67       -1%
 10           CVX           Chevron Corp                 116.28       -1%
 11           DIS           The Walt Disney Company      107.97       -1%
 12           UTX           United Technologies Corp     109.97       -1%
 13           GS            Goldman Sachs Group Inc      235.74       -4%
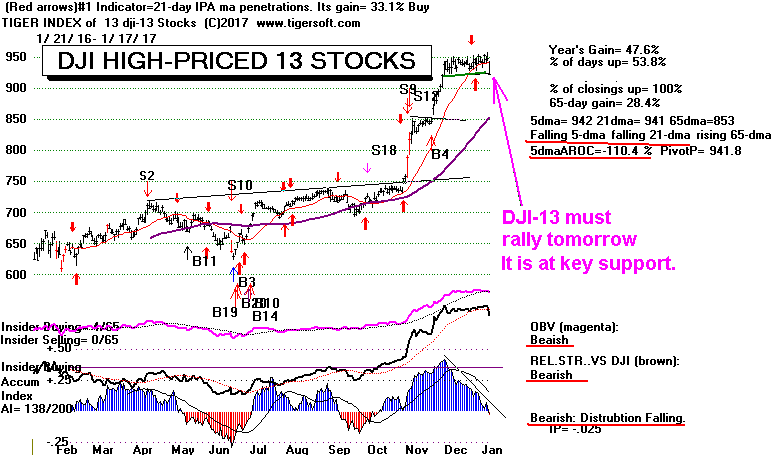
GS's Opening Tomorrow May Be The Key
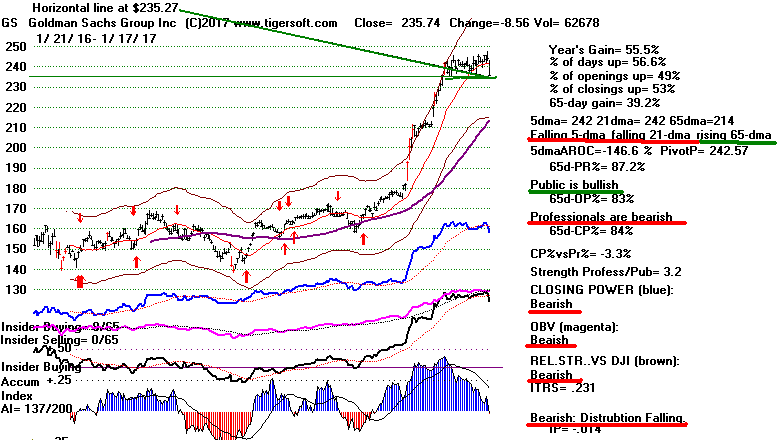
Tomorrow morning before the opening Goldman Sachs is scheduled to announce its
earnings. How it behaves then will be very important, as Goldman Sachs
(GS) is by far the
most heavily weighted stock in the most watched index of the stock market,
the DJI-30.
Today GS sold off partly because of general nervousness about its earnings plus
the
new President-Elect's criticism of a strong Dollar because of how it hurts
exports
and US manufacturing and helps imports of non-US goods. Wall Street roots
for a
strong Dollar because they want the US to be the world's financial center.
They benefit
enormously if wealthy foreigners put their money in the US.

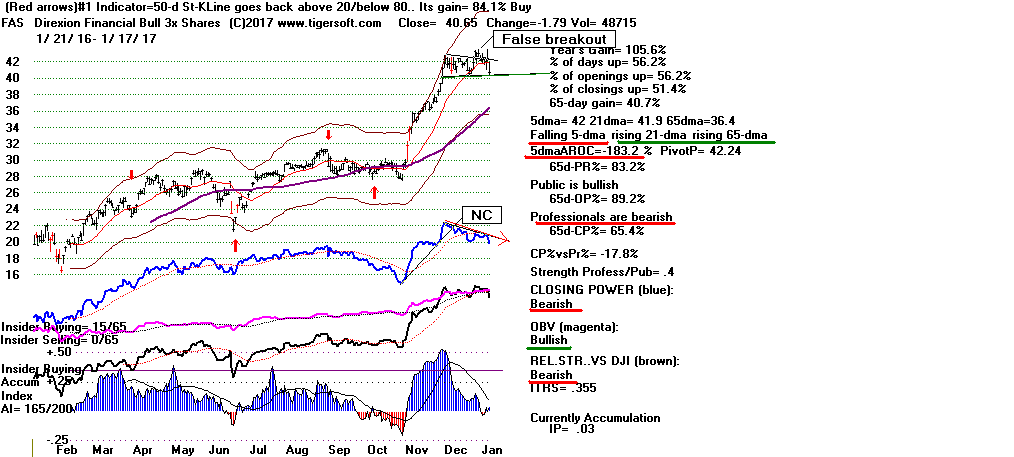
Today's 8+ point drop in GS sent nearly all banks and financials down. FAS
which closely rises and falls as the DJI does nearly broke its recent support.
As these have been the leaders, such a breakdown would remove the biggest
bullish sector propelling the market higher.
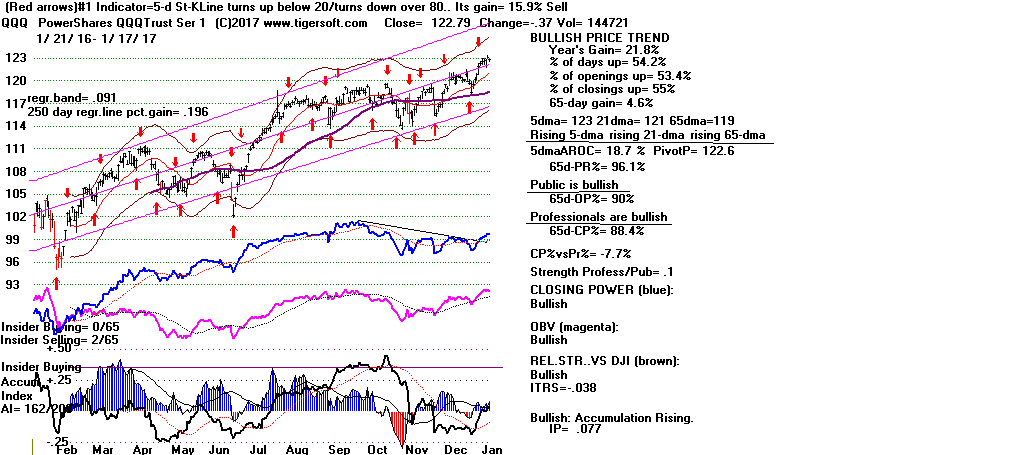
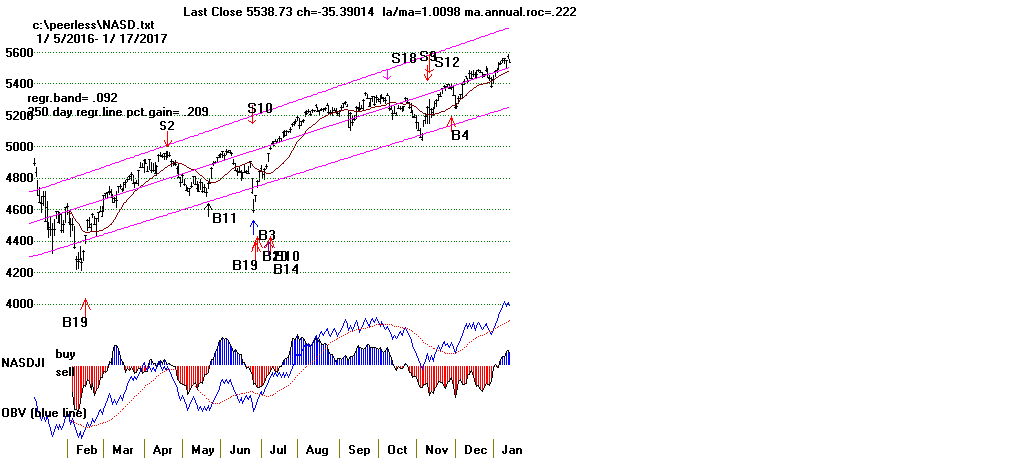
The Rising QQQ and NASDAQ
The QQQ and the NASDAQ are still in bullish uptrends. Their up-slope is a
modest
20% annualized. The years 2000 and 2007-2008 show that they can hold up
for a
month or two, if the DJI breaks down, but not much more than that.
To Tiger/Peerless Charts:
1/17/17:
PEERLESS
DJI, Signals, Indicators DJI-13
Hourly DJIA
S&P
OEX
NYSE
NASDAQ
COMPQX with Closing Power
DIA
QQQ SPY
IWM
Short-Term Rates
DJI-Utilities DJI-Transp
A/D Line-6000 Stocks
Crude Oil
FAS
GLD IBB
JETS JNUG
NUGT RSX
SLV SOXL
TECL YINN
AAPL, AMZN,
FB, GOOG,
GS MSFT
1/17/17:
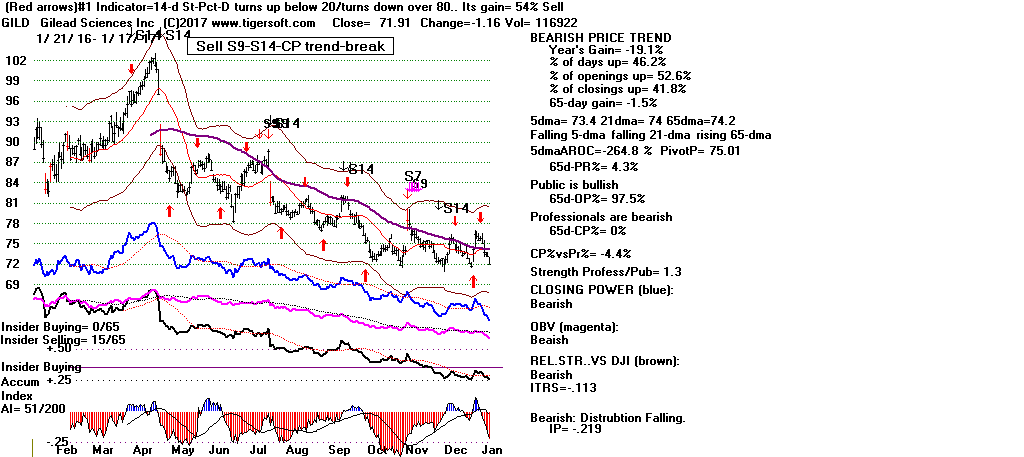
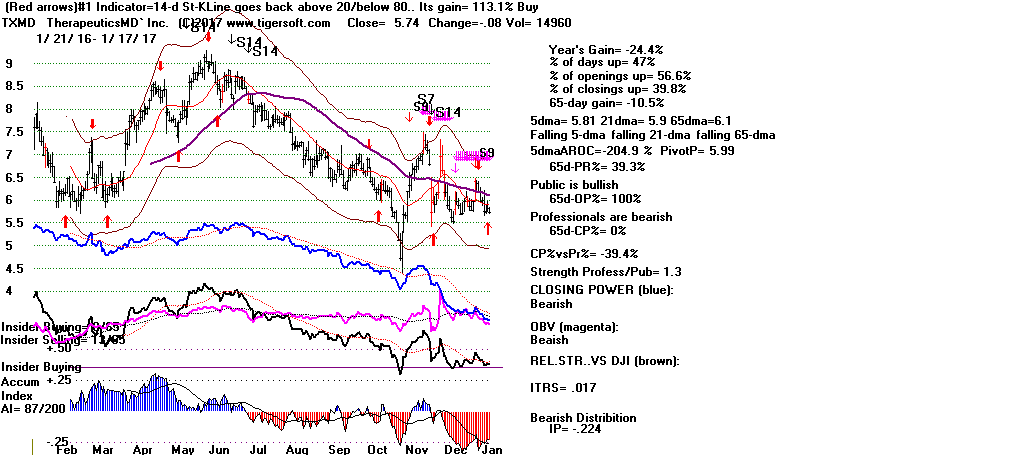
Bullish MAXCP Stocks (1/13/2017)
1/17/2017 Bearish MINCP Stocks
 |
 |
 RANKING OF KEY DIRECTORIES BASED PCT.OF STOCKS ABOVE 65-DMA
             1/17/17
---------------------------------------------------------------------------------------
Directory     Current       day-1         day-2         day-3         day-4         day-5
----------------------------------------------------------------------------------------
BIGBANKS       1oo%          1             1             1             1             1
EDU            1oo%          1             1             1             1             1
INFRA          1oo%          1             1             1             .909          .818
JETS           1oo%          1             1             1             1             .777
REGBANKS       .972          1             1             1             1             1
HOMEBLDG       .944          .944          .944          .888          .777          .722
GOLD           .943          .679          .603          .603          .622          .603
MORNSTAR       .911          .903          .899          .907          .907          .882
FINANCE        .903          .913          .924          .913          .892          .881
PIPELINE       .888          .888          .888          1             .777          1
UTILITY        .866          .8            .822          .8            .666          .711
NIFTY          .857          .885          .914          .914          .885          .885
AUTO           .85           .875          .875          .925          .95           .925
TRANSP         .85           .85           .85           .9            .85           .85
SP-100         .824          .793          .804          .804          .804          .814
INDMATER       .808          .818          .808          .848          .818          .797
REIT           .807          .755          .765          .75           .77           .807
COMODITY       .802          .661          .704          .647          .619          .633
DOWJONES       .8            .8            .8            .8            .8            .8
FOOD           .8            .733          .8            .4            .6            .6
INDEXES        .794          .777          .764          .768          .773          .777
INSURANC       .789          .815          .842          .868          .868          .868
RUS-1000       .786          .778          .76           .766          .747          .745
NASD-100       .784          .774          .784          .774          .795          .763
SP500          .784          .756          .752          .748          .739          .75
SEMI           .766          .8            .758          .791          .716          .7
ELECTRON       .752          .778          .731          .747          .701          .69
ETFS           .75           .794          .735          .72           .602          .558
SOFTWARE       .734          .734          .718          .75           .671          .64
OILGAS         .725          .712          .75           .756          .7            .737
CHEM           .718          .732          .718          .774          .774          .746
HOSPITAL       .714          .714          .714          .714          .428          .428
N=32
COMPUTER       .64           .68           .6            .6            .64           .6
GAMING         .633          .666          .6            .633          .566          .466
HACKERS        .611          .611          .555          .722          .555          .444
MILITARY       .6            .755          .666          .688          .688          .666
GREEN          .548          .58           .516          .548          .548          .516
BONDFUND       .531          .513          .432          .297          .261          .225
SOLAR          .526          .526          .421          .526          .368          .315
BIOTECH        .501          .599          .548          .552          .622          .603
RETAIL         .444          .425          .425          .407          .5            .425
CHINA          .4            .353          .261          .307          .292          .184
COAL           .333          .555          .444          .555          .444          .444
BEVERAGE       .3            .25           .25           .3            .3            .3
N=2
==========================================================================================================
1-13-2017
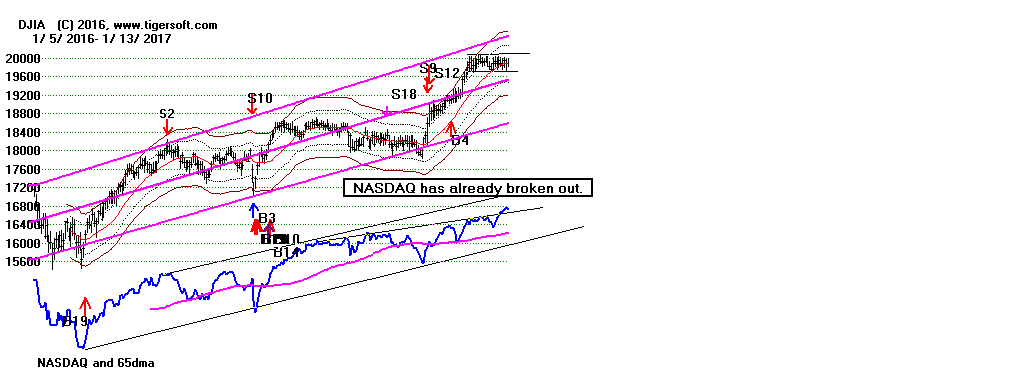
The current Peerless Buy B4 causes us to expect an
upside breakout by the DJI
above 20000 soon. Technology stocks in the QQQ and NASDAQ are
already pushing that
ETF into all-time high territory. This is certainly a bullish sign.
Speculative energies
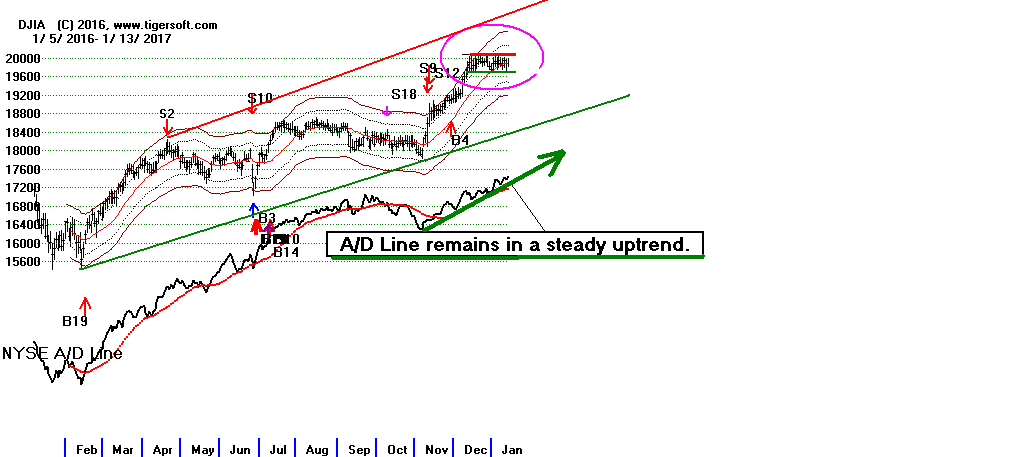
are on the increase. True - the DJI''s Accumulation Index is negative.
This mostly shows
the steady selling on rallies to 20000. But more important, I think, the NYSE
A/D Line is now making
new highs ahead of the DJI. As long as the A/D Line stays in its uptrend,
we have no choice
but to remain bullish.
I would think that a DJI breakout above 20000 to accompany Trump's Inauguration
will be a perfect way to get more investors into the stock market. This is
what
Wall Street wants. I can't believe all the money fueling the rally has had
as its purpose
just bringing the DJI up only to the all-too-obvious resistance at 20000.
The stage,
I still think, has been now set up for much higher prices.


The 1928 - Breakout-Take-Off
I have given some examples of narrow trading ranges near the yearly highs
and
have suggested that for the DJI breakout to be valid and likely lead to a big
advance,
we need to see a decisive breakout before the present horizontal range lasts
more
than 5 or 6 weeks. This is also what the authors of the "bible" of
"Technical Analysis
of Stock Trends" set forth. (
https://www.amazon.com/Technical-Analysis-Trends-Robert-Edwards/dp/0814408648
)
I have added the argument that we should be watching our TigerSoft IPA
Indicator.
This is the cumulative (daily) Tiger Accumulation Index, If the IPA starts
to weaken,
while the DJI is locked in its trading range, there is usually trouble ahead.
The best
examples of this that I showed were early 1962 and early 1966. On the
other hand
if the IPA starts to rise, expect an upside breakout, such as occurred early in
1987.
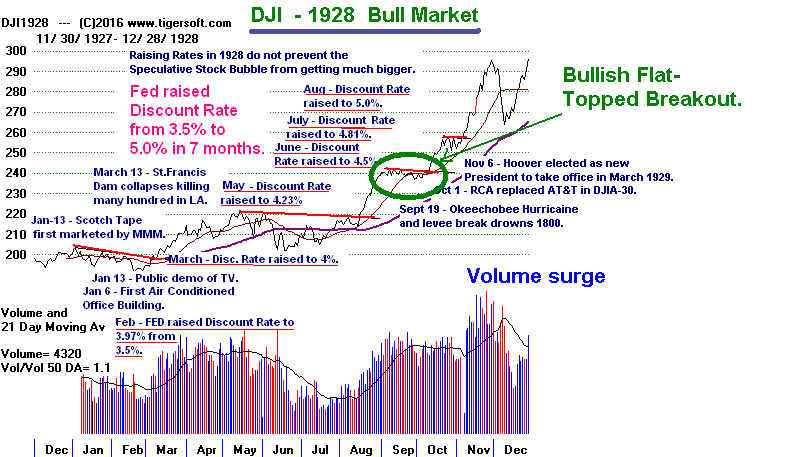
There is another historical parallel I should mention. Look back to the
DJI's narrow
5-week trading formation in September and October 1928. See what followed
an
an upside breakout back then. The price patterns then and now seem quite
similar.
In mid September, the Dow Jones' Corporation's increased the number of DJI
component
stocks from 20 to 30 and included for the first time of the hottest stock of the
1920s,
high-priced RCA. 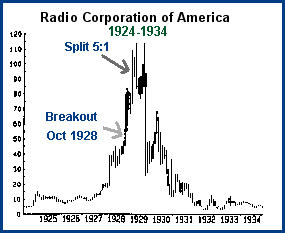
(
https://en.wikipedia.org/wiki/Historical_components_of_the_Dow_Jones_Industrial_Average
)
Even though, the market then was deemed highly speculative and over-priced
AND even
though the FED had raised rates several times in 1928, speculative market forces
propelled
the DJI much higher until early September 1929.
I am not suggesting the DJI is near a major top by showing the DJI chart of
1928. The current NYSE A/D Line is up-trending. At the top in 1929,
it had been
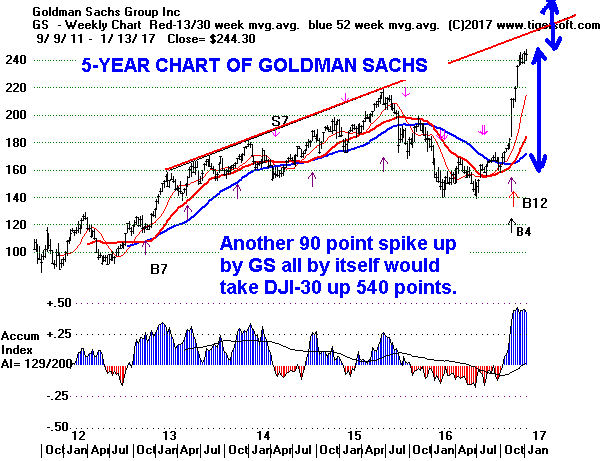
declining for months. RCA had been booming for years. Goldman Sachs
could
be in the early stages of a bull market.
 .
.
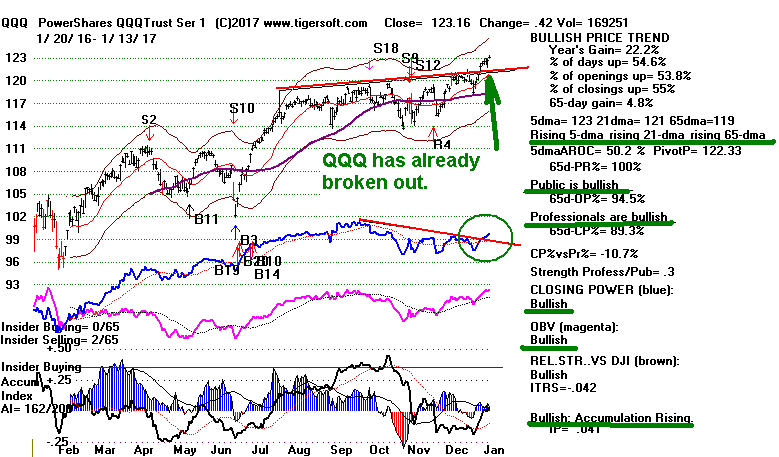
QQQ is already running in all-time high territory ahead
of DJI. It rates
buying in here.
To Tiger/Peerless Charts:
1/13/17:
PEERLESS
DJI, Signals, Indicators DJI-13
Hourly DJIA
S&P
OEX
NYSE
NASDAQ
COMPQX with Closing Power
DIA
QQQ SPY
IWM
Short-Term Rates
DJI-Utilities DJI-Transp
A/D Line-6000 Stocks
Crude Oil
FAS
GLD IBB
JETS JNUG
NUGT RSX
SLV SOXL
TECL YINN
AAPL, AMZN,
FB, GOOG,
GS MSFT
Bullish MAXCP Stocks
Bearish MINCP Stocks.
 RANKING OF KEY DIRECTORIES BASED PCT.OF STOCKS ABOVE 65-DMA
              1/13/17
---------------------------------------------------------------------------------------
Directory     Current       day-1         day-2         day-3         day-4         day-5
----------------------------------------------------------------------------------------
BIGBANKS       100%          1             1             1             1             1
EDU            100%          1             1             1             1             1
INFRA          100%          1             1             .909          .818          .909
JETS           100%          1             1             1             .888          .888
REGBANKS       100%          1             1             1             1             1
HOMEBLDG       .944          .944          .888          .777          .722          .833
FINANCE        .913          .924          .913          .892          .881          .913
MORNSTAR       .903          .899          .907          .907          .886          .907
PIPELINE       .888          .888          1             .777          1             1
NIFTY          .885          .914          .914          .885          .885          .914
AUTO           .875          .875          .925          .95           .925          .975
TRANSP         .85           .85           .9            .85           .85           .9
UTILITY        .85           .85           .9            .85           .85           .9
INDMATER       .818          .808          .848          .818          .808          .838
INSURANC       .815          .842          .868          .868          .868          .894
DOWJONES       .8            .8            .8            .8            .8            .866
SEMI           .8            .758          .791          .716          .7            .683
ETFS           .794          .735          .72           .602          .544          .514
SP-100         .793          .804          .804          .804          .814          .835
ELECTRON       .778          .731          .747          .701          .69           .67
RUS-1000       .778          .76           .766          .747          .748          .792
INDEXES        .777          .764          .768          .773          .773          .773
NASD-100       .774          .784          .774          .795          .763          .763
SP500          .756          .752          .748          .739          .752          .797
MILITARY       .755          .666          .688          .688          .666          .755
REIT           .755          .765          .75           .77           .802          .906
SOFTWARE       .734          .718          .75           .671          .625          .687
FOOD           .733          .8            .4            .6            .6            .6
CHEM           .732          .718          .774          .774          .746          .788
HOSPITAL       .714          .714          .714          .428          .428          .428
OILGAS         .712          .75           .756          .7            .731          .837
COMPUTER       .68           .6            .6            .64           .6            .6
GOLD           .679          .603          .603          .622          .603          .528
N=31
GAMING         .666          .6            .633          .566          .466          .566
COMODITY       .661          .704          .647          .619          .633          .619
HACKERS        .611          .555          .722          .555          .444          .5
BIOTECH        .599          .548          .556          .622          .599          .587
GREEN          .58           .516          .548          .548          .516          .58
COAL           .555          .444          .555          .444          .444          .555
SOLAR          .526          .421          .526          .368          .315          .315
BONDFUND       .513          .432          .297          .261          .207          .162
RETAIL         .425          .425          .407          .5            .425          .444
CHINA          .353          .261          .307          .292          .2            .215
BEVERAGE       .25           .25           .3            .3            .3            .55
N=1
=========================================================================================================
1-12-2017 High
Diving Board Top?
Or Flat Topped "Box" Pattern
Beckoning for A Breakout.
The current Peerless Buy B4 gives us hope for an
upside breakout by the DJI
above 20000. But what had looked like a flat-topped rectangle formation
that
usually brings a steep vertical ascent on a breakout to new highs is starting to
look like a bearish "high diving board". The longer the DJI remains in a
price
formation, the more the market will resemble the DJI's price action before
Hitler's
army attacked France in 1940 and JFK attacked US Steel in 1962.
(For details of second case, see
http://www.tigersoft.com/Tiger-Blogs/7-22-2007/ )
Both of these cases brought steep sell-offs. Both showed falling IPAs and
narrow
and trading ranges that lasted more than 6 months. Another parallel: Trump
is nothing
if he is not bellicose and seems always ready to get into a fight. So,
these two earlier
parallels stand out.
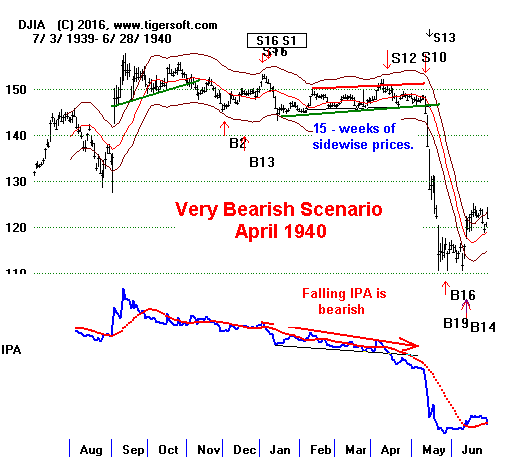
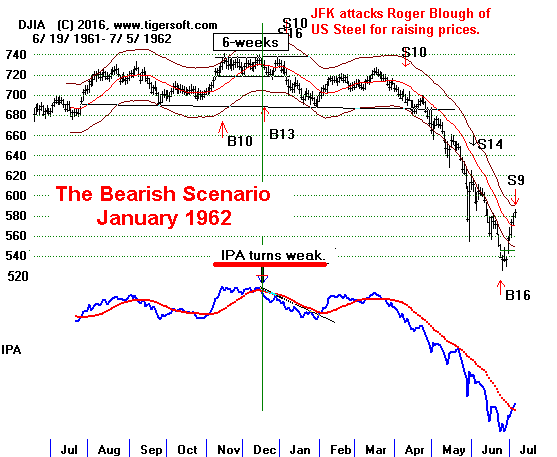
However, the good news is that the market may
decide to ignore Trump's words and
enjoy his actions, which should bring lower taxes, fewer regulations and minimal
numbers of prosecutions of corporations and Wall Street for fraud,
malfeasance
and misrepresentation. Thus, the DJI turned around from what was almost a
175 point
early decline (presumably to accommodate the many Trump-haters out there) and
fell only modestly. This caused our IPA
Indicator to turn up and rise above its 21-dma.
The IPA's rise now is particularly important, for it is this indicator more than
any
other that showed the market's internal weakness in 1940 and 1961-1962 before
the big sell-offs of those years.
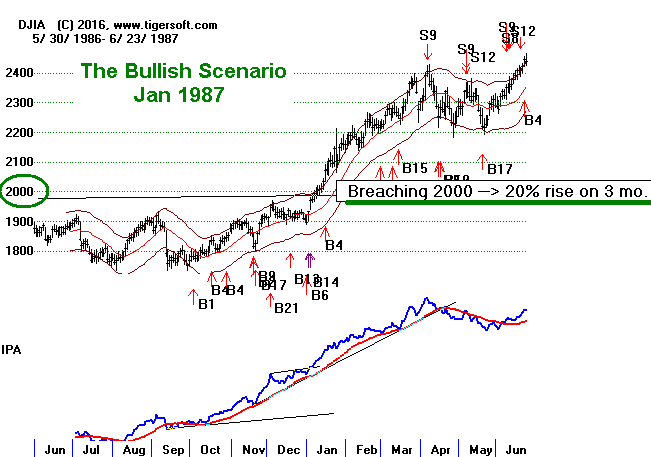
So, maybe, just maybe, Wall Street will soon breakout upwards and start a
delayed January
take-off, perhaps like the one in January 1987. See its chart below.
See how the
IPA Indicator turned up on the breakout. In our case, we may yet see red
Distribution turn
into re-Accumulation along with a DJI take-off to the upside. Let's give
the market more
chance to achieve a price breakout to confound Trump's detractors and bring the
masses
back into the market.
Time Is Running Out for A Breakout
I still believe that we can give the DJI another week to
breakout of its narrow and
flat rectangle price pattern. But "box" patterns are not
supposed to last more
than six weeks. If it takes longer than that, especially
with weakening
Accumulation
as measured by our cumulative Intra-Day Volume IPA indicator,
then the odds shift
to a decline to the lower band and the support also of the
65-dma.
I cannot help but see parallels between the DJI's chart
now with
a high diving board. A little bounce up for a short-lived breakout would
by this scenario be followed by a steep dive. Supporting this expected
scenario are
the many past DJI cases shown yesterday here
where the DJI went narrowly sidewise
in a bull market with the Tiger IPA Indicator falling and then sold off to the
lower
band.
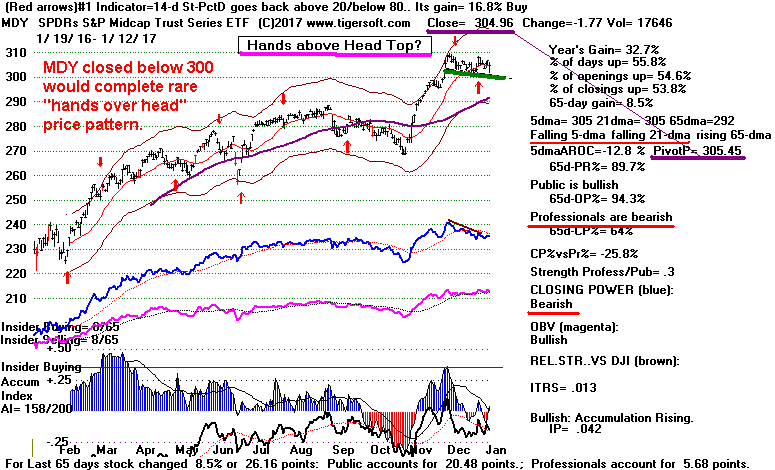
Another point: the MDY shows a bearish-looking "Hands above the Head
Pattern".
This is not a good omen. These only appear when speculation has become
dangerously excessive.
Hedging is recommended while we wait for either
breakdowns below
recent support or an upside DJI breakout confirmed by breadth and
a rising Closing Powers for ours key ETFs.
When the DJI and the broader market is confined to a trading range, it usually
pays
to buy the most bullish looking MAXCPs and sell short the weakest MINCPs.
See
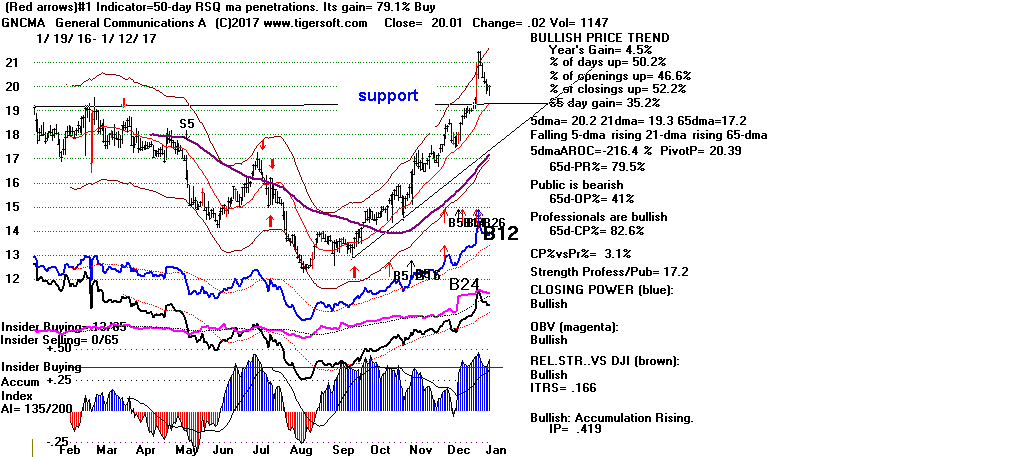
their charts below. Also consider buying GNCMA (chart shown below).
Long distance
carriers are now the best performing Morningside group since the
Presidential
Election.
To Tiger/Peerless Charts:
1/12/17:
PEERLESS
DJI, Signals, Indicators DJI-13
Hourly DJIA
S&P
OEX
NYSE
NASDAQ
COMPQX with Closing Power
DIA
QQQ SPY
IWM
Short-Term Rates
DJI-Utilities DJI-Transp
A/D Line-6000 Stocks
Crude Oil
FAS
GLD IBB
JETS JNUG
NUGT RSX
SLV SOXL
TECL YINN
AAPL, AMZN,
FB, GOOG,
GS MSFT
RANKING OF
MORNINGSIDE SECTORS FOR PCT. GAIN
SINCE TRUMP WON PRESIDENTIAL ELECTION
Strongest performing group was "Long Distance
Carriers", up 41%
compared with second-best, up 31% - Pacific NW Regional Banks.
The best performing stock in the long distance carriers is an Alaskan Cable
company,
GNCMA. In chart below see how its recent Buy B12 and nice pullback support
now to support.
1/12/17:
Bullish MAXCP Stocks (shown below)
1/12/17:
Bearsh MAXCP Stocks (shown below)
 RANKING OF KEY DIRECTORIES BASED PCT.OF STOCKS ABOVE 65-DMAa

              1/12/17
---------------------------------------------------------------------------------------
Directory     Current       day-1         day-2         day-3         day-4         day-5
----------------------------------------------------------------------------------------
BIGBANKS       1             1             1             1             1             1
EDU            1             1             1             1             1             1
INFRA          1             1             .909          .818          .909          .909
JETS           1             1             1             .888          .888          .888
REGBANKS       1             1             1             1             1             .972
HOMEBLDG       .944          .888          .777          .722          .833          .833
FINANCE        .924          .913          .892          .881          .903          .881
NIFTY          .914          .914          .885          .885          .914          .8
MORNSTAR       .899          .907          .907          .886          .907          .928
PIPELINE       .888          1             .777          1             1             1
AUTO           .875          .925          .95           .925          .975          .95
TRANSP         .85           .9            .85           .85           .9            .85
INSURANC       .842          .868          .868          .868          .868          .894
UTILITY        .822          .8            .666          .711          .777          .777
INDMATER       .808          .848          .818          .808          .828          .848
SP-100         .804          .804          .804          .814          .835          .824
DOWJONES       .8            .8            .8            .8            .866          .866
FOOD           .8            .4            .6            .6            .533          .4
NASD-100       .784          .774          .795          .763          .763          .763
REIT           .765          .75           .77           .802          .885          .916
INDEXES        .764          .768          .773          .773          .773          .794
RUS-1000       .76           .766          .747          .748          .781          .791
SEMI           .758          .791          .716          .7            .683          .658
SP500          .752          .748          .739          .752          .79           .782
OILGAS         .75           .756          .7            .731          .831          .843
ETFS           .735          .72           .602          .544          .514          .588
ELECTRON       .731          .747          .701          .69           .664          .659
CHEM           .718          .774          .774          .746          .788          .802
SOFTWARE       .718          .75           .671          .625          .671          .687
HOSPITAL       .714          .714          .428          .428          .428          .428
COMODITY       .704          .647          .619          .633          .633          .661
N=31
MILITARY       .666          .688          .688          .666          .755          .755
GOLD           .603          .603          .622          .603          .528          .716
COMPUTER       .6            .6            .64           .6            .6            .64
GAMING         .6            .633          .566          .466          .566          .6
HACKERS        .555          .722          .555          .444          .444          .444
BIOTECH        .549          .556          .627          .603          .572          .556
GREEN          .516          .548          .548          .516          .58           .612
COAL           .444          .555          .444          .444          .555          .555
BONDFUND       .432          .297          .261          .207          .144          .153
RETAIL         .425          .407          .5            .425          .444          .444
SOLAR          .421          .526          .368          .315          .315          .315
CHINA          .261          .307          .292          .2            .215          .215
BEVERAGE       .25           .3            .3            .3            .55           .6
N=2
=========================================================================================================
1-11-2017
Please
read about the "high diving board" danger if we do not get a breakout in
in the next week or if the DJI instead breaks down out of its rectangle
pattern.
High Diving
Board?
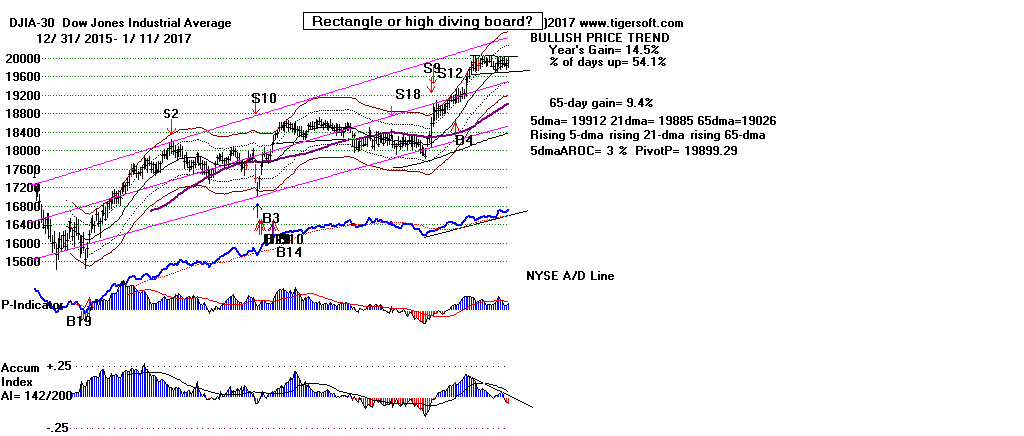

High Diving Board Top?
Or Flat Topped "Box" Pattern
Beckoning for A Breakout.
We can give the DJI only as much as 5 weeks to
breakout of its narrow and
flat rectangle price pattern. As we've been in the "box" pattern almost a
month,
time is running out for a breakout to the upside.
If it takes longer than that, especially
with weakening
Accumulation as measured
by our cumulative Intra-Day Volume IPA indicator,
then the odds shift to a decline
to the lower band and the support also of the
65-dma.
Flat tops do beckon for a breakout, but at some point there resistance looks too
imposing. We see how a flat resistance in a narrow trading range loses its
bullishness
after 4 or 5 weeks. In the present case, the DJI hit its peak on December
13th with
a hypothetical high of around 20060 and it hits low in the current pattern the
next
day at 19696.24. Since then, these two levels have confined the DJI.
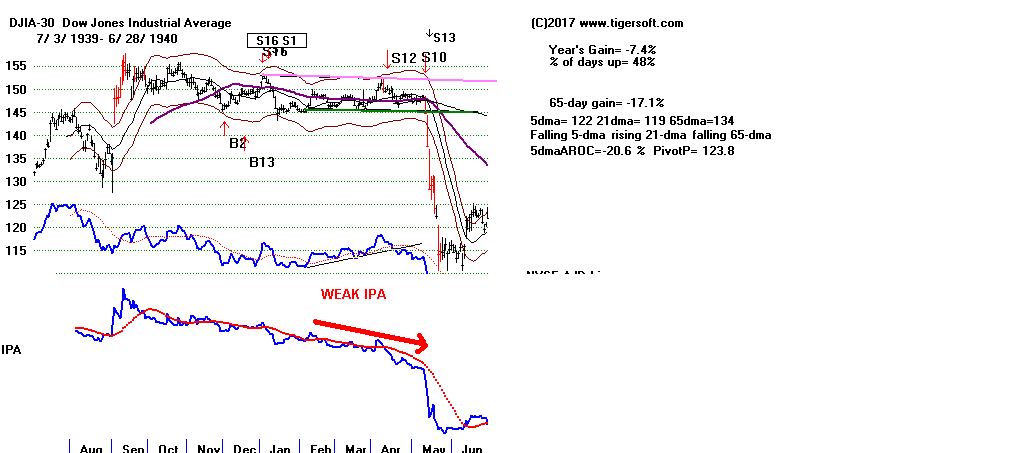
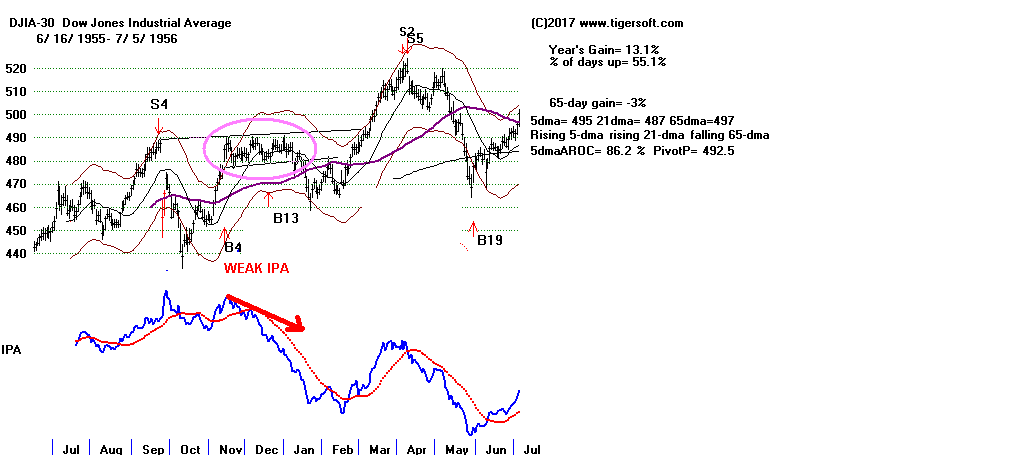
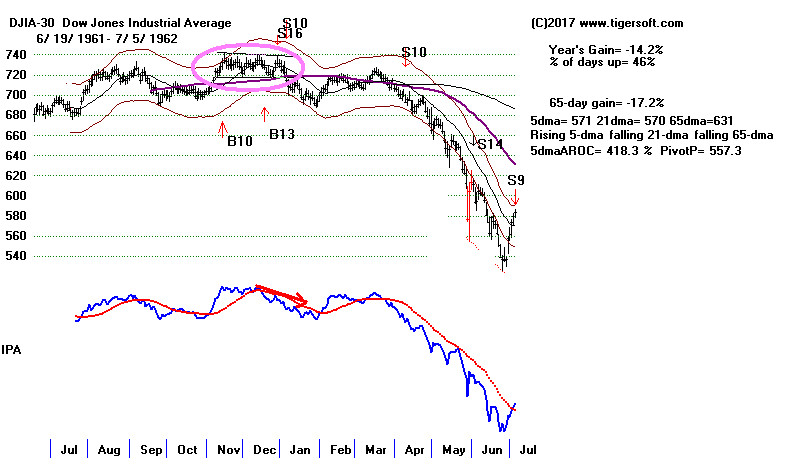
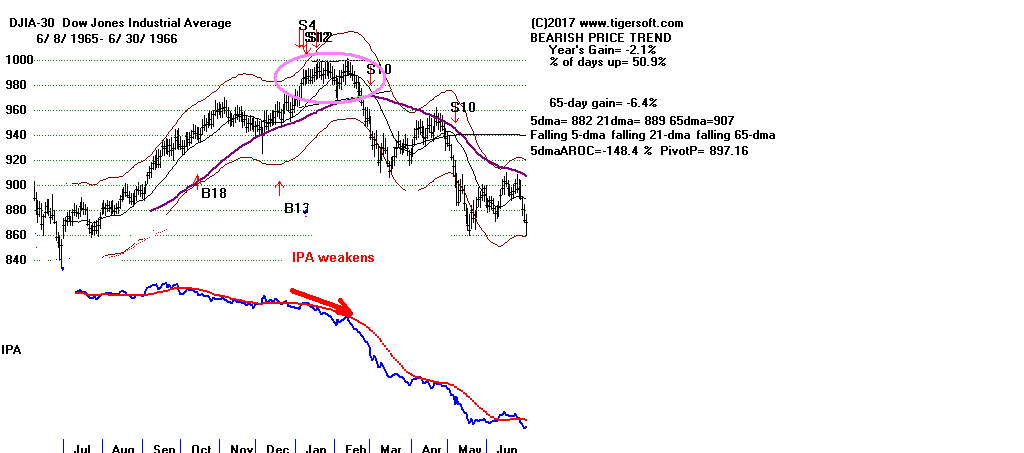
Consider the past cases where such flat topped patterns developed over 5
or more
weeks with a falling IPA. See the below past charts of these longer flat
topped DJI
rectangles in a rising market that are also showing falling daily IPA
readings.
Pattern
Breakout/Breakdown Outcome
-------------------------------------------------------------
May 1940 Down sharply
Jan 1956 Down
Jan 1962 Down sharply
June 1963 Down
Nov 1964 Down
Feb 1966 Down Sharply
July 1968 Down
April 1983 Up
Jan 1987 Up
Oct 2012 Down
Aug 2013 Down
July 2015 Down
May 1940 Down sharply
 |
Jan 1956 Down
 |
Jan 1962 Down
sharply
 |
Feb 1966 Down
Sharply
 |
To Tiger/Peerless Charts:
1/11/17:
PEERLESS
DJI, Signals, Indicators DJI-13
Hourly DJIA
S&P
OEX
NYSE
NASDAQ
COMPQX with Closing Power
DIA
QQQ SPY
IWM
M
Short-Term Rates
DJI-Utilities DJI-Transp
A/D Line-6000 Stocks
GLD IBB
JETS JNUG
NUGT SOXL
TECL
FAS SOXL
Crude Oil YINN
AAPL, AMZN,
FB, GOOG,
GS MSFT
1/11/17:
Bullish MAXCP Stocks (shown below)
Bullish
MAXCP Stocks (shown below)
 RANKING OF KEY DIRECTORIES BASED PCT.OF STOCKS ABOVE 65-DMA
              1/11/17
---------------------------------------------------------------------------------------
Directory     Current       day-1         day-2         day-3         day-4         day-5
----------------------------------------------------------------------------------------
BIGBANKS       100%           1             1             1             1             1
EDU            100%           1             1             1             1             .875
INFRA          100%          .909          .818          .909          .909          .909
JETS           100%          1             .888          .888          .888          .888
PIPELINE       100%          .777          1             1             1             1
REGBANKS       100%          1             1             1             .972          1
AUTO           .925          .95           .925          .975          .95           .975
NIFTY          .914          .885          .885          .914          .828          .742
FINANCE        .913          .892          .881          .903          .881          .903
MORNSTAR       .907          .907          .886          .907          .928          .911
TRANSP         .9            .85           .85           .9            .85           .9
HOMEBLDG       .888          .777          .722          .833          .833          .888
INSURANC       .868          .868          .868          .868          .894          .894
INDMATER       .848          .818          .808          .828          .848          .828
SP-100         .804          .804          .814          .835          .824          .793
DOWJONES       .8            .8            .8            .866          .866          .833
UTILITY        .8            .666          .711          .777          .777          .711
SEMI           .791          .716          .7            .683          .658          .658
CHEM           .774          .774          .746          .788          .802          .816
NASD-100       .774          .795          .763          .763          .752          .698
INDEXES        .765          .769          .769          .769          .79           .753
RUS-1000       .765          .745          .747          .78           .786          .784
OILGAS         .756          .7            .731          .831          .843          .806
REIT           .75           .77           .802          .885          .901          .89
SP500          .748          .739          .752          .79           .778          .775
ELECTRON       .747          .701          .69           .664          .659          .649
SOFTWARE       .746          .666          .619          .666          .682          .603
HACKERS        .722          .555          .444          .444          .444          .277
ETFS           .72           .602          .544          .514          .573          .455
HOSPITAL       .714          .428          .428          .428          .428          .428
MILITARY       .688          .688          .666          .755          .755          .8
N=31 (rising)
COMODITY       .647          .619          .633          .633          .661          .605
GAMING         .633          .566          .466          .566          .6            .6
GOLD           .603          .622          .603          .528          .716          .415
COMPUTER       .6            .64           .6            .6            .64           .68
SOLAR          .562          .375          .312          .312          .312          .375
BIOTECH        .556          .626          .603          .568          .54           .552
COAL           .555          .444          .444          .555          .555          .555
GREEN          .548          .548          .516          .58           .612          .645
RETAIL         .407          .5            .425          .444          .462          .574
FOOD           .4            .6            .6            .533          .4            .533
CHINA          .307          .292          .2            .215          .215          .169
BEVERAGE       .3            .3            .3            .55           .6            .65
BONDFUND       .297          .261          .207          .144          .144          .108
N=3
---------------------------------------------------------------------------------------------------------------------------------------------------------------
1-10-2017
The Peerless Buy B4 still calls for more new highs and
the DJI's flat top at
20000 still looks like it will be broken above. But time
may be running out if one
follows the time-table in which a top occurs in the days just before
Presidential Inauguration.
A lot of Professionals seem to be waiting to see how Trump handles himself
in his first
full-scale news conference since being elected. Will he fire up the
partisans and non-believers
or will he scare investors by being irrational or bellicose? A lot depends
on how the new
President handles himself.
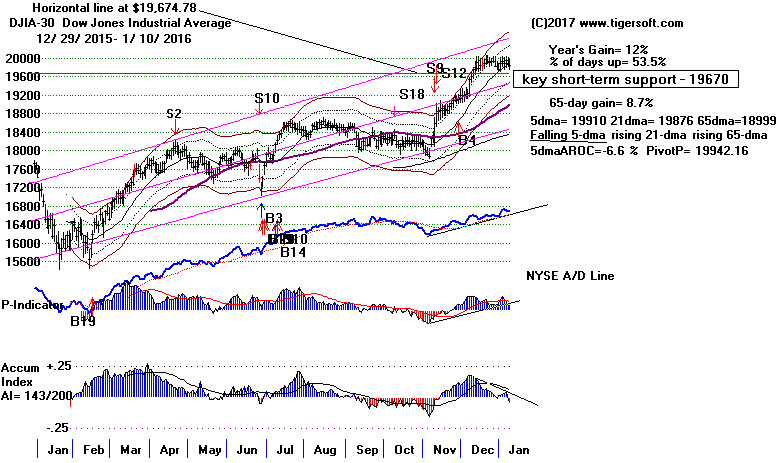
Bullish Pre-Inaugural Bullishness
When we look only at Presidential Election years since 1968 we see a bullish
seasonal period lies ahead for various numbers of trading days following January
10th.
Of course, there are only 12 cases and this is probably too small to rely on.
But it
does suggest we should not yet be sellers..
3 days out 5-days out 10-days out
21-days out
----------- ----------- ------------
------------
Pct of times up
66.7% 70.8%
66.7% 79.2%
Average DJI Gain 0.8%
+1.0% +1.0%
+1.9%
20,000 is clearly inviting some steady selling each time it is approached.
This might
be expected from such a round number. But it seems too obvious a
resistance-level
to become a significant top. As long as the NYSE breadth is good and the
DJI does
does not jump too quickly up to the 2% band or higher, Peerless cannot give a
Sell.
And as long as the DJI does not breakdown from its "box" pattern and thereby
cause a drop to the next support downward, the 65-day ma, I think we will see
the DJI grab some splashy headlines by closing above 20,000 just as Trump is
inaugurated.
Note today that there were 849 more up than down on the NYSE, The
NYSE A/D Line
remains in an uptrend. Only 19 stocks made new 52-week new lows compared
with
95 that made new highs. 27 of our stock groups show more than 2/3 of their
component
stocks above the 65-dma. Only 3 groups show the reverse.
It's true that Professionals are more cautious. We show 93 MAXCP stocks
(where the Closing Power is making a new 52-week high) and now 41 MINCP stocks
(where the Closing Power is making a new 52-week low). And it's true that
the
Closing Power for DIA is down-trending and
below its 21-day. But that Closing Power
will very likely turn up sharply if the DJI does shoot up past 2000.
Professional cautiousness is still also very evident in the Closing Powers for
SPY.
MDY, IWM
and even FAS. I think that
Professionals are wary about how Trump will
handle himself in his first full-scale press conference of the year.
Perhaps, it will fire up the
partisans and cause a life-off. Or, perhaps Trump will gaffe badly or say
something
so bellicose it will cause a war scare. Watch it. For now, it's not
surprising the market is
on hold in here just below the round number 20,000.
Instead of buying on a Flat-Top Breakout by DIA or on a pullback to its 65-dma,
consider buying some of the stocks just crossing back above their 65-dma that
also show
an extremely bullish Closing Power divergence from price (Augmented S7 or
CP%-Pr%>.37).
We offer no list of such stocks each night, but they can easily be found by
running the Power Ranker
against the NEAR65 group of stocks and then examining the most "bullish" ones
(#12) ones
or those with Closing Power new highs (#23). Click here to see the current
list. I suggest
having the computer show the purple "augmented B7s" by choosing the first item
under
Signals(3). The Buy B7s should only be acted on when prices get above the
65-dma and
the Accum. Index is positive.
Augmented B7s (Very Bullish Closing
Power Divergence from Price.)
The opposites, Augmented Sell S7s are a group we provide data for each night.
Here we
would act on these S7s only when the stock falls below the 65-dma with (red)
Distribution.
All these will show purple Sell S7s currently. Use the Power Ranker
against them.
Look for additional bearish signs, especially well-tested support about to be
broken.
Augmented Sell S7s (Very Bearish
Closing Power Divergence from Price.)
To Tiger/Peerless Charts:
1/10/17:
Peerless
DJIA and A/D Line
DJI-OBVPCT
Hourly DJIA
S&P
OEX
NYSE
NASDAQ
DIA
QQQ SPY
IWM
Short-Term Rates
DJI-Utilities
REITS
A/D Line-6000 Stocks
SOXL TECL
FAS
Crude Oil
1/10/17:
Bullish MAXCPs -
Bearish MINCPs
- Very few specimens here. Notice absence
of Bonds.
Augmented Sell S7s (Very Bearish
Closing Power Divergence from Price.)
Augmented B7s (Very Bullish Closing
Power Divergence from Price.)
1/10/17:
Bank Stocks - DB (Deutsche
Bank), WFC (Wells Fargo), GS
(Goldman Sachs),
FAS,
Super Stock -
NVDA (Rebounding up from rising
21-dma...)
Stocks:
AAPL, BIDU,
IBM, TXN,
AMZN, CAT, FB,
GOOG, JPM,
MSFT,
TXN
ETFS:
BBH, BRZU,
DIA, DUST,
FAS, GASL,
GLD, IWM,
JETS,
JNUG, KOL, MDY,
NUGT, OIH, OIL,
RETL,
RSX, SLV,
SOXL, TECL,
TMF, TNA,
UGAZ, UPW,
VGK, YINN
RANKING OF KEY DIRECTORIES BASED PCT.OF STOCKS ABOVE 65-DMA
              1/10/17
---------------------------------------------------------------------------------------
Directory     Current       day-1         day-2         day-3         day-4         day-5
----------------------------------------------------------------------------------------
BIGBANKS       100%          1             1             1             1             1
EDU            100%          1             1             1             .875          1
JETS           100%          .888          .888          .888          .888          .888
REGBANKS       100%          1             1             .972          1             1
AUTO           .95           .925          .975          .95           .975          .925
INFRA          .909          .818          .909          .909          .909          .909
MORNSTAR       .907          .886          .907          .928          .911          .844
FINANCE        .892          .881          .903          .881          .903          .881
NIFTY          .885          .885          .914          .828          .771          .685
INSURANC       .868          .868          .868          .894          .894          .894
TRANSP         .85           .85           .9            .85           .9            .9
INDMATER       .818          .808          .828          .848          .828          .747
SP-100         .804          .814          .835          .824          .793          .773
DOWJONES       .8            .8            .866          .866          .833          .866
NASD-100       .795          .763          .763          .752          .709          .612
HOMEBLDG       .777          .722          .833          .833          .888          .833
PIPELINE       .777          1             1             1             1             .888
CHEM           .774          .746          .788          .802          .816          .774
REIT           .77           .802          .885          .901          .88           .765
INDEXES        .769          .769          .769          .79           .753          .719
RUS-1000       .745          .747          .78           .786          .781          .717
SP500          .739          .752          .79           .778          .778          .71
SEMI           .716          .7            .683          .658          .658          .641
ELECTRON       .701          .69           .664          .659          .649          .628
OILGAS         .7            .731          .831          .843          .806          .762
MILITARY       .688          .666          .755          .755          .8            .777
SOFTWARE       .671          .625          .671          .687          .609          .5
N=27, + 1 for day (>.666)
UTILITY        .666          .711          .777          .777          .711          .644
COMPUTER       .64           .6            .6            .64           .68           .68
BIOTECH        .626          .603          .571          .54           .54           .431
GOLD           .622          .603          .528          .716          .396          .339
COMODITY       .619          .633          .633          .661          .605          .507
ETFS           .602          .544          .514          .573          .455          .382
FOOD           .6            .6            .533          .4            .533          .2
(Quick recovery)
GAMING         .566          .466          .566          .6            .6            .566
HACKERS        .555          .444          .444          .444          .277          .277
(Quick recovery)
GREEN          .548          .516          .58           .612          .645          .612
RETAIL         .5            .425          .444          .462          .574          .555
COAL           .444          .444          .555          .555          .555          .444
HOSPITAL       .428          .428          .428          .428          .428          .285
SOLAR          .368          .315          .315          .315          .368          .315
BEVERAGE       .3            .3            .55           .6            .65           .5
CHINA          .292          .2            .215          .215          .169          .153
BONDFUND       .261          .207          .144          .144          .099          .09
N=3
=========================================================================================================
1-9-2017
The Peerless Buy B4 still calls for more new highs and
the DJI's flat top at
20000 still looks like it will be broken above.
(Hotline had to be abbreviated and emailed out due to server of tigersoft.com
going down for early AM. Below is Hotline that was emailed at 4:04 AM
PCT).
"Stick with the Buy B4 for all the reasons previously given.
As long as the DJI stays inside its current
box, approximately
20000 and 19600, the odds favor an upside breakout. Nicolas
Darvas, who wrote 2 books about these patterns, said simply
that within the price boxes, there are random movements
that mean very little.
"However, I would say that a breakdown below the bottom of
these box patterns for any ETFs showing them would call for
a decline to the 65-day ma.
"QQQ may be able to breakout more decisively
to boost the market.
But be careful of IWM,
MDY, JETS.
A rupture of their recent support
level looks more threatening because their patterns look
less rectangular and more like ordinary top patterns.
"I will complete the regular hotline on the
www.tigersoft.com
site later this early morning if I am able and will have to
set up another Hotline page tomorrow night on
www.tigersoftware.com
as a contingency against the server problems continuing."
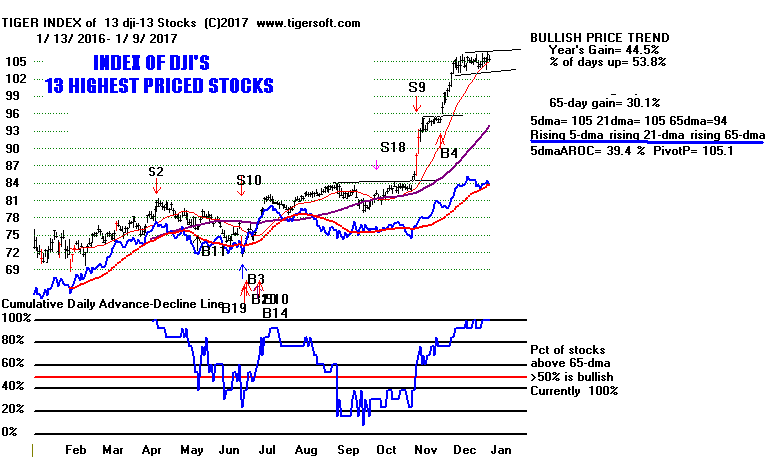
To Tiger/Peerless Charts:
1/9/17:
Peerless
DJIA and A/D Line
DJI-OBVPCT
Hourly DJIA
S&P
OEX
NYSE
NASDAQ
DIA
QQQ SPY
IWM
Short-Term Rates
DJI-Utilities
REITS
A/D Line-6000 Stocks
SOXL TECL
FAS
Crude Oil
1/9/17:
Bullish MAXCPs -
Bearish MINCPs
- Very few specimens here. Notice absence
of Bonds.
1/9/17:
Bank Stocks - DB (Deutsche
Bank), WFC (Wells Fargo), GS
(Goldman Sachs),
FAS,
Super Stock -
NVDA (still? - Profit taking as new
year begins...)
Stocks:
AAPL, BIDU,
IBM, TXN,
AMZN, CAT, FB,
GOOG, JPM,
MSFT,
TXN
ETFS:
BBH, BRZU,
DIA, DUST,
FAS, GASL,
GLD, IWM,
JETS,
JNUG, KOL, MDY,
NUGT, OIH, OIL,
RETL,
RSX, SLV,
SOXL, TECL,
TMF, TNA,
UGAZ, UPW,
VGK, YINN
RANKING OF KEY DIRECTORIES BASED PCT.OF STOCKS ABOVE 65-DMA
               1/9/17
---------------------------------------------------------------------------------------
Directory     Current       day-1         day-2         day-3         day-4         day-5
----------------------------------------------------------------------------------------
BIGBANKS       100           1             1             1             1             1
EDU            100           1             1             .875          1             1
PIPELINE       100           1             1             1             .888          .888
REGBANKS       100           1             .972          1             1             1
AUTO           .925          .975          .95           .975          .925          .825
JETS           .888          .888          .888          .888          .888          .777
MORNSTAR       .886          .907          .928          .911          .84           .777
NIFTY          .885          .914          .828          .771          .685          .685
FINANCE        .881          .903          .881          .903          .881          .817
INSURANC       .868          .868          .894          .894          .894          .921
TRANSP         .85           .9            .85           .9            .9            .9
INFRA          .818          .909          .909          .909          .909          .909
SP-100         .814          .835          .824          .793          .762          .68
INDMATER       .808          .828          .848          .828          .747          .666
REIT           .802          .885          .901          .88           .765          .718
DOWJONES       .8            .866          .866          .833          .866          .733
INDEXES        .769          .769          .79           .753          .702          .677
NASD-100       .765          .765          .755          .712          .606          .553
SP500          .752          .79           .778          .778          .708          .636
RUS-1000       .747          .78           .786          .781          .715          .661
CHEM           .746          .788          .802          .816          .774          .746
OILGAS         .731          .831          .843          .806          .762          .725
HOMEBLDG       .722          .833          .833          .888          .833          .833
UTILITY        .711          .777          .777          .711          .644          .666
SEMI           .7            .683          .658          .658          .65           .633
ELECTRON       .69           .664          .659          .649          .628          .639
N=26
MILITARY       .666          .755          .755          .8            .755          .688
COMODITY       .633          .633          .661          .605          .507          .492
SOFTWARE       .625          .671          .687          .609          .5            .437
BIOTECH        .603          .571          .54           .54           .42           .381
  (rising)
GOLD           .603          .528          .716          .396          .339          .245
COMPUTER       .6            .6            .64           .68           .6            .64
FOOD           .6            .533          .4            .533          .2            .133
 (rising)
ETFS           .544          .514          .573          .455          .367          .338
GREEN          .516          .58           .612          .645          .58           .58
GAMING         .466          .566          .6            .6            .566          .533
COAL           .444          .555          .555          .555          .444          .333
HACKERS        .444          .444          .444          .277          .222          .222
HOSPITAL       .428          .428          .428          .428          .285          .142
RETAIL         .425          .444          .462          .574          .555          .444
SOLAR          .315          .315          .315          .368          .315          .263
BEVERAGE       .3            .55           .6            .65           .45           .35
BONDFUND       .207          .144          .144          .099          .09           .063
CHINA          .2            .215          .215          .169          .153          .107
N=4
=========================================================================================================
1-6-2017
The Peerless Buy B4 still calls for more new highs and the DJI's flat top at
20000 still looks like it will be broken above. However, the advance will
have to
come from some new Trump stimulus. It will not come from the Santa Claus
and new year's buying effect. Those seasonal forces are now used up.
In fact,
seasonality now is slightly bearish. Since 1965, the DJI has risen only
42.9%
of the time over the 3 trading days following January 8th. Over the next
10 days,
it actually averages a slight loss of 0.4%. A little more backing and
filling
would actually be constructive.
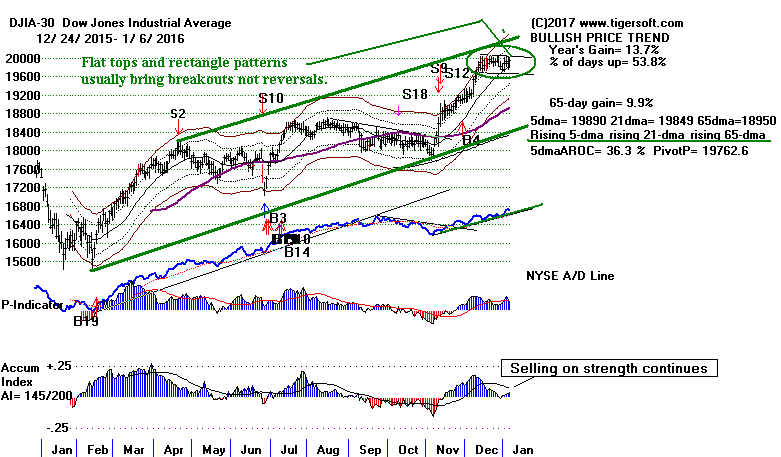
At this time, I think we must still consider Financials and Big Banks to still
offer the most trading opportunities. It is not clear yet that the Biotechs'
rebound
is much more than what happens when year-end tax-loss selling comes to an end.
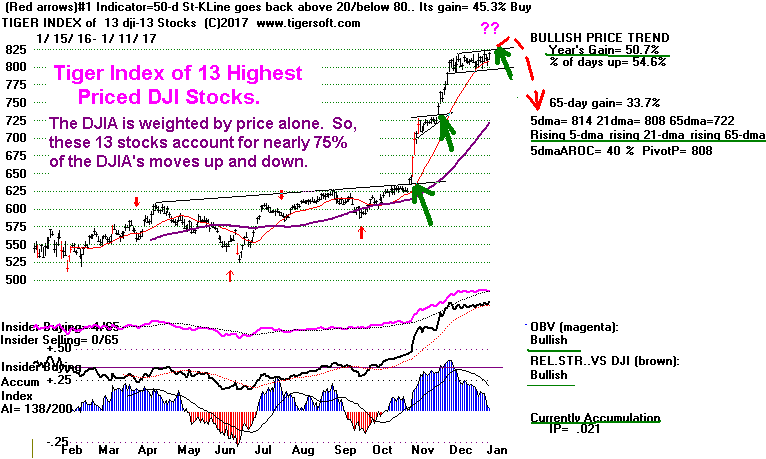
It will not take much of a rise in the 13 highest priced DJI stocks
to achieve a flat topped breakout in their Tiger Index. This would
very likely bring a DJI advance over 20000. That would create quite
a lot of media "buzz" and Trump partisan excitement.
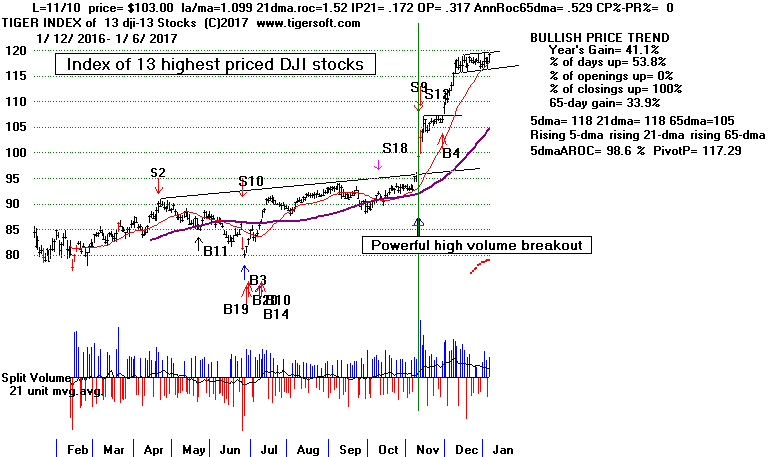
The Jobs' figure of 159,000 net new private jobs for December shows a weakening
but still growing economy. This is what the weakening Retail stocks have
been saying.
Consumer buying is not strong. Bulls have a right, I think, to
expect that this will
deter the FED from raising rates for a while. And this will help the
beaten down Bonds,
REITS, Golds.
GS will only need to rally 2.1 points to score a flat topped breakout.
As the highest priced DJI-30 stock, this could give that average enough
boost to surpass the much watched 20,000 round number resistance.
It should also send the 3x leveraged financials' ETF FAS up as well.
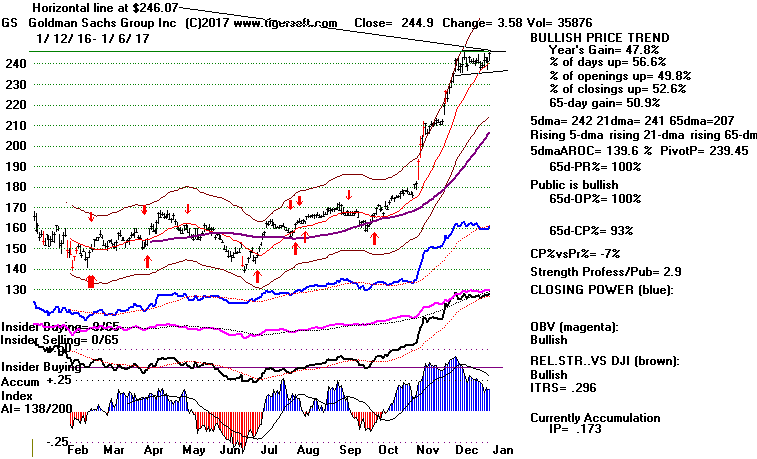
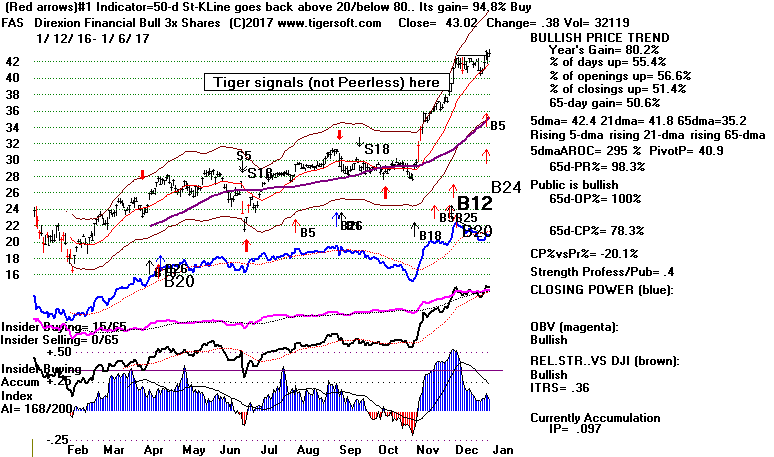
I have looked back to see if one day's negative breadth on a day when the DJI
rallies is bearish. The answer is only briefly since 2009. So, my
conclusion here
is to hold FAS because of its breakout and give the DJI a chance to run up past
20,000 to draw in new buyers. Let's watch QQQ, too. It is now
bullishly in all-time high
territory. A breakout by GS ought to send FAS up nicely. When the
market starts
to look a little tired, it is often a good idea for safety's sake to play the
very highest
Accumulation stocks (AI/200) of the 6000 that Tiger screens and places in the
download file
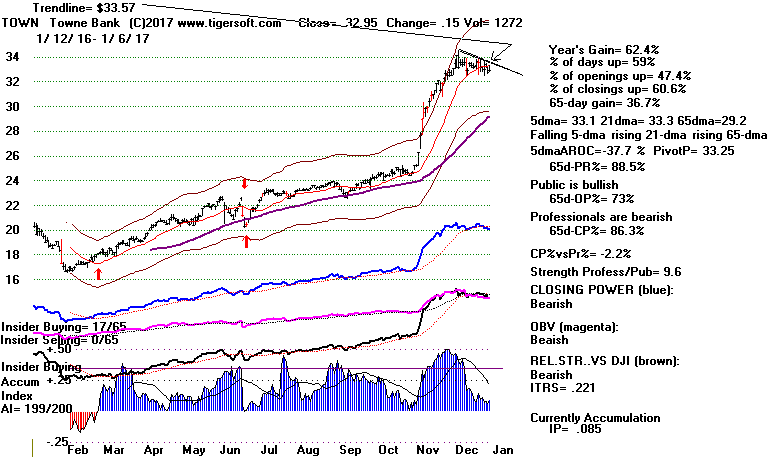
"ACCUMHOR". The best of these are shown below. TOWN is the only one
properly
positioned to be purchased, just below its 21-day ma. XOM, the highest
AI/200 stock
in the DJI is similarly positioned but its Closing Power is now falling.
AI/200 LA/MA
MNR 200
1.04
TOWN 199
.99
OCFC 196
1.04
Tiger/Peerless Charts:
1/6/17:
Peerless
DJIA and A/D Line
DJI-OBVPCT
Hourly DJIA
S&P
OEX
NYSE
NASDAQ
DIA
QQQ SPY
IWM
Short-Term Rates
DJI-Utilities
REITS
A/D Line-6000 Stocks
SOXL TECL
FAS
Crude Oil
1/6/17:
Bullish MAXCPs -
Bearish MINCPs
- Very few specimens here. Notice absence
of Bonds.
1/6/17:
Bank Stocks - DB (Deutsche
Bank), WFC (Wells Fargo), GS
(Goldman Sachs),
FAS,
Super Stock -
NVDA (still? - Profit taking as new
year begins...)
Stocks:
AAPL, BIDU,
IBM, TXN,
AMZN, CAT, FB,
GOOG, JPM,
MSFT,
TXN
ETFS:
BBH, BRZU,
DIA, DUST,
FAS, GASL,
GLD, IWM,
JETS,
JNUG, KOL, MDY,
NUGT, OIH, OIL,
RETL,
RSX, SLV,
SOXL, TECL,
TMF, TNA,
UGAZ, UPW,
VGK, YINN
 RANKING OF KEY DIRECTORIES BASED PCT.OF STOCKS ABOVE 65-DMA
               1/6/17
---------------------------------------------------------------------------------------
Directory     Current       day-1         day-2         day-3         day-4         day-5
----------------------------------------------------------------------------------------
BIGBANKS       100%          1             1             1             1             1
EDU            100%          1             .875          1             1             .875
PIPELINE       100%          1             1             .888          .777          .777
REGBANKS       100%          .972          1             1             1             1
AUTO           .975          .95           .975          .925          .85           .875
NIFTY          .914          .828          .771          .685          .685          .714
INFRA          .909          .909          .909          .909          .909          .909
MORNSTAR       .907          .928          .911          .84           .773          .785
FINANCE        .903          .881          .903          .881          .817          .838
TRANSP         .9            .85           .9            .9            .9            .9
JETS           .888          .888          .888          .888          .777          .777
REIT           .885          .901          .88           .765          .718          .656
INSURANC       .868          .894          .894          .894          .921          .921
DOWJONES       .866          .866          .833          .866          .733          .733
SP-100         .835          .824          .793          .762          .69           .742
HOMEBLDG       .833          .833          .888          .833          .833          .833
OILGAS         .831          .843          .806          .762          .718          .725
INDMATER       .828          .848          .828          .747          .686          .717
SP500          .79           .778          .778          .708          .642          .668
CHEM           .788          .802          .816          .774          .746          .76
RUS-1000       .78           .786          .781          .715          .664          .67
UTILITY        .777          .777          .711          .644          .644          .711
INDEXES        .774          .79           .753          .702          .677          .661
NASD-100       .763          .752          .709          .602          .559          .58
MILITARY       .755          .755          .8            .755          .711          .755
SEMI           .683          .658          .658          .65           .633          .633
SOFTWARE       .671          .687          .609          .5            .437          .5
N=27 still expanding!

ELECTRON       .664          .659          .649          .628          .644          .639
COMODITY       .633          .661          .605          .507          .492          .492
COMPUTER       .6            .64           .68           .6            .64           .68
GREEN          .58           .612          .645          .58           .58           .612
BIOTECH        .571          .54           .54           .42           .381          .389
GAMING         .566          .6            .6            .566          .533          .566
COAL           .555          .555          .555          .444          .444          .555
BEVERAGE       .55           .6            .65           .45           .35           .45
FOOD           .533          .4            .533          .2            .133          .133
GOLD           .528          .716          .396          .339          .245          .283
ETFS           .514          .573          .455          .367          .338          .338
HACKERS        .444          .444          .277          .222          .222          .277
RETAIL         .444          .462          .574          .555          .462          .537
HOSPITAL       .428          .428          .428          .285          .142          .142


SOLAR          .315          .315          .368          .315          .263          .263
CHINA          .215          .215          .169          .153          .107          .107
BONDFUND       .144          .144          .099          .09           .054          .054
===========================================================================================================
1-5-2017
The Peerless Buy B4 calls for more new highs.
The many index and ETF
flat tops beckon for breakouts. The A/D Lines are bullish for all the
important
general market indexes. While Professionals seem unwilling to induce price
breakouts, they may just be waiting to see what tomorrow's Job numbers are.
We have to be impressed that the DJI has not been below the 21-day ma since
November 4th.
Bulls need now to see, I think, a December Jobs Report between 150,000 and 210,000.
This would
be growth sufficient to cover the increase in population, but would
not itself be inflationary. On the other hand, Jobs' numbers
higher than 210,000
along with the higher oil prices and local minimum wage increases would give the
Hawks
plenty of ammunition to use to get another
rate hike soon. There is
another possibility, which seems unlikely; namely, that a Jobs' number will
come in much below 150,000. That would suggest a weakening
economy. It
would reinforce the sense that Main Street and Wall Street are living in two
different realms. This would further rattle Retail stocks. With the
market
having now risen nearly 8 years without more than a 17% correction, such low
numbers could cause another January decline, though not so deep as in 2009,
2014, 2015 and 2016.
Private New Jobs
in 1000s in US. |
| Year |
Jan |
Feb |
Mar |
Apr |
May |
Jun |
Jul |
Aug |
Sep |
Oct |
Nov |
Dec |
| 2006 |
278 |
316 |
281 |
183 |
23 |
82 |
207 |
181 |
158 |
4 |
208 |
171 |
| 2007 |
240 |
90 |
189 |
79 |
143 |
78 |
-33 |
-24 |
88 |
85 |
115 |
97 |
| 2008 |
19 |
-86 |
-78 |
-210 |
-185 |
-165 |
-209 |
-266 |
-452 |
-473 |
-769 |
-695 |
| 2009 |
-791 |
-703 |
-823 |
-686 |
-351 |
-470 |
-329 |
-212 |
-219 |
-200 |
-7 |
-279 |
| 2010 |
28 |
-69 |
163 |
243 |
522 |
-133 |
-70 |
-34 |
-52 |
257 |
123 |
88 |
| 2011 |
42 |
188 |
225 |
346 |
73 |
235 |
70 |
107 |
246 |
202 |
146 |
207 |
| 2012 |
338 |
257 |
239 |
75 |
115 |
87 |
143 |
190 |
181 |
132 |
149 |
243 |
| 2013 |
190 |
311 |
135 |
192 |
218 |
146 |
140 |
269 |
185 |
189 |
291 |
45 |
| 2014 |
187 |
168 |
272 |
310 |
213 |
306 |
232 |
218 |
286 |
200 |
331 |
292 |
| 2015 |
221 |
265 |
84 |
251 |
273 |
228 |
277 |
150 |
149 |
295 |
280 |
271 |
| 2016 |
168 |
233 |
186 |
144 |
24 |
271 |
252 |
176 |
208 |
142(P) |
178(P) |
|
| P : preliminary |
|
|
http://data.bls.gov/timeseries/CES0000000001?output_view=net_1mth
The DJIA-30 Looks Over-Extended Compared to the Other
Indexes.
Don't be alarmed. This is normal now, given how the DJI is weighted and
how the Leveraged ETFs' tails can wildly wag the Index dogs.
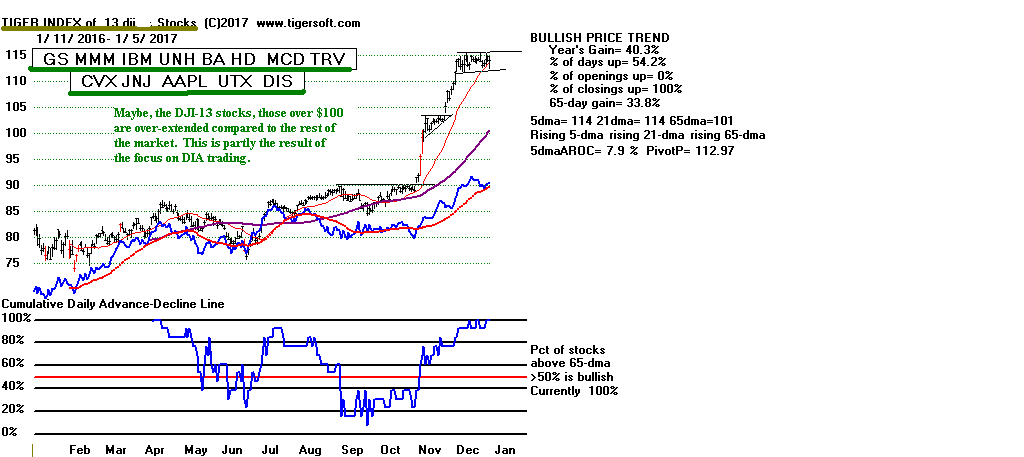
The 13 highest priced DJI stocks have produced 1479 of its splashy 2000 point
gain
since November 3rd, the day before the Election. This is caused by the
fact that
the DJIA is weighted solely by price. Even more distorted, just one of its
30
components, GS, accounts for 455 of the DJIA's Trump Rally's 2000 points.
That's
nearly 20%.
Of course, the way the DJI weights its winners most heavily in its computation
is not accidental. The DJIA-30 is a very important advertisement for Wall
Street.
It also gives traders who know this a big advantage. Some of them will
seek to buy into these
highest priced DJI stocks to rig a run-up so that they can sell all their stocks
to the
unsuspecting public. And as long as the high priced DJI stocks keep
rising, all is
well, the bull market looks solid and prices elsewhere rise, too.
My guess is that
renewed buying in the DJI-13 in a week or two will cause the DJI to briskly get
up above 20000 just before the Trump Inauguration. That will give traders
a
higher level where they can take some very nice profits selling to Republican
partisans.
But at some point, the traders will surely stop buying the DJI's "nifty" stocks.
If the
other indexes (which are volume and capitalization weighted) and their A/D Lines
then
start to sell-off, we may then be seeing a sign that that the "jig is up".
Fortunately, the A/D Lines
for the SP-500, NASDAQ-100 and Russell-1000 are in strong uptrends.
So the market
looks relatively safe.
But there is still short-term risk. If the traders who bought heavily into
the DJI's
high priced stocks, decide to dump them for some reason, such as a very weak
Jobs
number or a very high Jobs Number, then the DJI-30 could make a quick
decline back towards its 3.5% lower band. That would cause a shake-out
elsewhere.
So let's watch our DJI-13 in here to see if its recent support level holds. I
will post it
in the charts that are linked to just below.
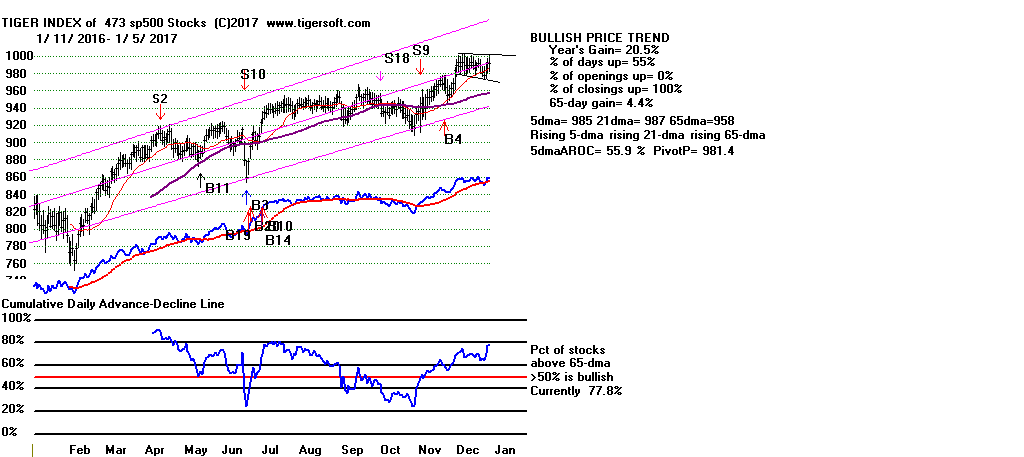
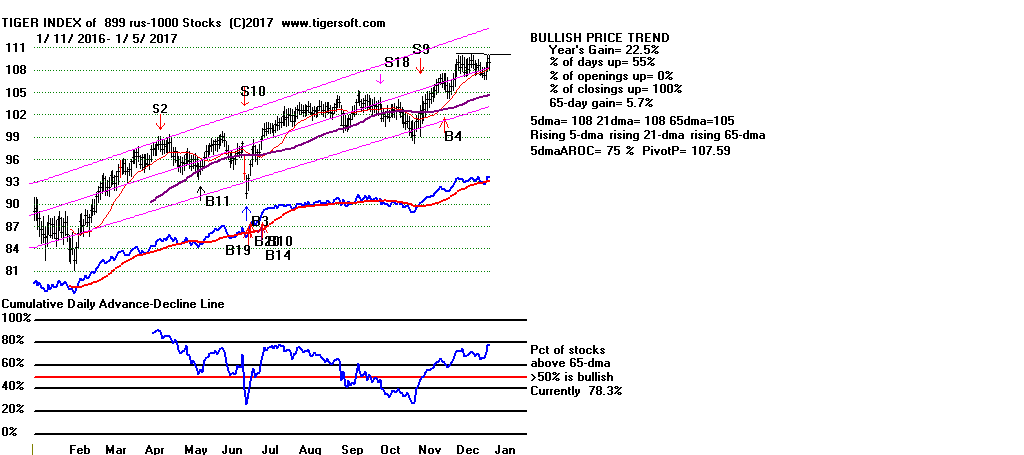
TIGER INDEXES:
SP-500, QQQ, RUSS-1000, DIA
(Weighted by avg price x avg trading volume)
Note that prices and their A/D Lines are all in bullish uptrends.
Their flat tops are bullish, too.
Tiger/Peerless Charts:
1/5/17:
Peerless
DJIA and A/D Line
DJI-OBVPCT
Hourly DJIA
S&P
OEX
NYSE
NASDAQ
DIA
QQQ SPY
IWM
Short-Term Rates
DJI-Utilities
REITS
A/D Line-6000 Stocks
SOXL TECL
FAS
Crude Oil
1/5/17:
Bullish MAXCPs -
Bearish MINCPs
- Very few specimens here. Notice absence
of Bonds.
1/5/17:
Bank Stocks - DB (Deutsche
Bank), WFC (Wells Fargo), GS
(Goldman Sachs),
FAS,
Super Stock -
NVDA (still? - Profit taking as new
year begins...)
Stocks:
AAPL, BIDU,
IBM, TXN,
AMZN, CAT, FB,
GOOG, JPM,
MSFT,
TXN
ETFS:
BBH, BRZU,
DIA, DUST,
FAS, GASL,
GLD, IWM,
JETS,
JNUG, KOL, MDY,
NUGT, OIH, OIL,
RETL,
RSX, SLV,
SOXL, TECL,
TMF, TNA,
UGAZ, UPW,
VGK, YINN
 RANKING OF KEY DIRECTORIES BASED PCT.OF STOCKS ABOVE 65-DMA
1/5/17
---------------------------------------------------------------------------------------
Directory     Current       day-1         day-2         day-3         day-4         day-5
----------------------------------------------------------------------------------------
BIGBANKS       100%          1             1             1             1             1
PIPELINE       100%          1             .9            .8            .7            .8
MORNSTAR       .928          .911          .84           .773          .785          .777
AUTO           .926          .951          .902          .829          .853          .878
REGBANKS       .923          .948          .923          .948          .948          .948
INFRA          .909          .909          .909          .909          .909          .909
JETS           .909          .909          .909          .818          .818          .818
INSURANC       .894          .894          .894          .921          .921          .921
EDU            .888          .777          .888          .888          .777          .777
FINANCE        .881          .903          .881          .817          .838          .827
REIT           .875          .855          .746          .701          .641          .601
TRANSP         .85           .9            .9            .9            .9            .9
OILGAS         .843          .806          .762          .718          .718          .725
INDMATER       .836          .817          .74           .682          .711          .692
HOMEBLDG       .833          .888          .833          .833          .833          .833
NIFTY          .828          .771          .685          .685          .714          .714
SP-100         .826          .795          .765          .693          .744          .714
CHEM           .808          .821          .78           .753          .767          .753
INDEXES        .79           .753          .702          .677          .661          .652
RUS-1000       .783          .779          .715          .667          .674          .66
SP500          .778          .778          .708          .642          .668          .653
MILITARY       .755          .8            .755          .711          .755          .733
NASD-100       .75           .708          .604          .562          .593          .562
UTILITY        .73           .692          .634          .615          .692          .615
GOLD           .722          .407          .351          .259          .296          .222
SOFTWARE       .691          .617          .514          .455          .529          .411
COMODITY       .671          .614          .514          .5            .5            .485
N=27
ELECTRON       .659          .649          .628          .644          .639          .659
SEMI           .658          .658          .65           .633          .633          .658
COMPUTER       .633          .666          .6            .633          .666          .6
DOWJONES       .633          .666          .6            .633          .666          .6
BEVERAGE       .6            .65           .45           .35           .45           .35
GAMING         .6            .6            .566          .533          .566          .533
ETFS           .573          .455          .367          .338          .323          .22
GREEN          .558          .588          .529          .529          .558          .588
BIOTECH        .549          .549          .431          .393          .397          .397
COAL           .5            .5            .4            .4            .5            .6
RETAIL         .446          .553          .535          .446          .517          .517
HOSPITAL       .428          .428          .285          .142          .142          .142
HACKERS        .421          .263          .21           .21           .263          .263
FOOD           .4            .533          .2            .133          .133          .2
SOLAR          .315          .368          .315          .263          .263          .315
CHINA          .215          .169          .153          .107          .107          .107
BONDFUND       .144          .099          .09           .054          .054          .027
N=3
=========================================================================================
1-4-2017
The Peerless Buy B4 calls for more new highs. Bank
and finance stocks
are leading the way higher. In its own way this is quite healthy.
Big banks
control the destinies of so much in national politics and economics as well as
finance,
it is a bullish sign that the troubles of 2007-2009 are very distant.
Technically, we easily spot the Banks' strength using TigerSoft and Peerless.
Regional banks again dominate the Bullish MAXCPs and their leveraged ETF,
FAS, made today a fine, bullish looking flat-topped breakouts. True, GS
and JPM did
not participate. So, this may hold FAS back a little.
A bigger worry would be if bank stocks rose in isolation and got too far ahead
of the overall market. Watching the steady advance of the
Russell-2000 today
and the 5%+ rise in its leveraged ETF, TNA, I would think we have to bullish.
In fact, there is a good chance that we are seeing a January take-off.
That notion is
supported by the fact that the DJI has now gone more than two months without
falling
below its 21-dma. In the 2006 version of Peerless, this was enough for a
Buy B15 signal.
Since then, the Buy B15 has become more conditional. But the purpose
of the Buy B15
is the same; it tells us that the market is becoming exceptionally strong
and we should
give it plenty of chance to run.
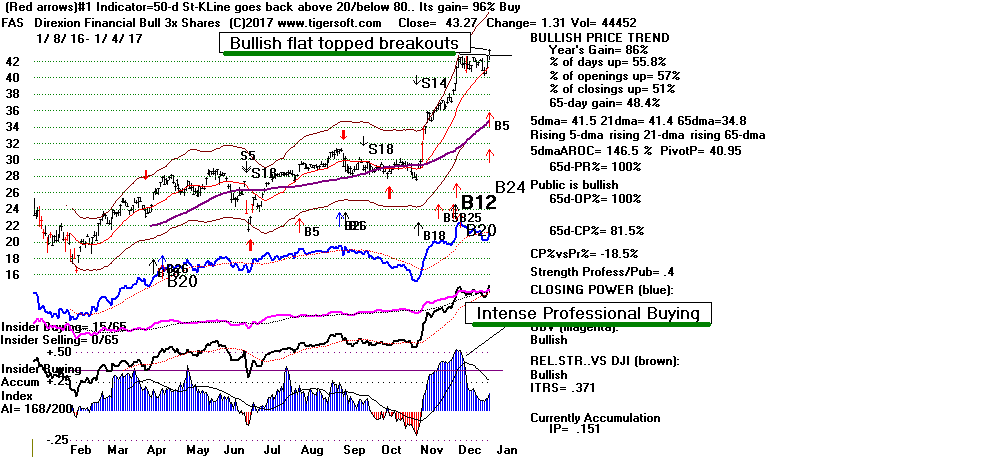
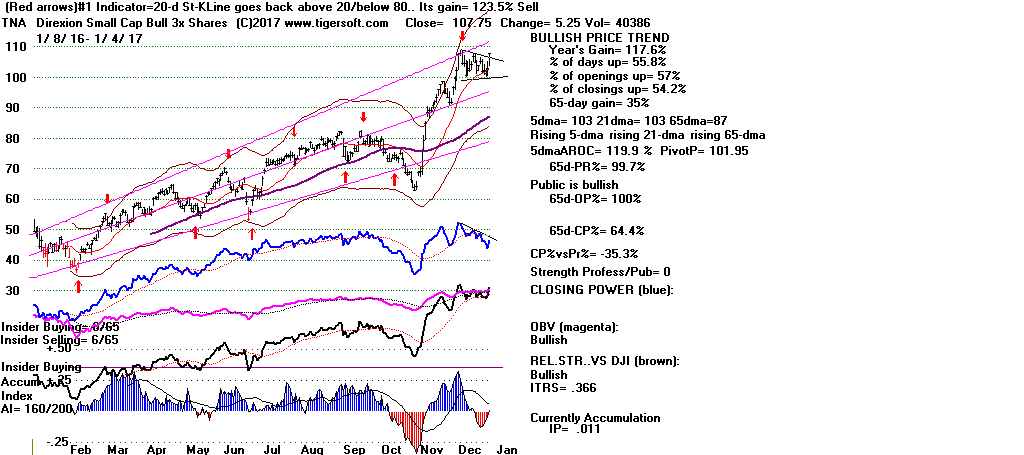
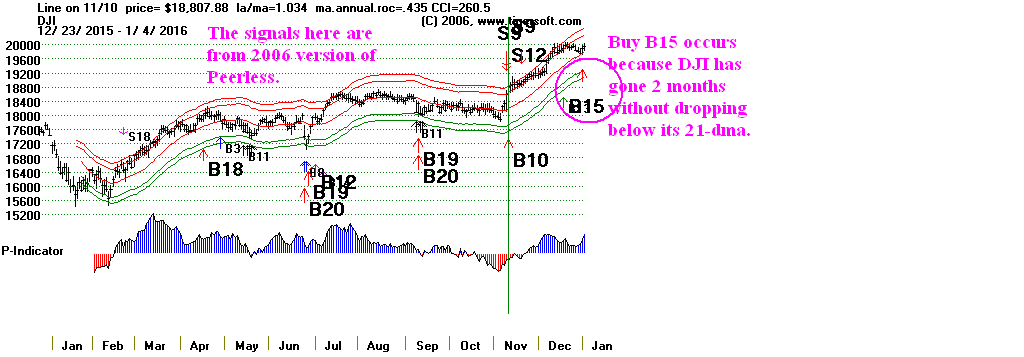
In that vein, notice how the NYSE A/D Line bullishly made a new high ahead of
the DJIA. Breadth was superb today. On the NYSE, there were 2606
advancers
and only 466 decliners today. The number of new lows on the NASDAQ and
NYSE
have shrunk to just 11 and 5, respectively. With year-end tax-loss
selling over,
shorts are busy covering beaten-down stocks, especially Golds, Bonds and foreign
ETFs, too, as rising Oil prices means more inflation which may check the
Dollar's rise.
In addition, the number of groups with more than 66.7% of their stocks above
their
65-dma has risen again. Their number rose from 23 to 25 today. Last
year,
we saw that number steadily rise after Trump's victory. The promise of
lower
taxes on corporations and on wealthy individuals along with fewer regulations,
is exactly what Wall Street wanted. Resist the urge to sell too much by
looking again
at the 1925 chart of the DJI chart and remember how Coolidge also campaigned
on a platform of markedly lower taxes, fewer regulations and higher tariffs
to protect American industry.
1925 Was A Very Bullish Year
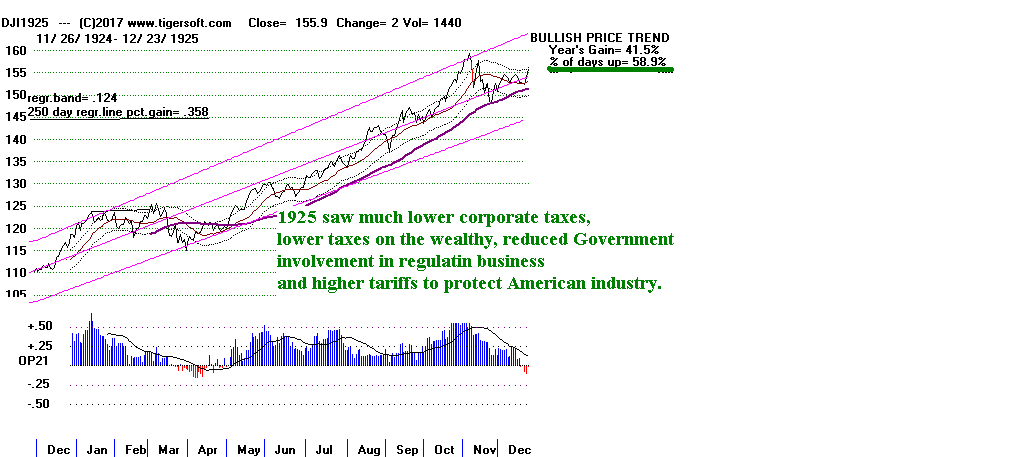
Tiger/Peerless Charts:
1/4/17:
Peerless
DJIA and A/D Line
DJI-OBVPCT
Hourly DJIA
S&P
OEX
NYSE
NASDAQ
DIA
QQQ SPY
IWM
Short-Term Rates
DJI-Utilities
REITS
A/D Line-6000 Stocks
SOXL TECL
FAS
Crude Oil
1/4/17:
Bullish MAXCPs -
Again lots of banks.
Bearish MINCPs
- Very few specimens here. Notice absence
of Bonds.
1/4/17:
Bank Stocks - DB (Deutsche
Bank), WFC (Wells Fargo), GS
(Goldman Sachs),
FAS,
Super Stock -
NVDA (still? - Profit taking as new
year begins...)
Stocks:
AAPL, BIDU,
IBM, TXN,
AMZN, CAT, FB,
GOOG, JPM,
MSFT,
TXN
ETFS:
BBH, BRZU,
DIA, DUST,
FAS, GASL,
GLD, IWM,
JETS,
JNUG, KOL, MDY,
NUGT, OIH, OIL,
RETL,
RSX, SLV,
SOXL, TECL,
TMF, TNA,
UGAZ, UPW,
VGK, YINN
   RANKING OF KEY DIRECTORIES BASED PCT.OF STOCKS ABOVE 65-DMA
               1/4/17
---------------------------------------------------------------------------------------
Directory     Current       day-1         day-2         day-3         day-4         day-5
----------------------------------------------------------------------------------------
BIGBANKS       100%           1             1             1             1             1
PIPELINE       100%          .9            .8            .7            .8            1
AUTO           .951          .902          .829          .853          .878          .902
REGBANKS       .948          .948          .923          .948          .948          .948
MORNSTAR       .911          .84           .773          .785          .773          .827
INFRA          .909          .909          .909          .909          .909          .909
JETS           .909          .909          .818          .818          .818          .818
FINANCE        .903          .881          .817          .838          .827          .86
TRANSP         .9            .9            .9            .9            .9            .9
INSURANC       .894          .894          .921          .921          .921          .921
HOMEBLDG       .888          .833          .833          .833          .833          .833
REIT           .855          .746          .701          .636          .577          .656
DOWJONES       .833          .866          .733          .733          .733          .8
CHEM           .821          .78           .753          .767          .753          .794
INDMATER       .817          .74           .682          .711          .692          .721
OILGAS         .806          .762          .718          .718          .725          .762
MILITARY       .8            .755          .711          .755          .733          .755
SP-100         .795          .765          .693          .744          .714          .775
RUS-1000       .778          .715          .666          .674          .655          .715
SP500          .778          .708          .642          .668          .646          .71
EDU            .777          .888          .888          .777          .777          .888
NIFTY          .771          .685          .685          .714          .714          .771
INDEXES        .756          .705          .68           .663          .655          .672
NASD-100       .708          .604          .562          .593          .562          .645
UTILITY        .673          .634          .634          .673          .596          .673
N=25
COMPUTER       .666          .6            .633          .666          .6            .733
SEMI           .658          .65           .633          .633          .658          .708
BEVERAGE       .65           .45           .35           .45           .35           .35
ELECTRON       .649          .628          .644          .639          .659          .701
SOFTWARE       .617          .514          .455          .529          .411          .544
COMODITY       .605          .507          .492          .492          .478          .478
GAMING         .6            .566          .533          .566          .533          .566
GREEN          .588          .529          .529          .558          .588          .588
RETAIL         .553          .535          .446          .517          .5            .535
BIOTECH        .549          .431          .393          .397          .393          .446
FOOD           .533          .2            .133          .133          .2            .2
COAL           .5            .4            .4            .5            .6            .7
ETFS           .455          .367          .338          .323          .22           .25
HOSPITAL       .428          .285          .142          .142          .142          .285
GOLD           .407          .351          .259          .296          .222          .185
SOLAR          .368          .315          .263          .263          .315          .315
HACKERS        .263          .21           .21           .263          .263          .263
CHINA          .169          .153          .107          .107          .107          .138
BONDFUND       .099          .09           .054          .054          .027          .018
N=3
========================================================================================================
1-3-2017
The Peerless Buy B4 calls for more new highs.
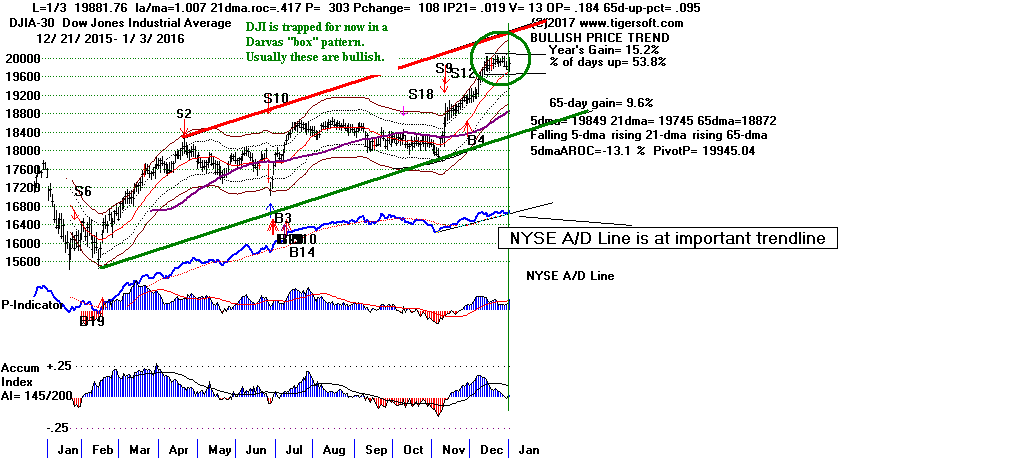
I
believe that the Finance stocks are the most likely to lead another market
advance.
Tops are seldom made from flat tops like the DJI and FAS now show. Usually
in such cases,
first there is a breakout to run in the shorts, at the very least. The
Closing Powers can lag
in these cases. The Closing Powers play catch up because Professionals are
too smart to be
stubbornly bearish. (Read about
Darvas Box patterns. They have quite a
history. And they
show a superb way to make money in a super bull market.)
At the bottom of this Hotline,
see some SPY examples of valid flat-topped price breakouts even when the
Closing Power
was lagging.
The Professional Day Traders who sold on early strength today may be losing
control of the market.
Other Professionals drove the DJI up 95 points in the last two hours. It
sure looks like
20000 will again be tested.
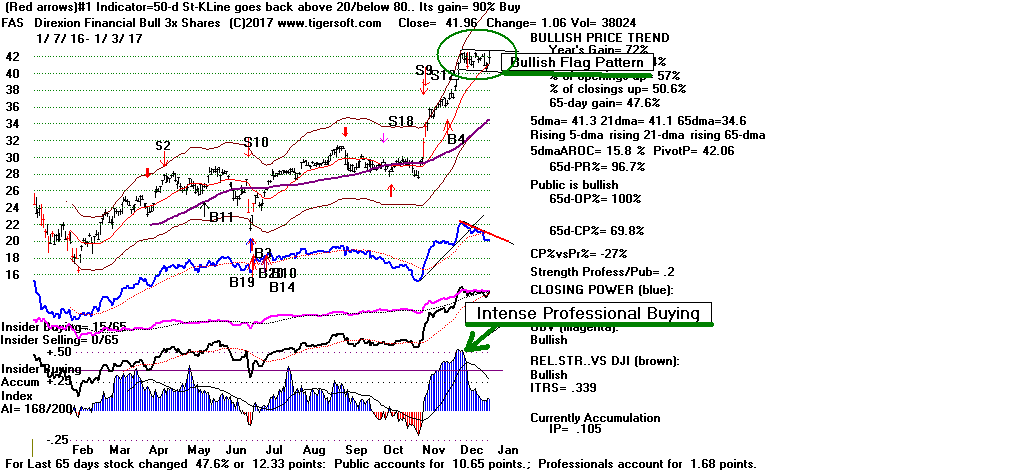
Today looked pretty bullish. The DJI jumped up from its still fast-rising
21-day ma. On the NYSE,
advancers outpaced decliners by 3:1. And volume rose by a third.
Lagging volume has been
a concern.
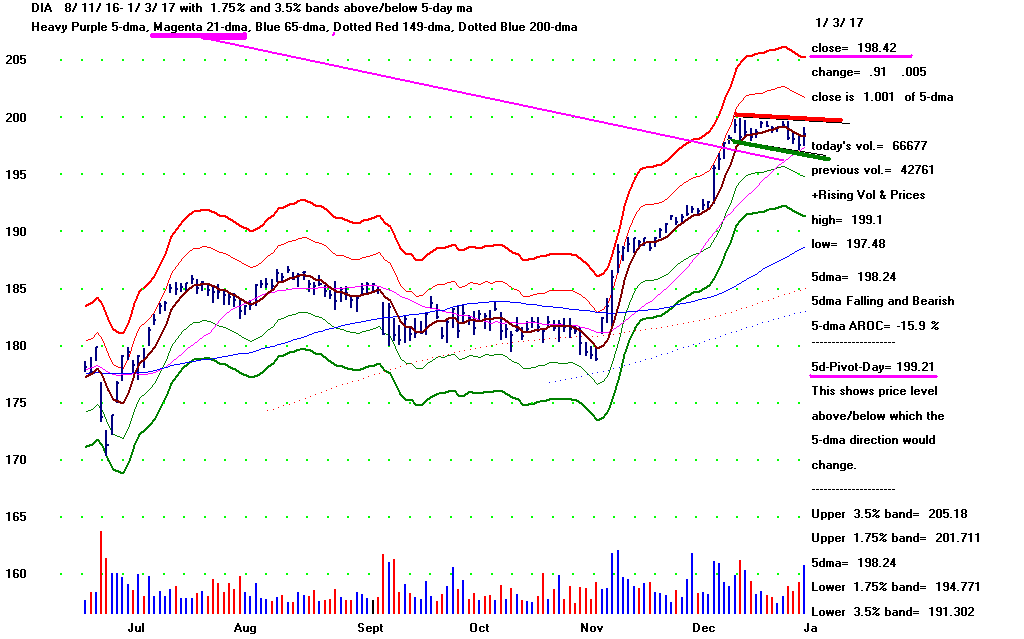
Tiger/Peerless Charts:
1/3/17:
Peerless
DJIA and A/D Line
DJI-OBVPCT
Hourly DJIA
S&P
OEX
NYSE
NASDAQ
DIA
QQQ SPY
IWM
Short-Term Rates
DJI-Utilities
REITS
A/D Line-6000 Stocks
SOXL TECL
FAS
Crude Oil
1/3/17:
Bullish MAXCPs
Bearish MINCPs - Notice absence
of Bonds.
1/3/17:
Bank Stocks - DB (Deutsche
Bank), WFC (Wells Fargo), GS
(Goldman Sachs),
FAS,
Super Stock -
NVDA (still? - Profit taking as new
year begins...)
Stocks:
AAPL, BIDU,
IBM, TXN,
AMZN, CAT, FB,
GOOG, JPM,
MSFT,
TXN
ETFS:
BBH, BRZU,
DIA, DUST,
FAS, GASL,
GLD, IWM,
JETS,
JNUG, KOL, MDY,
NUGT, OIH, OIL,
RETL,
RSX, SLV,
SOXL, TECL,
TMF, TNA,
UGAZ, UPW,
VGK, YINN
Flat Tops "Trump" falling Closing Powers.
Below are some SPY examples from the great bull market,
1995-2000. See how the flat
top breakouts occurred over and over even though Closing Power was lagging for a
while.
Usually the price breakout caused the Closing Power downtrendline to be broken.
Professionals
know the bullishness of flat topped breakouts.
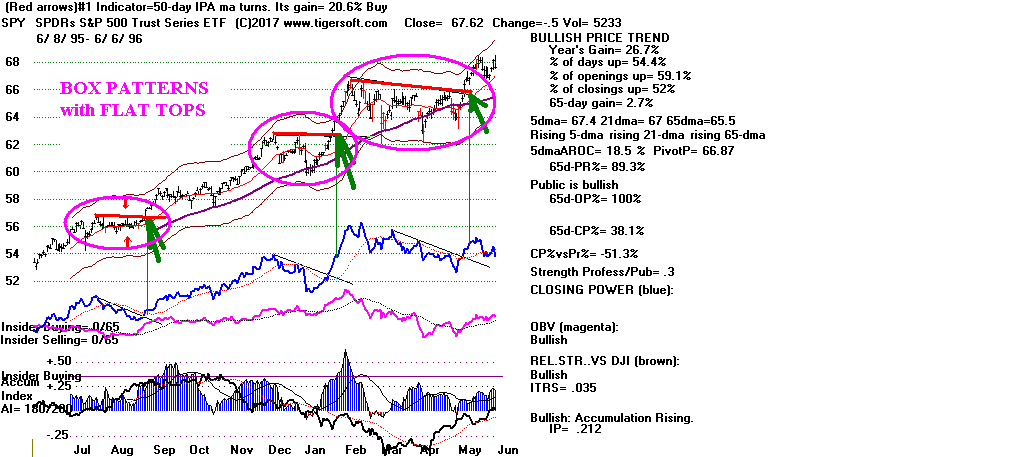
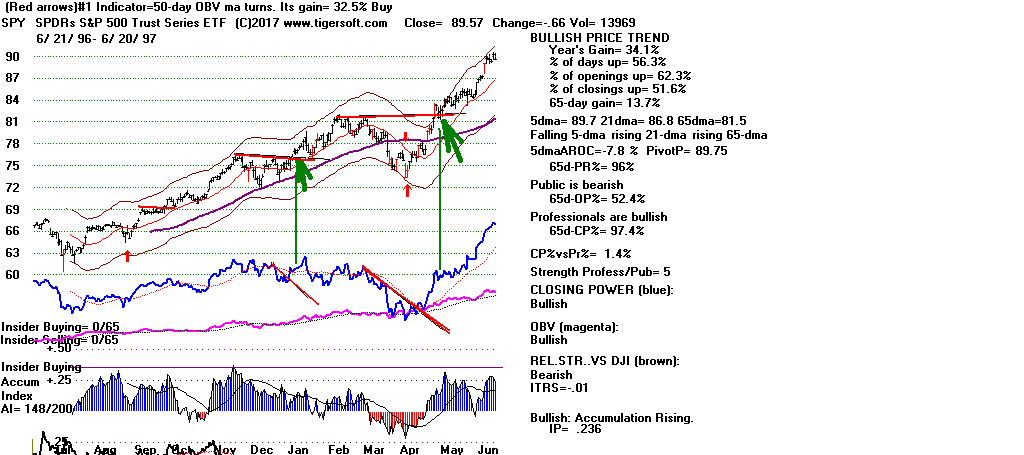
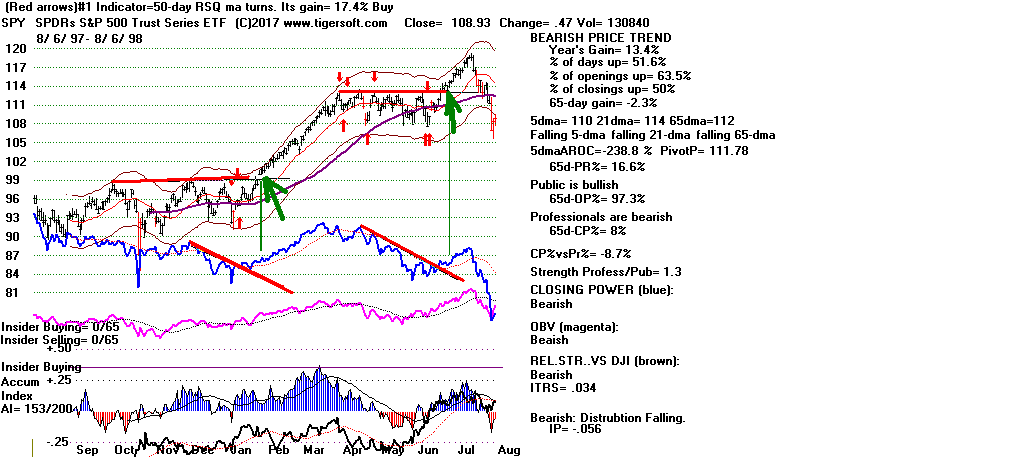 RANKING OF KEY DIRECTORIES BASED PCT.OF STOCKS ABOVE 65-DMA
1/3/17
---------------------------------------------------------------------------------------
Directory Current day-1 day-2 day-3 day-4 day-5
----------------------------------------------------------------------------------------
BIGBANKS 100% 1 1 1 1 1
REGBANKS .948 .948 .923 .948 .948 .948
INFRA .909 .909 .909 .909 .909 .909
JETS .909 .818 .818 .818 .818 .818
AUTO .902 .829 .853 .878 .902 .902
PIPELINE .9 .8 .7 .8 1 1
TRANSP .9 .9 .9 .9 .9 .9
INSURANC .894 .921 .921 .921 .921 .894
EDU .888 .888 .777 .777 .777 .888
FINANCE .881 .817 .838 .827 .86 .849
DOWJONES .866 .733 .733 .733 .8 .8
MORNSTAR .84 .773 .785 .773 .823 .815
HOMEBLDG .833 .833 .833 .833 .833 .833
CHEM .78 .753 .767 .753 .794 .821
SP-100 .765 .693 .744 .714 .775 .755
OILGAS .762 .718 .718 .725 .762 .756
MILITARY .755 .711 .755 .733 .755 .755
REIT .746 .701 .636 .572 .631 .641
INDMATER .74 .682 .711 .692 .721 .711
RUS-1000 .714 .664 .671 .651 .708 .697
SP500 .708 .642 .668 .646 .71 .695
INDEXES .702 .677 .661 .652 .669 .669
NIFTY-35 .685 .685 .714 .714 .771 .742
N=23
SEMI           .65           .633          .633          .658          .708          .7
ELECTRON       .628          .644          .639          .659          .701          .701
UTILITY        .615          .634          .692          .576          .673          .653
NASD-100       .604          .562          .593          .562          .645          .625
COMPUTER       .6            .633          .666          .6            .733          .666
GAMING         .566          .533          .566          .533          .566          .533
RETAIL         .535          .446          .517          .5            .535          .553
GREEN          .529          .529          .558          .588          .588          .588
SOFTWARE       .514          .455          .529          .411          .544          .5
COMODITY       .507          .492          .492          .478          .478          .478
BEVERAGE       .45           .35           .45           .35           .35           .35
BIOTECH        .431          .393          .397          .393          .439          .454
COAL           .4            .4            .5            .6            .7            .7
ETFS           .367          .338          .323          .22           .25           .264
GOLD           .351          .259          .296          .222          .185          .166
SOLAR          .315          .263          .263          .315          .315          .315
HOSPITAL       .285          .142          .142          .142          .285          .285
HACKERS        .21           .21           .263          .263          .263          .21
FOOD           .2            .133          .133          .2            .2            .2
CHINA          .153          .107          .107          .107          .138          .107
BONDFUND       .09           .054          .054          .027          .018          .036
N=6
===========================================================================================
12-30-2016
The Peerless Buy B4 calls for more new highs. But it
remains to be seen,
however, if Professionals are ready to turn bullish.
Short term traders will want to see SPY's 5-day ma turn up and its Closing
Power break its down-trend to be buyers. See below how Professionals
have been net sellers
recently while the Public and foreigners have been
net buyers. Usually,
the Professionals turn out to be right.
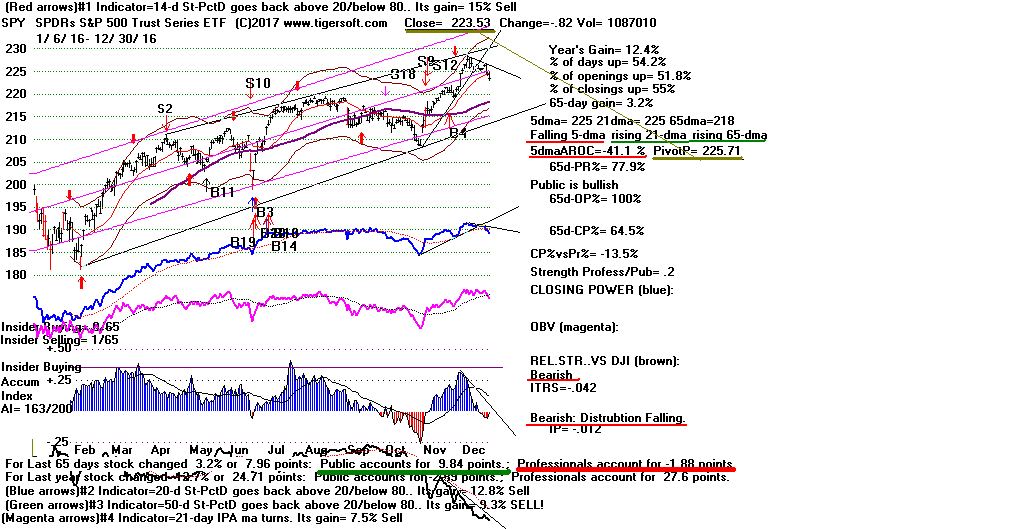
Who Is More Partisan?
The Trump buyers now? Or the Democrats who deny Trump all legitimacy?
For us, trusting our Indicators will probably work out best. The DJI has
fallen back to its falling 21-day ma and appears to be staging a good bounce
as the New Year starts. But Professionals have been recent sellers; so we
must watch
to see if they bullishly join the bulls tomorrow and the market closes up higher
than its
opening tomorrow. That action should be bullish enough to take the DJI up
to its 20300 and
the rising red parallel-line resistance shown further below tomorrow.
Will Feds Dare To Raise Rates All Alone?
Not talked much about is the effect we will see here because the Bank of
England chose not to follow the Fed and raise interest rates. They decided
on December 15th to
hold their rates unchanged even though the US Fed
raised their short-term rates. The British decision set off a spirited, if
brief,
rally in leveraged Gold Mining shares and also in Bonds. NUGT rose 50%
in just a week.
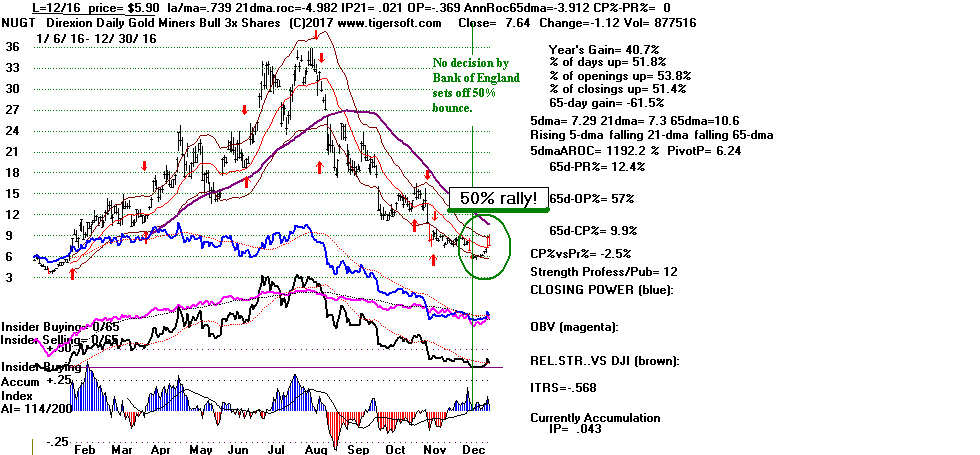
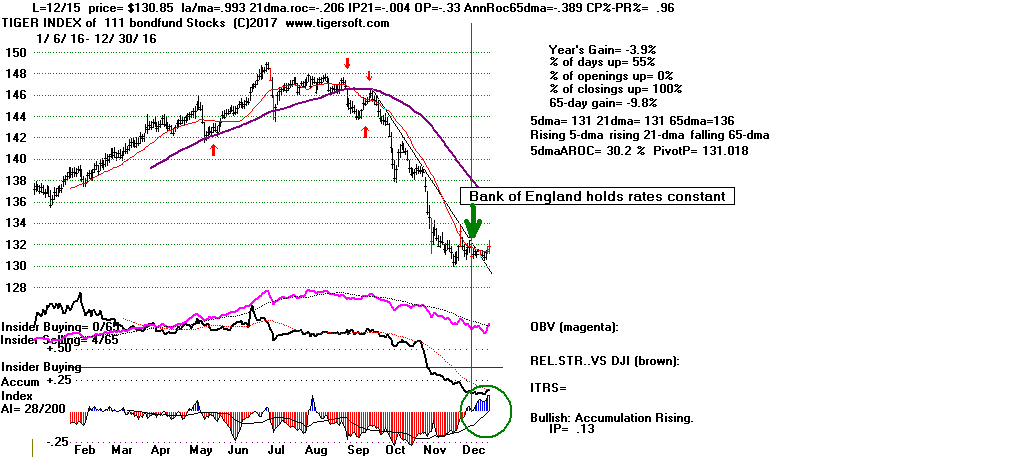
One would think that the British decision will work against the Fed raising
rates soon
unless they want to risk creating a much stronger Dollar with its negative
consequences
for US manufacturing exports, which Trump professes to want to promote.
Bullish Seasonalities May Last Another Week or Two.
Perhaps, the DJI will peak just as Trump Is Inaugurated...
Let's also take in account the seasonality of January and how the
market has welcomed Republican Presidents as they start a new term
in office.
After January 2nd, since 1965 the DJI usually rises for 3 more trading days.
It then pauses and makes little progress for the next two weeks.
3 trading days out from Jan 2 - DJI typically rises 65.3% of time and gains 0.6%
5 trading days out from Jan 2 - DJI typically rises 59.2% of time and gains 0.3%
10 trading days out from Jan 2 - DJI typically rises 63.3% of time and gains
0.6%
21 trading days out from Jan 2 - DJI typically rises 63..3% of time and gains 1%
Based on Trump being a Republican, if history repeats what happened in
7 of 8 cases, the DJI will not peak until somewhere between Jan. 5 and
Feb. 5.
first peak
Republican before decline
Presidents to lower band.
-------------------------------------
Coolidge 1/13/1925
Hoover
2/5/1929
Eisenhower 1/5/1953
Nixon
12/5/1969
Nixon
1/11/1973
Reagan 1/6/1981
Bush-Sr 2/1/1989
Bush-Jr 2/1/2001
The DJI is
testing the support of its rising 21-day ma. That moving average is rising
at an
annualized rate of 42.3%. This usually is enough to cause a reversal back
upwards.

--------- -----------
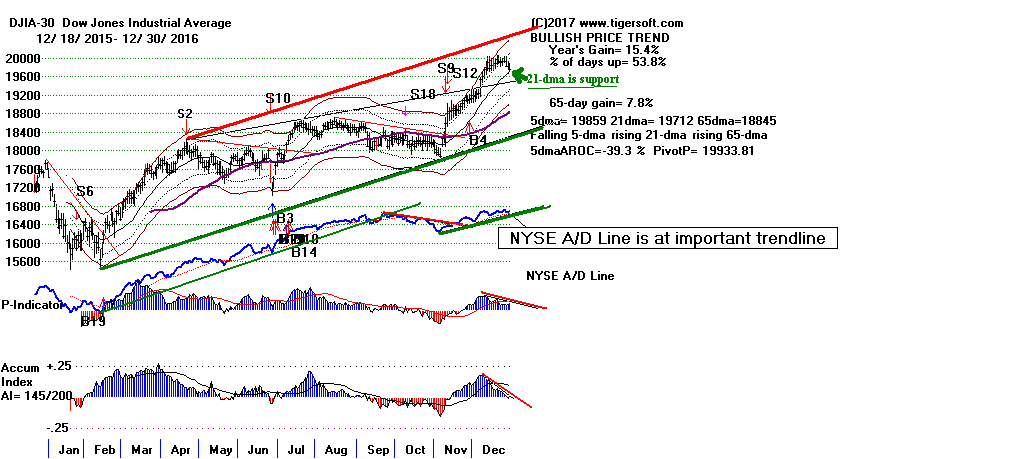
Tiger/Peerless Charts:
12/30/16:
Peerless
DJIA and A/D Line
DJI-OBVPCT
Hourly DJIA
S&P
OEX
NYSE
NASDAQ
DIA
QQQ SPY
IWM
Short-Term Rates
DJI-Utilities
REITS
A/D Line-6000 Stocks
SOXL TECL
FAS
Crude Oil
12/30/16:
Bullish MAXCPs
Bearish MINCPs - Notice absence
of Bonds. This due to British failure to raise rates.
12/30/16:
Bank Stocks - DB (Deutsche
Bank), WFC (Wells Fargo), GS
(Goldman Sachs),
FAS,
Super Stock -
NVDA
Stocks:
AAPL, BIDU,
IBM, TXN,
AMZN, CAT, FB,
GOOG, JPM,
MSFT,
TXN
ETFS:
BBH, BRZU,
DIA, DUST,
FAS, GASL,
GLD, IWM,
JETS,
JNUG, KOL, MDY,
NUGT, OIH, OIL,
RETL,
RSX, SLV,
SOXL, TECL,
TMF, TNA,
UGAZ, UPW,
VGK, YINN
RANKING OF KEY DIRECTORIES BASED PCT.OF STOCKS ABOVE 65-DMA
              12/30/16
---------------------------------------------------------------------------------------
Directory     Current       day-1         day-2         day-3         day-4         day-5
----------------------------------------------------------------------------------------
BIGBANKS       100%             1             1             1             1             1
REGBANKS       .948          .948          .923          .948          .948          .948
INSURANC       .921          .921          .921          .921          .894          .894
INFRA          .909          .909          .909          .909          .909          .909
TRANSP         .9            .9            .9            .9            .9            .9
EDU            .888          .777          .777          .777          .888          .888
HOMEBLDG       .833          .833          .833          .833          .833          .833
JETS           .818          .818          .818          .818          .818          .818
FINANCE        .817          .838          .827          .86           .849          .849
AUTO           .813          .837          .86           .883          .883          .883
PIPELINE       .8            .7            .8            1             1             .9
MORNSTAR       .773          .785          .773          .823          .81           .794
CHEM           .753          .767          .753          .794          .821          .794
DOWJONES       .733          .733          .733          .8            .8            .766
OILGAS         .718          .718          .725          .762          .756          .781
MILITARY       .711          .755          .733          .755          .755          .755
REIT           .701          .636          .572          .626          .621          .626
SP-100         .693          .744          .714          .775          .755          .734
NIFTY          .685          .714          .714          .771          .742          .742
INDMATER       .682          .711          .692          .721          .711          .701
INDEXES        .677          .661          .652          .669          .669          .656
N= 21
RUS-1000       .665          .672          .654          .71           .699          .686
ELECTRON       .644          .639          .659          .701          .701          .675
SP500          .642          .668          .646          .71           .695          .678
COMPUTER       .633          .666          .6            .733          .666          .666
SEMI           .633          .633          .658          .708          .7            .675
UTILITY        .615          .692          .596          .653          .653          .634
NASD-100       .562          .593          .562          .645          .625          .593
GAMING         .533          .566          .533          .566          .533          .533
GREEN          .514          .542          .571          .571          .571          .542
HACKERS        .514          .542          .571          .571          .571          .542
COMODITY       .492          .492          .478          .478          .478          .464
SOFTWARE       .455          .529          .411          .544          .485          .411
RETAIL         .446          .517          .5            .535          .553          .535
COAL           .4            .5            .6            .7            .7            .6
BIOTECH        .393          .397          .393          .439          .454          .386
BEVERAGE       .35           .45           .35           .35           .35           .3
ETFS           .338          .323          .22           .25           .235          .235
SOLAR          .263          .263          .315          .315          .315          .368
GOLD           .259          .296          .222          .185          .166          .166
HOSPITAL       .142          .142          .142          .285          .285          .285
FOOD           .133          .133          .2            .2            .2            .133
CHINA          .107          .107          .107          .138          .107          .123
BONDFUND       .054          .054          .027          .018          .036          .027
N=6
==================================================================================================
12-29-2016 Since
1965, the DJI has rallied 70.4% of the time over
the next five trading days and averaged a gain of 0.8%.
This helps us believe that the DJI will not slip
back much here and
make a successful attempt at getting past the 20000 resistance before Trump's
Inauguration. But, first, because nearly all the key ETFs are
showing falling
Closing Powers (net Professional selling) and falling 5-day mvg. averages,
I have to think that more profit-taking probably lies ahead and short-term
traders
should just wait to buy.
The operative Peerless signal is a Buy B4. But a series of low volume
rally-days with weak breadth which close near their days' lows could bring
a Sell S12 about 350-400-points higher than today's close. So stay tuned.
A quick spike above
20000 to celebrate the New Year might prove to be
a trap for unwary Trump partisans deploying new funds in January.
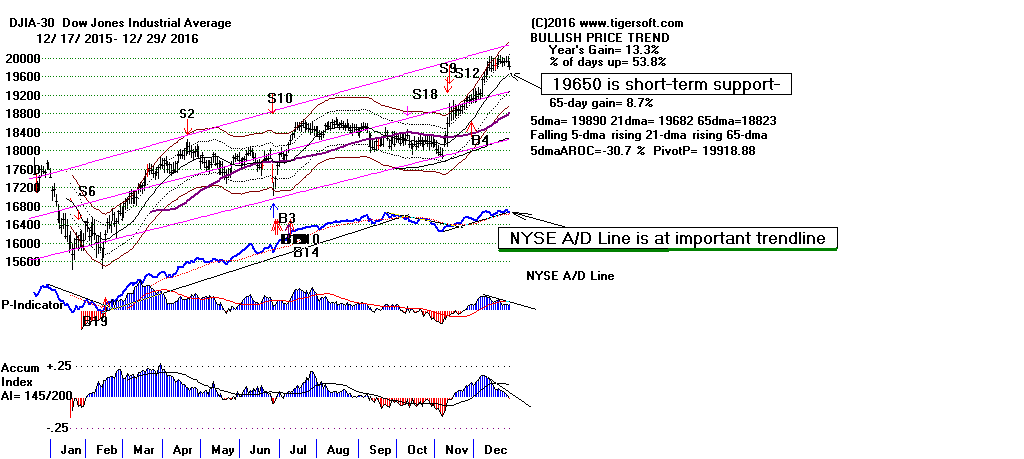
The data below show that the DJI failed recently to reach the 1.7% upper band
with the
IP21 and VI negative. In addition, the P-Indicator stands comfortably
above zero.
That explains why we have not seen a Peerless Sell signal (an S9, S12 or S16
recently.
It's true that there are almost 3x more stocks stocks traded on the NYSE now
than back in
1966, but even multiplying the PI value below for 1/6/1966, we see that the P-I
now is still
higher than in any cases below where the DJI declined from a late December or
early January top.
Thus, all this new data, in Table I, reinforces the research shown earlier
about the bullishness of a
December 17th-2-th close 2% over the 21-day ma, as happened this year. So,
most likely
we have not seen the DJI high yet on this advance.
But right now, we should, I think, wait for the key ETFs to stop showing falling
Closing Powers and 5-day moving averages. See Table II below in today's
Hotline.
Table I
Late December and Early January
Peaks and Pivots-Down in Rising Markets
Date
Peerless Signal LA/MA PI IP21 VI
Outcome
-----------------------------------------------------------------------------------------------------------------
1/6/1966 Sell S12
1.025 +34
-.042 +6
Bear Market started.
1180 up and down.
1/8/1968 Sell S12
1.02 +68 -.019
+6
DJI fell below lower band.
1/11/1973 Sell S12, S9
1.024
-96 +.002
-2
Bear Market started.
1/8/1981 Sell S16/S12
1.029 -29 -.049
-5
DJI declined to lower band.
1/6/1983 Sell S12
1.036 +36 -.092
0
DJI declined to lower band.
1/5/1984 Sell S12
1.019 +5 -.024
0
DJI fell below the lower band.
1/8/1997 no Sell signal
1.014 +143 -.001
-12
Bull market continues
1/12/2000 Sell S12, S15
1.019 -20 -.062 -64
Bear Market started
12/30/2013 Sell S12
1.027 +79 -.027
-2
Decline to lower band.
12/29/2014 No signal
1.017 +39 -.012
-62
Quick temporary drop to 3% lower band.
12/29/2015 Sell S16
1.019 -67
-.10
-147
DJI fell below lower band.
Most recently...
12/27/2016 no Sell signal 1.017
+166 +.030 -12
?
12/28/2016 no Sell signal 1.009
+146 +.008 -14
?
3015 up and down
12/29/2016 no Sell signal
1.007 +177
-.004 -4
?
Table 2
Key ETF's Short-Term Indicators
ClPower ETF Price Pivot-Point
Difference ITRS IP21 (Change 5-day ma
12/29 12/30 for 5-dma
(A)-(B)
from day before) trend ann roc%
(A) (B)
----------------------------------------------------------------------------------------------------------------------------
CP
trendbreak
DIA 197.99 -.09
198.97 (-.98)
+.023 (0)
Down -.294
Falling
SPY 224.35 -.05
225.38
(-1.03)
-.042
-.053
(-.008)
Down -.315
Falling
QQQ 119.71 -.17
120.12 (-.41)
-.076
-.055
(-.005) Down
-.315
Falling
MDY 302.91 +.89
303.24
(-.33)
-.001
-.039
(0)
Down -.354
Falling
IWM 135.37
+.12
135.32
(+.05) +.027 -.066
(-.024) Down
-.621
CP trendbreak
FAS 40.55 -.40
41.63
(-1.08)
+.313
+.084 (-.006) Down
-1.739
Falling
TECL
51.26 -.05
51.87
(-.61) -.019
+.016 (+.003)
Down -.942
Falling
SOXL 59.92
-.01
60.49
(-.57)
+.256
+.111 (+.051) Up +
.32
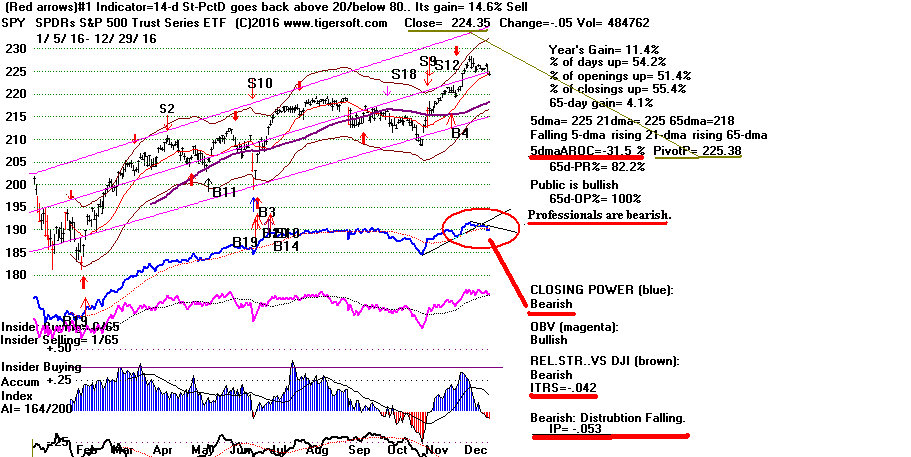
Tiger/Peerless Charts:
12/29/16:
Peerless
DJIA and A/D Line
DJI-OBVPCT
Hourly DJIA
S&P
OEX
NYSE
NASDAQ
DIA
QQQ SPY
IWM
Short-Term Rates
DJI-Utilities
REITS
A/D Line-6000 Stocks
SOXL TECL
FAS
Crude Oil
12/29/16:
Bullish MAXCPs
Bearish MINCPs - Notice absence
of Bonds. This due to British failure to raise rates.
12/29/16:
Bank Stocks - DB (Deutsche
Bank), WFC (Wells Fargo), GS
(Goldman Sachs),
FAS,
Super Stock -
NVDA
Stocks:
AAPL, BIDU,
IBM, TXN,
AMZN, CAT, FB,
GOOG, JPM,
MSFT,
TXN
ETFS:
BBH, BRZU,
DIA, DUST,
FAS, GASL,
GLD, IWM,
JETS,
JNUG, KOL, MDY,
NUGT, OIH, OIL,
RETL,
RSX, SLV,
SOXL, TECL,
TMF, TNA,
UGAZ, UPW,
VGK, YINN
RANKING OF KEY DIRECTORIES BASED PCT.OF STOCKS ABOVE 65-DMA
              12/29/16
---------------------------------------------------------------------------------------
Directory     Current       day-1         day-2         day-3         day-4         day-5
----------------------------------------------------------------------------------------
BIGBANKS       100%          1             1             1             1             1
REGBANKS       .948          .948          .923          .948          .948          .948
INSURANC       .921          .921          .921          .894          .894          .894
INFRA          .909          .909          .909          .909          .909          .909
TRANSP         .9            .9            .9            .9            .9            .9
FINANCE        .838          .827          .86           .849          .849          .849
AUTO           .837          .86           .883          .883          .883          .883
HOMEBLDG       .833          .833          .833          .833          .833          .888
JETS           .818          .818          .818          .818          .818          .818
EDU            .777          .777          .777          .888          .888          .888
CHEM           .767          .753          .794          .821          .794          .794
MILITARY       .755          .733          .755          .755          .755          .755
SP-100         .744          .714          .775          .755          .734          .744
DOWJONES       .733          .733          .8            .8            .766          .8
OILGAS         .718          .725          .762          .756          .775          .775
NIFTY          .714          .714          .771          .742          .742          .742
INDMATER       .711          .692          .721          .711          .701          .74
PIPELINE       .7            .8            1             1             .9            .8
UTILITY        .673          .596          .673          .634          .634          .653
(N=19)
COMPUTER       .666          .6            .733          .666          .666          .633
SP500          .665          .647          .707          .693          .675          .695
RUS-1000       .664          .647          .706          .693          .676          .702
INDEXES        .661          .652          .669          .669          .648          .652
ELECTRON       .639          .659          .701          .701          .675          .685
REIT           .636          .572          .626          .616          .611          .626
SEMI           .633          .658          .708          .7            .675          .7
NASD-100       .593          .562          .645          .625          .593          .635
GAMING         .545          .515          .545          .515          .545          .575
GREEN          .542          .571          .571          .571          .542          .6
SOFTWARE       .529          .411          .544          .485          .411          .5
RETAIL         .517          .5            .535          .553          .535          .642
COAL           .5            .6            .7            .7            .6            .5
COMODITY       .492          .478          .478          .478          .464          .464
BEVERAGE       .45           .35           .35           .35           .3            .25
BIOTECH        .397          .393          .439          .454          .386          .401
ETFS           .323          .22           .25           .235          .235          .25
GOLD           .296          .222          .185          .166          .166          .203
HACKERS        .263          .263          .263          .21           .263          .263
SOLAR          .263          .315          .315          .315          .368          .368
HOSPITAL       .142          .142          .285          .285          .285          .285
FOOD           .133          .2            .2            .2            .133          .2
CHINA          .107          .107          .138          .107          .123          .153
BONDFUND       .054          .027          .018          .036          .027          .036
==============================================================================================
12-28-2016
Despite the operative Peerless Buy B4, I
suggested that traders get out
of ETFs if they closed below the pivot point of their 5-day moving avg. thus
causing their 5-day moving averages to turn down.
This happened today for
DIA, SPY,
FAS, TECL
SOXL and QQQ.
IWM's 5-day ma was already falling.
The Closing Powers for each of these is now below its 21-say ma.
The overhead resistance was too just too much for the low volume trading.
I doubt if there will be big decline. But just as Trump's supporters are
loud and boisterous,
so too are his detractors. Now we get to see how numerous are the bears.
A little weakness now would get rid of some the inevitable profit-takers and
give others a chance to buy on weakness. When the internals begin trending
up, traders should be able to go long again.
See how this is the first time
DIA's 5-day ma has turned down visibly
since Trump was elected. Profit-taking is probably simply long over-due
here.
But, making things look somewhat more bearish,
DIA's Closing Power
uptrend-line has been
clearly violated and volume picked up considerably on today's decline.
And
most important, we have to be cautious now because there have been so many cases
of the DJI pivoting down in January when the Accumulation Index and V-Indicator
were negative despite the normally bullish Santa Claus effect. Compare the
the Peerless key values yesterday and today with what has brought a reversing
Sell signal in the past. The Accum. Index (IP21) is only barely positive
and the V-I
is quite negative.
The saving grace now is that usually in the past before the DJI peaked, the DJI
first closed at least 1.7% over the 21-day ma with both the current AI
(IP21)
and the V-Indicator negative. Because of the sturdy resistance at 20,000
and the low
trading volume, we have not recently seen the DJI or DIA close 2% above the
21-day.
This may help the bulls here. There may still have to be another rally to
take the DJI
closer to the 2% upper band. But we have to be concerned that the current Accum.
Index
(IP21) keeps falling closer and closer to (red) minus territory.
Moreover, as you can see just below, recently at the December 2014 and 2015
tops,
the DJI did not to reach the 2% upper band, yet still topped out and turn down.
No doubt,
the computerized traders, and there are lots more of them now, are selling
somewhat
earlier than they used to. That is why we have not seen the DJI
reach the full 3.5%
as much in recent years.
Below see the pivots-down at the end of the year and also the cases where the
DJI kept rising despite a weak IP21 and V-I at the end of the year.
Late December and Early January
Peaks and Pivots-Down in Rising Markets
Date
Peerless Signal LA/MA IP21 VI
Outcome
-----------------------------------------------------------------------------------------------------------------
1/6/1966 Sell S12
1.025
-.042 +6
Bear Market started.
1/8/1968 Sell S12
1.02
-.019
+6
DJI fell below lower band.
1/11/1973 Sell S12, S9
1.024 +.002
-2
Bear Market started.
1/8/1981 Sell S16/S12
1.029 -.049
-5
DJI declined to lower band.
1/6/1983 Sell S12
1.036 -.092
0
DJI declined to lower band.
1/5/1984 Sell S12
1.019 -.024
0
DJI fell below the lower band.
1/8/1997 no Sell signal
1.014 -.001
-12
Bull market continues
1/12/2000 Sell S12, S15
1.019 -.062
-64
Bear Market started
12/30/2013 Sell S12
1.027 -.027
-2
Decline to lower band.
12/29/2014 No signal
1.017 -.012
-62
Quick temporary drop to 3% lower band.
12/29/2015 Sell S16
1.019 -.10
-147
DJI fell below lower band.
Most recently...
12/27/2016 no Sell signal 1.017
+.030 -12
?
12/28/2016 no Sell signal 1.009
+.008 -14
?
(We start in 1965 because the NYSE Up and Down Volume needed
to compute the V-I
is not available before the middle of 1965. )
Professionals have turned net bearish on the
NASDAQ. Its Accumulation Index remains
in a downtrend. It appears unable to breakout past the (red) resistance
and needs to regroup
for another assault on its highs. Talk of a Trump trade war with China
does not help.
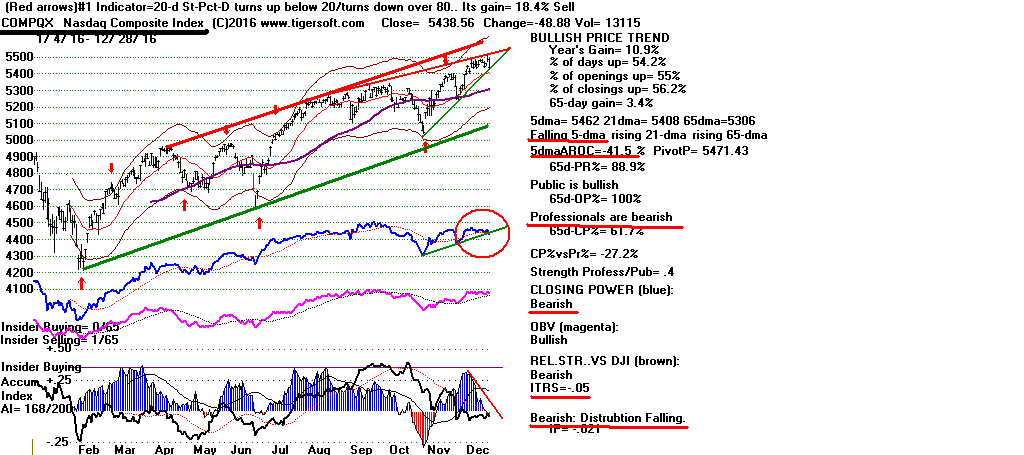
Professionals have turned net bearish on SPY.
Its Accumulation Index is negative.
It has made a new price low. We must see it find support now at its (red)
21-day ma.
The pivot point is 1.37 above today's close. It could still stage a
reversal, but the
short-term trend is now down.
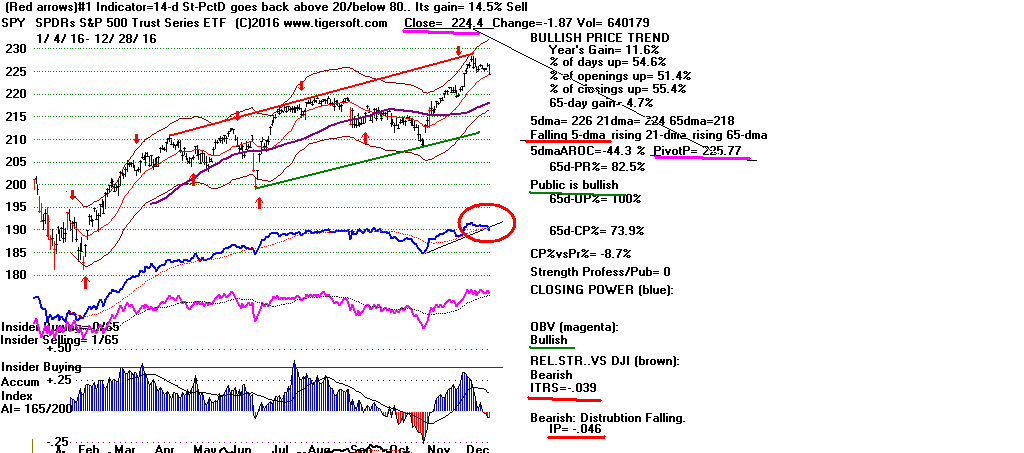
Tiger/Peerless Charts:
12/28/16:
Peerless
DJIA and A/D Line
DJI-OBVPCT
Hourly DJIA
S&P
OEX
NYSE
NASDAQ
DIA
QQQ SPY
IWM
Short-Term Rates
DJI-Utilities
REITS
A/D Line-6000 Stocks
SOXL TECL
FAS
Crude Oil
12/28/16:
Bullish MAXCPs
Bearish MINCPs
12/28/16:
Bank Stocks - DB (Deutsche
Bank), WFC (Wells Fargo), GS
(Goldman Sachs),
FAS,
Super Stock -
NVDA
Stocks:
AAPL, BIDU,
IBM, TXN,
AMZN, CAT, FB,
GOOG, JPM,
MSFT,
TXN
ETFS:
BBH, BRZU,
DIA, DUST,
FAS, GASL,
GLD, IWM,
JETS,
JNUG, KOL, MDY,
NUGT, OIH, OIL,
RETL,
RSX, SLV,
SOXL, TECL,
TMF, TNA,
UGAZ, UPW,
VGK, YINN
 RANKING OF KEY DIRECTORIES BASED PCT.OF STOCKS ABOVE 65-DMA
               12/28/16
---------------------------------------------------------------------------------------
Directory     Current       day-1         day-2         day-3         day-4         day-5
----------------------------------------------------------------------------------------
BIGBANKS       100%           1             1             1             1             1
REGBANKS       .948          .948          .923          .948          .948          .948
INSURANC       .921          .921          .894          .894          .894          .894
INFRA          .909          .909          .909          .909          .909          .909
TRANSP         .9            .9            .9            .9            .9            .9
AUTO           .86           .883          .883          .883          .883          .906
HOMEBLDG       .833          .833          .833          .833          .888          .833
FINANCE        .827          .86           .849          .849          .849          .849
JETS           .818          .818          .818          .818          .818          .818
PIPELINE       .8            1             1             .9            .8            .7
EDU            .777          .777          .888          .888          .888          .888
CHEM           .753          .794          .821          .794          .794          .78
DOWJONES       .733          .8            .8            .766          .8            .8
MILITARY       .733          .755          .755          .755          .755          .755
OILGAS         .725          .762          .756          .775          .775          .793
NIFTY          .714          .771          .742          .742          .742          .8
SP-100         .714          .775          .755          .734          .744          .744
INDMATER       .692          .721          .711          .701          .74           .74
n=18
ELECTRON       .659          .701          .701          .675          .685          .685
SEMI           .658          .708          .7            .675          .7            .691
INDEXES        .652          .669          .669          .648          .652          .669
RUS-1000       .647          .706          .693          .676          .7            .715
SP500          .647          .707          .693          .675          .691          .701
COAL           .6            .7            .7            .6            .5            .4
COMPUTER       .6            .733          .666          .666          .633          .633
UTILITY        .576          .673          .653          .615          .634          .692
REIT           .572          .626          .616          .606          .606          .691
GREEN          .571          .571          .571          .542          .6            .6
NASD-100       .562          .645          .625          .593          .625          .635
GAMING         .515          .545          .515          .545          .575          .575
RETAIL         .5            .535          .553          .535          .642          .678
COMODITY       .478          .478          .478          .464          .464          .464
SOFTWARE       .411          .544          .485          .411          .5            .544
BIOTECH        .393          .439          .454          .386          .397          .428
BEVERAGE       .35           .35           .35           .3            .25           .3
SOLAR          .315          .315          .315          .368          .368          .368
HACKERS        .263          .263          .21           .263          .263          .263
GOLD           .222          .185          .166          .166          .203          .203
ETFS           .22           .25           .235          .235          .25           .308
FOOD           .2            .2            .2            .133          .2            .2
HOSPITAL       .142          .285          .285          .285          .285          .285
CHINA          .107          .138          .107          .123          .153          .138
BONDFUND       .027          .018          .036          .027          .036          .018
==============================================================
12-27-2016
The Buy B4 still stands.
The bullish seasonality of the end of the year continues
to boost the DJI. Since 1965, the DJI has risen 67% of the time over the
next 5 trading
days and has averaged a 0.9% gain over this period.
Nearly always the DJI goes considerably higher when it was more than 2% over the
21-day ma on the 20th of December. In our case, it was 2.7% over the
21-day ma.
The outlook for 10 days shows a some deterioration. A pivot downwards
sometimes
take place in the first week of January but less often in a Presidential
Election Year.
There is still a good chance for another breakout run by the DJI past 20000.
See
how the DJI, the
SP-500, OEX
and NASDAQ are all at their key resistance
kingdom's
levels.
Many
the Trump rally's leaders in the Big Banks and Regional Banks along with FAS
show either recent breakouts above flat tops or current flat top resistance
levels that
commonly brings a breakout. Give the market more chance to run here.
We still see uptrends in the Closing Powers and 5-day mvg.
averages
for DIA, SPY and FAS.
However, it would not take much to turn down their
5-day moving averages.
Traders
should probably close
out positions if their ETFs' 5-day ma turn down. W can
always re-take
long positions
if their flat top resistance levels are later taken out.
ClPower ETF Price Pivot-Point
Difference ITRS IP21 (Change 5-day ma
12/27 12/28 for 5-dma
(A)-(B)
from day before) trend ann roc%
(A) (B)
----------------------------------------------------------------------------------------------------------------------------
Both
Up
DIA 199.21 +.16
199.42 (-.21)
+.023 (-.02)
Up +.153
Both
Up
SPY 226.27 +.56
226.40
(-.13)
-.037
-.047
(-.023)
Up +.164
Both
Up
QQQ 120.82 +.62 120.55 (+.27)
-.067
-.037
(-.019)
Up +.303
MDY 305.12 +1.2
306.45
(-1.33)
+.005
-.073
(-.046)
Up +.075
IWM 136.65
+.61
137.96
(-1.31) +.036 -.107
(-.021) Falling
-.005%
Both Up
FAS 42.06 +.23 42.44
(-.38)
+.373
+.092 (-.019)
Up +.74
Both Up
TECL
52.62 +.68 52.52
(+.10)
+.014
+.046 (-.016)
Up +.604
SOXL
63.63 +2.24. 59.53
(3.10)
+.360
+.133 (+.025) Up +
2.54
NVDA, A Semi-Conductor,
remains our "Super Stock".
SOXL shows the highest ITRS above. It is not quite
a QuickSilver pick even though it is running in all-time high territory
because its current IP21 is below +.15 and its Closing Power is not rising.
Using the 5-day ma trend still works well in it.
Even better would have been buying its star component, NVDA. This has been
out #1 ranked super stock. Its great
strength was early-on detected by its long refusal to even re-test its rising
65-dma. Only 4 stocks currently have not once
closed below their 65-fma even once in last 10 months. Of these only NVDA
and CASH currently show a positive
Accumulation Index. The other two with negative IP21s are RTEC and SAIC.
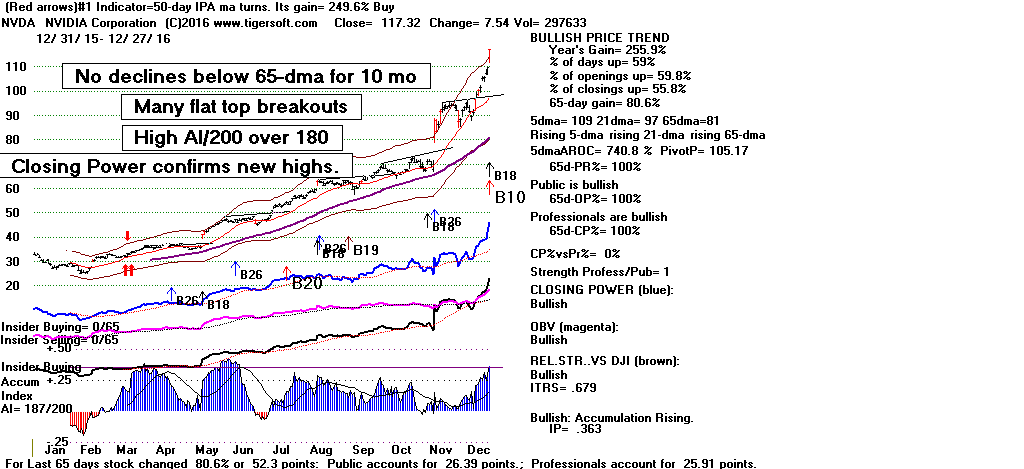
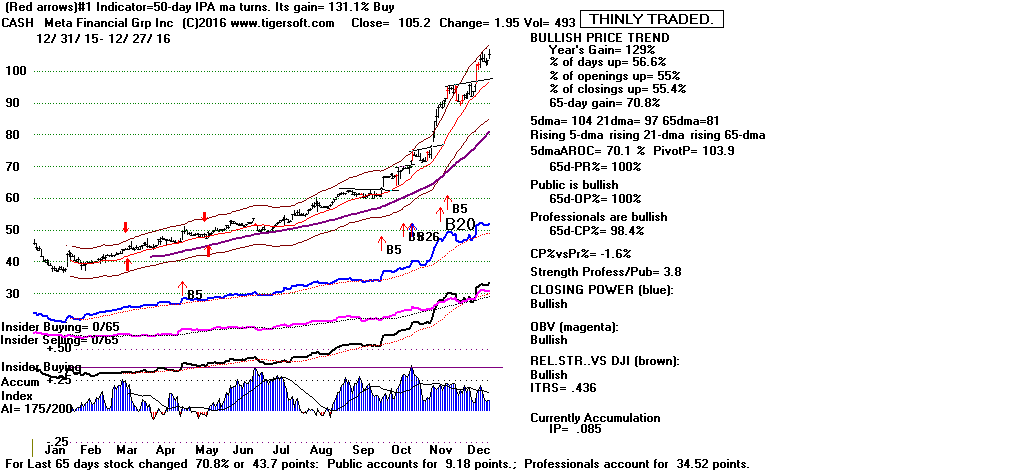
Tiger/Peerless Charts:
12/27/16:
Peerless
DJIA and A/D Line
DJI-OBVPCT
Hourly DJIA
S&P
OEX
NYSE
NASDAQ
DIA
QQQ SPY
IWM
Short-Term Rates
DJI-Utilities
REITS
A/D Line-6000 Stocks
SOXL TECL
FAS
Crude Oil
12/27/16:
Bullish MAXCPs
Bearish MINCPs
12/27/16:
Bank Stocks - DB (Deutsche
Bank), WFC (Wells Fargo), GS
(Goldman Sachs),
FAS,
Super Stock -
NVDA
Stocks:
AAPL, BIDU,
IBM, TXN,
AMZN, CAT, FB,
GOOG, JPM,
MSFT,
TXN
ETFS:
BBH, BRZU,
DIA, DUST,
FAS, GASL,
GLD, IWM,
JETS,
JNUG, KOL, MDY,
NUGT, OIH, OIL,
RETL,
RSX, SLV,
SOXL, TECL,
TMF, TNA,
UGAZ, UPW,
VGK, YINN
RANKING OF KEY DIRECTORIES BASED PCT.OF STOCKS ABOVE 65-DMA
 RANKING OF KEY DIRECTORIES BASED PCT.OF STOCKS ABOVE 65-DMA
12/27/16
---------------------------------------------------------------------------------------
Directory     Current       day-1         day-2         day-3         day-4         day-5
----------------------------------------------------------------------------------------
BIGBANKS       100%          1             1             1             1             1
PIPELINE       100%          1             .9            .8            .7            .7
REGBANKS       .948          .948          .923          .948          .948          .948
INSURANC       .921          .894          .894          .894          .894          .868
INFRA          .909          .909          .909          .909          .909          .909
TRANSP         .9            .9            .9            .9            .9            .9
AUTO           .883          .883          .883          .883          .906          .906
FINANCE        .86           .849          .849          .849          .849          .849
HOMEBLDG       .833          .833          .833          .888          .833          .833
JETS           .818          .818          .818          .818          .818          .818
DOWJONES       .8            .8            .766          .8            .8            .833
CHEM           .794          .821          .794          .794          .78           .835
SP-100         .775          .755          .734          .744          .755          .775
NIFTY          .771          .742          .742          .742          .8            .742
OILGAS         .762          .756          .775          .775          .793          .787
MILITARY       .755          .755          .755          .755          .755          .755
COMPUTER       .733          .666          .666          .633          .633          .666
INDMATER       .721          .711          .701          .74           .75           .75
SEMI           .708          .7            .675          .7            .7            .7
SP500          .707          .693          .675          .691          .701          .697
RUS-1000       .706          .693          .676          .7            .716          .705
ELECTRON       .701          .701          .675          .685          .69           .685
COAL           .7            .7            .6            .5            .5            .6
INDEXES        .669          .669          .648          .652          .673          .665
N=24
UTILITY        .653          .653          .634          .615          .692          .653
NASD-100       .645          .625          .593          .625          .645          .625
REIT           .626          .616          .606          .601          .681          .646
GREEN          .571          .571          .542          .6            .6            .6
GAMING         .545          .515          .545          .575          .575          .575
SOFTWARE       .544          .485          .411          .5            .544          .544
RETAIL         .535          .553          .535          .642          .678          .625
COMODITY       .478          .478          .464          .464          .464          .521
BIOTECH        .439          .454          .386          .397          .424          .409
BEVERAGE       .35           .35           .3            .25           .3            .4
SOLAR          .315          .315          .368          .368          .368          .368
HOSPITAL       .285          .285          .285          .285          .285          .285
HACKERS        .263          .21           .263          .263          .263          .263
EDU            .25           .235          .235          .25           .308          .294
ETFS           .25           .235          .235          .25           .308          .294
FOOD           .2            .2            .133          .2            .2            .333
GOLD           .185          .166          .166          .203          .203          .148
CHINA          .138          .107          .123          .153          .138          .153
BONDFUND       .018          .036          .027          .036          .018          .018
==============================================================================================
12-26-2016
The Buy B4 still stands.
The bullish seasonality of the end of the year continues
to boost the DJI. Since 1965, the DJI has risen 67% of the time over the
next 5 trading
days and has averaged a 0.9% gain over this period.
Nearly always the DJI goes considerably higher when it was more than 2% over the
21-day ma on the 20th of December. In our case, it was 2.7% over the
21-day ma.
Many of the Trump rally's leaders in the Big Banks and Regional Banks along with
FAS
show either recent breakouts above flat tops or current flat top resistance
levels that
commonly brings a breakout. If Trump behaves himself, these financials
should be
enjoy a golden age for a while.
We note also the still extant uptrends in the Closing Powers and 5-day mvg.
averages
for DIA, SPY and FAS. However, it would not take much to turn down their
5-day moving
averages. You can see how the last prices on Friday are quite close
the pivot-points that
should be used for Tuesday's close. DIA would only have to fall by .46 on
Tuesday's close
and SPY would only need to fall by .19 on Tuesday's close to turn the short-term
QuickSilver
5-dma down. The Accumul. Indexes are weakening, too.
Traders should probably close
out positions if their ETFs' 5-day ma turn down, since we can always re-take
long
positions correctly
if their flat top resistance levels are later taken out.
ClPower ETF Price Pivot-Point
Difference ITRS IP21 (Change
5-day ma
12/23 12/26 for 5-dma
(A)-(B)
from day before) trend
(A) (B)
----------------------------------------------------------------------------------------------------------------------------
Both
Up
DIA 199.05 +.08 198.60
(.45)
+.043 (-.09)
Up
Both
Up
SPY 225.71 +.33 225.53
(.18)
-.041
-.024
(-.08)
Up
OpPwr
Up
QQQ 120.2 +.08 120.9
(-.70)
-.073
-.017
(-.05)
Up
ClPwr
down
MDY 303.92 +.68 304.66
(-.74)
-.001
-.069
(-.042)
Up
ClPwr
down IWM 136.04
+.72
136.8
(-.76) -.024 -.086
(-.03)
Up
Both Up
FAS 41.83 +.20 41.44
(.43)
+.376
+.111 (-.025)
Up
Both Up
TECL
51.94 +.07 51.99
(-.05)
+.01
+.061 (-.050)
Up
Tiger/Peerless Charts:
12/23/16:
Peerless
DJIA and A/D Line
DJI-OBVPCT
Hourly DJIA
S&P
OEX
NYSE
NASDAQ
DIA
QQQ SPY
IWM
Short-Term Rates
DJI-Utilities
REITS
A/D Line-6000 Stocks
SOXL TECL
FAS
Crude Oil
12/23/16:
Bullish MAXCPs
Bearish MINCPs
12/26/16:
Bank Stocks - DB (Deutsche
Bank), WFC (Wells Fargo), GS
(Goldman Sachs),
FAS,
Super Stock -
NVDA
Stocks:
AAPL, BIDU,
IBM, TXN,
AMZN, CAT, FB,
GOOG, JPM,
MSFT,
TXN
ETFS:
BBH, BRZU,
DIA, DUST,
FAS, GASL,
GLD, IWM,
JETS,
JNUG, KOL, MDY,
NUGT, OIH, OIL,
RETL,
RSX, SLV,
SOXL, TECL,
TMF, TNA,
UGAZ, UPW,
VGK, YINN
 RANKING OF KEY DIRECTORIES BASED PCT.OF STOCKS ABOVE 65-DMA
               12/23/16
---------------------------------------------------------------------------------------
Directory     Current       day-1         day-2         day-3         day-4         day-5
----------------------------------------------------------------------------------------
BIGBANKS       100%          1             1             1             1             1
PIPELINE       100%          .9            .8            .7            .7            .7
REGBANKS       .948          .948          .923          .948          .948          .948
INFRA          .909          .909          .909          .909          .909          .909
TRANSP         .9            .9            .9            .9            .9            .9
INSURANC       .894          .894          .894          .894          .868          .868
EDU            .888          .888          .888          .888          .888          .888
AUTO           .883          .883          .883          .906          .906          .883
FINANCE        .849          .849          .849          .849          .849          .87
HOMEBLDG       .833          .833          .888          .833          .833          .833
CHEM           .821          .794          .794          .78           .835          .821
JETS           .818          .818          .818          .818          .818          .818
DOWJONES-30    .8            .766          .8            .8            .833          .8
OILGAS         .756          .775          .775          .793          .793          .793
MILITARY       .755          .755          .755          .755          .755          .733
SP-100         .755          .734          .744          .755          .775          .755
NIFTY          .742          .742          .742          .8            .771          .685
INDMATER       .711          .701          .74           .75           .75           .769
ELECTRON       .701          .675          .685          .69           .685          .67
COAL           .7            .6            .5            .5            .6            .8
SEMI-CONDUCTORS.7            .675          .7            .7            .7            .683
RUS-1000       .693          .676          .7            .716          .709          .69
SP500          .693          .675          .691          .701          .699          .689
INDEXES        .672          .651          .655          .676          .668          .693
COMPUTER       .666          .666          .633          .633          .666          .633
UTILITY        .634          .634          .634          .673          .653          .576
NASD-100       .625          .593          .625          .645          .635          .593
REIT           .616          .606          .601          .676          .641          .587
GREEN          .571          .542          .6            .6            .6            .6
RETAIL         .553          .535          .642          .678          .625          .642
GAMING         .487          .512          .538          .538          .538          .538
SOFTWARE       .485          .411          .5            .544          .544          .529
COMODITY       .478          .464          .464          .464          .521          .577
BIOTECH        .454          .386          .397          .424          .409          .401
BEVERAGE       .35           .3            .25           .3            .4            .4
SOLAR          .315          .368          .368          .368          .368          .315
HOSPITAL       .285          .285          .285          .285          .285          .285
ETFS           .25           .25           .264          .308          .294          .308
CHINA          .241          .258          .258          .258          .258          .274
HACKERS        .21           .263          .263          .263          .263          .21
FOOD           .2            .133          .2            .2            .333          .4
GOLD           .166          .166          .203          .203          .148          .185
BONDFUND       .036          .027          .036          .018          .018          .009
======================================================================================================
12-22-2016 The Peerless Buy B4 and the Bullishness of a strong
market now
should give us hope that the DJI,
Banks and
Semi-Conductors
should keep rising for the next two weeks, at least, even though
talk of a trade war with China may continue
to hold back
the QQQ and
NASDAQ as well as IWM and some leading
Tech
stocks like AAPL.
What
Happened To DJI
after December 22nd since 1965
After
Pct of Years Avg. DJI
DJI Rose Gain
----------------------------------------------------------
1 trading day 73.3%
0.3%
2 trading days 71.4%
0.5%
3 trading days 67.3%
0.6%
5 trading days 73.5%
0.9%
10 trading days 77.6%
1.3% Best
21 trading days 55.1%
1.1%
It sure looks the
Banks Stocks and
FAS must continue to lead the market higher.
3x-Leveraged FAS is poised for a nearly perfect flat-top breakout and its 5-day
ma
is rising again. Since the odds of the DJI and the general market
rising until the
end of the year,
I would think that traders will want to Buy
FAS for a breakout.
History shows over and over, it usually pays to play long the strongest sector
in
a new bull market or in a major intermediate-term advance.
There is no doubt which stocks have more moved up the DJI-30 the most. It
is
the bank stocks, GS and
JPM.
There's no doubt which of the leveraged ETFs shows a shows a strongly
rising 5-dma,
high ITRS, very positive Accumulation Index and ITRS (relative strength).
It is FAS.
There is no doubt which group of stocks has been the best performing since Trump
was elected President. We see this when we rank the Morningside sectors
for the
last 33 trading days (back to November 4th). The South-Eastern and Pacific
regional banks are up the most, +34%. We also see it in our ranking of
groups by the
percentage of stocks over their 65-dma now. And we have surely have
noticed each day,
that it has been the regional bankers that have dominated the Bullish MAXCPs on
our Hotline.
We are not alone in appreciating the many ways that Trump de-regulation
will greatly boost bank stocks, financials and brokerages. This seems as
close to being a
certainty as anything Wall Street ever offers.
In addition, the year-end effect would seem to guarantee still more buying by
institutions.
So this now invites breakouts to new highs, which in turn causing short-covering
and new buying.
All in all, I think that the best of these Bank stocks should rise another 10%
by early
next year. If that is how things work out, FAS should rise even more.
Regional Banks are market's
leaders now.
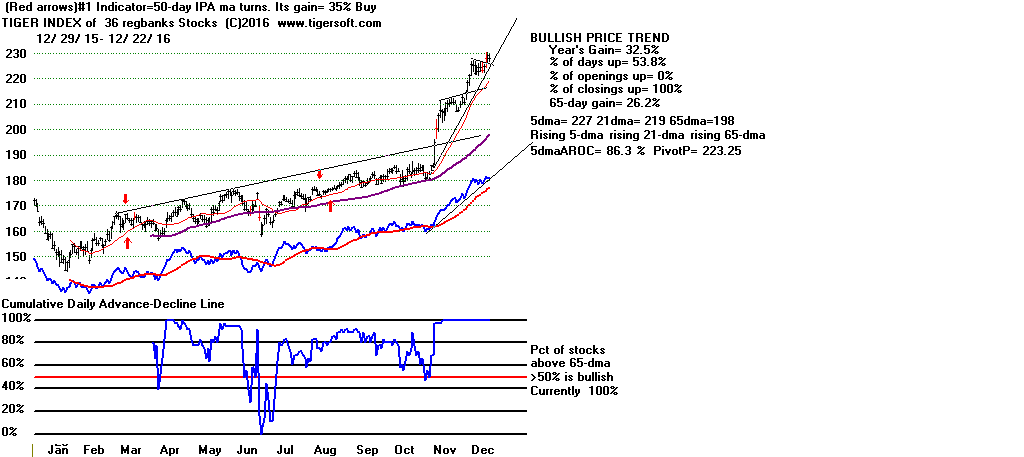
FAS has a near perfectly flag formation.
A breakout now to 43 could set up a vertical
ascent which matches its 14 point "flag pole"
advance after November 4th.
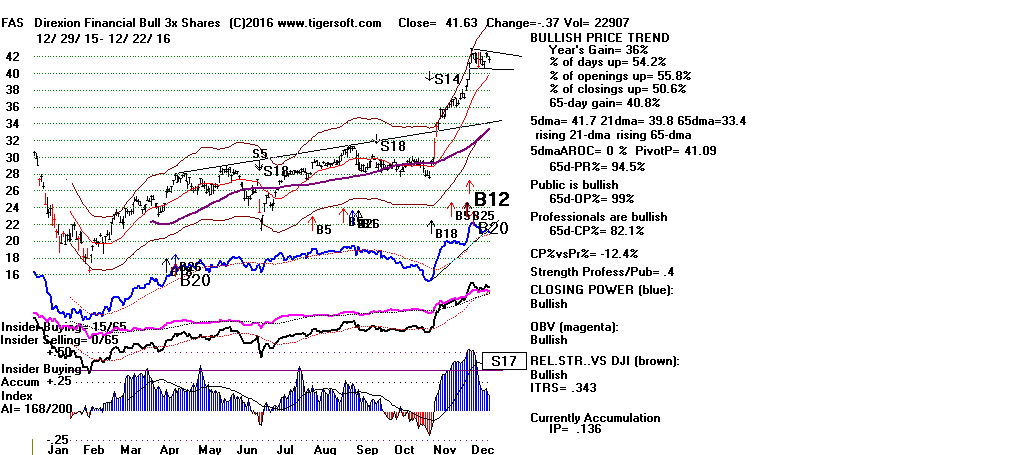
All of the ETFS and stocks below will show a rising 5-day ma
except for IWM if they simply go sidewise tomorrow. Of these
SOXL, FAS, GS and JPM show the highest ITRS (relative strength)
and IP21 (current Accumulation).
ETF Price Pivot-Point ITRS IP21
12/22 12/23 for 5-dma
-------------------------------------------------------------
DIA 198.97 -.19 198.19
+.063
SPY 255.38 -.39 225.04
-.042 -.016
QQQ 120.12 -.34 119.6
-.074 -.012
MDY 303.24 -1.82 302.93 -.005
-.027
IWM 135.32 -1.74
135.91
+.013 -.05
SOXL 60.49 +.96 58.84
+.272
+.172
TECL 51.87 -.37
50.96 -.007
+.059
FAS 41.63 -.37 41.09
+.343 +.136
GS 240.12 -1.32 238.9
+.321 +.253
JPM 86.89 +.14 84.94
+.178 +.358
AAPL 116.89 -.79 115.97
-.106 +.032
Tiger/Peerless Charts:
12/22/16:
Peerless
DJIA and A/D Line
DJI-OBVPCT
Hourly DJIA
S&P
OEX
NYSE
NASDAQ
DIA
QQQ SPY
IWM
Short-Term Rates
DJI-Utilities
REITS
A/D Line-6000 Stocks
SOXL TECL
FAS
Crude Oil
12/22/16:
Bullish MAXCPs
Bearish MINCPs
12/22/16:
Bank Stocks - DB (Deutsche
Bank), WFC (Wells Fargo), GS
(Goldman Sachs),
FAS,
Super Stock -
NVDA
Stocks:
AAPL, BIDU,
IBM, TXN,
AMZN, CAT, FB,
GOOG, JPM,
MSFT,
TXN
ETFS:
BBH, BRZU,
DIA, DUST,
FAS, GASL,
GLD, IWM,
JETS,
JNUG, KOL, MDY,
NUGT, OIH, OIL,
RETL,
RSX, SLV,
SOXL, TECL,
TMF, TNA,
UGAZ, UPW,
VGK, YINN
RANKING OF KEY DIRECTORIES BASED PCT.OF STOCKS ABOVE 65-DMA
              12/22/16
---------------------------------------------------------------------------------------
Directory     Current       day-1         day-2         day-3         day-4         day-5
----------------------------------------------------------------------------------------
BIGBANKS       100%           1             1             1             1             1
EDU            100%           1             1             1             1             1
REGBANKS       100%           1             1             1             1             1
AUTO           .925          .925          .95           .95           .925          .925
INSURANC       .911          .911          .911          .882          .852          .882
INFRA          .909          .909          .909          .909          .909          .909
TRANSP         .904          .904          .904          .904          .904          .904
PIPELINE       .888          .777          .666          .666          .666          .444
FINANCE        .849          .849          .849          .849          .87           .86
HOMEBLDG       .833          .888          .833          .833          .833          .833
JETS           .818          .818          .818          .818          .818          .818
GAMING         .777          .777          .777          .777          .777          .777
CHEM           .768          .756          .743          .792          .78           .756
OILGAS         .767          .767          .784          .779          .784          .761
DOWJONES       .766          .8            .8            .833          .8            .833
NIFTY          .742          .742          .8            .771          .685          .714
SP-100         .731          .742          .752          .773          .752          .804
MILITARY       .725          .725          .745          .745          .705          .725
INDMATER       .702          .742          .752          .752          .772          .782
ELECTRON       .684          .692          .701          .701          .684          .688
COMPUTER       .68           .64           .64           .68           .64           .76
RUS-1000       .676          .7            .716          .709          .691          .688
SP500          .675          .691          .701          .699          .687          .687
COAL           .666          .555          .555          .666          .888          .888
UTILITY        .652          .652          .717          .673          .586          .456
INDEXES        .647          .655          .676          .668          .689          .663
SEMI           .646          .669          .669          .669          .654          .661
REIT           .619          .614          .69           .649          .588          .512
GREEN          .612          .677          .677          .677          .677          .677
NASD-100       .595          .627          .648          .638          .595          .67
RETAIL         .555          .666          .703          .648          .666          .74
COMODITY       .464          .464          .464          .521          .577          .605
SOLAR          .375          .375          .375          .375          .312          .312
SOFTWARE       .369          .461          .507          .507          .492          .507
BIOTECH        .36           .38           .394          .384          .387          .404
BEVERAGE       .285          .238          .285          .38           .38           .333
HACKERS        .285          .333          .38           .38           .285          .38
HOSPITAL       .25           .25           .25           .25           .25           .25
ETFS           .235          .25           .308          .294          .308          .352
GOLD           .142          .178          .178          .125          .16           .142
FOOD           .133          .2            .2            .333          .4            .4
CHINA          .105          .131          .118          .144          .157          .131
BONDFUND       .027          .036          .018          .018          .009          .009
============================================================================================
12-21-2016 The DJIA could not breakout above 20000.
The Buy B4 and the Bullish seasonality of
the second half of December should keep us long.
But traders should probably sell or reduce positions
if their stocks or ETFs close below their 5-day ma
pivot points tomorrow or break their rising Closing
Power uptrends. We can always retake these positions
if flat topped breakouts do occur.
ETF Price Pivot-Point ITRS IP21
12/21 12/22 for 5-dma
-------------------------------------------------------------
DIA 199.16 -.26 198.66
+.069
SPY 255.77 -.63 226.81
-.041 +.002
QQQ 120.46 -.09 120.40
-.074 -.015
MDY 305.06 -1.39 304.68
+.004 +.019
IWM 137.06 -0.9 136.16
+.024 +.031
SOXL 59.53
60.82
+.233 +.169 SOXL's 5-dma will probably
turn down tomorrow,
TECL 52.24 -.28
51.94
+.002 +.064
FAS 42.0 -.44 41.63
+.373 +.154
GS 241.44 -1.65
243.0
+.329 +.875 GS's 5-dma
will probably turn down tomorrow,
JPM 86.75 +.22 86.00
+.171 +.378
AAPL 117.06 +.11 115.82
-.073 +.004
So far, Bank Stocks have been doing most of the heavy-lifting of this market.
QQQ and TECL need to breakout to help lead the advance. A Trump trade war
with China will hit US tech stocks with production facilities in US particularly
hard.
The NASDAQ's broadening pattern looks particularly vulnerable. It will not
take much to turn its short-term trend downward. That could quickly become
a much bigger decline. Let's see how techs respond to Navarro's
appointment.
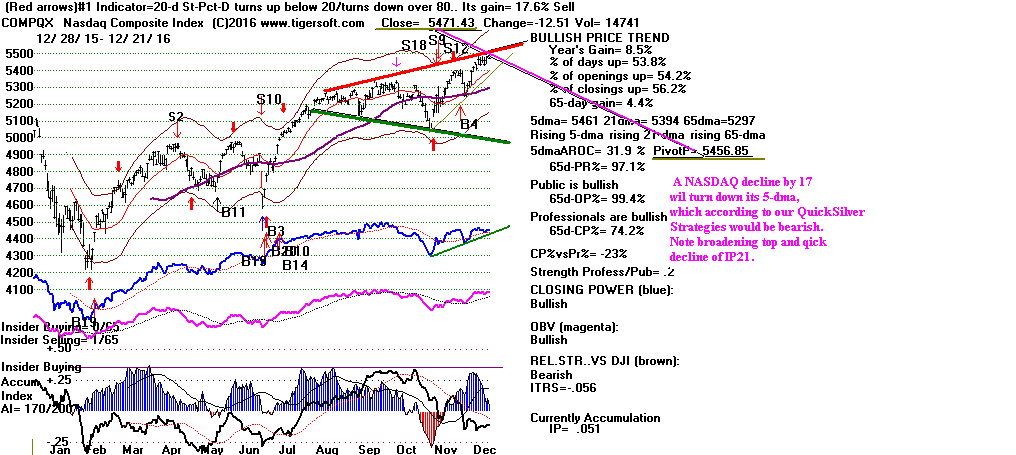
A Trump Trade War?
Trump's appointment of Peter Navarro (from
San Diego) puts US trade policy with China up
close, front and center for immediate consideration
by investors. In his view, China is already at war with
the US, so we must protect ourselves.

See
https://www.youtube.com/watch?v=mMlmjXtnIXI
http://www.nytimes.com/2016/12/21/us/politics/peter-navarro-carl-icahn-trump-china-trade.html?emc=edit_th_20161222&nl=todaysheadlines&nlid=58223894
I talked to him for an hour in the 1980s. He was interested in the British
Jobs Policies, or the lack of them
before WWII, that were a big
part of my Doctoral Dissertation. He made it clear that he was not a fan of
Keynesian Public Works
policies
(See.
http://tigersoftware.com/tigerblogs/83---2011/index.html
)
His appointment as special foreign trade consultant to
the President is a shot across the bow for China.
It also suggests to me that Trump may want to work on the
terms of trade with China before he launches a big
Public Works program. He probably realizes that putting
money in lots of new workers' hands might under present
conditions be a bigger boost for the Chinese economy than
the American.
December DJI Strength.
See charts at
http://www.tigersoft.com/Peerless-Research/December-Strength/INDEX.htm
What happens when DJI is up more than 1.019%
over the 21-day ma between December 18th and 20th?
Nearly always the DJI goes considerably higher. But in nearly half of the 18
cases,
there is a 1%-3% pullback and paper loss in January.
17 previous cases in bull markets since 1929:
10 very big runs developed.
5 gains of about 5%
2 cases, a Peerless Sell stopped the market
at the end of the year.
8 Paper losses: 1% - 3%
1943 - 1% to 2%.
1949 - 2%
1954 - 2% to 3%
1960 - 1%
1963 - 2%
1984 - 2%
1985 - 3%
1988 - 2%
Here are all the cases since 1929 when the DJI was in a bull market
and the DJI closed more than 1.9% over the 21-day ma between December
18th and December 20th, as has just happened in 2016.
Date
close/
Resulting DJI action.
21-dma
--------------------------------------------------------------
12/17/1942 1.029
118.7 to 136 in March 1943
12/20/1943 1.023
136.1 to 141 in March 1944
12/16/1949 1.019
198 to 224 in June 1950
12/20/1954 1.023
397 to 419 in March 1955
12/19/1956 1.024
494 rally only end of year where S16 occurred.
12/19/1958 1.024
573 to 640 in May 1959
12/18/1959 1.024
676 rally only end of year where S9 occurred.
12/19/1960 1.024
616 to 700 in May 1961
12/17/1963 1.023
766 to 830 in July 1961
12/18/1970 1.027
825 to 950 in April 1971 (start of bull market)
12/20/1971 1.048
885 to 970 in April 1972 (start of recovery after sell-off)
12/18/1984 1.02
1212 to 1275 in Feb. 1985
12/19/1985 1.035
1544 to 1800 in May 1986
12/19/1988 1.029
2173 to 2325 in Feb 1989|
12/19/2003 1.029
10278 to 10700 in Feb 2004
12/16/2010 1.02
11499 to 12700 in April 2011
12/20/2011 1.022
12104 to 13100 in April 2012
Tiger/Peerless Charts:
12/21/16:
Peerless
DJIA and A/D Line
DJI-OBVPCT
Hourly DJIA
S&P
OEX
NYSE
NASDAQ
DIA
QQQ SPY
IWM
Short-Term Rates
DJI-Utilities
REITS
A/D Line-6000 Stocks
SOXL TECL
FAS
Crude Oil
12/21/16:
Bullish MAXCPs
Bearish MINCPs
             RANKING OF KEY DIRECTORIES BASED PCT.OF STOCKS ABOVE 65-DMA
             12/21/16
---------------------------------------------------------------------------------------
Directory     Current       day-1         day-2         day-3         day-4         day-5
----------------------------------------------------------------------------------------
BIGBANKS       100%          1             1             1             1             1
EDU            100%          1             1             1             1             1
REGBANKS       .972          .972          .972          .972          .972          .972
AUTO           .925          .95           .95           .925          .925          .9
INSURANC       .911          .911          .882          .852          .852          .852
INFRA          .909          .909          .909          .909          .909          .909
TRANSP         .904          .904          .904          .904          .904          .904
HOMEBLDG       .888          .833          .833          .833          .833          .777
FINANCE        .849          .849          .849          .87           .86           .849
JETS           .818          .818          .818          .818          .818          .818
DOWJONES       .8            .8            .833          .8            .8            .8
GAMING         .777          .777          .777          .777          .777          .777
PIPELINE       .777          .666          .666          .666          .444          .444
OILGAS         .767          .784          .779          .784          .761          .767
CHEM           .756          .743          .792          .78           .756          .756
INDMATER       .742          .752          .752          .772          .792          .772
NIFTY          .742          .8            .771          .685          .714          .771
SP-100         .742          .752          .773          .752          .793          .773
MILITARY       .725          .745          .745          .705          .725          .705
RUS-1000       .7            .716          .709          .691          .684          .675
ELECTRON       .692          .701          .701          .684          .692          .671
SP500          .691          .701          .699          .687          .683          .667
GREEN          .677          .677          .677          .677          .677          .645
SEMI           .669          .669          .669          .654          .669          .616
RETAIL         .666          .703          .648          .666          .74           .722
INDEXES        .655          .676          .668          .689          .663          .663
UTILITY        .652          .717          .673          .586          .456          .413
COMPUTER       .64           .64           .68           .64           .68           .6
NASD-100       .627          .648          .638          .595          .648          .648
REIT           .614          .69           .649          .588          .512          .543
COAL           .555          .555          .666          .888          1             .888
COMODITY       .464          .464          .521          .577          .605          .591
SOFTWARE       .461          .507          .507          .492          .507          .507
BIOTECH        .38           .394          .384          .387          .404          .377
SOLAR          .375          .375          .375          .312          .312          .312
HACKERS        .333          .38           .38           .285          .38           .333
ETFS           .25           .308          .294          .308          .352          .367
HOSPITAL       .25           .25           .25           .25           .25           .125
BEVERAGE       .238          .285          .38           .38           .333          .285
FOOD           .2            .2            .333          .4            .4            .4
GOLD           .178          .178          .125          .16           .142          .16
CHINA          .131          .118          .144          .157          .157          .197
BONDFUND       .036          .018          .018          .009          .009          .009
===================================================================================
Peerless/TigerSoft Hotlines and
Links
12-20-2016 The DJIA is now just 25 points from 20,000!
Our Buy B4 and the Bullish Santa Claus
Rally Period should produce a breakout past
that magic level soon.
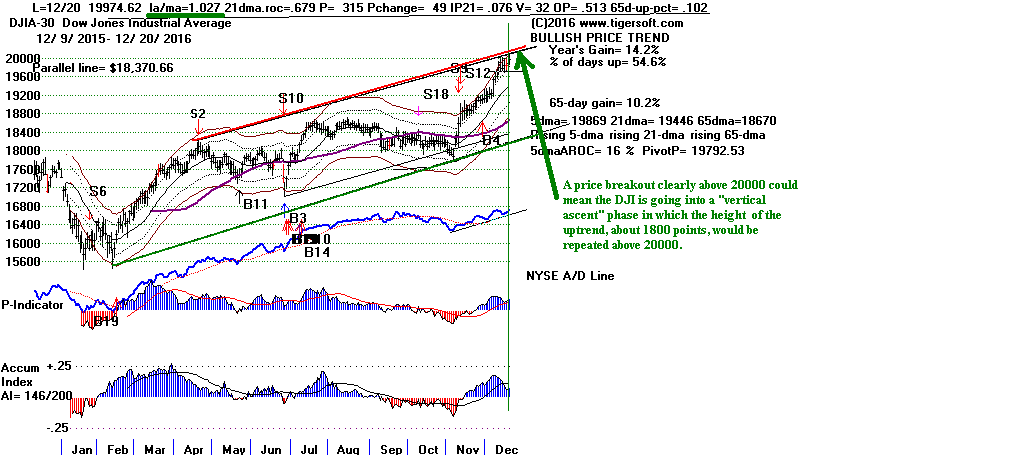
See how many key ETFs, Indexes and stocks have flat
tops after small retreats. These usually bring price
breakouts. So, that is a source of bullish optimism here.
So, is the finding in yesterday's Hotline that the DJI
has always since 1965 gone significantly when it was
more than 2% over the 21-day ma on December 19th
or 20th. The DJI is now 2.7% over the 21-day ma.
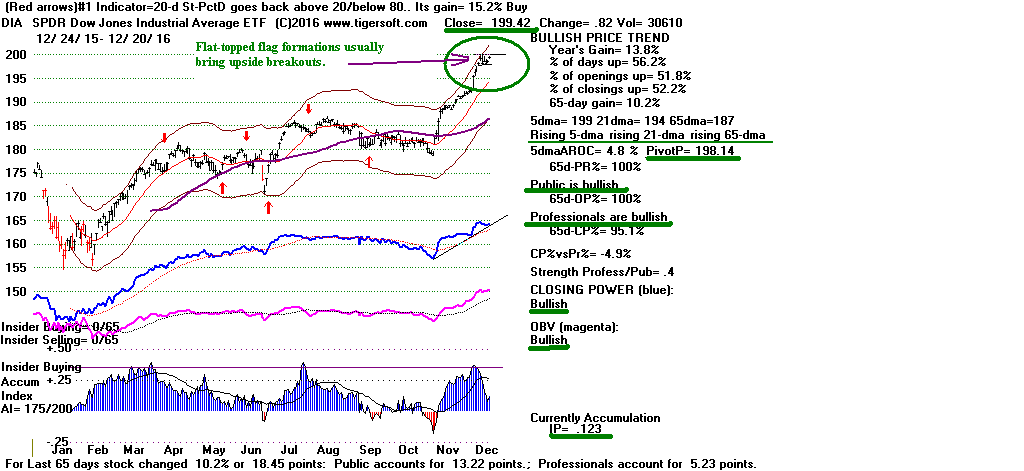
Tiger/Peerless Charts:
12/20/16:
Peerless
DJIA and A/D Line
DJI-OBVPCT
Hourly DJIA
S&P
OEX
NYSE
NASDAQ
DIA
QQQ SPY
IWM
Short-Term Rates
DJI-Utilities
REITS
A/D Line-6000 Stocks
SOXL TECL
FAS
Crude Oil
Regional Banks are the sector that has advanced the
most since Trump's election. A strong advance by
FAS
would
constitute a breakout BUY above a flat top.
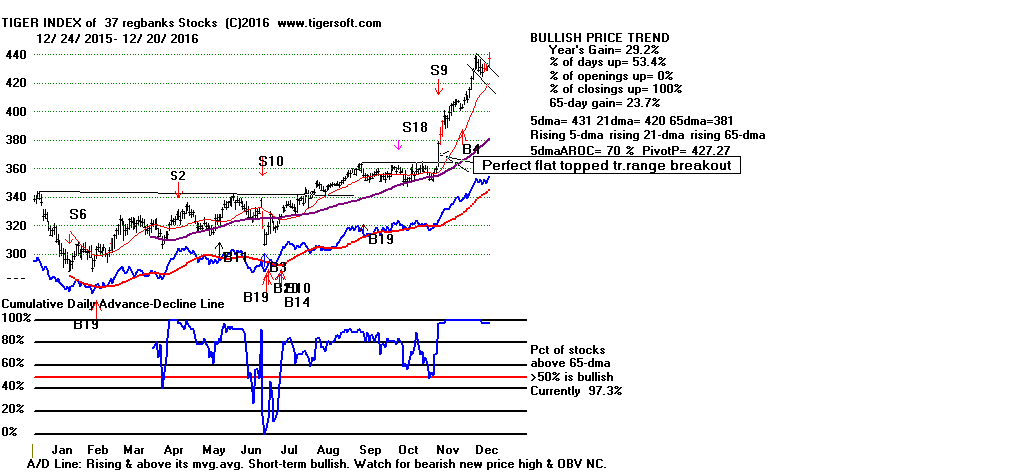
12/20/2016:
Bullish MAXCPs (Regional
banks remain the leaders.)
Bearish
MINCPs
12/20/16:
Bank Stocks - DB (Deutsche
Bank), WFC (Wells Fargo), GS
(Goldman Sachs),
FAS,
Super Stock -
NVDA
Stocks:
AAPL, BIDU,
IBM, TXN,
AMZN, CAT, FB,
GOOG, JPM,
MSFT,
TXN
ETFS:
BBH, BRZU,
DIA, DUST,
FAS, GASL,
GLD, IWM,
JETS,
JNUG, KOL, MDY,
NUGT, OIH, OIL,
RETL,
RSX, SLV,
SOXL, TECL,
TMF, TNA,
UGAZ, UPW,
VGK, YINN
A Golden Green Age for Banks Lies Ahead.
Quite apart from technicals and market history, we
would do
well to appreciate how extraordinarily bullish lower taxes and
"deregulation" are for Wall Street and corporate America. If Trump can
avoid being lured into unproductive personal squabbles,
like today's with Bill Clinton or his Saturday Night Live
impersonator, Alex Baldwin, next year should be as bullish
as Coolidge's Administration was in 1925.
I think it is not at all clear yet that Trump has the self-control to keep
his focus on carrying through on his economic targets. More and
more of his political enemies will surely goad and annoy him, so
that he is distracted and becomes angry.

Pres. Calvin Coolidge - 1928.
Even so, the Republican control of Congress and
Trump's
campaign promises to lower taxes and cut regulations will
do wonders for Banks and Finance companies.
I started making a list of the many changes in laws and regulations
that seem likely to occur in the years ahead. Each will make more money
for all Banks, Finance companies and Brokerages. When you
look through this list, you will see that lower corporate and capital gains
taxes
are just the beginning of the new Money-Green Revolution on
Wall Street.
1) It's a certainty I think that Spending
cuts will especially
hit regulatory staff in the banking, finance and brokerage industries..
2) Banks will soon be allowed to merge and dominate competition.
The prospect of mergers will surely run up the Regional Banks stocks.
Trusts were one of the hall-marks of the 1920s.
3) Commercial Banks will probably be allowed to go into the
Brokerage and Underwriting Businesses and vice verse.
No more Dodd Frank.
4) The Big Banks will be allowed to get even bigger. Regional
banking may disappear just as Intra-State banking did.
5) Banks will surely be allowed to use more leverage to make more
questionable loans, to buy out one another and to buy shares of stock.
6) Insider trading will not be much enforced. Big banks will rampantly
rig and manipulate stocks, as they did in 1920s.
7) Consumer protection provisions in existing bank
loan laws
will surely be whittled away.
8) Personal Bankruptcies will become harder so that Banks
and Finance Companies will be protected from those who refuse
to honor their personal debts. For example, in the 1920s
consumer goods could be repossessed if the customer failed to make
just one payment.
9) Enforcement of existing laws will be reduced even below
Obama's Justice Department's low standards. Wall Street and
the Banking Industries will be self-regulating as they were
in the 1920s. The mantras of "Transparency" and "Accountability"
will be replaced by the slogans, "Due diligence", "Let the buyer beware"
and, above all, "Let the Devil take the hindmost".
10) Time-consuming "Compliance"will be dramatically reduced.
11) Laws making government officials wait for
a year or more
before they take a job in the industry that they used to regulate
will probably be changed or go unenforced. Similarly,
laws requiring divestitures and blind trusts for those moving
from the private to the government sector will likely be
voided or will go unenforced.
12) Margin requirements will be lowered to facilitate more
Public trading.
13) Medicare and Social Security could become so shredded so that
individuals will then be forced to try to invest and speculate
just as the stock market gets even more over-bought.
RANKING OF KEY DIRECTORIES BASED PCT.OF STOCKS ABOVE 65-DMA
               12/20/16
---------------------------------------------------------------------------------------
Directory     Current       day-1         day-2         day-3         day-4         day-5
----------------------------------------------------------------------------------------
BIGBANKS       100%          1             1             1             1             1
EDU            100%             1             1             1             1             1
REGBANKS       .972          .972          .972          .972          .972          1
AUTO           .95           .95           .925          .925          .9            .95
INSURANC       .911          .882          .852          .852          .852          .852
INFRA          .909          .909          .909          .909          .909          .909
TRANSP         .904          .904          .904          .904          .904          .904
FINANCE        .849          .849          .87           .86           .849          .86
HOMEBLDG       .833          .833          .833          .833          .777          .888
JETS           .818          .818          .818          .818          .818          .818
DOWJONES       .8            .833          .8            .8            .8            .833
NIFTY          .8            .771          .685          .714          .771          .828
OILGAS         .784          .779          .784          .761          .767          .831
GAMING         .777          .777          .777          .777          .777          .777
INDMATER       .752          .752          .772          .792          .772          .841
SP-100         .752          .773          .752          .793          .783          .793
MILITARY       .745          .745          .705          .725          .705          .784
CHEM           .743          .792          .78           .756          .756          .792
UTILITY        .717          .673          .586          .456          .413          .695
RUS-1000       .716          .709          .691          .684          .676          .748
RETAIL         .703          .648          .666          .74           .722          .796
ELECTRON       .701          .701          .684          .692          .671          .719
SP500          .701          .699          .687          .683          .669          .754
REIT           .69           .649          .588          .512          .538          .639
GREEN          .677          .677          .677          .677          .645          .741
INDEXES        .676          .668          .689          .663          .663          .697
SEMI           .669          .669          .654          .669          .616          .669
PIPELINE       .666          .666          .666          .444          .444          .666
NASD-100       .648          .638          .595          .648          .659          .712
COMPUTER       .64           .68           .64           .68           .6            .68
COAL           .555          .666          .888          1             .888          1
SOFTWARE       .507          .507          .492          .507          .507          .553
COMODITY       .464          .521          .577          .605          .591          .619
BIOTECH        .394          .384          .387          .404          .377          .394
HACKERS        .38           .38           .285          .38           .333          .476
SOLAR          .375          .375          .312          .312          .312          .375
ETFS           .308          .294          .308          .352          .367          .485
BEVERAGE       .285          .38           .38           .333          .238          .333
HOSPITAL       .25           .25           .25           .25           .125          .125
FOOD           .2            .333          .4            .4            .4            .4
GOLD           .178          .125          .16           .142          .16           .232
CHINA          .118          .144          .157          .157          .197          .197
BONDFUND       .027          .027          .009          .009          .009          .018
============================================================
12-19-2016 Operative Buy B4 and Bullish Santa Claus
Rally Period should produce another rally
until Year's end.
But we will likely need to see breakouts not
only by the DJI, but by the
NASDAQ, QQQ
and TECL. The market must not narrow
and
depend too much on Financials and Big Big Banks.
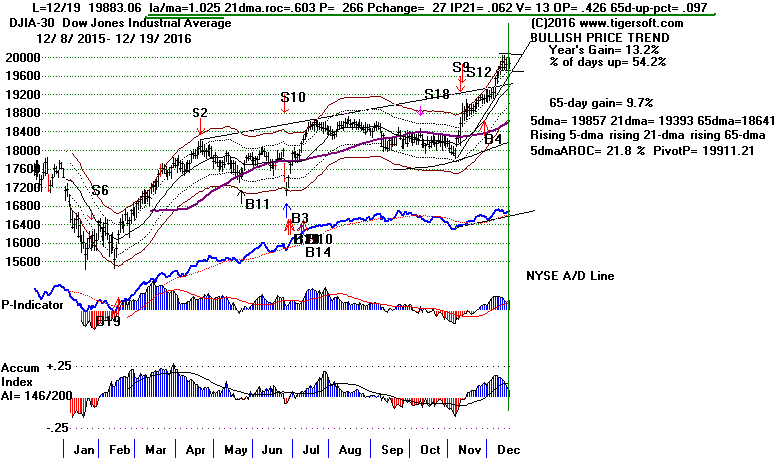
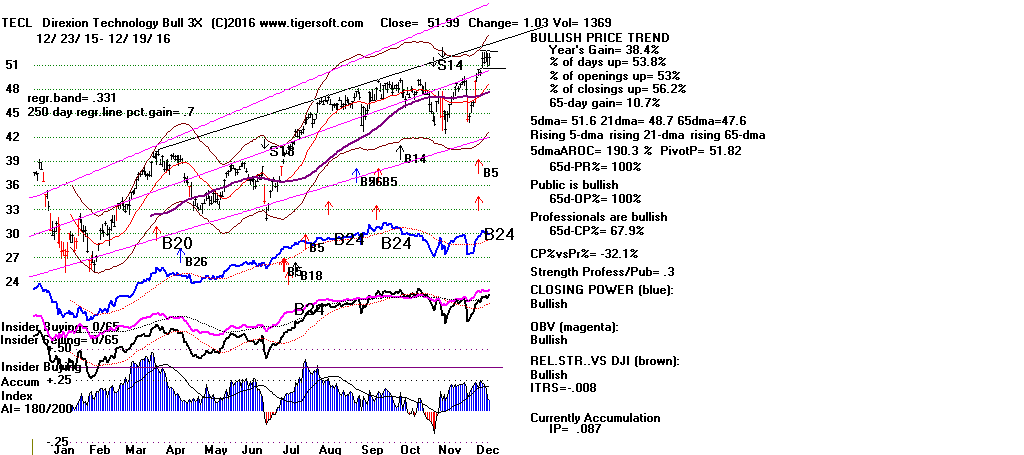
There is ample reason to be optimistic.
Trump's victory
puts very, very wealthy businessmen in charge. For the
immediate-term and intermediate-term futures, this is exactly
what Wall Street wants. The rising market is betting that
the impulsive, shoot-from-the-hip Trump will be subordinated
by the Trump who has grand plans to revitalize the US economy and
re-industrialize America. In due time, we will be better able to answer
the most important question: Is Trump "crazy like a fox" or
just plain crazy? It will be interesting!
Yes, Trump will have his loud opponents.
But Wall Street will probably ignore them.
For now, this is not a market where Public dissidents will have much effect.
It is a very professional market, unlike the one Nixon had to cope with
that declined soon after he was elected. It is much more like the DJI in
1919 when even strikes and race riots had little or no effect on a bull
market. It was the Fed that deliberately engineered a market top back then
to
curb the post war surge of price-inflation and brought on the severe
decline in 1920-1921.
The Bloody, Bull Market of 1919 demonstrates that Wall Street
can remain insulated from lots of civil strife for a long time.
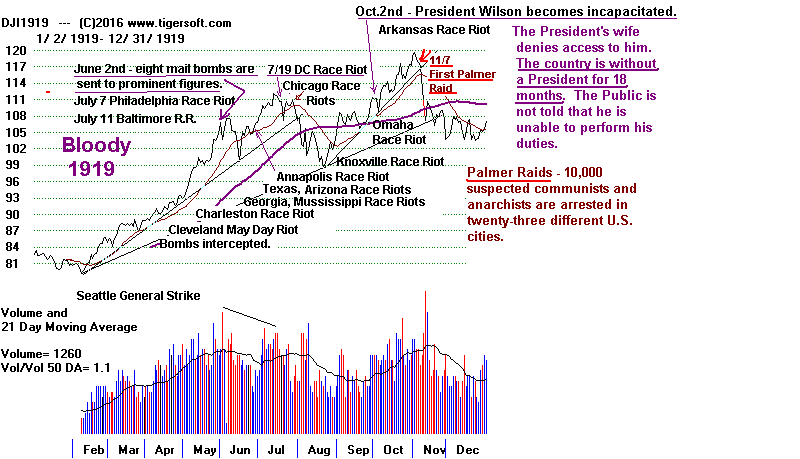
Another point: if the DJI were, in fact, going to go higher, we would expect
to see exactly what we see now, namely beaded flat-tops in its price-line which
beckon for breakouts.
New Research
The DJIA now is 2.5% over the 21-day ma.
This is quite
strong for mid-December.
What has happened in the past when DJI was more than 2%
over the 21-day ma between December 18th and 20th going back to 1965
and leaving out the cases where it was in a bear market on a Peerless Sell.
Answer: Nearly always the DJI went
considerably higher. Below are all the
cases since 1965. There were no significant paper losses.
12/18/1970
1.027 825 to 950 in April 1971 (start of bull market)
12/20/1971
1.048 885 to 970 in April 1972 (start of recovery after
sell-off)
12/18/1984
1.02 1212 to 1275 in Feb. 1985
12/19/1985
1.035 1544 to 1800 in May 1986
12/19/1988
1.029 2173 to 2325 in Feb 1989|
12/19/2003
1.029 10278 to 10700 in Feb 2004
12/16/2010
1.02 11499 to 12700 in April 2011
12/20/2011
1.022 12104 to 13100 in April 2012
(See all the charts
here.)
Tiger/Peerless Charts:
12/19/16:
Peerless
DJIA and A/D Line
DJI-OBVPCT
Hourly DJIA
S&P
OEX
NYSE
NASDAQ
DIA
QQQ SPY
IWM
Short-Term Rates
DJI-Utilities
REITS
A/D Line-6000 Stocks
SOXL TECL
FAS
Crude Oil
12/19/2016:
Bullish MAXCPs
Bearish MINCPs
12/19/16:
Bank Stocks - DB (Deutsche
Bank), WFC (Wells Fargo), GS
(Goldman Sachs),
FAS,
Super Stock -
NVDA
Stocks:
AAPL, BIDU,
IBM, TXN,
AMZN, CAT, FB,
GOOG, JPM,
MSFT,
TXN
ETFS:
BBH, BRZU,
DIA, DUST,
FAS, GASL,
GLD, IWM,
JETS,
JNUG, KOL, MDY,
NUGT, OIH, OIL,
RETL,
RSX, SLV,
SOXL, TECL,
TMF, TNA,
UGAZ, UPW,
VGK, YINN
RANKING OF KEY DIRECTORIES BASED PCT.OF STOCKS ABOVE 65-DMA
              12/19/16
---------------------------------------------------------------------------------------
Directory     Current       day-1         day-2         day-3         day-4         day-5
----------------------------------------------------------------------------------------
BIGBANKS       100%          1             1             1             1             1
EDU            100%          1             1             1             1             1
REGBANKS       .972          .972          .972          .972          1             1
AUTO           .95           .925          .925          .9            .95           .975
INFRA          .909          .909          .909          .909          .909          .909
TRANSP         .904          .904          .904          .904          .904          .904
INSURANC       .882          .852          .852          .852          .852          .852
FINANCE        .847          .869          .858          .847          .858          .869
DOWJONES       .833          .8            .8            .8            .833          .766
HOMEBLDG       .833          .833          .833          .777          .888          .888
JETS           .818          .818          .818          .818          .818          .818
CHEM           .792          .78           .756          .756          .804          .804
OILGAS         .779          .784          .761          .767          .831          .802
GAMING         .777          .777          .777          .777          .777          .777
SP-100         .773          .752          .793          .783          .793          .762
NIFTY          .771          .685          .714          .771          .828          .8
INDMATER       .752          .772          .792          .772          .841          .851
MILITARY       .745          .705          .725          .705          .784          .823
RUS-1000       .709          .691          .684          .676          .744          .724
ELECTRON       .703          .685          .694          .672          .72           .685
SP500          .699          .687          .683          .669          .752          .716
COMPUTER       .68           .64           .68           .6            .68           .68
GREEN          .677          .677          .677          .645          .741          .709
UTILITY        .673          .586          .456          .413          .673          .565
SEMI           .671          .656          .671          .619          .671          .634
INDEXES        .668          .689          .663          .663          .697          .697
COAL           .666          .888          1             .888          1             1
PIPELINE       .666          .666          .444          .444          .666          .444
REIT           .649          .588          .512          .538          .634          .67
RETAIL         .648          .666          .74           .722          .777          .777
NASD-100       .638          .595          .648          .659          .712          .648
COMODITY       .521          .577          .605          .591          .619          .605
SOFTWARE       .507          .492          .507          .507          .538          .492
BIOTECH        .384          .387          .404          .377          .394          .384
BEVERAGE       .38           .38           .333          .238          .333          .333
HACKERS        .38           .285          .38           .333          .428          .428
SOLAR          .375          .312          .312          .312          .375          .375
FOOD           .333          .4            .4            .4            .4            .4
ETFS           .294          .308          .352          .367          .485          .441
HOSPITAL       .25           .25           .25           .125          .125          .125
CHINA          .144          .157          .157          .197          .197          .184
GOLD           .125          .16           .142          .16           .25           .232
BONDFUND       .027          .009          .009          .009          .018          .018
============================================================
12-16-2016 Operative Buy B4 and Bullish Santa Claus
Rally Period should produce another rally.
But we will likely need to see more groups stage
good advances. Otherwise, we will get a Peerless
Sell signal because of a dangerous deterioration in
our breadth and Accumulation indicators.
Do not underestimate the bullish seasonal forces now at work. Since
1965, the DJI has risen
almost 80% of the time over the ten trading days following December 18th.
The average gain
was more than 1.7%. For decades, Wall Street sages have pointed to
the "Santa Claus
effect" and how nicely a rally nearly always marks the end of the year.
With some theories,
so much discussion and agreement would long ago have destroyed the concept's
reliability.
That is not true of the "Santa Claus" rally, even when the DJI already seems
over-extended,
Look below simply at the data from 1999 to 2016. Buying on December 18th
in a rising market,
like now, would have consistently made a trader money provided he then sold on
the next Peerless
Sell or sometime in January.
December 18th
DJI - Price
1999 11257.43
11484.86 12/29/1999 Sell S16
2000 10645.42 low 12/20
10318.93 10912.41 1/4/2001
Sell S12
2003 10248.08
10702.51 1/26/2004
2004 10649.92
10854.54 12/28/2004 No Sell. Decline to
10368. Then rally to 10936-S4..
2005 10875.59
11043.44 1/11/2006 No Sell.
Decline to 10667. Then rally to 11164--S9..
2006 12441.87
12786.04 2/20/2007
2009 10398.89
10725.43 1/19/2010
2010 11491.91
12391.95 2/28/2011
2011 11868.81
13232.62 3/16/2012 Sell S1
2012 13250.96 low 13190.84
15409.39 5/28/2013
2013 16167.97
16577.66 12/31/2013 Sell S16
2014 17778.15
18288.63 3/8/2014
2015 17128.55
17720.98 12/29/2016 Sell S16
Rising Interest Rates
The 1/4% rise in the Federal Funds' short-term rates has been translated
into far more
meaningful jumps in longer term rates. These will ripple through the
economy. Since November 4th,
the 30 year mortgages have risen from 2.59% to 3.19%. The yield on the
much-watched 10-year year bonds has gone from 1.78% to 2.59%. As a result,
we
have seen recent pullbacks in a number of stock groups, particularly housing,
retailers
and industrial materials by 3% in the last three days.
Disparate rises in longer-term bonds may also partly explain the recent rise in
Finance stocks.
The rates that they will loan out money has gone up much more than the rise in
what they
themselves must pay to borrow short-term.
The main technical problems now are that Volume is not expanding and Breadth is
not improving.
See the Hourly DJI's lagging OBV Line and
how a really bad breadth day now would break the
still uptrending NYSE A/D Line. The
DJI would probably still hold up or even rise if these
breakdown now because of the bullish seasonality. But such breakdowns
would make
for trouble when the Santa Claus effect is exhausted.
Unless we see clear breakouts this week by QQQ, TECL (technology) and the NASDAQ
to
new highs, it appears the market, as measured by the DJI and mostly powered by
Bank Stocks,
will be simply holding up where it is because of the bullish seasonality until
the end of the year.
Without more segments of the market participating, it will be hard for the
finance stocks to
power a big advance. Instead, there may be a temptation to take
profits early in 2017.
Quickly Deteriorating "IP21s" Brings Tiger
(Not Peerless)
Sell S18s Warnings.
Reflecting the interest rate outlook, we should note now the rapid deterioration
in our TigerSoft
Accumulation Index (IP21) readings for such ETFs as
DIA, SPY,
FAS, RETL,
MDY and
IWM.
When the IP21 (current Accum. Index drops by more than .20 in five trading days,
a Tiger Sell S17
can be produced using the user-selected Tiger Signals (under Signals(1).
This Tiger S18 is not a
sell on its own. But it is a warning that the next rally to the recent
highs is apt to fail unless volume
picks up, unless the hurried institutional distribution ends and unless
these ETFs can start closing again
near their daily highs. Unfortunately, Volume will probably be too low
this coming week to cause
these ETFs' Accumulation Index to improve by much. Thus, this will become
a warning for the
end of December.
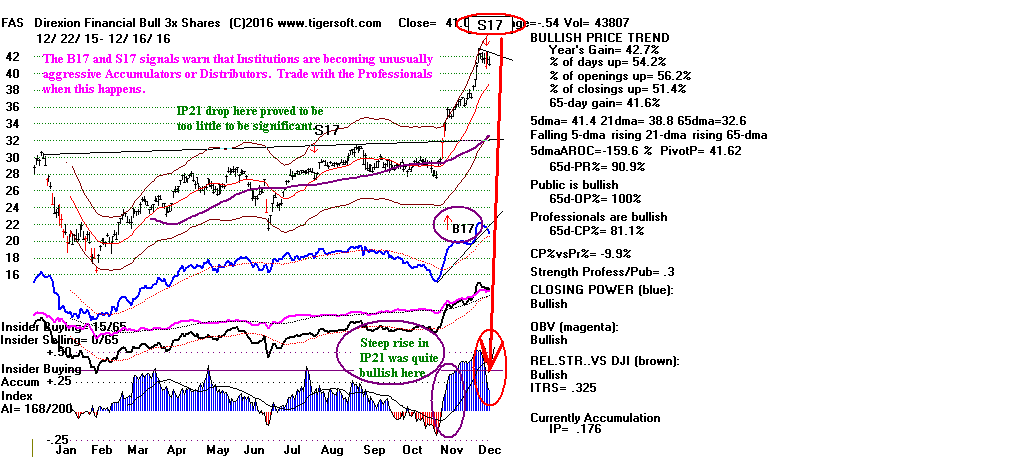
Hold ETFs Long Provided Their 5-day Moving
Averages
and Closing Powers are Rising.
This applies now to DIA, QQQ and TECL.
Tiger/Peerless Charts:
12/16/16:
Peerless
DJIA and A/D Line
DJI-OBVPCT
Hourly DJIA
S&P
OEX
NYSE
NASDAQ
DIA
QQQ SPY
IWM
Short-Term Rates
DJI-Utilities
REITS
A/D Line-6000 Stocks
SOXL TECL
FAS
Crude Oil
12/16/2016:
Bullish MAXCPs
Bearish MINCPs
12/16/16:
Bank Stocks - DB (Deutsche
Bank), WFC (Wells Fargo), GS
(Goldman Sachs),
FAS,
Super Stock -
NVDA
Stocks:
AAPL, BIDU,
IBM, TXN,
AMZN, CAT, FB,
GOOG, JPM,
MSFT,
TXN
ETFS:
BBH, BRZU,
DIA, DUST,
FAS, GASL,
GLD, IWM,
JETS,
JNUG, KOL, MDY,
NUGT, OIH, OIL,
RETL,
RSX, SLV,
SOXL, TECL,
TMF, TNA,
UGAZ, UPW,
VGK, YINN
 RANKING OF KEY DIRECTORIES BASED PCT.OF STOCKS ABOVE 65-DMA
               12/16/16
---------------------------------------------------------------------------------------
Directory     Current       day-1         day-2         day-3         day-4         day-5
----------------------------------------------------------------------------------------
BIGBANKS       100%          1             1             1             1             1
EDU            100%          1             1             1             1             1
REGBANKS       .972          .972          .972          1             1             1
AUTO           .925          .925          .9            .95           .975          .95
INFRA          .909          .909          .909          .909          .909          .909
TRANSP         .904          .904          .904          .904          .904          .952
COAL           .888          1             .888          1             1             1
FINANCE        .868          .857          .846          .857          .868          .901
INSURANC       .852          .852          .852          .852          .852          .852
HOMEBLDG       .833          .833          .777          .888          .944          .888
JETS           .833          .833          .833          .833          .833          .833
DOWJONES       .8            .8            .8            .833          .766          .7
OILGAS         .784          .761          .767          .831          .802          .813
CHEM           .78           .756          .756          .804          .804          .841
GAMING         .777          .777          .777          .777          .777          .777
INDMATER       .772          .792          .772          .841          .851          .851
SP-100         .752          .793          .783          .793          .762          .721
MILITARY       .705          .725          .705          .784          .823          .823
RUS-1000       .691          .684          .676          .744          .724          .738
INDEXES        .689          .663          .663          .697          .697          .668
SP500          .687          .683          .669          .752          .718          .711
ELECTRON       .685          .694          .672          .72           .681          .707
NIFTY          .685          .714          .771          .828          .8            .771
GREEN          .677          .677          .645          .741          .709          .709
PIPELINE       .666          .444          .444          .666          .444          .444
RETAIL         .666          .74           .722          .777          .777          .851
SEMI           .656          .671          .619          .671          .634          .656
COMPUTER       .64           .68           .6            .68           .68           .68
NASD-100       .595          .648          .659          .712          .659          .659
REIT           .588          .512          .538          .634          .664          .664
UTILITY        .586          .456          .413          .673          .565          .434
COMODITY       .577          .605          .591          .619          .619          .605
SOFTWARE       .492          .507          .507          .538          .507          .523
FOOD           .4            .4            .4            .4            .4            .4
BIOTECH        .389          .406          .379          .396          .386          .433
BEVERAGE       .38           .333          .238          .333          .333          .333
SOLAR          .312          .312          .312          .375          .375          .375
ETFS           .308          .352          .367          .485          .411          .441
HACKERS        .285          .38           .333          .428          .476          .523
HOSPITAL       .25           .25           .125          .125          .125          .125
GOLD           .16           .142          .16           .25           .232          .214
CHINA          .157          .157          .197          .197          .184          .236
BONDFUND       .009          .009          .009          .018          .018          .018
========================================================================
12-15-2016 Buy B4 Still Operates.
We will be entering the very bullish last two weeks of December
on Monday when the DJI typically rises 2% and 90% of time
over the next two weeks. The Peerless programs, as a result, do
not do not easily produce Sell signals at this time of the year.
When a Republican has won the Presidential Election in a rising
market, there have been no tops for at least two weeks, except for
Nixon and December 1968. Unless one wants to compare how
divided the country was then over the war in Viet Nam with how
politically divided the country is now, bullishness seems appropriate.
I think we have to let Professionals show us when to sell. As all the
major market ETFs' Closing Powers are above their rising 21-dma,
let's see if the DJI can get past
20,000. This old bull market might
then start another leg up as it did in 1925, 1989 and 1995.
Stay long GS,
AAPL and TECL while their Closing Powers
and 5-day mvg.
averages are rising. Traders watch for the flat top breakouts shown
in our new Leveraged Opportunity
Patterns' Section.
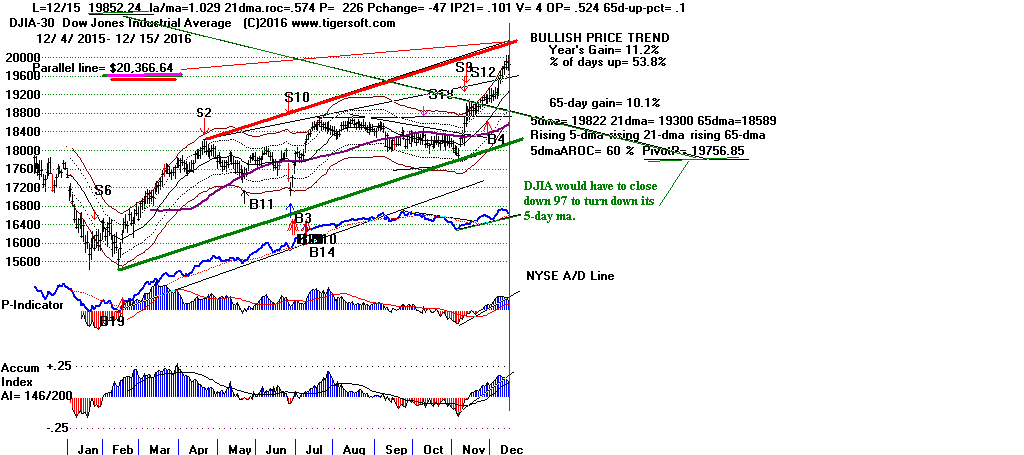
Bullishly, the DJI has been unable to produce two straight down days since
Trump's victory. Do not underestimate Trump's wealthier true believers
or the bullishness of prospects of much lower taxes and fewer
government regulations on corporations. Keep in mind the
image of the "Roarin' 1920s". That is what Trump is aiming for.
Many of the indexes, like the NASDAQ,
NYSE, OEX
and SP-500
have reached overhead resistance lines. But if the new Buy B4 is
right, then we could see take-offs in the market as happened between
1924-1925, 1988-1989 and 1994-1995. At least, at this stage,
I would want to give the market a chance to breakout above 20000
for as long as Professionals keep pushing upwards our Closing Powers
on all the major ETFs.
Current Volume and OBVPCT of DJIA Chart
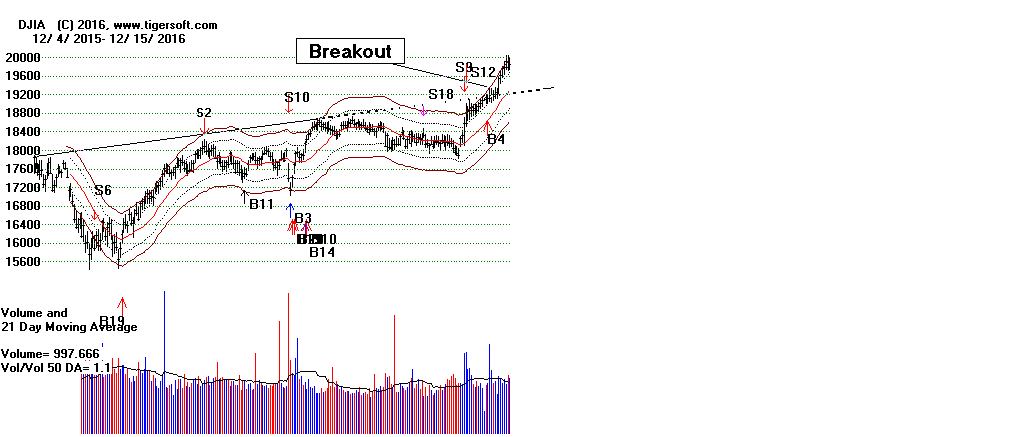

What makes the DJI (above) so bullish now is the complete switch from
red (bearish) to blue (bullish) by the Tiger OBVPct Indicator. See above
how it has risen from below -.37 to above +.65 in only six weeks. This is
much
more dramatic a turn-around than in any of the 3 cases below or any
other situation I can find in a Presidential Election November. Viewed
this way,
The closest parallel would seem to be just before the 1995 take-off that started
the
huge advance until early 2000.
However, the case where the Republican Nixon won the White House
in 1968 should also be mentioned. Then too, but in early October before
the election,
the DJI's OBVPct Indicator moved up a long way and reached +.692. Because
of the unpopular War in Viet Nam and inflationary pressures, the FED
started raising rates in December 1968 and the DJI peaked seven weeks after
the OBVPct's peak. If we take this as the worst case, then the DJI would
next
peak seven weeks after December 8th this year when the OBVPct hit its
high at +.658. My sense is that the broader Public played a far greater
role in the
market back then. Stocks are traded and owned by far fewer individual
members
of the Public now. So, a divided Public is less significant now, though
the political
chasm seems just as wide.
1968-1969 Bull Market Peak in early December
Republican Nixon Wins. Inflation. Higher Interest Rates. Unpopular
War...
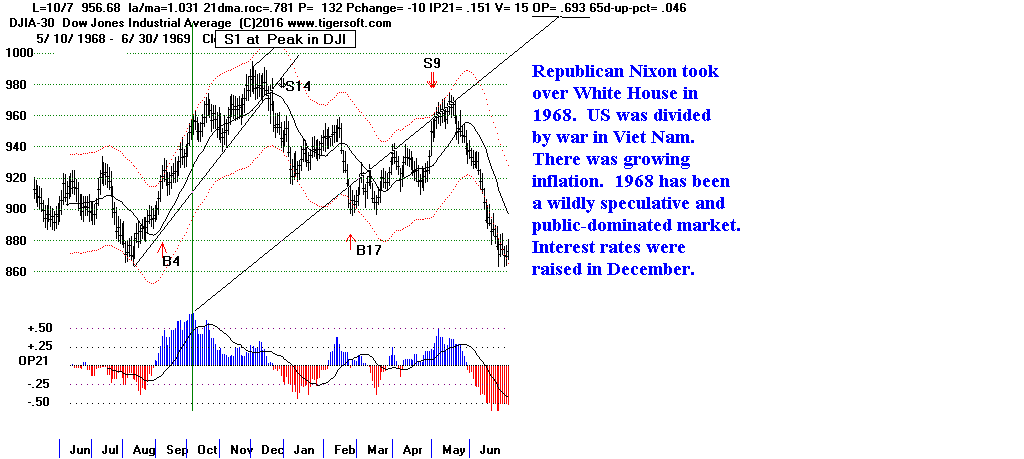
1924-1925: Republican Coolidge Wins
December and January Strong
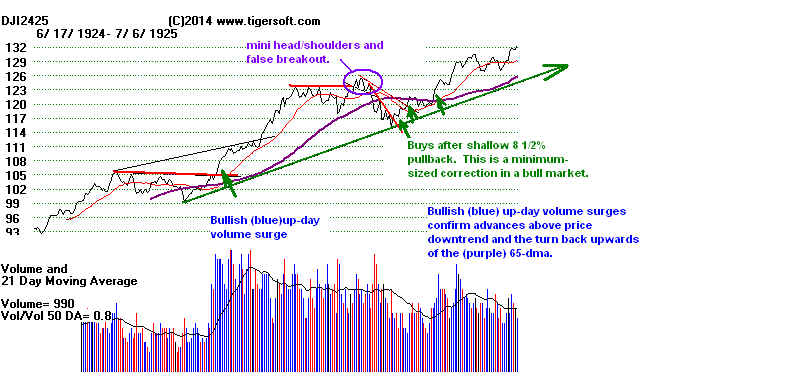

1988-1989 Republican Bush-I Wins
December strong, Breakout in February
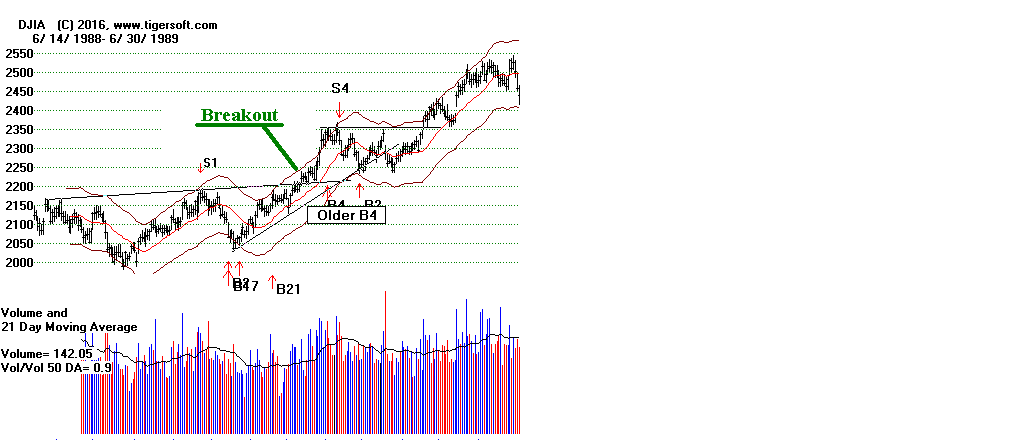

1994-1995: Republicans Win Congress
December strong, Breakout in February
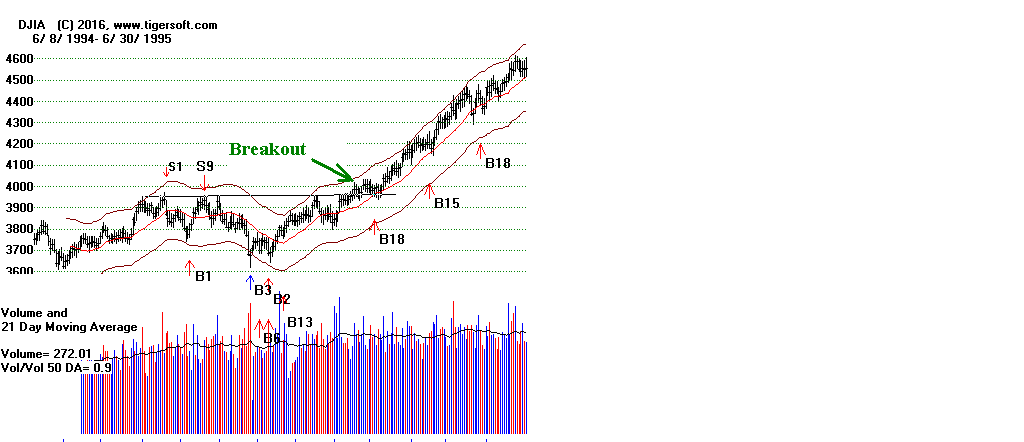

Tiger/Peerless Charts:
12/15/16:
Peerless
DJIA and A/D Line
DJI-OBVPCT
Hourly DJIA
S&P
OEX
NYSE
NASDAQ
DIA
QQQ SPY
IWM
Short-Term Rates
DJI-Utilities
REITS
A/D Line-6000 Stocks
SOXL TECL
FAS
Crude Oil
12/15/2016: New:
Leveraged ETFS' Opportunity Patterns:
Flat Topped Breakouts.
Bullish MAXCPs
Bearish MINCPs
12/15/16:
Bank Stocks - DB (Deutsche
Bank), WFC (Wells Fargo), GS
(Goldman Sachs),
FAS,
Super Stock -
NVDA
Stocks:
AAPL, BIDU,
IBM, TXN,
AMZN, CAT, FB,
GOOG, JPM,
MSFT,
TXN
ETFS:
BBH, BRZU,
DIA, DUST,
FAS, GASL,
GLD, IWM,
JETS,
JNUG, KOL, MDY,
NUGT, OIH, OIL,
RETL,
RSX, SLV,
SOXL, TECL,
TMF, TNA,
UGAZ, UPW,
VGK, YINN
 RANKING OF KEY DIRECTORIES BASED PCT.OF STOCKS ABOVE 65-DMA
              12/15/16
---------------------------------------------------------------------------------------
Directory     Current       day-1         day-2         day-3         day-4         day-5
----------------------------------------------------------------------------------------
BIGBANKS       100%          1             1             1             1             1
COAL           100%          .888          1             1             1             1
EDU            100%          1             1             1             1             1
REGBANKS       .972          .972          1             1             1             1
AUTO           .925          .9            .95           .975          .95           .95
INFRA          .909          .909          .909          .909          .909          .909
TRANSP         .904          .904          .904          .904          .952          .952
FINANCE        .857          .846          .857          .868          .901          .89
INSURANC       .852          .852          .852          .852          .852          .882
HOMEBLDG       .833          .777          .888          .944          .888          .944
JETS           .833          .833          .833          .833          .833          .916
DOWJONES       .8            .8            .833          .766          .7            .633
SP-100         .793          .783          .793          .762          .721          .69
INDMATER       .792          .772          .841          .851          .851          .871
GAMING         .777          .777          .777          .777          .777          .777
OILGAS         .761          .767          .831          .802          .813          .808
CHEM           .756          .756          .804          .804          .841          .853
RETAIL         .74           .722          .777          .777          .851          .87
MILITARY       .725          .705          .784          .823          .823          .823
NIFTY          .714          .771          .828          .8            .771          .771
ELECTRON       .694          .672          .72           .681          .707          .703
RUS-1000       .684          .676          .744          .724          .737          .723
SP500          .683          .669          .752          .718          .711          .693
COMPUTER       .68           .6            .68           .68           .68           .64
GREEN          .677          .645          .741          .709          .709          .677
SEMI           .671          .619          .671          .634          .656          .656
INDEXES        .668          .663          .697          .697          .668          .638
NASD-100       .648          .659          .712          .659          .659          .617
COMODITY       .605          .591          .619          .619          .605          .577
REIT           .512          .538          .634          .664          .664          .659
SOFTWARE       .507          .507          .538          .507          .523          .538
UTILITY        .456          .413          .673          .565          .434          .347
PIPELINE       .444          .444          .666          .444          .444          .444
BIOTECH        .406          .379          .396          .386          .43           .403
FOOD           .4            .4            .4            .4            .4            .333
HACKERS        .38           .333          .428          .476          .523          .428
ETFS           .352          .367          .485          .411          .426          .441
BEVERAGE       .333          .238          .333          .333          .333          .238
SOLAR          .312          .312          .375          .375          .375          .375
HOSPITAL       .25           .125          .125          .125          .125          0
CHINA          .157          .197          .197          .184          .236          .302
GOLD           .142          .16           .25           .232          .214          .267
BONDFUND       .009          .009          .018          .018          .018          .018
======================================================================
12-14-2016
The DJI's chart shows it has not reached its
rising resistance line. 12300
would achieve that. But 20000 may be a barrier until the bullishness
of the Santa Claus seasonality from December 17th to December 31st
kicks in. Since 1965, the DJI has risen 89% of the time in the 10 trading
days following December 17th. The average gain here is a whopping 2.1%.
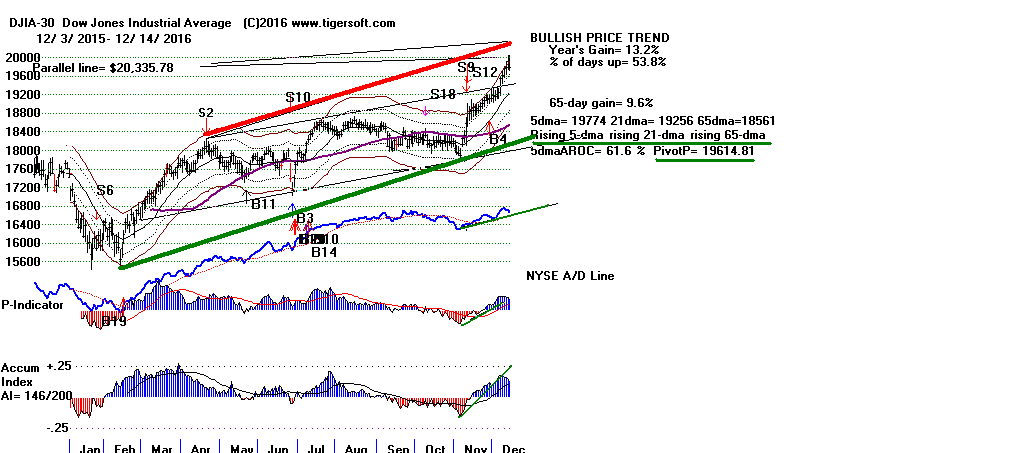
As long as TECL does not close below 48, its
flat-topped breakout into all-time territory
looks pretty good. Trump needs the support
of the biggest high tech companies as much
or more than they need him.
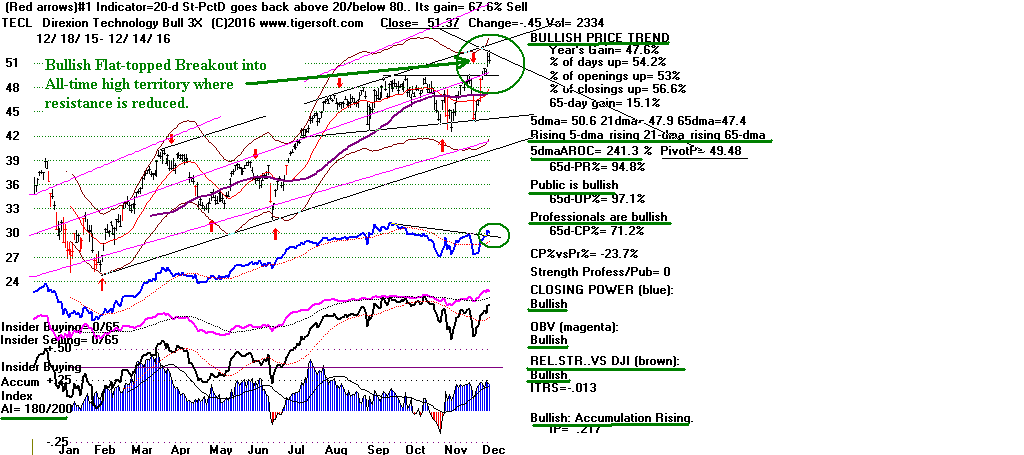
But first a little more pullback seems likely. The 5-day moving averages
have turned
down for FAS,
MDY and IWM.
SPY's will turn if it falls by more than 0.73
tomorrow.
Expect only a minor retreat in these.
Today's meeting between Trump and the CEOs of AMZN, GOOG, AAPL...
went well. I suppose it could have degenerated into a shouting match since
Trump during the Campaign questioned their patriotism in exporting so many jobs.
Instead, each of the CEOs was invited to call him directly if they had a
problem.
This appear promising. I would continue to buy/hold TECL (above) as long
as it does not
fail its breakout. The 5-day ma of GS
and AAPL are still rising, so I would
continue
to hold these.
Gold (below) broke below its recent support while the Dollar (UUP below) got
stronger.
Since Gold feeds on financial fear, I think we have to be optimistic that 12000
will be taken
out by the DJI before Inauguration Day. Gold and the Dollar are
nearly reverse
images of each other. Wall Street's Big Banks love a strong Dollar.
Trump may
have to choose between his wishes to create a new Manufacturing Base in America
and
the advise given by his Goldman Sachs graduates who will place a higher priority
on a
strong Dollar.

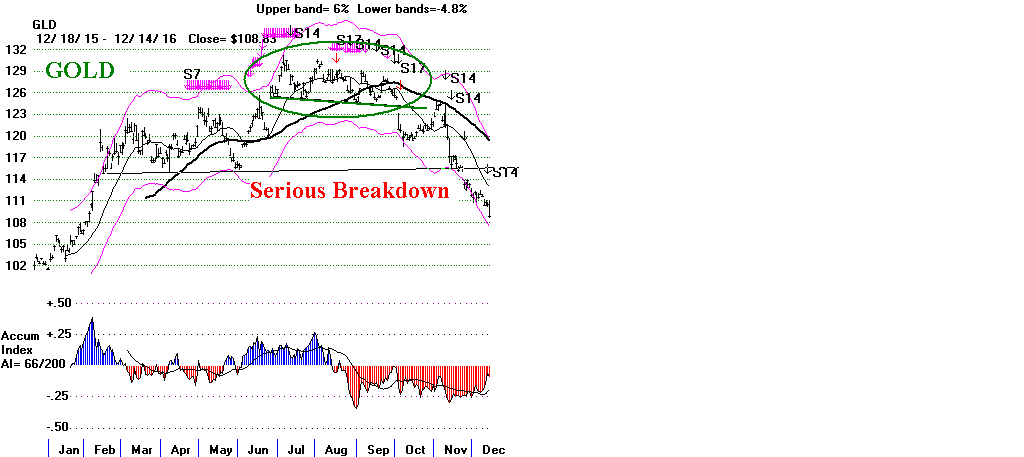
.
Will Trump Be Trumped by The Federal Reserve?
Though the Fed's rate hike today was
expected and quite minimal, Trump's new appointments
and optimistic plans for the US economy failed for once to dominate the news.
In addition,
Investors were reminded today, as they have not been for a month, that the new
President
will face many well-entrenched enemies to his policies. He will not easily
be able to launch a
grand program of Public Works. He will not easily get American
corporations not to invest
overseas. Janet Yellen's words today were a warning to him.
A Veiled Warning
Their clear implication was that a 4% national economic growth rate would surely
be
be inflationary and that would cause the Fed to raise interest rates to protect
the Dollar
and fight inflation. The unspoken message within her words was:
"You, Mr. President, may want to revive American manufacturing and get back
many of the jobs that went overseas, but we at the Fed have a different mission,
we seek a strong Dollar and very low inflation because that is what
our clients, the Big Banks, want. Maybe, a stronger Dollar will continue
to cause
American capital to go overseas for investment opportunities and make imports
cheap and exports more difficult, but those things are just not our
problem.
And at the first signs of Inflation, we will raise rates. We
understand that
this will make your task of borrowing to play for Public Works harder,
but that's not our problem. That's yours. And you better learn to
cooperate and
play by our rules, or we can make things very difficult for you."
http://www.npr.org/sections/thetwo-way/2016/11/17/502480053/federal-reserve-chair-throws-cold-water-on-trump-economic-plan
Fed's Number Two sends warning to Trump - Nov. 21, 2016
12/14/16:
Peerless
DJIA and A/D Line
DJI-OBVPCT
Hourly DJIA
S&P
OEX
NYSE
NASDAQ
DIA
QQQ SPY
IWM
Short-Term Rates
DJI-Utilities
REITS
A/D Line-6000 Stocks
SOXL TECL
FAS
Crude Oil
12/14/2016:
Bullish MAXCPs
Bearish MINCPs
Stocks:
AAPL, BIDU,
IBM, TXN
Bank Stocks - DB (Deutsche
Bank), WFC (Wells Fargo), GS (Goldman Sachs),
AMZN, CAT, FB,
GOOG, JPM,
MSFT, NVDA (Super Stock)
TXN
ETFS:
BBH, BRZU,
DIA, DUST,
FAS, GASL,
GLD, IWM,
JETS,
JNUG, KOL, MDY,
NUGT, OIH, OIL,
RETL,
RSX, SLV,
SOXL, TECL,
TMF, TNA,
UGAZ, UPW,
VGK, YINN
 RANKING OF KEY DIRECTORIES BASED PCT.OF STOCKS ABOVE 65-DMA
              12/14/16
---------------------------------------------------------------------------------------
Directory     Current       day-1         day-2         day-3         day-4         day-5
----------------------------------------------------------------------------------------
BIGBANKS       100%          1             1             1             1             1
EDU            100%          1             1             1             1             1
REGBANKS       .972          1             1             1             1             1
INFRA          .909          .909          .909          .909          .909          .909
TRANSP         .904          .904          .904          .952          .952          .904
AUTO           .9            .95           .975          .95           .95           .9
COAL           .888          1             1             1             1             1
INSURANC       .852          .852          .852          .852          .882          .852
FINANCE        .846          .857          .868          .901          .89           .879
JETS           .833          .833          .833          .833          .916          1
DOWJONES       .8            .833          .766          .7            .633          .666
SP-100         .783          .793          .762          .721          .69           .69
GAMING         .777          .777          .777          .777          .777          .888
HOMEBLDG       .777          .888          .944          .888          .944          .888
INDMATER       .772          .841          .851          .851          .871          .841
NIFTY          .771          .828          .8            .771          .771          .742
OILGAS         .767          .831          .802          .813          .808          .808
CHEM           .756          .804          .804          .841          .853          .853
RETAIL         .722          .777          .777          .851          .87           .814
MILITARY       .705          .784          .823          .823          .823          .862
RUS-1000       .676          .744          .724          .737          .721          .702
ELECTRON       .672          .72           .681          .707          .703          .685
SP500          .669          .752          .718          .711          .693          .685
INDEXES        .666          .7            .7            .67           .645          .645
NASD-100       .659          .712          .659          .659          .617          .617
GREEN          .645          .741          .709          .709          .677          .709
SEMI           .619          .671          .634          .656          .656          .619
COMPUTER       .6            .68           .68           .68           .64           .64
COMODITY       .591          .619          .619          .605          .577          .605
REIT           .538          .634          .664          .664          .654          .614
SOFTWARE       .507          .538          .507          .523          .538          .507
PIPELINE       .444          .666          .444          .444          .444          .444
UTILITY        .413          .673          .565          .434          .347          .304
FOOD           .4            .4            .4            .4            .333          .4
BIOTECH        .379          .396          .386          .43           .4            .362
ETFS           .367          .485          .411          .426          .441          .411
HACKERS        .333          .428          .476          .523          .428          .38
SOLAR          .312          .375          .375          .375          .375          .437
BEVERAGE       .238          .333          .333          .333          .238          .238
CHINA          .197          .197          .184          .236          .302          .342
GOLD           .16           .25           .232          .214          .267          .267
HOSPITAL       .125          .125          .125          .125          0             0
BONDFUND       .009          .018          .018          .018          .018          .018
=====================================================================
12-13-2016
The Peerless Buy B4 should keep the
market rising, though the
FED will have a lot to say about what happens for the next few days.
Expect the market to take off if the Feds do not raise rates. That was
what happened in early 1987 and in late 1999. Most observers expect
a 1/4% rate hike. More important will be what the FED hints it will do
if Trump does get a stimulus package through Congress.
(See warnings from NY Times:
http://www.nytimes.com/2016/12/13/business/economy/federal-reserve-interest-rates.html?emc=edit_th_20161214&nl=todaysheadlines&nlid=58223894
)
The DJI's 5-day moving average cannot easily turn down. Both its Opening
and Closing Power are still rising. Channel price resistance is expected
above
20,263. TECL's bullish breakout above its flat top in all-time high
territory
should be bought. Watch for news about Trump's meeting tomorrow with
high tech companies.
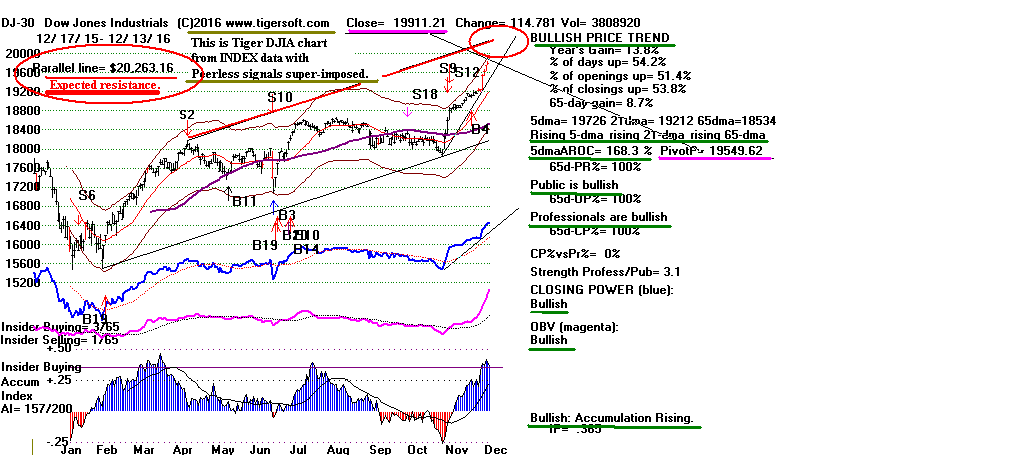
Money seems to be coming out of some
of the Financials and going into
tech stocks. Watch the close in FAS tomorrow. If it should close
0.57
below today's close, its 5-day ma will turn down. Its internals are still
excellent, but traders should probably take profits in it. All-time high
breakouts by QQQ and TECL should be bought by traders and held
as long as their 5-day moving averages are rising and they do not close
below their pivot-points. See their charts further below.
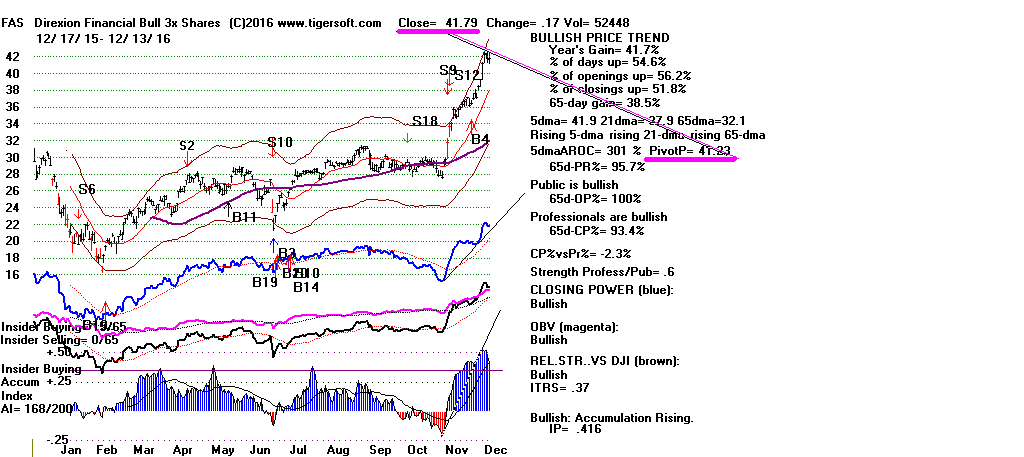
Buy TECL's Breakout
QQQ's Internals are not as good.
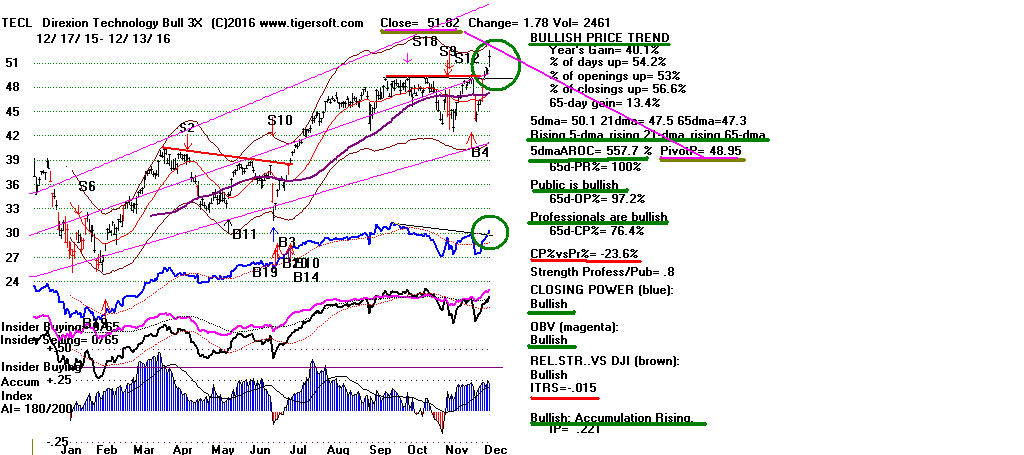
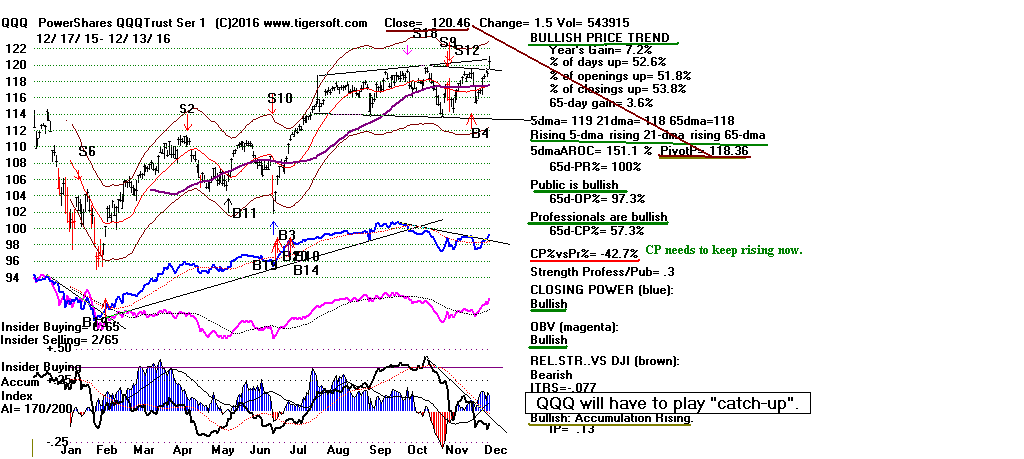
DJI-2000 and The Fed's Decision on Rates
Two hours before today's close, the DJI was
less than 68 points, or 1/3%, below
20,000, a level that very few people back in August 1983 expected it to reach
in one generation. Will 20,000 be easily breached? I think so.
The round number
"20000" does not have the same psychological resistance built into it as the
DJI's 100-level, 1000-level or the 10000-level did. Only if the FED raises
short-term
rates by more than 1/4% will there be a problem. If the FED does not raise
rates, look for an explosive rally past 20,000 much like occurred in January
1987.
It took almost 18 years (1906-1924) of testing the DJI-100
barrier before it was
finally overcome decisively. It then took only 6 months for the DJI
to
overcome the 200-level in 1928. It did this
despite the FED's raising the Discount
Rate several times in 1928. The market's momentum-psychology was too
strong
to stop.
It took almost 18 years (1966-1983) to get completely above the
DJI-1000 round
number resistance. The DJI then easily shot past the
2000-barrier on its first try
in January 1987. It did this despite a lagging NYSE A/D Line and NASDAQ.
The FED had lowered the Discount Rate to 5.5% on
8/21/1986 and did not raise it
until two months before the 1987 Crash. It was said that the Fed had
"accommodated
the rally" and then put the breaks on too hard.
http://www.tigersoft.com/Tiger-Blogs/8-18-2003/index.htm
Breaching 2000 was quick and easy.
The Fed did not raise rates.
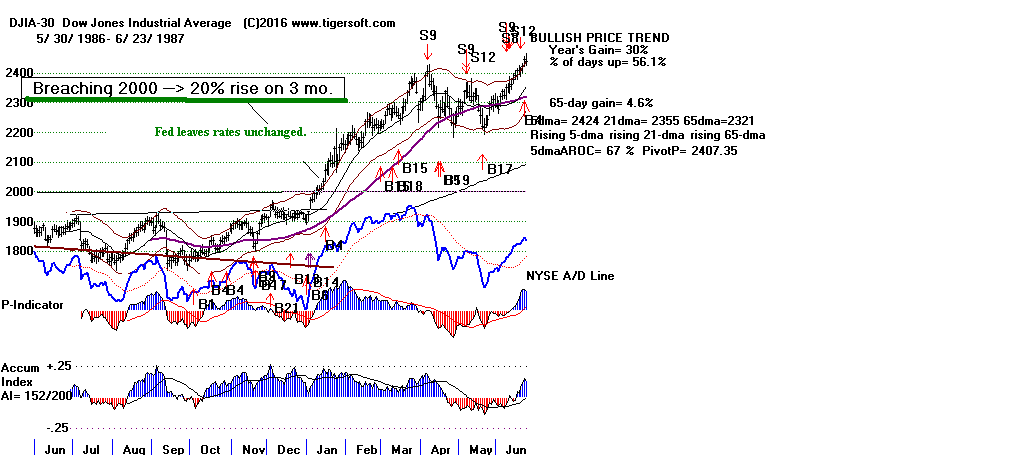
When the DJI faced 10,000 for the first time in
April 1999, it was as though it
was drawn to it like a magnet. A badly lagging A/D Line did not prevent
the
DJI from decisively breaking above it in several weeks. Greenspan's delay
in raising interest
rates until January 2000 is often given as the reason the DJI rose to 11700 in
early 2000.
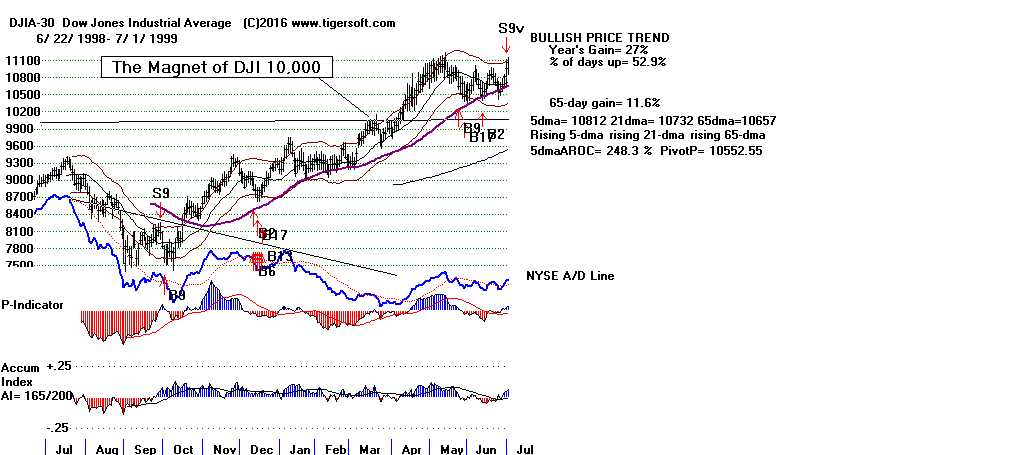
12/13/16:
Peerless
DJIA and A/D Line
DJI-OBVPCT
Hourly DJIA
S&P
OEX
NYSE
NASDAQ
DIA
QQQ SPY
IWM
Short-Term Rates
DJI-Utilities
REITS
A/D Line-6000 Stocks
SOXL TECL
FAS
Crude Oil
12/13/2016:
Bullish MAXCPs (Fewer regional banks)
Bearish MINCPs
(Bond Funds are rising a
little and have disappeared
from this group. The most bearish plays here now are short ETFs
on the general market.)
Stocks:
AAPL, BIDU,
IBM, TXN
Bank Stocks - DB (Deutsche
Bank), WFC (Wells Fargo), GS (Goldman Sachs),
AMZN, CAT, FB,
GOOG, JPM,
MSFT, NVDA (Super Stock)
TXN
ETFS:
BBH, BRZU,
DIA, DUST,
FAS, GASL,
GLD, IWM,
JETS,
JNUG, KOL, MDY,
NUGT, OIH, OIL,
RETL,
RSX, SLV,
SOXL, TECL,
TMF, TNA,
UGAZ, UPW,
VGK, YINN
    RANKING OF KEY DIRECTORIES BASED PCT.OF STOCKS ABOVE 65-DMA

               12/13/16
---------------------------------------------------------------------------------------
Directory     Current       day-1         day-2         day-3         day-4         day-5
----------------------------------------------------------------------------------------
BIGBANKS       100%           1             1             1             1             1
COAL           100%           1             1             1             1             .888
EDU            100%           1             1             1             1             1
REGBANKS       100%           1             1             1             1             1
AUTO           .95           .975          .95           .95           .9            .875
INFRA          .909          .909          .909          .909          .909          .909
TRANSP         .904          .904          .952          .952          .904          .904
HOMEBLDG       .888          .944          .888          .944          .888          .833
FINANCE        .857          .868          .901          .89           .879          .835
INSURANC       .852          .852          .852          .882          .852          .823
INDMATER       .841          .851          .851          .871          .841          .801
DOWJONES       .833          .766          .7            .633          .666          .6
JETS           .833          .833          .833          .916          1             .833
OILGAS         .831          .802          .813          .808          .808          .79
NIFTY          .828          .8            .771          .771          .742          .742
CHEM           .804          .804          .841          .853          .853          .731
SP-100         .793          .762          .721          .69           .69           .67
MILITARY       .784          .823          .823          .823          .862          .823
GAMING         .777          .777          .777          .777          .888          .888
RETAIL         .777          .777          .851          .87           .814          .722
SP500          .752          .718          .711          .693          .685          .628
RUS-1000       .744          .724          .738          .722          .703          .655
GREEN          .741          .709          .709          .677          .709          .516
ELECTRON       .72           .681          .707          .703          .685          .663
NASD-100       .712          .659          .659          .617          .617          .585
INDEXES        .7            .7            .67           .645          .645          .616
COMPUTER       .68           .68           .68           .64           .64           .6
UTILITY        .673          .565          .434          .347          .304          .26
SEMI           .671          .634          .656          .656          .619          .589
PIPELINE       .666          .444          .444          .444          .444          .444
REIT           .634          .664          .664          .654          .614          .538
COMODITY       .619          .619          .605          .577          .605          .605
SOFTWARE       .545          .515          .53           .545          .515          .469
ETFS           .485          .411          .426          .441          .411          .264
HACKERS        .428          .476          .523          .428          .38           .333
FOOD           .4            .4            .4            .333          .4            .4
BIOTECH        .396          .386          .43           .4            .359          .41
SOLAR          .375          .375          .375          .375          .437          .25
BEVERAGE       .333          .333          .333          .238          .238          .19
GOLD           .25           .232          .214          .267          .267          .25
CHINA          .197          .184          .236          .302          .328          .197
HOSPITAL       .125          .125          .125          0             0             .25
BONDFUND       .018          .018          .018          .018          .018          .009
=====================================================
12-12-2016
20,000+ before 19,000.
The
Buy B4, rising ETFs'
Closing Powers and 5-day mvg. averages argue persuasively
in favor of holding our long positions, though the FED may ruffle the market on
Wednesday with
something other than a 1/4% increase in short-term rates. Trump's
appointment of Exxon's
CEO as Secretary of State is pleasing the market over-night. Predictably,
the NY Tines
and the anti-Russian establishment in Washington are calling for an
investigation into the
ties between WikiLeaks and the Russian Government. The DC Democrats there
find it easier
to scapegoat their own pick of foreigners for their own failings. For us,
this means that Trump will not
sail through his first few months in office without a cyclone or two. So,
Wall Street may let the DJI
breakout above 20,000 to draw in more buyers, but sometime around January 20th,
Trump's
Inauguration it will hit its peak.
A good presentation of the real barriers Trump will face in carrying out his
"populist" agenda,
including tariffs and Public Works: Richard Wolff -
https://www.youtube.com/watch?v=D9KMzEZ1JQ4
Wednesday, Trump representatives will have an important meeting with AAPL and
other tech companies.
They may promise to invest more in the US if Trump exempts their produces from
his planned
new tariff on Chinese goods. This meeting looms up as amore important than
the Fed's.
DJIA and Peerless Signals
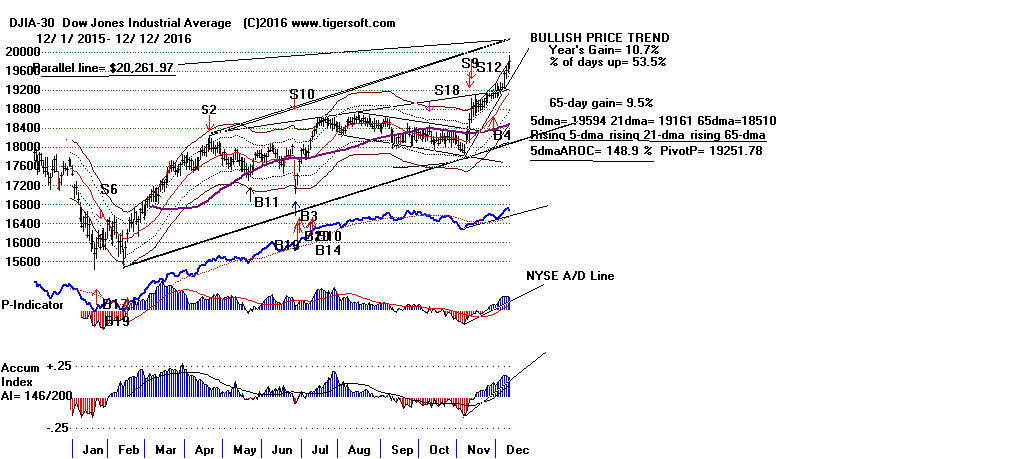
DIA
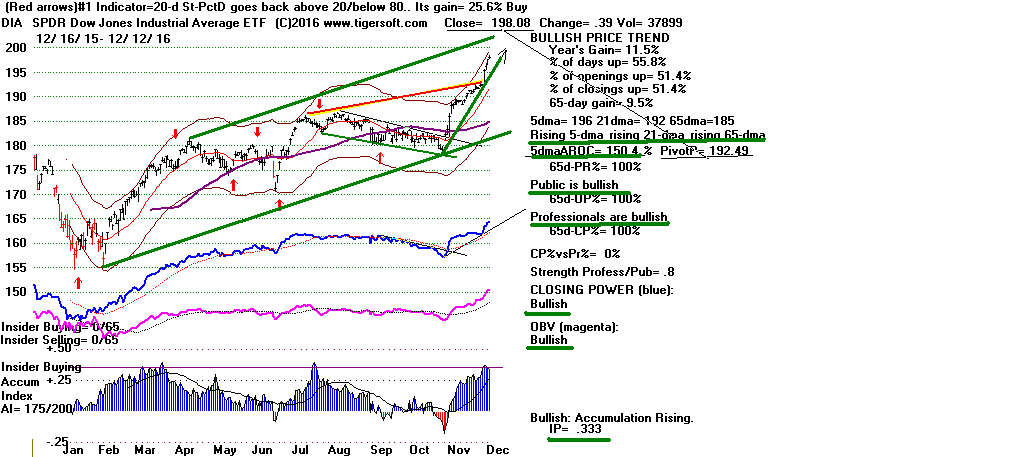
SPY
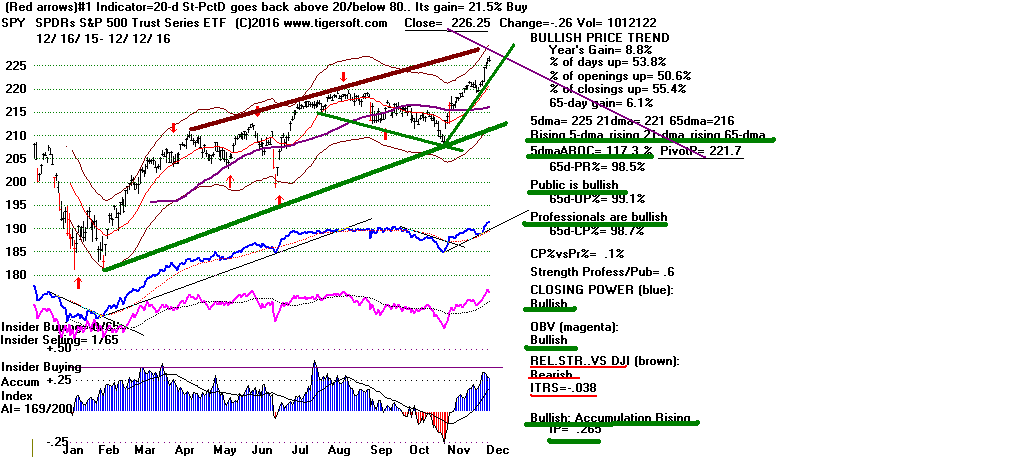
FAS
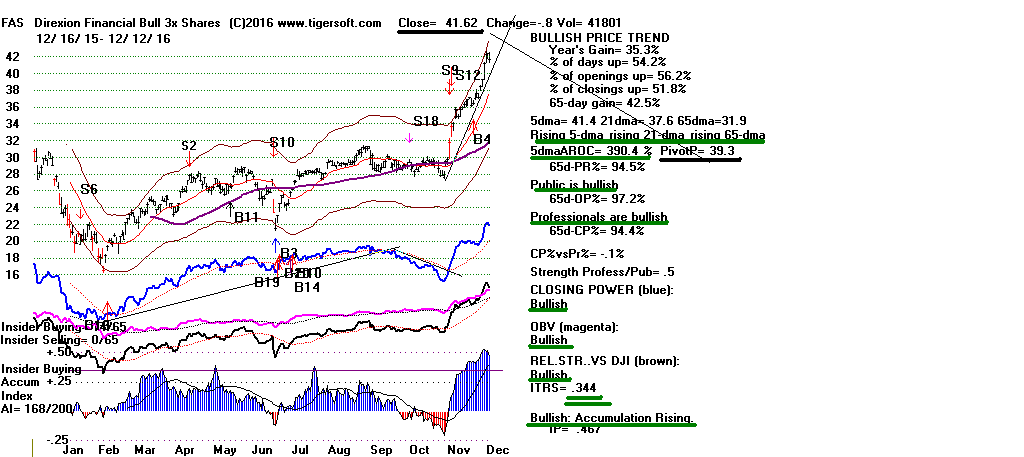

The
NASDAQ, QQQ
and TECL could not break out today above
their flat tops, but their |
internals are still very bullish. I expect them to breakout soon. If
they do breakout, AAPL
should play well. Note its bullish Closing Power divergence from prices.
Its recent price action reminds
me of how it looked last July when it rose back above its 65-dma.
Clearly Pros are more
confident about AAPL than the Public. Here the big question is whether
Trump will produce
a trade war with China that hurts AAPL.
Trump has promised a 45% tariff against
China. This
would make its products considerbly more expensive here. AAPL has
already agreed to repatriate billions
from Europe and will meet Trump representatives on Wednesday about his plans for
high techs.
MSFT, GOOGLE, AMAZON and TESLA will be present, too.
Apple
May Join $100 Billion Softbank Fund Pitched to Donald Trump
fortune.com/2016/12/12
Chinese media: Trump's trade war will hurt Apple and Boeing
Nov 14, 2016
Apple boss expects to repatriate billions to the US next year | Business ...
Sep 1, 2016

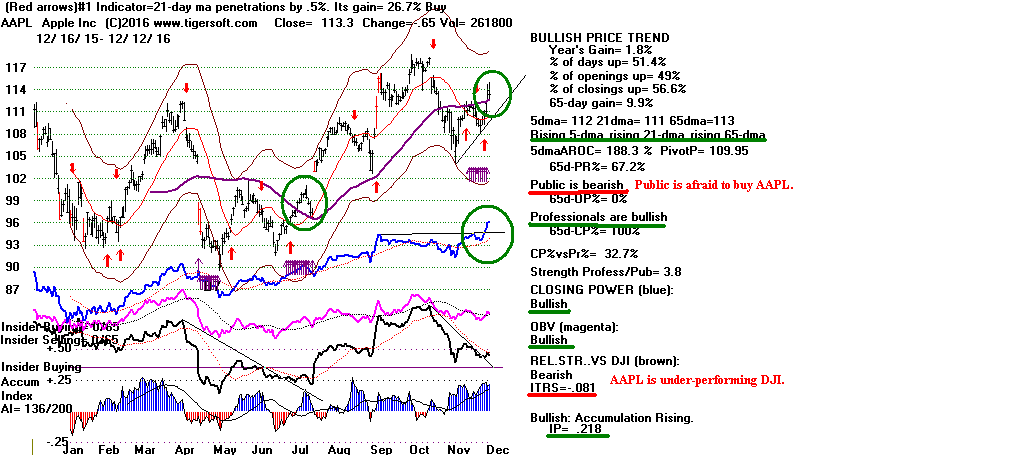
The number of stocks and ETFs that have had their 5-day ma visually rise for 23
or more straight
days jumped by 95 today. In this sense, the market is broadening and
getting stronger.
12/12/16:
Peerless
DJIA and A/D Line
DJI-OBVPCT
Hourly DJIA
S&P
OEX
NYSE
NASDAQ
DIA
QQQ SPY
IWM
Short-Term Rates
DJI-Utilities
REITS
A/D Line-6000 Stocks
SOXL TECL
FAS
Crude Oil
12/12/2016:
Bullish MAXCPs (mostly
financials & regional banks)
Bearish MINCPs
(Bond Funds are rising a
little and have disappeared
from this group. The most bearish plays here now are short ETFs
on the general marlet and financials.)
Stocks:
AAPL, BIDU,
IBM, TXN
Bank Stocks - DB (Deutsche
Bank), WFC (Wells Fargo), GS (Goldman Sachs),
AMZN, CAT, FB,
GOOG, JPM,
MSFT, NVDA (Super Stock)
TXN
ETFS:
BBH, BRZU,
DIA, DUST,
FAS, GASL,
GLD, IWM,
JETS,
JNUG, KOL, MDY,
NUGT, OIH, OIL,
RETL,
RSX, SLV,
SOXL, TECL,
TMF, TNA,
UGAZ, UPW,
VGK, YINN
RANKING OF KEY DIRECTORIES BASED PCT.OF STOCKS ABOVE 65-DMA
              12/12/16
---------------------------------------------------------------------------------------
Directory     Current       day-1         day-2         day-3         day-4         day-5
----------------------------------------------------------------------------------------
BIGBANKS       100%          1             1             1             1             1
COAL           100%          1             1             1             .888          .888
EDU            100%          1             1             1             1             1
REGBANKS       100%          1             1             1             1             1
AUTO           .975          .95           .95           .9            .85           .8
HOMEBLDG       .944          .888          .944          .888          .777          .666
INFRA          .909          .909          .909          .909          .909          .909
TRANSP         .904          .952          .952          .904          .904          .904
FINANCE        .868          .901          .89           .879          .835          .846
INSURANC       .852          .852          .882          .852          .823          .794
INDMATER       .851          .851          .871          .841          .811          .801
JETS           .833          .833          .916          1             .833          1
MILITARY       .823          .823          .823          .862          .823          .843
CHEM           .804          .841          .853          .853          .743          .743
OILGAS         .802          .813          .808          .808          .79           .802
NIFTY          .8            .771          .771          .742          .742          .742
GAMING         .777          .777          .777          .888          .888          .888
RETAIL         .777          .851          .87           .814          .722          .703
DOWJONES       .766          .7            .633          .666          .6            .566
SP-100         .762          .721          .69           .69           .659          .628
RUS-1000       .724          .738          .722          .703          .654          .634
SP500          .718          .711          .693          .685          .626          .612
GREEN          .709          .709          .677          .709          .516          .548
INDEXES        .7            .67           .645          .645          .616          .594
ELECTRON       .681          .707          .703          .685          .663          .624
COMPUTER       .68           .68           .64           .64           .56           .52
REIT           .664          .664          .654          .614          .532          .467
NASD-100       .659          .659          .617          .617          .585          .574
SEMI           .634          .656          .656          .619          .589          .522
COMODITY       .619          .605          .577          .605          .605          .605
UTILITY        .565          .434          .347          .304          .26           .26
SOFTWARE       .515          .53           .545          .515          .469          .409
HACKERS        .476          .523          .428          .38           .333          .285
PIPELINE       .444          .444          .444          .444          .444          .555
ETFS           .411          .426          .441          .411          .25           .176
FOOD           .4            .4            .333          .4            .4            .4
BIOTECH        .386          .43           .4            .359          .406          .366
SOLAR          .375          .375          .375          .437          .25           .125
BEVERAGE       .333          .333          .238          .238          .19           .19
GOLD           .232          .214          .267          .267          .25           .267
CHINA          .184          .236          .302          .328          .197          .236
HOSPITAL       .125          .125          0             0             .25           .25
BONDFUND       .018          .018          .018          .018          .009          .009
Traders, When to take profits?
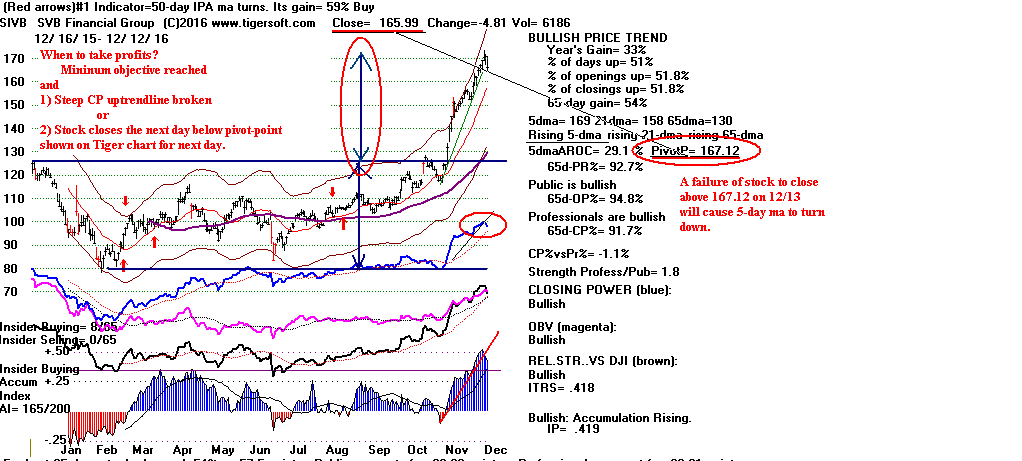
======================================================================
12-9-2016
20,000 before 19,000. The new Buy B4
even argues for much high prices.
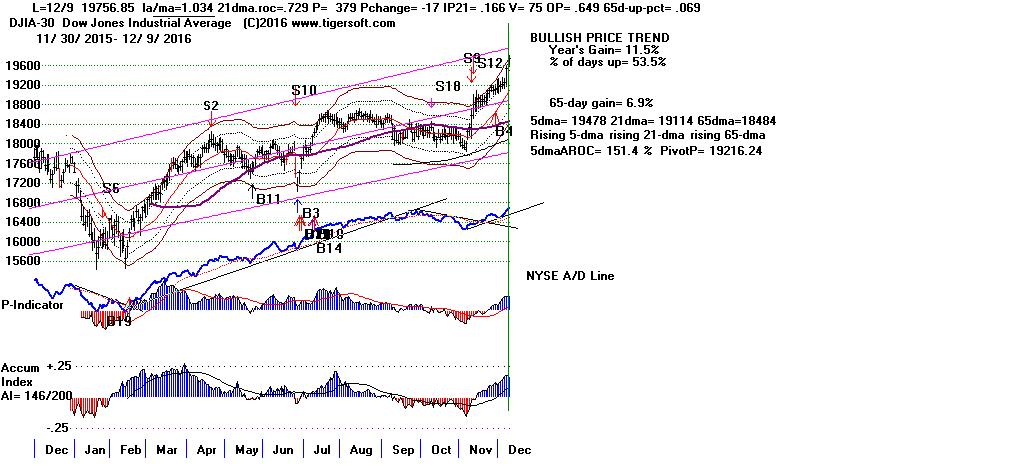
Republican Partisan Buying expected at
least until End of Year.
We have to take into
account Presidential partisan euphoria
just like we do
Monthly Seasonality. As long as DIA's 5-dma is rising
and the Closing Power stays in its uptrend, we should
expect still higher prices, even though the DJI is now up
10% since the Election and the Round Number 12,000
Should Act as some resistance.
DIA's 5-Day MA has been visually rising for 24
straight days. Traders should sell if
it closes below its 5-day ma Pivot-Point or when it comes close to 200
intra-day. In the
meantime, watch how the "band-wagon effect draws in more and more investors.
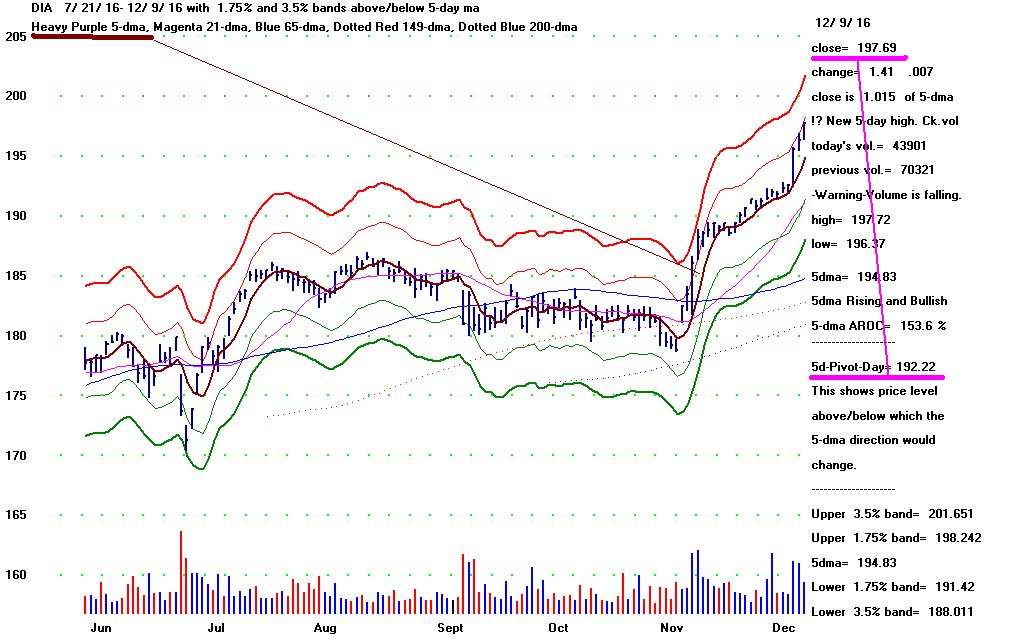
> The sudden reversal Buy B4 is sometimes
very bullish.
See
http://tigersoft.com/Peerless-Research/NewBuy-B4s/INDEX.htm
When the DJI's OBVPCT has been very (red) negative for more than
a month in the 3rd or 4th quarter and then suddenly rises above +.10,
we can construe a "Visual Buy B4" (See the
5 past cases since 1970.
Each shows a sudden reversal and an unexpectedly good subsequent rally.)
> Trump Is The New Coolidge and That's
Bullish.
Republican Presidential-Election victories in bull markets usually
bring rallies
to at least December. See recent Hotlines.
> Republican victories for White House almost always bring rallies to end of
year.
Fed Rate Hikes at much higher
levels in December cause pullbacks.
1920 Ongoing Bear Market - December Decline
1924 10/14/1924 (99.20) to 1/13/1925
(123.60)
12/10/1928 (263.9) - 2/2/1929 (319.7)
10/22/1952 (263.1) to 1/5/1953 (293.8)
11/28/1956 (455.1) to 12/31/1956 (499.5)
12/2/1968 (983.34) to 2/25/1969 (899.8)
8/30/1968 Rate Hike 5.25% Sends
market up until December
12/18/1968 5.50% (+1/4%) Marks top in bull market.
4/4/69 6.0% - Bear Market soon follows.
11/13/1970 5.75% Bull market is launched
12/11/1980 (908.45) to 1/6/1981 (1004.69)
7/28/1980 10.0% Drop in
rates in on-going bull market
9/26/1980 11.0% Tightening again.
11/17/1980 12.0% Stops rally and drops DJI to lower band.
12/5/1980 13.0% Drops DJI to lower band and support.
12/7/1984 (1163.21) to 3/1/1985
(1299.36)
11/21/1984 8.5% (1/2% reduction)
Mkt declines to lower band.
12/24/1984 8.0% Drop in rates in on-going bull market
5/24/1985 7.5% Drop in rates in on-going bull market
3/7/1986 7.0% Drop in rates in on-going bull market
4/21/1986 6.5% Drop in rates in on-going bull market
7/11/1986 6.0% Drop in rates in on-going bull market
8/21/1986 5.5% Drop in rates in on-going bull market
9/4/1987 6.0% Mkt rallies to upper band
and then Big October 1987 Crash!
11/16/1988 (2038.58) - 2/7/1989 (2347.14)
1
12/1/2000 (10373.54) - 2/1/2001 (10983.63)
10/25/2004 (9749.99) - 12/28/2004 (10854.54)
> Impending Republican Control of Congress Is Very Bullish.
Coolidge had a Republican Congress behind him. This gave investors
confidence that he would carry through his campaign pledges to lower taxes,
de-regulate and impose protective tariffs. The DJI rose 24% on Coolidge's
re-election coupled with a Republican Congress.
10/14/1924 (99.20) to 1/13/1925 (123.60)
And, more important, a year after the 1924 election, the DJI was 60%.
People forget that Republicans controlled Congress between 1995 and 1996.
the start of the "Clinton bull market". 1995 was a superb year for bulls.
Bush II was supported by a Republican Congress from 2003-2007. This
helped push up the market after the 2004 Presidential Election. This
brought
a good December rally in DJI and also one that lifted DJI from lower band
to upper band in Feb. and March of next year.
> The Fed's Raising of Rates by 1/4% This Week Ought
Not To Upset Stocks too much.
Such a rise in the Federal Funds (short-term rates) is being built into the
market.
The decline in Bonds has made the Feds intentions clear. A rise by 1/2%,
on the
other hand, would be disturbing enough to invite profit-taking/ We should
watch
this chart of Short-Term Rates.


> December's bullishness is greater in the second half of
this month than the first half.
Since 1965, the DJI has risen 74.5% of the time in the ten trading days
following
December 11th. A retreat by the DJI after December 16th will bring a new
Buy B13
provided the DJI drops below the 1% upper band. It is now at the 3.4%
upper band.
> QQQ, TECL and
NASDAQ could make bullish flat-topped breakouts.
These would show the market's breadth is expanding and that the rally will
not be dependent so much on booming Bank Stocks. A close above 120
by QQQ (shown below) should be bought. This is important resistance; it is
the all-time
high dating back to March 2000.
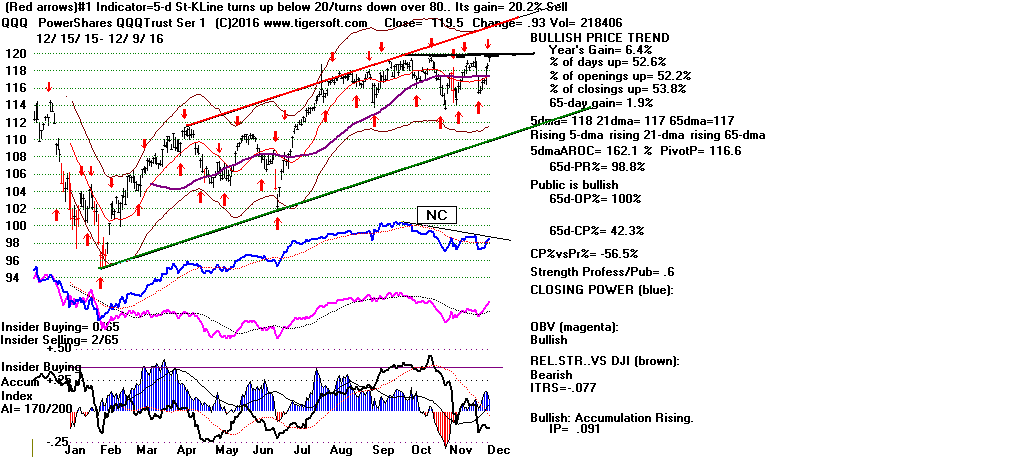
>Traders should stick with the rising 5-day moving averages
of FAS, GS, Bullish Regional Banks.
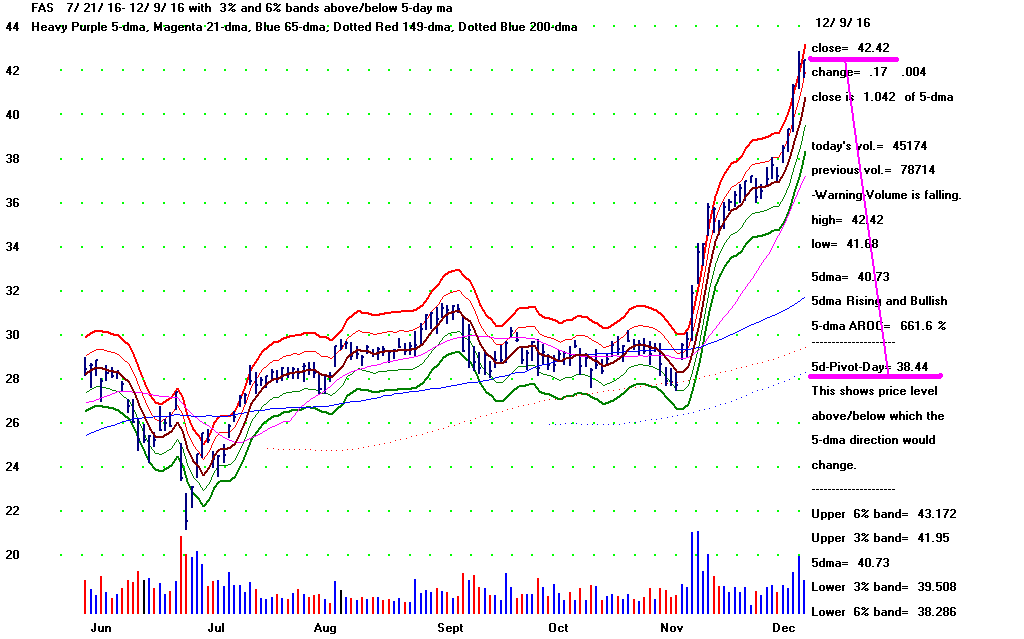
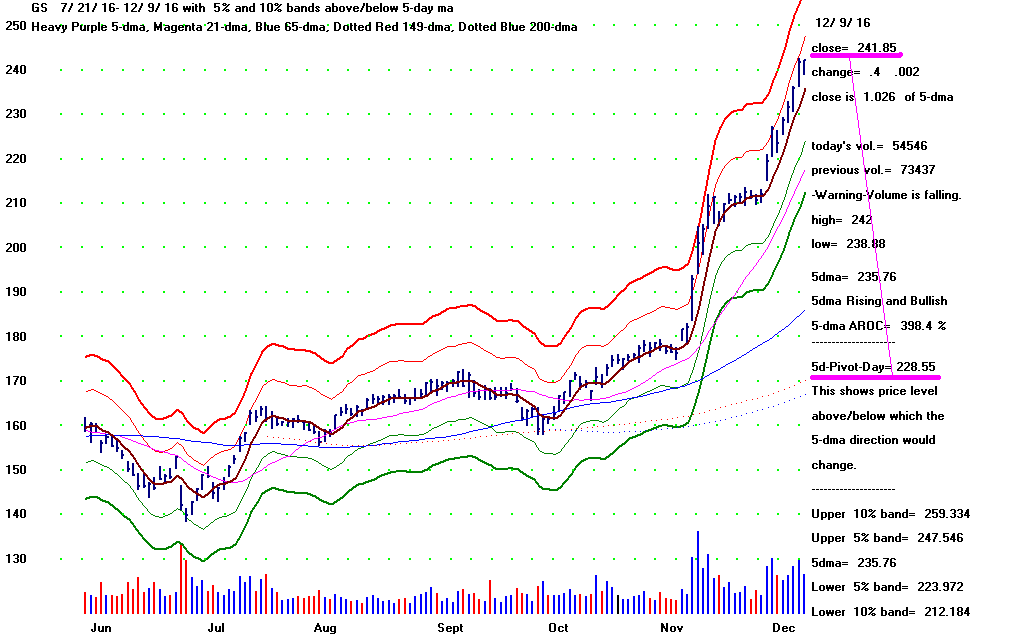
>DIA's 5-day ma has been rising visually for 24 straight days.
>There are now 78 stocks over $3.50 which have been
rising for 24 straight days or more. These may be
considered the leaders of the new Trump mini-Bull Market.
We will watch these closely for signs of a top in the coming weeks.
Index of 78 High Momentum - Super Stocks
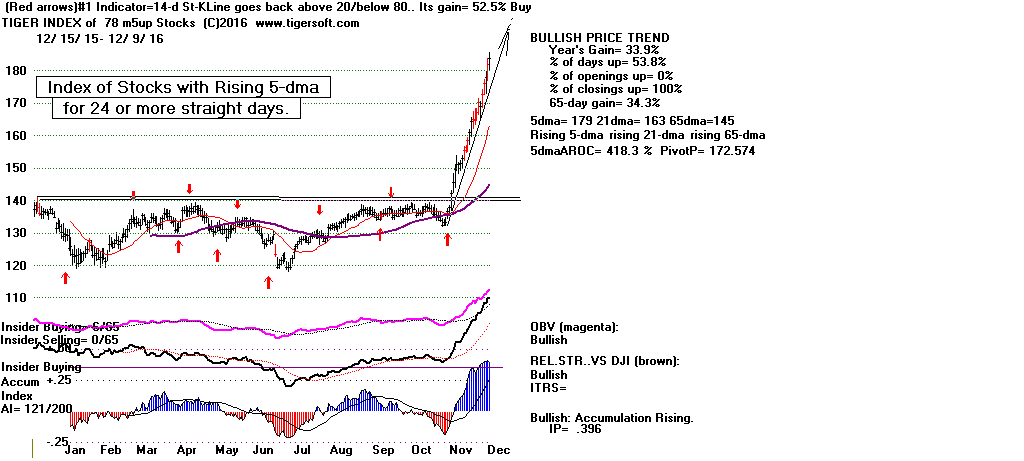
AMTD   BDGE  BNCL   BOBE   BSRR   CAAS   CACB   COLB  CSFL  CSV  DDM   DIA   DZZ   EVR   FAS  FAST
FDX    FFBC  FHN    FOR    FXZ    GBLI   HEI    HSC   HWKN  HXL  IBKC  ICFI  IRBT  IVE   IWD  IWX
IXG    IYF   IYT    JKF    KAI    KEM    KFY    KMG   KRU   KWR  LDOS  LNC   LUK   MAR   MDP  MGV
MHO    MS    MSM    MTG    MTW    PBIP   PHMD   PRF   PYZ   PZN  RBC   RGA   RIGP  SIVB  STLD THG
TICC   TITN  TOWN   TSCO   UBNK   UCBI   UDOW   UTI   UYG   VAW  WABC  WAL   WSFS  XLI
   Stocks whose 5-dma has been visually rising for 24 or more straight days.  12/9/2016
|
Updated Charts
12/9/16:
Peerless
DJIA and A/D Line
DJI-OBVPCT
Hourly DJIA
S&P
OEX
NYSE
NASDAQ
DIA
QQQ SPY
IWM
Short-Term Rates
DJI-Utilities
REITS
A/D Line-6000 Stocks
SOXL TECL
FAS
Crude Oil
12/9/2016:
Bullish MAXCPs (mostly
financials & regional banks)
Bearish MINCPs
(Bond Funds are rising a
little and have disappeared
from this group. The most bearish plays here now are short ETFs
on the general marlet and financials.)
Stocks:
AAPL, BIDU,
IBM, TXN
Bank Stocks - DB (Deutsche
Bank), WFC (Wells Fargo), GS (Goldman Sachs),
AMZN, CAT, FB,
GOOG, JPM,
MSFT, NVDA (Super Stock)
TXN
ETFS:
BBH, BRZU,
DIA, DUST,
FAS, GASL,
GLD, IWM,
JETS,
JNUG, KOL, MDY,
NUGT, OIH, OIL,
RETL,
RSX, SLV,
SOXL, TECL,
TMF, TNA,
UGAZ, UPW,
VGK, YINN
RANKING OF KEY DIRECTORIES BASED PCT.OF STOCKS ABOVE 65-DMA
              12/9/16
---------------------------------------------------------------------------------------
Directory     Current       day-1         day-2         day-3         day-4         day-5
----------------------------------------------------------------------------------------
BIGBANKS       100%          1             1             1             1             1
COAL           100%          1             1             .888          .888          .888
EDU            100%          1             1             1             1             1
REGBANKS       100%          1             1             1             1             1
TRANSP         .952          .952          .904          .904          .904          .904
AUTO           .95           .95           .9            .85           .8            .775
INFRA          .909          .909          .909          .909          .909          .909
FINANCE        .901          .89           .879          .835          .835          .824
HOMEBLDG       .888          .944          .888          .777          .666          .555
INSURANC       .852          .882          .852          .823          .794          .794
INDMATER       .851          .871          .841          .811          .801          .792
RETAIL         .851          .87           .814          .722          .703          .685
CHEM           .841          .853          .853          .743          .743          .731
JETS           .833          .916          1             .833          1             1
MILITARY       .823          .823          .862          .823          .843          .823
OILGAS         .813          .808          .808          .79           .802          .732
GAMING         .777          .777          .888          .888          .888          .777
NIFTY          .771          .771          .742          .742          .742          .685
RUS-1000       .738          .722          .703          .655          .631          .599
SP-100         .721          .69           .69           .659          .628          .628
SP500          .711          .693          .685          .626          .608          .576
GREEN          .709          .677          .709          .516          .548          .483
ELECTRON       .707          .703          .685          .663          .624          .593
DOWJONES       .7            .633          .666          .6            .566          .6
COMPUTER       .68           .64           .64           .56           .52           .6
INDEXES        .666          .641          .641          .611          .59           .544
REIT           .664          .654          .614          .532          .467          .416
NASD-100       .659          .617          .617          .585          .574          .542
SEMI           .656          .656          .619          .589          .522          .485
COMODITY       .605          .577          .605          .605          .605          .563
SOFTWARE       .53           .545          .515          .469          .409          .348
HACKERS        .523          .428          .38           .333          .285          .285
PIPELINE       .444          .444          .444          .444          .555          .555
UTILITY        .434          .347          .304          .26           .26           .239
BIOTECH        .432          .402          .361          .408          .371          .331
ETFS           .426          .441          .411          .25           .176          .147
FOOD           .4            .333          .4            .4            .4            .266
SOLAR          .375          .375          .437          .25           .125          .125
BEVERAGE       .333          .238          .238          .19           .19           .142
CHINA          .236          .302          .328          .197          .236          .236
GOLD           .214          .267          .267          .25           .267          .232
HOSPITAL       .125          0             0             .25           .25           .25
BONDFUND       .018          .018          .018          .009          .009          0
================================================================
12-8-2016 20,000 before 19,000. The new Buy B4
even argues for much high prices.
Past new (OBVPct) Buy B4s:
See
http://tigersoft.com/Peerless-Research/NewBuy-B4s/INDEX.htm
Trump's true-believers are in control. They are now
making converts of those fund
managers that must perform to keep their jobs. Even Democrats and moderate
Republicans will soon start to buy and set aside their misgivings about what
they perceive
as Trump's weaknesses - which they are sure will eventually rock the market,
namely his willingness to take on all his opponents at once. his verbal
recklessness and
his manic narcissism.
But first, I think, the DJI will reach 20,000 before it falls back very far.
Such is the magnet
of that round number. Last night I showed how 10,000 attracted the DJI
even when the
A/D Line was badly lagging the DJI in 1999. What better way to draw in new
buyers.
Picture Wall Street's appeal when the headlines read: "DOW JONES - 20000!"
Keep in mind, too, that what the DJIA does, the NASDAQ may not be able to do.
It is even
normal for the NYSE A/D Line to lag the DJI by anywhere from two to ten months
before the DJI forms a major top. It usually also takes 4 or 5 sets of
major Peerless Sells
before a significant top. Of course, the longer the A/D Line lags the DJI,
the more more
vulnerable the stock market eventually becomes: notably, 1929,
1972-1973,
1980-1981,
1987, 1999-2000 and 2007-2008.
Let the broad market weaken, if it must. Holding long Bank Stocks and ETFs
is
recommended. In addition, Bonds remain very weak. Hold them short,
too. Bonds
and stocks sometimes go in opposite directions.
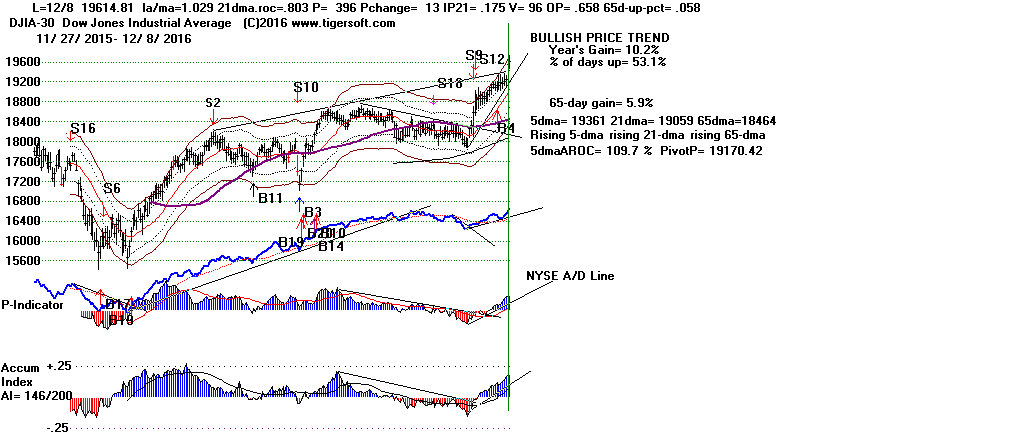


Updated Charts
12/8/16:
Peerless
DJIA and A/D Line
DJI-OBVPCT
Hourly DJIA
S&P
OEX
NYSE
NASDAQ
DIA
QQQ SPY
IWM
Short-Term Rates
DJI-Utilities
REITS
A/D Line-6000 Stocks
SOXL TECL
FAS
Crude Oil
12/8/2016:
Bullish MAXCPs (mostly
financials & regional banks)
Bearish MINCPs
(Bond Funds are rising a
little and have disappeared
from this group. The most bearish plays here now are short ETFs
on the general marlet and financials.)
Stocks:
AAPL, BIDU,
IBM, TXN
Bank Stocks - DB (Deutsche
Bank), WFC (Wells Fargo), GS (Goldman Sachs),
AMZN, CAT, FB,
GOOG, JPM,
MSFT, NVDA (Super Stock)
TXN
ETFS:
BBH, BRZU,
DIA, DUST,
FAS, GASL,
GLD, IWM,
JETS,
JNUG, KOL, MDY,
NUGT, OIH, OIL,
RETL,
RSX, SLV,
SOXL, TECL,
TMF, TNA,
UGAZ, UPW,
VGK, YINN
Trump Is Wall Street's Friend, for Now....
Who could have expected how quickly the Dow Jones would rise after a
Trump victory? Will the DJI still go much higher? Should the S9/S12
be discarded for a new Buy signal? Is it too late to buy now? Should
the S9/S12 be trusted a little longer? The DJI has only risen 4.1%
against it.
Reasonable questions - those. My position is the Hotline always doubted
the Sell S9/S12.
The S9/S12 is a Sell signal that has failed before: but only three times
in 24 earlier cases. So, it may seem right to conclude that there is only
a
12.5% chance of failing now. But how often does a Trump come along?
Just once in 230 years!
He seems to about to give Wall Street everything that they ever dreamed of. It's
as though Goldman Sachs has staged a not-so hidden coup.
On the weekend after the Election, after help from the San Diego Tigers
at our monthly User Group meeting, I wrote a long Hotline giving many reasons
for not trusting it. See below the Hotline of November 11th,
"Reasons not
to go short...".
1) The DJI's rise to the upper band right after the Election was unusually
swift. I mentioned the DJI's 1000 point intra-day turn-around
in two days. This showed enormous Professional buying. So, it was
perfect
for us. All we had to do I said was to watch the Closing Power of DIA.
As long
as the CP stayed above its 21-day ma, we should assume Professionals were
still net buyers and we should stay long. We could use the QuickSilver
tactics.
As long an ETF had a rising Closing Power and a rising 5-day ma, no significant
pullback was likely. DIA's 5-dma has yet to turn down since Trump's
election.
Up day volume (shown in blue) has dwarfed Down day volume (shown in red).
These are prime QuickSilver trading considerations that appear on our
6-month Tiger charts,
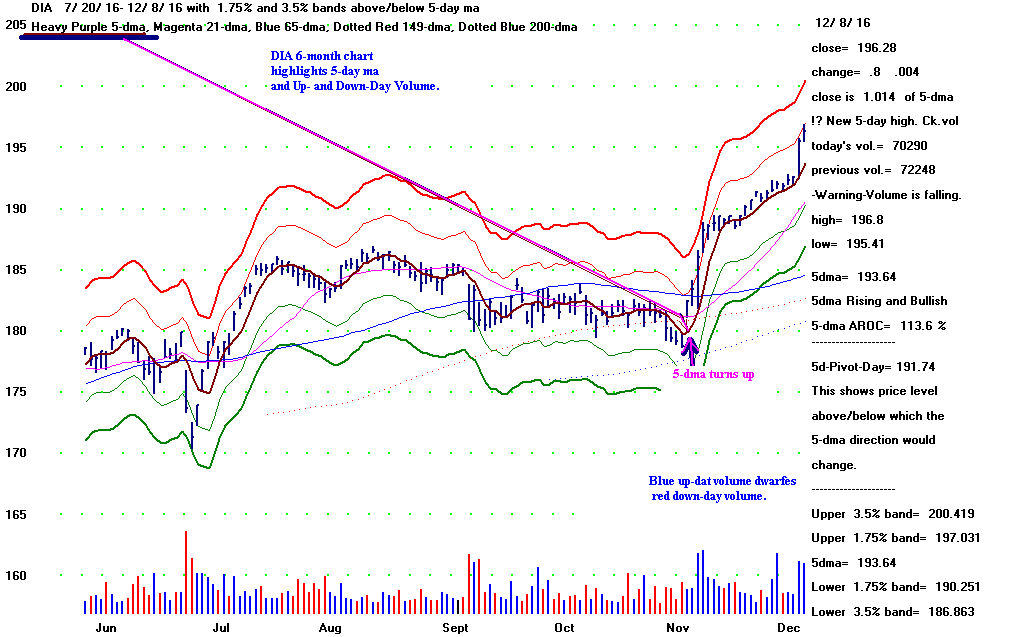
2) There had only been one November case of an S9/S12 and that was right
after Reagan's Election. In the 1980 case, the S9/S12 occurred much
farther above
the 21-day ma than in our case and the internals were much weaker. From
this, I concluded that our S9/S12 was not so bearish as back then. I
considered
re-writing the program then to disallow a November S9/S12 with the internals
our case shows. But decided we should just wait. If the market rose
more,
we would get a Buy B4, either old or new.
3) Decembers are bullish. They seldom bring sell-offs. An S9/S12
would be confronted
with a 75% to 80% historic chance for a DJI rally.
4) When the DJI first shows a low and red OBVPct but then that
indicator swiftly rises above
+.10, the Sell S18 should be reversed. A little more study here revealed that
when the
OBVPct rises above +.25, a reliable DJI take-off has occurred.
And sometimes,
these produce very big moves. The huge bull market from 1995-2000
began in this
way.
5) Mostly, I have written each night about how very bullish Trump is for
the market because
Trump's policies are a perfect throw-back to Calvin Coolidge's, the
main difference being that
Trump tirelesslly trumpets his views everywhere while "Silent Cal" avoided
making speeches
wherever possible.
6) Big Money will run the Government now. Coolidge and his Treasury
Secretary (Andrew Mellon)
gave Wall Street exactly what they wanted in the 1920s: deregulation, lower
taxes and protective tariffs.
Mellon was the third richest person in America. Only JD Rockefeller
and Henry Ford were richer.
Trump has appointed a Cabinet of Billionaires and "Centipede"-Millionaires.
Trump's billionaire cabinet could be the wealthiest administration ever ...
https://www.theguardian.com › US News › Trump administration
7) The effects of Trumps policies and his Cabinet picks were
immediately picked up on by Wall Street.
Big Banks (like GS) and Bank ETFs (like FAS) were the first out of the gate,
starting November 4th.
Big Banks were the first group to show 100% of their stocks above the 65-day
ma, a ranking which I
consider important enough to post each night.
8) Night after night since Trump's Election, the industry group most
represented on list of Bullish MAXCPs
has been regional banks. This made very simple our choice about what
stocks to buy. Buying into the
strongest stocks in any industry group that overwhelmingly fills out the
Bullish MAXCP always seems to
be profitable, just as the reverse is true for our
Bearish MINCPs.
9.) Accordingly, over and over, I have recommended buying Bank Stocks/ETFs.
And because they
were so strong and for all the reasons mentioned above, I said
the S9/S12
was not as important as
being long the right sectors now, the ones that the new Trump Administration
would benefit the most.
REGIONAL BANKS ARE SOARING!
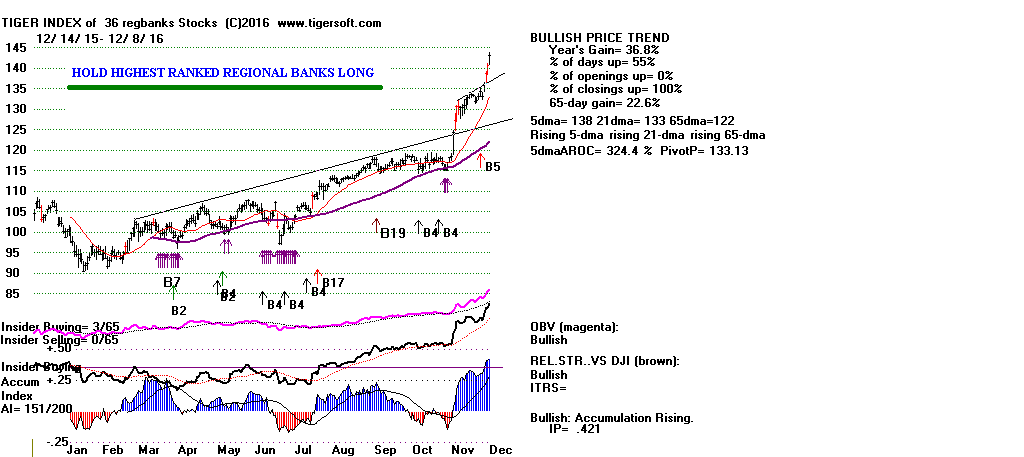
Hold Bonds Short
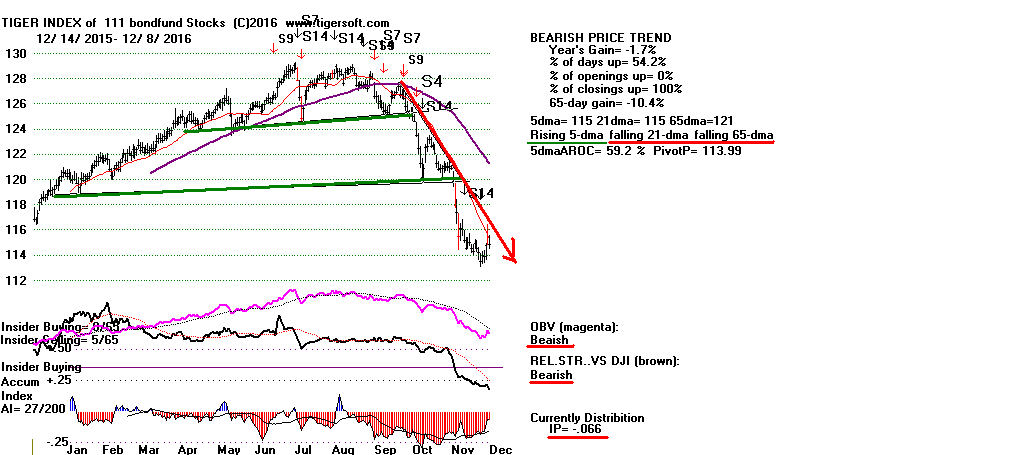
But would I buy now, I've been asked?
Last night I said a pull back to 21-day ma would be all we are likely to get,
considering
that we are in December and that the 21-day ma is rising at an annualized rate
above 80%.
I added that we should not look for such a retreat until DIA's Closing Power or
5-day ma turns down.
They are still rising. They cannot easily turn down right now. So, the market as measured
by the DJIA
seems bound to go higher.
I've mentioned that GS is the most important DJIA-30 stock simply because it is
so high-priced
At 240+ it accounts for more of the DJI's price movements than CSCO (30), PFE
(31), GE (32),
INTC (36), KO (41), VZ(51) and NKE (52) combined. The DJI weights stocks
just by its
price, not by capitalization, trading volume x price, number of employees.
When you see the
DJI make a big move, ask what the role of GS is in it. And look at its
daily and weekly chart.
GS made a perfect short-term flat-resistance breakout above 215. It
long-term chart shows
its all-time high is 247.92 (Sept. 30, 2007). It seems certain to reach
that level on this move.
And it may go a lot higher.
Back when Hoover had just been elected in 1928, the highest priced DJI stock was
RCA,
which had just be admitted to the DJIA. Between October 1928 and March
1929, it
rose from 200 to above 500. Think how much this boosted the closely watch
Dow Jones Industrial
Average. In this way, much of the DJI's move back then was entirely
artificial, like now, and
result of big advances in a few high priced DJIA stocks.
But that did not stop the advance. The DJI rose quickly all winter until the FED
raised
"call rates" and the "Discount Rate" in February 1929. But so powerful
and under-regulated
was Wall Street that they soon got the FED to withdraw their rate increase as it
applied to
margin borrowing. The DJI then rose 20% more, until September 1929, despite a
badly
lagging A/D Line.
In the early Summer of 1929, the FED backed off from its efforts to stop
the stock market bubble
because of pressure from the big banks on Wall Street, which included their
disregarding the
Fed's recommended higher
"call rates" on margin accounts and because commercial banks
did not want
to hurt an economy that was already weakening. Only when Britain
raised its Discount Rate to 7%,
a full point above where it was in the US, was the American stock market bubble
finally pierced.
Who can say now that we will not see what happened after November 1928.
Back then, the
FED found it very hard to stop a manic market. It remains to be seen if
Yellen "and friends" will
find a way now to cool the market. The Jobs' Report was not very strong. Commercial
banks will resist a
meaningful rise in rates. They are enjoying the
investment spot-light. So, they
will tell the FED to "Give Trump a chance." And if history repeats,
the NY Fed will yield
to pressure
from Wall Street's biggest banks so that big banks can get their stocks up
even more, if only to make the Christmas stock bonuses more profitable.
If the FED were about to do anything that would stop the rally, we ought to
first see signs
of selling by Professionals and a Closing Power for the DIA and FAS which turns
down.
That is not true yet.
RANKING OF KEY DIRECTORIES BASED PCT.OF STOCKS ABOVE 65-DMA
              12/8/16
---------------------------------------------------------------------------------------
Directory     Current       day-1         day-2         day-3         day-4         day-5
----------------------------------------------------------------------------------------
BIGBANKS       100%          1             1             1             1             1
COAL           100%          1             .888          .888          .888          .888
EDU            100%          1             1             1             1             1
REGBANKS       100%          1             1             1             1             1
TRANSP         .952          .904          .904          .904          .904          .904
AUTO           .95           .9            .85           .8            .75           .75
HOMEBLDG       .944          .888          .777          .666          .555          .5
JETS           .916          1             .833          1             1             .833
INFRA          .909          .909          .909          .909          .909          .909
FINANCE        .89           .879          .835          .835          .824          .835
INSURANC       .882          .852          .823          .794          .794          .794
INDMATER       .871          .841          .811          .801          .782          .772
RETAIL         .87           .814          .722          .703          .666          .666
CHEM           .853          .853          .743          .743          .719          .719
MILITARY       .823          .862          .823          .843          .823          .843
OILGAS         .808          .808          .79           .802          .732          .72
GAMING         .777          .888          .888          .888          .777          .666
NIFTY          .771          .742          .742          .742          .685          .714
RUS-1000       .722          .703          .655          .632          .598          .587
ELECTRON       .701          .683          .662          .623          .593          .571
SP500          .693          .685          .626          .608          .574          .567
SP-100         .69           .69           .659          .628          .628          .618
GREEN          .677          .709          .516          .548          .483          .548
SEMI           .656          .619          .589          .522          .485          .492
REIT           .654          .614          .532          .467          .416          .375
INDEXES        .642          .642          .613          .592          .546          .525
DOWJONES       .633          .666          .6            .566          .6            .6
NASD-100       .617          .617          .585          .574          .531          .531
COMPUTER       .615          .615          .538          .5            .576          .538
COMODITY       .577          .605          .605          .605          .563          .549
SOFTWARE       .545          .515          .469          .409          .348          .333
PIPELINE       .444          .444          .444          .555          .555          .444
ETFS           .441          .411          .25           .176          .132          .147
HACKERS        .428          .38           .333          .285          .285          .285
BIOTECH        .402          .361          .408          .371          .331          .324
SOLAR          .375          .437          .25           .125          .125          .125
UTILITY        .347          .304          .26           .26           .239          .173
FOOD           .333          .4            .4            .4            .266          .2
CHINA          .302          .328          .197          .236          .223          .263
GOLD           .267          .267          .25           .267          .232          .196
BEVERAGE       .238          .238          .19           .19           .142          .142
BONDFUND       .018          .018          .009          .009          0             0
HOSPITAL       0             0             .25           .25           .25           .25
========================================================
12-7-2016 The Trump Rally Should Continue.
I take the operative Peerless Signal to be the new Buy B4. This is
a sharp-reversal-up
Buy signal. It occurs when the DJI'a OBVPct turns quickly around from -.25
to a +.25. It
reverses the S9/S12 belatedly, to be sure. But this new B4 is reliable and
sometimes
very powerful. See
http://tigersoft.com/Peerless-Research/NewBuy-B4s/INDEX.htm
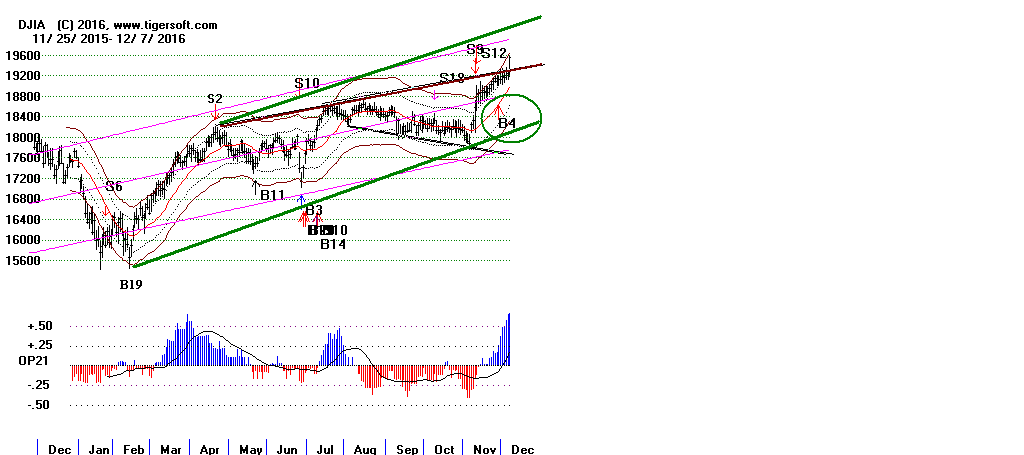
The Buy B4 signal more than anything else, is a sudden turn-around
signal. Trump was
not expected to win! Now we will see big changes which Wall Street and big
corporations
really like. There is no pretense. Deregulation of banks and energy
companies are
certainties. Wall Street through Goldman Sachs graduates will continue to
be in charge
of the Treasury, just as they have been since 1981. The Big Banks will be
continue to be protected. And now, most important, taxes on big corporations and
the
wealthy will be dropped sharply. Unlike when Reagan and Eisenhower were
Presidents,
Republicans now control Congress. This was not widely expected.
Technically, these
new developments are what the market is seeking to reflect and what has brought
about our new Buy B4.
FAS is running in all-time high territory.
Its performance will certainly attract speculators
and performance-minded fund managers. Hold it
long while its 5-day ma rises. The pivot-point is
3.58 below its current price. So, it cannot easily
turn down now. Expect higher prices.
GS is still
15-20 points below its all-time high. I would think
it will go well past 250-260.
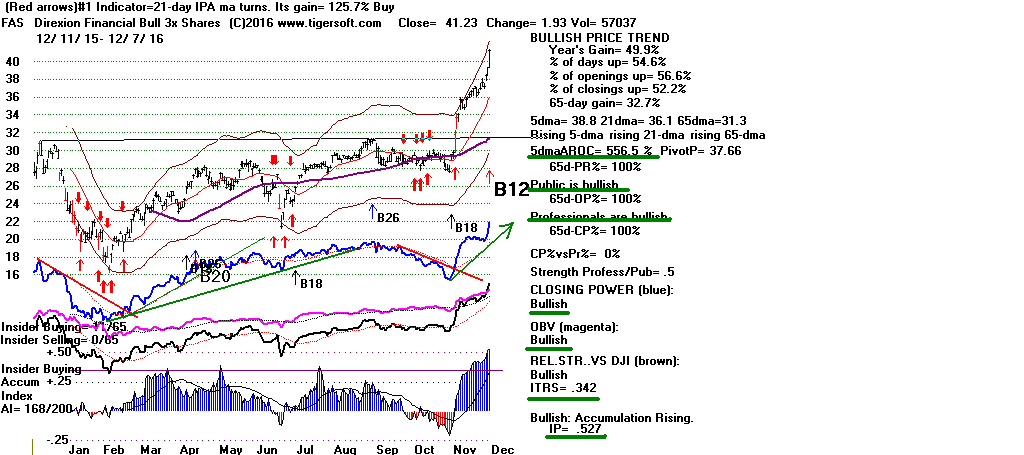
I think this new type of Buy B4, coming off three months
of steady (red) institutional selling
is particularly bullish. You may recall the earlier study that I
reported before the Election
which showed that a long period of red OBVPct numbers should be considered
reversed
if the OBVPct turning quickly positive and rises simply above +.10. Here
we have an OBVPct
which has now risen above +.60. See in the example below how the
OBVPct suddenly reversed
at the end of 1994 from its red negativity and turned positive. This
started the wonderful
Bull Market of 1995-2000.
1994-1995:
Sudden Reversal: Red Selling gave way to positive OBVPct.
A magnificent Bull Market then followed.
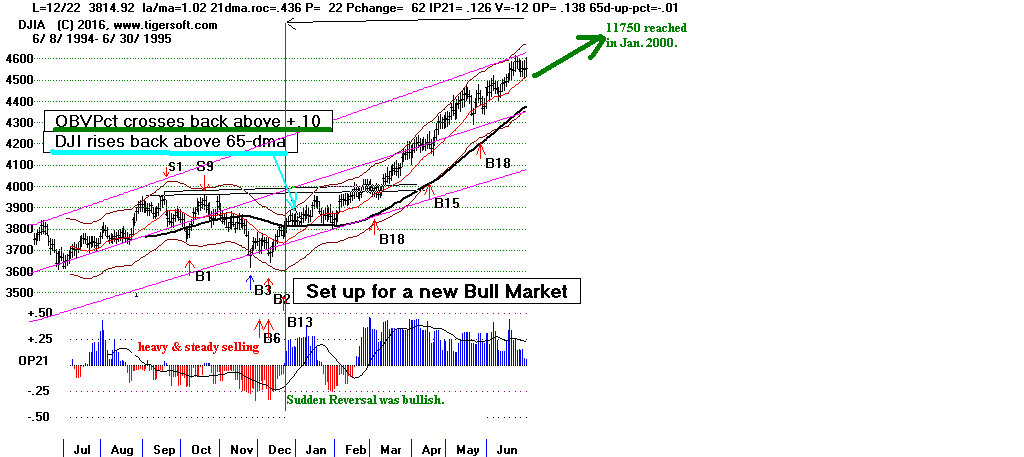
A Pullback to the DJI's 21-day ma would normally
make a good spot to buy. But predicting how soon
it will occur is difficult. The DJI's 21-day ma is now
rising at an annualized rate of 81.1% a year, so any
decline to it should be used to buy. With it
running in all-time high territory, the path of least
resistance is UP.
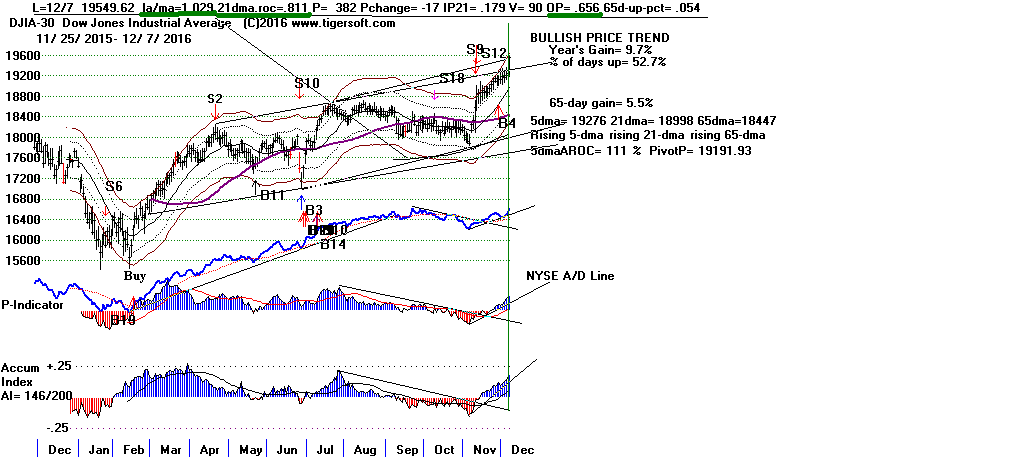
Just as 10,000 acted as a magnet for the DJI in Aptil 1999,
expect 20,000's round number to invite the same
type of public excitement now. See how that round-number magnet
overcame the bearishness of a very weak NYSE A/D Line.

So, we may, or we may not, see a brief pull-back to the DJI's 21-day ma.
That is what happened in all the earlier Buy B4s. But I would not
look for much
of a retreat in the DJIA or DIA until DIA's up-trending Closing Power trend is
broken or
prices drop below its 5-day moving average pivot-point. See the chart
below.
Some selling is apt to occur if the Fed raises rates to try to control what
"hawks" there
will say is excessive market euphoria. But I'm not so sure the Fed will
act now. The Job
Numbers were not so great. Bonds were up today, too. And even if
they do raise rates,
I doubt if it will drop the DJI much below its now steeply rising 21-day ma.
Watch tomorrow to see if the NASDAQ,
SOXL and
TECL can make new highs.
A broader advance would mean we are observing new money come into the market now
and not just seeing a grand reordering of investment priorities occasioned by
Trump's
appointments and recent statements on cutting taxes and reducing regulations on
business.
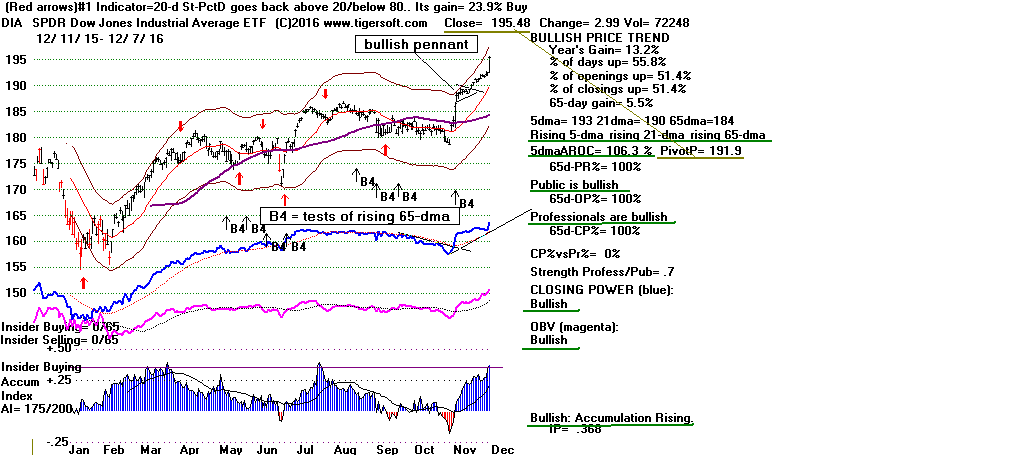
Updated Charts
12/7/16:
Peerless
DJIA and A/D Line
DJI-OBVPCT
Hourly DJIA
S&P
OEX
NYSE
NASDAQ
DIA
QQQ SPY
IWM
Short-Term Rates
DJI-Utilities
REITS
A/D Line-6000 Stocks
SOXL TECL
FAS
Crude Oil
12/7/2016:
Bullish MAXCPs (mostly
financials & regional banks)
Bearish MINCPs
(Bond Funds are rising a
little and have disappeared
from this group. The most bearish plays here now are short ETFs
on the general marlet and financials.)
Stocks:
AAPL, BIDU,
IBM, TXN
Bank Stocks - DB (Deutsche
Bank), WFC (Wells Fargo), GS (Goldman Sachs),
AMZN, CAT, FB,
GOOG, JPM,
MSFT, NVDA (Super Stock)
TXN
ETFS:
BBH, BRZU,
DIA, DUST,
FAS, GASL,
GLD, IWM,
JETS,
JNUG, KOL, MDY,
NUGT, OIH, OIL,
RETL,
RSX, SLV,
SOXL, TECL,
TMF, TNA,
UGAZ, UPW,
VGK, YINN
RANKING OF KEY DIRECTORIES BASED PCT.OF STOCKS ABOVE 65-DMA
               12/7/16
---------------------------------------------------------------------------------------
Directory     Current       day-1         day-2         day-3         day-4         day-5
----------------------------------------------------------------------------------------
BIGBANKS       100%          1             1             1             1             1
COAL           100%          .888          .888          .888          .888          .888
EDU            100%          1             1             1             1             1
JETS           100%          .833          1             1             .833          1
REGBANKS       100%          1             1             1             1             1
INFRA          .909          .909          .909          .909          .909          .909
TRANSP         .904          .904          .904          .904          .904          .904
AUTO           .9            .85           .8            .75           .75           .725
GAMING         .888          .888          .888          .777          .666          .666
HOMEBLDG       .888          .777          .666          .555          .5            .555
FINANCE        .879          .835          .835          .824          .835          .813
MILITARY       .862          .823          .843          .823          .843          .843
CHEM           .853          .743          .743          .719          .719          .707
INSURANC       .852          .823          .794          .794          .794          .823
INDMATER       .841          .811          .801          .782          .772          .782
RETAIL         .814          .722          .703          .666          .666          .703
OILGAS         .812          .795          .807          .736          .73           .701
NIFTY          .742          .742          .742          .685          .714          .714
GREEN          .709          .516          .548          .483          .548          .548
RUS-1000       .703          .655          .632          .598          .585          .618
SP-100         .69           .659          .628          .628          .608          .608
SP500          .685          .626          .608          .574          .563          .58
ELECTRON       .683          .662          .623          .593          .567          .67
DOWJONES       .666          .6            .566          .6            .6            .566
INDEXES        .642          .613          .592          .546          .525          .592
SEMI           .622          .592          .525          .488          .496          .614
NASD-100       .617          .585          .574          .531          .521          .595
COMPUTER       .615          .538          .5            .576          .538          .576
REIT           .612          .53           .464          .413          .367          .433
COMODITY       .605          .605          .605          .563          .549          .563
SOFTWARE       .522          .477          .417          .358          .343          .522
PIPELINE       .444          .444          .555          .555          .444          .666
SOLAR          .437          .25           .125          .125          .125          .25
ETFS           .411          .25           .176          .132          .147          .147
FOOD           .4            .4            .4            .266          .2            .333
HACKERS        .38           .333          .285          .285          .285          .428
BIOTECH        .362          .41           .372          .332          .322          .379
CHINA          .328          .197          .236          .223          .263          .368
UTILITY        .304          .26           .26           .239          .173          .173
GOLD           .267          .25           .267          .232          .196          .214
BEVERAGE       .238          .19           .19           .142          .142          .19
BONDFUND       .018          .009          .009          0             0             0
HOSPITAL       0             .25           .25           .25           .25           .25
.
==================================================================
12-6-2016 The Trump Turn-around Rally Continues.
The market strength we are seeing invites us to reconsider the Peerless
S9/S12. What I have
found is that when the DJI's OBVPCT quickly turns from below a -.25 level to
above +.25,
we should consider a new Buy B4 rendered when the following conditions are
true.:
1) The DJI is more than 1% above a rising 65-dma.
2) The DJI is not more than 2.7% above its 21-dma.
3) There is no simultaneous Peerless Sell.
4) The current Accum. Index (IP21) is above +.07.
As a result, I now consider Peerless to be operating under this new Buy B4.
See the earlier new Buy B4 cases:
http://tigersoft.com/Peerless-Research/NewBuy-B4s/INDEX.htm
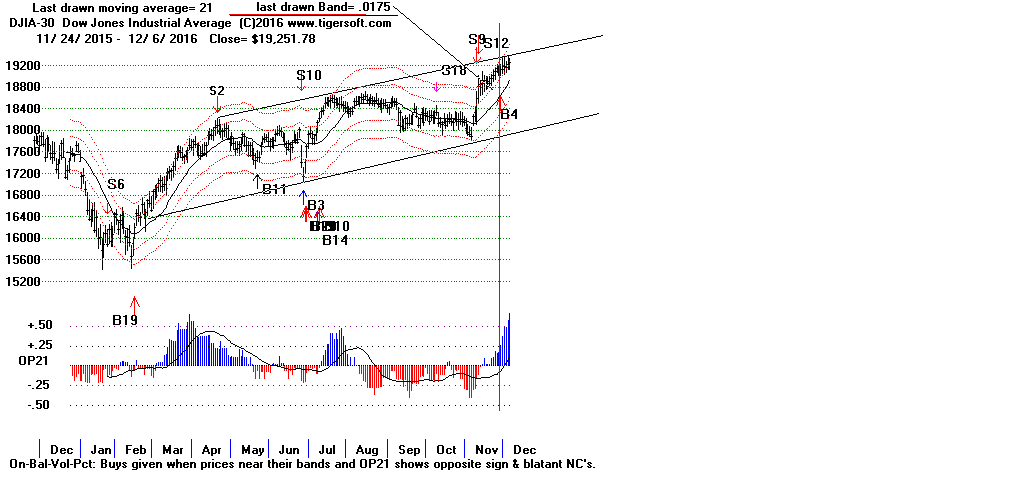
Often when a Republican wins the White House, the stock market rallies
throughout most
of December and does not reach a peak until the following January or February.
I think that is
what we are seeing now.
Coolidge's victory in 1924 overcame a divided Republican Party and promised a
very pro-business
government for four more years. Tax cuts, Deregulation,
the promotion of business by Government
and new tariffs were all promised and delivered on. The Fed's easy money
policy also played a big role
in encouraging a new age of installment buying. The DJI did retreat much
until March 6, 1925.
DJI - 1924 and 1925
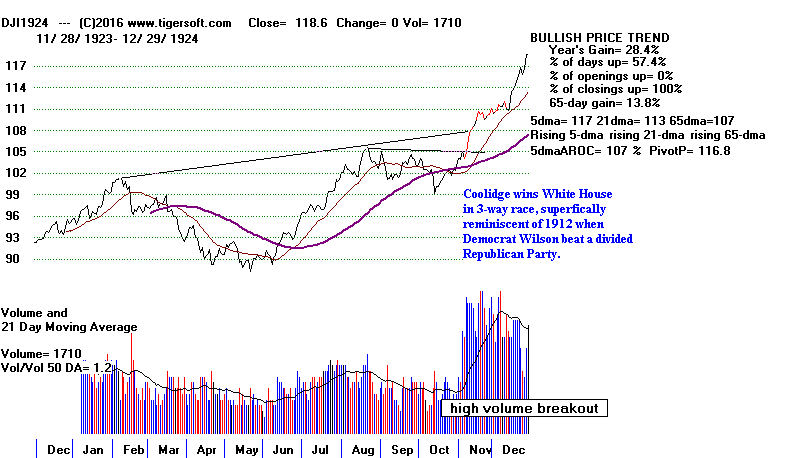
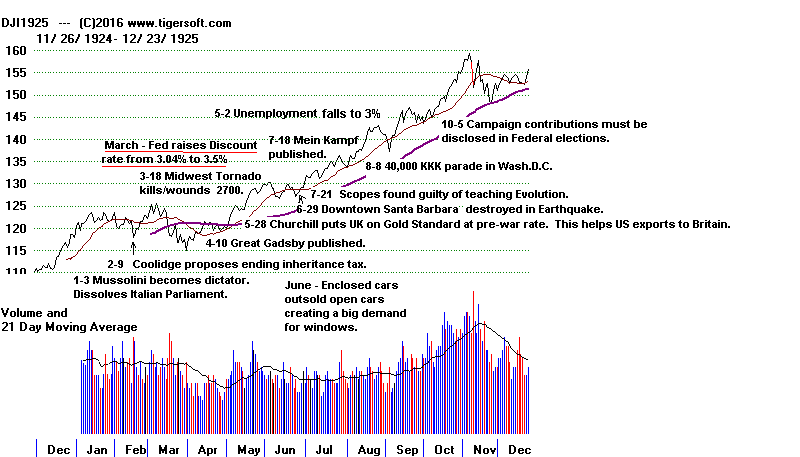
Eisenhower's victory stirred a partisan rally that did not stop until January
5th of 1953.
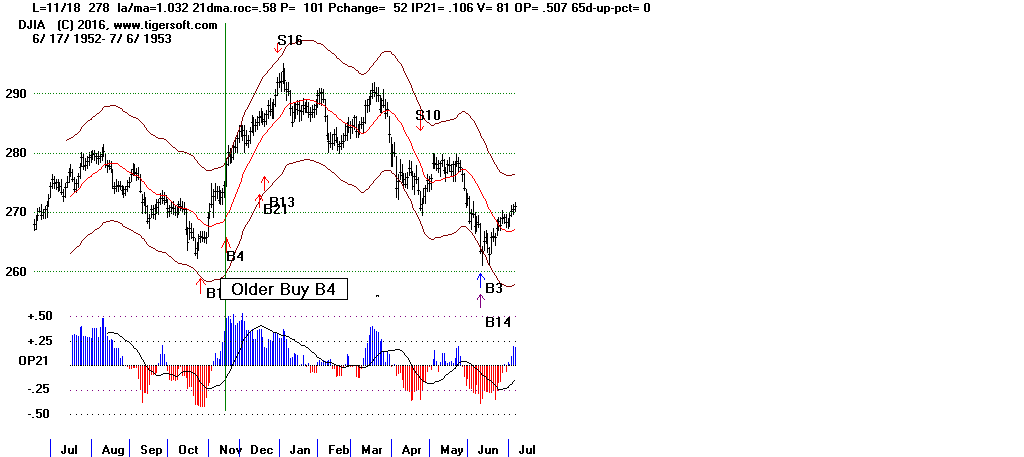
The coming of Reagan to the Presidency in January 1981 was more important
for Wall Street than the Fed's sky-high interest rates until April 1981.
Only after no less than five sets of major Sells, did the DJI finally
begin a bear market. Make no mistake about it. The stock market
was anticipating tax cuts, deregulation and a very pro-business Administration,
very much as it looks forward to all that Trump can do to create more
profits and growth.
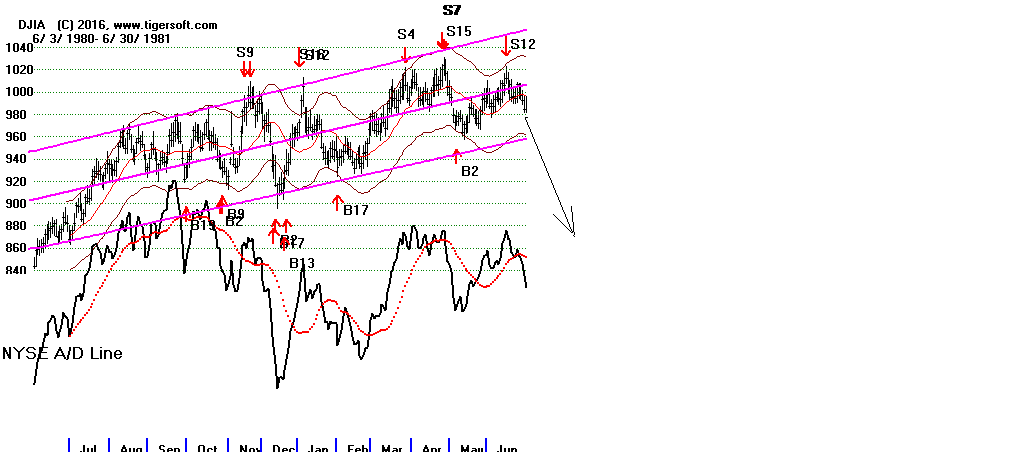
Bush Sr.'s victory in November 1988 brought a strong advance into 1989.
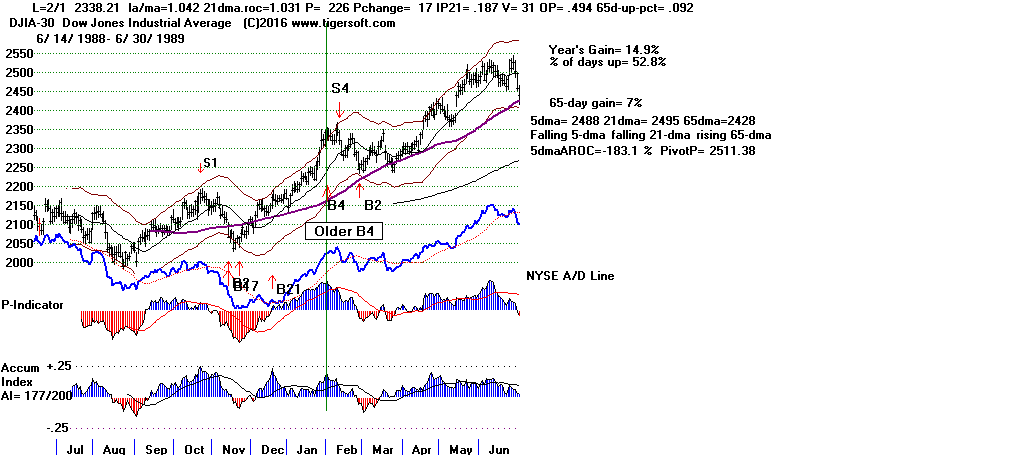
I strongly suggest using the QuickSilver rules for trading ETFs now.
So long as an ETF has both
Opening and Closing Power rising (above their 21-day ma), an IP21 reading above
+.15, volume is rising
and they are above resistance or at support, buy or continue to hold them.
(
See QuickSilver Documentation
- 1/11/2016
)
It also does not take a rocket scientist now to see how exceptionally strong Big
Bank and Regional Bank
stocks are. GS is on track to hit its
all-time high of 250. FAS is a QuickSilver Buy still.
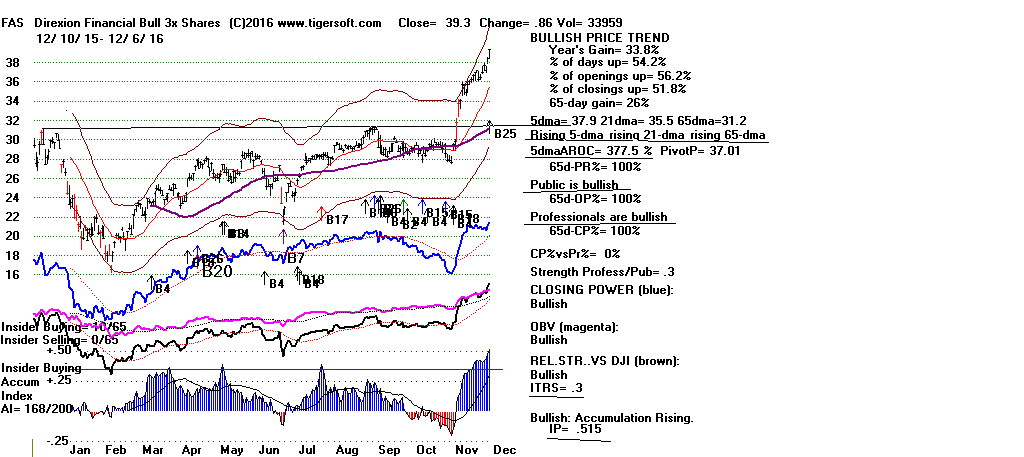
Deregulation and lower taxes plus a strong Dollar are exactly what they need to
advance.
Look back at how rapidly regional Bank Stocks rose soon after Bill Clinton
appointed Robert
Rubin from Goldman Sachs to be his Treasury Secretary and followed the banker
way down the
path of de-regulation of Banks. I wrote about this in the new Explosive
Super Stocks book
and used the example of ZION, a Utah bank.
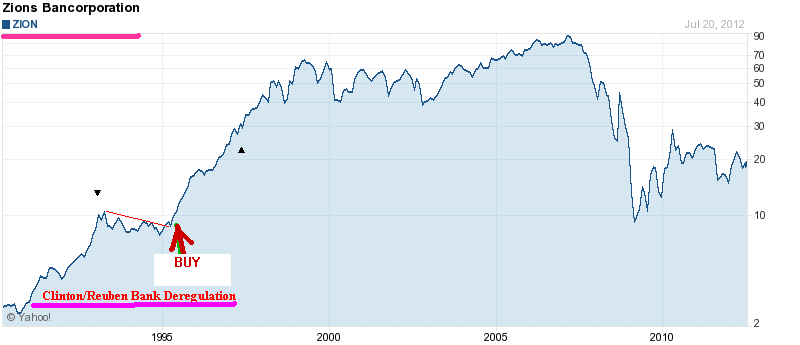
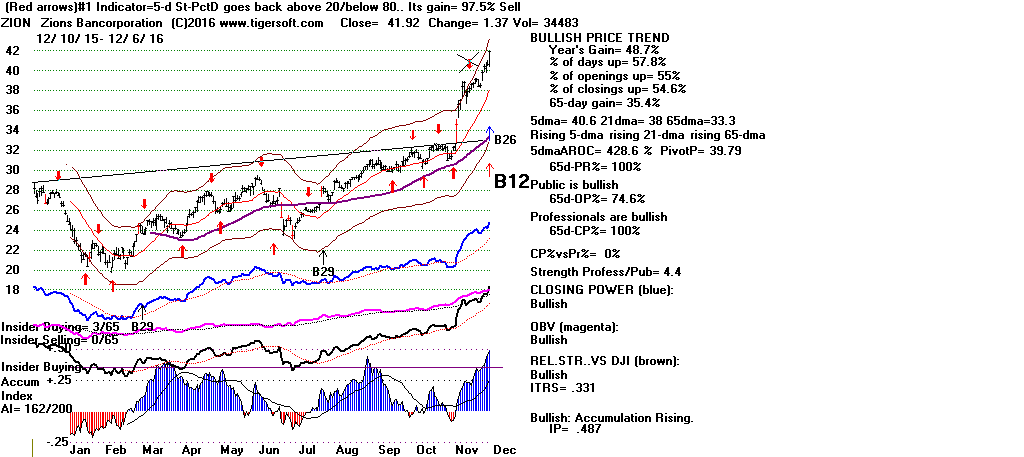
              12/6/16
---------------------------------------------------------------------------------------
Directory     Current       day-1         day-2         day-3         day-4         day-5
----------------------------------------------------------------------------------------
BIGBANKS       100%          1             1             1             1             1
EDU            100%          1             1             1             1             1
REGBANKS       100%          1             1             1             1             1
INFRA          .909          .909          .909          .909          .909          .909
TRANSP         .904          .904          .904          .904          .904          .904
COAL           .888          .888          .888          .888          .888          1
GAMING         .888          .888          .777          .666          .666          .888
AUTO           .85           .8            .75           .75           .725          .7
FINANCE        .835          .835          .824          .835          .813          .835
JETS           .833          1             1             .833          .916          .916
INSURANC       .823          .794          .794          .794          .823          .882
MILITARY       .823          .843          .823          .843          .843          .803
INDMATER       .811          .801          .782          .772          .772          .782
OILGAS         .795          .807          .736          .73           .701          .444
HOMEBLDG       .777          .666          .555          .5            .555          .666
CHEM           .743          .743          .719          .719          .707          .743
NIFTY          .742          .742          .685          .714          .714          .714
RETAIL         .722          .703          .666          .666          .685          .796
ELECTRON       .662          .623          .593          .567          .67           .688
SP-100         .659          .628          .628          .608          .618          .628
RUS-1000       .654          .631          .597          .585          .617          .636
SP500          .626          .608          .574          .563          .58           .604
INDEXES        .613          .592          .546          .525          .588          .63
COMODITY       .605          .605          .563          .549          .563          .408
DOWJONES       .6            .566          .6            .6            .566          .633
SEMI           .592          .525          .488          .496          .614          .637
NASD-100       .585          .574          .531          .521          .595          .648
COMPUTER       .538          .5            .576          .538          .576          .538
REIT           .527          .461          .411          .365          .426          .532
GREEN          .516          .548          .483          .548          .548          .548
SOFTWARE       .477          .417          .358          .343          .522          .552
PIPELINE       .444          .555          .555          .444          .666          .333
BIOTECH        .408          .371          .331          .32           .375          .439
FOOD           .4            .4            .266          .2            .333          .333
HACKERS        .333          .285          .285          .285          .428          .523
UTILITY        .26           .26           .239          .173          .173          .456
ETFS           .25           .176          .132          .147          .147          .132
GOLD           .25           .267          .232          .196          .214          .214
HOSPITAL       .25           .25           .25           .25           .25           .375
SOLAR          .25           .125          .125          .125          .25           .25
CHINA          .207          .246          .233          .272          .363          .324
BEVERAGE       .19           .19           .142          .142          .19           .238
BONDFUND       .009          .009          0             0             0             0
=================================================================
12-5-2016
Newly Created B4 based on OPCT (OBVPct)
would put us back on a Buy.
December is very Bullish.
So are Tax Cuts and De-Regulation.
The Partisan Rally
Should Continue. Buy the New Winners under Trump
and Remain Short Bonds.
Tonight I looked back over all the Peerless DJI charts back to 1929
to see what happens
when Tiger's OBVPct swings swiftly back from below -.25 to above +.25 in two months,
as has happened in the last two months.
What I
found was that as long as the 65-dma was rising, that there was no simultaneous
Peerless
Sell, that the DJI was not more than 3% over the 21-day ma and that this did not
occur in
the last two weeks of December, we have a very reliable Buy signal. Seldom
does the new B4
reverse a Peerless Sell, but when it does, it is worth acting on and trusting.
I have not coded
these parameters yet. So, we will have to wait until tomorrow night to see
all the cases. I want
to put special attention on the new B4s which occurred in bull markets and those
that
would have reversed a Peerless Buy.
This new Buy B4 would have occurred several days ago. See the DJI chart giving
this signal below.
It's true the A/D Line is lagging. But Trump's new paradigm seems centered
on inequality. So why
shouldn't his favorites go to an extreme? There is a natural tendency
anyway for booms and exuberances
when regulation is limited. What's more? All the performance based
funds at this time of year have
no choice but to buy more and more of their winners if they want big year-end
bonuses. .
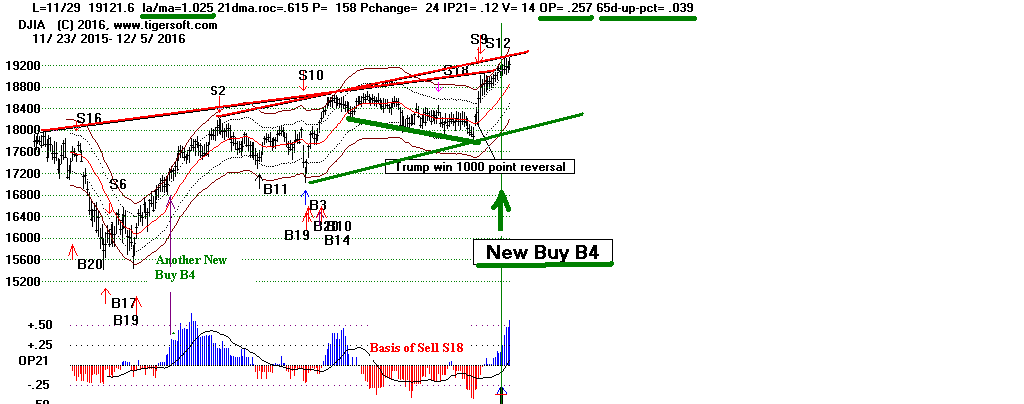


Back in early November, I mentioned that if the DJI's OBV-PCT
crossed back above +.11,
we would have to consider the Summer's S18 voided. Then the Trump-Partisan
rally took
the DJI up so fast that Peerless gave a Sell S9/S12. I said that we should
buy IWM and
the very bullish looking regional banks and not short DIA and SPY because
their
Closing Powers were rising, thus showing that Professionals were still bullish.
The reason,
of course, was that a new Trump and a Republican Congress would likely cut
corporate
and high income taxes dramatically and reduce regulations, too. This still seems
a sure thing,
so I would continue to buy the MAXCP financials and GS, too, until reaches its
all-time
high around 250.
The previously very strong High Tech leaders are more problematic. Trump
is challenging
China and talking about penalties on companies that export jobs. These
policies would really
hurt some of the biggest NASDAQ companies if a trade war developed. But
can Trump
change his mind? Most pundits think that he has and will. He is not
crazy, they say.
Tonight's
New York Times reports that Congressional Republicans have served notice to
Trump
that they would not support tariffs and other protectionist policies that might
lead to
a trade war. Professionals knew something like this was occurring.
Today, the NASDAQ rallied
strongly up from its rising 65-dma instead of breaking down, possibly then
falling to a low below
the October low.
NY Times article: Click
on title below...
House G.O.P. Signals Break With Trump Over Tariff Threat
By JENNIFER STEINHAUER President-elect Trump has suggested a heavy
tax on companies that move jobs overseas, but Republican leaders pushed back,
saying they don't want a trade war.
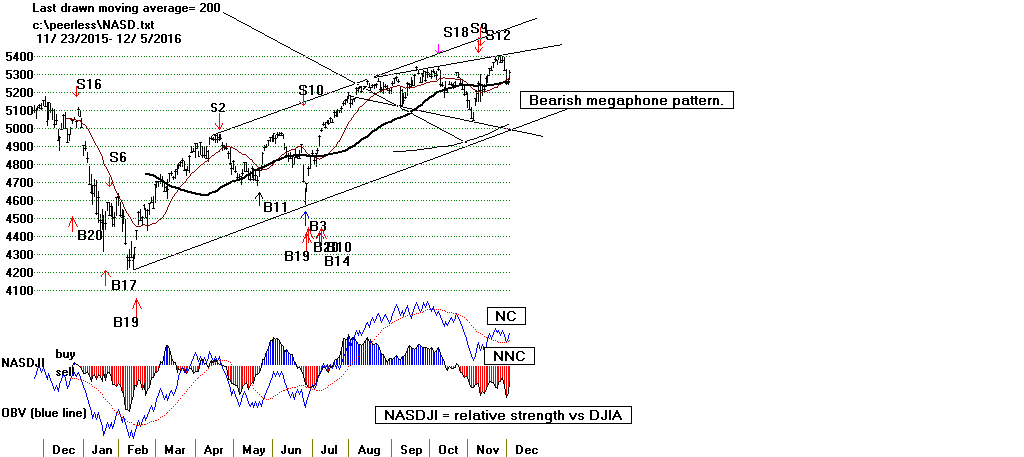
Technically, I would still consider a break in the NASDAQ's 65-dma as bearish
enough to
short it as well as TECL if its Closing Power and 5-day ma are filling.
Since Trump's victory, I have said that the rearrangement of portfolio
priorities, the selling
of municipal bonds, utilities and REIT and the buying of Financials and
Infrastructure stocks
were more important than worrying about the Peerless Sell S9/S12. I suspect
this will continue to be
true. Trump's victory was unexpected and it takes a long time for the
market to factor in
the new Trump priorities and their consequences. I said that I would not
be surprised if
the market as measured by the DJI with GS, JPM, CAT and CVX powering it, reached
and breached 20,000 as Trump has his coronation. What better way to draw
in all
the over-exuberant Public money before making a top? Moreover, with lower
taxes expected
for next year, there is also a natural tendency not to take profits until next
year. And
as I mentioned last night, the second half of December usually out-performs the
first half.
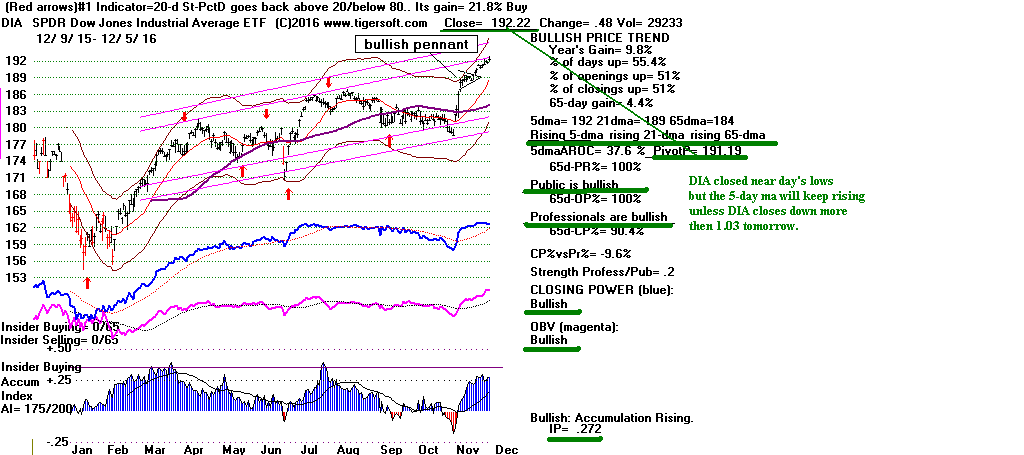
I continue to think that we should abide by the direction of the different ETFs'
5-day
ma and Closing Power, but always reckon where the likely support and resistance
are.
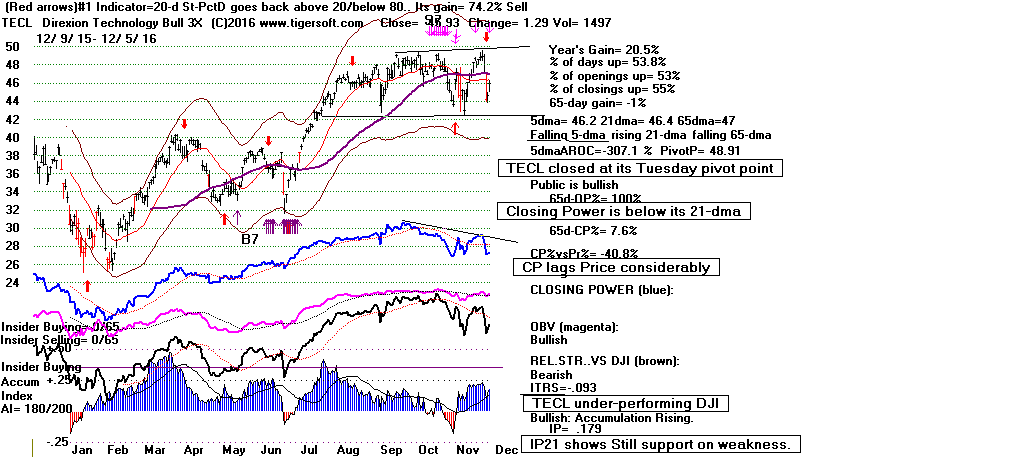
Updates Links to Charts
Links will be to current charts tomorrow. No more time tonight.
12/2/16:
Peerless
DJIA and A/D Line
DJI-OBVPCT
Hourly DJIA
S&P
OEX
NYSE
NASDAQ
DIA
QQQ SPY
IWM
Short-Term Rates
DJI-Utilities
REITS
A/D Line-6000 Stocks
SOXL TECL
FAS
Crude Oil
12/5/2016:
Bullish MAXCPs (mostly
financials & regional banks)
Bearish MINCPs
(still many Bond Funds)
Stocks:
AAPL, BIDU,
IBM, TXN
Bank Stocks - DB (Deutsche
Bank), WFC (Wells Fargo), GS (Goldman Sachs),
AMZN, FB,
GOOG, JPM,
MSFT, NVDA (Super Stock)
TXN
ETFS:
BBH, BRZU,
DIA, DUST,
FAS, GASL,
GLD, IWM,
JETS,
JNUG, KOL, MDY,
NUGT, OIH, OIL,
RETL,
RSX, SLV,
SOXL, TECL,
TMF, TNA,
UGAZ, UPW,
VGK, YINN
 RANKING OF KEY DIRECTORIES BASED PCT.OF STOCKS ABOVE 65-DMA

               12/5/16
---------------------------------------------------------------------------------------
Directory     Current       day-1         day-2         day-3         day-4         day-5
----------------------------------------------------------------------------------------
BIGBANKS       100%          1             1             1             1             1
EDU            100%          1             1             1             1             .875
JETS           100%          1             .833          .916          .916          .75
REGBANKS       100%          1             1             1             1             1
INFRA          .909          .909          .909          .909          .909          .909
TRANSP         .904          .904          .904          .904          .904          .904
COAL           .888          .888          .888          .888          1             1
GAMING         .888          .777          .666          .666          .888          .888
MILITARY       .843          .823          .843          .843          .823          .862
FINANCE        .835          .824          .835          .813          .846          .802
OILGAS         .807          .736          .73           .701          .444          .543
INDMATER       .801          .782          .772          .772          .772          .792
AUTO           .8            .75           .75           .725          .7            .725
INSURANC       .794          .794          .794          .823          .882          .852
CHEM           .743          .719          .719          .707          .731          .731
NIFTY          .742          .685          .714          .714          .714          .742
RETAIL         .703          .666          .666          .685          .796          .796
HOMEBLDG       .666          .555          .5            .555          .666          .666
RUS-1000       .631          .597          .585          .617          .635          .648
SP-100         .628          .628          .608          .618          .628          .67
ELECTRON       .621          .591          .565          .669          .691          .682
SP500          .608          .574          .563          .58           .602          .622
COMODITY       .605          .563          .549          .563          .408          .535
INDEXES        .589          .543          .523          .585          .627          .623
NASD-100       .574          .531          .521          .595          .648          .638
DOWJONES       .566          .6            .6            .566          .633          .633
PIPELINE       .555          .555          .444          .666          .333          .222
GREEN          .548          .483          .548          .548          .548          .645
SEMI           .522          .485          .492          .611          .641          .634
COMPUTER       .5            .576          .538          .576          .538          .576
REIT           .461          .411          .365          .426          .522          .451
SOFTWARE       .417          .358          .343          .522          .552          .567
FOOD           .4            .266          .2            .333          .333          .466
BIOTECH        .37           .329          .319          .373          .434          .41
HACKERS        .285          .285          .285          .428          .523          .476
GOLD           .267          .232          .196          .214          .214          .214
UTILITY        .26           .239          .173          .173          .434          .456
HOSPITAL       .25           .25           .25           .25           .375          .25
CHINA          .246          .233          .272          .363          .337          .298
BEVERAGE       .19           .142          .142          .19           .238          .238
ETFS           .176          .132          .147          .147          .132          .147
SOLAR          .125          .125          .125          .25           .25           .25
BONDFUND       .009          0             0             0             0             0
===========================================================
12-2-2016 See www.tigersoft.com/345HLN12/INDEX.html
===========================================================
12-1-2016
Tomorrow morning we get the official Jobs numbers. I would
think that a
November figure over 200,000 will all but guarantee that the FED will
raise interest rates in December. By down-trending steeply since the
Summer, it is apparent that Bonds, Utilities and Gold are anticipating this.
| |
| Year |
Jan |
Feb |
Mar |
Apr |
May |
Jun |
Jul |
Aug |
Sep |
Oct |
Nov |
Dec |
| 2006 |
278 |
316 |
281 |
183 |
23 |
82 |
207 |
181 |
158 |
4 |
208 |
171 |
| 2007 |
240 |
90 |
189 |
79 |
143 |
78 |
-33 |
-24 |
88 |
85 |
115 |
97 |
| 2008 |
19 |
-86 |
-78 |
-210 |
-185 |
-165 |
-209 |
-266 |
-452 |
-473 |
-769 |
-695 |
| 2009 |
-791 |
-703 |
-823 |
-686 |
-351 |
-470 |
-329 |
-212 |
-219 |
-200 |
-7 |
-279 |
| 2010 |
28 |
-69 |
163 |
243 |
522 |
-133 |
-70 |
-34 |
-52 |
257 |
123 |
88 |
| 2011 |
42 |
188 |
225 |
346 |
73 |
235 |
70 |
107 |
246 |
202 |
146 |
207 |
| 2012 |
338 |
257 |
239 |
75 |
115 |
87 |
143 |
190 |
181 |
132 |
149 |
243 |
| 2013 |
190 |
311 |
135 |
192 |
218 |
146 |
140 |
269 |
185 |
189 |
291 |
45 |
| 2014 |
187 |
168 |
272 |
310 |
213 |
306 |
232 |
218 |
286 |
200 |
331 |
292 |
| 2015 |
221 |
265 |
84 |
251 |
273 |
228 |
277 |
150 |
149 |
295 |
280 |
271 |
| 2016 |
168 |
233 |
186 |
144 |
24 |
271 |
252 |
176 |
191(P) |
161(P) |
|
|
http://data.bls.gov/timeseries/CES0000000001?output_view=net_1mth
|
|
Trump Wants Wall Street To Boom
and He Believes That Goldman Sachs
Will Make That Happen.
But the real news is, of course, what the new Trump Administration can do
for Wall Street by reducing taxes on corporations, on capital gains, on wealthy
individuals and estates. Lower taxes have been declared to be the
highest
priority for the Republican Congress. Dropping the official tax on
corporations
from 35% to 15% would immediately boost earnings all across the business world
by as much as 20%.
Reducing government regulations will take longer. But we can
certainly see
how eagerly Bank stocks are looking forward to the World of Trump, especially
since his Cabinet will likely have a number of Goldman Sachs graduates on it.
Not surprisingly as a result, Today's DJI advance was again led by Goldman and
JPM.
CVX also helped out today. Without these three components. the Dow
Jones would have
only risen by 10. Because GS is by far the highest priced and most
weighty stock in the DJI-30,
we have to watch it closely now. It seems headed back up to its
all-time high, still 20-points away.
Such a rise in isolation would lift the DJI by 150 more points. But
is too much of the
heavy-lifting now being done by too few stocks?
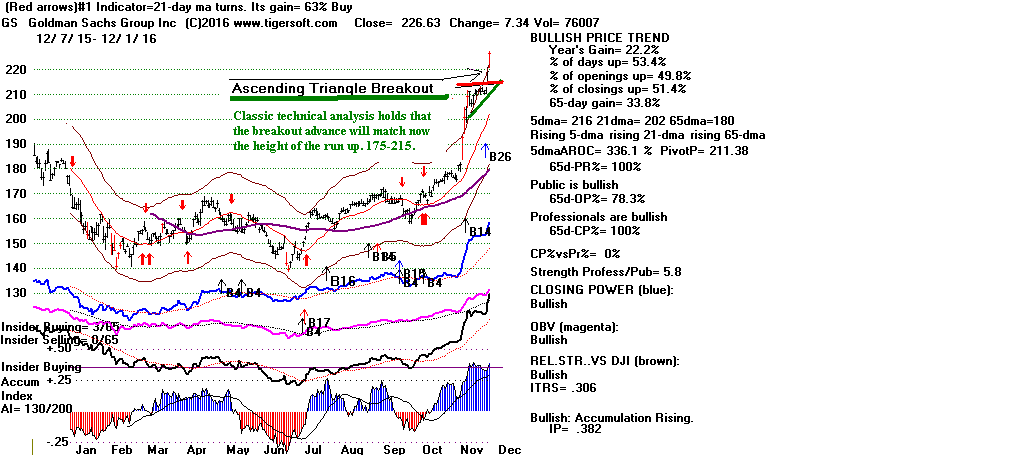
No Reversing Buy Signal Yet
The Peerless S9/S12 has not been reversed.
The paper loss on the DJIA from the
clinched S9/S12 is not outside the range that we have seen before from this
signal.
It is presently 384 points or about 2%. In fact, eight of the earlier 24
Peerless
Sell S9/S12s suffered paper losses between 2% and 4.3%, the biggest pager loss.
5 of these 8 still worked out profitably when reversed on the next Peerless
Buy signal. In the three cases where a loss ensued, a Buy B4 appeared
which
limited further loss. The Buy B4 was always profitable in its own right.
Unfortunately,
we are not likely to get a Buy B4 unless there is a broad surge in the market.
Today's market was ugly. Even though the
DJI was up more than 90 in early
trading today, at the close there were 726 more down than up on the NYSE.
The DJI has reached its over-head resistance and the NYSE A/D Line's uptrend
was today slightly violated.
The NASDAQ lost 73 points (-1.36%) today. Big daily losses were recorded
by SOXL (14.8% - semi-conductors) and
TECL (6.2% - technology). The
NASDAQ's broadening top, a megaphone
pattern, looks quite bearish, especially
if tomorrow it slices down through its 65-dma, which it closed at today.
Bearish
also is its weakened/negative relative strength
versus the DJI, its lagging OBV
and the break in its Closing Power uptrend following a non-confirmation.
See the
COMPQX (NASDAQ chart) below using the INDEX data on the Tiger Data Page.
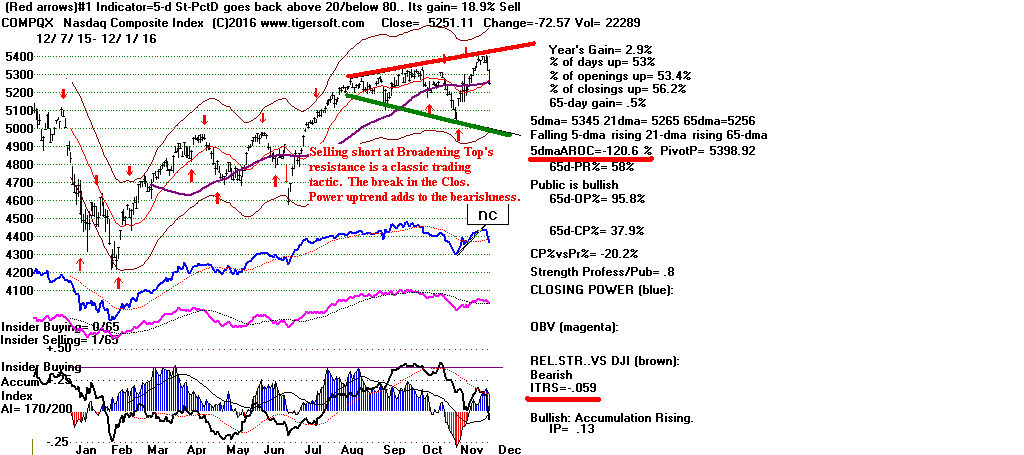
Updates Links to Charts
Peerless
DJIA and A/D Line
DJI-OBVPCT
Hourly DJIA
S&P
OEX
NYSE
NASDAQ
DIA
QQQ SPY
IWM
Short-Term Rates
DJI-Utilities
REITS
A/D Line-6000 Stocks
SOXL TECL
FAS
Crude Oil
12/1/16:
Bullish MAXCPs (mostly
financials & regional banks)
Bearish MINCPs
(many Bond Funds)
Stocks:
AAPL, BIDU,
IBM, TXN
Bank Stocks - DB (Deutsche
Bank), WFC (Wells Fargo), GS (Goldman Sachs),
AMZN, FB,
GOOG, JPM,
MSFT, NVDA (Super Stock)
TXN
ETFS:
BBH, BRZU,
DIA, DUST,
FAS, GASL,
GLD, IWM,
JETS,
JNUG, KOL, MDY,
NUGT, OIH, OIL,
RETL,
RSX, SLV,
SOXL, TECL,
TMF, TNA,
UGAZ, UPW,
VGK, YINN
Below are the
8 cases where there was a paper loss on a Peerless S9/S12.
DJIA
% Gain
Biggest
on
Paper
Short
Loss
---------------------------------------------------------------------------------------------
                     19290426      S9             314.2         .066
                     19290430      S12            319.3         .081        2.2%
                     19290614      S9             313.7        -.047
                     19290617      S12            319.3        -.029        2.9%

                     19340821      S9             92.6          .036
                     19340821      S12            92.6          .036        3.1%
                     19340927      S9             93.4         -.02
                     19341005      S12            92.9         -.026        2.6%
                     19590701      S9             650.2         .019
                     19590701      S12            650.2         .019        4.3%
                     19710826      S9             906.1         .088
                     19710831      S12            898.07        .08         3.7%
                     19720803      S9             947.7         .027
                     19720804      S12            951.76        .032        2.3%
                     19870608      S12            2351.64      -.04
                     19870609      S9             2352.7       -.039        3.9%
                     Looking at the charts of three cases where short sales on DIA would have been
                     reversed at a loss, we see that in all 3 cases a Buy B4 was the agent of change.
                     In addition, on the day of the Buy B4, the annualized rate of change the 21-day
                     ma was above 1.10. It is only .71 now.  And in all three cases, the DJI was more
                     than 4% over the 21-day ma.  Here it is only 2.3% over the 21-dma.
RANKING OF KEY DIRECTORIES BASED PCT.OF STOCKS ABOVE 65-DMA
              12/1/16
---------------------------------------------------------------------------------------
Directory     Current       day-1         day-2         day-3         day-4         day-5
----------------------------------------------------------------------------------------
BIGBANKS       100%          1             1             1             1             1
EDU            100%          1             1             .875          .875          .875
REGBANKS       100%          1             1             1             1             1
INFRA          .909          .909          .909          .909          .909          .909
TRANSP         .904          .904          .904          .904          .952          .904
COAL           .888          .888          1             1             1             1
MILITARY       .843          .843          .823          .862          .843          .823
FINANCE        .835          .813          .846          .802          .846          .835
JETS           .833          .916          .916          .75           .833          .833
INSURANC       .794          .823          .882          .852          .882          .852
INDMATER       .774          .774          .774          .794          .794          .794
AUTO           .75           .725          .7            .725          .75           .725
OILGAS         .73           .701          .444          .543          .619          .649
CHEM           .719          .707          .731          .731          .731          .743
NIFTY          .714          .714          .714          .714          .771          .771
GAMING         .666          .666          .888          .888          1             1
RETAIL         .666          .685          .796          .759          .814          .814
SP-100         .608          .618          .628          .659          .69           .639
DOWJONES       .6            .566          .633          .633          .7            .633
RUS-1000       .585          .618          .636          .645          .674          .648
ELECTRON       .569          .673          .695          .686          .704          .726
SP500          .563          .58           .602          .616          .651          .622
COMPUTER       .555          .592          .555          .592          .592          .555
COMODITY       .549          .563          .408          .535          .492          .521
GREEN          .548          .548          .548          .645          .612          .612
INDEXES        .523          .585          .627          .627          .652          .623
NASD-100       .521          .595          .648          .617          .68           .627
HOMEBLDG       .5            .555          .666          .666          .666          .666
SEMI           .496          .614          .644          .629          .659          .696
PIPELINE       .444          .666          .333          .222          .444          .555
REIT           .365          .426          .522          .451          .436          .401
SOFTWARE       .343          .522          .552          .567          .582          .582
BIOTECH        .319          .373          .434          .407          .494          .478
HACKERS        .285          .428          .523          .476          .476          .476
CHINA          .272          .363          .337          .298          .324          .311
HOSPITAL       .25           .25           .375          .25           .375          .375
GOLD           .21           .228          .228          .228          .192          .192
FOOD           .2            .333          .333          .466          .533          .466
UTILITY        .173          .173          .434          .456          .347          .152
ETFS           .147          .147          .132          .147          .132          .147
BEVERAGE       .142          .19           .238          .238          .19           .19
SOLAR          .125          .25           .25           .25           .25           .25
BONDFUND       0             0             0             0             0             0
=============================================================
11-30-2016
The Peerless S9/S12 has not been reversed.
The paper loss from the
clinched S9/S12 is not outside the range that we have seen before from this
signal. (More on this tomorrow night.) A short-term decline
now seems highly
likely. Watch tomorrow to see if the NYSE A/D Line breaks its recent
uptrend.
This would be bearish given the recent failure of the A/D Line to match the DJI
in
making a new high. Expect the DJI to find support, if there is a decline,
at its
rising 21-dma, at 18600-18700.
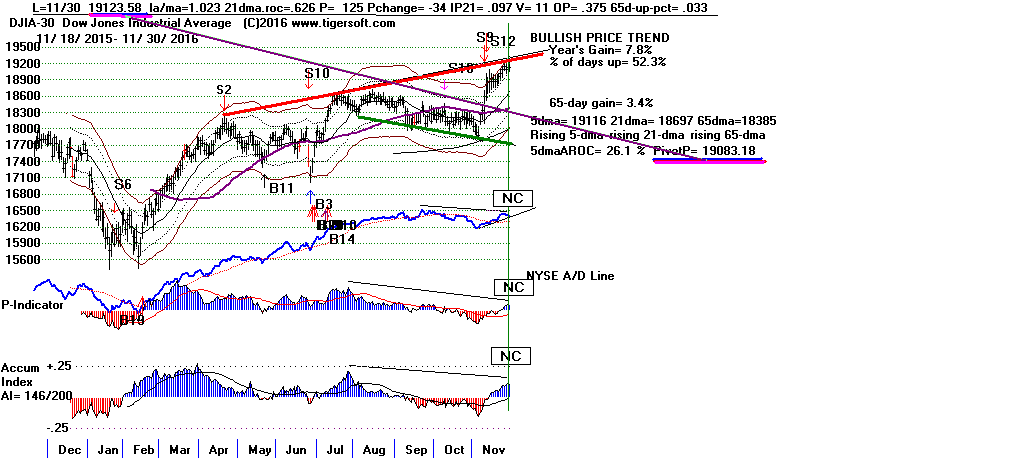
Trump has given us a rousing partisan rally this
Presidential Election season.
History told us to expect such a rally. Exuberant partisan buying is
normal in
Presidential Election year Novembers.
Wall Street loves his billionaire Cabinet appointments. The fears that he
might
actually be a Main Street populist have completely evaporated. This has
sent
big bank stocks like Goldman soaring. As by far the highest priced
individual DJI
stock, GS has single-handedly boosted the DJI by 425 points in the last two
months.
(62/.146). Its all-time high beckons. So, it could rise another 30
points, which would
boost the DJI by 200 more points.
Cutting taxes on the wealthy and corporations are the Administration's and
Congress'
number#1 priority. Such tax cuts have always been very bullish.
(More on this tomorrow.)
Just the expectation of lower taxes will get many to defer their selling and
taking profits
until after the tax cut becomes law.
And December is the most bullish month of the year. Since 1965, the DJI
has achieved
a gain over the next 20 trading days of December 75.5% of the time, the rise
averaging
2.2%.
So, why do we have a number of bearish technical readings now? The Fed's
determination
now to raise rates to prevent a brand new stock market bubble? Misgivings
about
Trump's personality disorders which his political foes will surely try to
exploit and
aggravate? Simple profit-taking? An overseas backlash from
allies and trading partners
against Trump's new economic nationalism? Take your pick. Whatever
it turns out to be,
the technical deterioration shown below warns us that something negative is
approaching
the market. Simple profit-taking seems warranted now or soon.
December is too
bullish a month to bring a really big DJI drop, one that goes below the lower
band.
The thing to know now is that there are a number of
technical warning signs. Here are
ones that I consider most important. The first four relate to the DJI
itself.
1) As I showed last night, there has not been a DJI take-off following a 7% jump
in prices
in November in 61 years. Of course, it can be argued that the
Eisenhower take-off of 1955 was
a direct result of his launching a big infrastructure program to build
interstate highways.
Trump tells us he will propose something equally grand and important.
What Happens To DJI after 7% Advances in November?
Date Outcome
-------------- ------------
11/19/1954 bullish take-off
11/20/1980 sharp sell-off a little below lower band.
11/22/1996 DJI went sidewise.
11/1/2000 DJI fell to lower band.
11/11/2005 Wild swings both ways.
11/4/2014 Wild swings both ways.
2) The DJI's Hourly DJI chart is now showing a widening and bearish divergence
between prices and its OBV Line. See below how the Hourly OBV Line has
also
just broken its uptrend. If the Hourly OBV/DISI Line starts to make two
month
lows ahead of price, it will start to look a lot it did before the August 2015
and January
2016 intermediate-term DJI corrections of 13%-14%.
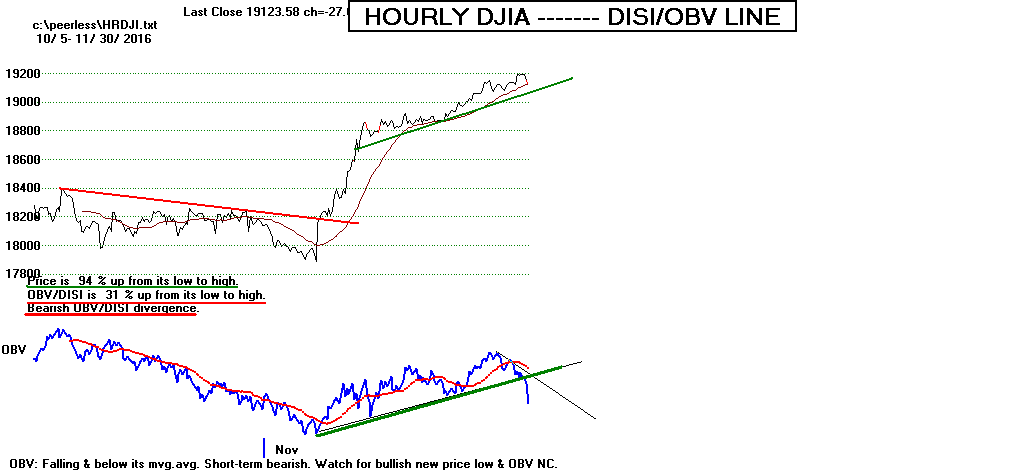
3) Our short-term NET IDOSC for the DJIA-30 shows nearly the same degree of
bearish divergence from prices that was seen at this Summer's top.
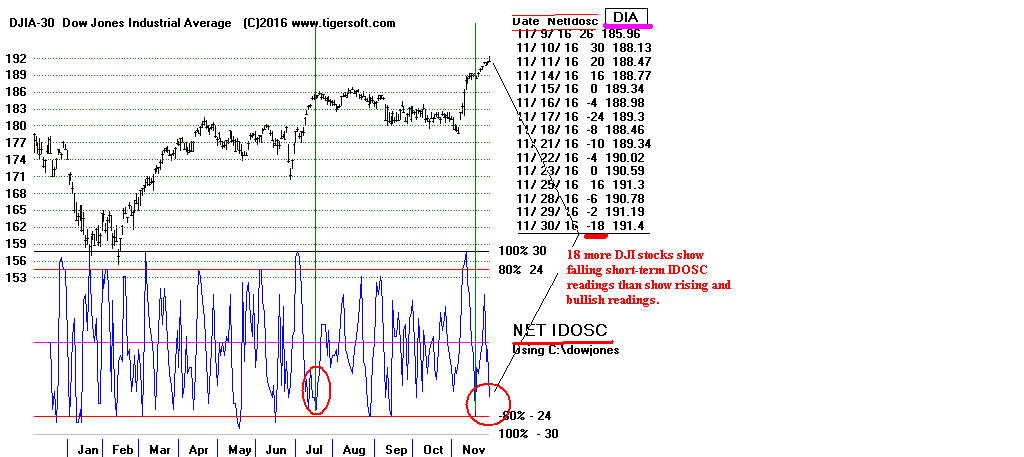
4) DIA's Closing Power steep uptrend been
broken and it will only
take a DIA decline of .82 or more to cause its
5-day ma to turn down.
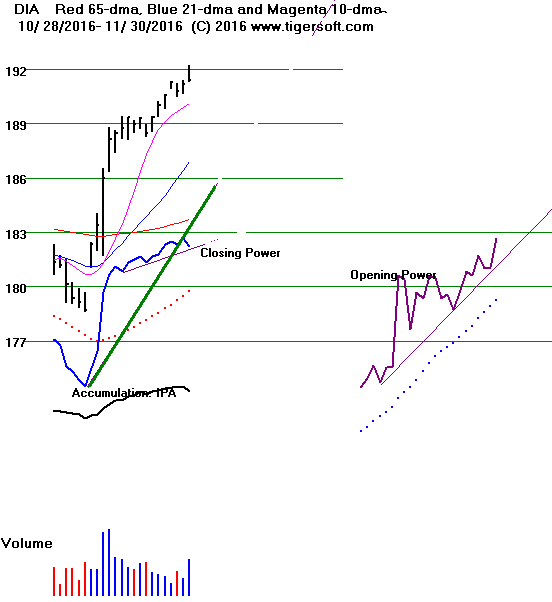
5) The Closing Powers for IWM, QQQ and SPY
are in minor down-trends now.
The 5-day moving averages for IWM,
SPY and QQQ
are falling. A pull-back
is very likely for them, especially as they have each and are now retreating
from
their resistance-lines.
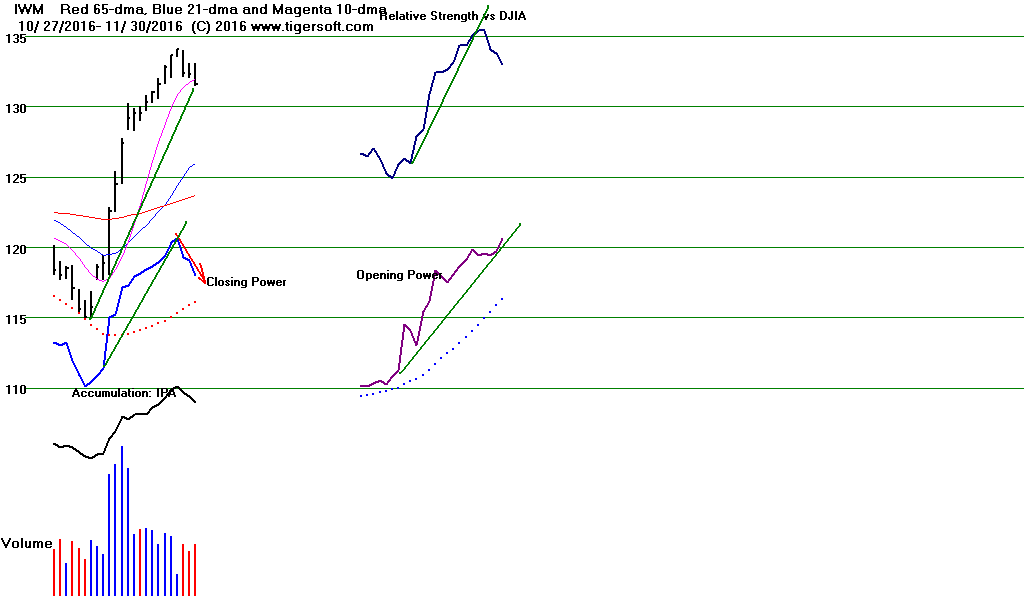
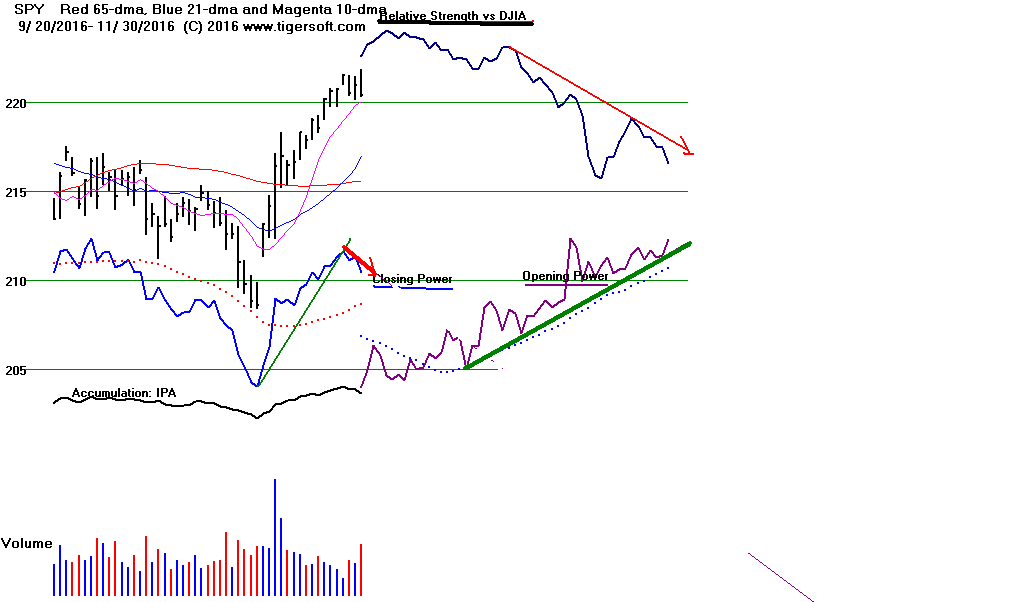
6) The NASDAQ shows a bearish broadening top, or megaphone pattern.
This is associated with a dangerously speculative and out-of-control market.
Selling short at the 5th point shown on the chart is a standard technical
strategy.
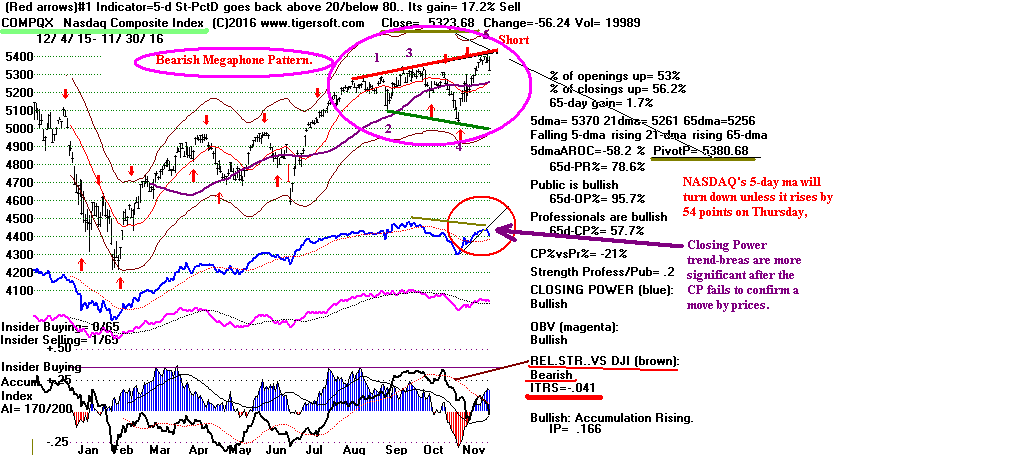
Updates Links to Charts
Peerless
DJIA and A/D Line
DJI-OBVPCT
Hourly DJIA
S&P
OEX
NYSE
NASDAQ
DIA
QQQ SPY
IWM
Short-Term Rates
DJI-Utilities
REITS
A/D Line-6000 Stocks
SOXL TECL
FAS
Crude Oil
11/30/16:
Bullish MAXCPs (many
financials & regional banks)
Bearish MINCPs
(many Bond Funds)
Stocks:
AAPL, BIDU,
IBM, TXN
Bank Stocks - DB (Deutsche
Bank), WFC (Wells Fargo), GS (Goldman Sachs),
AMZN, FB,
GOOG, JPM,
MSFT, NVDA (Super Stock)
TXN
ETFS:
BBH, BRZU,
DIA, DUST,
FAS, GASL,
GLD, IWM,
JETS,
JNUG, KOL, MDY,
NUGT, OIH, OIL,
RETL,
RSX, SLV,
SOXL, TECL,
TMF, TNA,
UGAZ, UPW,
VGK, YINN
         RANKING OF KEY DIRECTORIES BASED PCT.OF STOCKS ABOVE 65-DMA
         11/30/16
---------------------------------------------------------------------------------------
Directory     Current       day-1         day-2         day-3         day-4         day-5
----------------------------------------------------------------------------------------
BIGBANKS       100%          1             1             1             1             1
EDU            100%          1             .875          .875          .875          .875
REGBANKS       100%          1             1             1             1             1
JETS           .916          .916          .75           .833          .833          .833
INFRA          .909          .909          .909          .909          .909          .909
TRANSP         .904          .904          .904          .952          .904          .904
COAL           .888          1             1             1             1             1
MILITARY       .843          .823          .862          .843          .823          .784
INSURANC       .823          .882          .852          .882          .823          .823
FINANCE        .813          .846          .802          .846          .835          .813
INDMATER       .774          .774          .794          .794          .794          .784
AUTO           .725          .7            .725          .75           .725          .675
CHEM           .716          .74           .74           .74           .753          .716
NIFTY          .714          .714          .714          .771          .742          .714
OILGAS         .697          .441          .54           .616          .639          .668
RETAIL         .685          .796          .759          .814          .796          .814
ELECTRON       .67           .692          .683          .701          .722          .692
GAMING         .666          .888          .888          1             1             .888
PIPELINE       .666          .333          .222          .444          .555          .555

RUS-1000       .618          .636          .645          .674          .645          .631
SP-100         .618          .628          .659          .69           .628          .628
SEMI           .614          .644          .629          .659          .696          .681
NASD-100       .595          .648          .617          .68           .617          .638
COMPUTER       .592          .555          .592          .592          .555          .555
INDEXES        .585          .627          .627          .652          .623          .61
SP500          .58           .602          .616          .651          .616          .604
DOWJONES       .566          .633          .633          .7            .6            .533
COMODITY       .557          .414          .528          .5            .528          .542
HOMEBLDG       .555          .666          .666          .666          .666          .666
GREEN          .548          .548          .645          .612          .612          .58
SOFTWARE       .522          .552          .567          .582          .582          .626
- - - - - - - - - - - - - - - - - - - - - - - - - - - - - - - - - - - - - - - - - - - - - - - -
HACKERS        .428          .523          .476          .476          .476          .523
REIT           .426          .522          .451          .436          .401          .416
BIOTECH        .375          .435          .408          .493          .469          .425
CHINA          .371          .346          .307          .333          .32           .294

FOOD           .333          .333          .466          .533          .466          .666
HOSPITAL       .25           .375          .25           .375          .375          .125
SOLAR          .25           .25           .25           .25           .25           .25
GOLD           .228          .228          .228          .192          .192          .21
BEVERAGE       .19           .238          .238          .19           .19           .19
UTILITY        .173          .434          .456          .347          .152          .26
ETFS           .147          .132          .147          .132          .147          .147
BONDFUND       0             0             0             0             0             0
===========================================================
11-29-2016
November rises in the DJI by more than 7% like
we have just seen
have been more bearish historically than bullish. This surprising
statistic
must concern us here, especially since the Peerless Sell S9/S12 signals have
not been reversed. A quick bout of profit-taking, perhaps when the FED
raises
rates, would seem to be likely soon. Typically, we then will see a
Santa
Claus Buy B13 after December 26th. If there is a decline, I would not
think
the DJI will drop much below the rising 21-day ma because of December's bullish
seasonality and because the big Trump tax cuts give big investors reason to hold
of serious profit-taking until next year. The key ETFs Closing Powers did
weaken a little today. Now the bears will need to see the recent
NYSE A/D
Line
break its uptrend.
What Happens To DJI after 7% Advances in November?
Date Outcome
-------------- ------------
11/19/1954 bullish take-off
11/20/1980 sharp sell-off a little below lower band.
11/22/1996 DJI went sidewise.
11/1/2000 DJI fell to lower band.
11/11/2005 Wild swings both ways.
11/4/2014 Wild swings both ways.
(See charts below.)
Updates Links to Charts
Peerless
DJIA and A/D Line
DJI-OBVPCT
Hourly DJIA
S&P
OEX
NYSE
NASDAQ
DIA
QQQ SPY
IWM
Short-Term Rates
DJI-Utilities
REITS
A/D Line-6000 Stocks
SOXL TECL
FAS
Crude Oil
11/29/16:
Bullish MAXCPs
Bearish MINCPs
(many Bond Funds)
Stocks:
AAPL, BIDU,
IBM, TXN
Bank Stocks - DB (Deutsche
Bank), WFC (Wells Fargo), GS (Goldman Sachs),
AMZN, FB,
GOOG, JPM,
MSFT, NVDA (Super Stock)
TXN
ETFS:
BBH, BRZU,
DIA, DUST,
FAS, GASL,
GLD, IWM,
JETS,
JNUG, KOL, MDY,
NUGT, OIH, OIL,
RETL,
RSX, SLV,
SOXL, TECL,
TMF, TNA,
UGAZ, UPW,
VGK, YINN
CASES WHERE DJI ROSE 7% in 14 TRADING DAYS:
1945-2016
See list of
cases...
-----------------------------------------------------------------------------------------------------
88 earlier cases: 38 occurred in Bear
Markets. We will leave these out of our consideration here.
50 Bold = Bull Market Cases
24
Blue = DJI subsequent take-offs
48%
19
Red = DJI fell to lower band or lower
38%
4
Maroon = DJI went primarily sidewise
8%
3
Pink = Wild Swings Up and then down sharply
6%
Since
2000 23 cases
13
Bull Market Cases
5
DJI take-offs upwards 38.5%
3
DJI fell to lower band or lower 23.1%
1
DJI went primarily sidewise. 7.7%
4
Wild Swings Up and then down sharply
30.8%
November Cases
11/19/1954
1.03 99
.07
11/20/ 1980
1.04 -19
-.01
11/22/1996
1.04 232
.16
11/1/2000
1.04 -200
.03
11/11/2004
1.03 476
.06
11/4/2014
1.03 265
.07
11/25/2016
1.03 115
.08 Undecided...
11/19/1954
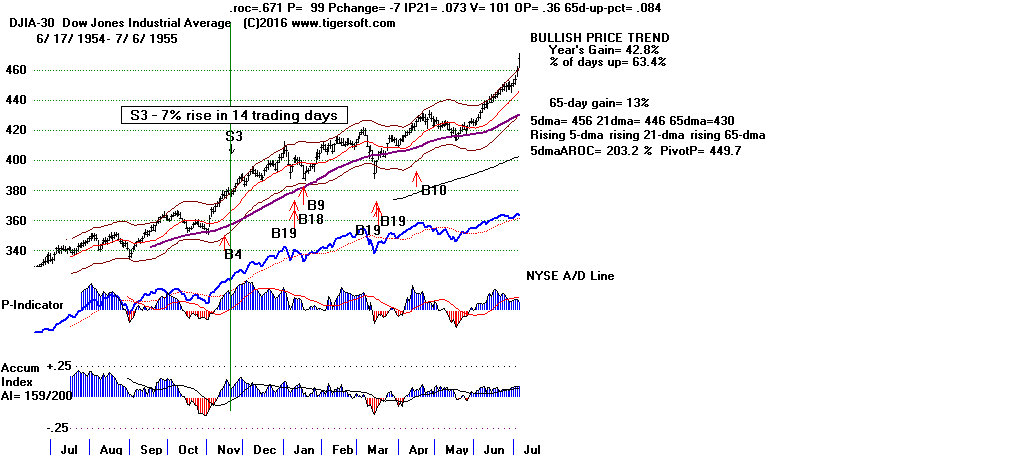 |
11/20/ 1980
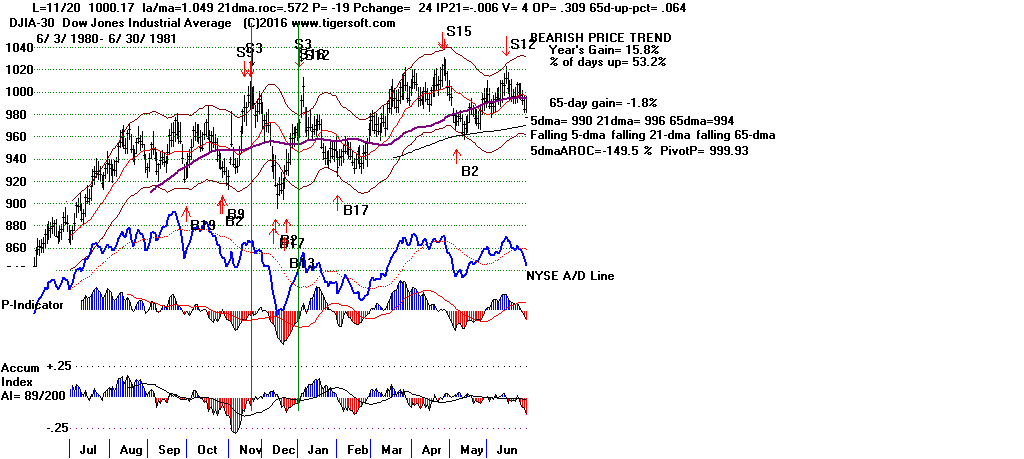 |
11/22/1996
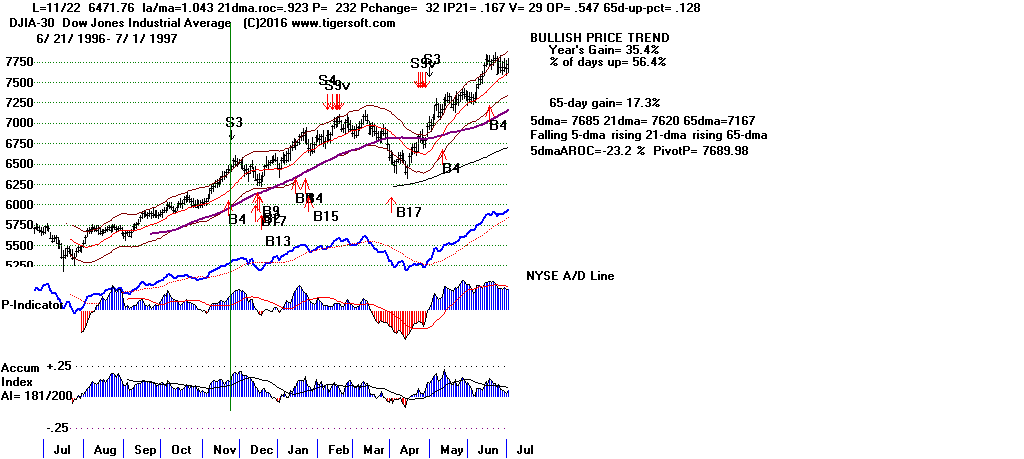 |
11/1/2000
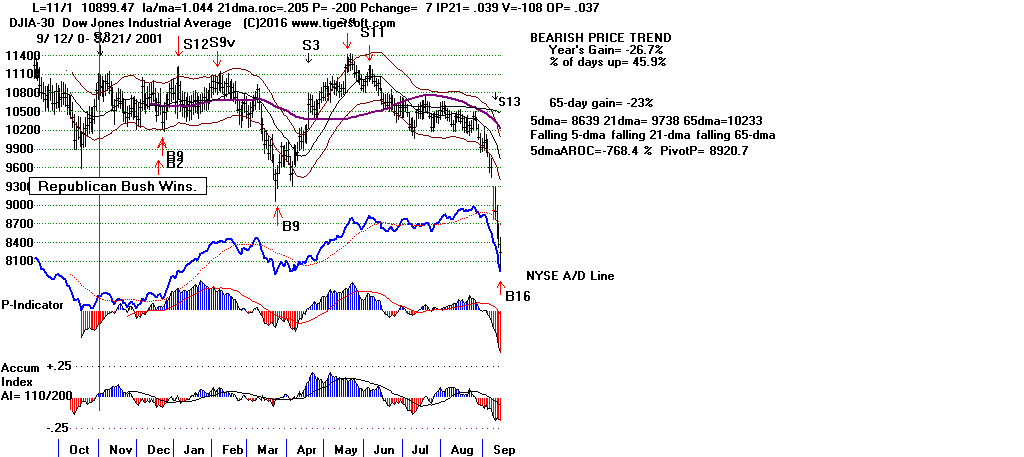 |
11/11/2004
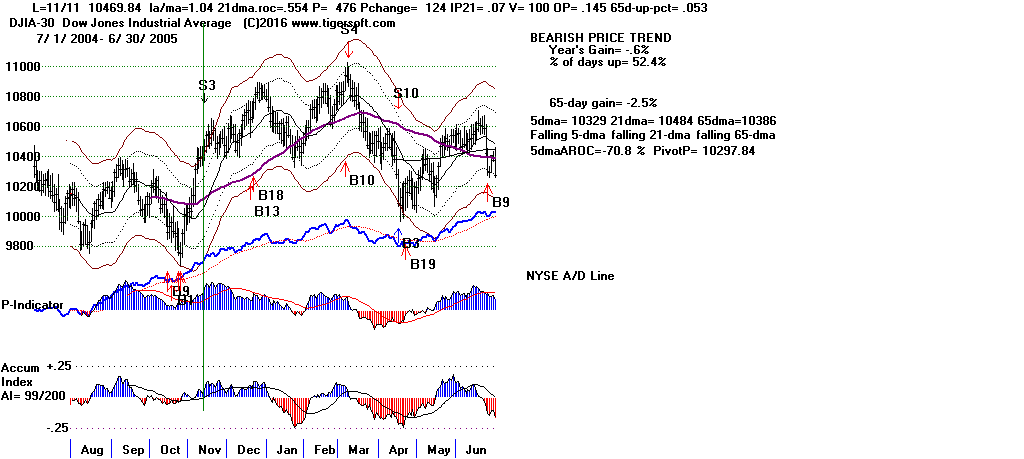 |
11/4/2014
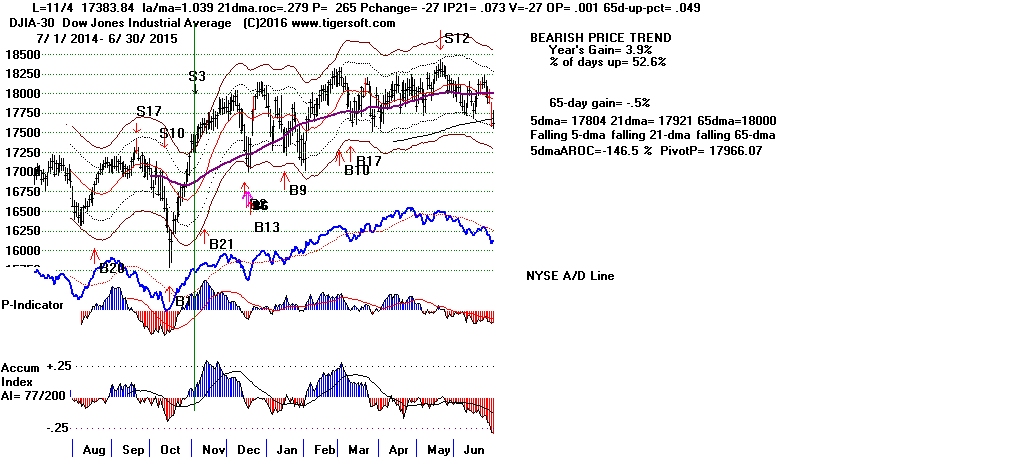 |
           RANKING OF KEY DIRECTORIES BASED PCT.OF STOCKS ABOVE 65-DMA

              11/29/16
---------------------------------------------------------------------------------------
Directory     Current       day-1         day-2         day-3         day-4         day-5
----------------------------------------------------------------------------------------
BIGBANKS       100%           1             1             1             1             1
COAL           100%           1             1             1             1             1
EDU            100%           .875          .875          .875          .875          .875
REGBANKS       100%           1             1             1             1             1
JETS           .916          .75           .833          .833          .833          .833
INFRA          .909          .909          .909          .909          .909          .909
TRANSP         .904          .904          .952          .904          .904          .904
GAMING         .888          .888          1             1             .888          .888
INSURANC       .882          .852          .882          .823          .794          .823
FINANCE        .846          .802          .846          .835          .813          .824
MILITARY       .823          .862          .843          .823          .784          .725
RETAIL         .796          .759          .814          .796          .814          .74
INDMATER       .774          .794          .794          .794          .784          .784
CHEM           .74           .74           .74           .753          .716          .703
NIFTY          .714          .714          .771          .742          .714          .742
AUTO           .7            .725          .75           .725          .675          .6
ELECTRON       .692          .683          .701          .722          .688          .67
HOMEBLDG       .666          .666          .666          .666          .666          .555

NASD-100       .648          .617          .68           .617          .648          .617
SEMI           .644          .629          .659          .696          .674          .651
RUS-1000       .636          .645          .674          .645          .631          .62
DOWJONES       .633          .633          .7            .6            .566          .566
SP-100         .628          .659          .69           .628          .639          .608
INDEXES        .627          .627          .652          .623          .61           .602
SP500          .602          .616          .651          .616          .606          .596
COMPUTER       .555          .592          .592          .555          .592          .592
SOFTWARE       .552          .567          .582          .582          .626          .626
GREEN          .548          .645          .612          .612          .58           .483
HACKERS        .523          .476          .476          .476          .523          .571
REIT           .522          .451          .436          .401          .406          .314
OILGAS         .441          .54           .616          .639          .668          .656
BIOTECH        .437          .41           .494          .471          .424          .481
UTILITY        .434          .456          .347          .152          .26           .173
COMODITY       .414          .528          .5            .528          .528          .6
HOSPITAL       .375          .25           .375          .375          .125          .375
CHINA          .346          .307          .333          .32           .294          .294

FOOD           .333          .466          .533          .466          .6            .6
PIPELINE       .333          .222          .444          .555          .555          .555
SOLAR          .25           .25           .25           .25           .25           .187
BEVERAGE       .238          .238          .19           .19           .19           .19
GOLD           .228          .228          .192          .192          .21           .192
ETFS           .132          .147          .132          .147          .147          .132
BONDFUND       0             0             0             0             0             0
=========================================================
11-28-2016
The Peerless Sell S9/S12 Will Not Easily Go Away. No new Peerless
Buy Signals
are in sight.
Take long profits in IWM and the
Bullish Bank Stocks. There are just
too
many
glaring contradictions between the DJI's strength and nearly all of our
technical
indicators. The same is true for the Hourly DJI,
SP-500 and
NASDAQ. Prices have
reached a very over-bought status and most internal strength measures are still
lagging badly.
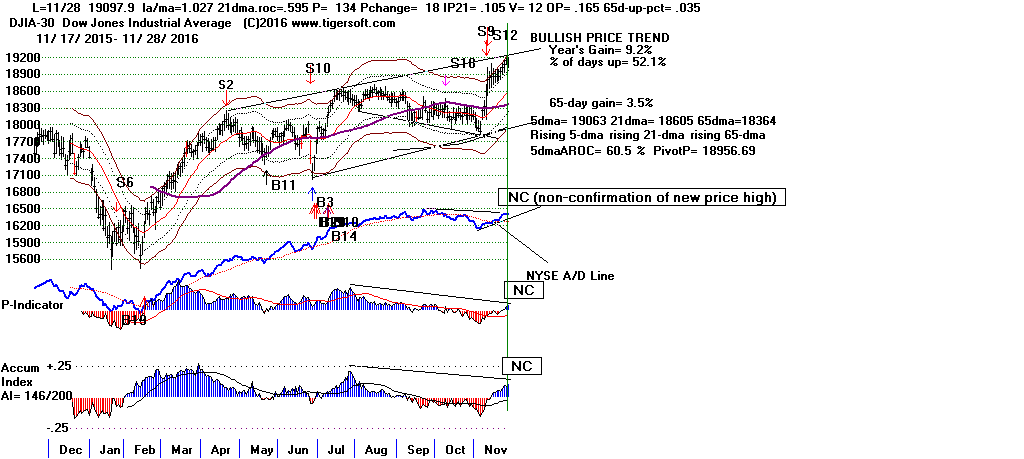
I don't like how abruptly the rally stopped now that Thanksgiving's bullishness
is
past. I don't like the multiple non-confirmations (breadth and volume)
wherein the
A/D Line and the OBV Lines still have not made their own new highs like the DJI
has.
I don't like the breaks in all the steep Closing Power uptrends. See this
in
blown-up graphs for the last month of so: DIA,
SPY, MDY,
IWM...
I don't like my discovery tonight that November run-ups by 7% in 14 trading days
have only been associated with one market take-off in the 6 instances of such
big
advances since 1945. I don't like how each of the major market ETFs pulled
back
today from resistance-lines. I don't like that SPY, FAS and QQQ could each
have
falling 5-day moving averages on the close tomorrow unless we get a good up-day.
And, of course, I am frightened that our next President finds it so easy to
fabricate
any numbers he chooses. This weekend he argued that he only reason that he lost
the popular vote nationally
(by more than
2 million) was because of illegal voting
and voter fraud. He offered no evidence to support this view.
So, why must he even
fuss about it? He will be the next
President. He seems
to care not at all how much
harm he can do to himself and to the country when
talking
so glibly. Today we saw how
his crazy words can rattle market confidence.
Unfortunately,
he seems less "crazy like a fox"
and more just plain "crazy". .
DJI rose 7% or more in 14 trading days
when the DJI was not in a bear market.
Date Outcome
-------------- ------------
11/19/1954 bullish take-off
11/20/1980 sharp sell-off a little below lower band.
11/22/1996 DJI went sidewise.
11/1/2000 DJI fell to lower band.
11/11/2005 Wild swings both ways.
11/4/2014 Wild swings both ways.
(More on this tomorrow night.)
ETF Open.
Clos. 11/28/16
11/29/16 IP21 ITRS
Notes
Power Power
Pivot Point
---------------------------------------------------------------------
DIA Both Up
190.78 -.52 187.34
+.27 na
turned down at rising resistance-line.
SPY
Both Up 220.48
-1.04 220.15 +.188
-.021 turned down at rising resistance-line
MDY Both Up 296.52
-2.17 294.43 +.21
+.019 turned down at rising resistance-line
IWM Both Up 132.33
-1.74
131.60 +.266 +.032.
turned down at rising resistance-line
FAS
Both Up 36.20 -.98
36.28
+.416 +226. turned down at rising
resistance-line..
QQQ
Up ? 118.53
-.27
118.54
+.066 -.044
turned down at rising resistance-line.
TECL +.20 is testing its resistance up
to 50.
SOXL -.48 was stopped by its steeply rising
resistance line.
Megaphone patterns are bearish when prices turn down from the rising resistance
line. We see that in the NASDAQ chart below. We also see glaring
failures by the
OBV, NASDJI Relative Strength and Accumulation Index to match the NASDAQ's
recent run to new highs.
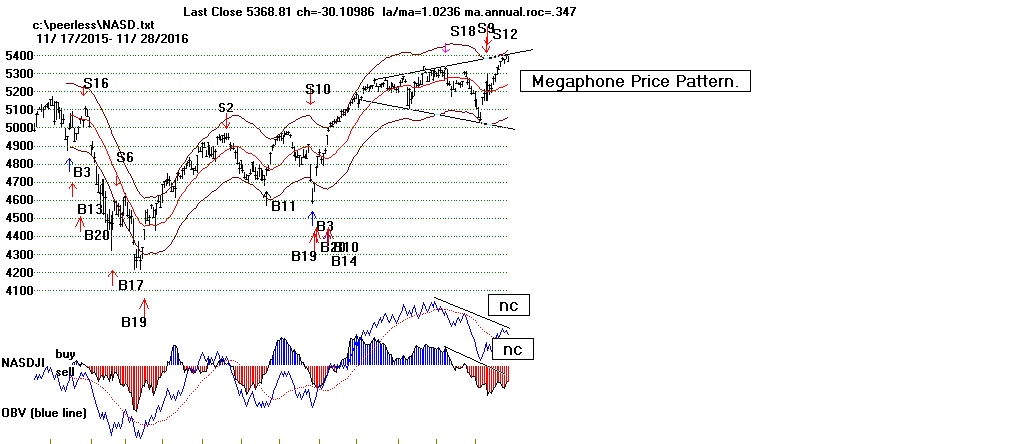

Updates Links to Charts
Peerless
DJIA and A/D Line
DJI-OBVPCT
Hourly DJIA
S&P
OEX
NYSE
NASDAQ
DIA
QQQ SPY
IWM
Short-Term Rates
DJI-Utilities
REITS
A/D Line-6000 Stocks
SOXL TECL
FAS
Crude Oil
11/28/16:
Bullish MAXCPs
Bullish Banks hit with profit-taking.
Bearish MINCPs
(many Bond Funds)
Stocks:
AAPL, BIDU,
IBM, TXN
Bank Stocks - DB (Deutsche
Bank), WFC (Wells Fargo), GS (Goldman Sachs),
AMZN, FB,
GOOG, JPM,
MSFT, NVDA (Super Stock)
TXN
ETFS:
BBH, BRZU,
DIA, DUST,
FAS, GASL,
GLD, IWM,
JETS,
JNUG, KOL, MDY,
NUGT, OIH, OIL,
RETL,
RSX, SLV,
SOXL, TECL,
TMF, TNA,
UGAZ, UPW,
VGK, YINN
Sector Strength: Pct of Stocks over 65-dma
18 have more than 66% above their 65-dma, a drop of only 1.
8 have lower than 33% above their 65-dma, a rise of 2
today..
 RANKING OF KEY DIRECTORIES BASED PCT.OF STOCKS ABOVE 65-DMA
11/28/16
---------------------------------------------------------------------------------------
Directory     Current       day-1         day-2         day-3         day-4         day-5
----------------------------------------------------------------------------------------
BIGBANKS       100%          1             1             1             1             1
COAL           100%          1             1             1             1             1
REGBANKS       100%          1             1             1             1             1
INFRA          .909          .909          .909          .909          .909          .909
TRANSP         .904          .952          .904          .904          .904          .904
GAMING         .888          1             1             .888          .888          .666
EDU            .875          .875          .875          .875          .875          .875
MILITARY       .862          .843          .823          .784          .725          .745
INSURANC       .852          .882          .823          .794          .823          .794
FINANCE        .802          .846          .835          .813          .824          .791
INDMATER       .794          .794          .794          .784          .774          .764
RETAIL         .759          .814          .796          .814          .74           .74
JETS           .75           .833          .833          .833          .833          .833
CHEM           .74           .74           .753          .716          .716          .666
AUTO           .725          .75           .725          .675          .6            .55
NIFTY          .714          .771          .742          .714          .742          .685
ELECTRON       .683          .701          .722          .688          .67           .662
HOMEBLDG       .666          .666          .666          .666          .555          .444
SP-100         .659          .69           .628          .639          .618          .577
GREEN          .645          .612          .612          .58           .516          .451
RUS-1000       .645          .674          .645          .631          .619          .583
DOWJONES       .633          .7            .6            .566          .6            .5
SEMI           .629          .659          .696          .674          .651          .629
INDEXES        .623          .652          .623          .61           .602          .552
NASD-100       .617          .68           .617          .648          .627          .595
SP500          .616          .651          .616          .606          .596          .563
COMPUTER       .592          .592          .555          .592          .629          .555
SOFTWARE       .567          .582          .582          .626          .611          .611
OILGAS         .54           .616          .639          .668          .656          .529
COMODITY       .528          .5            .528          .528          .585          .4
HACKERS        .476          .476          .476          .523          .523          .523
FOOD           .466          .533          .466          .6            .6            .466
UTILITY        .456          .347          .152          .26           .173          .13
REIT           .451          .436          .401          .406          .314          .314
BIOTECH        .412          .496          .473          .426          .479          .489
CHINA          .307          .333          .32           .294          .294          .269
HOSPITAL       .25           .375          .375          .125          .375          .375
SOLAR          .25           .25           .25           .25           .187          .25
BEVERAGE       .238          .19           .19           .19           .19           .19
GOLD           .228          .192          .192          .21           .192          .175
PIPELINE       .222          .444          .555          .555          .555          .555
ETFS           .147          .132          .147          .147          .132          .073
BONDFUND       0             0             0             0             0             0
========================================================
11-25-2016
The Closing Powers continue to keep us long.
Professionals keep buying
each day after the Public sells at the opening. Until this pattern
changes,
continue to hold IWM long despite the
Peerless S9/S12. It is looking
more and more like the S9 and S12 were the result of the unusually fast
advance upwards to the upper band after Trump unexpectedly won.
Both of these Peerless signals have safe-guards against this built into them.
But they failed to deploy here. The 1000-point one day reversal upwards
on the day after the Presidential Election was our best clue, but Peerless
does not directly factor in trading hours before the NYSE opening.
Certainly, as long as the major ETF's Closing Powers's 5-day moving
averages
are rising, I would stay long IWM. DIA,
SPY, MDY and
IWM
are in all-time high territory where it is usually harder for bears to
gain
the upper hand because it is not so obvious where sell orders should be
concentrated.
Price movements for the DJI and Bank/Financial Stocks
have been very closely correlated for years. The strength now in FAS
should
provide give Bulls a lot of confidence now. The weakness in
Gold works
the same way in recerse.
ETF Open.
Clos. 11/25/16
11/28/16 IP21
Power Power
Pivot Point
---------------------------------------------------------------------
DIA
Both Up
191.3 +.71 188.46
+.271 All-time high and bullish flag breakout.
SPY
Both Up 221.52 +.82 218.50
+.184
megaphone pattern
MDY
Both Up 298.69 +.86 292.42
+.248
megaphone pattern
IWM
Both Up 134.07 +.44
130.99 +.272 ITRS = +.049. Running in all-time high territ.
FAS
Both Up 37.18 + .25
35.99
+.422 ITRS = +232. Running in all-time high territ.
QQQ
Up
? 118.8
+.38
117.32
ITRS = -.04. 119-120 barrier is stopping its
rallies.
Trump and Wall Street:
A Growing Romance.

Far from being a danger to the stock market, as the Public was
told by the mainstream media, much of Wall Street loves Trump.
Now as the DJI closes in on 20,000, Trump critics there are being
forced to eat their words and start chasing stocks.
This should not be a surprise. Trump's appointments show he is
no dangerous Wall Street-hating populist. Just the opposite. He
is a billionaire and the majority of his Cabinet appointments are, too,
so far. Shades of Hoover and Coolidge, especially in view of the
the coming big tax cuts and tariffs...
Should we worry about the FED? Not if Trump gets his way regarding
a greatly expanded Public Works/ Infrastructure Program. And even
if rates are raised in December, they will remain very low.
What's more?
Bond holders are selling and being pushed by events to switch to stocks.
Subsidence before December's Bullishness
With the week of Thanksgiving behind, more players will return to the
stock market. Since 1965, there has been a tendency for the market to
subside slightly over the next three trading days. It has risen in this
period
only 53% of the time. But after that, the market usually gets stronger,
rising 1.3% on average over the next month and 65.3% of the time. It
is this bullish end-of-the-year seasonality that prevent us from getting
more Sell S9s and S12s in November.
The only S9/S12 case since 1945 was in November 20, 1980 and in this case
the DJI did not reverse until it closed 4.9% over the 21-day ma with
both
the P-I (breadth) and V-I (Up Vol - Down Vol) negative. Our market is
internally
stronger.
Friday the DJI closed just 3.2% over the 21-dma with both the P-I and V-I
clearly positive, standing respectively at +115 and +.089. Two other
technicals also make this market stronger than back then. The Tiger
Cumulative IPA (Accumulation) is much stronger now than back then
and the Annualized daily rate of change for the DJI's 21-day ma is also
more positive than it was back on 11/20/1980.
2016
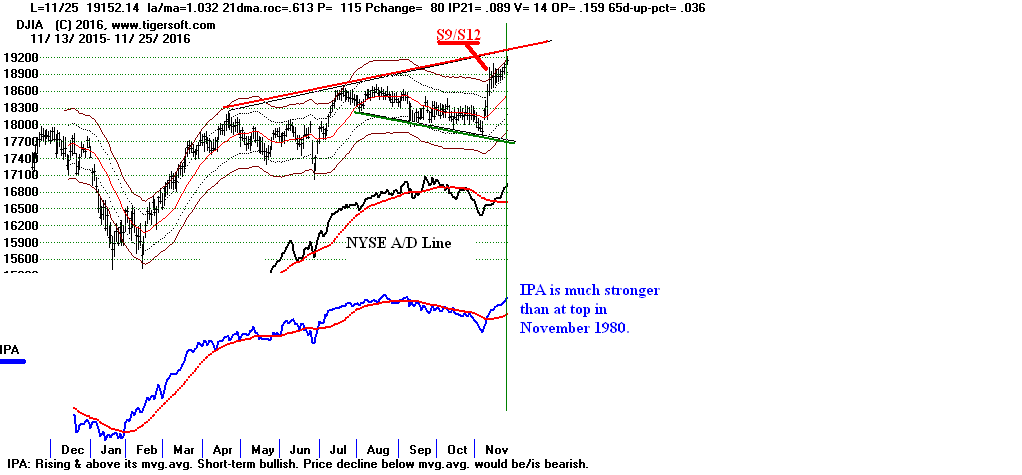
1980
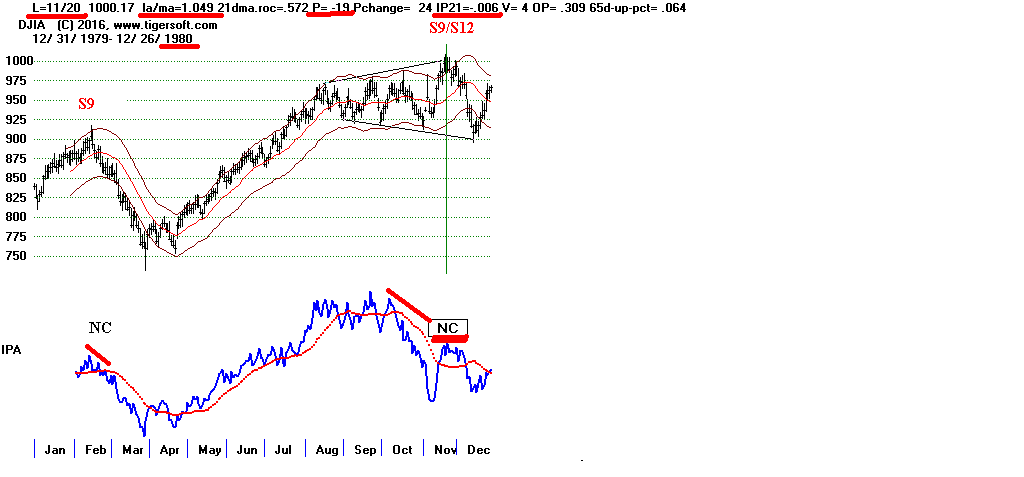
What Would It Take
To Bring A New Peerless Buy Signal?
It will be difficult to get a new Buy signal in here.
The P-Indicator and IP21 (current Accum.) are too
negative given how far the DJI is above the 21-day ma.
An additional one percent gain, in fact, would probably
bring a new Peerless Sell. So, what are we to make
of a 7% jump in the DJI since Election Day? I will
do some studying of advances of that magnitude at this
time of the year and when (and if) they have occurred
without a Peerless Buy. More on this later week.
Updates Links to Charts
Peerless
DJIA and A/D Line
DJI-OBVPCT
Hourly DJIA
S&P
OEX
NYSE
NASDAQ
DIA
QQQ SPY
IWM
Short-Term Rates
DJI-Utilities
REITS
A/D Line-6000 Stocks
SOXL TECL
FAS
Crude Oil
11/25/16:
Bullish
MAXCPs (mostly Regional Banks)
Bearish MINCPs
(mostly Bond Funds)
Stocks:
AAPL, BIDU,
IBM, TXN
Bank Stocks - DB (Deutsche
Bank), WFC (Wells Fargo), GS (Goldman Sachs),
AMZN, FB,
GOOG, JPM,
MSFT, NVDA (Super Stock)
TXN
ETFS:
BBH, BRZU,
DIA, DUST,
FAS, GASL,
GLD, IWM,
JETS,
JNUG, KOL, MDY,
NUGT, OIH, OIL,
RETL,
RSX, SLV,
SOXL, TECL,
TMF, TNA,
UGAZ, UPW,
VGK, YINN
There are now 19 of my Data Directories that show
more than 2/3 of their stocks are above their 65-dma.
That is 3 more than on Wednesday. Only 6 show
more than 2/3 of their stocks below the 65-dma. I reckon
a number above 66% shows good support on the next decline.
 RANKING OF KEY DIRECTORIES BASED PCT.OF STOCKS ABOVE 65-DMA
                           11/25/16
---------------------------------------------------------------------------------------
Directory     Current       day-1         day-2         day-3         day-4         day-5
----------------------------------------------------------------------------------------
BIGBANKS       100%          1             1             1             1             1
COAL           100%          1             1             1             1             .777
GAMING         100%          1             .888          .888          .666          .666
REGBANKS       100%          1             1             1             1             1
TRANSP         .952          .904          .904          .904          .904          .904

INFRA          .909          .909          .909          .909          .909          .909
INSURANC       .882          .823          .794          .823          .794          .705
EDU            .875          .875          .875          .875          .875          .875
FINANCE        .846          .835          .813          .824          .802          .802
MILITARY       .843          .823          .784          .725          .745          .784
JETS           .833          .833          .833          .833          .833          .833

RETAIL         .814          .796          .814          .74           .722          .759
INDMATER       .794          .794          .784          .774          .764          .725
NIFTY          .771          .742          .714          .742          .685          .657
AUTO           .75           .725          .675          .6            .55           .575
CHEM           .731          .743          .707          .707          .646          .634
ELECTRON       .702          .724          .689          .672          .668          .676

DOWJONES       .7            .6            .566          .6            .5            .533
SP-100         .69           .628          .639          .618          .577          .608
NASD-100       .68           .617          .648          .627          .585          .627
RUS-1000       .674          .646          .632          .619          .582          .59

HOMEBLDG       .666          .666          .666          .555          .444          .388
SEMI           .661          .698          .676          .654          .639          .654
INDEXES        .652          .623          .61           .602          .552          .577
SP500          .651          .616          .606          .596          .561          .565
OILGAS         .616          .639          .668          .656          .529          .488
GREEN          .612          .612          .58           .516          .451          .451
COMPUTER       .592          .555          .592          .629          .592          .555
SOFTWARE       .582          .582          .626          .611          .611          .641
FOOD           .533          .466          .6            .6            .466          .333
COMODITY       .5            .528          .528          .585          .4            .371
BIOTECH        .498          .474          .427          .481          .488          .471
HACKERS        .476          .476          .523          .523          .523          .571
PIPELINE       .444          .555          .555          .555          .555          .444
REIT           .438          .403          .408          .316          .316          .285
HOSPITAL       .375          .375          .125          .375          .375          .25
UTILITY        .347          .152          .26           .173          .13           .13

CHINA          .333          .32           .294          .294          .269          .269
SOLAR          .294          .294          .294          .235          .294          .294
GOLD           .192          .192          .21           .192          .175          .14
BEVERAGE       .19           .19           .19           .19           .19           .142
ETFS           .132          .147          .147          .132          .073          .088
BONDFUND       0             0             0             0             0             0
===============================================================
11-23-2016
Have a Happy Thanksgiving.
As long as the major ETF's Closing Powers and 5-day moving
averages
are rising, I would stay long IWM. Of course, it is not clear if IWM will
keep rising if the DJI tops out. But DIA, SPY, MDY and IWM all show
5-day mvg. averages that cannot easily turn down and their Closing Powers
keep going higher. In all-time high territory, it is harder for bears to
gain
the upper hand because it is not so obvious where sell orders should be
concentrated.
ETF Open.
Clos. 11/23/16
11/25/16
Power Power
Pivot Point
---------------------------------------------------------------------
DIA
Both Up
190.59 189.3
All-time high and bullish flag breakout.
SPY
Both Up
220.7 218.99
megaphone pattern
MDY
Both Up
297.3 292.36
megaphone pattern
IWM
Both Up
133.63 130.30
ITRS = +.052. Running in all-time high territ.
QQQ
Up
?
118.42
117.46
ITRS = -.034. 119-120 barrier is stopping its
rallies.
Notes:
Pivot point is level below which prices must drop for 5-day ma to
turn down.
Tiger ITRS (Intermediate Relative Strength) measures ETF's pct change for last
50 days less DJI's.
A positive Opening Power suggests net Public Buying.
A positive Closing Power suggests net Professional Buying.
Both Up shows both Opening Power and Closing Power are rising. Prices
normally
rise easily when this condition prevails. It usually ends abruptly when
Professionals
switch and become net sellers.
1920s - Will President Trump Bring on A Remake of 1920s?

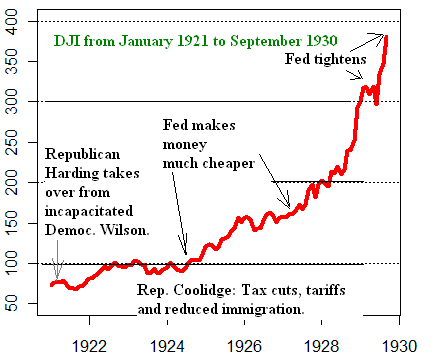
We went to Barona Casino to feast Pilgrim style with American Indians.
All the hostesses were dressed in the style of 1920's flappers. Trump's
influence is already apparent. The 1920's were very good years for the
stock
market... at least until September 1929. The new President's
prospective
economic and immigration policies certainly look like Harding's and Coolidge's.
But won't we need lots of new technologies to match the role played by autos,
airplanes, radios, phonographs, movies and electrical appliances in bringing
about
a 1920s'-like economic and stock market boom now?
Updates Links to Charts
Peerless
DJIA and A/D Line
DJI-OBVPCT
Hourly DJIA
S&P
OEX
NYSE
NASDAQ
DIA
QQQ SPY
IWM
Short-Term Rates
DJI-Utilities
REITS
A/D Line-6000 Stocks
SOXL TECL
FAS
Crude Oil
11/23/16:
Bullish
MAXCPs (mostly Regional Banks)
Bearish MINCPs
(mostly Bond Funds and some other groups now)
Stocks:
AAPL, BIDU,
IBM, TXN
Bank Stocks - DB (Deutsche
Bank), WFC (Wells Fargo), GS (Goldman Sachs),
AMZN, FB,
GOOG, JPM,
MSFT, NVDA (Super Stock)
TXN
ETFS:
BBH, BRZU,
DIA, DUST,
FAS, GASL,
GLD, IWM,
JETS,
JNUG, KOL, MDY,
NUGT, OIH, OIL,
RETL,
RSX, SLV,
SOXL, TECL,
TMF, TNA,
UGAZ, UPW,
VGK, YINN
                  RANKING OF KEY DIRECTORIES BASED PCT.OF STOCKS ABOVE 65-DMA
                                            11/23/16
---------------------------------------------------------------------------------------
Directory     Current       day-1         day-2         day-3         day-4         day-5
----------------------------------------------------------------------------------------
BIGBANKS       100%          1             1             1             1             1
COAL           100%          1             1             1             .777          1
GAMING         100%          .888          .888          .666          .666          .666
REGBANKS       100%          1             1             1             1             1
INFRA          .909          .909          .909          .909          .909          .909
TRANSP         .904          .904          .904          .904          .904          .904
EDU            .875          .875          .875          .875          .875          .875
FINANCE        .835          .813          .824          .802          .791          .791
JETS           .833          .833          .833          .833          .833          .833
INSURANC       .823          .794          .823          .794          .705          .705
MILITARY       .823          .784          .725          .745          .784          .764
RETAIL         .796          .814          .74           .722          .759          .703
INDMATER       .794          .784          .774          .764          .725          .725
CHEM           .743          .707          .707          .646          .634          .573
NIFTY          .742          .714          .742          .685          .657          .6
AUTO           .725          .675          .6            .55           .575          .55
ELECTRON       .725          .69           .673          .669          .673          .678
SEMI           .698          .676          .654          .639          .647          .632
HOMEBLDG       .666          .666          .555          .444          .388          .277

RUS-1000       .646          .632          .619          .582          .588          .558
OILGAS         .639          .668          .656          .529          .488          .511
SP-100         .628          .639          .618          .577          .608          .597
INDEXES        .623          .61           .602          .552          .577          .564
NASD-100       .617          .648          .627          .585          .627          .627
SP500          .616          .606          .596          .561          .563          .547
GREEN          .612          .58           .516          .451          .451          .419
DOWJONES       .6            .566          .6            .5            .533          .566
SOFTWARE       .582          .626          .611          .611          .626          .507
COMPUTER       .555          .592          .629          .592          .555          .592
PIPELINE       .555          .555          .555          .555          .444          .333
COMODITY       .528          .528          .585          .4            .371          .371

HACKERS        .476          .523          .523          .523          .523          .571
BIOTECH        .474          .427          .481          .488          .468          .447
FOOD           .466          .6            .6            .466          .333          .333
REIT           .404          .409          .318          .318          .287          .297
HOSPITAL       .375          .125          .375          .375          .25           0

CHINA          .311          .285          .285          .259          .259          .272
SOLAR          .294          .294          .235          .294          .294          .294
GOLD           .192          .21           .192          .175          .14           .157
BEVERAGE       .19           .19           .19           .19           .142          .142
UTILITY        .152          .26           .173          .13           .13           .13
ETFS           .147          .147          .132          .073          .088          .058
BONDFUND       0             0             0             0             0             0
==================================================================
11-22-2016
As long as the major ETF's Closing Powers and 5-day moving
averages
are rising, I would stay long IWM. It has done well in making a run
into all-time high territory. Small caps usually get a play late in a bull
market and this is probably it. December's bullish seasonality will
also help. It has even out-performed the DJI by 5% over the last
ten weeks. See also below how strong the Cumulative TigerSoft
IPA is.
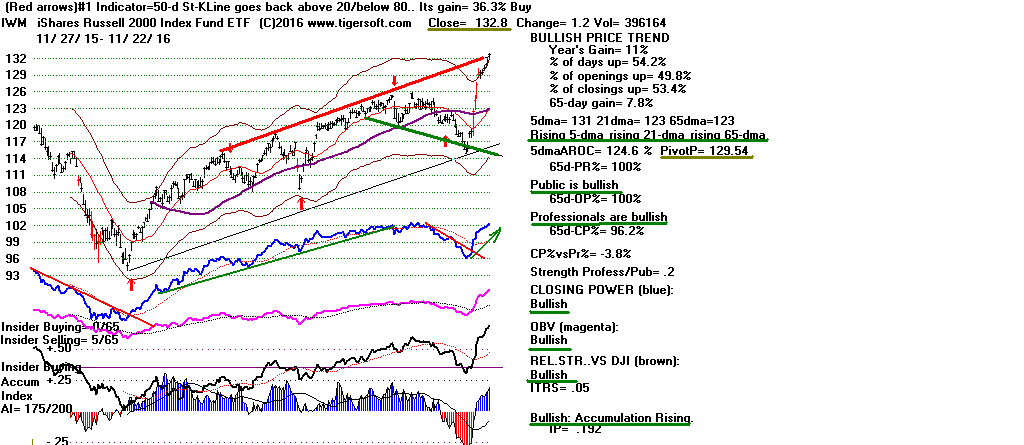

But what to make of the Sell S9/S12? The Sell
S12 is based on negative
Accumulation as the DJI reaches more than 2.2% over the 21-day ma.
The extraordinarily quick advance in the DJI caused this signal. Now the
Accumulation Index has turned positive. This reduces much of the Sell
S12's
negativity.
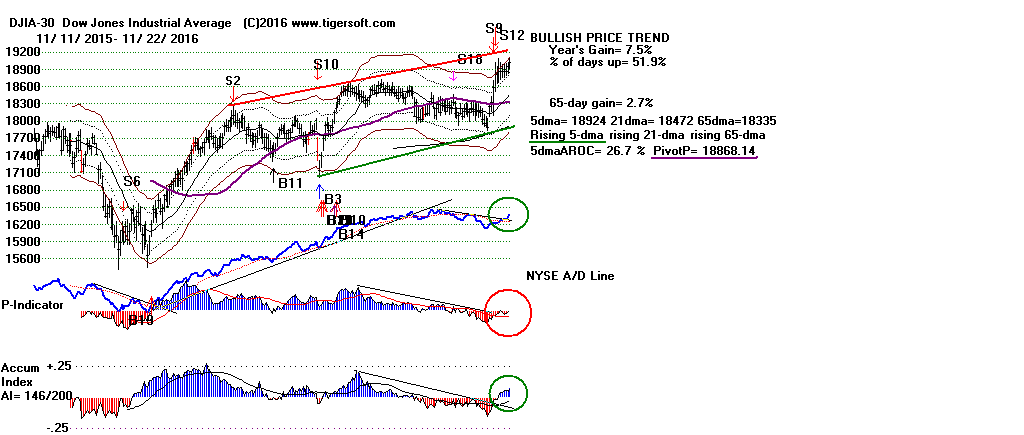

The Sell S9, on the other hand, shows the market's real problem. The
market
as a whole is not rising because new money is coming into it. Rather, it
is mostly
rising because money from the bonds being sold is now going into the leading
blue chips,
big banks, financials and regional banks and to a lesser extent into all the
groups that would presumably benefit from the new Trump Presidency.
Trump's victory WAS a surprise. This is very important. Washington
will now
create a whole new army of corporate winners to replace many of those
the Obama-Clinton Democrats favored. It takes time for stock prices to
reflect
this new reality. And it also takes time for shorts to cover their various
hedging positions.
Look for the SP-500 to reach its red resistance line.
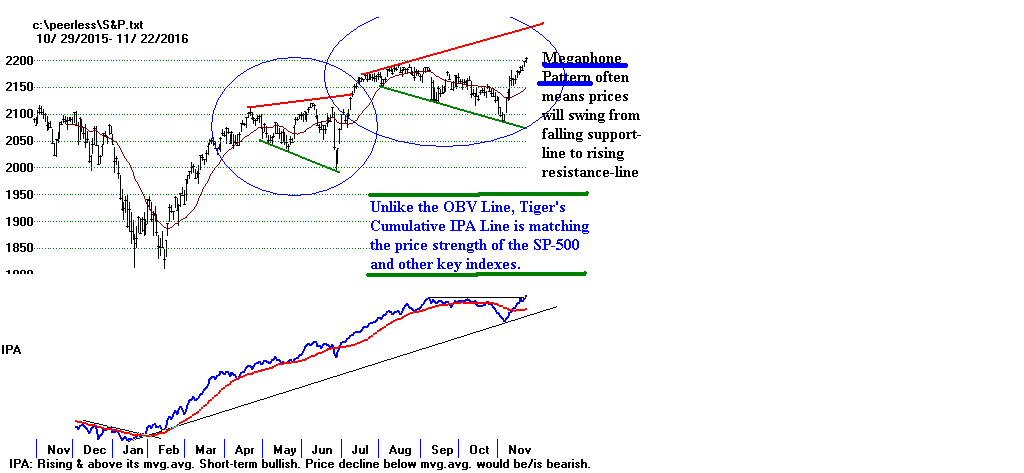
Because the rally is not so much based on new money coming into the market,
trading volume has not been great. As a result, all the key indexes and
ETFs show
lagging OBV Lines. And because of all the selling in fixed income stocks
and bond funds
on the NYSE (which is explained by the likelihood of a Fed rate increase and
lots of new borrowing under a Trump Presidency), the A/D Line and the
P-Indicator
have lagged and are still lagging. It is this which has caused our
Peerless S9.
But the re-deployment of money raised from selling bonds continues,
as does the Partisan excitement that we finally again have a Republican
President. A big tax cut for corporations and the wealthy is a near
certainty.
This is very bullish for stocks. I think this is what is boosting
the markets now.
The Sell S9 does not know this. I believe this re-deployment and partisan
buying may well continue to year's end or even a little longer, possibly
climaxing when Trump is inaugurated.
In this environment, I think we will be well served by simply watching our
TigerSoft Closing Power, the 5-day moving averages and one other indicator,
Tiger's IPA. See it in the SP-500 chart above and elsewhere for the
NASDAQ,
OEX, NYSE
and DJIA. The Cumulative IPA
Line is rising for all the Indexes.
It is not lagging. This indicator shows whether the closes are nearer the
highs or
lows each day and factors in trading volume. I have looked tonight
at all the IPA-DJIA
charts since 1965. Big declines rarely take place until the IPA
uptrend-line is broken.
In all those fifty years, I only find two exceptions to this rule. In 1977
when there was
very high inflation and in 1990 when Iraq attacked Kuwait DJI tops did occur
which the IPA was slow to catch by virtue of a break in its uptrend-line.
Trust The Professionals. They Remain New Buyers.
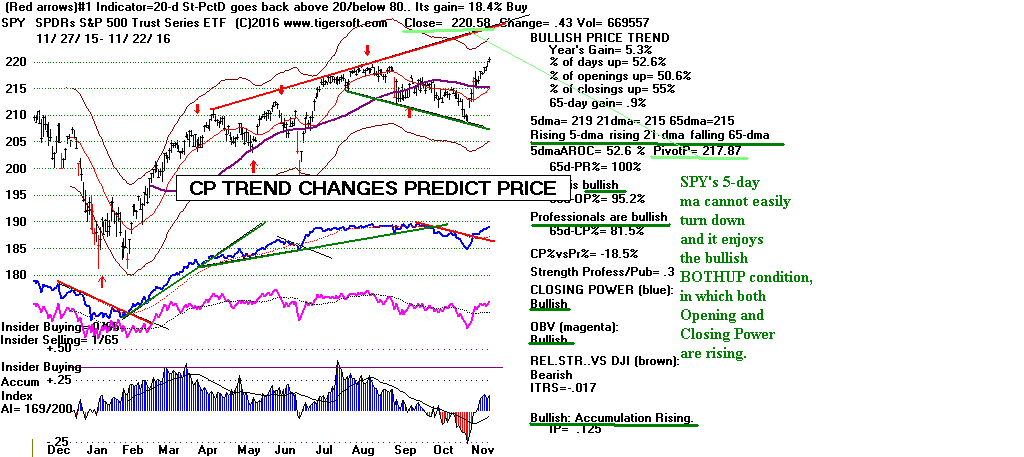
So, my conclusion is, despite the Sell S9-S12, to hold IWM and see if IWM won't
rise still further. As long as Professionals remain bullish and the Accumulation
Indicators are are up-trending, as are the 5-day moving averages, why sell?
It may be that the Thanksgiving-seasonal buying is now over. So, don't be
surprised if there is a shallow pull-back now. But as long as the major
ETF's
Closing Powers are rising and above their 21-day mvg. averages and as
as long as their 5-day moving averages are rising, I would stay long IWM.
It has outperformed the DJI and is now making a run into all-time high
territory,
where sell orders cannot easily be bunched.
Links to Charts
Peerless
DJIA and A/D Line
DJI-OBVPCT
Hourly DJIA
S&P
OEX
NYSE
NASDAQ
DIA
QQQ SPY
IWM
Short-Term Rates
DJI-Utilities
REITS
A/D Line-6000 Stocks
SOXL TECL
FAS
Crude Oil
11/22/16:
Bullish
MAXCPs (mostly Regional Banks)
Bearish MINCPs
(mostly Bond Funds and some other groups now)
Stocks:
AAPL, BIDU,
IBM, TXN
Bank Stocks - DB (Deutsche
Bank), WFC (Wells Fargo), GS (Goldman Sachs),
AMZN, FB,
GOOG, JPM,
MSFT, NVDA (Super Stock)
TXN
ETFS:
BBH, BRZU,
DIA, DUST,
FAS, GASL,
GLD, IWM,
JETS,
JNUG, KOL, MDY,
NUGT, OIH, OIL,
RETL,
RSX, SLV,
SOXL, TECL,
TMF, TNA,
UGAZ, UPW,
VGK, YINN
     RANKING OF KEY DIRECTORIES BASED PCT.OF STOCKS ABOVE 65-DMA
                                  11/22/16
---------------------------------------------------------------------------------------
Directory     Current       11-21         11-18         11-17         11-16         11-15
----------------------------------------------------------------------------------------
BIGBANKS       100%          1             1             1             1             1
COAL           100%          1             1             .777          1             1
REGBANKS       100%          1             1             1             1             1
INFRA          .909          .909          .909          .909          .909          .909
TRANSP         .904          .904          .904          .904          .904          .857
GAMING         .888          .888          .666          .666          .666          .666
EDU            .875          .875          .875          .875          .875          .875
JETS           .833          .833          .833          .833          .833          .75
RETAIL         .814          .74           .722          .759          .703          .629
FINANCE        .813          .824          .802          .791          .802          .835
INSURANC       .794          .823          .794          .705          .705          .705
INDMATER       .784          .774          .764          .725          .725          .735
MILITARY       .784          .725          .745          .784          .764          .764
NIFTY          .714          .742          .685          .657          .6            .628
CHEM           .707          .707          .646          .634          .573          .621
ELECTRON       .692          .675          .67           .675          .683          .666
SEMI           .676          .654          .639          .647          .632          .617
AUTO           .675          .6            .55           .575          .55           .5
OILGAS         .668          .656          .529          .488          .511          .54
HOMEBLDG       .666          .555          .444          .388          .277          .333

NASD-100       .648          .627          .585          .627          .627          .585
SP-100         .639          .618          .577          .608          .597          .618
RUS-1000       .632          .619          .582          .588          .558          .569
SOFTWARE       .626          .611          .611          .626          .507          .492
INDEXES        .61           .602          .552          .577          .564          .564
SP500          .606          .596          .561          .563          .543          .559
FOOD           .6            .6            .466          .333          .333          .333
COMPUTER       .592          .629          .592          .555          .592          .592
GREEN          .58           .516          .451          .451          .419          .451
DOWJONES       .566          .6            .5            .533          .566          .6
PIPELINE       .555          .555          .555          .444          .333          .444
COMODITY       .528          .585          .4            .371          .371          .357
HACKERS        .523          .523          .523          .523          .571          .523
BIOTECH        .426          .479          .486          .466          .449          .496
REIT           .409          .318          .318          .287          .292          .277

CHINA          .303          .303          .278          .278          .291          .278
SOLAR          .294          .235          .294          .294          .294          .294
UTILITY        .26           .173          .13           .13           .13           .173
GOLD           .21           .192          .175          .14           .157          .175
BEVERAGE       .19           .19           .19           .142          .142          .19
ETFS           .147          .132          .073          .088          .073          .102
HOSPITAL       .125          .375          .375          .25           0             .25
BONDFUND       0             0             0             0             0             0
=================================================================
11-21-2016 Bullish is Pre-Thanksgiving
Seasonality
Bullish, too, is Wall Street's Celebration
of Trump's Expected Tax Cuts and Fiscal Expansionism.
Will This Allow Breakouts by DJI, SP-500,
NASDAQ and IWM?
The only November Peerless S9 in November since World
War II stopped the DJI
when the DJI had closed 4.2% over the 21-day ma. What's more? It only
stopped the
DJI, in part, because its Accumulation Index (IP21) was negative. Our DJI
now is
only 2.8% over the 21-dma and its Accumulation Index is now quite positive.
So, will the Sell S9/S12 stop the current rally?
Certainly, the OBV Lines for the Hourly
DJI,
SP-500, NYSE,
OEX and NASDAQ are badly lagging prices. But Professionals are
still pushing up prices. See how the charts of
DIA, SPY,
MDY, IWM
and FAS all
show both rising Opening and Closing Powers. Professionals, apparently
believe that
they can get the partisan exuberance we see now to become even more intense.
And,
in fact, with all-time highs being reached, technical cases can be made in favor
of another
steep DJI spike up and for IWM to burst above the megaphone pattern of the
resistance line
it has now reached.
As long as the Closing Powers are rising and the major ETFs show rising 5-day
mvg.
averages, I would give the DJI and IWM more chance to achieve breakouts above
the resistance
lines shown below. QQQ and the
NASDAQ are more questionable.
For now, stay long IWM and do not yet go short DIA despite the earlier Peerless
Sell S9/S12.
It does appear from the weakness of the NYSE A/D
Line and P-Indicator that a failure by the DJI
to breakout above its well-tested resistance line by mid next week will probably
lead to a decline
once the bullishness of the Thanksgiving week is past.
Only DIA's Pivot Point is near its close today. The leaders, IWM and FAS
are
not likely to have their 5-day ma turn down.
Close 5-day ma IP21
Pivot Point
DIA Both Up . 189.34 189.34
.21 (quite positive)
SPY Both Up 220.15 218.28
.106
MDY Both Up 294.43 290.42
.114
IWM Both Up 131,.6 129.5
,153
FAS Both Up 36.28 35.66
.337 (very high Accumulation) Financial are leaders.
SOXL Both Up 54.87 49.66
.076
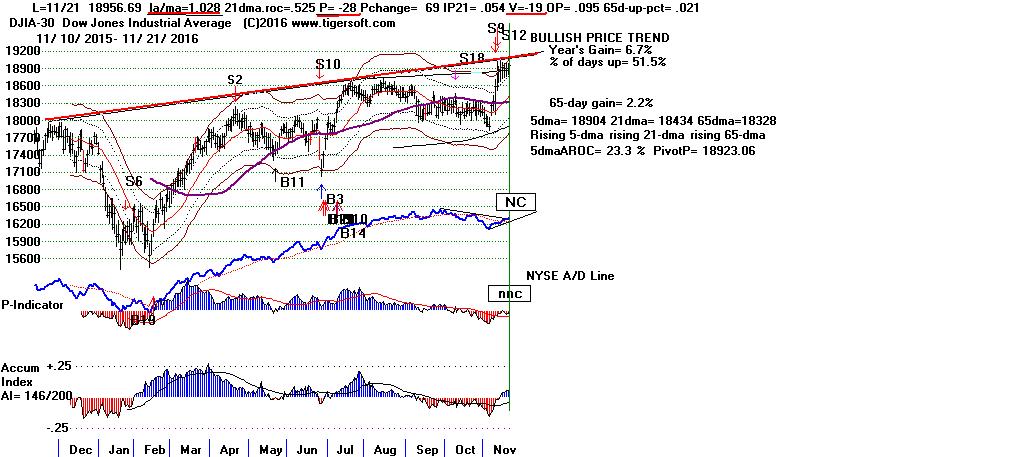
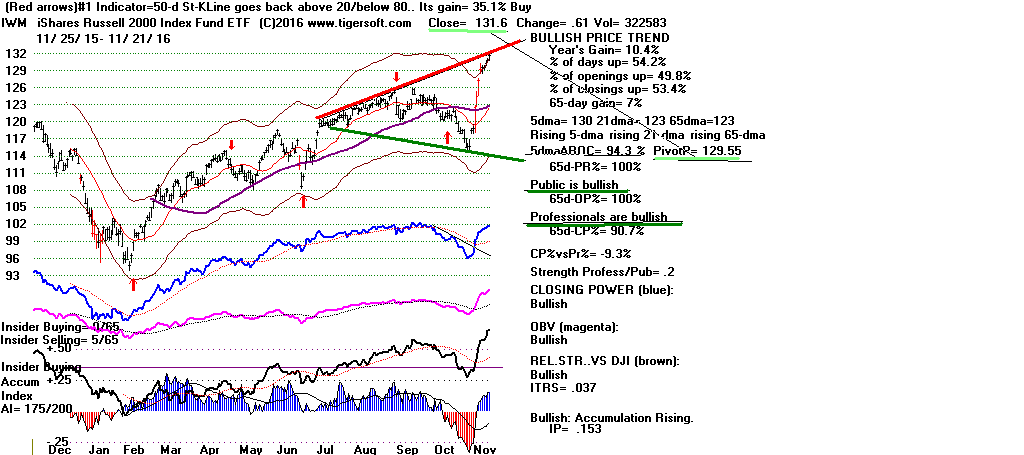
.
Links to Charts
Peerless
DJIA and A/D Line
DJI-OBVPCT
Hourly DJIA
S&P
OEX
NYSE
NASDAQ
DIA
QQQ SPY
IWM
Short-Term Rates
DJI-Utilities
REITS
A/D Line-6000 Stocks
SOXL TECL
FAS
Crude Oil
11/21/16:
Bullish
MAXCPs (mostly Regional Banks)
Bearish MINCPs
(mostly Bond Funds)
Stocks:
AAPL, BIDU,
IBM, TXN
Bank Stocks - DB (Deutsche
Bank), WFC (Wells Fargo), GS (Goldman Sachs),
AMZN, FB,
GOOG, JPM,
MSFT, NVDA (Super Stock)
TXN
ETFS:
BBH, BRZU,
DIA, DUST,
FAS, GASL,
GLD, IWM,
JETS,
JNUG, KOL, MDY,
NUGT, OIH, OIL,
RETL,
RSX, SLV,
SOXL, TECL,
TMF, TNA,
UGAZ, UPW,
VGK, YINN
 RANKING OF KEY DIRECTORIES BASED PCT.OF STOCKS ABOVE 65-DMA
                                  11/21/16
---------------------------------------------------------------------------------------
Directory     Current       11-18         11-17         11-16         11-15         11-14
----------------------------------------------------------------------------------------
BIGBANKS       100%          1             1             1             1             1
COAL           100%          1             .777          1             1             1
REGBANKS       100%          1             1             1             1             .972
INFRA          .909          .909          .909          .909          .909          .909
TRANSP         .904          .904          .904          .904          .857          .952
GAMING         .888          .666          .666          .666          .666          .555
EDU            .875          .875          .875          .875          .875          1
JETS           .833          .833          .833          .833          .75           .833
FINANCE        .824          .802          .791          .802          .835          .824
INSURANC       .823          .794          .705          .705          .705          .735
INDMATER       .782          .772          .732          .732          .742          .752
NIFTY          .742          .685          .657          .6            .628          .571
RETAIL         .74           .722          .759          .703          .611          .666
MILITARY       .711          .73           .769          .75           .75           .73
CHEM           .707          .646          .634          .573          .621          .634
ELECTRON       .675          .67           .675          .683          .662          .623

OILGAS         .656          .529          .488          .511          .54           .412
SEMI           .654          .639          .647          .632          .61           .566
COMPUTER       .629          .592          .555          .592          .592          .518
NASD-100       .627          .585          .627          .627          .574          .553
RUS-1000       .619          .582          .588          .558          .566          .539
SP-100         .618          .577          .608          .597          .618          .587
SOFTWARE       .611          .611          .626          .507          .492          .492
AUTO           .6            .55           .575          .55           .5            .45
DOWJONES       .6            .5            .533          .566          .6            .533
FOOD           .6            .466          .333          .333          .333          .266
SP500          .596          .561          .563          .543          .557          .531
INDEXES        .592          .55           .575          .563          .563          .512
COMODITY       .585          .4            .371          .371          .357          .3
HOMEBLDG       .555          .444          .388          .277          .333          .388
PIPELINE       .555          .555          .444          .333          .444          .333
HACKERS        .523          .523          .523          .571          .571          .571
GREEN          .516          .451          .451          .419          .451          .387
BIOTECH        .479          .486          .466          .449          .493          .493
HOSPITAL       .375          .375          .25           0             .25           0

REIT           .318          .318          .287          .292          .267          .303
CHINA          .303          .278          .278          .291          .278          .253
SOLAR          .235          .294          .294          .294          .235          .176
GOLD           .192          .175          .14           .157          .175          .14
BEVERAGE       .19           .19           .142          .142          .19           .142
UTILITY        .173          .13           .13           .13           .152          .152
ETFS           .132          .073          .088          .073          .102          .058
BONDFUND       0             0             0             0             0             0
===================================================================
11-18-2016 Clinched Sell S9/S12 Fights with
Bullish Pre-Thanksgiving Seasonality.
Let's hold off in shorting DIA and stay long IWM a little longer.
Both the Opening and Closing Power are still rising for IWM. So is its
5-day ma.
However, if its should close tomorrow below its 5-day ma pivot point, it should
probably
be sold. It would take a drop by it of more than 1.85 tomorrow to
turn down its 5-day ma.
Until that happens, lets see if IWM can breakout above its rising red resistance
line.
This is a bullish time of year. A number of Bullish MAXCPs have made
such breakouts and there are 10 more MAXCPs then MINCPs.
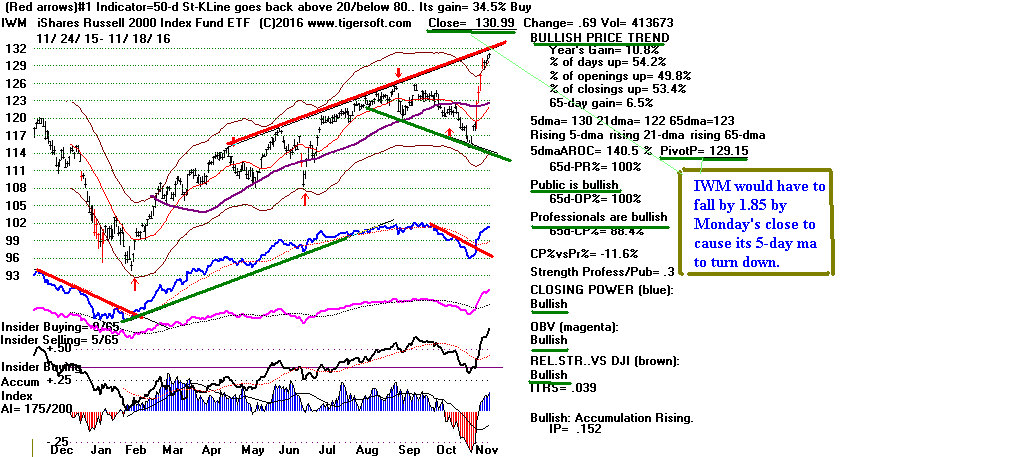
There is certainly precedent for smaller caps or
NASDAQ stocks topping
out after the DJI. This was what 1967-1968 was all about. And we
know
that the NASDAQ kept making highs for two months after the DJI had
hit its peak in January 2000. Trump's unexpected ascendancy has unleashed
a whole legion of presumed new winners in the stock market. They are
still getting a play, especially as disappointed Bond holders redeploy
their funds. Finally, it is rather normal for a long bull market NOT to
end
until the smaller stocks get a really good play.
DJI-NASDAQ 1999-2000
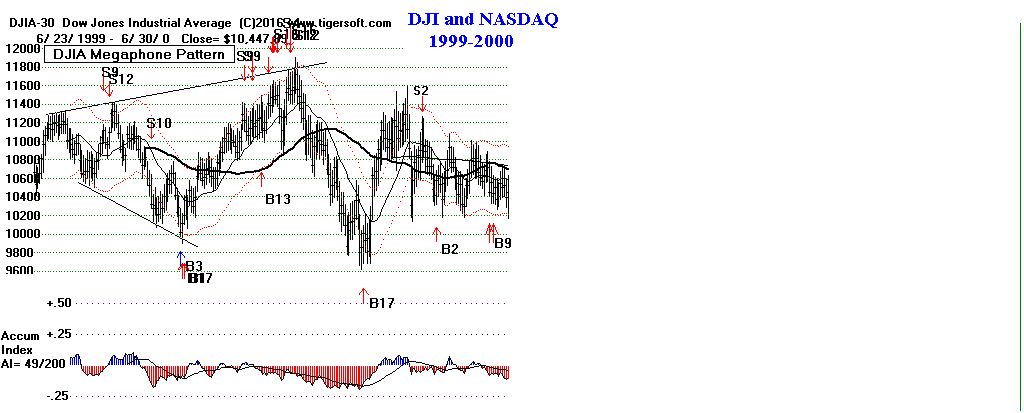
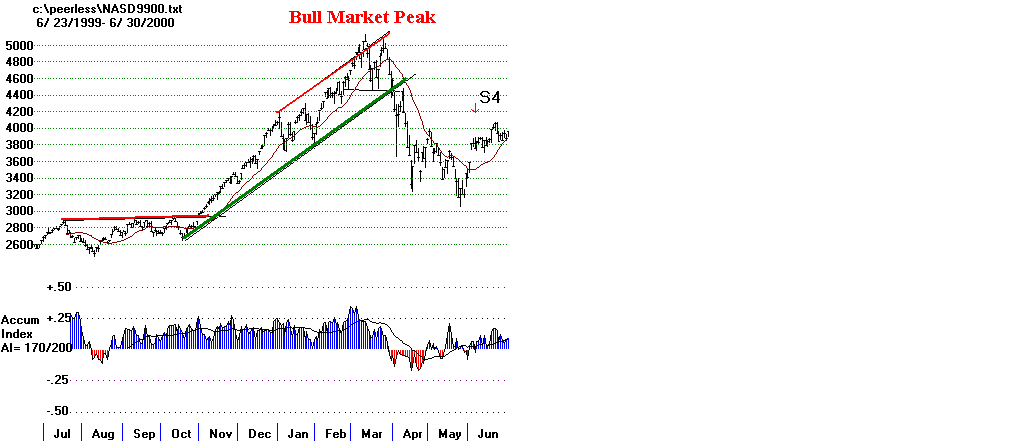
The Peerless S9/S12 has stopped the DJI's post-Election
DJI advance,
but does it have the power to drop the DJI to the lower band? Especially,
in the normally bullish weak right before Thanksgiving (this Thursday).
We can talk about Trump fiscal expansionism and lower corporate taxes,
but there is no getting away from the fact that the DJI's internals look weak
given how over-extended the DJI is. The DJI now stands 2.6% over the
21-day ma but two of its four key internal strength are negative and the
current Accumulation and OPct are only slightly positive. In addition, DIA
will need to rise by .32 to prevent its 5-day ma from falling. The turning
down of DIA's 5-day ma would be one more sign of impending weakness here.
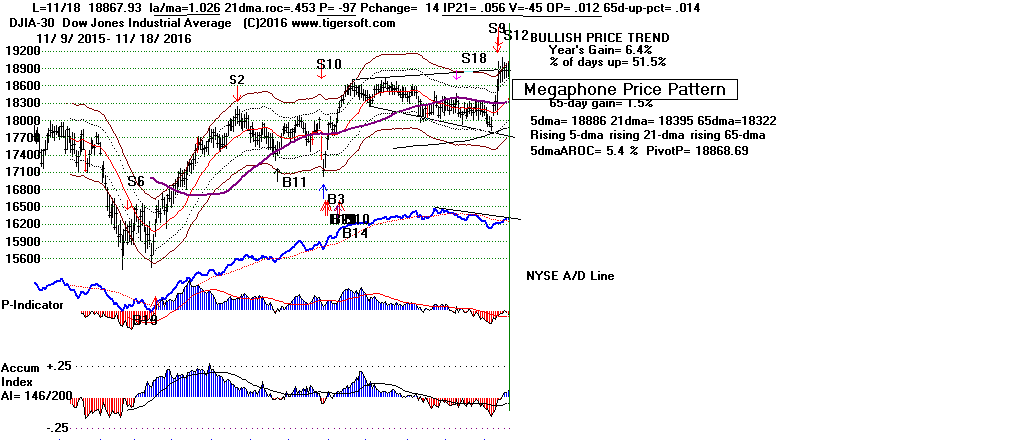

Look at DIA's exploded chart. Its Closing
Power has slightly broken its
steep uptrend. A retreat by CP back to its rising 21-day ma would seem
likely. Its Opening Power is still safely rising for now.
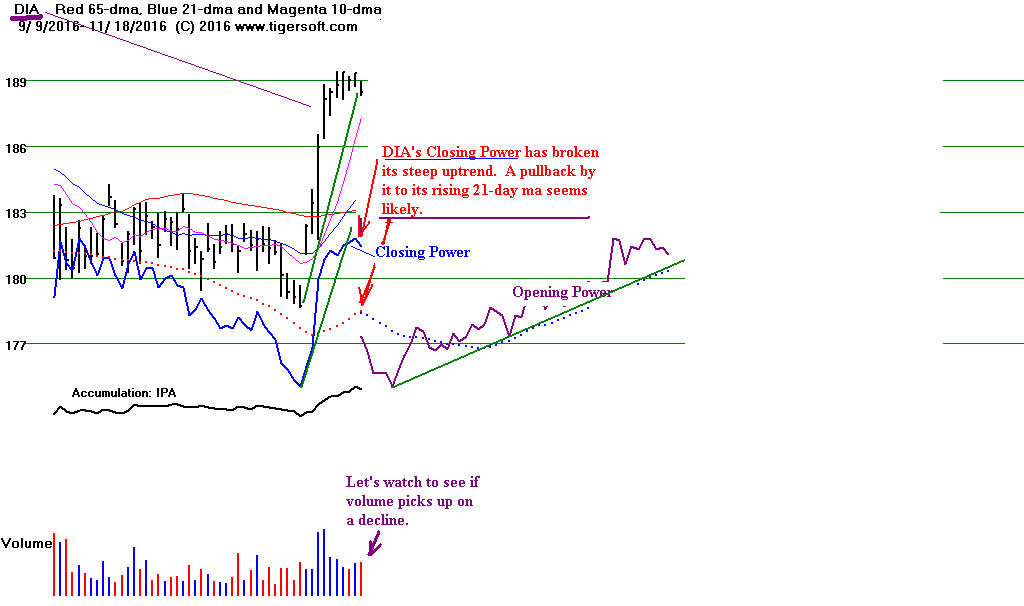
Seasonality is certainly bullish now. Tiger lets us easily see these
numbers
for the period 1965-2014. The DJI typically rallies 65.3% of the time over
the
next five trading days and rises 1.4% on average ten trading days after
November 20th. The numbers are equally bullish in Presidential Election
years.
But there are exceptions.
The DJI topped out about this time in 1980 two weeks after the Republican
won
the Presidency from the Democrat Carter. Republican partisans were too
quick
to chase the market and Professionals were happy to take their money.
This seems eerily similar to now. See how back then, the DJI was also
trapped
in a megaphone (broadening top pattern) pattern. With the help of Peerless
signals, the DJI formed a quick H/S top and fell to the lower band, only to
rally
back to new highs in late December. Of course, such historical parallels
are
far from perfect. See how far up from the 21-day ma was on 11/20/1980.
It was
almost 5% above the 21-day ma. The farthest up the DJI has been on this
run
is only 3.6%.
Will the DJI Top out,
just like in November 1980?
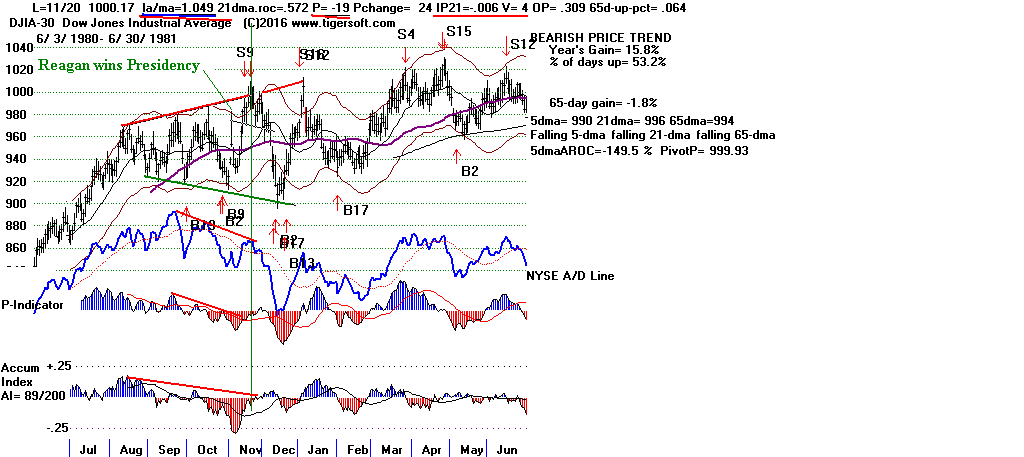
Links to Charts
Peerless
DJIA and A/D Line
DJI-OBVPCT
Hourly DJIA
S&P
OEX
NYSE
NASDAQ
DIA
QQQ SPY
IWM
Short-Term Rates
DJI-Utilities
REITS
A/D Line-6000 Stocks
SOXL TECL
FAS
Crude Oil
11/18/16:
Bullish
MAXCPs (mostly Regional Banks)
Bearish
MINCPs
(mostly Bond Funds)
Stocks:
AAPL, BIDU,
IBM, TXN
Bank Stocks - DB (Deutsche
Bank), WFC (Wells Fargo), GS (Goldman Sachs),
AMZN, FB,
GOOG, JPM,
MSFT, NVDA (Super Stock)
TXN
ETFS:
BBH, BRZU,
DIA, DUST,
FAS, GASL,
GLD, IWM,
JETS,
JNUG, KOL, MDY,
NUGT, OIH, OIL,
RETL,
RSX, SLV,
SOXL, TECL,
TMF, TNA,
UGAZ, UPW,
VGK, YINN
RANKING OF KEY DIRECTORIES
BASED ON PCT.OF STOCKS ABOVE 65-DMA
                  RANKING OF KEY DIRECTORIES
               BASED PCT.OF STOCKS ABOVE 65-DMA
                                       11/18/16
---------------------------------------------------------------------------------------
Directory     Current       11-17         11-16         11-15        11-14         11-1
----------------------------------------------------------------------------------------
BIGBANKS       100%          1             1             1             1             1
COAL           100%          .777          1             1             1             .888
REGBANKS       100%          1             1             1             .972          .972
INFRA          .909          .909          .909          .909          .909          .909
TRANSP         .904          .904          .904          .857          .952          .809
EDU            .875          .875          .875          .875          1             .875
JETS           .833          .833          .833          .75           .833          .666
FINANCE        .802          .791          .802          .835          .824          .813
INSURANC       .794          .705          .705          .705          .735          .764
INDMATER       .772          .732          .732          .742          .752          .683
MILITARY       .73           .769          .75           .75           .73           .75
RETAIL         .722          .759          .703          .611          .666          .629
NIFTY          .685          .657          .6            .628          .571          .485
ELECTRON       .67           .675          .683          .662          .623          .611
GAMING         .666          .666          .666          .666          .555          .666

CHEM           .646          .634          .573          .621          .634          .585
SEMI           .639          .647          .632          .61           .566          .551
SOFTWARE       .611          .626          .507          .492          .507          .582
COMPUTER       .592          .555          .592          .592          .555          .555
NASD-100       .585          .627          .627          .574          .553          .521
RUS-1000       .582          .588          .558          .566          .539          .508
SP-100         .577          .608          .597          .618          .587          .597
SP500          .561          .563          .543          .557          .531          .505
PIPELINE       .555          .444          .333          .444          .333          .222
AUTO           .55           .575          .55           .5            .45           .475
INDEXES        .55           .575          .563          .563          .521          .516
OILGAS         .529          .488          .511          .54           .424          .36
HACKERS        .523          .523          .571          .571          .619          .523
DOWJONES       .5            .533          .566          .6            .533          .633

BIOTECH        .486          .466          .449          .493          .489          .469
FOOD           .466          .333          .333          .333          .266          .133
GREEN          .451          .451          .419          .451          .387          .354
HOMEBLDG       .444          .388          .277          .333          .388          .222
COMODITY       .4            .371          .371          .357          .3            .3
HOSPITAL       .375          .25           0             .25           0             0

REIT           .318          .287          .292          .267          .303          .222
SOLAR          .294          .294          .294          .235          .176          .176
CHINA          .278          .278          .291          .278          .253          .253
BEVERAGE       .19           .142          .142          .19           .142          .142
GOLD           .175          .14           .157          .175          .14           .157
UTILITY        .13           .13           .13           .152          .152          .152
ETFS           .073          .088          .073          .102          .058          .058
BONDFUND       0             0             0             0             0             0
============================================================
11/17/2016
Clinched Sell S9/S12 Still Stands.
NASDAQ and IWM are on verge of breaking Out.
All key ETFs Closing Powers and 5-day mvg.
Averages are still rising. Can Trump deliver
Growth without Inflation? That's what Dollar's
Strength and Booming Russell-2000 seem to
show that Professionals now believe. Are we headed
for repeats of the very bullish stock market years:
1983-1985 and 1996-2000? Will Congressional
Republicans allow the new President to do big
Infrastructure and Public Works spending? `
Wait to short DIA. Hold IWM long. Trust the Professionals.
DJIA
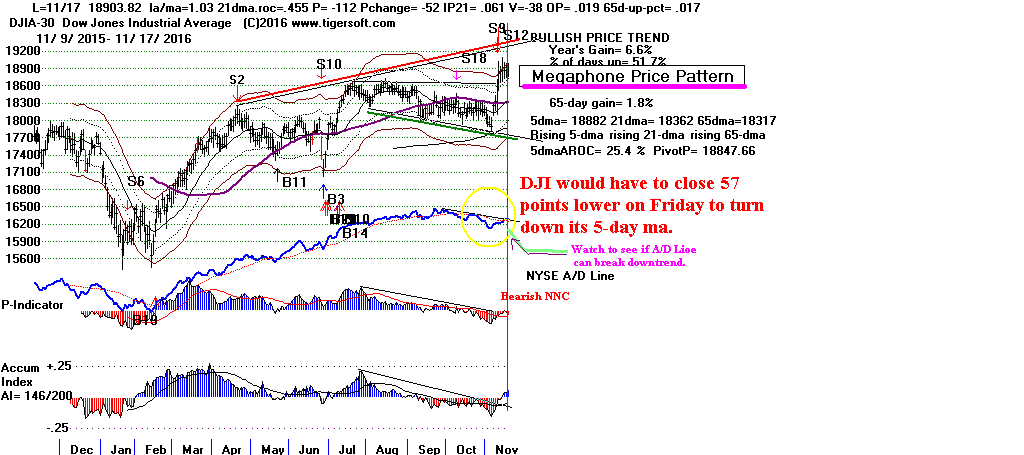
DIA's Internals are all rising.
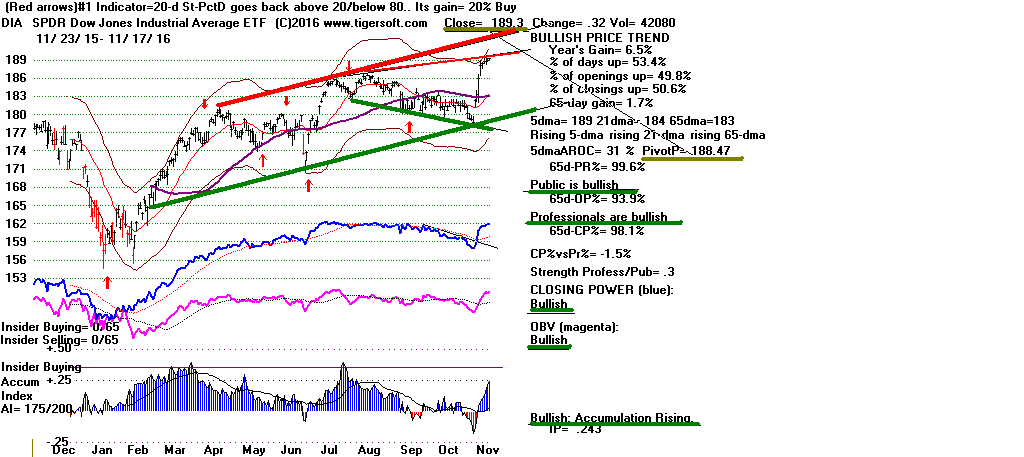
Right now it looks like the NASDAQ looks like it will
follow
Semi-Conductors, which often lead prices,
and breakout to new highs where
the path of least resistance is up. The megaphone patterns
in the SP-500, OEX,
NYSE and
NASDAQ all would seem to be
setups for another advance. Again, I am reminded of the
DJI's extended megaphone top in 1980-1981, which seems
the closest parallel politically. And we know from the year
2000, that the NASDAQ can keep climbing for 3 months
even as the DJI falls because of its Sell S9.
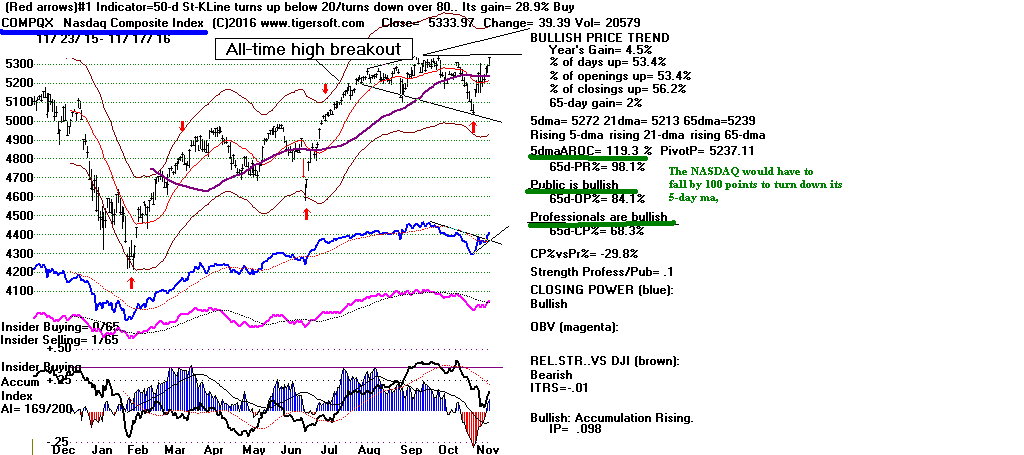
The volume measures all continue to lag. See the Index
charts and the Hourly DJI's OBV/DISI.
This means any breakout
will probably be limited.
But we will be entering a bullish seasonal period next week
and we see a number of BULLISH MAXCP
stocks breaking
out above rising resistance lines. I suspect that they, like
SOXL, are warning that the broad market will
make another
run upwards here very soon. One factor influencing this judgment
is the simple appreciation that there are many more, 10x more,
MAXCPs (stocks making new CP new highs than stocks
making CP new lows.)
Watch Your Dollar Grow.
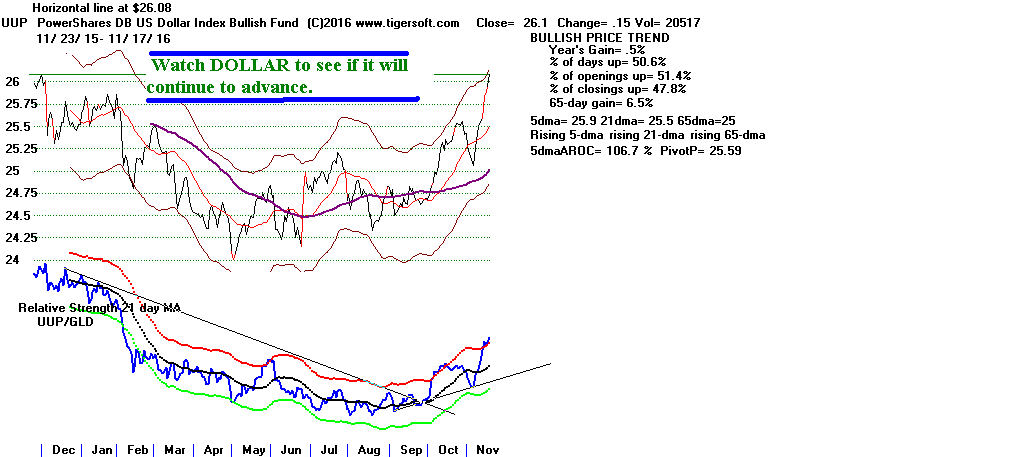
The Dollar's Strength (UPP made a nominal new high today.) coupled with
prospects for a Trump fiscal expansionism are quite bullish. That
is why both banks stocks and the smaller companies represented
by IWM are both simultaneously so strong. This is a situation which
it is very hard to find precedent for. But, if my economics'
understanding is right here, a new boom is just in the beginning.
Look back at 1983-1985 and 1996-2000. The stock market boomed
in those years. Economic growth was also very high.

https://www.northerntrust.com/insights-research/market-commentary?c=a36a637f9b45af78f8463a58afd57fab
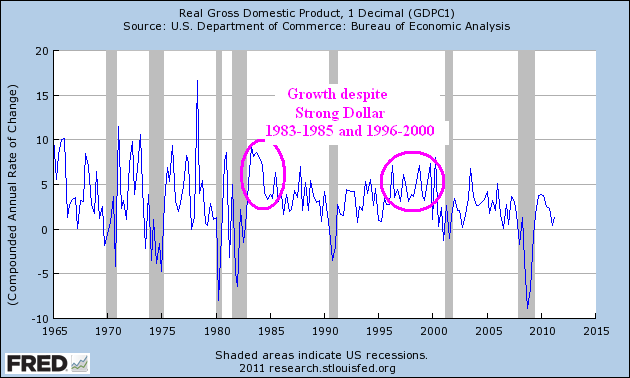
Bears will, of course, point to the collapsing Bond Market and
tell us that Bonds are more important than the equities' market for
many big funds. But, I would counter that the trend we see now will
continue
and money will simply continue to come out of Bonds and flow
into stocks.
Fiscal expansionism, in fact, can even counter restrictive monetary
policies for a while and allow stocks to advance further. That is the
reason that Martin Zweig required not one but three rate hikes in a row
before tighter money could flash a Sell.
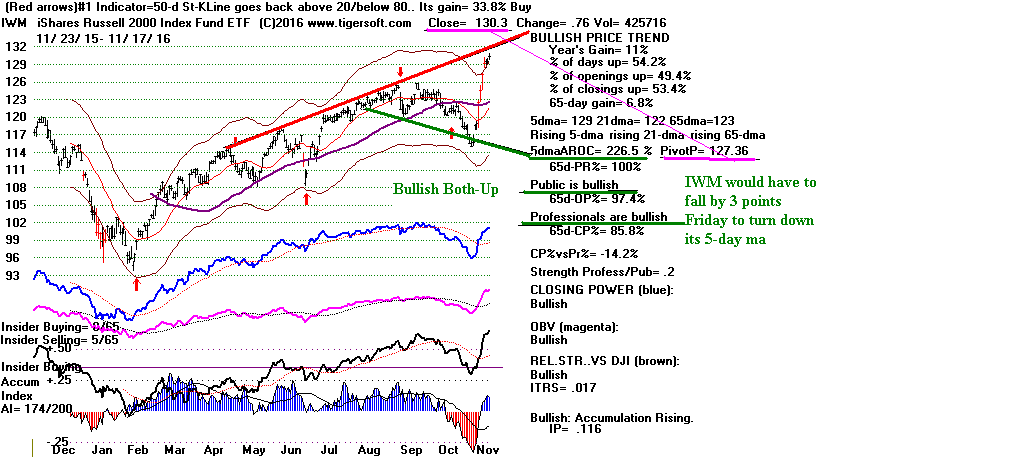
CP - Tiger's Closing Power - usually correctly predicts price
trends. See
tonight's
special study of SPY since 1995 in this respect.
Year after year, all one had to do to make money was be long
when CP was in a rising trend for SPY and short when it was falling.
There were a few exceptions. In these cases, CP lagged sometimes after
a bullish flat-topped breakout (1996). We should always be on the
alert for big bulges of Accumulation, they can over-ride a temporarily
lagging CP's apparent bearishness.
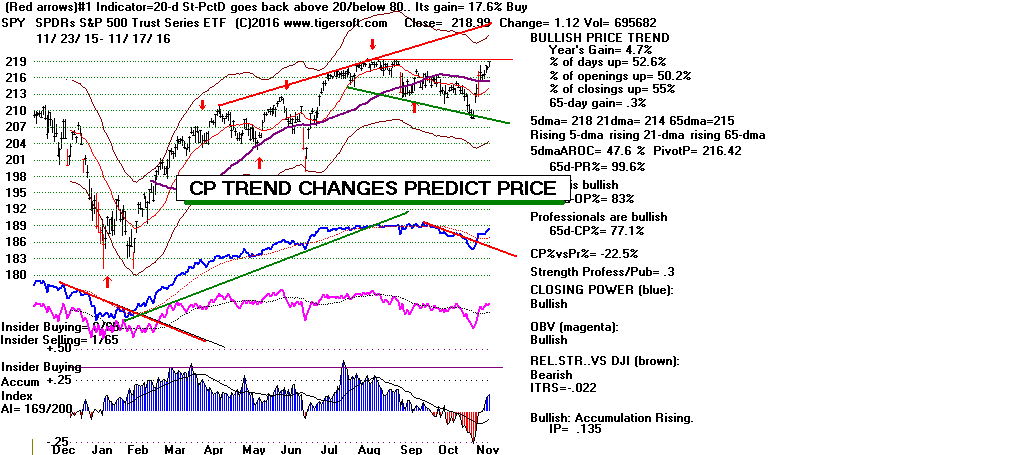
The Closing Powers are rising for all the key ETFs,
In addition, all have rising 5-day moving averages. So, it is not
yet time to sell short. IWM, in fact, probably should be played long
while its Closing Power and 5-day mvg. averages are rising.
Another thing to note is themost bullish short-term "BOTHUP" situation
applies now. This is where both Opening and Closing Power
are rising. In this environment, a stock or ETF may be expected to
typically
jump at the opening and then move still higher doing the day. Another
thing here: almost always it is the break in the rising Closing Power
that brings a reversal in the price trend.
It seems to be only a matter of time
before GLD makes a new low. Notice
its nested head/shoulders.
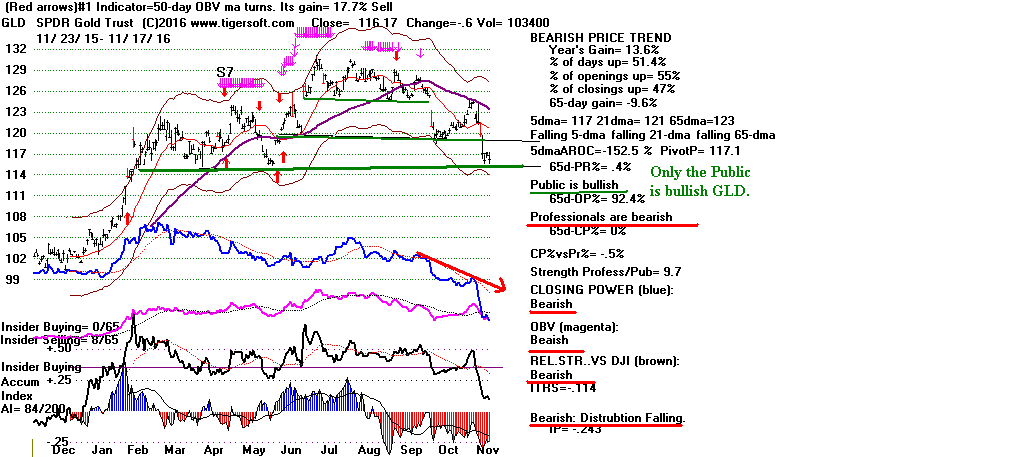
Let's also watch to see if Gold (GLD) breaks
to new lows. Its Closing
Power and Accumulation Index are very weak. I would think it
should be shorted on such a breakdown. Such a decline would
mean interest rates will, in fact, probably be going up in December
and Bonds much lower.
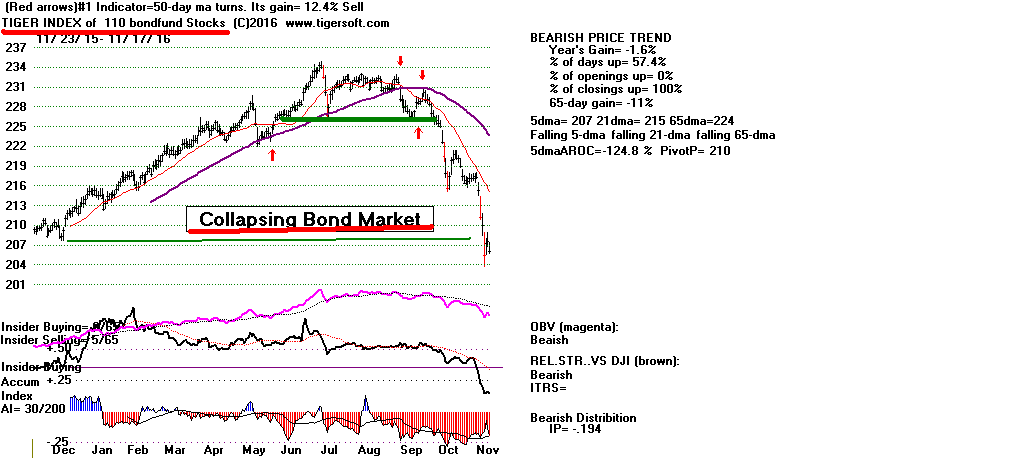
Links to Charts
Peerless
DJIA and A/D Line
DJI-OBVPCT
Hourly DJIA
S&P
OEX
NYSE
NASDAQ
DIA
QQQ SPY
IWM
Short-Term Rates
DJI-Utilities
REITS
A/D Line-6000 Stocks
SOXL TECL
FAS
Crude Oil
11/17/16:
Bullish
MAXCPs (mostly Regional Banks)
Bearish
MINCPs
(mostly Bond Funds)
Stocks:
AAPL, BIDU,
IBM, TXN
Bank Stocks - DB (Deutsche
Bank), WFC (Wells Fargo), GS (Goldman Sachs),
AMZN, FB,
GOOG, JPM,
MSFT, NVDA (Super Stock)
ETFS:
BBH, BRZU,
DIA, DUST,
FAS, GASL,
GLD, IWM,
JETS,
JNUG, KOL, MDY,
NUGT, OIH, OIL,
RETL,
RSX, SLV,
SOXL, TECL,
TMF, TNA,
UGAZ, UPW,
VGK, YINN
RANKING OF KEY DIRECTORIES
BASED ON PCT.OF STOCKS ABOVE 65-DMA
11/17/16
             11/17/16
---------------------------------------------------------------------------------------
Directory     Current       11/16         11/15         11/14         11/11         11/10
----------------------------------------------------------------------------------------
BIGBANKS       100%          1             1             1             1             1
REGBANKS       100%          1             1             .972          .972          .972
INFRASTRUCTURE .909          .909          .909          .909          .909          .909
TRANSP         .904          .904          .857          .952          .809          .809
EDU            .875          .875          .875          1             .875          1
JETS           .833          .833          .75           .833          .666          .75
FINANCE        .791          .802          .835          .824          .813          .791
COAL           .777          1             1             1             .888          .888
MILITARY       .769          .75           .75           .73           .75           .711
RETAIL         .759          .703          .611          .666          .611          .5
INDMATER       .725          .725          .735          .745          .676          .656
INSURANC       .705          .705          .705          .735          .764          .764
ELECTRON       .675          .683          .662          .623          .615          .525
GAMING         .666          .666          .666          .555          .666          .666
NIFTY          .657          .6            .628          .571          .485          .514
SEMI           .647          .632          .61           .566          .551          .492
CHEM           .634          .573          .621          .634          .585          .56
NASD-100       .627          .627          .574          .553          .521          .457
SOFTWARE       .626          .507          .492          .507          .567          .417
SP-100         .608          .597          .618          .587          .597          .618
RUS-1000       .588          .558          .566          .539          .504          .501
INDEXES        .577          .564          .564          .523          .518          .548
AUTO           .575          .55           .5            .45           .475          .425
SP500          .563          .543          .557          .531          .498          .533
COMPUTER       .555          .592          .592          .555          .555          .481
DOWJONES       .533          .566          .6            .533          .633          .633
HACKERS        .523          .571          .571          .619          .523          .523
ALL STOCKS     .510
OILGAS         .488          .511          .54           .424          .354          .418
BIOTECH        .466          .449          .493          .489          .469          .432
GREEN          .451          .419          .451          .387          .354          .29
PIPELINE       .444          .333          .444          .333          .222          .333
HOMEBLDG       .388          .277          .333          .388          .222          .222
COMODITY       .371          .371          .357          .3            .314          .385
FOOD           .333          .333          .333          .266          .2            .466
SOLAR          .294          .294          .235          .176          .176          .117
REIT           .287          .292          .267          .303          .222          .191
CHINA          .278          .291          .278          .253          .253          .177
HOSPITAL       .25           0             .25           0             0             0
BEVERAGE       .142          .142          .19           .142          .142          .142
GOLD           .14           .157          .175          .14           .157          .175
UTILITY        .13           .13           .152          .152          .152          .108
ETFS           .088          .073          .102          .058          .058          .102
BONDFUND       0             0             0             0             0             0
=============================================================
11/16/2016
Clinched Sell S9/S12 Still Stands.
But there is a
good chance that will get a new Peerless Buy B4
if a new buying surge pushes the Peerless breadth (P-I) and
Accumulation Index up enough. The DJI's megaphone
price pattern suggests a target of at least 19300. A breakout
run by the NASDAQ could be starting, too. IWM would
seem the best way for ETF traders to play this, should it
develop. Note the increasing number of MAXCP stocks
that are breaking out above their own rising resistance lines.
The closest historical parallel I can find is when Reagan won
the Presidency in November 1980. See how the DJI formed
a broadening top (megaphone pattern) there. Note that it took
4-5 sets of Peerless Sells to finally bring on a bear market
because of the very high interest rates the FED imposed.
DJI and NASDAQ 1980-1981
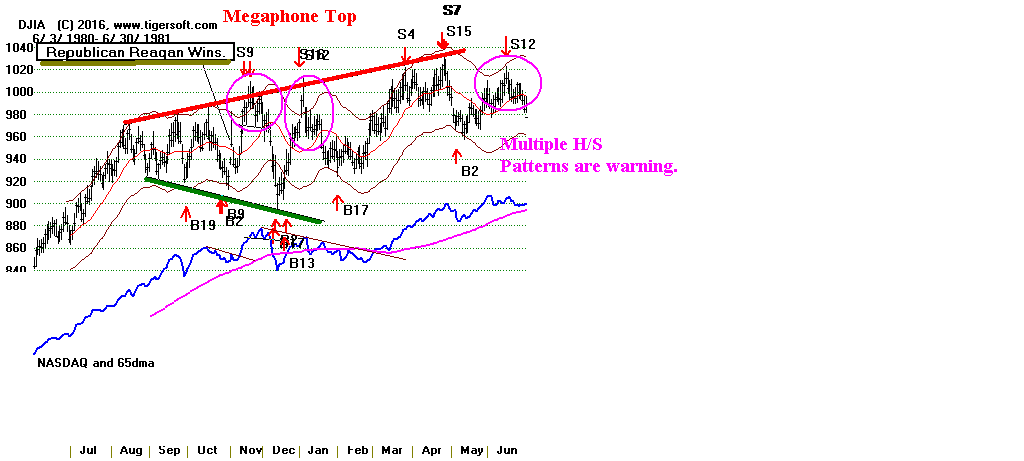
DJI and NASDAQ Now
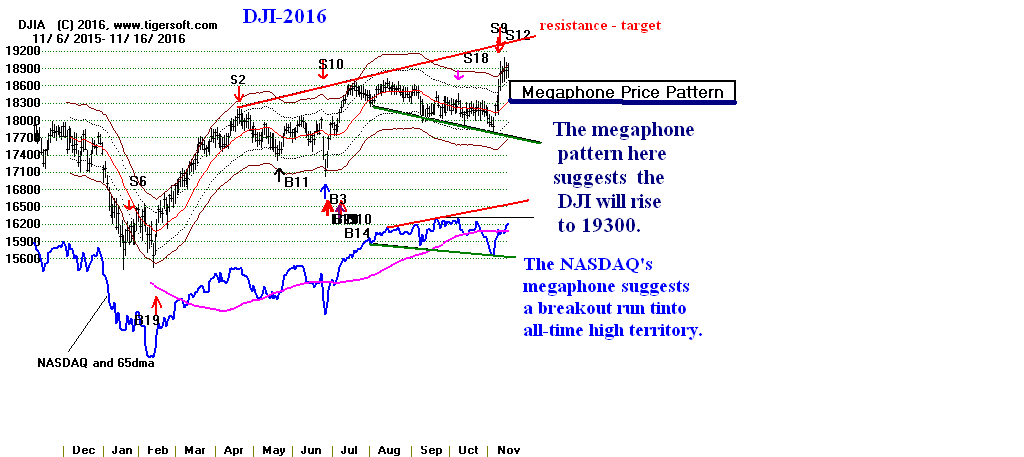
Studying the past cases where a Republican took over the
White House
from a Democrat helps us understand the strength of the market now even as
it is hit by a Peerless S9/S12. A rally though the end of the month of
November, at least, was achieved in 1952, 1968, 1980 and 2000. This
surprised many because of the active wars going on in 1952 and 1968,
because of the extraordinarily high interest rates of 1980 and because
of the high tech "bust" that had already started by late 2000.
I think it's very important to appreciate that the prospective
Trump Presidency does not have to cope with any of these handicaps.
And, just as important, his party controls a working majority in Congress.
This was not true in any of these earlier cases. Just on this basis, one
might
think that the sudden, mostly unexpected prospect of a new Republican
Presidency would propel the market significantly.
The risks inherent in his quirky Personality would appear
to be the major
force holding the stock market back. Is that enough to stop the stock
market
here? I would not think so, but for our clinched Peerless S9/S12.
It is
because of the Politics of the current market environment and the expected
Republican Partisan celebration, that I would think the DJI and the other
Indexes, NASDAQ, SP-500, QQQ, IWM, OEX, NYSE will all reach the
rising resistance lines of their megaphone patterns. It is why I think we
must short only ETFs now whose Closing Powers and 5-day moving averages
are falling. Only QQQ has met those criteria. And it appears to be
on the
cusp of turning bullish. See how its 5-day ma will probably turn up
tomorrow
and a strong close would break its Closing Power downtrend. If these
things occur, cover any short in QQQ.
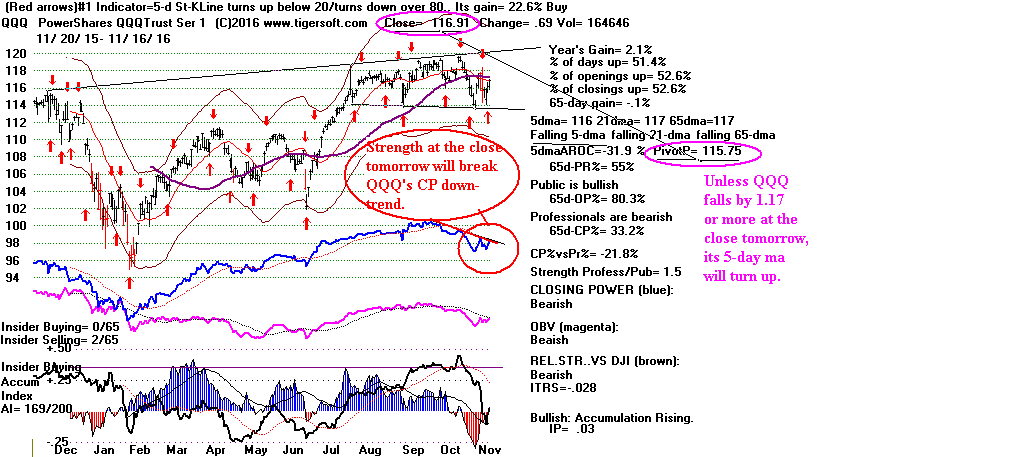
Buy IWM but Follow QuickSilver Strategy for Trading.
I think the best way for ETF traders to play the undeniable strength
is with IWM. As long as its Closing Power and 5-day moving average
are rising, it looks like a prime beneficiary of Trump's expansionist
vision for the economy. A breakout above its rising resistance line
should start a swift vertical ascent. That this may, indeed, what will
happen next is shown by the growing number of
MAXCP stocks
that are breakout out or have broken out above their rising
resistance lines.
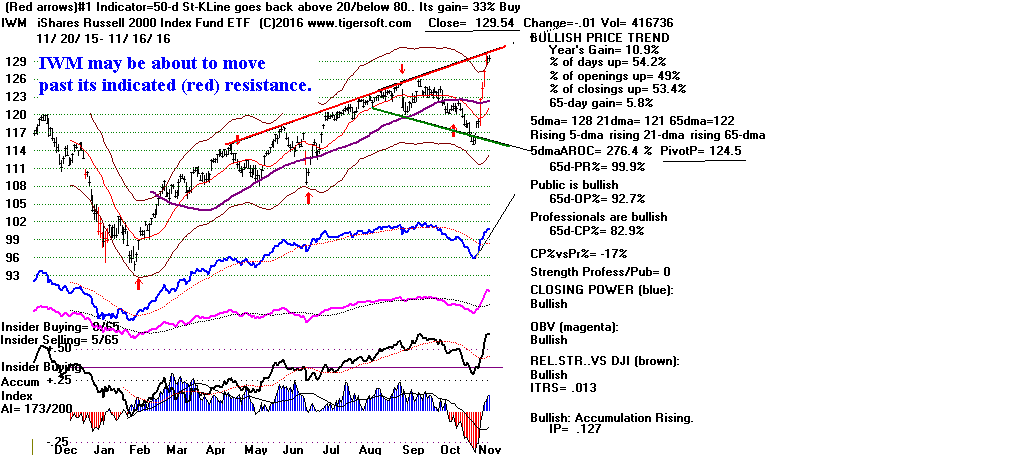
Links to Charts
Peerless
DJIA and A/D Line DJI-OBVPCT
Hourly DJIA
S&P
OEX
NYSE
NASDAQ
DIA
QQQ SPY
IWM
Short-Term Rates
DJI-Utilities
REITS
A/D Line-6000 Stocks
SOXL TECL
FAS
Crude Oil
Oil/Gas Stocks
11/16/16:
Bullish
MAXCPs (mostly Regional Banks)
Bearish
MINCPs
(mostly Bond Funds)
Stocks:
AAPL, BIDU,
IBM, TXN
Bank Stocks - DB (Deutsche
Bank), WFC (Wells Fargo), GS (Goldman Sachs),
AMGN AMZN,
FB,
GOOG, JPM,
NVDA (Super Stock)
ETFS:
BBH, BRZU,
DIA, DUST,
FAS, GASL,
GLD, IWM,
JETS,
JNUG, KOL, MDY,NUGT,
OIH, RETL,
RSX, SLV,
SOXL, TECL,
TMF, TNA,
UGAZ, UPW,
VGK, YINN
RANKING OF KEY DIRECTORIES
BASED ON PCT.OF STOCKS ABOVE 65-DMA
11/16/16
---------------------------------------------------------------------------------------
Directory     Current       day-1         day-2         day-3         day-4         day-5
----------------------------------------------------------------------------------------
BIGBANKS       1             1             1             1             1             1
COAL           1             1             1             .888          .888          1
REGBANKS       1             1             .972          .972          .972          .972
INFRA          .909          .909          .909          .909          .909          .909
EDU            .875          .875          1             .875          1             .875
TRANSP         .862          .793          .758          .758          .689          .62
JETS           .833          .75           .833          .666          .75           .833
FINANCE        .802          .835          .824          .813          .802          .758
MILITARY       .75           .75           .73           .75           .711          .653
INDMATER       .725          .735          .745          .676          .656          .617
INSURANC       .714          .714          .742          .771          .771          .628
RETAIL         .703          .611          .666          .611          .5            .333
ELECTRON       .682          .66           .622          .613          .523          .523
GAMING         .666          .666          .555          .666          .666          .555
NIFTY          .666          .666          .629          .592          .592          .666
SEMI           .632          .61           .566          .551          .492          .514
NASD-100       .627          .574          .553          .521          .446          .489
SP-100         .597          .618          .587          .597          .618          .567
COMPUTER       .592          .592          .555          .555          .518          .481
CHEM           .573          .621          .634          .585          .56           .512
HACKERS        .571          .571          .619          .523          .523          .428
DOWJONES       .566          .6            .533          .633          .633          .566
INDEXES        .564          .564          .523          .518          .543          .518
RUS-1000       .558          .566          .539          .504          .497          .471
AUTO           .55           .5            .45           .475          .425          .25
SP500          .543          .557          .531          .498          .527          .48
OILGAS         .511          .54           .424          .354          .418          .412
SOFTWARE       .507          .492          .507          .567          .432          .447
BIOTECH        .449          .493          .489          .469          .429          .359
GREEN          .419          .451          .387          .354          .29           .29
COMODITY       .371          .357          .3            .314          .385          .4
FOOD           .333          .333          .266          .2            .466          .6
PIPELINE       .333          .444          .333          .222          .222          .222
SOLAR          .294          .235          .176          .176          .117          .117
REIT           .292          .267          .303          .222          .186          .207
CHINA          .291          .278          .253          .253          .177          .278
HOMEBLDG       .277          .333          .388          .222          .222          .111
GOLD           .157          .175          .14           .157          .175          .228
BEVERAGE       .142          .19           .142          .142          .142          .19
UTILITY        .13           .152          .152          .152          .108          .304
ETFS           .073          .102          .058          .058          .102          .235
BONDFUND       0             0             0             0             0             0
HOSPITAL       0             .25           0             0             0             0
==================================================================
11/15/2016
Stay short QQQ but
let's hold off shorting DIA for now.
Admittedly, the DJI looks quite over-extended when we take into account its
Hourly chart's lagging OBV/DISI and when we
look at the
A/D Line chart for our Tiger Index of the
DJI-30 stocks. Clearly, too much
of the rally has come from too few DJI stocks. See the oversized
gains since 11/7 in just GS +16%,
JPM +13%, CAT +12%. The
median DJI stock gain in this period is only a little over 1%. Nine
of them are actually down.
Buyers' remorse is probably inevitable in the case of Trump. Certainly,
newspapers like the New York Times have no plans to let up in their
criticisms, especially of the more outspoken and very right-wing
leaders in his new government.
The DJI is at the upper band (in very over-bought
territory)
but shows only a slightly positive P-I, IP21 and V-I reading.
Breadth will need to improve dramatically to support a rally
from here and give us new Peerless Buy Breadth-based B4
signal. There is still a chance for an Accumulation-based B4.
It is based on a striking advance in this IP21 indicator in ten
days or less.
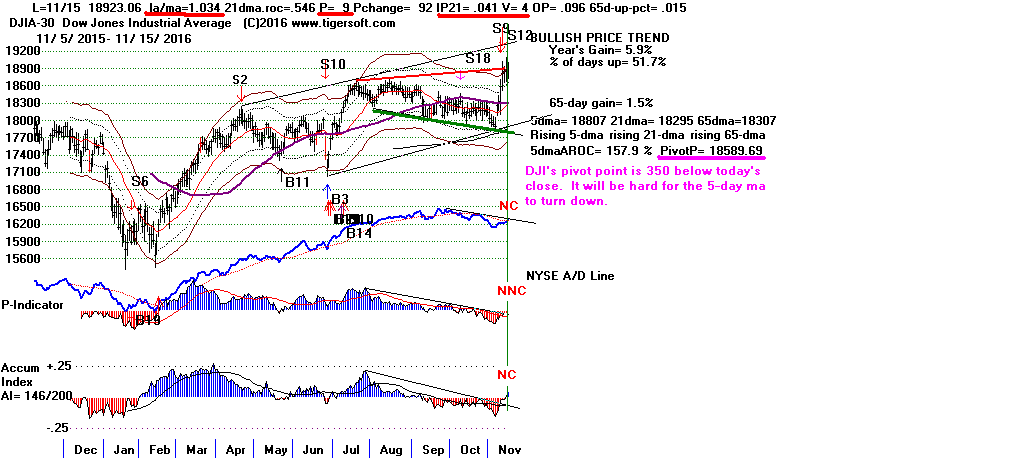
Our S9/S12 was clinched Thursday when the DJI was 18848.
It is now 85 points higher. The history of the 24 earlier Sell S9/S12
below shows that the median paper loss is between 1% and 2%
before the DJI turns down. Only in 1/8 of the cases did a Peerless
S9/S12 fail to be reversed profitably, so maybe be the Trump-Partisan
rally will end without the DJI going up much more. For now, we
should wait for the ETFs' Closing Powers and 5-day mvg.avgs
to turn down.
S9-S12s: total 24 Earlier Cases: 1928-2016
Losses and Gains on Shorting DJI on second Sell.
Losses = 3
Gains 4% to +8% = 7
Gains 8% to +12% = 5
Gains 12% to 20% = 2
Gains >20% = 3
Median Gain = > +8%
Paper Losses
None = 7
0% to +1% = 4
1% to +2% = 5
2% to +3% = 4
3% to +4% = 3
4.3% = 1
--------------------------------------------
ETF Opwr CPwr
5-day-MA
R esistance/ S upport
AROC
-------------------------------------------------------------------------------------------------------------------------------------------------------
DIA
Up Up
+159% Pivot Point is 3.39 points lower.
At 3.4% upper band with bearish divergences
(5-dma cannot easily turn down.)
SPY Up
Up +97% Pivot Point is
1.90 points lower R=219
(+.72 higher)
QQQ Up
Bearish
-38%
Pivot Point is 1.44 higher.
R=118 (+1.78 higher)
TECL
Up
Bearish
Pivot Point is 2.02 higher.
(Cannot easily turn up.)
IWM Up
Up +429%
Pivot Point is 7.01+
points lower. R=47 (2.13 higher)
(5-dma cannot easily turn down.)
Don't Forget Our QuickSilver Program
I have neglected our Tiger QuickSilver ranking program in all the excitement
about Trump. You will remember it finds the leveraged ETFs with the
highest
5-day AROC (annualized rate of change) and we want to buy those with an
IP21 above .15 when both the Opening and Closing Power are rising. That is
now true of KRU (Regional Banking) and TMV the leveraged short of 3-year
Treasuries.
See below how well they have done in the last week. They can be traded
aggressively
if you watch them closely and sell on the next price Reversal Day down, CLosing
Power trend-break or turning down of their 5-dma.
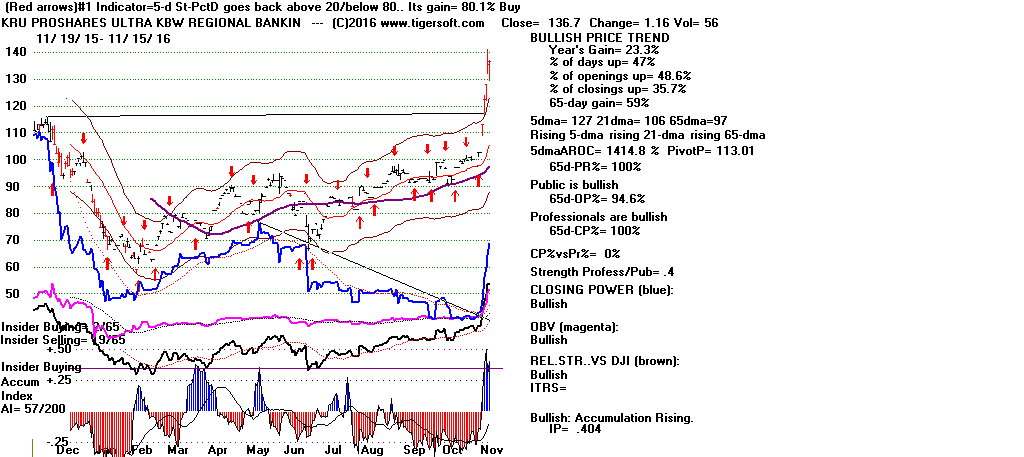
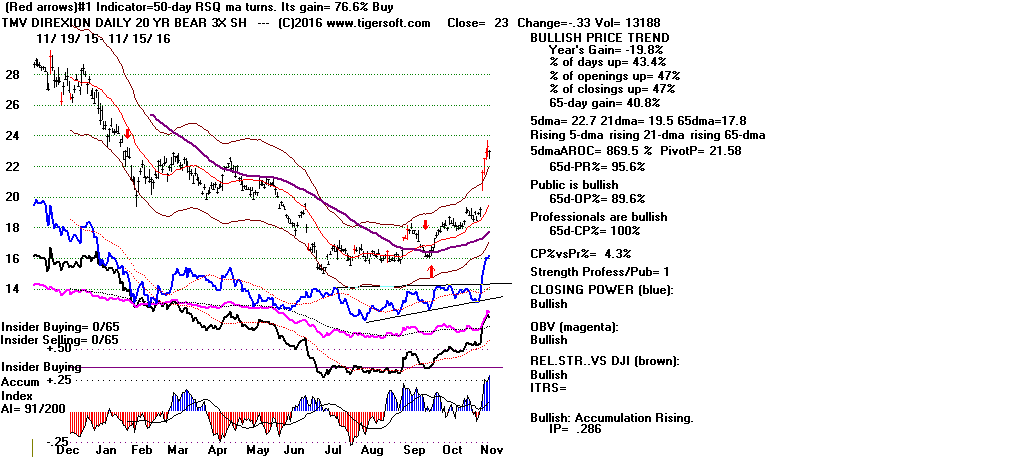
Links to Charts
Peerless
DJIA and A/D Line DJI-OBVPCT
Hourly DJIA
S&P
OEX
NYSE
NASDAQ
DIA
QQQ SPY
IWM
Short-Term Rates
DJI-Utilities
REITS
A/D Line-6000 Stocks
SOXL TECL
FAS
Crude Oil
Oil/Gas Stocks
11/15/16:
Bullish
MAXCPs (mostly Regional Banks)
Bearish
MINCPs
(mostly Bond Funds)
Stocks:
AAPL, BIDU,
IBM, TXN
Bank Stocks - DB (Deutsche
Bank), WFC (Wells Fargo), GS (Goldman Sachs),
AMGN AMZN,
FB,
GOOG, JPM,
NVDA (Super Stock)
ETFS:
BBH, BRZU,
DIA, DUST,
FAS, GASL,
GLD, IWM,
JETS,
JNUG, KOL, MDY,NUGT,
OIH, RETL,
RSX, SLV,
SOXL, TECL,
TMF, TNA,
UGAZ, UPW,
VGK, YINN
        RANKING OF KEY DIRECTORIES
    BASED ON PCT.OF STOCKS ABOVE 65-DMA
                          11/15/16
---------------------------------------------------------------------------------------
Directory     Current       day-1         day-2         day-3         day-4         day-5
                            11/14         11/11         11/10         11/9          11/8
----------------------------------------------------------------------------------------
BIGBANKS       1             1             1             1             1             .857
COAL           1             1             .888          .888          1             .777
REGBANKS       1             .972          .972          .972          .972          .694
INFRA          .909          .909          .909          .909          .909          .818
EDU            .875          1             .875          1             .875          .75
FINANCE        .835          .824          .813          .802          .758          .582
TRANSP         .793          .758          .758          .689          .62           .551
JETS           .75           .833          .666          .75           .833          .833
MILITARY       .75           .73           .75           .711          .653          .365
INDMATER       .735          .745          .676          .656          .617          .509
INSURANC       .714          .742          .771          .771          .628          .4
GAMING         .666          .555          .666          .666          .555          .555
ELECTRON       .66           .622          .613          .523          .532          .506
NIFTY          .628          .571          .485          .514          .571          .514
CHEM           .621          .634          .585          .56           .512          .378
SP-100         .618          .587          .597          .618          .587          .484
RETAIL         .611          .666          .611          .5            .333          .259
SEMI           .61           .566          .551          .492          .529          .551
DOWJONES       .6            .533          .633          .633          .566          .433
COMPUTER       .592          .555          .555          .518          .481          .444
NASD-100       .574          .553          .521          .446          .5            .414
HACKERS        .571          .619          .523          .523          .428          .333
RUS-1000       .566          .539          .504          .497          .474          .421
INDEXES        .564          .523          .518          .543          .523          .418
SP500          .557          .531          .498          .527          .488          .446
OILGAS         .54           .424          .354          .418          .418          .325
AUTO           .5            .45           .475          .425          .25           .225
BIOTECH        .493          .489          .469          .429          .359          .194
SOFTWARE       .492          .507          .567          .432          .447          .373
GREEN          .451          .387          .354          .29           .29           .29
PIPELINE       .444          .333          .222          .222          .222          .111
COMODITY       .357          .3            .314          .385          .4            .428
FOOD           .333          .266          .2            .466          .6            .733
HOMEBLDG       .333          .388          .222          .222          .111          .166
CHINA          .278          .253          .253          .177          .278          .303
REIT           .267          .303          .222          .186          .191          .171
HOSPITAL       .25           0             0             0             0             .5
SOLAR          .235          .176          .176          .117          .176          .352
BEVERAGE       .19           .142          .142          .142          .19           .38
GOLD           .175          .14           .157          .175          .228          .175
UTILITY        .152          .152          .152          .108          .304          .63
ETFS           .102          .058          .058          .102          .25           .397
BONDFUND       0             .008          0             0             .008          0
================================================================
11/14/2016
Our S9/S12 was clinched Thursday. Predicting
what will happen
next with DIA, SPY, QQQ and IWM is made tricky now because seasonality
will turn quite bullish from Thanksgiving to the end of the year and
because of the enormous shifting of funds taking place now from
one sector to another. Even so, I would sell
short more QQQ.
Only its
Closing Power and 5-day ma are both falling now. We can also
understand how the new Trump Administration will negatively impact
QQQ. Even better would probably be short
sales of the weakest foreign
ETFs and more short sales of Bond Funds and Gold Stocks' ETFs.
These represent the weakest Sectors now.
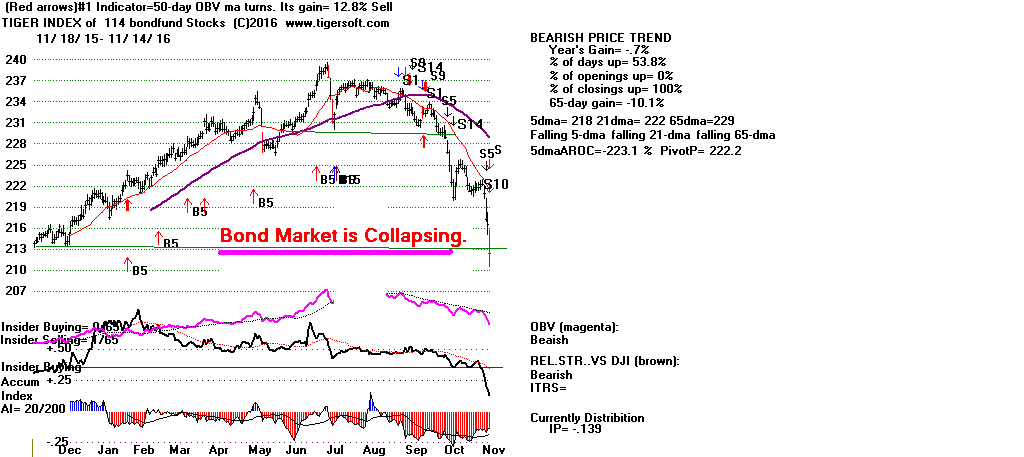
Opwr CP
5-day-MA
ITRS Optimized Signal
AROC
---------------------------------------------------------------------------------------------------------------------------
DIA
Up Up
+173% Pivot Point is 5 1/2 points lower. lower.
na Red Sell (new)
(5-dma cannot easily turn down.)
SPY Up
>MA +80% Pivot Point is 2.58 points lower
-.029
QQQ Up
Bearish
-74%
Pivot Point is 2.48 higher.
-.042
Sell
TECL
Up
Bearish
-371%
Pivot Point is 4.12 higher.
-.106
Sell
(Cannot easily turn down.)
IWM Up
Up +432% Pivot Point is
10.27+
points lower.
.016 Buy
(5-dma cannot easily turn down.)
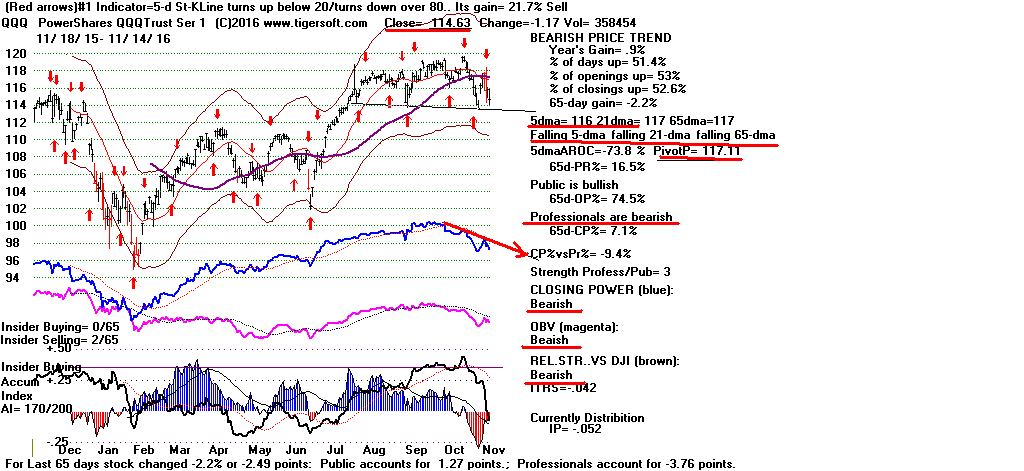
Trump's victory would seem be a great victory for lower corporate tax
rates,
higher rates of corporate profits, lower taxation of the wealthy leaving more
funds for them to invest in stocks, de-regulation of banks, biotechs and
the
energy industry plus a new protectionism, lots of new infra-structure spending,
better relations with Russian, more economic growth and higher interest
rates.
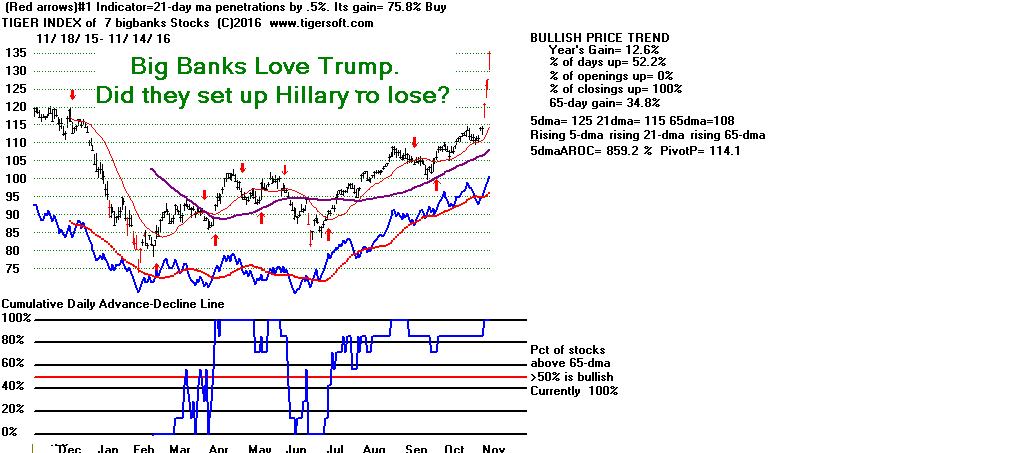
All this creates a brand new mix of winners and losers on Wall Street that
should dwarf the effects of the Sell S9/S12.
Because Trump's victory was unexpected for most, it will take some time for the
sellers of Bonds, Utilities, REITs, defensive dividend stocks, foreign ETFs, big
high tech
multinationals and Gold/Silver to finish selling what now seems doomed to
weakness
under Trump and redeploy their funds into Banks and Financials,
Infrastructure-Building
stocks, Biotechs and Security/Military Stocks.
Buying into these new sectors of capital in-flow (bullish) and shorting the
sector show capital out-flow seems better than trading DIA and SPY?
But we can see how the technicals are matching the fundamental trends outlined
above.
First, we can reason that the QQQ with its many high tech multinationals will be
much
more vulnerable if Trump restricts trade with China or limits the issuing of
green cards
to talented foreign workers working for the likes of GOOG, AAPL, FB, MSFT, etc.
See how QQQs falling Closing Power is matched by its 5-day ma having turn down
today.
Given this weakness and the Peerless S9/S12, QQQ looks like the best ETF to
short,
though one might also consider TECL.
I believe that it will be hard for DIA (with its big Banks and premier
infrastructure stock-CAT)
to decline much. Its Closing Power and 5-day ma are rising now and cannot
easily turn down.
The most bullish ETF now is IWM. With its legions of smaller companies
catering mostly
to domestic markets, it may not decline at all in here. We see how much it
has risen
since the day before the election. We see its current ITRS (50-day
Relative Strength)
shows it to be stronger than the DJI. Significantly, both its Opening and
Closing Power
are now rising. And its 5-day ma is advancing at an annualized
rate and cannot
easily turn down.
Links to Charts
Peerless
DJIA and A/D Line DJI-OBVPCT
Hourly DJIA
S&P
OEX
NYSE
NASDAQ
DIA
QQQ SPY
IWM
Short-Term Rates
DJI-Utilities
REITS
A/D Line-6000 Stocks
SOXL TECL
FAS
Crude Oil
Oil/Gas Stocks
11/14/16:
Bullish
MAXCPs Bearish
MINCPs
Stocks:
AAPL, BIDU,
IBM, TXN
Bank Stocks - DB (Deutsche
Bank), WFC (Wells Fargo), GS (Goldman Sachs),
AMGN AMZN,
FB,
GOOG, JPM,
NVDA (Super Stock)
ETFS:
BBH, BRZU,
DIA, DUST,
FAS, GASL,
GLD, IWM,
JETS,
JNUG, KOL, MDY,NUGT,
OIH, RETL,
RSX, SLV,
SOXL, TECL,
TMF, TNA,
UGAZ, UPW,
VGK, YINN
              RANKING OF KEY DIRECTORIES
            BASED PCT.OF STOCKS ABOVE 65-DMA
11/14/16
---------------------------------------------------------------------------------------
Directory     Current       day-1         day-2         day-3         day-4         day-5
                            11/11         11/10         11/09         11/08
                                                        Trump         Election
                                                        wins          Day
----------------------------------------------------------------------------------------
BIGBANKS       1             1             1             1             .857          .857
COAL           1             .888          .888          1             .777          .888
EDU            1             .875          1             .875          .75           .625
REGBANKS       .972          .972          .972          .972          .694          .694
INFRA          .909          .909          .909          .909          .818          .727
JETS           .833          .666          .75           .833          .833          .75
FINANCE        .824          .813          .802          .758          .593          .56
TRANSP         .758          .758          .689          .62           .551          .586
INDMATER       .745          .676          .656          .617          .519          .46
INSURANC       .742          .771          .771          .628          .4            .314
MILITARY       .73           .75           .711          .653          .365          .365
RETAIL         .666          .611          .5            .333          .277          .259
CHEM           .634          .585          .56           .512          .402          .39
ELECTRON       .622          .613          .523          .532          .506          .476
HACKERS        .619          .523          .523          .428          .333          .38
SP-100         .587          .597          .618          .587          .474          .412
NIFTY          .571          .485          .514          .571          .514          .542
SEMI           .566          .551          .492          .529          .536          .514
COMPUTER       .555          .555          .518          .481          .444          .407
GAMING         .555          .666          .666          .555          .555          .555
NASD-100       .553          .521          .446          .5            .414          .393
RUS-1000       .538          .503          .497          .473          .42           .389
DOWJONES       .533          .633          .633          .566          .433          .333
SP500          .529          .496          .527          .486          .442          .391
INDEXES        .523          .518          .543          .523          .422          .372
SOFTWARE       .507          .567          .432          .447          .388          .447
BIOTECH        .489          .469          .429          .359          .197          .184
AUTO           .425          .45           .425          .225          .225          .2
OILGAS         .424          .354          .418          .418          .325          .313
HOMEBLDG       .388          .222          .222          .111          .166          .111
GREEN          .387          .354          .29           .29           .29           .29
PIPELINE       .333          .222          .222          .222          .111          .111
REIT           .303          .222          .186          .191          .171          .166
COMODITY       .3            .314          .385          .4            .428          .357

FOOD           .266          .2            .466          .6            .8            .733
CHINA          .253          .253          .177          .278          .303          .265
SOLAR          .176          .176          .117          .176          .352          .294
UTILITY        .152          .152          .108          .304          .586          .478
BEVERAGE       .142          .142          .142          .19           .38           .19
GOLD           .14           .157          .175          .228          .175          .175
ETFS           .058          .058          .102          .25           .382          .308
BONDFUND       .008          0             0             .008          0             .017
HOSPITAL       0             0             0             0             .5            .5
==============================================================
11/11/2016
Our S9/S12 was clinched Thursday. But Trump's
prospective
Presidency would seem to give much of Wall Street nearly all it
could ever wish for. So, right now there is a buying stampede.
Why fight it? Use Tiger's Closing Power's uptrend and the trend
of the 5-day ma to judge when Professionals believe a pull-back
is starting. Only the QQQ has a bearish down-trending Closing
Power but its 5-day ma is still rising. Apparently, big tech stocks
are afraid of the consequences of Trump protectionism. But those
fears seem likely to dissipate if the rally continues.
Opwr CP
5-day-MA AROC (Annualized Rate of Change)
----------------------------------------------------------------------------
DIA
Up Up
+265.6 Pivot Point is 6+ points lower.
SPY Up
>MA +184% Pivot Point is 3+ points lower
QQQ Up
Bearish +92.6%
Pivot Point is .55 higher.
IWM Up
Up +484% Pivot Point is 8+
points lower.
If
Trump uses his power wisely and does not cause his opponents
to coalesce and fight him at every step, Wall Street's bulls will should
be very happy. A massive Public Works program will be reminiscent
of IKE's Inter-State Highway Construction Program in 1954. That
was an extraordinarily bullish period.
But Trump's combative personality is probably too irrepressible to
be wisely tempered. So the Sell S9/S12 on
the DJI could still work out.
But right now, Peerless users should appreciate that the biggest previous
paper loss with S9/S12 signals was 4.3% and that one eight of these signals
were reversed with a loss. Note that a loss of more than 2% on the
DJI
before the markets turn down from the second signal, the S12, occurred in
one third of the 24 earlier cases. (See Thurday's Hotline for these
statistics. )
Conclusion. Cover all short sales, except those
in Bonds,
Gold and
Utilities.
Buy new high Accumulation Breakouts in the strongest sectors (see below).
Reasons Not To Go Short Yet.
1) The DJI has rallied from 17500 (the lower band, early Wednesday morning) to
18847 Friday's close. This is a 3 day DJIA jump of 1347 points or
7.7%. Earlier
studies I have done show this is way too much market strength to sell short.
The S9s and S12s have rules built into them preventing their appearance when
the DJI rises so steeply in normal trading hours. What stopped these rules from
working here was the wild swing down in international trading on Wednesday
morning. Even as such, these big gains have caused our Closing Powers to
rise
very steeply. Clearly, Professionals still are eagerly buying. Only
when they stop,
would I want to go short.
2) There are no prior cases of Sell S9/Sell S12s in November. This is not
accidental. Though seasonality is mildly bearish for the next week,
it is normally quite bullish through the end of the year. Since
1965,
the DJI has rallied 63.3% of the time over the next 10 trading days,
69.4% over the next 20 trading days and 79.6% over the next 40
trading days.
3.) The weakening NYSE A/D Line owes mostly to the collapsing
Bond Market. Unless the bond market collapses so fast as to cause a
liquidity crisis for the entire market, it may also be taken as a sign that
money is
flowing out of fixed income plays into more speculative stocks.
4) The biggest gainers now are Finance stocks, Regional Banks and the
Big Banks. The market is in much more danger when these groups
show weakness, as in 2007-2008, than when they show exceptional
strength. Many of these banking stocks look forward how they
can turn somewhat higher interest rates into bigger profits.
The Big Banks-Brokerages now have a huge vested interest in seeing the DJI hit
magic number 20,000. The publicity of that will generate lots more public
trading.
It will also tend to support those Republicans who have long advocated
the privatization of Social Security.
5) Gold Stocks tell us when a financial crisis looms by virtue of their
unusual advances. But Gold stocks now are heading steeply down. So,
Confidence
in equities and the Dollar is on the rise.
6) The closest parallel I can find is the DJI in November 1980 just after
the Republican Reagan bear the incumbent Democrat Carter for President.
In that case, the DJI rose until the end of November when it reach its
rising resistance in a price-megaphone pattern. We see price-megaphone
patterns here for the SP-500 and the NASDAQ. So the DJI still has
a lot further to go on the upside to allow the SP-500 and NASDAQ
to reach the rising resistance levels that define the top of these megaphone
patterns.
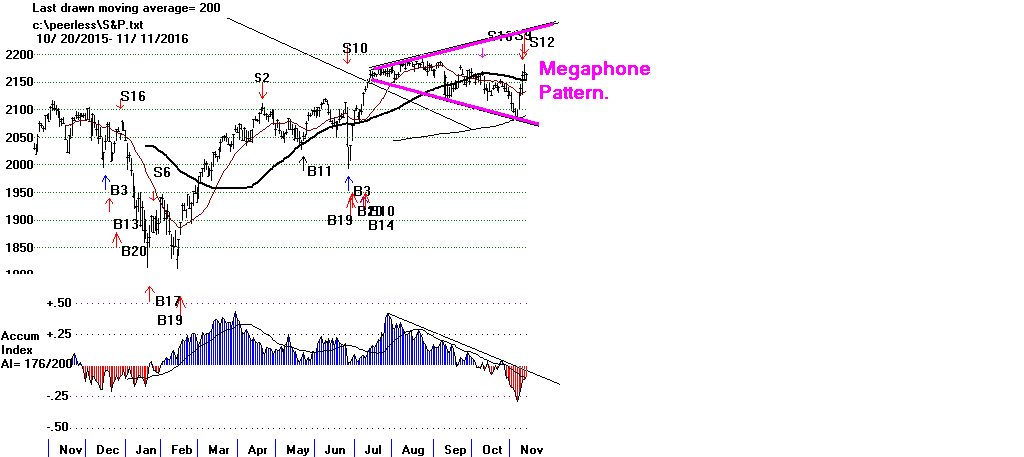
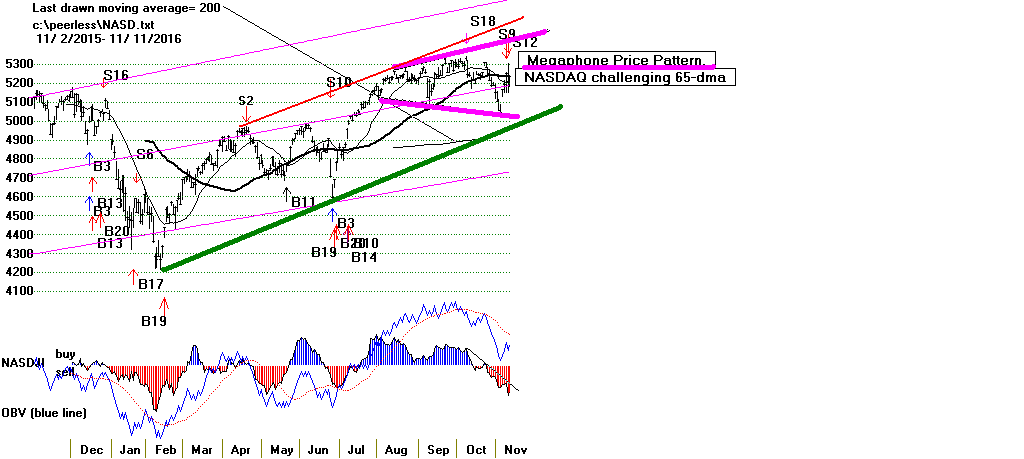
7) Reagan was a transformative President. He lowered corporate taxes
on the wealthy. He broke unions. He made peace with the Soviet
Union.
And where he could, he deregulated business. But he never had a
Republican Congressional majority in both the House and the Senate like
President Trump will have.
So, almost certainly, corporate taxes will fall
sharply under Trump. This
means Corporations will make 10%-20% higher earnings
in the next year,
barring other negative developments,
such as the start of an international
trade war because of new US tariffs. This is the outlook that is moving
the
the markets now. Potentially, the stock market could go up more than
it did under Reagan and possibly match what it did under Eisenhower. .
8) The main reason Reagan's 18 months in office experienced a bear market,
I would argue, was because the Fed Chairman has pushed up Interest Rates
well above 12%! Our situation is very different now.
Links to Charts
Peerless
DJIA and A/D Line DJI-OBVPCT
Hourly DJIA
S&P
OEX
NYSE
NASDAQ
DIA
QQQ SPY
IWM
Short-Term Rates
DJI-Utilities
REITS
A/D Line-6000 Stocks
SOXL TECL
FAS
Crude Oil
Oil/Gas Stocks
11/11/16:
Bullish MAXCPs
Bearish
MINCPs
Stocks:
AAPL, BIDU,
IBM, TXN
Bank Stocks - DB (Deutsche
Bank), WFC (Wells Fargo), GS (Goldman Sachs),
AMGN AMZN,
FB,
GOOG, JPM,
NVDA (Super Stock)
ETFS:
BBH, BRZU,
DIA, DUST,
FAS, GASL,
GLD, IWM,
JETS,
JNUG, KOL, MDY,NUGT,
OIH, RETL,
RSX, SLV,
SOXL, TECL,
TMF, TNA,
UGAZ, UPW,
VGK, YINN
 RANKING OF KEY DIRECTORIES BASED PCT.OF STOCKS ABOVE 65-DMA
11/11/16
---------------------------------------------------------------------------------------
Directory     Current       day-1         day-2         day-3         day-4         day-5
----------------------------------------------------------------------------------------
BIGBANKS       1             1             1             .857          .857          .857
REGBANKS       .972          .972          .972          .694          .694          .5
INFRASTR.      .909          .909          .909          .818          .727          .454
COAL           .888          .888          1             .777          .888          .888
EDU            .875          1             .875          .75           .625          .625
FINANCE        .813          .802          .758          .593          .56           .384

INSURANC       .771          .771          .628          .4            .342          .228
TRANSP         .758          .689          .62           .551          .586          .31
MILITARY       .75           .711          .653          .365          .365          .25
INDMATER       .676          .656          .617          .519          .46           .392
GAMING         .666          .666          .555          .555          .555          .555
JETS           .666          .75           .833          .833          .833          .583
DOWJONES     .633          .633          .566          .433          .333          .2
ELECTRON       .613          .523          .532          .506          .476          .339
RETAIL         .611          .5            .333          .277          .259          .148

SP-100       .597          .618          .587          .474          .412          .237
CHEM           .585          .56           .512          .402          .39           .304
SOFTWARE       .567          .432          .447          .388          .462          .283
COMPUTER       .555          .518          .481          .444          .407          .333
SEMI           .551          .492          .529          .536          .514          .338
HACKERS        .523          .523          .428          .333          .38           .19
INDEXES        .523          .543          .523          .422          .38           .259
NASD-100     .521          .446          .5            .414          .393          .244
RUS-1000     .503          .497          .473          .42           .391          .26
SP500          .496          .527          .486          .442          .397          .247
NIFTY          .485          .514          .571          .514          .542          .314
BIOTECH        .466          .429          .358          .195          .179          .121
AUTO           .45           .425          .225          .225          .2            .125
GREEN          .354          .29           .29           .29           .29           .225
OILGAS         .354          .418          .418          .325          .308          .232
COMODITY       .314          .385          .4            .428          .371          .314

CHINA          .253          .177          .278          .303          .265          .164
HOMEBLDG       .222          .222          .111          .166          .111          .055
PIPELINE       .222          .222          .222          .111          .111          .111
REIT           .222          .186          .191          .171          .166          .111

FOOD           .2            .466          .6            .8            .733          .466
SOLAR          .176          .117          .176          .352          .294          .117
GOLD           .157          .175          .228          .175          .175          .245
UTILITY        .152          .108          .304          .586          .478          .239
BEVERAGE       .142          .142          .19           .38           .238          .047
ETFS           .058          .102          .25           .382          .308          .132
BONDFUND       0             0             .008          0             .017          .026
HOSPITAL       0             0             0             .5            .5            0
|
======================================================
11/10/2016
Trump-
Rally Brings Boom To Big Banks and 'InfraStructures'
And A "Bust" To Bonds, Foreign ETFs and Hospitals.
Yesterday's Sell S9 Was 'Clinched' by Negative NYSE Breadth
and Reinforced by a New Peerless Sell S12. Sell short
QQQ.
It already shows a falling Closing Power. The Closing Powers
for DIA, SPY and
IWM are rising steeply,
showing Professionals
have not become net sellers in them. Stay short Bonds. They are
in a state of collapse. This is going to have very unsetting effects
on the equities' market. And Trump did say the stock market
was a bubble quite ready to burst.
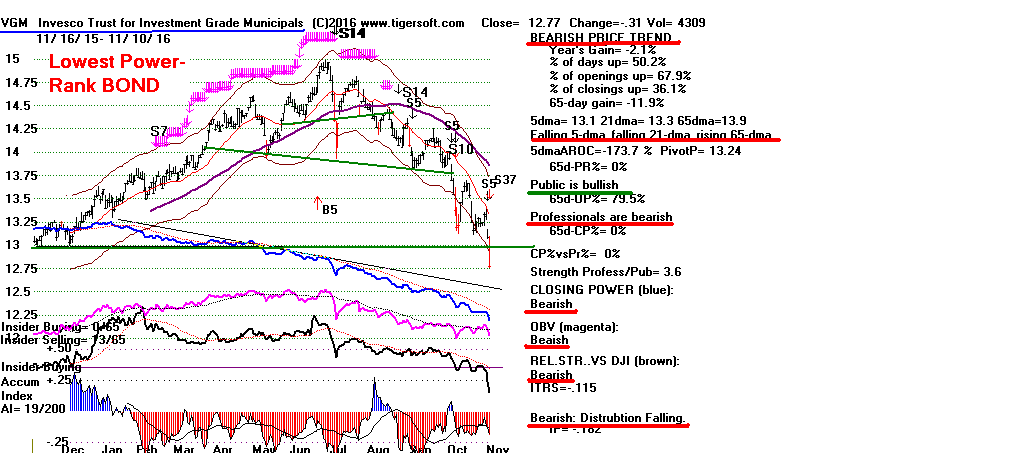
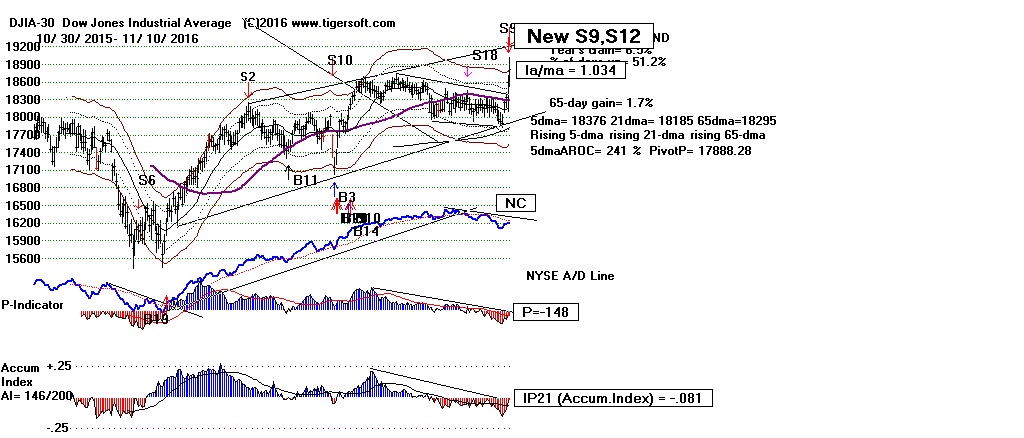


The DJI rose another 218 points today, but there were 227 more
decliners
than advancers on the NYSE. By Peerless rules for "clinching" a Sell
S9,
this invokes yesterday's Sell S9. Because the DJI closed 3.4% over the
21-day
ma with the Tiger Accum. Index at a -.01, Peerless also gave a Sell S12
today..
The history of combined S9/S12s in rising markets is quite bearish. It
is
also quite reliable. Below are all the cases where this combination
occurred
in rising markets since 1928.
S9-S12s: total 24 earlier cases
Losses and Gains on Shorting DJI on second Sell.
Losses = 3
Gains 4% to +8% = 7
Gains 8% to +12% = 5
Gains 12% to 20% = 2
Gains >20% = 3
Median Gain = > +8%
Paper Losses
None = 7
0% to +1% = 4
1% to +2% = 5
2% to +3% = 4
3% to +4% = 3
4.3% = 1
Peerless S9s and S12s in Bull Markets.
| |
Date          Signal         DJI          Gain from    Paper
                                          Selling      Loss
                                          Short

19290130      S12            312.6         .039
19290201      S9             319.7         .06         0.8%
19290426      S9             314.2         .066
19290430      S12            319.3         .081        2.2%
19290614      S9             313.7        -.047
19290617      S12            319.3        -.029        2.9%
19290828      S12            372.1         .436
19290903      S9             381.2         .45         none
19340404      S12            103.2         .11
19340412      S9             104.8         .124        1.7%
--------------------------------------------------------------------------
19340821      S9             92.6          .036
19340821      S12            92.6          .036        3.1%
19340927      S9             93.4         -.02
19341005      S12            92.9         -.026        2.6%
19380107      S9             128.2         .039
19380114      S12            131.8         .065        none
19380413      S9             114.9         .048
19380419      S12            116.3         .053        none
19561206      S9             492.7         .062
19561206      S12            492.7         .062        1.4%
----------------------------------------------------------------------------
19590701      S9             650.2         .019
19590701      S12            650.2         .019        4.3%
19660106      S9             985.46        .213
19660106      S12            985.46        .213        1.0%

19710826      S9             906.1         .088
19710831      S12            898.07        .08         3.7%
19720803      S9             947.7         .027
19720804      S12            951.76        .032        2.3%
19730108      S9             1047.86       .114
19730111      S12            1051.7        .118       none
---------------------------------------------------------------------------
19750829      S9             835.34        .048
19750829      S12            835.34        .048        0.4%
19870506      S9             2342.19       .052
19870506      S12            2342.19       .052       none
19870608      S12            2351.64      -.04
19870609      S9             2352.7       -.039       3.9%
19871001      S9             2639.2        .341
19871002      S12            2640.99       .342       none
19980708      S9             9174.97       .168
19980708      S12            9174.97       .168       1.8%  7/17

----------------------------------------------------------------------------
19990817      S9             11117.07      .099
19990817      S12            11117.07      .099       1.9%  8/25
20071206      S12            13619.89      .099
20071207      S9             13625.58      .099       0.7%  12/10
20110630      S12            12414.34      .075
20110705      S9             12569.87      .086       1.2%  7/21
20111205      S9             12097.83      .027
20111207      S12            12196.37      .035       none
=========================================================================
   S9-S12s: total 24 earlier cases
   Losses and Gains on Shorting DJI on second Sell.
   Losses = 3
   Gains 0% to +4% = 4
   Gains 4% to +8% = 7
   Gains 8% to +12% = 5
   Gains 12% to 20% = 2
   Gains >20% = 3
|
|
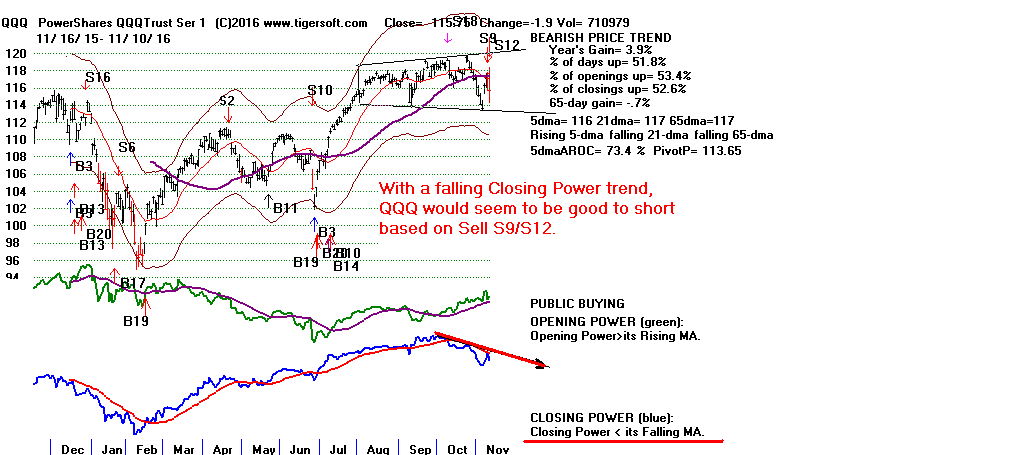
Appropriately, we now see megaphone price patterns in SP-500 and NASDAQ.
These usually appear at the end of bull markets. They show markets
out of control, rushing quickly from one extreme to another.
Interesting, the closest parallel to the present was in 1980-1981,
when the Republican Reagan took the White House away from
the Democrat Jimmie Carter. It took a series of wilder and wilder
swings within its megaphone (broadening top pattern) to finally
set up the Bear Market of 1981-1982. There is one big difference.
Reagan did not command a Republican majority in the House and
the Senate. (
https://en.wikipedia.org/wiki/Party_divisions_of_United_States_Congresses )
Closest Historical Parallel to Present in 1980-1981

Continuing Protests and Scathing New York Times Criticisms
Of Trump Campaign Positions Warns Us How Polarized The US now is.
Trump, a minority President, can call for a national "coming together" and
a "healing of differences", but it's not clear how and if he can make that
happen.
His blaming the media for the protests and accusing protestors of being
"paid professionals" does not bode well or seem seem like a good way to
bring about a new tranquility.
NY Times: "Donald
Trump Could Put Climate Change on Course for 'Danger Zone' "
By CORAL DAVENPORT President-elect Trump has vowed to cancel the Paris
climate accord, jeopardizing what scientists say is a critical 3.6-degree
irreversible temperature target.
OPINION
|
Op-Ed | Steven Rattner
NY Times: "Trump's
Economic Prescription. First: Do Harm."
By STEVEN RATTNER Plans for tariffs, tax breaks and immigration could push
up inflation, shift more money to the wealthy, increase deficits and cost
blue-collar jobs.
CBS:
Riot declared in Portland, Oregon amid new wave of anti-Trump demos

MEGAPHONE PATTERNS, LIKE DJI NOW SHOWS, WARN THAT
A BEAR MARKET IS NOT FAR AWAY.
Appropriately, we now see megaphone price patterns in SP-500 and NASDAQ.
These usually appear at the end of bull markets. They show markets
out of control, rushing quickly from one extreme to another.
Interesting, the closest parallel to the present was in 1980-1981,
when the Republican Reagan took the White House away from
the Democrat Jimmie Carter. It took a series of wilder and wilder
swings within the megaphone (broadening top pattern) to finally
set up the Bear Market of 1981-1982. There is one big difference.
Reagan did not command a Republican majority in the House and
the Senate. (
https://en.wikipedia.org/wiki/Party_divisions_of_United_States_Congresses )
Links to Charts
Peerless
DJIA and A/D Line DJI-OBVPCT
Hourly DJIA
S&P
OEX
NYSE
NASDAQ
DIA QQQ SPY
IWM
Short-Term Rates
DJI-Utilities
REITS
A/D Line-6000 Stocks
SOXL TECL
FAS
Crude Oil
Oil/Gas Stocks
Bullish MAXCPs
Bearish
MINCPs
Stocks:
AAPL, BIDU,
IBM, TXN
Bank Stocks - DB (Deutsche
Bank), WFC (Wells Fargo), GS (Goldman Sachs),
AMGN
AMZN, FB
ETFS:
BBH, BRZU,
DIA, DUST,
FAS, GASL,
GLD, IWM,
JETS,
JNUG, KOL, MDY,NUGT
OIH, RETL,
RSX, SLV,
SOXL, TECL,
TMF, TNA,
UGAZ, UPW,
VGK, YINN
 RANKING OF KEY DIRECTORIES BASED PCT.OF STOCKS ABOVE 65-DMA
11/10/16
---------------------------------------------------------------------------------------
Directory     Current       day-1         day-2         day-3         day-4         day-5
----------------------------------------------------------------------------------------
BIGBANKS       1             1             .857          .857          .857          .857
EDU            1             .875          .75           .625          .625          .75
REGBANKS       .972          .972          .694          .694          .5            .5
INFRA          .909          .909          .818          .727          .454          .454
COAL           .888          1             .777          .888          .888          .888
FINANCE        .802          .758          .593          .56           .395          .439
INSURANC       .771          .628          .4            .342          .228          .228
JETS           .75           .833          .833          .833          .583          .583
MILITARY       .711          .653          .365          .365          .25           .211
TRANSP         .689          .62           .551          .586          .31           .31
GAMING         .666          .555          .555          .555          .555          .555

INDMATER       .656          .617          .519          .46           .382          .411
DOWJONES       .633          .566          .433          .333          .2            .2
SP-100         .618          .587          .474          .412          .237          .257
CHEM           .56           .512          .402          .39           .304          .341
INDEXES        .543          .523          .422          .38           .263          .259
SP500          .527          .486          .442          .397          .249          .247
ELECTRON       .523          .532          .506          .476          .351          .364
HACKERS        .523          .428          .333          .38           .19           .238
COMPUTER       .518          .481          .444          .407          .333          .222
NIFTY          .514          .571          .514          .542          .314          .342
RETAIL         .5            .333          .277          .259          .148          .129

RUS-1000       .497          .473          .419          .391          .261          .253
SEMI           .492          .529          .536          .514          .345          .389
FOOD           .466          .6            .8            .733          .466          .4
NASD-100       .446          .5            .414          .393          .244          .255
SOFTWARE       .432          .447          .388          .462          .283          .268
BIOTECH        .429          .358          .195          .179          .125          .097
AUTO           .425          .225          .225          .2            .125          .1
OILGAS         .418          .418          .325          .308          .244          .273
COMODITY       .385          .4            .428          .371          .314          .342

GREEN          .29           .29           .29           .29           .225          .225
HOMEBLDG       .222          .111          .166          .111          .055          .111
PIPELINE       .222          .222          .111          .111          .111          .111
REIT           .182          .187          .167          .162          .106          .081
CHINA          .177          .278          .303          .265          .164          .202
GOLD           .175          .228          .175          .175          .245          .263
BEVERAGE       .142          .19           .38           .238          .047          .095
SOLAR          .117          .176          .352          .294          .117          .176
UTILITY        .108          .304          .586          .478          .239          .26
ETFS           .102          .25           .382          .308          .147          .176
BONDFUND       0             .008          0             .017          .026          .008
HOSPITAL       0             0             .5            .5            0             0
|
================================================================
11/9/2016
Classic Post Presidential Rally
Give
It More Chance To Play Out.
New Sell S9. I suggest only deploying today's Sell S9 when daily NYSE
decliners
exceed advancers at the close over the next few days provided we do not get
a new Peerless Buy signal in the interim.
Every time that a Republican has replaced a Democrat in the White House
since
1945, the DJI has made excellent short-term gains.
With a Republican majority
in the House of Representatives and the Senate, the new President Trump
Administration
should be in a position to bring about much bigger changes than Obama was able
to, Unfortunately,
historically, the odds are we will be in a bear market next year. In that
connection,
note today's new Sell S9. While this is bearish, it often takes several
new Peerless
Sells to reverse a bull market and bring on a bear market. The real news
today is how
much switching of portfolio mixes is now under way. Hospital Stocks,
foreign ETFs,
Bonds are being sold and Biotechs, Military Stocks and the Elite Infrastructure
Stocks
are being eagerly bought. This has brought about a jump in trading volume.
When A Republican Replaces A Democrat.
1952 - Rally until end of year.
Then 10% Decline to June 1953.
1968 - Rally until end of November.
Then Bear Market until May 1970.
1980 - Rally until Thanksgiving and then zig-zags back and forth
between bands until May 1981
followed by a bear market until August 1981. .
2000 - quick rally to upper band.
Bear Market then began. It did not end until March
2003.
A wild Trump-Rally is upon us. Volume was the highest it has been in two
months.
The DJI gained 1000 points from its low in pre-opening trading to its close.
This caused
big jumps in our Closing Powers. The key ETFs' Closing Powers downtrends
were all broken.
Professionals are now net buyers. The DJI closed
for the second day in a row above its 65-dma.
This last development should cancel the Sell S18.
New Peerless S9 - Delay Using It.
But today's breadth on the NYSE was not impressive. There were only 312
more up than
down on the NYSE even though the DJI rose 250. This brought us a new
Peerless Sell S9.
This occurs when the DJI closes 2.4% over the 21-day ma and the P-Indicator (the
21-day ma
of NYSE Advances minus Declines) is negative. We
usually delay deploying this signal
until the NYSE decliners are greater by 24 ore more than advancers at the close.
This is
done because sometimes the DJI and the broad market take off and there are
soon new Peerless buy
signals. The most famous case of this was in June 1987. I think we
must delay using the
the Sell S9 here, too. Another reason for not jumping to quickly on this
Sell S9, is that
there has been only one case of a November Sell S9 in a bull market. That
was on November 14, 1980.
It did a bring a 5.3% drop in the DJIA.
DJI closed 2.4% over the 21-dma with the P-Indicator a
-225.
Coupled with weak readings elsewhere, this is what brings the Sell S9.
Note the big jump in volume.

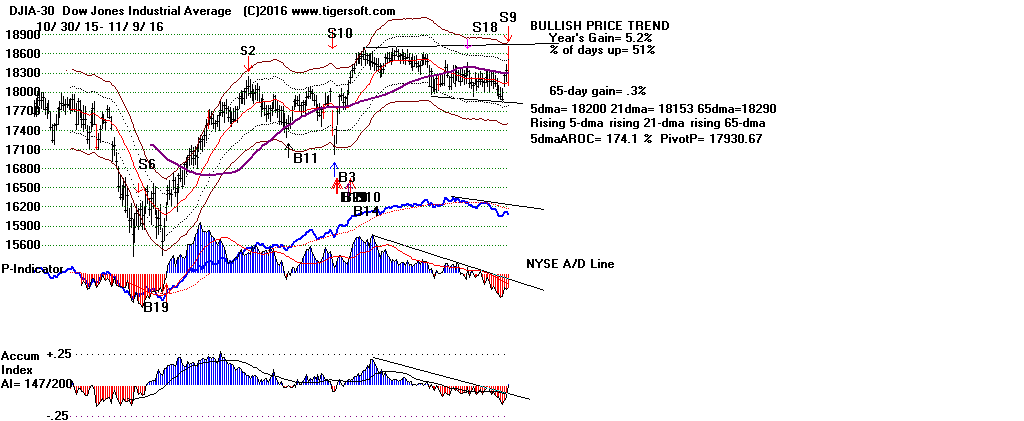


I mentioned SPY's megaphone pattern. The
NASDAQ also shows one.
Technically, this pattern develops when prices swing wildly from well-tested
falling support to the well-tested rising resistance. This appears to
be the situation we are in now. I would not be short IWM here. In fact,
its rising much
above its neckline at 120 was where it should have been covered.
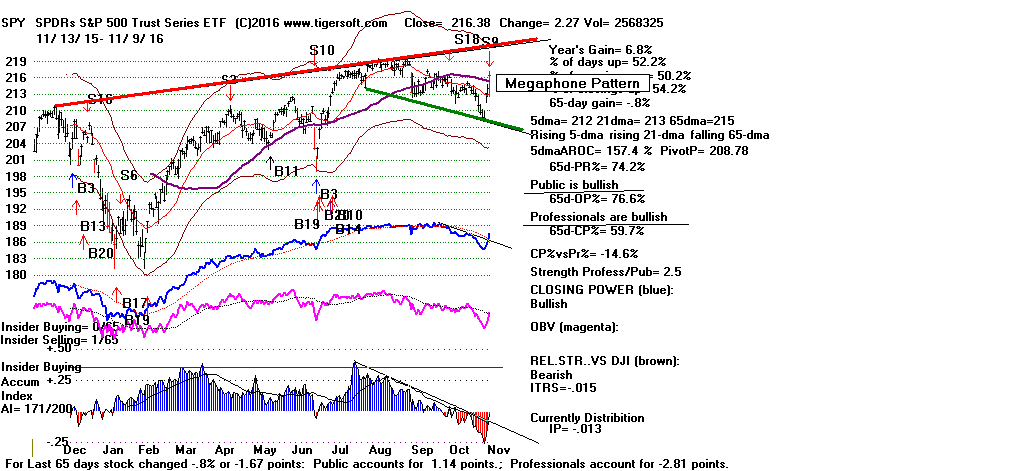
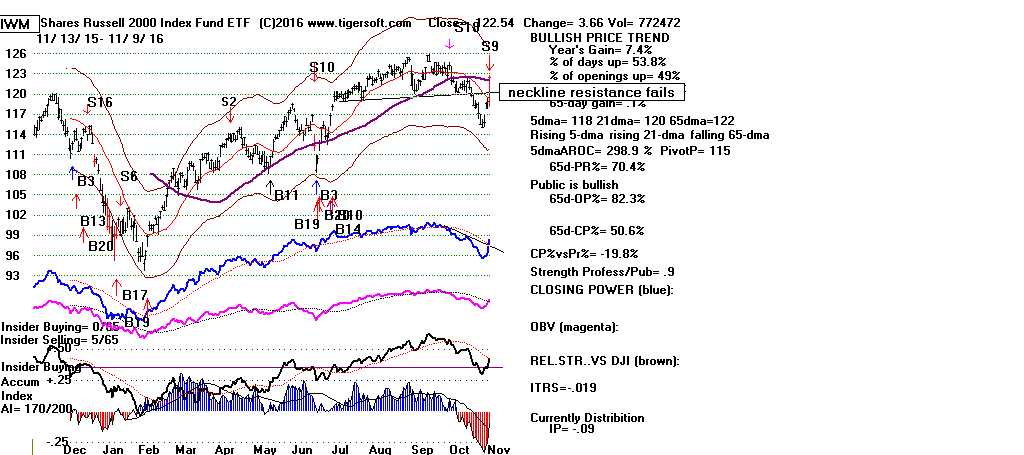
THE BIG NEWS TODAY
The big story today is the huge amount of hasty rearranging portfolios to try to
match
the new President Trump's declared priorities. New Military and
Infrastructure spending
coupled with tax cuts for business will bring a big deficit for a while.
That means more inflation
and new borrowing demand. Both of these will bring higher interest rates.
Bonds (which we
are short) and utilites fell sharply today.
A lot of money is being re-deployed in stock groups expected to benefit from a
new Trump
Administration. Meanwhile, hospital stocks were dumped today because of
the likely end of
Affordable Care but drug stocks did great because it was expected that they
would no
longer be under Democrats' criticism for raising prices.
Trumps' stress on the military and gun ownership also played a role in the heavy
volume
switching around of portfolios. The Morningstar Security sector
(MG766)rose +10% today.
This was the biggest rise among Morningstar sectors. The second biggest
gain was Biotechs
(MG 516), which rose 8% today. Almost as strong today were Mornngstar's
Metal
Fabrication (MG 627) and Heavy Construction (MG 636). (Download MORNSTAR
from
our Tiger Data page).
I have created a special INFRAstructure group for easier tracking of these
stocks.
Look at the size of the gains in the leading stocks in this group: CAT
+6.52,
EXP (Eagle Materials) + 7.21, GVA (Granite Construction) + 5.23,
NUE (Nucorp Steel and Iron) +6.25, STLD (Steel Dynamics) + 2.84 and
(Vulcan Materials) + 11.82. This is the sector I would place new
investments in.
There is a massive amount of infrastructure re-building that is needed.
Trump is
a builder. This is what he wants to be his legacy. I expect he will
easily get Republican
and Democrat support for his plans.
INFRASTRUCTURE BOOM AHEAD?
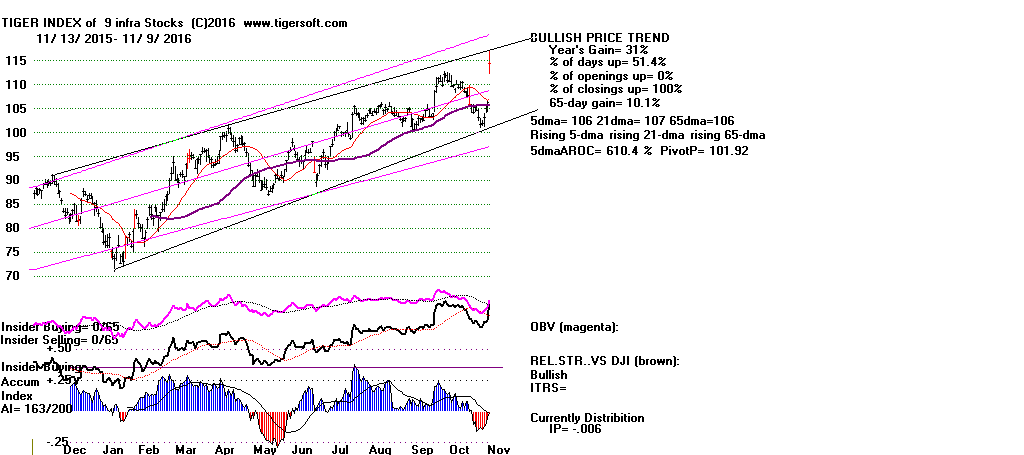
HOSPITALS STOCKS DECLINE
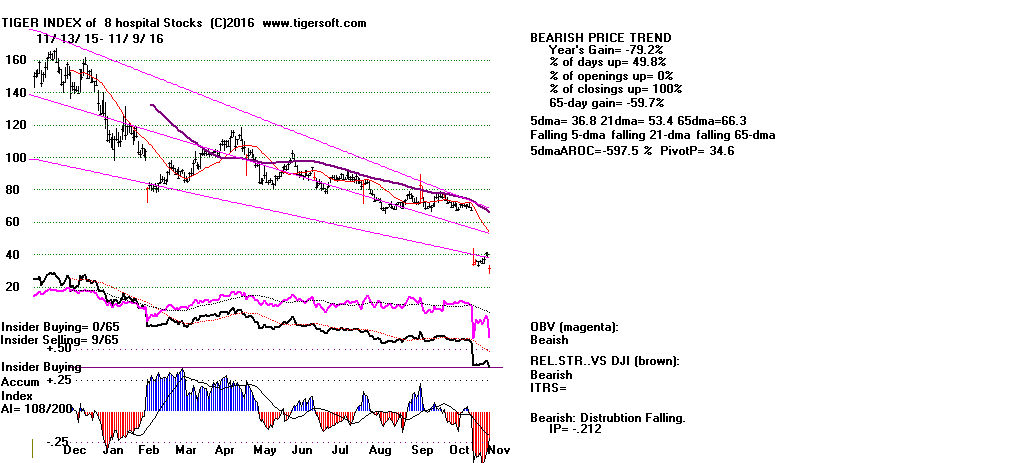
Links to Charts
Peerless
DJIA and A/D Line DJI-OBVPCT
Hourly DJIA
S&P
OEX
NYSE
NASDAQ
DIA QQQ SPY
IWM
Short-Term Rates
DJI-Utilities
REITS
A/D Line-6000 Stocks
SOXL TECL
FAS
Crude Oil
Oil/Gas Stocks
Bullish MAXCPs
Bearish
MINCPs
Stocks:
AAPL, BIDU,
IBM, TXN
Bank Stocks - DB (Deutsche
Bank), WFC (Wells Fargo), GS (Goldman Sachs),
AMGN
AMZN, FB
ETFS:
BBH, BRZU,
DIA, DUST,
FAS, GASL,
GLD, IWM,
JETS,
JNUG, KOL, MDY,NUGT
OIH, RETL,
RSX, SLV,
SOXL, TECL,
TMF, TNA,
UGAZ, UPW,
VGK, YINN
 RANKING OF KEY DIRECTORIES BASED PCT.OF STOCKS ABOVE 65-DMA
    Example  ".972 " = 97.2%

                                         11/9/16
---------------------------------------------------------------------------------------
Directory     Current       day-1         day-2         day-3         day-4         day-5
----------------------------------------------------------------------------------------
BIGBANKS       1.0           .857          .857          .857          .857          .857
COAL           1.0           .777          .888          .888          .888          .888
REGBANKS       .972          .694          .694          .5            .527          .472
INFRASTRUCTURE .888          .777          .666          .555          .555          .333
EDU            .875          .75           .625          .625          .75           .75
JETS           .833          .833          .833          .583          .583          .583
FINANCE        .758          .593          .56           .395          .439          .45
MILITARY       .653          .365          .365          .25           .23           .25

INSURANC       .628          .4            .342          .228          .228          .257
TRANSP         .62           .551          .586          .31           .31           .344
INDMATER       .617          .519          .46           .382          .411          .372
FOOD           .6            .8            .733          .466          .4            .533

SP-100         .587          .474          .412          .237          .247          .309
NIFTY          .571          .514          .542          .314          .342          .371
DOWJONES       .566          .433          .333          .2            .2            .233
GAMING         .555          .555          .555          .555          .555          .555
ELECTRON       .532          .506          .476          .351          .36           .364
SEMI           .529          .536          .514          .345          .382          .367
INDEXES        .523          .422          .38           .263          .259          .255
CHEM           .512          .402          .39           .304          .329          .353
NASD-100       .5            .414          .393          .244          .255          .297

SP500          .486          .442          .397          .249          .245          .273
COMPUTER       .481          .444          .407          .333          .222          .37
RUS-1000       .473          .419          .391          .261          .252          .266
SOFTWARE       .447          .388          .462          .283          .268          .328
HACKERS        .428          .333          .38           .19           .238          .238
OILGAS         .418          .325          .308          .244          .273          .273
COMODITY       .4            .428          .371          .314          .342          .342
BIOTECH        .358(big jump).195          .179          .125          .097          .125
RETAIL         .333          .277          .259          .148          .129          .148
ALL STOCKS     .33

UTILITY        .304          .586          .478          .239          .26           .173
GREEN          .29           .29           .29           .225          .225          .29
CHINA          .278          .303          .265          .164          .202          .177
ETFS           .25           .382          .308          .147          .176          .191
GOLD           .228          .175          .175          .245          .263          .157
AUTO           .225          .225          .2            .125          .1            .15
PIPELINE       .222          .111          .111          .111          .111          .111
REIT           .191          .171          .166          .111          .08           .075
BEVERAGE       .19           .38           .238          .047          .095          .095
SOLAR          .176          .352          .294          .117          .176          .294
HOMEBLDG       .111          .166          .111          .055          .111          .055
BONDFUND       .008          0             .017          .025          .008          .008
HOSPITAL       0             .5            .5            0             0             0
|
==================================================================
11/8/2016 Now
we know why the technicals were so weak: i.e., why we have a
Sell S18 from
Peerless, why the Tiger Closing Power and
Day Traders Tool are in clear
downtrends,
why fewer than 33% of all stocks are below their 65-dma and why the Russell-2000
(IWM)
has completed such an obviously bearish head and shoulders pattern. In
over-night trading,
the DJI fell to 17500 and the lower band. The pollsters and pundits didn't
just get the
outcome of the Presidential wrong, they got it massively wrong. Trump has
won the Electoral
College in a landslide. And, below the radar-screen for most,
short-term interest rates made
another new high today. This will also weight on the market.
Stay short IWM for now. We need to see how the market closes tomorrow.
Surprises
and whip-saws like this often take at least a week to play out. See below
how the unexpected
victory of Truman over Dewey affected the market.
What does the Trump victory mean? Surely it will help
RSX (Russia) and
hurt the Peso
and the Mexican ETFs. Otherwise, we will need some time to assess the
repercussions.
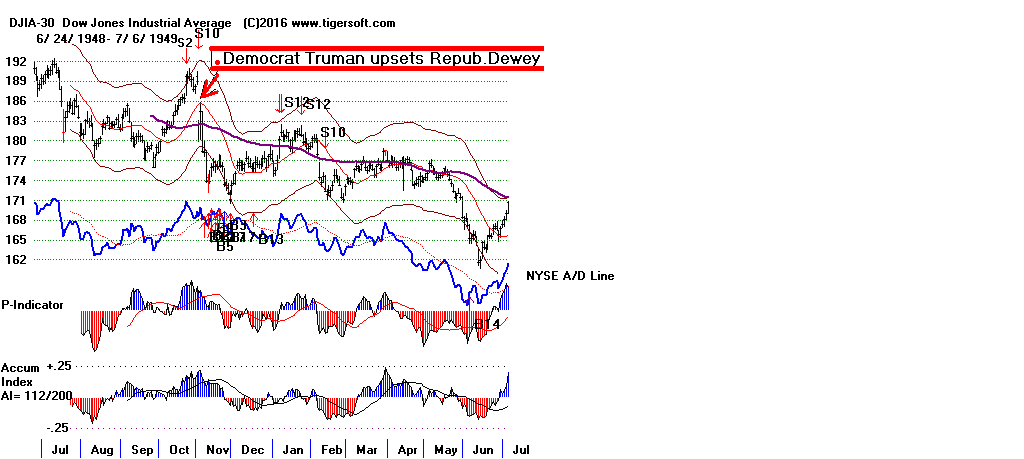
IWM's top
formation.
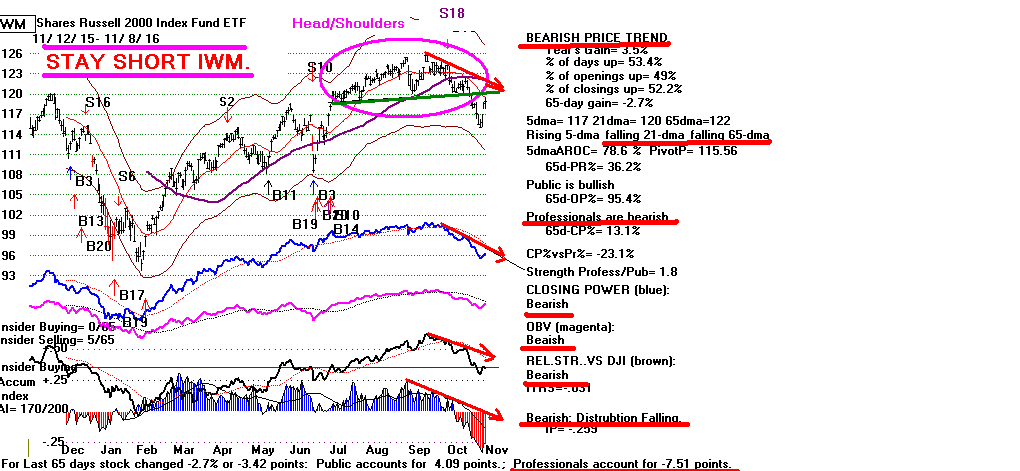

What happens when a Republican
takes over the White House from a Democrat?
There is a fairly clear pattern here. The market usually rallies immediately
after the Election
but then slumps badly in the next year.
1920 - A bear market had already begun...no rally until Mid-December.
1952 - rally until end of year.
1968 - rally until end of November.
1980 - rally until Thanksgiving and then zig-zags back and forth.
2000 - quick rally to upper band.
Stay short
the weakest Bonds.
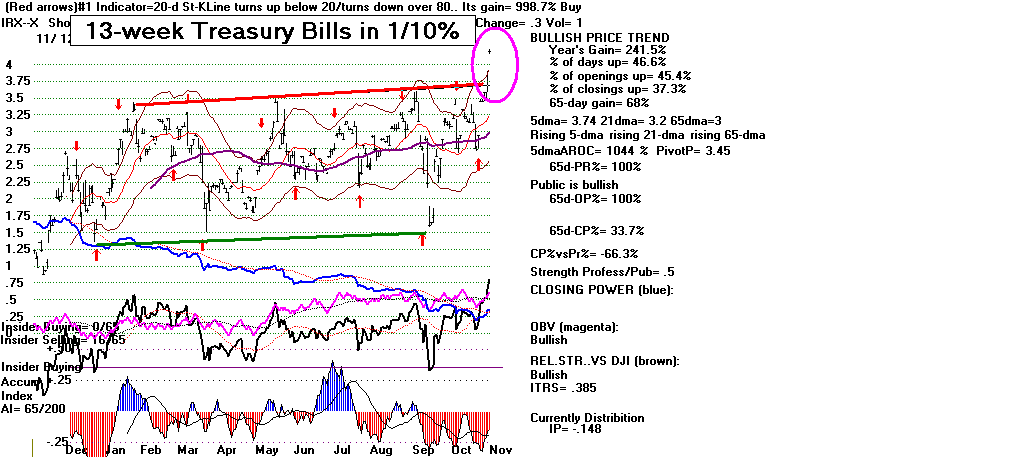
Links to Charts
Peerless
DJIA and A/D Line DJI-OBVPCT
Hourly DJIA
S&P
OEX
NYSE
NASDAQ
DIA QQQ SPY
IWM
Short-Term Rates
DJI-Utilities
REITS
A/D Line-6000 Stocks
SOXL TECL
FAS
Crude Oil
Oil/Gas Stocks
Bullish MAXCPs
Bearish
MINCPs
Stocks:
AAPL, BIDU,
IBM, TXN
Bank Stocks - DB (Deutsche
Bank), WFC (Wells Fargo), GS (Goldman Sachs),
AMGN
AMZN, FB
ETFS:
BBH, BRZU,
DIA, DUST,
FAS, GASL,
GLD, IWM,
JETS,
JNUG, KOL, MDY,NUGT
OIH, RETL,
RSX, SLV,
SOXL, TECL,
TMF, TNA,
UGAZ, UPW,
VGK, YINN
Hillary's loss should not have come as such a surprise. Why else are coal
stocks
so strong and solar energy stocks so weak? After all these years, I should
have believed the
technicals not the "talking heads" on TV. Usually I don't listen to
them but they
were so non-stop, so ubiquitous and so sure of their polls. Just like in
the Brexit vote,
pollsters mis-sampled and failed to fathom the discontent with the
Establishment.
It's easy now to see that for many of the powerless, forgotten and
disenfranchised, voting
for Trump was seen as one of the few ways they could strike back at the
Establishment. So,
it should not have been such a surprise.
I did mention that no Democrat has ever succeeded a living Democrat to the White
House.
This can't be a coincidence. Most of all, I should known better.
Growing up in the MidWest,
I should never have underestimated the anger felt towards the Wall
Street-Democrats
who have long put their own free trade profits ahead of Main Street.
Below is a picture of
an abandoned factory near where I grew up in Cincinnati.

Empty factory floor at
Stearns and Foster in Cincinnati.
View
RANKING OF ALL KEY DIRECTORIES FOR PCT OF THEIR STOCKS
ABOVE THEIR 65-DMA.
(New Tiger software lets you rank any set of directories you may wish to
and get a report like the one below. Steps to take. Go to TigerSoft
ESP Page
and download latest Peerless update (includes the new Peerless S18 and
Ranking as shown below. If you do not have an ESP Subscription and would
like this update, otherwise, send me an email. Hotline subscribers who
have TigerSoft
may get this update for $85.00.)
Directions
Create c:\peerless\KEYDIRS.txt
with Notepad/Windows.
This is your editable list of your Tiger directories to be ranked.
EDIT it as needed. Be sure that all Tiger
directories designated in it
are updated to these latest date. When opened, it should look something
like the
one shown below. Use only the names of the updated Directories. Do
not
insert prefix or suffix. All the names listed in it should be
left-justified.
FINANCE
ETFS
GOLD
OILGAS
UTILITY
With the new Peerless installed, run the new Directory Ranker with
these Tiger/Peerless commands:
Peercomm + Charts-2016 + RunSetups + Rank
Directories for Pct. over 65-dma.
Look at results by opening in WINDOWS, the new
created
C:\PEERLESS\RANKDIRS.txt
--------------------------------------------------------------------------------------------------------------
11/7/2016
Which Will Win Out Here?
Politics or Technicals? My guess is that we will
soon see the DJI charge up to the upper 3% band, assuming Hillary wins.
There we
may get a Sell S9/S12. The still extant Peerless S18 warns, however, not
to
trust the rally. Be very selective. (See the recommendations of
yesterday.)
Watch the Short-Term Interest Rates' charts. It appears
that
the Fed will be
raising rates in December. See
below their new high made today.
In all the excitement of the Elections, not many noticed this bearish
development.
Accordingly, too, Bonds did not rise today.
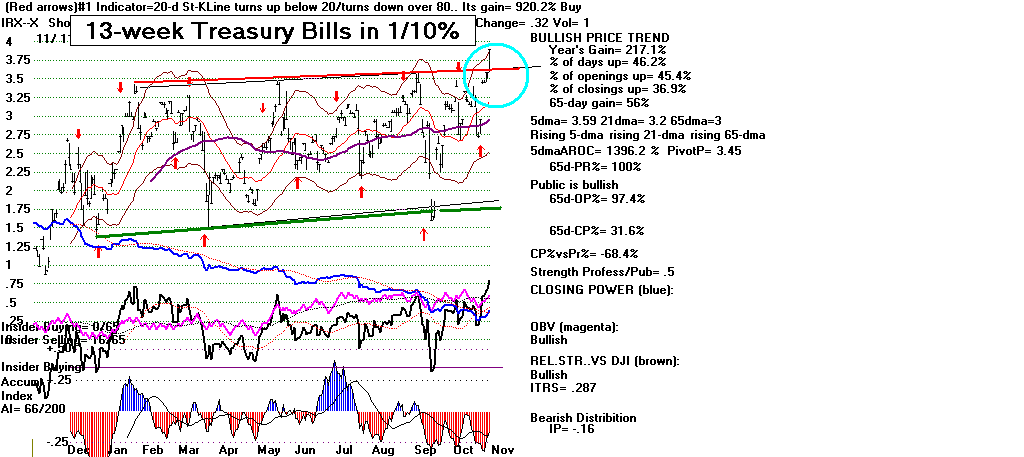
Since 1945, when a Democrat is elected the market usually makes a good run
upwards in November after the Election and another even bigger advance in the
following year. The odds are 5:2 historically of this happening.
But is Hillary
popular enough to bring on a burst of partisan buying? She is
very popular where
it counts: namely, at the biggest Wall Street banks (where 85.7% of them
are
well above their 65-dma compared to only 31% of all stocks) and with many of
the biggest corporations, like Boeing (which has out-performed the DJI by 9%
over the last 50 trading days). GS and BA are among the highest priced and
thus most weighted DJI-30 components.
Were it not Presidential Election time, the big +2% DJI gain today would seem
like a "relief" rally in a bear market, given that the SP-500 had just fallen 9
straight
days. As is often true in a bear market, volume today was less on the big
up-day
than on Friday on the NYSE. From a Peerless technical viewpoint, we need
much
more proof that this is the start of a much bigger rally. All the Key
Peerless
Indicators are quite negative despite the DJI's being 0.7% over its 21-day
ma. See below the key values at the top of the Peerless DJI chart for
today.
A quick, additional 1.8% DJI gain would almost certainly bring a bearish Sell
S9/S12.
The SPY chart shows that that key ETF's Closing Power and the
Tiger Day Traders' Tool are still falling. But we do see a potential
"megaphone"
or broadening pattern in the SPY chart. And we know that towards the end
of bull
markets, the tops are made from Opening Power strength with the Closing Power
lagging. See the SPY charts for 1997,
1998, 2000,
2001, 2002,
2007, 2008 and
2015.
So, perhaps, a Hillary victory will bring
about a big enough partisan celebration
to produce a Peerless Sell at the upper band.
Wall Street
and most big corporations
should be very pleased to have as President someone
who believes in back-room
private deals and readily accepts large contributions
to a family foundation in exchange
for favors to businesses.
It will be fascinating to see her Cabinet choices. Will they also be the
ones favored
by Citi-Bank (as happened in 2008 with Obama just elected) or by
Goldman Sachs
(whose stock is very strong now that Hillary looks like the winner. (Thank
you
Wiki-Leaks (and Russia, too, maybe) for letting us see how political sausages
are really
made with the Clintons in power...Wikileaks has released
35,594 Podesta emails since
October 7th
http://www.cnn.com/2016/10/27/politics/bill-clinton-inc-foundation-wikileaks-emails/
Oct 28, 2016 - Podesta's
hacked email contained foundation details...Hillary Clinton's State
Department emails
points to a "rampant pay-to-play culture". Do a Google
search of Clinton and "Pay for Play".
1)
WIKILEAKS: Podesta Called Foreign Money 'Currying Favor',
2)
124 References to 'Pay for Play' and 'Quid Pro'
3)
Clinton Foundation's 'Pay-To-Play' With Ukraine Oligarch
)
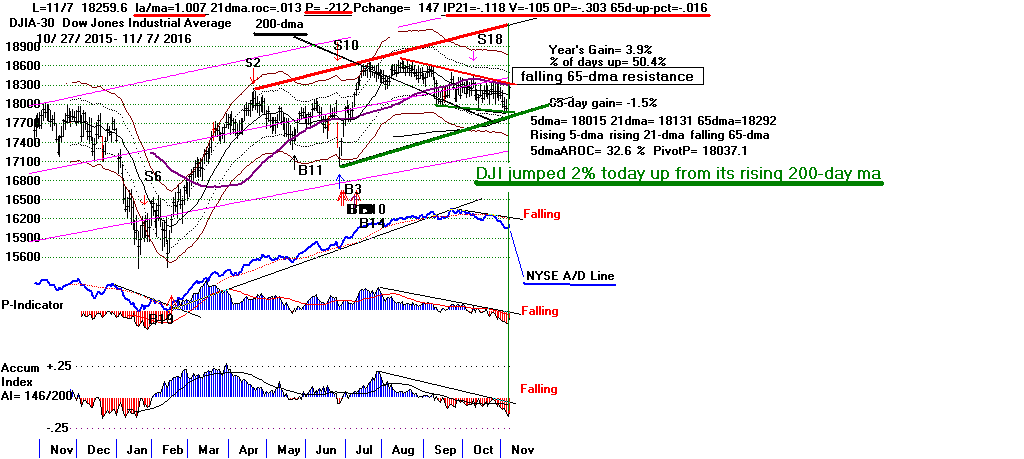
Links to Charts
Peerless
DJIA and A/D Line DJI-OBVPCT
Hourly DJIA
S&P
OEX
NYSE
NASDAQ
DIA QQQ SPY
IWM
Short-Term Rates
DJI-Utilities
REITS
A/D Line-6000 Stocks
SOXL TECL
FAS
Crude Oil
Oil/Gas Stocks
Bullish MAXCPs
Bearish
MINCPs
Stocks:
AAPL, BIDU,
IBM, TXN
Bank Stocks - DB (Deutsche
Bank), WFC (Wells Fargo), GS (Goldman Sachs),
AMGN
AMZN, FB
ETFS:
BBH, BRZU,
DIA, DUST,
FAS, GASL,
GLD, IWM,
JETS,
JNUG, KOL, MDY,NUGT
OIH, RETL,
RSX, SLV,
SOXL, TECL,
TMF, TNA,
UGAZ, UPW,
VGK, YINN
ViewRANKING OF ALL KEY DIRECTORIES FOR PCT OF THEIR STOCKS
ABOVE THEIR 65-DMA.
(New Tiger software lets you rank any set of directories you may wish to
and get a report like the one below. Steps to take. Go to TigerSoft
ESP Page
and download latest Peerless update (includes the new Peerless S18 and
Ranking as shown below. If you do not have an ESP Subscription and would
like this update, otherwise, send me an email. Hotline subscribers who
have TigerSoft
may get this update for $85.00.)
Directions
Create c:\peerless\KEYDIRS.txt
with Notepad/Windows.
This is your editable list of your Tiger directories to be ranked.
EDIT it as needed. Be sure that all Tiger
directories designated in it
are updated to these latest date. When opened, it should look something
like the
one shown below. Use only the names of the updated Directories. Do
not
insert prefix or suffix. All the names listed in it should be
left-justified.
FINANCE
ETFS
GOLD
OILGAS
UTILITY
With the new Peerless installed, run the new Directory Ranker with
these Tiger/Peerless commands:
Peercomm + Charts-2016 + RunSetups + Rank
Directories for Pct. over 65-dma.
Look at results by opening in WINDOWS, the new
created
C:\PEERLESS\RANKDIRS.txt
====================================================================================================
11/4/2016
The Hillary Victory Rally appears to have begun a day early. Wikileaks shows just how
important a Clinton victory is to many very big corporations and banks.
But I
still trust our technical indicators. I think that we will mostly have to
wait a few
days to see if the Closing Power downtrend-lines are violated to Buy. This
is
because of how pronounced has been the recent daily pattern of Big Money selling
soon after nice early gains. Let's see if the same pattern reappears over
the next
few days.
What Happens To DJI When Democrat Wins White House?
Since World War II, there have been 5 cases of a market rally into the middle
of November or later when a Democrat was elected and two cases where the
market declined significantly. In 1960, 1964, 1992, 1996 and 2012, a
Democrat
victory brought very tradable DJI rallies for at least three months into the
following year. So, I think that we do not want to be stubbornly bearish
here.
We should also notice that SPY and IWM are recovering from rising 200-day
moving averages. This should help them tomorrow
1948 DJI fell until November 30th.
It rallied feebly five
weeks and
then dropped to a series of new lows until mid June 1949.
1960 DJI advanced to Nov. 10th, pulled back a little
and rose strongly
until mid-May.
1964 DJI advanced to Nov. 18th, then fell back 4%
only to then rise
strongly again until mid-May.
1976 DJI fell 2% in
week after the Election and then rallied
back nearly to its yearly highs by late December.
1992 DJI advanced to Dec. 24th, then fell
back 2% only to then rise
strongly again until the end of May.
1996 DJI advanced to Nov. 25th, then fell
back 4% only to then rise
strongly again until the end of March 10th.
2012 DJI fell below lower 3.5% band on
November 15th. It then
rallied, making new highs until the end of May.
back nearly to its yearly highs by late December.
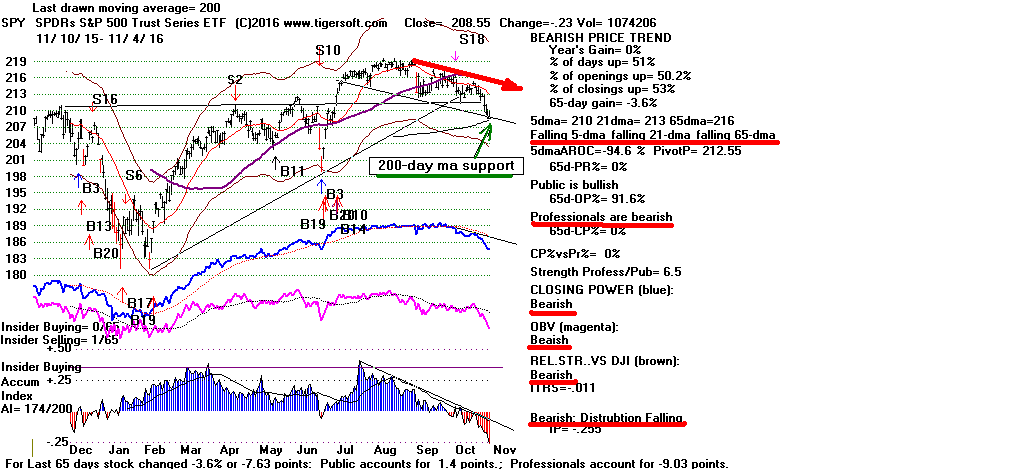

With the S18 operative, let's not go long DIA or SPY until
the DJI closes
back above 18300 (where its falling 65-dma is). I would also want the
OBVPct Indicator to turn clearly positive. (above +.10).
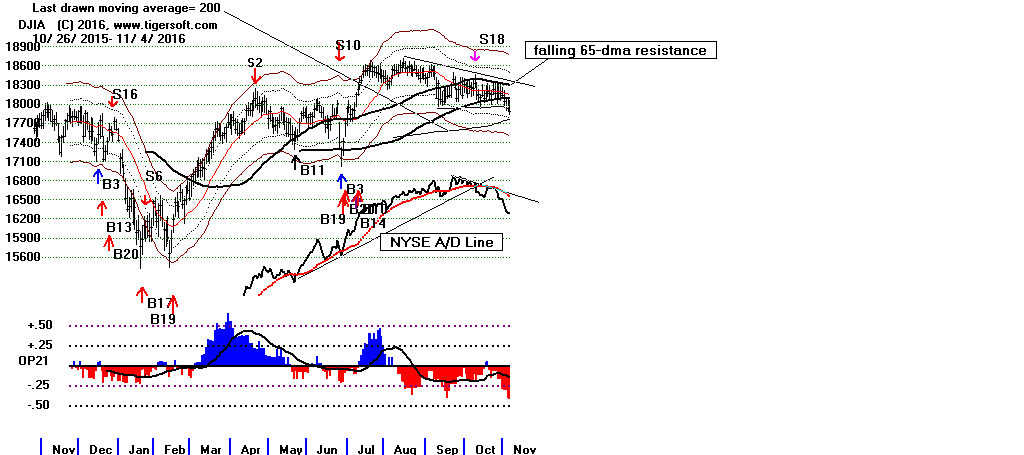
Since we have nice profits in the Biotechs,
cover most of them by tomorrow's close
unless the DJI completely loses all its gains. I have posted some of the
most
Bullish MAXCPs I could find this
weekend, for those who want to stocks to go long
for the likely "Partisian Bounce". Let's stay short
IWM (below). Its head/shoulders pattern
still looks menacing. It could rally briefly to 119-120 and then turn back
down
again because the odds still favor a FED boost in interest rates in December.
See how close short-term rates are to their
highs. So let's also hold the "Bearish
MINCP"
Bonds short.
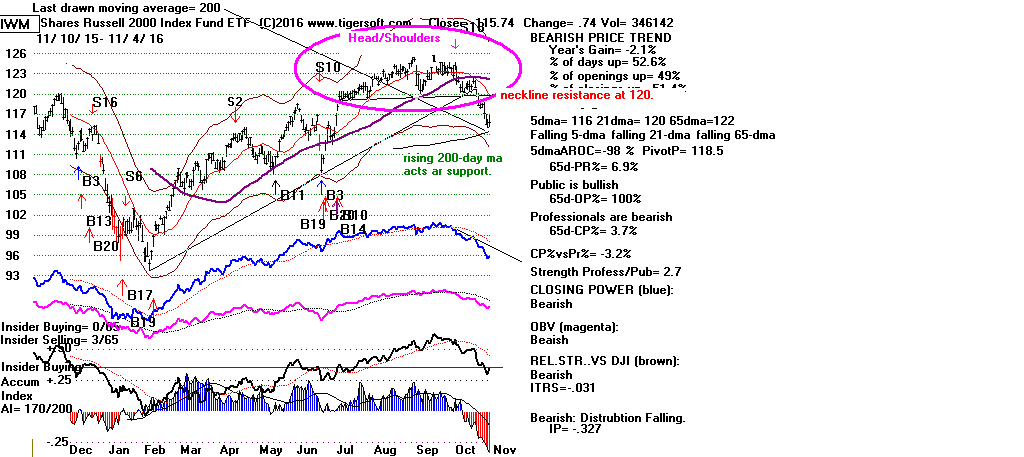
Bullish News
The British Supreme Court's voiding the popular vote for Brexit is
helping drive a
much higher opening. Right now, six hours before the Opening, the
DJI is up +235.
The other big news is that the FBI has exonerated Hillary this weekend. No
charges will
be brought against her for mishandling classified documents by storing them on
her private server. That seems to have been the last barrier to her
re-election.
So she should win easily, despite widespread public distrust.
Pay-for-Play Makes Wall Street Happy.
A Hillary victory is tremendously important to the Wall Street establishment, to
the
many big corporations that she, her husband and John Podesta (campaign manager)
have reciprocating ties with and to the mass media that has supported her
all along. So, if you liked Obama's stock market, you should like
Hillary's too.
Big money will be readily accommodated. This becomes crystal when
you
read some of the many Wikileaks about the Clinton's "Pay for Play." No
wonder, she does not like Russia's Putin. Listen to a youtube report from
one the American journalists using RT.com. By the way, Wikleaks denies
that Russia
provided the documents on
https://wikileaks.org/.
It would have taken professional
hackers to get into Podesta's account. He used his name and the password
"PASSWORD"
to get his emails.
https://www.youtube.com/watch?v=9fat63bqvG8
Links to Charts
Peerless
DJIA and A/D Line DJI-OBVPCT
Hourly DJIA
S&P
OEX
NYSE
NASDAQ
DIA QQQ SPY
IWM
Short-Term Rates
DJI-Utilities
REITS
A/D Line-6000 Stocks
SOXL TECL
FAS
Crude Oil
Oil/Gas Stocks
Bullish MAXCPs
Bearish
MINCPs
Stocks:
AAPL, BIDU,
IBM, TXN
Bank Stocks - DB (Deutsche
Bank), WFC (Wells Fargo), GS (Goldman Sachs),
AMZN, FB
ETFS:
BBH, BRZU,
DIA, DUST,
FAS, GASL,
GLD, IWM,
JETS,
JNUG, KOL, MDY,NUGT
OIH, RETL,
RSX, SLV,
SOXL, TECL,
TMF, TNA,
UGAZ, UPW,
VGK, YINN
RANKING OF ALL KEY DIRECTORIES FOR PCT OF THEIR STOCKS
ABOVE THEIR 65-DMA.
(New Tiger software lets you rank any set of directories you may wish to
and get a report like the one below. Steps to take. Go to TigerSoft
ESP Page
and download latest Peerless update (includes the new Peerless S18 and
Ranking as shown below. If you do not have an ESP Subscription and would
like this update, otherwise, send me an email. Hotline subscribers who
have TigerSoft
may get this update for $85.00.)
Directions
Create c:\peerless\KEYDIRS.txt
with Notepad/Windows.
This is your editable list of your Tiger directories to be ranked.
EDIT it as needed. Be sure that all Tiger
directories designated in it
are updated to these latest date. When opened, it should look something
like the
one shown below. Use only the names of the updated Directories. Do
not
insert prefix or suffix. All the names listed in it should be
left-justified.
FINANCE
ETFS
GOLD
OILGAS
UTILITY
With the new Peerless installed, run the new Directory Ranker with
these Tiger/Peerless commands:
Peercomm + Charts-2016 + RunSetups + Rank
Directories for Pct. over 65-dma.
Look at results by opening in WINDOWS, the new
created
C:\PEERLESS\RANKDIRS.txt
 RANKING OF KEY DIRECTORIES BASED ON PCT.OF STOCKS ABOVE 65-DMA
              11/4/16
---------------------------------------------------------------------------------------
Directory     Current       day-1         day-2         day-3         day-4         day-5
----------------------------------------------------------------------------------------
COAL           .888          .888          .888          1             .888          .888
BIGBANKS       .857          .857          .857          .857          .857          .857
EDU            .625          .75           .75           .625          .625          .75
JETS           .583          .583          .583          .666          .583          .583
GAMING         .555          .555          .555          .666          .555          .555
REGBANKS       .5            .527          .472          .611          .666          .611
--------------------------------------------------------------------------------------------------

FOOD           .466          .4            .533          .466          .6            .666
FINANCE        .395          .439          .461          .516          .593          .626
INDMATER       .382          .411          .372          .411          .48           .46
ELECTRON       .357          .365          .387          .421          .472          .417
SEMI           .345          .382          .389          .441          .485          .433
COMPUTER       .333          .222          .37           .333          .407          .37
COMODITY       .314          .342          .371          .385          .4            .585
NIFTY          .314          .342          .371          .4            .457          .4
TRANSP         .31           .31           .344          .379          .413          .517
CHEM           .304          .329          .353          .365          .451          .414
SOFTWARE       .283          .268          .328          .432          .417          .417
INDEXES        .263          .259          .263          .33           .376          .338
RUS-1000       .262          .253          .268          .303          .351          .316
MILITARY       .25           .23           .25           .307          .365          .346
SP-500         .249          .245          .275          .308          .361          .326
GOLD           .245          .263          .157          .175          .14           .087
NASD-100       .244          .255          .297          .319          .404          .351
OILGAS         .244          .273          .273          .354          .366          .465
UTILITY        .239          .26           .173          .326          .521          .326
SP-100         .237          .247          .309          .34           .412          .371

----------------------------------------------------------------------------------------------------------
ALL STOCKS     .23           .23
----------------------------------------------------------------------------------------------------------
INSURANC       .228          .228          .257          .257          .342          .285
GREEN          .225          .225          .29           .322          .322          .29
DOWJONES-30    .2            .2            .233          .266          .333          .333
HACKERS        .19           .238          .238          .333          .333          .333
CHINA          .164          .202          .177          .227          .215          .379
RETAIL         .148          .129          .148          .148          .148          .148
ETFS           .147          .176          .191          .308          .397          .352
BIOTECH        .128          .101          .125          .165          .165          .179
AUTO           .125          .1            .15           .2            .25           .175
SOLAR          .117          .176          .294          .294          .294          .235
PIPELINE       .111          .111          .111          .111          .222          .333
REIT           .111          .08           .075          .101          .126          .095
HOMEBLDG       .055          .111          .055          .111          .055          .111
BEVERAGE       .047          .095          .095          .095          .19           .19
BONDFUND       .025          .008          .008          .017          .025          .017
|
==================================================================================================
11/3/2016 The DJI held at its support but the NASDAQ and SP-500 did
not.
A weak DJI rally "should" take place. But our short-term indicators
and the Hourly DISI/OBV keep falling. Stay short
the weak biotechs
and IWM as well as the Bonds. Stick with the Sell S18 for now.
Hillary Clinton will probably win. The "Establishment" will be much
relieved. So, there should be bounce from that. The S&P-500 has
now fallen for 7 straight days. And, by conventional measures, the
market is oversold. But, fear of what higher rates will do to the stock
market is also operating here. Tomorrow's Jobs numbers will, thus,
be quite important. Again, it will be a case of 'good numbers'
(above 200,000) being 'bad'.
See
http://data.bls.gov/timeseries/CES0000000001?output_view=net_1mt
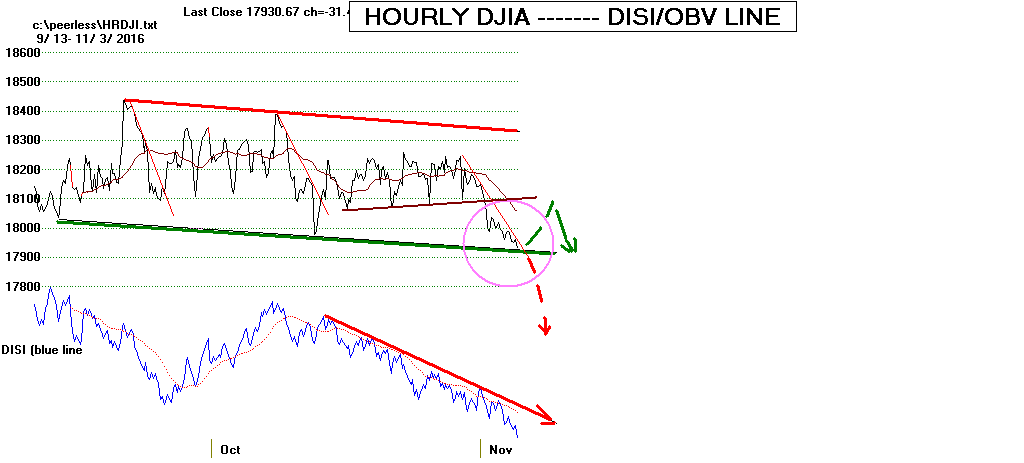
Not many people remember 1948 when the anti-Wall Street Truman
surprised Dewey and all the pundits and won the Election. The DJI fell
from 189.8 on the day before the Election to 173.9 a few days later. So, I
would
hold something back here rather than being fully short.
The DJI is holding at support. A breakdown here
would likely cause a decline by it to 17400. A breakdown
is strongly suggested by the three full months of
negative (red) OBVPct. Big money Selling on all Rallies
keeps blunting and stopping all rallies. Why is Big Money
so eager to sell? Waiting to find out why is not a great plan.
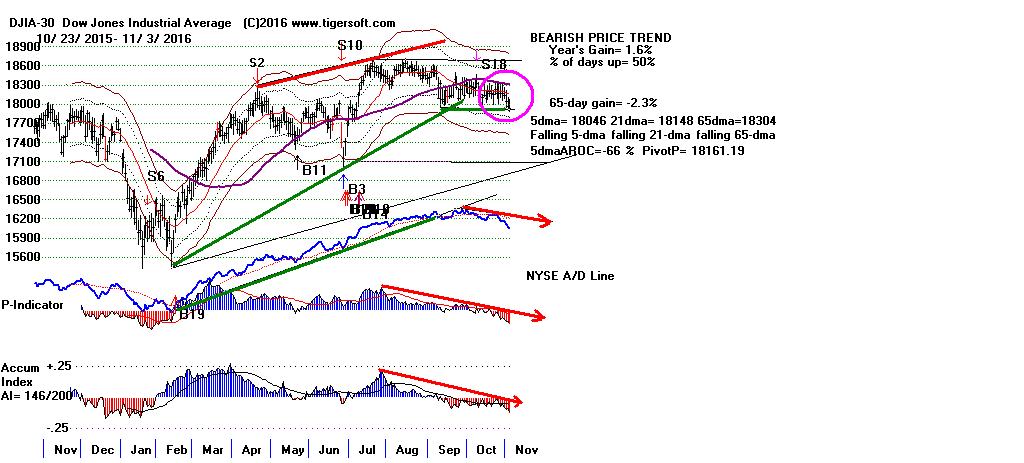

Breakdowns in SP-500 and NASDAQ
produce over-head resistance. This will work
against any good rally developing.
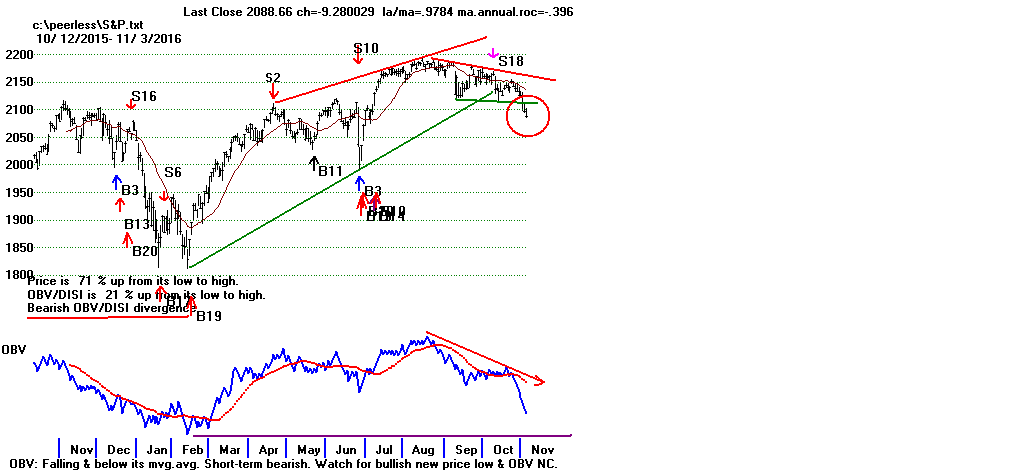
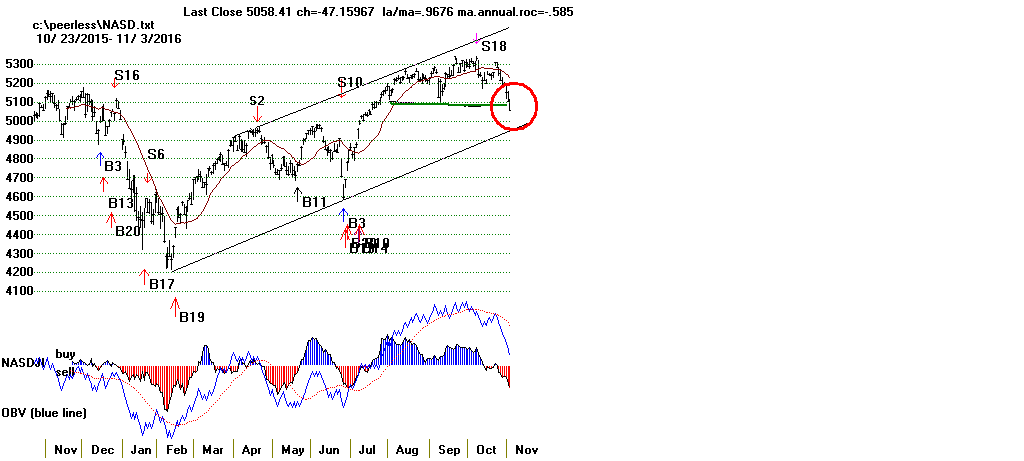
Tiger's Index of Indexes
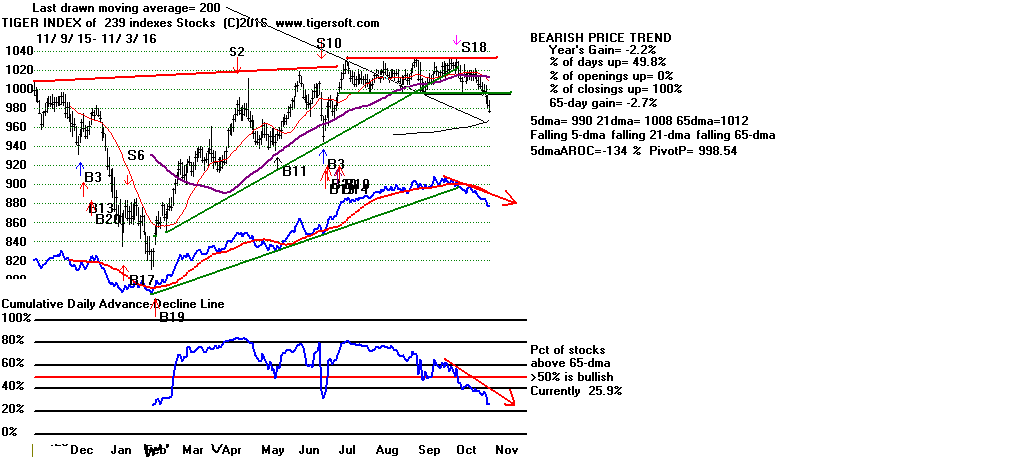
Killer Short Selling Techniques:
It's As Easy as 1,2,3

My new study
of the 16 biggest decliners since mid August shows how
important it is for short sellers to watch for the the combination of
1) Tiger S9s (Insider selling into strength) followed by
2) Tiger S145s (Big Money hurriedly dumping and then
3) a break in a rising Closing Power (showing that Professionals have
shifted and are net Sellers.) This is mentioned in my Killer Short Sales.
But it will help to look back at the the biggest decliners of 2010, 2011, 2012.
.... and see how well this cluster works. If we get involved
in another
bear market, selling short these types of stocks will make a big difference.
Links to Charts
Peerless
DJIA and A/D Line DJI-OBVPCT
Hourly DJIA
S&P
OEX
NYSE
NASDAQ
DIA QQQ SPY
IWM
Short-Term Rates
DJI-Utilities
REITS
A/D Line-6000 Stocks
SOXL TECL
FAS
Crude Oil
Oil/Gas Stocks
Bullish MAXCPs
Bearish
MINCPs
Stocks:
AAPL, BIDU,
IBM, TXN
Bank Stocks - DB (Deutsche
Bank), WFC (Wells Fargo), GS (Goldman Sachs),
AMZN, FB
ETFS:
BBH, BRZU,
DIA, DUST,
FAS, GASL,
GLD, IWM,
JETS,
JNUG, KOL, MDY,NUGT
OIH, RETL,
RSX, SLV,
SOXL, TECL,
TMF, TNA,
UGAZ, UPW,
VGK, YINN
Pct of Different Groups over 65-dma Ranked
11/3 11/2
11/1
10/31
10/28
10/27 10/26
10/25
---------------------------------------
-------------------------------------------------------------------------------------------------------------------
Big Banks
85.7%
85.7%
85.7%
85.7% 85.7% 85.7% 85.7%
85.7%
Regional Banks
52.8%
47.1%
61.1% 66.7%
61.1% 72.2% 69.5
Finance
44.0%
46.7% 52.2% 60.0%
63.3% 68.9% 68.1
------------------------------------------------------------------------------------------------------------------------------
Semi-C
38.2% 39.0% 44.4
% 48.9% 44.9% 50.7% 51.5% 56.6%
Electronics
36.6%
38.7% 42.3%
Computers
22.2% 37.0%
33.3%
40.7%
37.3%
40.7% 40.7% 40.7%
Software
26.9%
32.8% 41.8%
43.3% 41.8% 41.8% 37.3% 44.8%
------------------------------------------------------------------------------------------------------------------------------
NASDAQ-100
25.5% 29.5%
31.9%
40.4%
36.2% 38.3%
40.4% 42.6
ALL
23.0%
24.0%
28.0%
32.0%
31.0% 33.0%
36.0% 39.0%
OIL/GAS
27.3%
27.3% 5.5% 36.6% 46.5% 54.1% 57.9%
57.9%
SP-500
24.5%
27.6% 30.9%
36.1% 32.9% 32.0% 34.5% 34.3%
Rus-1000
25.4%
26.8% 30.4%
35.1%
31.9%
32.1%
35.0%
36.1%
Military
23.1%
25.0% 30.8% 36.5% 38.7%
38.7% 32.7%
26.9%
DJIA-30
17.0%
23.3%
26.7% 33%
33.3%
36.7% 33%
33%
Utilities
26.1%
23.3%
36.2%
52%
28.3%
38.6%
------------------------------------------------------------------------------------------------------------------------------
Foreign ETFs
17.6%
19.1% 30.9% 39.7%
42.6% 42.6%
51.5% 58.8%
Junk Bonds
11.1% 16.7% 16.7% 22.2%
52.6% 68.4% 78.9% 84.2%
Gold
26.3% 15.8% 17.5% 14.0% 8.8% 7.0%
5.3% 8.8%
Autos
10.0% 15.0% 20.0%
25.0%
17.5% 22.5%
32.5%
27.5%
Retail 13.0% 14.8% 14.8% 14.8% 14.8% 18.5%
20.4%
Biotechs
10.1%
12.6% 16.7%
16.7%
18.1% 22% 22.9% 26.0%
------------------------------------------------------------------------------------------------------------------------------
REITs
8.1%
7.6% 10.1%
12.6% 9.6% 10.6% 16.2% 22.6%
HomeBldg
11.1%
5.6%
5.6% 5.6%
11.8%
5.6% 5.6%
5.6%
Bonds
0.9% 0.9%
1.7%
2.6% 3.4% 3.4% 4.3%
4.3%
4 rose
1 rose 1 rose 11 rose
4 rose
4 rose 2 rose
0 rose
17 fell
18 fell
19 fell
8 fell
17 fell
14 fell 10 fell
15 fell
-----------------------------------------------------------------------------------------------------------------------------------------------------------------------------------
11/2/2016 Hillary will probably win and one would think that there
will be a bounce. That,
at least, is what the pundits are saying. Unfortunately, this is not what
the falling technical indicators are suggesting. The intermediate-term
trend
is still down.
The DJI, NASDAQ, SPY (SP-500s) and FAS (financials) have each fallen today
to their intermediate-term support-levels. A bounce is certainly possible.
But the key ETFs' Closing Powers, Traders Tools, 5-day mvg. avgs., IP21s and
the Hourly DJI's DISI/OBV are all falling.
The burden of proof must be
left to the bulls. Even if there is a jump early in the day, too many
times recently
has renewed Big Money selling come in to squelch and suppress rallies early
in the day. Certainly, there is more risk than rewards if they open
higher. That is
the clear message given by the plunging ETFs' Day Traders' Tools. So, it seems
better to trust the un-reversed Peerless Sell S18 and stay
short IWM, Bonds
and weak (MINCP) biotechs.
If these four indexes and ETFs do breakdown, classic chart theory suggests
there will be an additional decline, at a minimum, by the number of points in
the height of
these patterns. See the charts below. I would think that 17100 will
be better support
in the case of the DJI while the price uptrend-line for the NASDAQ may come into
play before the "minimum" objective is reached.
Biggest Decliners since DJI Peaked on 8/15/2016
16 stocks above $5.00 fell by more than 52% in the last 56 trading days.
All but 3 or 4 were biotechs. I will post a down-loadable file with these
16 stocks
for further study on the Tiger Data Page and discuss it more here this weekend.
The biggest plungers were NVAX (-82%) and ADPT (-80%).

DJI - 17900-18400 TRADING RANGE.
A breakdown would set up a minimum target of 17400.
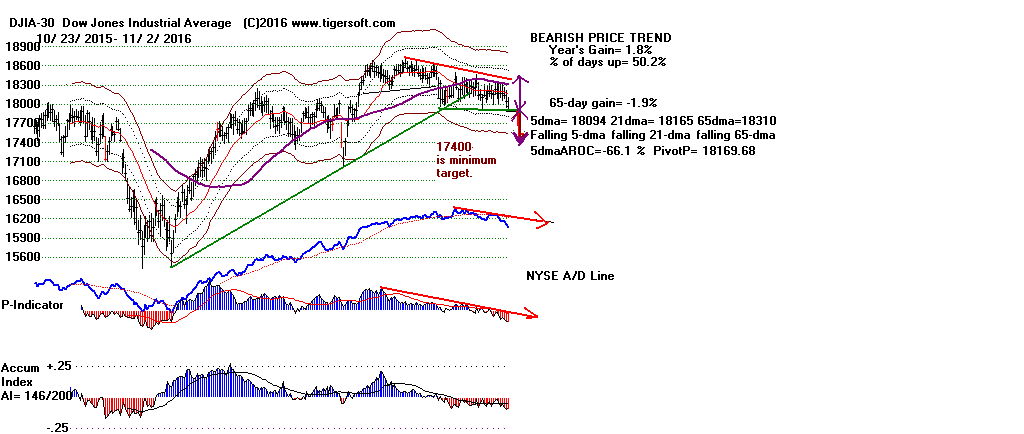
 |
NASDAQ - Test of uptrend-line seems likely.
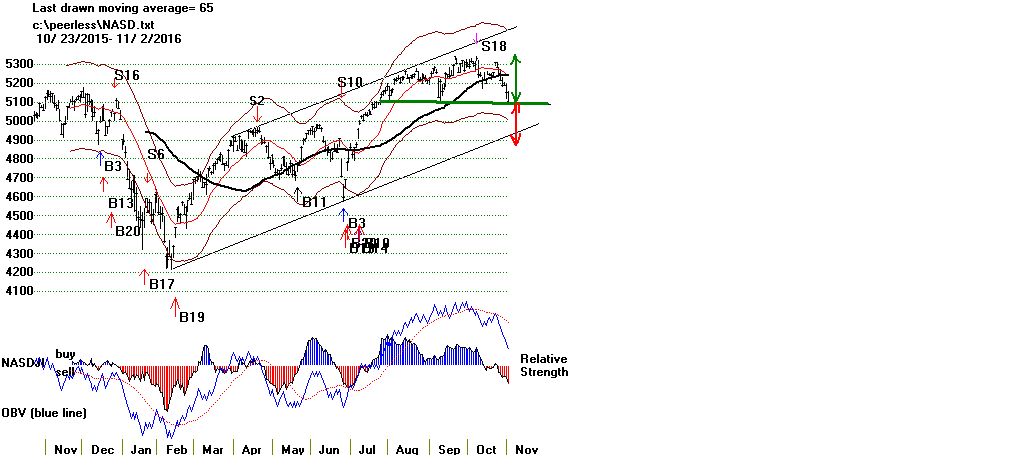 |
SPY
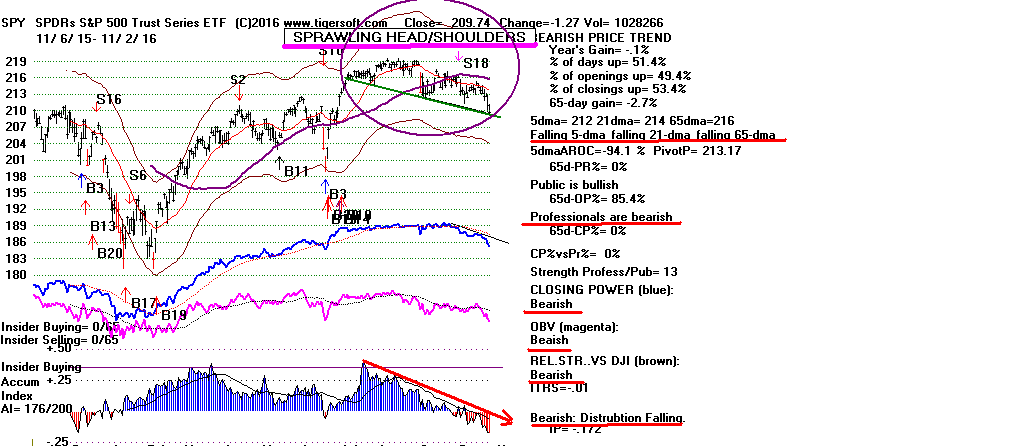
 |
FAS

 |
Links to Charts
Peerless
DJIA and A/D Line DJI-OBVPCT
Hourly DJIA
S&P
OEX
NYSE
NASDAQ
DIA QQQ
IWM
Short-Term Rates
DJI-Utilities
REITS
A/D Line-6000 Stocks
SOXL TECL
FAS
Crude Oil
Oil/Gas Stocks
Bullish MAXCPs
Bearish
MINCPs
Stocks:
AAPL, BIDU,
IBM, TXN
Bank Stocks - DB (Deutsche
Bank), WFC (Wells Fargo), GS (Goldman Sachs),
AMZN, FB
ETFS:
BBH, BRZU,
DIA, DUST,
FAS, GASL,
GLD, IWM,
JETS,
JNUG, KOL, MDY,NUGT
OIH, RETL,
RSX, SLV,
SOXL, TECL,
TMF, TNA,
UGAZ, UPW,
VGK, YINN
Pct of Different Groups over 65-dma Ranked
Only the Big Banks here have more of their components still above the 65-dma.
This may keep the market from starting a bear market like the one of 2008, but
it shows there is no real leadership for much of a post-Election bounce.
11/2
11/1
10/31
10/28
10/27 10/26
10/25
-------------------------------------------------------------------------------------------------------------------
Big Banks
85.7%
85.7%
85.7% 85.7% 85.7% 85.7%
85.7%
Regional Banks
47.1%
61.1% 66.7%
61.1% 72.2% 69.5
Finance
46.7% 52.2% 60.0%
63.3% 68.9% 68.1
------------------------------------------------------------------------------------------------------------------------------
Semi-C
39.0% 44.4
% 48.9% 44.9% 50.7% 51.5% 56.6%
Electronics
38.7% 42.3%
Computers 37.0%
33.3%
40.7%
37.3%
40.7% 40.7% 40.7%
Software
32.8% 41.8%
43.3% 41.8% 41.8% 37.3% 44.8%
------------------------------------------------------------------------------------------------------------------------------
NASDAQ-100 29.5%
31.9%
40.4%
36.2% 38.3%
40.4% 42.6
ALL
28.0%
28.0%
32.0%
31.0% 33.0%
36.0% 39.0%
OIL/GAS
27.3% 5.5% 36.6% 46.5% 54.1% 57.9%
57.9%
SP-500
27.6%
30.9%
36.1% 32.9% 32.0% 34.5% 34.3%
Rus-1000
26.8%
30.4%
35.1%
31.9%
32.1%
35.0%
36.1%
Military
25.0% 30.8% 36.5% 38.7%
38.7% 32.7%
26.9%
DJIA-30
23.3%
26.7% 33%
33.3%
36.7% 33%
33%
Utilities
23.3%
36.2%
52%
28.3%
38.6%
------------------------------------------------------------------------------------------------------------------------------
Foreign ETFs
19.1% 30.9% 39.7%
42.6% 42.6%
51.5% 58.8%
Junk Bonds
16.7% 16.7% 22.2%
52.6% 68.4% 78.9% 84.2%
Gold 15.8% 17.5% 14.0% 8.8% 7.0%
5.3% 8.8%
Autos
15.0% 20.0%
25.0%
17.5% 22.5%
32.5%
27.5%
Retail
14.8% 14.8% 14.8% 14.8% 18.5%
20.4%
Biotechs
12.6% 16.7%
16.7%
18.1% 22% 22.9% 26.0%
------------------------------------------------------------------------------------------------------------------------------
REITs
7.6%
10.1%
12.6% 9.6% 10.6% 16.2% 22.6%
HomeBldg
5.6%
5.6% 5.6%
11.8%
5.6% 5.6%
5.6%
Bonds 0.0%
1.7%
2.6% 3.4% 3.4% 4.3%
4.3%
1 rose
1 rose 11 rose
4 rose
4 rose 2 rose
0 rose
18 fell
19 fell
8 fell
17 fell
14 fell 10 fell
15 fell
Tiger's Index of Indexes
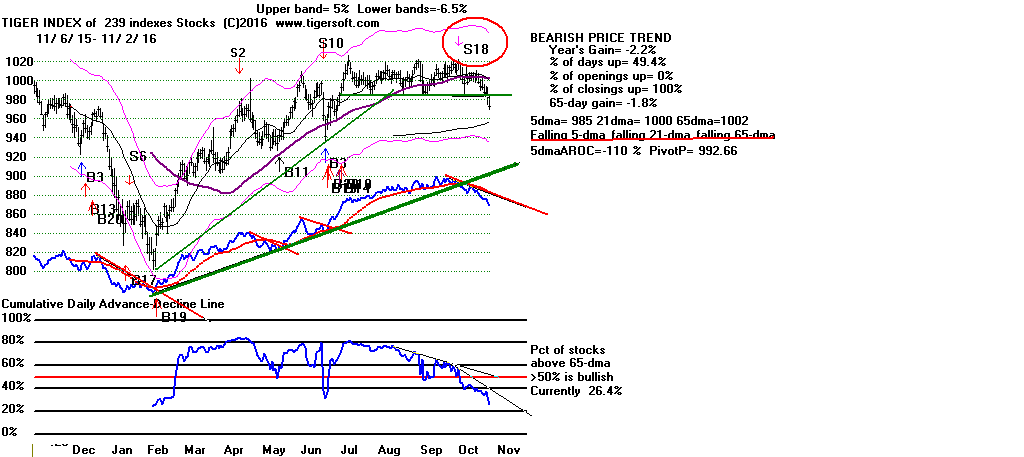
============================================================================================
11/1/2016 Another
test of 18000 tomorrow. The Sell S18,
falling Closing Powers,
IP21s
and the very negative OBVPct on the DJI
tell us that the 18000 support is
not likely to hold for long. Watch to see if the DJI-30 market makers
attempt another
rally. I would interpret this as one more sign of desperation, where they
seek to conceal the gathering technical weakness in the market, in part
to help the Clinton candidacy and in part to permit more Big Money
distribution.
Stay short Bonds,
Biotech
Bearish MINCPs and
IWM.
Support on DJI appears down to 17900.
Below that, probably 17300.
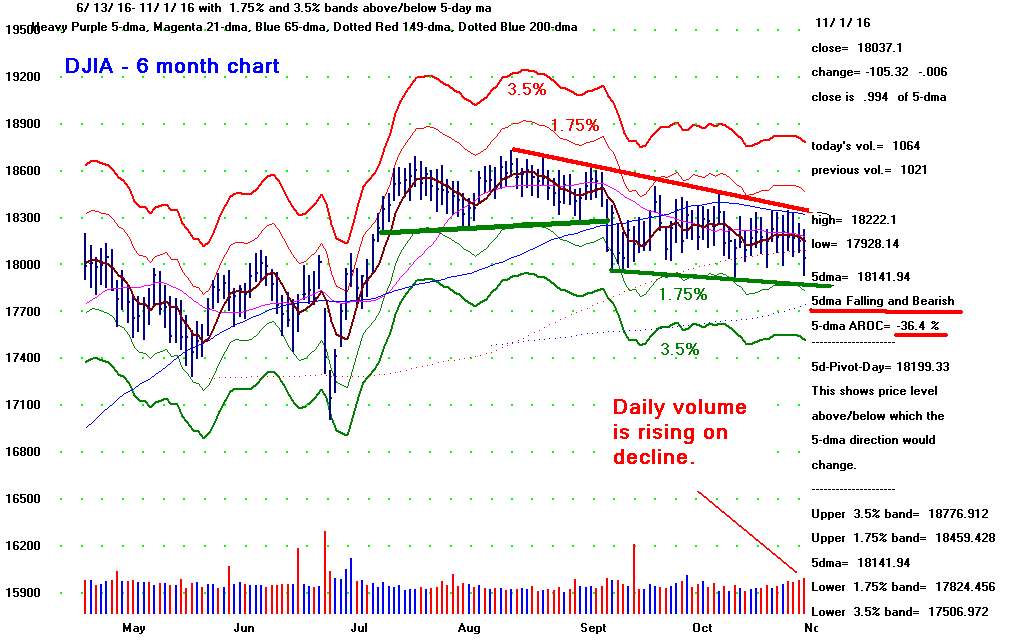
Falling Tiger Indicators are Bearish for SPY:
IP21, Closing Power, Tiger Day Traders' Tool
Completion of the Head/Shoulders (shown below) and
the turning down of the
Opening Power will bring a drop to lower band at 204.
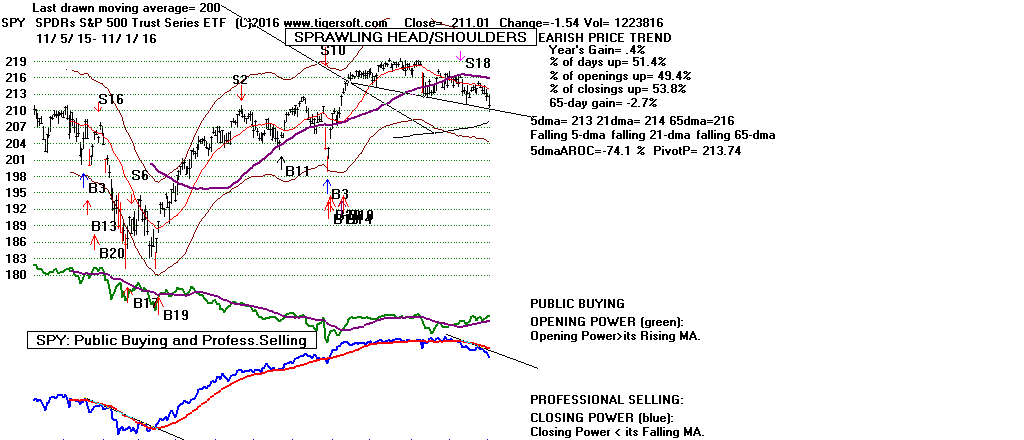


More and More Stocks Drop below key 65-dma Support
We are told that the declines owes to Trump's rising poll numbers.
In that case, a Clinton will next week should bring a rally. But from
what group? Only a handful of Coal Stocks,
Regional Banks and the
Big Banks show
more than 60% of their stocks above the 65-dma. The DJI-30's percentage is
now
down to 26.7%. All stocks/ETFs
percentage now stand at 28%, a drop of 4% today.
Nor would I expect much from technology stocks. This key percentage
plunged from 40.4% to 31.9% for the QQQ-100.
Today's weakness was widespread. But I was struck by how the recent
weakness
in Oil Stocks has been coupled with a
further sharp drop in Foreign ETFs, which
dovetails with
the plunge by Junk Bonds below their
rising 65-dma. The brief bounce in
Utilities ended
today and short-term rates are near their
highs again, all because the Fed is expected to finally
raise rates in December.
Links to Charts
Peerless
DJIA and A/D Line DJI-OBVPCT
Hourly DJIA
S&P
OEX
NYSE
NASDAQ
DIA
SPY QQQ
IWM
Short-Term Rates
DJI-Utilities
REITS
A/D Line-6000 Stocks
SOXL TECL
FAS
Crude Oil
Oil/Gas Stocks
Bullish MAXCPs
Bearish
MINCPs
Stocks:
AAPL, BIDU,
IBM, TXN
Bank Stocks - DB (Deutsche
Bank), WFC (Wells Fargo), GS (Goldman Sachs),
AMZN, FB
ETFS:
BBH, BRZU,
DIA, DUST,
FAS, GASL,
GLD, IWM,
JETS,
JNUG, KOL, MDY,NUGT
OIH, RETL,
RSX, SLV,
SOXL, TECL,
TMF, TNA,
UGAZ, UPW,
VGK, YINN
Pct of Different Groups over 65-dma Ranked
11/1
10/31
10/28
10/27 10/26
10/25
---------------------------------------------------------------------------------------------------------
Big Banks
85.7%
85.7% 85.7% 85.7% 85.7%
85.7%
Regional Banks
61.1% 66.7%
61.1% 72.2% 69.5
Finance 52.2% 60.0%
63.3% 68.9% 68.1
------------------------------------------------------------------------------------------------------------------------------
Semi-C
44.4
% 48.9% 44.9% 50.7% 51.5% 56.6%
Electronics
42.3%
Software
41.8%
43.3% 41.8% 41.8% 37.3% 44.8%
Utilities
36.2%
52%
28.3%
38.6%
OIL/GAS 35.5% 36.6% 46.5% 54.1% 57.9%
57.9%
Computers
33.3%
40.7%
37.3%
40.7% 40.7% 40.7%
------------------------------------------------------------------------------------------------------------------------------
NASDAQ-100
31.9%
40.4%
36.2% 38.3%
40.4% 42.6
Military
30.8% 36.5% 38.7%
38.7% 32.7%
26.9%
Foreign ETFs
30.9% 39.7%
42.6% 42.6%
51.5% 58.8%
SP-500
30.9%
36.1% 32.9% 32.0% 34.5% 34.3%
Rus-1000
30.4%
35.1%
31.9%
32.1%
35.0%
36.1%
DJIA-30
26.7% 33%
33.3%
36.7% 33%
33%
ALL 28.0%
32.0%
31.0%
33.0%
36.0% 39.0%
Autos
20.0%
25.0%
17.5% 22.5%
32.5%
27.5%
------------------------------------------------------------------------------------------------------------------------------
Junk Bonds
16.7% 22.2%
52.6% 68.4% 78.9% 84.2%
Biotechs
16.7%
16.7%
18.1% 22% 22.9% 26.0%
Retail
14.8% 14.8% 14.8% 18.5%
20.4%
Gold 17.5% 14.0% 8.8% 7.0%
5.3% 8.8%
REITs
10.1%
12.6% 9.6% 10.6% 16.2% 22.6%
HomeBldg
5.6% 5.6%
11.8%
5.6% 5.6%
5.6%
Bonds
1.7%
2.6% 3.4% 3.4% 4.3%
4.3%
1rose 11rose
4rose
4rose 2rose
0rose
19 fell
8 fell
17 fell
14 fell 10 fell
15 fell
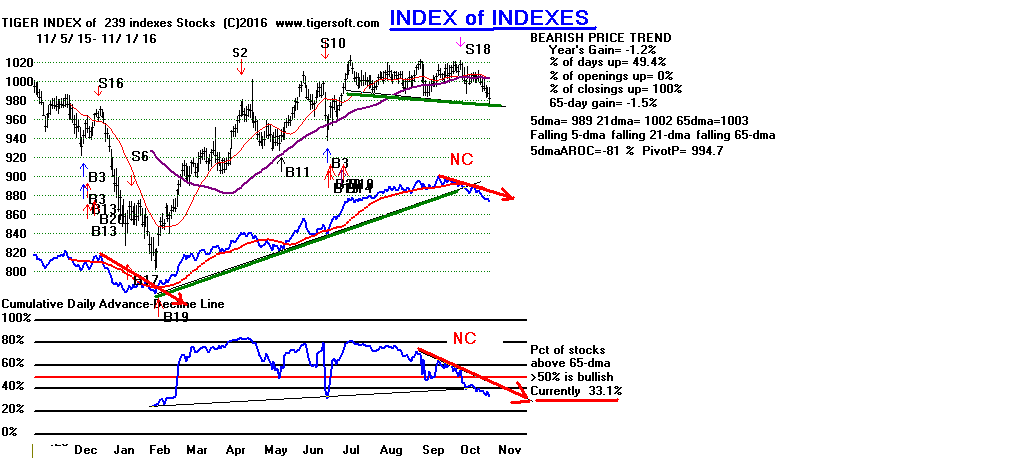
=============================================================================================
10/31/2016 The Election may
still bring a bounce. But it will likely be quite
limited. It is unlikely that the Democrats will gain control of the House
of Representatives. The "checks and balances" of American Government
should still be working their conservative magic. If you liked the last
four years,
we should see more of the same, except that the FED seems obliged soon
to raise rates by a token amount. Either, the stock market is not
really scared by this prospect or the Fed has cried "Wolf" too often
and most traders do not believe the FED will do anything significant.
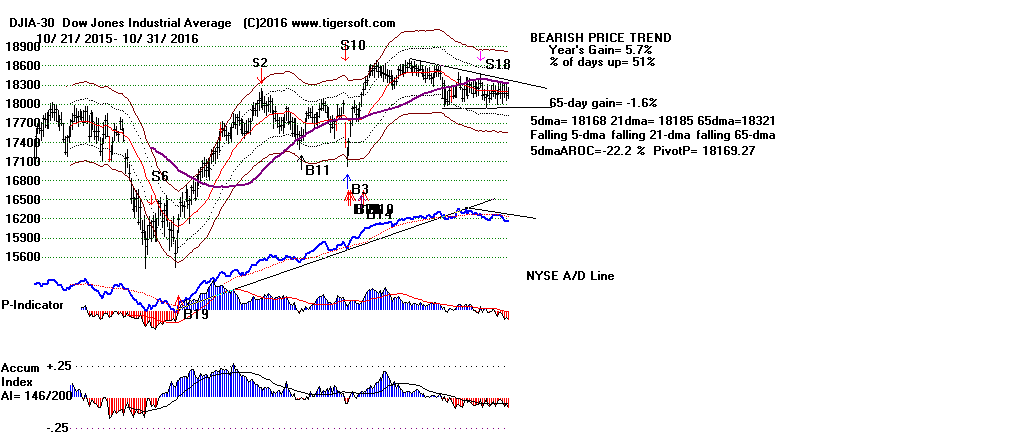

The Sell S18 still stands. Watch the DJI's
OP21-OBVPct. As long as it stays
negative, the odds are greater that there will be a downside breakdown
below 18000. And history shows that whichever way the DJI first jumps
from the trading range, it is apt to continue to move.
The short-term indicators show Professionals are net sellers and Big Money
is getting out on all modest rallies. The Closing Powers are all falling
for the key
ETFs and the Accumulation Index for the DJI remains quite negative, as
does the Tiger ObvPct Indicator. The Hourly DJI's DISI/OBV is still
falling.
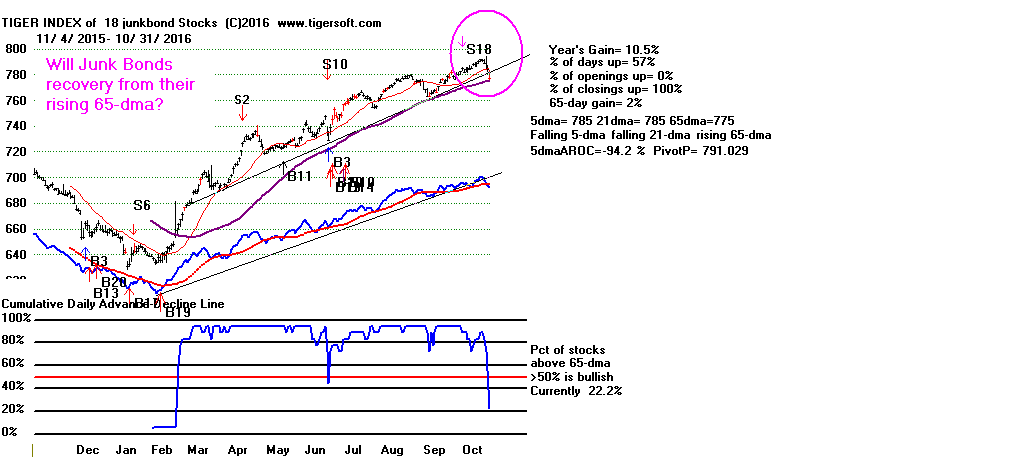
There may have been a warning today from another source. Junk Bonds
sold off sharply for the second trading day in a row. Some consider this a bearish
sign,
showing more threats of insolvency from Sovereign Debt and another decline
in Oil Prices. Junk bonds had been steadily rallying for 8 months. I
personally
would not make too much of this. Utilities showed unusual strength with
many
of the better grade ones climbing back above their 65-dma.
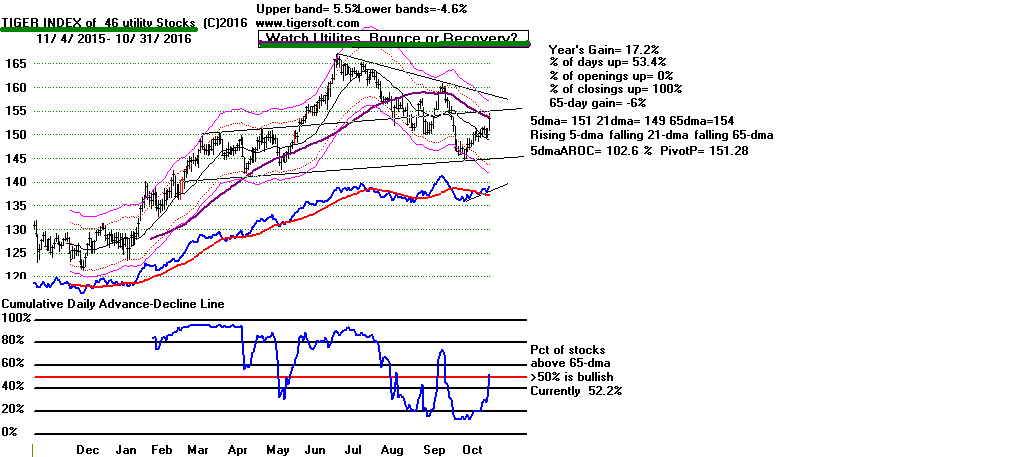
While today saw 100 more up than down on the NYSE, only Big Banks,
Regional Banks and the Finance group show more than 60% of its stocks above
their 65-dma. Presumably, bankers are looking forward to charging more on
their loans
and will use any increase in the short-term rates the Fed charges to raise
their fees. It seems highly unlikely that Finance stocks acting alone can
bring much
of a rally. We have to show still more patience.
With The OBVPct So Negative,
A DJI Breakdown below 18000
Should Be Quite Bearish.
Eventually, the DJI will break away from its narrow trading range. Looking
back
at the DJI since 1928, we find a few other cases where the DJI went narrowly
sidewise
for 6 ore more weeks with the OBVPct Negative. This reliably brought an
additional
decline:
8/12/1931-9/3/1931 deep bear market
1/15/1940-5/19/1940 deep 20% decline
4/30/1945-7/17/1945 shallow decline
3/7/1949-5/27/1949 7% decline
See the narrow trading below just before World War II
spread to Western Europe. Our situation shows much
lower and worse OBVPct, unfortunately.

Links to Charts
Peerless
DJIA and A/D Line DJI-OBVPCT
Hourly DJIA
S&P
OEX
NYSE
NASDAQ
DIA
SPY QQQ
IWM
Short-Term Rates
DJI-Utilities
REITS
A/D Line-6000 Stocks
SOXL TECL
FAS
Crude Oil
Oil/Gas Stocks
Bullish MAXCPs
Bearish
MINCPs
Stocks:
AAPL, BIDU,
IBM, TXN
Bank Stocks - DB (Deutsche
Bank), WFC (Wells Fargo), GS (Goldman Sachs),
AMZN, FB
ETFS:
BBH, BRZU,
DIA, DUST,
FAS, GASL,
GLD, IWM,
JETS,
JNUG, KOL, MDY,NUGT
OIH, RETL,
RSX, SLV,
SOXL, TECL,
TMF, TNA,
UGAZ, UPW,
VGK, YINN
Below see how the remaining best performing stock-groups weakened on Friday.
Now only Financials seem secure and show more than 60% of their stocks above
their 65-dma.
Pct of Different Groups over 65-dma Ranked
10/31
10/28
10/27 10/26
10/25
10/24
10/21
-----------------------------------------------------------------------------------------------------------------------------
Big Banks
85.7% 85.7% 85.7% 85.7%
85.7% 85.7%
85.7%
Regional Banks 66.7%
61.1% 72.2% 69.5
Finance 60.0%
63.3% 68.9% 68.1
Utilities
52%
28.3%
38.6%
Semi-C
48.9% 44.9% 50.7% 51.5% 56.6% 56.6% 49.3%
Foreign ETFs 39.7% 42.6% 42.6% 51.5% 58.8% 61.8%
57.4%
Software 41.8% 41.8% 37.3% 44.8% 46.3% 53.7%
43.3%
NASDAQ-100
40.4% 36.2% 38.3% 40.4% 42.6
44.7%
38.3%
Computers 40.7%
37.3%
40.7% 40.7% 40.7% 44.4% 37.0%
OIL/GAS 36.6% 46.5% 54.1% 57.9%
57.9% 65.1%
68.6%
Military
36.5% 38.7%
38.7% 32.7%
26.9% 30.8% 21.2%
SP-500
36.1% 32.9% 32.0% 34.5% 34.3%
38.1% 34.9%
Rus-1000
35.1%
31.9%
32.1%
35.0%
36.1%
39.8% 36.5%
DJIA-30 33%
33.3%
36.7% 33%
33%
33.0% 32.3%
ALL
32.0%
31.0%
33.0%
36.0% 39.0%
42.0%
39.0%
Autos
25.0%
17.5% 22.5%
32.5%
27.5% 45.0% 37.5%
Junk Bonds
22.2%
52.6% 68.4% 78.9% 84.2% 84.2%
78.9%
Biotechs
16.7%
18.1% 22% 22.9% 26.0% 29.0% 29.0%
Retail 14.8% 14.8% 18.5%
20.4%
Gold 14.0% 8.8% 7.0%
5.3% 8.8%
7.0%
5.3%
REITs
12.6% 9.6% 10.6% 16.2% 22.6%
23.1% 19.6%
HomeBldg
5.6%
11.8%
5.6% 5.6%
5.6%
16.7% 16.7%
Bonds
2.6% 3.4% 3.4% 4.3%
4.3% 4.3%
5.2%
11rose
4rose
4rose 2rose
0rose
14rose
8fell
17fell
14fell 10fell
15fell
3fell


