Earlier Hotlines
newest
www.tigersoft.com/HH9911/INDEX.htm
http://www.tigersoft.com/HH9911/olderINDEX.htm
http://www.tigersoft.com/HHH517/INDEX.htm
www.tigersoft.com/HHH517/XXXIndex.htm
www.tigersoft.com/HHH517/INDEX6917.htm
www.tigersoft.com/HHH517/OLDER.html
www.tigersoft.com/HH747/INDEX.html
www.tigersoft.com/HHLL217/INDEX.html
PREINDEX.html
www.tigersoftware.com/HL/INDEX.html
Most Recent Hotlines: 2/4/2017 - 2/15/2017
These have somehow become corrupted. Their graphs are missing.
http://www.tigersoft.com/345HLN12/ZINDEX.html
http://www.tigersoft.com/333HLLL/INDEX.html
http://www.tigersoft.com/444HL444/INDEX.html
www.tigersoft.com/119HLPAZ/INDEX.html
http://www.tigersoft.com/888HLAZ/INDEX.html
www.tigersoft.com/821-HL/INDEX.html
http://www.tigersoft.com/816-HLN/INDEX.html
http://www.tigersoft.com/77HL7778/INDEX.html
http://www.tigersoft.com/64HRL/INDEX.html
http://www.tigersoft.com/55HL55/INDEX.html
HELP
A
Guide To Profitably Using The Tiger Nightly HOTLINE
Introduction
to Tiger/Peerless Buys and Sells.
Peerless
Buy and Sell Signals: 1928-2016
Individual Peerless signals explained:
http://tigersoftware.com/PeerlessStudies/Signals-Res/index.htm
http://www.tigersoft.com/PeerInst-2012-2013/
Explanation of each Peerless signal.
http://www.tigersoft.com/PeerInst-2012-2013/
Different
Types of TigerSoft/Peerless CHARTS, Signals and Indicators
-----> More HELP LINKS
Documentation
for TigerSoft Automatic and Optimized Signals.
How
reliable support is the DJI's rising 200-day ma?
SPY
Charts since 1994: Advisory Closing Power S7s, Accum. Index, 65-dma,
Optimized Signals.
^^^^^^^^^^^^^^^^^^^^^^^^^^^^^^^^^^^^^^^^^^^^^^^^
1/19/2016 --->
Corrections,Deeper Declines and Bear Markets since 1945.
1/21/2016
--->
High Velocity Declines since 1929
2/12/2016 --->
Presidential Elections Years and Bullish IP21 Positive Non-Confirmations at
Lower Band.
2/12/2016 --->
OBV NNCs
on DJI's Rally to 2.7% Upper Band when DJI's 65-dma is falling.
11/6/2016 --->
Killer Short Selling Techniques:
===>
Order Here
($42.50)
It's As Easy as
1,2,3
TigerSoft "Combination" Short-Selling...
Easy as 1-2-3 Short Sales
Earlier
Q-Answers
QuickSilver
Documentation (1/11/2016)
Our Different Signals
Better
understand the difference between Peerless DJI-based signals,
the one-year optimized red Signals
and the fixed signals based
on technical developments.
Introduction to
Tiger/Peerless Buys and Sells.
Different
Types of TigerSoft/Peerless CHARTS, Signals and Indicators
New
TigerPeerless
Installation and Basic Uses' Instruction
(11/25/2016)
See
the re-written materials on TigerSoft Buys and Sells.
A few more pages will be added. But users could
print this
main Installation and Uses' Page for reference.
Study-
Trading SPY WITHOUT Peerless - Some Guidelines.
When completed this will be
a new Tiger Trading E-Book.
Study-
Examples of "Hands above the Head" top patterns.
Study-
9/3/2017
TigerSoft (not
Peerless) charts of Major Tops as they occurred.
===> Please report any broken
or out-of-date links.
william_schmidt@hotmail.com
-----------------------------------------------------------------------------------------------------------------
IMPORTANT:
The HOTLINE's Address will change Sunday.
Look for an email from us on Friday
giving the new address. If you do not get
the email by Saturday, email me.
===================================================================================
www.tigersoft.com/H7TBR/INDEX.htm
10/19/2017
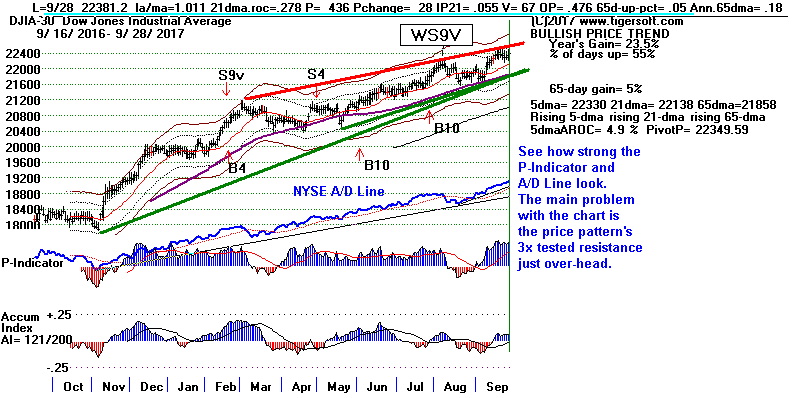
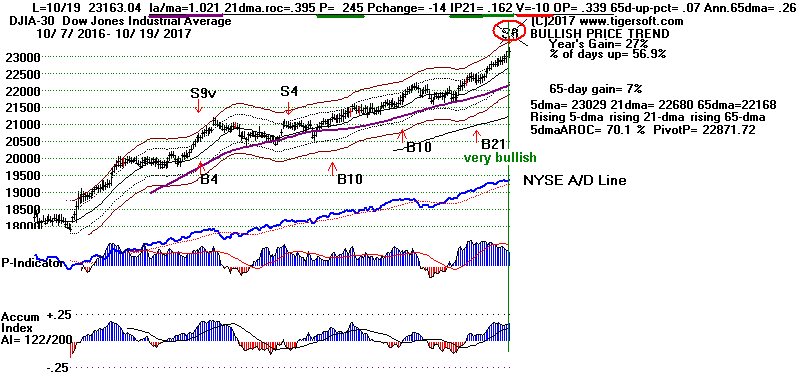
Today Peerless produced a Sell S8 Signal. But I would not act on it
at this time. I think the DJI will go still higher for now. In
recent
Hotlines I have discussed the need to see more blatant breadth and
Accumulation divergences before we can predict much of a decline.
The new study of Sell S8s tonight confirms that. Traders should also
be using QuickSilver. As long as the Closing Powers and 5-day moving
averages are rising, let your stocks and ETFs run.
Let me explain. In the previous S8s (See
the list below.) none occurred
this late in the year. As you can see from their key values, the past
S8s are mostly a variation of S9-Vs, S9s and S12s. As such, most occur
with
either weak V-I, P-I and or IP21 readings with the DJI above the 2.4% upper
band. I think it is important that none of the earlier S8s followed
closely
after the new and very bullish September Buy B21s. I also worry that
the
Accumulation Index (IP21) now is still way too high to trust a Sell and
bring
about a decline. And, as if to make this point again, the DJI closed
near its
highs today and is bounding up over-night in all-time high territory, where
its
path of least resistance tends to be UP. Accordingly, I think we should not
take
the Sell S8. I will rewrite the
software to disallow such signals this late
in October, especially after the bullish B21 and with the IP21 above +.15.

Previous Sell S8s: 1929-2017
===========================================================================
             Signal DJI    Gain PaperLoss  LA/MA  P-I   IP21  V-I  OPct
===========================================================================
1   19330831  S8    102.4  .051  .032      1.035  +6   .277   -32  .024
                                           ^^^^^  low   ^^^^
This signal here was redundant and could be eliminated because of high IP21.
----------------------------------------------------------------------------------
2   19370816  S8    189.3  .376  None      1.022  -5   .050   -44  .130
                                                        low
----------------------------------------------------------------------------------
3   19410714  S8    127.9  .135  .013      1.027  +94  .107   83   .300
----------------------------------------------------------------------------------
4   19430602  S8    142.4  .075  .024      1.024  +26  .104  -31   .328
----------------------------------------------------------------------------------
5   19500518  S8    220.6  .058  .035      1.021  +32  .096  -78   .367
----------------------------------------------------------------------------------
6   19550727  S8    468.5  .042  none      1.018  +11  .041  -157  .402
----------------------------------------------------------------------------------
7   19550920  S8    483.7  .088  .008      1.025  +95  .113   38   .403
----------------------------------------------------------------------------------
8   19720530  S8    971.18 .056  none      1.025  -19 -.005  -1    .238
----------------------------------------------------------------------------------
9   19790822  S8    885.84 .087  .013      1.027  +246 .263   6    .202
                                                       ^^^^^
    This Sell could quite satisfactorily be dropped. A better S9 followed
    at a higher level.
----------------------------------------------------------------------------------
10  19870610  S8   2353.61 -.039 .039      1.025  -14  .016   1    .024
----------------------------------------------------------------------------------
11  19871005  S8   2640.18  .341  none     1.025  -46 -.006   -3   .083
----------------------------------------------------------------------------------
12  19900717  S8   2999.75  .182  none     1.032  -1   .024   -4   .453
----------------------------------------------------------------------------------
13  20060505  S8  11577.74  .049  .005     1.026  -10  .035  -62   .165
----------------------------------------------------------------------------------
14  20090608  S8   8764.49  .050  .004     1.032  258  .074  -98   .155
----------------------------------------------------------------------------------
15  20110502  S8  12807.36  .051  none     1.029  +212 .147  -17   .349
    This case also shows high P-I and IP21 readings, but it occurred 2.9%
    over the 21-dma and in May when regular S9-Vs are allowed.
----------------------------------------------------------------------------------
16  20120919  S8  13577.96  .056  .002     1.024  +290  .023  35   .225
----------------------------------------------------------------------------------
17  20130712  S8  15464.3   .037  .012     1.026  +350 -.008  -4   .264
----------------------------------------------------------------------------------


18  20171019  S8  23163.04                 1.021  +245 +.162  -10   .339
    too late                                          too high

The simplest change to make in the Sell S8 program is to disallow October
S8s when IP21 is greater than +.15 and kick out S8s in August and September
if the IP21 is above +.20
|
Charts 10/19/2017
PEERLESS DJI, Signals, Indicators Daily
DJI Split Volume 10-DayUp/Down
Vol
Hourly DJIA
A/D Line for
All Stocks
DJIA
S&P
OEX
NYSE
NASDAQ
COMPQX
with CP
DIA
SPY
QQQ
MDY
IWM-TNA
Short Term Interest Rates
DJI-Utilities
DJI-Transp
Nifty-30 Index
CrudeOil FAS
GLD
BBH
IBB
JETS
JNUG
KOL
NUGT
OIH
OIL
RSX
RETL SDS
SLV
SOXL
TECL
TMF
TNA UGA
(gasoline)
XIV YINN
Commodities: JJC, NIB,
CORN,
WEAT UUP
(Dollar)
AAPL ADBE
ALXN
AMAT
AMGN
AMZN BA
BABA
BIDU
CAT
FB
GOOG
GS
HD
IBM JPM
M (Macy's)
MASI
MSFT
NVDA QCOM
TSLA
TXN
ANDV,
CMG (Chipotle),
LRCX,
SWKS,
TOWN
Others REN, CVE
and SWN
10/19/2017
Bullish MAXCPs
Bearish MINCPs
|
Table 1
Tiger's QUICKSILVER
and MAJOR ETFS 10/10/2017
        DIA, FAS, SOXL, TECL, UGA and GLD show across-the-board Blue
			values.

        All the major market ETFs except IWM show rising Closing
  	  Power and rising 5-dma...

       QuickSilver Documentation  This is for short-term trading
       of leveraged ETFs. It also provides a useful short-term
       outlook of these sectors ETF's and the sectors they represent.


       Blue is Bullish and Red is Bearish.

       1    Candle-Stick color is shortest-term. This changes when close vis-a-vis opng changes.
       2    5-dma AROC and Close versus pivot point is next most short-term.
                W = warning.  Close is below PIVOT-Point
       3   Closing Power trend-direction vs its 21-dma is next most short-term.
       4   IP21 is used to spot divergences and to estimate underlying support.
       5   IP21 falling and below +.15 and its 21-dma is bearish.
       6   Note price trend-lines, support/resistance and price patterns on charts.


                     QUICKSILVER on ETFS - 10/19/17
ETF      CLOSE   CHANGE     PIVOT-PT   5-dma AROC   CL-PWR   CANDLE  IP21   ITRS
---------------------------------------------------------------------------------------------
DIA       231.65    .19      228.73        72.3%   Bullish      BLUE  .407   ----
---------------------------------------------------------------------------------------------
COMPQX    6605.07   -19.15  W6605.8        10.3%   Bullish      BLUE  .344  -.011
---------------------------------------------------------------------------------------------
SPY       255.79    .07      254.95        22.5%   Bullish      BLUE  .415  -.016
---------------------------------------------------------------------------------------------
QQQ       148.31   -.55      148.34        18.2%   Bullish      BLUE  .338  -.021
---------------------------------------------------------------------------------------------
MDY       331.59    .32      330.73        9.8%    Bullish      BLUE  .289  -.001
---------------------------------------------------------------------------------------------
IWM       149.29   -.23     W149.37       -11.7%   Bullish      BLUE  .222   .025
---------------------------------------------------------------------------------------------
FAS       58.97    .12       58.45         50.4%   Bullish      BLUE  .324   .068
---------------------------------------------------------------------------------------------
RETL      25.75   -.26       25.57         66.6%   Bearish      ----  .24   -.097
---------------------------------------------------------------------------------------------
SOXL      131.3   -1.16      129.6         161.1%  Bullish      BLUE  .421   .338
---------------------------------------------------------------------------------------------
TECL      96.69   -.89       95.92         105.8%  Bullish      BLUE  .313   .096
---------------------------------------------------------------------------------------------
IBB       335.11   -.86     W336.38        -30%    Bearish      BLUE  .119   .019
---------------------------------------------------------------------------------------------
GLD       122.6    .58       119.46        142.2%  Bullish      BLUE  .092   .014
---------------------------------------------------------------------------------------------
OIL       5.35   -.07        5.35          83.7%   ----         ----  .221  -.028
---------------------------------------------------------------------------------------------
OIH       24.01   -.33      W25.07        -191.2%  Bearish      RED  -.023  -.02
---------------------------------------------------------------------------------------------
GASL      21.19   -.39      W22.13        -256.3%   ----        ----  .238   .129
---------------------------------------------------------------------------------------------
UGA       29      -.29       28.84         149.2%  Bullish      BLUE  .412   .045
---------------------------------------------------------------------------------------------
UUP       24.21   -.06       24.18         6.2%    Bearish      ---- -.038  -.052
---------------------------------------------------------------------------------------------
IEF       106.48    .11     W106.86       -.9%     Bearish      RED  -.109  -.056
---------------------------------------------------------------------------------------------
CORN      17.34    .01      W17.51        -5.7%    Bullish      ---- -.033  -.13
---------------------------------------------------------------------------------------------
WEAT      6.39    .03       W6.48          39.1%   Bearish      ---- -.076  -.157
---------------------------------------------------------------------------------------------
YINN      31.99   -2.01     W33.45        -109.4%  Bullish      ----  .197   .114
---------------------------------------------------------------------------------------------
RSX       22.19   -.26      W22.56        -24.5%   Bearish      RED   .083   .043
|
| Table 2 Bulls
Remain Dominant, but Professionals are retaking some short
positions.
10/19 10/18 10/17 10/16 10/13 10/12 10/11
10/10 10/9 10/6 10/5
10/4 10/3 10/2 9/29
NEWHIGHS 300
381 238 423
430 402 487
481 271 371
555 444 652
700 441
NEWLOWS 41 32 32 53 50 44 44
29 21 25
19 28
25 27 25
-------------------------------------------------------------------------------------------------------------------------
MAXCPs 251 154
125 137 168
255 239 194
185 252 229
220 307 311
230
MINCPs
98 101 89 105
78 79
73 64
55 41
40 28
41 41 37
------------------------------------------------------------------------------------------------------------------------
TTTNHs
89 88 65 63 76 115 102 89 74
93 104 109
102 153 97
TTTNLs
122
153
117 138 108 92
92 75 95 65
60 52
69 47
46
-------------------------------------------------------------------------------------------------------------------------
FASTUP 63
68
65
FASTDOWN 148 174 166
-------------------------------------------------------------------------------------------------------------------------
MAXCPs are Closing
Power new highs. MINCPs are Closing Power new lows for any given
day.
TTTNHs are Tiger Day Traders' Tool new highs. After opening, more
upside potential than downside risk.
TTTNLs are Tiger Day Traders' Tool new lows. After opening, more
downside potential than upside risk
FASTUP are stocks/ETFs where 5-dma AROC is over 500%
FASTOWN are stocks/ETFs where 5-dma AROC is under -500%
|
Table 3
Count of Stocks and New Highs in Key Tiger Directories
Date = 171019
            No.     New Highs     Pct.
-------------------------------------------------------------------
HOMEBLDG       17            6             35 %
DJI-13         13            4             31 %
BIGBANKS       7             2             29 %
DOWJONES       30            7             23 %
UTILITY        43            9             21 %
INFRA          11            2             18 %
INDEXES        213           36            17 %
INSURANC       32            5             16 %
-------------------------------------------------------------------
MORNSTAR       238           33            14 %
NIFTY          30            4             13 %
SP-100         96            12            13 %
FINANCE        92            10            11 %
SOFTWARE       63            6             10 %
SP500          487           51            10 %
RUS-1000       843           76            9 %
MILITARY       38            3             8 %
HACKERS        25            2             8 %
SEMI           130           10            8 %
AUTO           40            3             7 %
GAMING         28            2             7 %
ELECTRON       181           13            7 %
GREEN          31            2             6 %
REGBANKS       34            2             6 %
NASD-100       88            5             6 %
REIT           179           9             5 %
BEVERAGE       20            1             5 %
INDMATER       92            4             4 %
BIOTECH        374           14            4 %
COMPUTER       23            1             4 %
RETAIL         55            2             4 %
CHEM           65            2             3 %
ETFS           66            2             3 %
CHINA          64            2             3 %
BONDFUND       112           1             1 %
-----------------------------------------------
Now new highs among BIGMIL, OILGAS, TRANSP, COAL,
GOLD, EDUC, PIPELINE, COMMODITY, FOOD, HOSPITAL & JETS
|
 |
 RANKING OF KEY DIRECTORIES BASED PCT.OF STOCKS ABOVE 65-DMA
              10/19/17
  BULLISH = 39
  BEARISH = 6
---------------------------------------------------------------------------------------
Directory     Current       day-1         day-2         day-3         day-4         day-5
----------------------------------------------------------------------------------------
BIGBANKS       100%          1             1             1             1             1
BIGMIL         100%          1             1             1             1             1
REGBANKS       .941          .97           .941          .941          .941          .941
AUTO           .9            .925          .9            .875          .85           .9
COAL           .875          .75           .75           .75           .625          .75
DJI-13         .846          .923          .923          .846          .846          .769
GREEN          .838          .806          .806          .838          .87           .838
DOWJONES       .833          .866          .866          .833          .833          .833
ETFS           .833          .878          .863          .878          .878          .833
NIFTY          .833          .9            .833          .9            .933          .933
CHEM           .83           .83           .846          .861          .83           .83
HOMEBLDG       .823          .764          .823          .823          .882          .941
INFRA          .818          .727          .727          .818          .818          .818
FINANCE        .815          .858          .847          .858          .869          .836
MILITARY       .815          .842          .789          .789          .842          .842
SP-100         .812          .802          .802          .812          .822          .822
INDMATER       .793          .793          .793          .793          .793          .739
INSURANC       .781          .781          .625          .75           .687          .656
UTILITY        .767          .697          .674          .651          .72           .79
MORNSTAR       .756          .768          .764          .76           .802          .789
INDEXES        .751          .755          .765          .779          .802          .812
HOSPITAL       .75           .25           .25           .25           .25           .25
NASD-100       .75           .738          .727          .738          .761          .75
TRANSP         .75           .8            .8            .8            .8            .9
SOFTWARE       .746          .777          .73           .761          .746          .761
SP500          .735          .724          .718          .72           .745          .741
RUS-1000       .714          .706          .703          .704          .727          .721
ELECTRON       .712          .74           .745          .745          .784          .784
CHINA          .703          .718          .687          .734          .718          .703
SEMI           .7            .746          .753          .753          .776          .784
N=30
------------------------------------------------------------------------------------------------
SOLAR          .666          .619          .571          .571          .619          .571
REIT           .642          .703          .715          .675          .748          .698
HACKERS        .64           .68           .68           .68           .64           .68
BIOTECH        .628          .625          .639          .663          .679          .7
GAMING         .607          .571          .571          .714          .678          .642
OILGAS         .597          .604          .673          .694          .687          .687
COMODITY       .577          .521          .563          .619          .647          .647
BEVERAGE       .55           .55           .55           .55           .55           .55
COMPUTER       .521          .652          .608          .695          .695          .652
N=9
===============================================================================================
EDU            .5            .5            .5            .666          .5            .5
==============================================================================================
FOOD           .428          .357          .357          .357          .357          .357
RETAIL         .4            .363          .381          .363          .381          .363
BONDFUND       .375          .33           .33           .375          .383          .33
GOLD           .34           .22           .38           .5            .72           .74
JETS           .333          .555          .444          .555          .555          .555
PIPELINE       0             0             .285          .142          .142          .285
N=6
|
============================================================================
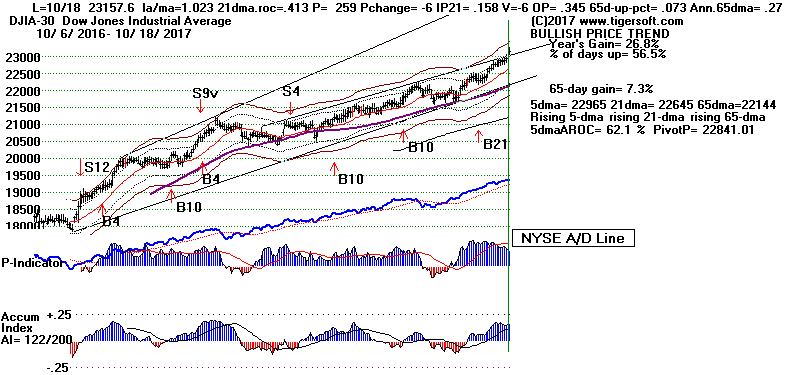
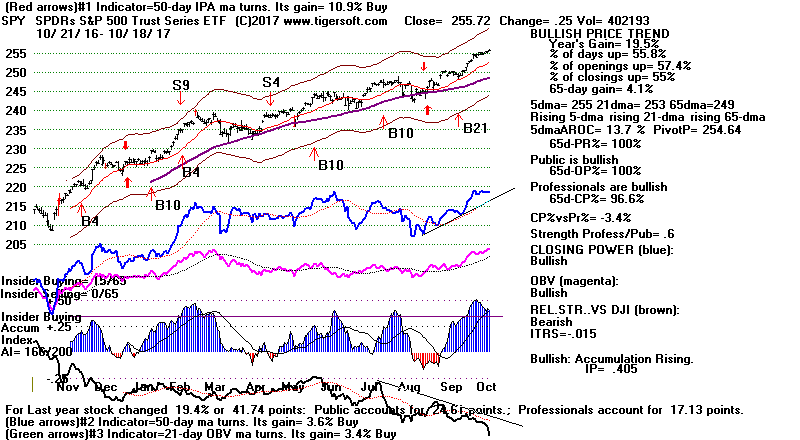
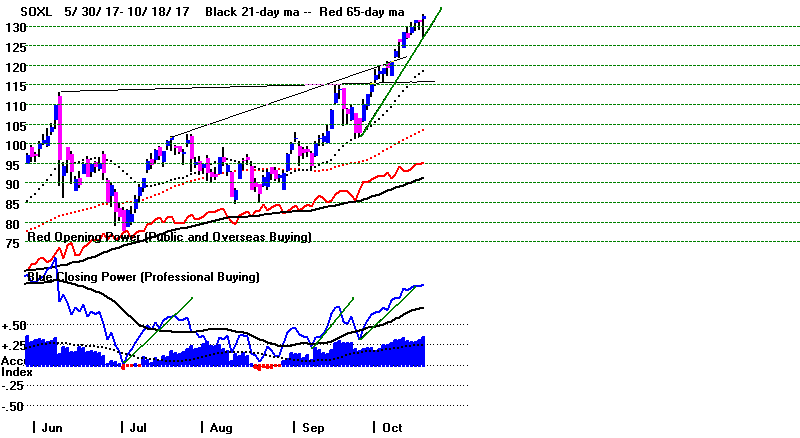
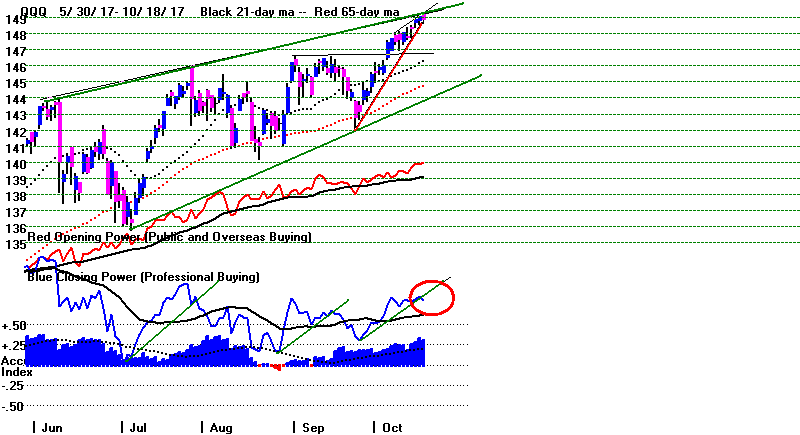
10/18/2017 We
have no Peerless Sell Signal. The
major market ETF's Closing Powers
and 5-day ma are all still rising except in the case if IWM. The
Hourly DJI and its DISI
Line are in uptrends. There are no head/shoulder tops in DJI stocks.
But
there can be little doubt that the DJI-30 is getting far ahead of the rest
of the
market, apart from leading semi-conductors, defense and a few big high
techs.
IBM and Goldman Sachs, together gained 20 points
today. Their strength
alone accounted for 130 of today's otherwise impressive jump of 160 points.
Yesterday the same thing happened, with just UNH and JNJ causing the
DJI to gain 107 of points. Yesterday there were more down than up on
the
NYSE. Today the broader market lagged, though a little differently, as
NYSE
Down Volume was more than Up Volume and the NASDAQ-100 actually
closed down for the day.
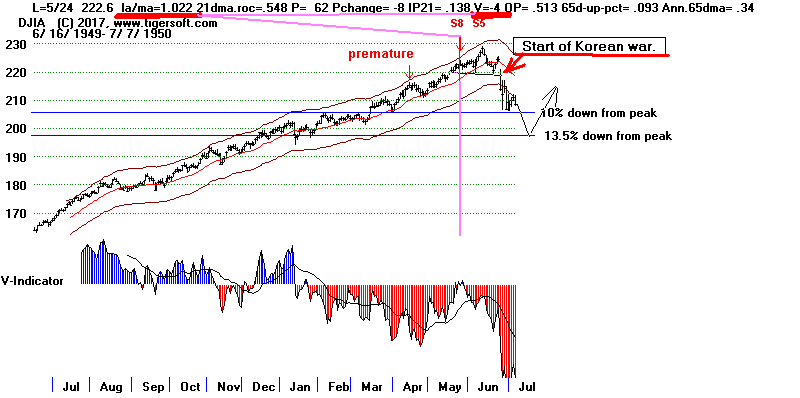
The DJI's rise today put it 2.3% over the 21-day ma.
How significant is it
when the V-I is negative and NYSE down volume is greater on a big DJI up day
with the DJI making a new high at least 2.3% over the 21-dma?
When I go back
to 1929 and look for cases with these conditions, I find a special Sell signal
would not
have worked unless there was already some other Peerless Sell signal
already. In other
words, the DJI either must be closer to the 3.5% upper band and/or the
P-Indicator
or IP21 Indicator must be much weaker than they are now. There is one
exception.
That was in 1950 not long before the start of the Korean war. In the
second case
shown on the chart below, there was a simultaneous Peerless S8 and an S5
occurred
at the actual top. Perhaps, this is a warning here. But
a useful Peerless Sell signal
can not be created just because the V-Indicator is negative with the DJI
2.3%
over the 21-dma. There must be other divergences.
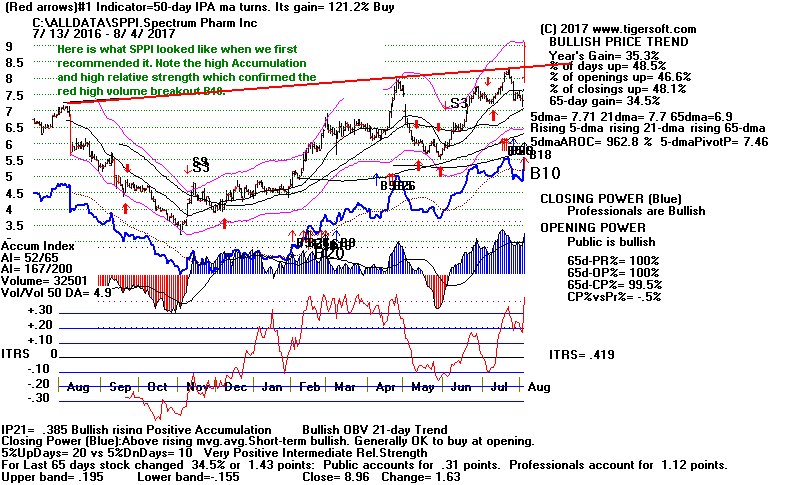
One other thing. Did you see how our
SPPI jumped
35% today on good news
from its trials for lung cancer? It has now doubled in 2 months
since I first
put it among the Bullish MAXCPs and recommended buying it on our Stocks'
Hotline.
Here is what caught our attention.
DJI and Peerless Signals and Indicators

 |
Charts 10/18/2017
PEERLESS DJI, Signals, Indicators Daily
DJI Split Volume 10-DayUp/Down
Vol
Hourly DJIA
A/D Line for
All Stocks
DJIA
S&P
OEX
NYSE
NASDAQ
COMPQX
with CP
DIA
SPY
QQQ
MDY
IWM-TNA
Short Term Interest Rates
DJI-Utilities
DJI-Transp
Nifty-30 Index
CrudeOil FAS
GLD
BBH
IBB
JETS
JNUG
KOL
NUGT
OIH
OIL
RSX
RETL SDS
SLV
SOXL
TECL
TMF
TNA UGA
(gasoline)
XIV YINN
Commodities: JJC, NIB,
CORN,
WEAT UUP
(Dollar)
AAPL ADBE
ALXN
AMAT
AMGN
AMZN BA
BABA
BIDU
CAT
FB
GOOG
GS
HD
IBM JPM
M (Macy's)
MASI
MSFT
NVDA QCOM
TSLA
TXN
ANDV,
CMG (Chipotle),
LRCX,
SWKS,
TOWN
Others REN, CVE
and SWN
10/18/2017
Bullish MAXCPs
Bearish MINCPs
|
|
Table 1 QUICKSILVER
and MAJOR ETFS
        DIA, SOXL, YINN, UGA and GLD shows across-the-board Blue
			values.

        All the major market ETFs except IWM show rising Closing
  	  Power and rising 5-dma...


       QuickSilver Documentation  This is for short-term trading
       of leveraged ETFs. It also provides a useful short-term
       outlook of these sectors ETF's and the sectors they represent.


       Blue is Bullish and Red is Bearish.

      1   Candle-Stick color is shortest-term. This changes when close vis-a-vis opng changes.

      2    5-dma AROC and Close versus pivot point is next most short-term.

           W = warning.  Close is below
			PIVOT-Point

      3   Closing Power trend-direction vs its 21-dma is next most short-term.

      4   IP21 is used to spot divergences mostly. But not its trend-breaks.

      5   IP21 falling +.15 and its 21-dma is bearish.

      6   Note price trend-lines, support/resistance and price patterns on charts.


                     QUICKSILVER on ETFS - 10/18/17
ETF      CLOSE   CHANGE     PIVOT-PT      5-dma AROC   CL-PWR      CANDLE  IP21   ITRS
---------------------------------------------------------------------------------------------
DIA       231.46    1.61     228.33        62.2%       Bullish      BLUE   .397     0
---------------------------------------------------------------------------------------------
COMPQX    6624.22    .56     6591.51       15.6%       Bullish       RED   .328  -.009
---------------------------------------------------------------------------------------------
SPY       255.72    .25      254.64        13.7%       Bullish       RED   .406  -.015
---------------------------------------------------------------------------------------------
QQQ       148.86   -.18      147.77        27.6%       Bullish       RED   .305  -.017
---------------------------------------------------------------------------------------------
MDY       331.27    1.04     330.94        6.2%        Bullish      BLUE   .301  -.008
---------------------------------------------------------------------------------------------
IWM       149.52    .71     W149.64       -7.7%         ----        ----   .21    .019
---------------------------------------------------------------------------------------------
FAS       58.85    .66       58.38        -18.8%        ----        BLUE   .318   .063
---------------------------------------------------------------------------------------------
RETL      26.01    .46       25.41        -78.1%       Bearish      BLUE   .234  -.114
---------------------------------------------------------------------------------------------
SOXL      132.46    1.29     127.1         156.7%      Bullish      BLUE   .336   .339
---------------------------------------------------------------------------------------------
TECL      97.58    .76       94.65         118.8%      Bullish       RED   .288   .11
---------------------------------------------------------------------------------------------
IBB       335.97   -2.15    W337.13       -43.3%       ----          RED   .132   .02
---------------------------------------------------------------------------------------------
GLD       122.6    .58       119.46        142.2%      Bullish      BLUE   .092   .015
---------------------------------------------------------------------------------------------
OIL       5.42   -.01        5.26          74.6%       ----         ----   .22    0
---------------------------------------------------------------------------------------------
OIH       24.34   -.47      W24.96        -211.6%      Bearish      RED    .059  -.011
---------------------------------------------------------------------------------------------
GASL      21.58   -.52      W22.32        -255.9%      ----         RED    .237   .177
---------------------------------------------------------------------------------------------
UGA       29.29    .21       28.14         122%        Bullish      BLUE   .409   .064
---------------------------------------------------------------------------------------------
UUP       24.27   -.03       24.18         28.9%       ----         RED    .03   -.048
---------------------------------------------------------------------------------------------
IEF       106.37   -.27     W106.5        -1.4%        ----         BLUE  -.105  -.054
---------------------------------------------------------------------------------------------
CORN      17.33   -.07      W17.36         37.4%      Bullish       ----   .081  -.127
---------------------------------------------------------------------------------------------
WEAT      6.36   -.05        6.34         -15.6%      Bearish       -----  .03   -.152
---------------------------------------------------------------------------------------------
YINN      34    .98          32.72         190.2%     Bullish       BLUE   .175   .16
---------------------------------------------------------------------------------------------
RSX       22.45    .05       22.3          2.2%       Bearish       ----   .115   .057
|
|
Table 2
Bulls
Remain Dominant, but Professionals are retaking some short
positions.
10/18 10/17 10/16 10/13 10/12 10/11 10/10
10/9 10/6 10/5 10/4
10/3 10/2 9/29 9/28
NEWHIGHS 381
238 423 430
402 487 481
271 371 555
444 652 700
441 407
NEWLOWS 32 32 53 50 44 44
29 21 25
19 28
25 27 25
23
-------------------------------------------------------------------------------------------------------------------------
MAXCPs 154
125 137 168
255 239 194
185 252 229
220 307 311
230 228
MINCPs
101 89 105
78 79
73 64
55 41
40 28
41 41 37
51
------------------------------------------------------------------------------------------------------------------------
TTTNHs
88 65 63 76 115 102 89 74
93 104 109
102 153 97
106
TTTNLs
153
117 138 108 92
92 75 95 65
60 52
69 47
46
62
-------------------------------------------------------------------------------------------------------------------------
FASTUP
68
65
FASTDOWN 174 166
-------------------------------------------------------------------------------------------------------------------------
MAXCPs are Closing
Power new highs. MINCPs are Closing Power new lows for any given
day.
TTTNHs are Tiger Day Traders' Tool new highs. After opening, more
upside potential than downside risk.
TTTNLs are Tiger Day Traders' Tool new lows. After opening, more
downside potential than upside risk
FASTUP are stocks/ETFs where 5-dma AROC is over 500%
FASTOWN are stocks/ETFs where 5-dma AROC is under -500%
|
Table 3
Count of Stocks and New Highs in Key Tiger Directories
Date = 171018
            No.     New Highs     Pct.
-------------------------------------------------------------------
BIGBANKS       7             3             43 %
INDEXES        213           43            20 %
SEMI-CONDUCT   130           25            19 %
SOLAR          21            4             19 %
GAMING         28            5             18 %
ELECTRON       181           30            17 %
DJI-13         13            2             15 %
ETFS           66            10            15 %
MORNSTAR       238           33            14 %
DOWJONES       30            4             13 %
-----------------------------------------------------------
INSURANC       32            4             13 %
UTILITY        43            5             12 %
SP-100         96            11            11 %
CHINA          64            7             11 %
COAL           9             1             11 %
NIFTY          30            3             10 %
FINANCE        92            8             9 %
SP500          487           43            9 %
RUS-1000       843           74            9 %
COMPUTER       25            2             8 %
AUTO           40            3             7 %
NASD-100       88            6             7 %
GREEN          31            2             6 %
HOMEBLDG       17            1             6 %
REIT           179           11            6 %
TRANSP         20            1             5 %
CHEM           71            3             4 %
BIOTECH        370           15            4 %
REGBANKS       34            1             3 %
MILITARY       38            1             3 %
SOFTWARE       63            2             3 %
INDMATER       92            2             2 %
RETAIL         55            1             2 %
OILGAS         144           1             1 %
BIGMIL         6                           0 %
HACKERS        25                          0 %
INFRA          11                          0 %
GOLD           50                          0 %
EDU            6                           0 %
PIPELINE       7                           0 %
COMODITY       69                          0 %
BEVERAGE       20                          0 %
FOOD           14                          0 %
BONDFUND       112                         0 %
HOSPITAL       8                           0 %
JETS           9                           0 %
|
 |
 Table 4

   RANKING OF KEY DIRECTORIES BASED PCT.OF STOCKS ABOVE 65-DMA
             10/18/17
Bullish = 39
Bearish = 6
---------------------------------------------------------------------------------------
Directory     Current       day-1         day-2         day-3         day-4         day-5
----------------------------------------------------------------------------------------
BIGBANKS       100%          1             1             1             1             1
BIGMIL         100%          1             1             1             1             1
REGBANKS       .97           .941          .941          .941          .941          .941
AUTO           .925          .9            .875          .85           .9            .9
DJI-13         .923          .923          .846          .846          .769          .923
NIFTY          .9            .833          .9            .933          .933          .933
ETFS           .878          .863          .878          .878          .833          .803
DOWJONES       .866          .866          .833          .833          .833          .866
FINANCE        .858          .847          .858          .869          .826          .847
MILITARY       .842          .789          .789          .842          .842          .842
CHEM           .816          .83           .83           .816          .816          .816
GREEN          .806          .806          .838          .87           .838          .838
SP-100         .802          .802          .812          .822          .812          .833
TRANSP         .8            .8            .8            .8            .85           .85
INDMATER       .793          .793          .793          .793          .739          .75
INSURANC       .781          .625          .75           .687          .656          .687
COAL           .777          .777          .777          .666          .777          .666
SOFTWARE       .777          .73           .761          .746          .761          .761
MORNSTAR       .768          .764          .76           .802          .789          .794
HOMEBLDG       .764          .823          .823          .882          .941          .823
INDEXES        .755          .765          .779          .802          .807          .826
SEMI           .746          .753          .753          .776          .784          .784
ELECTRON       .74           .745          .745          .784          .784          .779
NASD-100       .738          .727          .738          .761          .75           .727
INFRA          .727          .727          .818          .818          .727          .818
SP500          .724          .718          .72           .745          .737          .726
CHINA          .718          .687          .734          .718          .703          .703
RUS-1000       .706          .703          .704          .727          .717          .71
REIT           .703          .715          .675          .748          .703          .67
UTILITY        .697          .674          .651          .72           .79           .767
HACKERS        .68           .68           .68           .64           .68           .64
COMPUTER       .64           .6            .68           .68           .6            .64
BIOTECH        .627          .64           .664          .681          .697          .71
SOLAR          .619          .571          .571          .619          .571          .571
OILGAS         .604          .673          .694          .687          .687          .729
GAMING         .571          .571          .714          .678          .678          .642
JETS           .555          .444          .555          .555          .444          .555
BEVERAGE       .55           .55           .55           .55           .55           .55
COMODITY       .507          .55           .608          .637          .637          .652
Bullish = 39
=============================================================================================
EDU            .5            .5            .666          .5            .5            .5
=============================================================================================
RETAIL         .363          .381          .363          .381          .363          .418
FOOD           .357          .357          .357          .357          .357          .285
BONDFUND       .33           .33           .375          .383          .339          .339
HOSPITAL       .25           .25           .25           .25           .25           .25
GOLD           .22           .38           .5            .72           .7            .78
PIPELINE       0             .285          .142          .142          .285          .285
Bearish = 6
|
=================================================================================
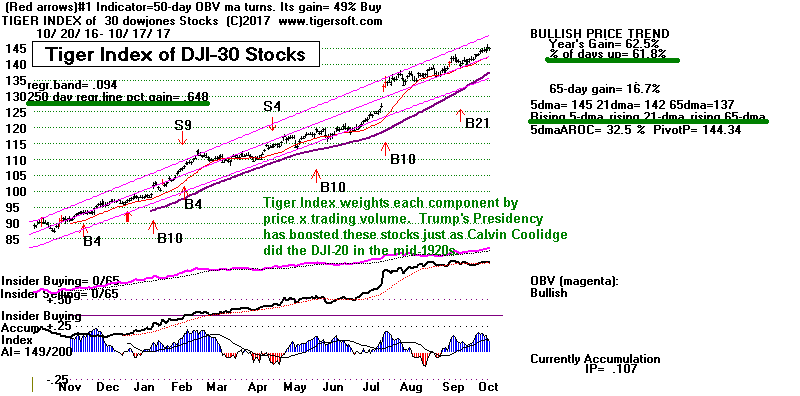
10/17/2014 The
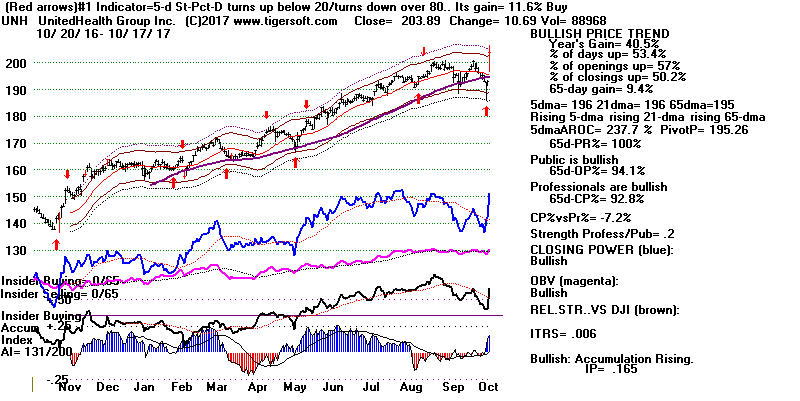
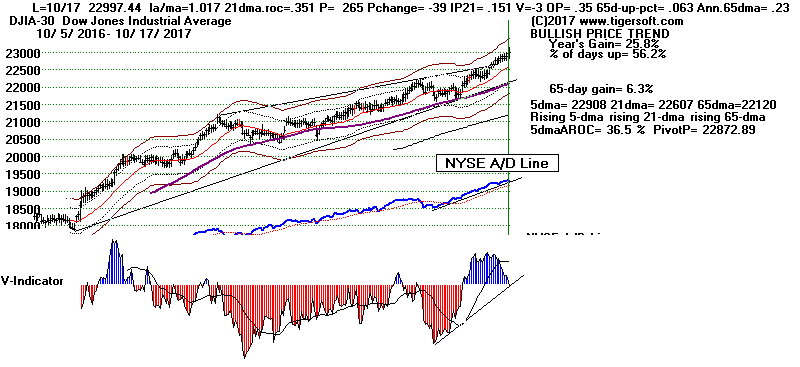
DJI (+41) just would not pull back. With the help of a 10.69 point rise in
UNH,
which is now the third most heavily weighted DJI-30 component (after Boeing
and Goldman).
the DJI closed just 2.5 points below the round number resistance of 23000.
It did this despite
a 6 point loss in Goldman Sachs, despite
there being 397 more down than up on the NYSE
and despite the fact that there were 75 million more shares traded down than
up.
Will there be much of a DJI pull-back from 23000?
I doubt it.
No Sell S9-V
Readers should note that we got no Sell S9-V today even though the DJI
closed 1.7% over
the 21-day ma and the V-I Indicator dropped below 0 today. This is because
our Peerless
program kicks out nearly all potential S9-V possibilities after September.
Of course,
other Sells could occur, but they will require the DJI to rally closer
to the 3.5% upper band
or the P-I or IP21 to drop quite a bit from their current levels. So,
do not expect
a Peerless Sell signal until the DJI runs up climactically to its 3.5% band
and or there is
much more deterioration in the P-I (21-day ma of NYSE advances-declines) or
our
Accumulation Index (IP21) falls below
its 21-day ma
The Leaders Are Tightly Held
Down Volume refuses to rise even as the DJI has run up to 23000. The
very high AI/200
scores for the NASDAQ (199 of 200),
QQQ (189 of 200) and
TECL (193 of 200)
suggest 3 more bullish aspects of the market now: first, that big-money is
still ready and willing
to buy on all dips; second, that they may have to decide to buy on strength
if they want
to own all the shares they would like to buy; third, these stocks and ETFs
are likely quite tightly
held now, which will facilitate much higher prices.

Since the Hourly
DJI-DISI Lines are in uptrends as are all the major market ETFs'
Closing Powers and 5-day moving averages, I think we must simply expect
higher
prices. The Bullish MAXCPs
should keep rising. And very likely the
Bearish MINCPs
will keep falling. Clearly, the
semi-conductor group is the biggest source of MAXCPs
now. The big Nifty-30 NASDAQ stocks were lifted again today by
AAPL and a
flat-topped breakout by Facebook (FB).
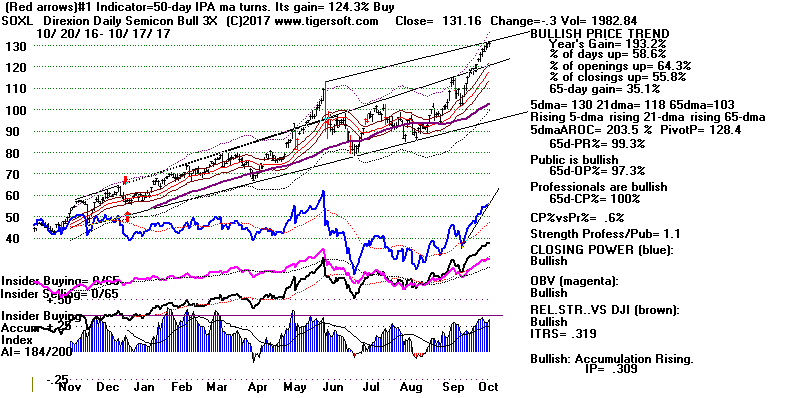
SOXL (below) has reached the top of a new potential price channel. A
retreat is suggested
by the chart. But prices are just as likely, I believe, to breakout
above the top of
channel and score some stunning gains.
Charts 10/17/2017
PEERLESS DJI, Signals, Indicators Daily
DJI Split Volume 10-DayUp/Down
Vol
Hourly DJIA
A/D Line for
All Stocks
DJIA
S&P
OEX
NYSE
NASDAQ
COMPQX
with CP
DIA
SPY
QQQ
MDY
IWM-TNA
Short Term Interest Rates
DJI-Utilities
DJI-Transp
Nifty-30 Index
CrudeOil FAS
GLD
BBH
IBB
JETS
JNUG
KOL
NUGT
OIH
OIL
RSX
RETL SDS
SLV
SOXL
TECL
TMF
TNA UGA
(gasoline)
XIV YINN
Commodities: JJC, NIB,
CORN,
WEAT UUP
(Dollar)
AAPL ADBE
ALXN
AMAT
AMGN
AMZN BA
BABA
BIDU
CAT
FB
GOOG
GS
HD
IBM JPM
M (Macy's)
MASI
MSFT
NVDA QCOM
TSLA
TXN
ANDV,
CMG (Chipotle),
LRCX,
SWKS,
TOWN
Others REN, CVE
and SWN
10/17/2017
Bullish MAXCPs
Bearish MINCPs
|
Table 1 QUICKSILVER on ETFS - 10/17/17
Only DIA shows across-the-board Blue
values.
All the major market ETFs except IWM and MDY show rising Closing
Power and rising 5-dma...
QuickSilver Documentation This is for short-term trading
of leveraged ETFs. It also provides a useful short-term outlook of these
sectors ETF's and the sectors they represent.
Blue is Bullish and Red is Bearish.
1 Candle-Stick color is shortest-term. This changes when close vis-a-vis opng changes.
2 5-dma AROC and Close versus pivot point is next most short-term.
W = warning. Close is below
PIVOT-Point
3 Closing Power trend-direction vs its 21-dma is next most short-term.
4 IP21 is used to spot divergences mostly. But not its trend-breaks.
5 IP21 falling +.15 and its 21-dma is bearish.
6 Note price trend-lines, support/resistance and price patterns on charts.
QUICKSILVER on ETFS - 10/17/17
ETF      CLOSE   CHANGE     PIVOT-PT    5-dma AROC   CL-PWR     CANDLE  IP21   ITRS
---------------------------------------------------------------------------------------------
DIA       229.85    .4       228.61        34.8%     Bullish    BLUE    .404   ---
---------------------------------------------------------------------------------------------
COMPQX    6623.66   -.34     6603.55       27.6%     Bullish    BLUE    .347  -.003
---------------------------------------------------------------------------------------------
SPY       255.47    .18      255.02        16.7%     Bullish    BLUE    .428  -.01
---------------------------------------------------------------------------------------------
QQQ       149.04    .19      148.04        48.6%     Bullish     BLUE    .326  -.01
---------------------------------------------------------------------------------------------
MDY       330.23   -.45     W330.86       -6%        Bullish    RED     .288  -.006
---------------------------------------------------------------------------------------------
IWM       148.81   -.43     W149.75       -35.1%     Bullish    RED     .209   .019
---------------------------------------------------------------------------------------------
FAS       58.19   -.69      W59.07        -66.4%     ----       RED     .317   .05
---------------------------------------------------------------------------------------------
RETL      25.55    .46      W26.41        -382.6%    Bearish    BLUE    .24   -.141
---------------------------------------------------------------------------------------------
SOXL      131.17   -.29      128.4         203.9%    Bullish     RED     .308   .319
---------------------------------------------------------------------------------------------
TECL      96.82   -.12       95.3          135.2%    Bullish     RED     .296   .103
---------------------------------------------------------------------------------------------
IBB       338.12    1.28    W338.89       -21.8%     Bullish    BLUE    .151   .025
--------------------------------------------------------------------------------------------
GLD       122.13   -.84     W122.79        -11%      Bullish     BLUE   -.038  -.019
---------------------------------------------------------------------------------------------
OIL       5.43    .01        5.34          121.9%    Bullish    ----    .216   .003
---------------------------------------------------------------------------------------------
OIH       24.81   -.2       W25.4         -109.3%    Bearish    RED     .125  -.002
---------------------------------------------------------------------------------------------
GASL      22.1    0         W22.72        -64.9%     ----       ----    .26    .197
---------------------------------------------------------------------------------------------
UGA       29.08    .28       28.59         131.4%    ----       BLUE    .415   .053
---------------------------------------------------------------------------------------------
UUP       24.3    .06        24.13         20.7%     ----       ----    .039  -.037
---------------------------------------------------------------------------------------------
IEF       106.64   -.04      106.4         16.9%     ----       BLUE   -.142  -.044
---------------------------------------------------------------------------------------------
CORN      17.4   -.04        17.2          17.3%     Bullish    ----    .054  -.12
---------------------------------------------------------------------------------------------
WEAT      6.41   -.01        6.38         -7.8%      Bearish    ----    .027  -.15
---------------------------------------------------------------------------------------------
YINN      33.02   -.63       32.74         3%        Bullish    RED     .19    .159
---------------------------------------------------------------------------------------------
RSX       22.4   -.13       W22.44         33.5%     Bearish     ----    .179   .065
|
|
Table 2
Bulls
Remain Dominant, but Professionals are retaking some short
positions.
10/17 10/16 10/13 10/12 10/11 10/10
10/9 10/6 10/5 10/4
10/3 10/2 9/29 9/28
9/27
NEWHIGHS 238 423
430 402 487
481 271 371
555 444 652
700 441 407
441
NEWLOWS 32 53 50 44 44
29 21 25
19 28
25 27 25
23 20
-------------------------------------------------------------------------------------------------------------------------
MAXCPs 125 137 168
255 239 194
185 252 229
220 307 311
230 228 197
MINCPs
89 105 78
79 73
64 55
41 40
28 41 41
37 51 63
------------------------------------------------------------------------------------------------------------------------
TTTNHs
65 63 76 115 102 89 74
93 104 109
102 153 97
106 120
TTTNLs
117 138 108 92
92 75 95 65
60 52
69 47
46
62 108
-------------------------------------------------------------------------------------------------------------------------
FASTUP
65
FASTDOWN 166
-------------------------------------------------------------------------------------------------------------------------
MAXCPs are Closing
Power new highs. MINCPs are Closing Power new lows for any given
day.
TTTNHs are Tiger Day Traders' Tool new highs. After opening, more
upside potential than downside risk.
TTTNLs are Tiger Day Traders' Tool new lows. After opening, more
downside potential than upside risk
FASTUP are stocks/ETFs where 5-dma AROC is over 500%
FASTOWN are stocks/ETFs where 5-dma AROC is under -500%
|
  TABLE 3
Count of Stocks and New Highs in Key Tiger Directories
Date = 171017
               No.          No. NH         Pct NHs
-------------------------------------------------------------------
DJI-13         13            4             31 %
SOLAR          20            6             30 %
SEMI           130           24            18 %
INDEXES        213           35            16 %
ELECTRON       181           27            15 %
---------------------------------------------------------------------
DOWJONES       30            4             13 %
NIFTY          30            4             13 %
UTILITY        43            5             12 %
BEVERAGE       20            2             10 %
SP-100         96            9             9 %
INFRA          11            1             9 %
NASD-100       88            7             8 %
GAMING         28            2             7 %
INDMATER       95            7             7 %
MORNSTAR       238           16            7 %
GREEN          31            2             6 %
HOMEBLDG       17            1             6 %
CHEM           71            4             6 %
SP500          487           30            6 %
INSURANC       34            2             6 %
RUS-1000       843           54            6 %
ETFS           66            3             5 %
BIOTECH        367           15            4 %
AUTO           40            1             3 %
SOFTWARE       64            2             3 %
CHINA          64            2             3 %
FINANCE        92            2             2 %
GOLD           50            1             2 %
RETAIL         57            1             2 %
OILGAS         152           2             1 %
remainders show 0% NHs
|
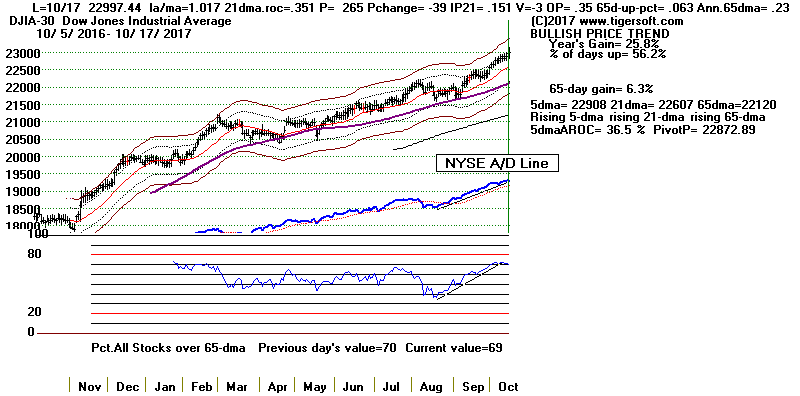 |
 RANKING OF KEY DIRECTORIES BASED PCT.OF STOCKS ABOVE 65-DMA
              10/17/17
Bullish = 38
Bearish = 7
---------------------------------------------------------------------------------------
Directory     Current       day-1         day-2         day-3         day-4         day-5
----------------------------------------------------------------------------------------
BIGBANKS       100%          1             1             1             1             1
BIGMIL         100%          1             1             1             1             1
DJI-13         .923          .846          .846          .769          .923          .846
REGBANKS       .916          .916          .916          .916          .916          .916
AUTO           .9            .875          .85           .9            .9            .925
DOWJONES       .866          .833          .833          .833          .866          .866
ETFS           .863          .878          .878          .833          .803          .833
FINANCE        .847          .858          .869          .826          .847          .836
NIFTY          .833          .9            .933          .933          .933          .866
CHEM           .83           .845          .802          .816          .816          .845
HOMEBLDG       .823          .823          .882          .941          .882          .764
GREEN          .806          .838          .87           .838          .87           .87
SP-100         .802          .812          .822          .812          .843          .822
INDMATER       .8            .8            .8            .747          .757          .726
TRANSP         .8            .8            .8            .85           .85           .85
INDEXES        .765          .779          .802          .807          .83           .845
MORNSTAR       .764          .76           .802          .789          .794          .777
MILITARY       .755          .755          .777          .8            .8            .8
SEMI           .753          .753          .776          .784          .792          .776
COAL           .75           .75           .625          .75           .625          .5
ELECTRON       .745          .745          .784          .784          .784          .779
SOFTWARE       .734          .765          .75           .765          .781          .781
INFRA          .727          .818          .818          .727          .818          .636
NASD-100       .727          .738          .761          .75           .727          .704
SP500          .718          .72           .745          .737          .731          .71
RUS-1000       .703          .704          .727          .717          .716          .701
CHINA          .687          .734          .718          .703          .703          .734
HACKERS        .68           .68           .64           .68           .68           .76
UTILITY        .674          .651          .72           .79           .767          .674
OILGAS         .671          .684          .671          .671          .71           .73
N=30
=============================================================================================
BIOTECH        .64           .662          .678          .694          .705          .713
INSURANC       .617          .735          .676          .647          .676          .676
COMPUTER       .6            .68           .68           .6            .64           .6
REIT           .583          .583          .666          .666          .583          .5
GAMING         .571          .714          .678          .678          .642          .678
BEVERAGE       .55           .55           .55           .55           .55           .55
COMODITY       .55           .608          .637          .637          .652          .594
SOLAR          .55           .55           .6            .55           .6            .65
N=8
=============================================================================================
EDU            .5            .666          .5            .5            .5            .5
=============================================================================================
JETS           .444          .555          .555          .444          .555          .555
PIPELINE       .444          .333          .222          .333          .333          .333
RETAIL         .403          .385          .403          .385          .491          .526
GOLD           .38           .5            .72           .7            .78           .72
FOOD           .357          .357          .357          .357          .285          .285
HOSPITAL       .25           .25           .25           .25           .25           .25
BONDFUND       .2            .2            .2            .2            .2            .2
N=7
|
===============================================================================
===============================================================================
10-16-2017 No Peerless Sell.
The Closing Powers and 5-day ma are still rising for
DIA,
SPY, QQQ,
SOXL and
TECL. But NYSE
Up Volume keeps dropping.
Fortunately,
Down Volume has not risen much.
Led by AAPL,
MSFT,
NFLX,
BIDU and numerous semi-conductors (AMAT,
NVDA,
TXN and
LRCX), the
DJI, the
NASDAQ and
SOXL ran upwards
to new highs. The broader market was more subdued. There were 40
more down
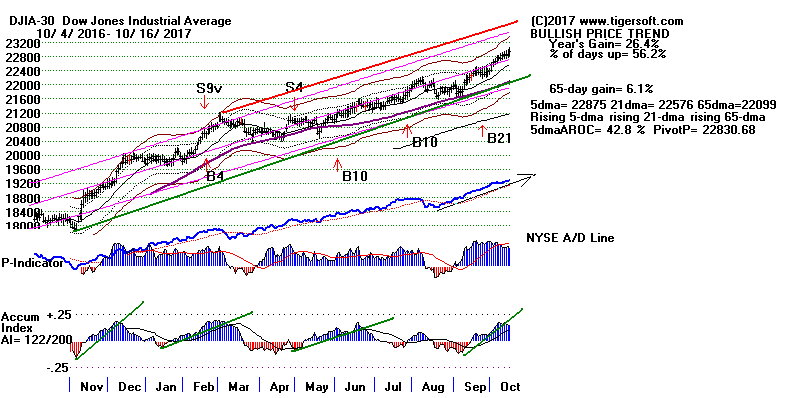
than up on the NYSE. I went back over the Peerless data to 2009 to see
if this
amount of divergence is significant with the DJI 1.7 %. or more over the
21-day ma.
What I found was that there were more than 10 instances of such divergences
which
the DJI ignored and kept rallying. The only cases where the DJI did
decline to the lower
band were when the DJI was 2.1%, 2.2%, 2.8% and 4.0% over the 21-day and the
Accumulation Index (IP21) was below .072. Presently, the DJI is only
1.7% over the
21-day ma and the IP21 is .147.
However, it is true that the V-Indicator
has fallen back to only a +6. But I do not believe
that we can get a Peerless S9-V Sell this late in the year even if the
V-Indicator were
to drop into negative territory and the DJI closes up at the 2.5% upper
band.
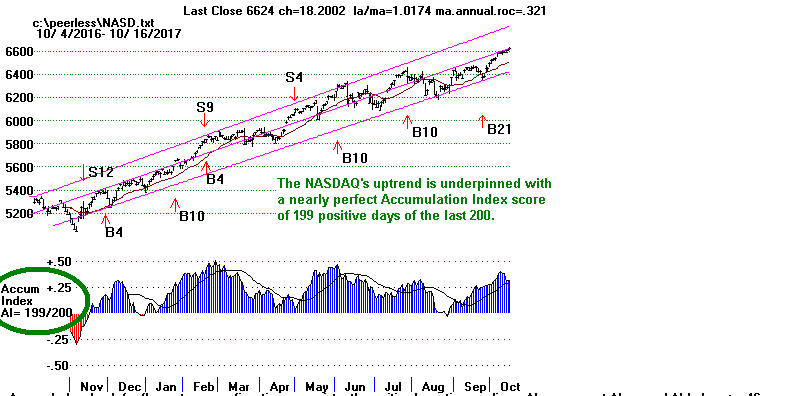
Keep in mind the record positive Accumulation on the
NASDAQ for the last year.
Not much of a decline is possible under these conditions. Rather the
upside potential
far outweighs the downside. This is the same message that the past
Peerless Buy B21s
on DJI charts is imparting!
Charts 10/16/2017
PEERLESS DJI, Signals, Indicators Daily
DJI Split Volume 10-DayUp/Down
Vol
Hourly DJIA
A/D Line for
All Stocks
DJIA
S&P
OEX
NYSE
NASDAQ
COMPQX
with CP
DIA
SPY
QQQ
MDY
IWM-TNA
Short Term Interest Rates
DJI-Utilities
DJI-Transp
Nifty-30 Index
CrudeOil FAS
GLD
BBH
IBB
JETS
JNUG
KOL
NUGT
OIH
OIL
RSX
RETL SDS
SLV
SOXL
TECL
TMF
TNA UGA
(gasoline)
XIV YINN
Commodities: JJC, NIB,
CORN,
WEAT UUP
(Dollar)
AAPL ADBE
ALXN
AMAT
AMGN
AMZN BA
BABA
BIDU
CAT
FB
GOOG
GS
HD
IBM JPM
M (Macy's)
MASI
MSFT
NVDA QCOM
TSLA
TXN
ANDV,
CMG (Chipotle),
LRCX,
SWKS,
TOWN
Others REN, CVE
and SWN
10/16/2017
Bullish MAXCPs
Bearish MINCPs
|
Table 1 QUICKSILVER on ETFS - 10/16/17
QuickSilver Documentation This is for short-term trading
of leveraged ETFs. It also provides a useful short-term outlook of these
sectors ETF's and the sectors they represent.
Blue is Bullish and Red is Bearish.
1 Candle-Stick color is shortest-term. This changes when close vis-a-vis opng changes.
2 5-dma AROC and Close versus pivot point is next most short-term.
W = warning. Close is below
PIVOT-Point
3 Closing Power trend-direction vs its 21-dma is next most short-term.
4 IP21 is used to spot divergences mostly. But not its trend-breaks.
5 IP21 falling +.15 and its 21-dma is bearish.
6 Note price trend-lines, support/resistance and price patterns on charts.
Blue Across-the-Board = TECL, SOXL and YINN
All major general market ETFs have rising Closing Power trends.
Except IBB
IWM, FAS and IBB now show a falling 5-dma.
W = warning. Close is below
PIVOT-Point QUICKSILVER on ETFS - 10/16/17
ETF      CLOSE   CHANGE     PIVOT-PT    5-dma AROC   CL-PWR     CANDLE    IP21   ITRS
---------------------------------------------------------------------------------------------
DIA       229.45    .72      228.26        42.1%    Bullish      BLUE     .398    ---
---------------------------------------------------------------------------------------------
COMPQX    6624    18.2       6587.25       33.6%    Bullish      BLUE     .32    .003
---------------------------------------------------------------------------------------------
SPY       255.29    .34      254.62        26.3%    Bullish      BLUE     .402  -.008
---------------------------------------------------------------------------------------------
QQQ       148.85    .51      147.6         46%      Bullish      BLUE     .283  -.004
---------------------------------------------------------------------------------------------
MDY       330.68   -.05      330.63        15.9%    Bullish      RED      .316  -.004
---------------------------------------------------------------------------------------------
IWM       149.24   -.13     W149.86       -6.3%     Bullish      RED       .239   .024
---------------------------------------------------------------------------------------------
FAS       58.88    .43      W58.97         51.2%    Bullish      BLUE      .369   .063
---------------------------------------------------------------------------------------------
RETL      25.09   -.48      W27.54        -419.7%   Bearish      RED       .209  -.147
---------------------------------------------------------------------------------------------
SOXL      131.46    1.86     125.93        312.4%   Bullish      BLUE      .28    .393
---------------------------------------------------------------------------------------------
TECL      96.94    1.02      94.24         154%     Bullish      BLUE      .251   .124
---------------------------------------------------------------------------------------------
IBB       336.84    .46     W339.59       -39%      Bearish      BLUE      .137   .027
---------------------------------------------------------------------------------------------
GLD       122.97   -.85     122.40         36.2     Bearish      RED      -.054  -.013
---------------------------------------------------------------------------------------------
OIL       5.42    .07        5.3           294%     Bullish      ----      .225   .002
---------------------------------------------------------------------------------------------
OIH       25.01   -.06      W25.36        -99%      ----         RED        .16   -.018
---------------------------------------------------------------------------------------------
GASL      22.1   -.03       W22.39        -82.6%    ----         RED        .3     .13
---------------------------------------------------------------------------------------------
UGA       28.8   -.04        28.33         203.1%   Bearish      RED        .335   .034
---------------------------------------------------------------------------------------------
UUP       24.24    .06       24.2         -18.6%    Bullish      ----      .073  -.04
---------------------------------------------------------------------------------------------
IEF       106.68   -.18      106.28        20.7%    Bearish      ----      -.139  -.043
---------------------------------------------------------------------------------------------
CORN      17.44   -.07       17.34         14.4%    Bullish      RED        .025  -.108
---------------------------------------------------------------------------------------------
WEAT      6.42   -.06        6.42         -23.4%    Bearish       RED       .027  -.135
---------------------------------------------------------------------------------------------
YINN      33.45    .73       32.21         122.5%   Bullish      BLUE       .234   .186
---------------------------------------------------------------------------------------------
RSX       22.53   -.03       22.25         94%      Bearish       RED       .116   .08
|
| Table 2 Bulls
Remain Dominant, but Professionals are retaking some short
positions.
10/16 10/13 10/12 10/11 10/10
10/9 10/6 10/5 10/4
10/3 10/2 9/29 9/28
9/27 9/26
NEWHIGHS 423 430 402 487
481 271 371
555 444 652
700 441 407
441 235
NEWLOWS 53 50 44 44
29 21 25
19 28
25 27 25
23 20
20
-------------------------------------------------------------------------------------------------------------------------
MAXCPs 137 168 255 239
194 185 252
229 220 307
311 230 228 197
125
MINCPs 105 78 79 73 64
55 41
40 28
41 41 37
51 63
70
------------------------------------------------------------------------------------------------------------------------
TTTNHs
63 76 115 102 89 74
93 104 109
102 153 97
106 120 114
TTTNLs 138 108 92
92 75 95 65
60 52
69 47
46
62 108
134
MAXCPs are Closing
Power new highs. MINCPs are Closing Power new lows for any given
day.
TTTNHs are Tiger Day Traders' Tool new highs. After opening, more
upside potential than downside risk.
TTTNLs are Tiger Day Traders' Tool new lows. After opening, more
downside potential than upside risk
|
Table 3

Count of Stocks and New Highs in Key Tiger Directories
Date = 171016
-------------------------------------------------------------------
NIFTY-30       30            9             30 %
BIGBANKS       7             2             29 %
ETFS           66            19            29 %
SOLAR          20            5             25 %
INDEXES        213           43            20 %
BEVERAGE       20            4             20 %
GREEN          31            6             19 %
GAMING         28            5             18 %
ELECTRON       181           33            18 %
DOWJONES       30            5             17 %
MORNSTAR       238           40            17 %
SEMI           142           23            16 %
REGBANKS       34            5             15 %
DJI-13         13            2             15 %
SP-100         96            14            15 %
-----------------------------------------------------
FOOD           14            2             14 %
INDMATER       95            12            13 %
UTILITY        45            6             13 %
CHEM           66            8             12 %
CHINA          66            8             12 %
MILITARY       38            4             11 %
SP500          487           53            11 %
RUS-1000       843           91            11 %
NASD-100       88            10            11 %
SOFTWARE       63            6             10 %
INFRA          11            1             9 %
COMODITY       70            6             9 %
FINANCE        92            7             8 %
HACKERS        25            2             8 %
HOMEBLDG       17            1             6 %
INSURANC       33            2             6 %
AUTO           39            2             5 %
OILGAS         150           6             4 %
BIOTECH        235           9             4 %
COMPUTER       23            1             4 %
GOLD           50            2             4 %
REIT           180           6             3 %
RETAIL         56            1             2 %
BONDFUND       112           2             2 %
BIGMIL         6                           0 %
TRANSP         20                          0 %
COAL           8                           0 %
EDU            6                           0 %
PIPELINE       7                           0 %
HOSPITAL       8                           0 %
JETS           9                           0 %
|
 |
Table 4 RANKING OF KEY DIRECTORIES BASED PCT.OF STOCKS ABOVE 65-DMA
Bullish = 40
Bearish = 4
10/16/2017
---------------------------------------------------------------------------------------
Directory Current day-1 day-2 day-3 day-4 day-5
----------------------------------------------------------------------------------------
BIGBANKS 100% 1 1 1 1 1
BIGMIL 100% 1 1 1 1 1
REGBANKS .941 .941 .941 .941 .941 .941
NIFTY .9 .933 .933 .933 .866 .8
ETFS .878 .878 .833 .803 .833 .803
AUTO .871 .846 .897 .897 .923 .923
FINANCE .858 .869 .826 .847 .836 .815
CHEM .848 .818 .818 .818 .848 .848
CHINA .848 .818 .818 .818 .848 .848
DJI-13 .846 .846 .769 .923 .846 .846
GREEN .838 .87 .838 .87 .87 .838
DOWJONES .833 .833 .833 .866 .866 .833
HOMEBLDG .823 .882 .941 .882 .764 .882
INFRA .818 .818 .727 .818 .636 .727
SP-100 .812 .822 .812 .843 .822 .802
TRANSP .8 .8 .85 .85 .8 .7
INDMATER .789 .789 .747 .747 .736 .736
MILITARY .789 .842 .842 .842 .842 .842
INDEXES .779 .802 .807 .83 .835 .821
SOFTWARE .761 .746 .761 .777 .777 .777
MORNSTAR .76 .802 .789 .794 .777 .726
INSURANC .757 .696 .666 .696 .696 .666
COAL .75 .625 .75 .625 .5 .5
ELECTRON .745 .784 .784 .784 .773 .767
NASD-100 .738 .761 .75 .727 .704 .681
SP500 .72 .745 .737 .731 .708 .7
SEMI .718 .739 .753 .753 .732 .725
GAMING .714 .678 .678 .642 .678 .714
RUS-1000 .704 .727 .717 .716 .701 .69
OILGAS .7 .686 .686 .726 .746 .746
COMPUTER .695 .695 .608 .652 .608 .608
HACKERS .68 .64 .68 .68 .76 .76
REIT .672 .744 .7 .677 .65 .644
EDU .666 .5 .5 .5 .5 .5
UTILITY .644 .711 .777 .755 .666 .533
BIOTECH .642 .663 .676 .697 .706 .719
COMODITY .614 .642 .642 .657 .628 .571
JETS .555 .555 .444 .555 .444 .222
BEVERAGE .55 .55 .55 .55 .6 .5
SOLAR .55 .6 .55 .6 .65 .55
=============================================================================================
GOLD .5 .72 .7 .78 .78 .76
=============================================================================================
BONDFUND .375 .383 .339 .348 .33 .285
RETAIL .375 .375 .357 .482 .5 .517
FOOD .357 .357 .357 .285 .285 .285
HOSPITAL .25 .25 .25 .25 .25 .25
PIPELINE .142 .142 .285 .285 .285 .285
|
================================================================================
10-13-2017 We have to
remain quite bullish.
It will take something truly awful to stop the
market's rally now. Let's hope the
rally continues! Past September B21s like the one that occurred on September
25th
have brought very big gains, only very small losses and mostly no Sell
signal until
the following Spring. See my study of these bullish signals
here. The
charts shown
here fully support a bullish expectation. In the DJI chart, the A/D
Line is confirming
the DJI's strength. The P-I, IP21 and V-I are sufficiently positive to
prevent a Sell
for now. The Hourly DJI and DISI-OBV show no weakness and are in nice
uptrends.
The Accumulation Index/200 score for the NASDAQ is 198. If this were a
DJI-30 stock
in the period between 1970 and 2000, the average subsequent gain over the
next 18 months
would be 37%. Readings this high are very rare. If the price
uptrend-channel is broken above,
I would expect a "melt up", vertical take-off as the rate of ascent
accelerates. The Closing
Powers are rising. Eager Professionals are net-buyers. Look at
the bullish "alligator snout"
patterns in the charts of NASDAQ and SPY. Upside breakouts are likely
from these.
Tech stocks are poised for more gains. TECL is at the top if its price
channel. With so much
Accumulation and a rising Closing Power, an upside breakout seems quite
likely. MSFT and
GOOG are showing the way here.
But there is an upswing globally. Look at the charts of IXUS
and VEA (AI/200=200!, high volume and breakout) below.
There are lots of
Bullish MAXCPs situations
but the two situations I favor the most are
CDNS (semi-conductor designer tools) and TSM (Taiwan semi-conductor maker).
They show what we like to see: Steady Accumulation, High current
Accumulation (IP21)
and up-trending Closing Power and prices. See their charts below.
Charts 10/13/2017
PEERLESS DJI, Signals, Indicators Daily
DJI Split Volume 10-DayUp/Down
Vol
Hourly DJIA
A/D Line for
All Stocks
DJIA
S&P
OEX
NYSE
NASDAQ
COMPQX
with CP
DIA
SPY
QQQ
MDY
IWM-TNA
Short Term Interest Rates
DJI-Utilities
DJI-Transp
Nifty-30 Index
CrudeOil FAS
GLD
BBH
IBB
JETS
JNUG
KOL
NUGT
OIH
OIL
RSX
RETL SDS
SLV
SOXL
TECL
TMF
TNA UGA
(gasoline)
XIV YINN
Commodities: JJC, NIB,
CORN,
WEAT UUP
(Dollar)
AAPL ADBE
ALXN
AMAT
AMGN
AMZN BA
BABA
BIDU
CAT
FB
GOOG
GS
HD
IBM JPM
M (Macy's)
MASI
MSFT
NVDA QCOM
TSLA
TXN
ANDV,
CMG (Chipotle),
LRCX,
SWKS,
TOWN
Others REN, CVE
and SWN
10/13/2017
Bullish MAXCPs
Bearish MINCPs
|
Table 1 QUICKSILVER on ETFS - 10/12/17
QuickSilver Documentation This is for short-term trading
of leveraged ETFs. It also provides a useful short-term outlook of these
sectors ETF's and the sectors they represent.
Blue is Bullish and Red is Bearish.
1 Candle-Stick color is shortest-term. This changes when close vis-a-vis opng changes.
2 5-dma AROC and Close versus pivot point is next most short-term.
W = warning. Close is below
PIVOT-Point
3 Closing Power trend-direction vs its 21-dma is next most short-term.
4 IP21 is used to spot divergences mostly. But not its trend-breaks.
5 IP21 falling +.15 and its 21-dma is bearish.
6 Note price trend-lines, support/resistance and price patterns on charts.
Blue Across-the-Board = TECL, SOXL and YINN
All major general market ETFs have rising Closing Power trends.
Except IBB
Red candlesticks for COMPQ (NASDAQ),
SPY, MDY, IWM, IBB
Watch pivot-points:
IWM, FAS and IBB now show a falling 5-dma.
W = warning. Close is below
PIVOT-Point
ETF      CLOSE   CHANGE     PIVOT-PT    5-dma AROC   CL-PWR    CANDLE  IP21   ITRS
---------------------------------------------------------------------------------------------
DIA       228.73    .4       227.53     25.9%        Bullish    ----   .39    ----
--------------------------------------------------------------------------------------------
COMPQX    6605.8    14.29    6579.74    11.9%        Bullish    RED    .318   .002
--------------------------------------------------------------------------------------------
SPY       254.95    .31      253.95     11.4%        Bullish    RED    .428  -.007
---------------------------------------------------------------------------------------------
QQQ       148.34    .57      147.49     23%          Bullish    ----   .254  -.005
---------------------------------------------------------------------------------------------
MDY       330.73   -.21      329.63      2.1%        Bullish    RED    .367    0
---------------------------------------------------------------------------------------------
IWM       149.37   -.27     W149.43    -22.7%        Bullish    RED    .306   .031
---------------------------------------------------------------------------------------------
FAS       58.45    .07       58.28     -17%          Bullish    BLUE   .374   .071
---------------------------------------------------------------------------------------------
RETL      25.57    .16      W27.31    -605.1%        Bearish    RED     .224  -.102
---------------------------------------------------------------------------------------------
SOXL      129.6    2.5       123.53    343.5%        Bullish    BLUE   .28     .375
---------------------------------------------------------------------------------------------
TECL      95.92    1.27      94.02     134.1%        Bullish    BLUE   .259    .122
---------------------------------------------------------------------------------------------
IBB       336.38   -.75     W339.48    -60.5%        Bearish     RED    .177    .03
---------------------------------------------------------------------------------------------
GLD       122.6    .58       119.46    142.2%        Bullish    BLUE    .092   .025
---------------------------------------------------------------------------------------------
OIL       5.35    .09        5.11      258.7%        Bullish    ----    .261   .003
---------------------------------------------------------------------------------------------
OIH       25.07    .11      W25.51     -69.1%        ----       RED      .24   -.015
---------------------------------------------------------------------------------------------
GASL      22.13   -.19      W22.47     -82.3%        ----       RED     .319   .192
---------------------------------------------------------------------------------------------
UGA       28.84    .7        27.65     199.4%        ----      BLUE     .363    .04
---------------------------------------------------------------------------------------------
UUP       24.18    0        W24.33     -39.2%        ----      BLUE     .069   -.033
---------------------------------------------------------------------------------------------
IEF       106.86    .36      106.24     34.8%        Bearish   ----   -.104    -.043
---------------------------------------------------------------------------------------------
CORN      17.51    .15      W17.39      28.8%        Bullish   BLUE    .051    -.097
---------------------------------------------------------------------------------------------
WEAT      6.48    .14        6.45      -38.9%        ----      BLUE    .061    -.128
---------------------------------------------------------------------------------------------
YINN      33.45    .73       32.21     122.5%        Bullish   BLUE    .234     .187
---------------------------------------------------------------------------------------------
RSX       22.56    .26       22.11      96.6%        Bearish   BLUE    .176     .087
|
Bulls Remain Dominant
Table 2
10/13 10/12 10/11 10/10 10/9
10/6 10/5 10/4 10/3
10/2 9/29 9/28 9/27
9/26 9/25
NEWHIGHS 430 402 487
481 271 371
555 444 652
700 441 407
441 235 221
NEWLOWS 50 44 44
29 21 25
19 28
25 27 25
23 20
20 31
-------------------------------------------------------------------------------------------------------------------------
MAXCPs 168 255 239
194 185 252
229 220 307
311 230 228 197
125 153
MINCPs
78 79 73 64
55 41
40 28
41 41 37
51 63
70 59
------------------------------------------------------------------------------------------------------------------------
TTTNHs
76 115 102 89 74
93 104 109
102 153 97
106 120 114 98
TTTNLs 108 92 92 75 95 65
60 52
69 47
46
62 108
134 139
MAXCPs are Closing
Power new highs. MINCPs are Closing Power new lows for any given
day.
TTTNHs are Tiger Day Traders' Tool new highs. After opening, more
upside potential than downside risk.
TTTNLs are Tiger Day Traders' Tool new lows. After opening, more
downside potential than upside risk.
Count of Stocks in Key Tiger Directories
Date = 171013
--------------------------------------
NEWHIGHS       430
NEWLOWS        50
MAXCP          168
MINCP          78
TTTNH          76
TTTNL          108
FASTUP         67
FASTDOWN       138
CPCROSSA       55
CPCROSSD       100
BIGVOLUP       2
BIGVODN        10
ACCUMVER       63
HIGHIP21       196
HIUPPCT        135
VHIP21         38
LOWACCUM       153
REDSELL        86
AUGSELS7       18
TRAPDOOR       10
|
Table 3
Count of Stocks and New Highs in Key Tiger Directories
Date = 171013
-------------------------------------------------------------------
ETFS           68            27            40 %
NIFTY-30       30            10            33 %
SOLAR          19            5             26 %
DOWJONES       30            7             23 %
CHINA          64            15            23 %
NASD-100       93            19            20 %
ELECTRON       194           36            19 %
SEMI           142           27            19 %
CHEM           72            13            18 %
SP-100         96            17            18 %
SOFTWARE       64            11            17 %
INDEXES        213           34            16 %
MORNSTAR       238           39            16 %
DJI-13         13            2             15 %
FOOD           14            2             14 %
GAMING         30            4             13 %
INDMATER       98            13            13 %
SP500          487           65            13 %
------------------------------------------------------
HACKERS        27            3             11 %
RUS-1000       843           95            11 %
COAL           9             1             11 %
GREEN          31            3             10 %
FINANCE        92            9             10 %
INFRA          11            1             9 %
RETAIL         58            5             9 %
UTILITY        45            4             9 %
REGBANKS       193           13            7 %
MILITARY       45            3             7 %
REIT           179           12            7 %
COMODITY       71            5             7 %
HOMEBLDG       18            1             6 %
INSURANC       35            2             6 %
AUTO           40            2             5 %
TRANSP         20            1             5 %
BEVERAGE       20            1             5 %
COMPUTER       25            1             4 %
GOLD           50            2             4 %
OILGAS         158           4             3 %
BIOTECH        254           6             2 %
BONDFUND       112           1             1 %
BIGBANKS       7                           0 %
BIGMIL         6                           0 %
EDU            8                           0 %
PIPELINE       9                           0 %
HOSPITAL       7                           0 %
JETS           9                           0 %
|
NYSE A/D Line is rising and is at a new high.
71% of all stocks and ETFs are above their 65-dma.
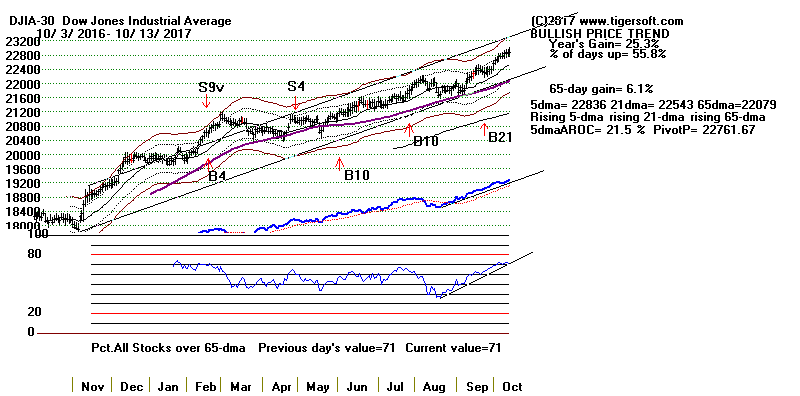
Table 4RANKING OF KEY DIRECTORIES BASED PCT.OF STOCKS ABOVE 65-DMA
10/13/17
        Bullish = 41
        Bearish = 5
---------------------------------------------------------------------------------------
Directory     Current       day-1         day-2         day-3         day-4         day-5
----------------------------------------------------------------------------------------
BIGBANKS       100%          1             1             1             1             1
BIGMIL         100           1             1             1             1             1
NIFTY          .933          .933          .933          .866          .833          .833
HOMEBLDG       .888          .944          .888          .777          .888          .888
GREEN          .87           .838          .87           .87           .838          .935
FINANCE        .869          .826          .847          .836          .815          .836
ETFS           .867          .823          .794          .823          .794          .808
AUTO           .85           .9            .9            .925          .925          .9
DJI-13         .846          .769          .923          .846          .923          .846
DOWJONES       .833          .833          .866          .866          .866          .833
SP-100         .822          .812          .843          .822          .812          .833
INFRA          .818          .727          .818          .636          .727          .727
CHEM           .805          .805          .791          .833          .833          .847
INDEXES        .802          .807          .83           .835          .821          .798
MORNSTAR       .802          .789          .794          .777          .731          .777
MILITARY       .8            .8            .777          .8            .8            .822
TRANSP         .8            .85           .85           .8            .7            .7
INDMATER       .795          .755          .755          .744          .744          .795
ELECTRON       .788          .788          .788          .773          .768          .788
NASD-100       .774          .763          .741          .72           .709          .72
REGBANKS       .751          .709          .689          .663          .658          .621
SOFTWARE       .75           .765          .781          .781          .781          .75
SP500          .745          .737          .731          .708          .704          .722
REIT           .743          .698          .675          .648          .642          .608
SEMI           .739          .753          .753          .732          .725          .739
RUS-1000       .727          .717          .716          .701          .69           .708
GOLD           .72           .7            .78           .78           .78           .66
CHINA          .718          .703          .703          .734          .718          .718
UTILITY        .711          .777          .755          .666          .555          .577
INSURANC       .685          .657          .685          .685          .685          .714
OILGAS         .683          .677          .708          .727          .727          .746
COMPUTER       .68           .6            .64           .6            .64           .68
BIOTECH        .669          .677          .696          .712          .716          .744
-----------------------------------------------------------------------------------------------
COAL           .666          .777          .666          .555          .555          .666
GAMING         .666          .666          .633          .666          .7            .8
COMODITY       .647          .647          .661          .633          .591          .507
SOLAR          .631          .578          .631          .684          .578          .684
HACKERS        .629          .666          .666          .74           .74           .777
EDU            .625          .625          .625          .625          .625          .625
JETS           .555          .444          .555          .444          .222          .222
BEVERAGE       .55           .55           .55           .6            .5            .4
===============================================================================================
RETAIL         .396          .379          .5            .517          .517          .62
BONDFUND       .383          .339          .348          .33           .294          .285
FOOD           .357          .357          .285          .285          .285          .357
PIPELINE       .333          .444          .333          .333          .333          .444
HOSPITAL       .285          .285          .285          .285          .285          .285
N=5
|
==================================================================================
10-12-2017
Bank stocks weakened a little today, but there were
more up than down on the NYSE.
Moreover, the Hourly DISI
and the key major market ETFs' Closing Powers and
5-day moving averages are all rising. See the QuickSilver Table 1
below. So are the
NYSE A/D Line and the trend of the
DJI's Accumulation Index. There
remains a clear
preponderance of MAXCPs and New Highs to their counter-parts MINCPs and
New Lows. See Table 2 below.) While it's true
NYSE Up Volume is waning,
except for some very weak MINCPs
which could be used for hedging by shorting,
NYSE Down Volume is not rising.
Reviewing all this, most likely we are seeing only some hesitation before
the advance
begins again. Certainly, no bearish Distribution-Top-Price-Patterns
are seen among
the key indexes and ETFs which could bring on a judged Sell S10 in the DJI.
Special Bullishness of Strong A/D Line in September
I think we should remain quite bullish.
I mentioned several weeks ago how bullish
a strong September would be. I have decided to show that tonight in
the form of
a new Peerless Buy signal, a Buy B21. This reinforcing Buy would have
occurred
on September 25th. More exactly,
I've back-tested the concept of a new Peerless
Buy signal occurring when the
NYSE A/D Line
makes a 150-day new high in the
last week of
September with positive IP21 and V-I values.
Below, see all the past
cases
since 1929. The average gain, assuming one sold the DJI on the next
automatic
Peerless Sell
signal would have been a whopping +17.3%. Only in one case, 1950,
would there have been a brief paper loss as big as 2%.
It's true that there have only been 8 prior cases.
But like all our Peerless signals
they are not arbitrary. Rather, they make intuitive sense. We
know that Septembers
are more likely than any other month to bring weakness in the general
market. Here
it is the unusualness of both price and internal strength at this time that makes the market
standout as being bullish. This
notion came to me, I remember, as I watched the market
rally in September
and October 2006. I did not take the time to make it into a Buy Signal
because it was never needed to reverse a Peerless Sell. But now, I can
see its value lies
in showing just how bullish the market would seem to be. I have posted all the
charts for
these
signals elsewhere. This signal will have to be added to the new
Peerless book, which
should be done soon.
Previous Buy B21s
<1>
Date
la/ma AROC P-I
IP21 V-I OPct
Result
--------------------------------------------------------------------------------
9/25/1942 1.023 .424 75 .257
40 .564 Gain = +30.2% S8 on 6/2/1943.
9/25/1945 1.017 .643 183 .296 190
.319 Gain = +11.0% S9 on 1/10/1946.
9/29/1949 1.009 .244 98 .143
58 .169 Gain = +20.9% S8 on 5/18/1950.
9/29/1950 1.016 .498 119 .131 111
.383 Gain = +14.4% S9 on 4/30/1951.
9/29/1958 1.016 .488 84 .098
24 .234 Gain = +20.4% S12 on 7/1/1958
9/25/1964 1.019 .633 102 .092 29
.499 Gain = +7.3% S7 on 5/13/1965
9/26/2006 1.017 .400 342 .091 23
.255 Gain = +6.2% S19 on 1/5/2007
9/29/2010 1.026 .934 511 .173 126
.489 Gain = +18.2% S12 on 6/30/2011
-----------------------------------------------------------------------------------
Avg. Gain = +17.3%
9/25/2017 1.010 .277 410
.064 56 .471
<1> There already is another different
type of Buy-on-Strength Buy B21 that
occurs in the last three months of the year. This can be easily
distinguished from
the new B21 by its always taking place at the end of September. Our
new Peerless
book will show all the years' charts and list all of each signals' cases and
results.
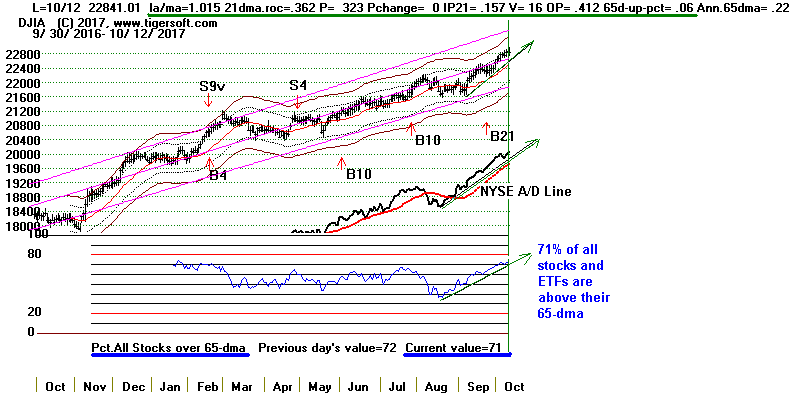
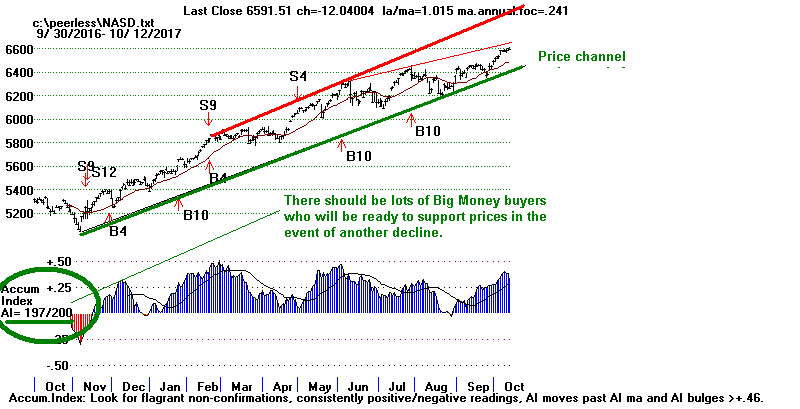
Charts 10/12/2017
PEERLESS DJI, Signals, Indicators Daily
DJI Split Volume 10-DayUp/Down
Vol
Hourly DJIA
A/D Line for
All Stocks
DJIA
S&P
OEX
NYSE
NASDAQ
COMPQX
with CP
DIA
SPY
QQQ
MDY
IWM-TNA
Short Term Interest Rates
DJI-Utilities
DJI-Transp
Nifty-30 Index
CrudeOil FAS
GLD
BBH
IBB
JETS
JNUG
KOL
NUGT
OIH
OIL
RSX
RETL SDS
SLV
SOXL
TECL
TMF
TNA UGA
(gasoline)
XIV YINN
Commodities: JJC, NIB,
CORN,
WEAT UUP
(Dollar)
AAPL ADBE
ALXN
AMAT
AMGN
AMZN BA
BABA
BIDU
CAT
FB
GOOG
GS
HD
IBM JPM
M (Macy's)
MASI
MSFT
NVDA QCOM
TSLA
TXN
ANDV,
CMG (Chipotle),
LRCX,
SWKS,
TOWN
Others REN, CVE
and SWN
10/12/2017
Bullish MAXCPs
Bearish MINCPs
|
 Table 1           QUICKSILVER on ETFS - 10/12/17

     QuickSilver Documentation  This is for short-term trading
       of leveraged ETFs. It also provides a useful short-term outlook of these
       sectors ETF's and the sectors they represent.

       Blue is Bullish and Red is Bearish.
     1 Candle-Stick color is shortest-term. This changes when close vis-a-vis opng changes.
     2 5-dma AROC and Close versus pivot point is next most short-term.
     3 Closing Power trend-direction vs its 21-dma is next most short-term.
     4 IP21 is used to spot divergences mostly. But not its trend-breaks.
     5 IP21 falling +.15 and its 21-dma is bearish.
     6 Note price trend-lines, support/resistance and price patterns on charts.

      Red candlesticks for DIA, COMPQ (NASDAQ),FAS, SOXL, TECL
                           and IBB
      Watch pivot-points:
        DIA's 5-dma would turn down if it closed down 0.89
          COMPQX would turn down if it closed down 1.34
          SPY would turn down if it closed down .28
          QQQ would turn down if it closed down .12
          MDY would turn down if it closed down .36
          TECL would turn down if it closed down 1.27

        IWM and FAS now show a falling 5-dma.

        Only SOXL seems too far above its pivot-point to see its 5-day ma turn down.
ETF      CLOSE   CHANGE     PIVOT-PT      5-dma AROC   CL-PWR   CANDLE  IP21  ITRS (Rel.Str.)
---------------------------------------------------------------------------------------------
DIA       228.33   -.28      227.55        15.1%       Bullish   RED     .424    ---
---------------------------------------------------------------------------------------------
COMPQX    6591.51  -12.04   6590.18         4.7%       Bullish   RED     .31    -.002
---------------------------------------------------------------------------------------------
SPY       254.64   -.38      254.37        -.4%        Bullish  ----     .443   -.009
---------------------------------------------------------------------------------------------
QQQ       147.77   -.27      147.66       10.5%        Bullish  ----     .185   -.012
------------------------------------------------------------------------ ---------------------
MDY       330.94    .08      330.59         .5%        Bullish   BLUE    .41    -.001
---------------------------------------------------------------------------------------------
IWM       149.64   -.11      150.05       -20.7%       Bullish   BLUE    .327    .029
---------------------------------------------------------------------------------------------
FAS       58.38    -.69       58.65       -28.9%       Bullish    RED    .357    .057
---------------------------------------------------------------------------------------------
RETL      25.41    -1         28.85      -723.7%       Bearish    RED    .241   -.112
---------------------------------------------------------------------------------------------
SOXL      127.1   -1.3       121          309.3%       Bullish    RED    .284    .333
---------------------------------------------------------------------------------------------
TECL      94.65   -.65        93.39        95.8%       Bullish    RED    .244    .096
---------------------------------------------------------------------------------------------
IBB       337.13  -1.76      340.48       -54.7%       ----       RED    .171    .025
---------------------------------------------------------------------------------------------
GLD       122.89    .10      121.09        97.3        Bullish    BLUE   -.087   -.018
|
| |
Table 2
10/12 10/11 10/10 10/9
10/6 10/5 10/4 10/3
10/2 9/29 9/28 9/27
9/26 9/25 9/24
NEWHIGHS 402 487
481 271 371
555 444 652
700 441 407
441 235 221
304
NEWLOWS 44 44
29 21 25
19 28
25 27 25
23 20
20 31
33
-------------------------------------------------------------------------------------------------------------------------
MAXCPs 255 239
194 185 252
229 220 307
311 230 228 197
125 153 148
MINCPs
79 73 64
55 41
40 28
41 41 37
51 63
70 59
63
------------------------------------------------------------------------------------------------------------------------
TTTNHs
115 102 89
74
93 104 109
102 153 97
106 120 114 98
92
TTTNLs
92 92 75
95 65
60 52
69 47
46
62 108
134 139 103
MAXCPs are Closing
Power new highs. MINCPs are Closing Power new lows for any given
day.
TTTNHs are Tiger Day Traders' Tool new highs. After opening, more
upside potential than downside risk.
TTTNLs are Tiger Day Traders' Tool new lows. After opening, more
downside potential than upside risk.
|
 Table 3
   Percent of New Highs in Key Tiger Directories
                Date = 171012
               No.          NHs            Pct.
-------------------------------------------------------------------
BIGMIL         6             5             83 %
INFRA          11            4             36 %
DJI-13         13            4             31 %
DOWJONES       30            7             23 %
NIFTY-30       30            7             23 %
MILITARY       45            10            22 %
SOLAR          19            4             21 %
ELECTRON       194           36            19 %
SEMI           142           27            19 %
HOMEBLDG       18            3             17 %
UTILITY        45            7             16 %
SP-100         97            15            15 %
ETFS           68            10            15 %
TRANSP         20            3             15 %
INDEXES        213           30            14 %
MORNSTAR       238           34            14 %
SP500          499           69            14 %
NASD-100       93            13            14 %
GAMING         30            4             13 %
SOFTWARE       64            8             13 %
RUS-1000       874           110           13 %
CHEM           72            8             11 %
COAL           9             1             11 %
REIT           193           20            10 %
CHINA          64            6             9 %
FINANCE        92            7             8 %
INDMATER       98            7             7 %
BIOTECH        254           17            7 %
RETAIL         58            4             7 %
FOOD           14            1             7 %
GREEN          31            2             6 %
INSURANC       35            2             6 %
AUTO           40            2             5 %
HACKERS        27            1             4 %
COMODITY       71            3             4 %
REGBANKS       36            1             3 %
BONDFUND       112           3             3 %
GOLD           50            1             2 %
OILGAS         158           2             1 %
BIGBANKS       7                           0 %
COMPUTER       25                          0 %
EDU            8                           0 %
PIPELINE       9                           0 %
BEVERAGE       20                          0 %
HOSPITAL       7                           0 %
JETS           9                           0 %
|
Table 4

RANKING OF KEY DIRECTORIES BASED PCT.OF STOCKS ABOVE 65-DMA
              10/12/17
Very Bullish = 32
Bullish = 8
Bearish = 6
---------------------------------------------------------------------------------------
Directory     Current       day-1         day-2         day-3         day-4         day-5
----------------------------------------------------------------------------------------
BIGBANKS       100%          1             1             1             1             1
BIGMIL         100%          1             1             1             1             1
HOMEBLDG       .944          .888          .777          .888          .888          .888
NIFTY          .933          .933          .866          .833          .833          .833
REGBANKS       .916          .916          .916          .916          .916          .916
AUTO           .9            .9            .925          .925          .9            .925
TRANSP         .85           .85           .8            .7            .7            .8
GREEN          .838          .87           .87           .838          .935          .903
DOWJONES       .833          .866          .866          .866          .833          .833
FINANCE        .826          .847          .836          .815          .836          .836
ETFS           .823          .794          .823          .794          .794          .808
SP-100         .814          .845          .814          .814          .824          .835
INDEXES        .807          .83           .835          .821          .798          .802
CHEM           .805          .805          .819          .833          .847          .833
MILITARY       .8            .8            .777          .8            .822          .844
MORNSTAR       .789          .794          .777          .731          .768          .773
ELECTRON       .788          .788          .778          .768          .788          .752
COAL           .777          .666          .555          .555          .666          .666
UTILITY        .777          .755          .666          .555          .577          .622
DJI-13         .769          .923          .846          .923          .846          .769
SOFTWARE       .765          .781          .781          .781          .75           .765
NASD-100       .763          .741          .72           .709          .709          .72
INDMATER       .755          .755          .744          .744          .795          .795
SEMI           .753          .753          .732          .725          .739          .711
SP500          .737          .729          .705          .703          .717          .733
INFRA          .727          .818          .636          .727          .727          .818
RUS-1000       .723          .72           .704          .695          .711          .733
REIT           .709          .689          .663          .658          .632          .694
CHINA          .703          .703          .734          .718          .703          .671
GOLD           .7            .78           .78           .78           .66           .48
OILGAS         .683          .715          .727          .727          .746          .759
BIOTECH        .681          .696          .704          .724          .736          .744
N=32
----------------------------------------------------------------------------------------------
GAMING         .666          .633          .666          .7            .8            .733
HACKERS        .666          .666          .74           .74           .777          .777
INSURANC       .657          .685          .685          .685          .714          .657
COMODITY       .647          .661          .633          .591          .507          .492
EDU            .625          .625          .625          .625          .625          .625
COMPUTER       .6            .64           .6            .64           .68           .68
SOLAR          .578          .631          .684          .578          .684          .684
BEVERAGE       .55           .55           .6            .5            .4            .55
Bullish = 8
----------------------------------------------------------------------------------------------
JETS           .444          .555          .444          .222          .222          .333
PIPELINE       .444          .444          .333          .333          .444          .333
RETAIL         .379          .5            .517          .517          .603          .655
FOOD           .357          .285          .285          .285          .357          .285
BONDFUND       .339          .348          .33           .294          .294          .294
HOSPITAL       .285          .285          .285          .285          .285          .428
Bearish = 6
=================================================================================
=================================================================================
10/11/2017
No Peerless sell
is imminent. The
NYSE A/D Line keeps rising. So
do the Closing
Powers and 5-day mvg.averages for nearly all the major market ETFs. But
NYSE Up-Volume keeps falling.
Fortunately, Down Volume is not rising
and there are many more new highs than new lows, MAXCPs than MINCPs
and even TTTNHs than TTTNLs.
The yearly SP-500 chart
shows prices seem to have reached the top of a
long price channel. But so long as its
Closing Power and Accumulation Index
are rising, I believe that there is a very good chance that SPY will
breakout
of the channel shown below and accelerate its advance.
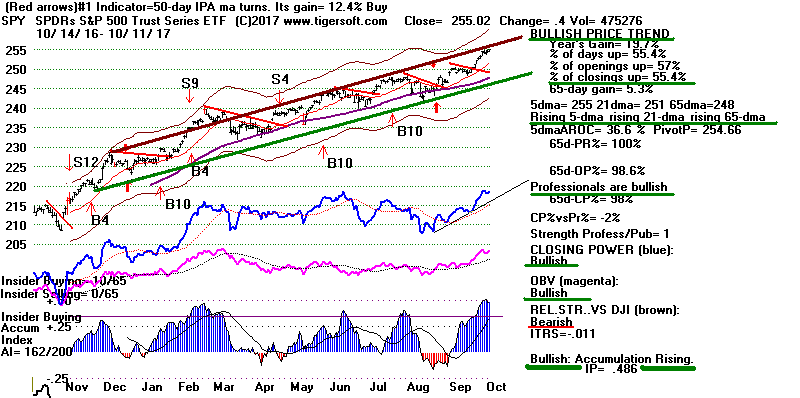
The NASDAQ's
Accumulation Index has now been positive for 196
of the last 200 days. This
suggests there is an abundance of "Big-Money" ready
to support it on any decline to its rising 65-dma. But without a
Peerless Sell signal
and the trends still rising, more and moreof this money on the sidelines is
being tempted
to come into the market without waiting for a decline. This
tendency could create a
"melt-up" if the volume starts to pick up and key stocks on the NASDAQ
breakout.
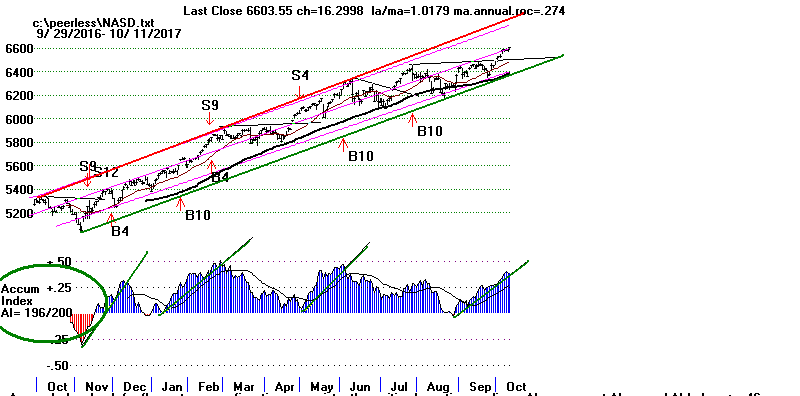
The tech stocks to watch now, I
think, are AAPL which needs to clearly
surpass
its 65-dma and GOOG and
FB which have formed flat-tops, like the
NASDAQ itself.
As we know, flat-tops usually bring upside breakouts especially when they
occur
as now at an all-time high.
TECL's
path of resistance is UP.
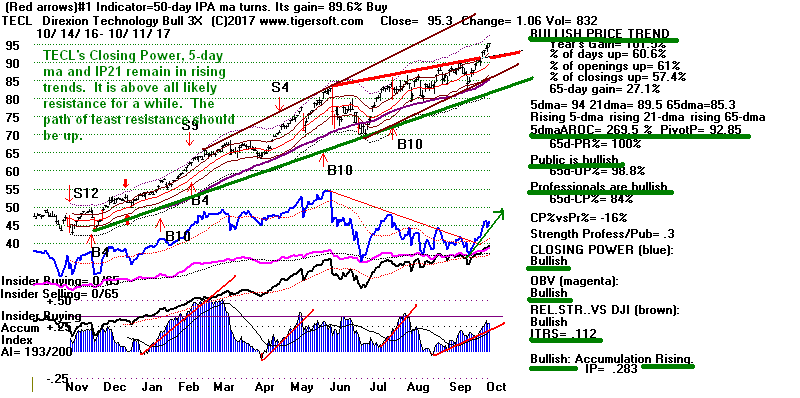
SOXL and semi-conductors remain red-hot.
Artificial intelligence, miniaturized
computers within phones, solar panels and 'robotization' of the work place
are
all factors here. 21% of the 143 Semi-Conductor stocks we watch now made new
12-month highs today. SOXL shows bullish "Across-the-Board"
QuickSilver Blue.
Aggressive funds are expected to keep coming into this group, perhaps
increasingly
so, until year-end when a buying climax may be expected if there actually is
new tax-cut legislation
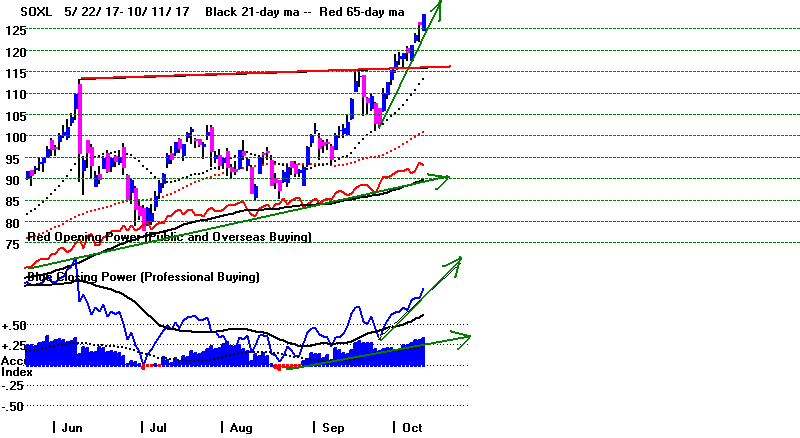
Big Military Stocks Boeing and UTX
keep helping the DJI make new highs.
Tomorrow we get to see some Big Banks' earnings. If they are good,
this will help
FAS achieve a breakout. Watch Goldman Sachs to see if it can start another
leg
up in the group. It is up 7% in the last month compared to Boeings 8%
rise.
Further advances by BA and GS could easily fuel a DJI rally to 13000.
Meanwhile,
all the rebuilding that will be necessary because of the hurricanes and now
forest
fires has lifted many builders. HD and CAT in the DJI reflect this.
Note also how
strong UTX (in the ever-rising Big Military group) and now Chevron have
become
among the DJI's components over $100/share.
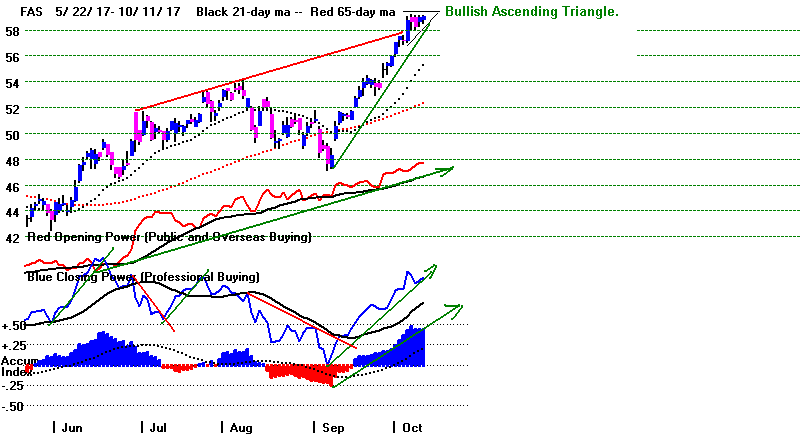
Charts 10/11/2017
PEERLESS DJI, Signals, Indicators Daily
DJI Split Volume 10-DayUp/Down
Vol
Hourly DJIA
A/D Line for
All Stocks
DJIA
S&P
OEX
NYSE
NASDAQ
COMPQX
with CP
DIA
SPY
QQQ
MDY
IWM-TNA
Short Term Interest Rates
DJI-Utilities
DJI-Transp
Nifty-30 Index
CrudeOil FAS
GLD
BBH
IBB
JETS
JNUG
KOL
NUGT
OIH
OIL
RSX
RETL SDS
SLV
SOXL
TECL
TMF
TNA UGA
(gasoline)
XIV YINN
Commodities: JJC, NIB,
CORN,
WEAT UUP
(Dollar)
AAPL ADBE
ALXN
AMAT
AMGN
AMZN BA
BABA
BIDU
CAT
FB
GOOG
GS
HD
IBM JPM
M (Macy's)
MASI
MSFT
NVDA QCOM
TSLA
TXN
ANDV,
CMG (Chipotle),
LRCX,
SWKS,
TOWN
Others REN, CVE
and SWN
10/11/2017
Bullish MAXCPs Hi
Volume "Streakers"
Bearish MINCPs
|
                  QUICKSILVER on ETFS - 10/11/17

                Across-the-Board Blue:
                 DIA,FAS,SOXL,TECL,GLD

       QuickSilver Documentation  This is for short-term trading
       of leveraged ETFs. It also provides a useful short-term outlook of these
       sectors ETF's and the sectors they represent.

       Blue is Bullish and Red is Bearish.
     1 Candle-Stick color is shortest-term. This changes when close vis-a-vis opng changes.
     2 5-dma AROC and Close versus pivot point is next most short-term.
     3 Closing Power trend-direction vs its 21-dma is next most short-term.
     4 IP21 is used to spot divergences mostly. But not its trend-breaks.
     5 IP21 falling +.15 and its 21-dma is bearish.
     6 Note price trend-lines, support/resistance and price patterns on charts.
      Across-the-Board Blue (Bullish):
      DIA, FAS, YINN
ETF      CLOSE   CHANGE     PIVOT-PT  5-dma AROC   CL-PWR   CANDLE  IP21   ITRS (Rel Str)
---------------------------------------------------------------------------------------------
DIA       228.61    .35      227.64     48.4%   Bullish      BLUE   .471     0
---------------------------------------------------------------------------------------------
COMPQX    6603.55    16.3    6585.36    52.4%   Bullish      BLUE   .389   -.004
--------------------------------------------------------------------------------------------
SPY       255.02    .4       254.66     36.6%   Bullish      BLUE   .487   -.011
---------------------------------------------------------------------------------------------
QQQ       148.04    .44      147.46     68.3%   Bullish      BLUE   .24    -.011
-------------------------------------------------------------------------------------------
MDY       330.86    .23      330.91     15.4%   Bullish      BLUE   .363   -.012
---------------------------------------------------------------------------------------------
IWM       149.75   -.11      150.26     -3.3%   Bullish      RED   .334   .014
---------------------------------------------------------------------------------------------
FAS       59.07    .1        58.72    163.7%    Bullish      BLUE  .434   .066
---------------------------------------------------------------------------------------------
RETL      26.41   -1.13      29.45   -415.7%    Bearish      RED   .259  -.115
---------------------------------------------------------------------------------------------
SOXL      128.4    2.47      119.45   377.6%    Bullish      BLUE  .331   .313
---------------------------------------------------------------------------------------------
TECL      95.3    1.06       92.85    269.5%    Bullish      BLUE  .283   .112
---------------------------------------------------------------------------------------------
IBB       338.89   -.7       340.85   -23.4%    Bullish      RED   .184   .031
---------------------------------------------------------------------------------------------
GLD       122.6    .58       119.46   142.2%   Bullish       BLUE  .092   .022
---------------------------------------------------------------------------------------------
OIL       5.34    .04        5.28     173.5%   Bullish       ----  .178  -.009
---------------------------------------------------------------------------------------------
OIH       25.4    .04        25.84    -52.8%   Bullish       BLUE  .261  -.008
---------------------------------------------------------------------------------------------
GASL      22.72    .33       23.79   -126.7%   Bullish       BLUE  .34    .044
---------------------------------------------------------------------------------------------
UGA       28.59    .26       28.82     88.9%   Bearish       ----  .153   .01
---------------------------------------------------------------------------------------------
UUP       24.13   -.07       24.41    -30.8%   ----          ----  .05   -.041
---------------------------------------------------------------------------------------------
IEF       106.4    .12       106.25     1.9%   Bearish       ----- .146  -.047
---------------------------------------------------------------------------------------------
CORN      17.2   -.14        17.37     28.8%   Bearish       RED  -.051  -.112
---------------------------------------------------------------------------------------------
WEAT      6.38   -.04        6.49     -84.9%   Bearish        --- -.025  -.149
---------------------------------------------------------------------------------------------
YINN      32.74   -.26       33.83     73.2%   Bullish        BLUE .261   .14
---------------------------------------------------------------------------------------------
RSX       22.44    .19       22.37     33.7%   Bearish        BLUE .189   .084
|
| |
|
10/11 10/10 10/9 10/6
10/5 10/4 10/3 10/2
9/29 9/28 9/27 9/26
9/25 9/22 9/21
NEWHIGHS 487
481 271 371
555 444 652
700 441 407
441 235 221
304 208
NEWLOWS 44
29 21 25
19 28
25 27 25
23 20
20 31
33 38
------------------------------------------------------------------------------------------------------------------------
MAXCPs 239 194
185 252 229
220 307 311
230 228 197 125
153 148 111
MINCPs 73 64
55 41
40 28
41 41 37
51 63
70 59
63 76
----------------------------------------------------------------------------------------------------------------------
TTTNHs 102 89
74
93 104 109
102 153 97
106 120 114 98
92 70
TTTNLs 92 75
95 65
60 52
69 47
46
62 108
134 139 103 129
MAXCPs are Closing
Power new highs. MINCPs are Closing Power new lows for any given
day.
TTTNHs are Tiger Day Traders' Tool new highs. After opening, more
upside potential than downside risk.
TTTNLs are Tiger Day Traders' Tool new lows. After opening, more
downside potential than upside risk.
|
       Count of Stocks and New Highs in Key Tiger Directories
                     Date = 2017-10-11

--------------------------------------------------------------------------------
BIGMIL         5             3             60 %
ETFS           68            23            34 %
HOMEBLDG       18            6             33 %
DOWJONES       30            10            33 %
NIFTY          30            10            33 %
DJI-13         13            4             31 %
INDEXES        213           55            26 %
SEMI           143           30            21 %
SOLAR          19            4             21 %
ELECTRON       194           39            20 %
SP-100         97            18            19 %
REGBANKS       36            6             17 %
GAMING         30            5             17 %
NASD-100       93            15            16 %
UTILITY        45            7             16 %
FINANCE        92            13            14 %
MILITARY       45            6             13 %
MORNSTAR       238           31            13 %
SOFTWARE       64            8             13 %
SP500          499           67            13 %
RUS-1000       874           101           12 %
CHEM           72            8             11 %
COAL           9             1             11 %
GREEN          31            3             10 %
BIOTECH        254           22            9 %
INFRA          11            1             9 %
CHINA          64            6             9 %
AUTO           40            3             7 %
HACKERS        27            2             7 %
RETAIL         58            4             7 %
INDMATER       98            6             6 %
REIT           193           12            6 %
OILGAS         158           4             3 %
INSURANC       35            1             3 %
GOLD           50            1             2 %
BONDFUND       112           2             2 %
COMODITY       71            1             1 %
BIGBANKS       7                           0 %
TRANSP         20                          0 %
COMPUTER       25                          0 %
EDU            8                           0 %
PIPELINE       9                           0 %
BEVERAGE       20                          0 %
FOOD           14                          0 %
HOSPITAL       7                           0 %
JETS           9                           0 %
|
             RANKING OF KEY DIRECTORIES BASED PCT.OF STOCKS ABOVE 65-DMA
                                    10/11/17

---------------------------------------------------------------------------------------
Directory     Current       day-1         day-2         day-3         day-4         day-5
----------------------------------------------------------------------------------------
BIGBANKS       100%          1             1             1             1             1
BIGMIL         100%          1             1             1             1             1
NIFTY          .933          .866          .833          .833          .833          .766
DJI-13         .923          .846          .923          .846          .769          .769
REGBANKS       .916          .916          .916          .916          .916          .916
AUTO           .9            .925          .925          .9            .925          .95
HOMEBLDG       .888          .777          .888          .888          .888          .833
GREEN          .87           .87           .838          .935          .903          .838
DOWJONES       .866          .866          .866          .833          .833          .833
TRANSP         .85           .8            .7            .7            .8            .8
FINANCE        .847          .836          .815          .836          .836          .847
SP-100         .845          .824          .804          .824          .835          .835
INDEXES        .83           .835          .821          .798          .802          .807
INFRA          .818          .636          .727          .727          .818          .636
CHEM           .805          .833          .819          .847          .833          .805
MILITARY       .8            .8            .777          .822          .844          .822
ETFS           .794          .823          .794          .794          .794          .779
MORNSTAR       .794          .777          .731          .768          .777          .756
ELECTRON       .788          .778          .773          .788          .752          .762
SOFTWARE       .781          .781          .781          .75           .765          .687
GOLD           .78           .78           .78           .66           .48           .58
INDMATER       .755          .744          .744          .795          .795          .785
SEMI           .755          .734          .727          .741          .706          .72
UTILITY        .755          .666          .555          .577          .622          .644
NASD-100       .741          .72           .709          .709          .72           .688
SP500          .731          .707          .701          .717          .729          .715
OILGAS         .721          .734          .727          .746          .759          .727
RUS-1000       .721          .705          .694          .711          .729          .723
CHINA          .703          .734          .718          .703          .671          .671
BIOTECH        .7            .704          .716          .744          .74           .696
REIT           .689          .663          .658          .632          .694          .678
INSURANC       .685          .685          .685          .714          .657          .657
COAL           .666          .555          .555          .666          .666          .555
HACKERS        .666          .74           .74           .777          .777          .666
COMODITY       .661          .633          .591          .507          .507          .507
COMPUTER       .64           .6            .64           .68           .68           .68
GAMING         .633          .666          .7            .8            .733          .666
SOLAR          .631          .684          .578          .684          .684          .684
EDU            .625          .625          .625          .625          .625          .625
JETS           .555          .444          .222          .222          .333          .333
BEVERAGE       .55           .6            .5            .4            .55           .5
total positive = 41
-------------------------------------------------------------------------------------------
RETAIL         .5            .517          .517          .603          .655          .603
-------------------------------------------------------------------------------------------
PIPELINE       .444          .444          .333          .444          .333          .333
BONDFUND       .348          .33           .294          .294          .303          .294
FOOD           .285          .285          .285          .357          .285          .285
HOSPITAL       .285          .285          .285          .285          .285          .285
N=4
|
==================================================================================
==================================================================================
10/10/2017
No Peerless Sell and none is in sight.
All the Peerless key values
remain quite positive. Though NYSE Up-Volume is now declining,
Down Volume is not rising. We see a large preponderance of new
highs
and MAXCPs to new lows and MINCPs. More than 70% of all stocks and
ETFs are above their 65-dma. Any weakness should find lots of support
when these stocks fall back to their 65-dma. The NYSE A/D Line is
still rising,
as is the Accumulation Index (IP21) for the DJI. So, don't expect much
weakness.
We favor history.
In that vein,
it's been 34 years since a rising DJI and
strongly uptrending NYSE A/D Line has produced an October top.
A little hesitation should be probably be expected.
After big jumps at their
openings, the tech ETFs (TECL, SOXL and IBB) today closed
below their openings, but not below their previous day's close, which is a
condition that has recently produced brief waves of sharp selling.
The Dollar's weakness brought considerable strength to foreign ETFs,
led by YINN, which shows across-the-board Bullish QuickSilver internals.
Oil, Utilities and Gold also benefitted from the growing sense that the FED
will hurry the raising of rates given how much damage was done home-owners
by the hurricanes. The Dollar's weakness may have held back the Big
Banks,
but Boeing, the highest priced and most heavily weighted DJI-30 stock, again
made a new high. It is by far the strongest stock in the DJI and in
our BIGMIL
sector.
I would call your attention to the new
nightly ranking of major sectors for the
percent of their stocks that are making new highs. See how this table
also
points to the sectors that ETF buyers may want to favor. This is not
just
a matter of playing momentum. Consider this.
If it's true that stocks making
new highs tend to have less overhead resistance, than it also stands to
reason
that those ETFs with lots of stocks making new highs should themselves have
an easier time rising.
            Percent of Stocks at New Highs
               in Key Tiger Directories
                       Date = 2017-10-10
Directories    No.           NH            NH%
-------------------------------------------------------------------
ETFS (Foreign) 68            23            34 %
DOWJONES       30            9             30 %
SP-100         97            19            20 %
CHINA          64            10            16 %
BIGBANKS       7             1             14 %
NASD-100       93            13            14 %
SP500          499           62            12 %
RUS-1000       874           94            11 %
COAL           9             1             11 %
SEMI           143           14            10 %
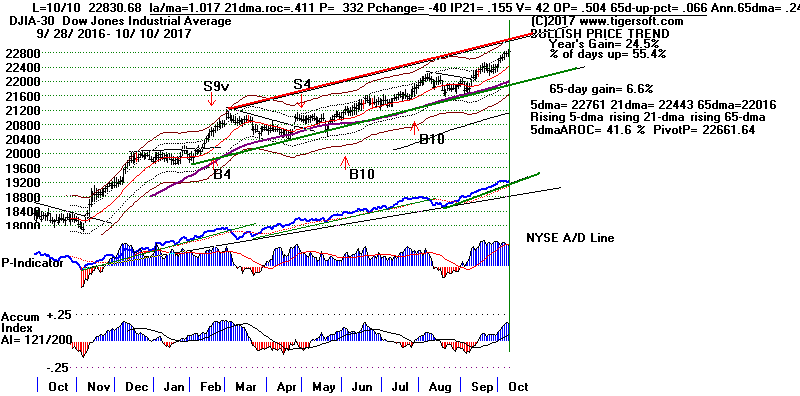
              QUICKSILVER on ETFS - 10/10/17
       Documentation  This is for short-term trading of leveraged ETFs.
       But it provides a useful short-term outlook of these sectors represented by
       the ETFs.
          Blue is Bullish and Red is Bearish.
          Candle-Stick is shortest-term.
          5-dma AROC and Close versus pivot point is next most short-term
          Closing Power direction is next
          IP21 is used to spot divergences mostly.
          So, when IP21 falls below +.15, non-confirmations become possible on
          price new highs.
      Across-the-Board Blue (Bullish):
      DIA, FAS, YINN

     Techs SOXL, TECL and IBB show red Candle-sticks today.
QUICKSILVER on ETFS - 10/10/17
ETF       CLOSE   CHANGE     PIVOT-PT   5-dma AROC CL-PWR    CANDLE  IP21   ITRS
---------------------------------------------------------------------------------------------
DIA       228.26    .73      226.41        44.5%   Bullish      BLUE  .454   ----
---------------------------------------------------------------------------------------------
COMPQX    6587.25    7.51    6534.63       42.3%   Bullish      RED   .387  -.006
---------------------------------------------------------------------------------------------
SPY       254.62    .67      253.16        34.7%   Bullish      ----  .485  -.012
---------------------------------------------------------------------------------------------
QQQ       147.6    .11       146.03        58.2%   Bullish      RED   .242  -.013
---------------------------------------------------------------------------------------------
MDY       330.63    1        329.84        8.9%    Bullish      ----  .385  -.012
---------------------------------------------------------------------------------------------
IWM       149.86    .43      149.85 watch -15.7%   Bullish      RED   .364   .015
---------------------------------------------------------------------------------------------
FAS       58.97    .69       57.16         129.2%  Bullish      BLUE  .438   .084
---------------------------------------------------------------------------------------------
RETL      27.54    .23       28.77        -323.4%   Bearish      ---- .319  -.06
---------------------------------------------------------------------------------------------
SOXL      125.93    2.4      119.2         312.1%   Bullish      RED  .307   .308
---------------------------------------------------------------------------------------------
TECL       94.24    .22       90.29       196.8%    Bullish      RED  .271   .112
---------------------------------------------------------------------------------------------
IBB       339.59    .11      340.48        25.6%    -------      BLUE .205   .021
---------------------------------------------------------------------------------------------
GLD       122.6    .58       119.46        142.2%   -------      BLUE .092   .021
---------------------------------------------------------------------------------------------
OIL       5.3      .19       5.16          67.7%    -------      ---- .167  -.049
---------------------------------------------------------------------------------------------
OIH       25.36   -.15       25.67        -68.3%   -------       RED  .261  -.022
---------------------------------------------------------------------------------------------
GASL      22.39   -.08       23.3         -250.8%   -------      RED  .314   .001
---------------------------------------------------------------------------------------------
UGA       28.33    .68       28.09         92.8%   Bearish      ---- .182   -.009
---------------------------------------------------------------------------------------------
UUP(Dollar) 24.2  -.13       24.28        -22.6%   -------      ---- .072   -.038
---------------------------------------------------------------------------------------------
IEF       106.28    .04      106.36       -5.2%   Bearish       -----.175    -.049
---------------------------------------------------------------------------------------------
CORN      17.34   -.05       17.3         -5.8%   -------        RED   .03   -.125
---------------------------------------------------------------------------------------------
WEAT      6.42   -.03        6.49         -100%   -------        ---- .063   -.165
---------------------------------------------------------------------------------------------
YINN      33    .79          32.26         156.5%   Bullish      BLUE .212    .19
---------------------------------------------------------------------------------------------
RSX       22.25    .14       22.29         4.5%     Bearish      ---- .148   .068
|
Charts 10/10/2017
PEERLESS DJI, Signals, Indicators Daily
DJI Split Volume 10-DayUp/Down
Vol
Hourly DJIA
A/D Line for
All Stocks
DJIA
S&P
OEX
NYSE
NASDAQ
COMPQX
with CP
DIA
SPY
QQQ
MDY
IWM-TNA
Short Term Interest Rates
DJI-Utilities
DJI-Transp
Nifty-30 Index
CrudeOil FAS
GLD
BBH
IBB
JETS
JNUG
KOL
NUGT
OIH
OIL
RSX
RETL SDS
SLV
SOXL
TECL
TMF
TNA UGA
(gasoline)
XIV YINN
Commodities: JJC, NIB,
CORN,
WEAT UUP
(Dollar)
AAPL ADBE
ALXN
AMAT
AMGN
AMZN BA
BABA
BIDU
CAT
FB
GOOG
GS
HD
IBM JPM
M (Macy's)
MASI
MSFT
NVDA QCOM
TSLA
TXN
ANDV,
CMG (Chipotle),
LRCX,
SWKS,
TOWN
Others REN, CVE
and SWN
10/10/2017
Bullish MAXCPs Bearish MINCPs
|
|
10/10 10/9 10/6 10/5
10/4 10/3 10/2 9/29
9/28 9/27 9/26 9/25
9/22 9/21 9/20 NEWHIGHS
481 271 371 555
444 652 700
441 407 441
235 221 304
208 347
NEWLOWS 33
29 21 25
19 28
25 27 25
23 20
20 31
33 38
------------------------------------------------------------------------------------------------------------------------
MAXCPs 194 185
252 229 220
307 311 230
228 197 125 153
148 111 138
MINCPs 64 55
41 40
28 41 41
37 51 63
70 59
63 76 73
----------------------------------------------------------------------------------------------------------------------
TTTNHs 89
74
93 104 109
102 153 97
106 120 114 98
92 70 78
TTTNLs
75
95 65
60 52
69 47
46
62 108
134 139 103 129 128
MAXCPs are Closing
Power new highs. MINCPs are Closing Power new lows for any given
day.
TTTNHs are Tiger Day Traders' Tool new highs. After opening, more
upside potential than downside risk.
TTTNLs are Tiger Day Traders' Tool new lows. After opening, more
downside potential than upside risk.
|
| |
            Percent of Stocks at New Highs
               in Key Tiger Directories
                       Date = 2017-10-10
                          (Full Table)

        Many stock traders want to buy stocks making new highs because
        there is often less resistance overhead.  This shows the
        groups that would seem to offer the most promise.  If there is
        less resistance for new highs, then ETFs focusing on the highest
        ranked directories here ought to perform the best, all other considerations
        being equal.
Directories    No.           NH            NH%
-------------------------------------------------------------------
BIGMIL         5             2             40 %
ETFS (Foreign) 68            23            34 %
DOWJONES       30            9             30 %
REGBANKS       36            10            28 %
DJI-13         13            3             23 %
HOMEBLDG       18            4             22 %
SOLAR          19            4             21 %
FINANCE        92            18            20 %
NIFTY          30            6             20 %
SP-100         97            19            20 %
MILITARY       45            8             18 %
MORNSTAR       238           43            18 %
INFRA          11            2             18 %
INDEXES        213           36            17 %
GREEN          31            5             16 %
ELECTRON       194           32            16 %
CHINA          64            10            16 %
AUTO           40            6             15 %
BIGBANKS       7             1             14 %
NASD-100       93            13            14 %
SOFTWARE       64            8             13 %
SP500          499           62            12 %
RUS-1000       874           94            11 %
COAL           9             1             11 %
SEMI           143           14            10 %
UTILITY        45            4             9 %
CHEM           72            6             8 %
GAMING         30            2             7 %
HACKERS        27            2             7 %
INDMATER       98            6             6 %
BIOTECH        254           14            6 %
INSURANC       33            2             6 %
HOSPITAL       35            2             6 %
OILGAS         158           6             4 %
GOLD           53            2             4 %
REIT           193           8             4 %
RETAIL         58            2             3 %
COMODITY       71            2             3 %
TRANSP         20            0             0 %
COMPUTER       25            0             0 %
EDU            8             0             0 %
PIPELINE       9             0             0 %
BEVERAGE       20            0             0 %
FOOD           14            0             0 %
BONDFUND       112           0             0 %
JETS           9             0             0 %
|
    71% of All Stocks & ETFs are above their 65-dma
        The number is rising, which is bullish.
           Such a high number suggests there is a lot of
           support for most of them at their 65-dma.


 RANKING OF KEY DIRECTORIES BASED PCT.OF STOCKS ABOVE 65-DMA
                      10/10/17
 Bullish = 42
 Bearish = 4
---------------------------------------------------------------------------------------
Directory     Current       day-1         day-2         day-3         day-4         day-5
----------------------------------------------------------------------------------------
BIGBANKS       100%          1             1             1             1             1
BIGMIL         100%          1             1             1             1             1
AUTO           .925          .925          .9            .925          .95           .95
REGBANKS       .916          .916          .916          .916          .916          .916
GREEN          .87           .838          .935          .903          .838          .87
DOWJONES       .866          .866          .833          .833          .833          .766
NIFTY          .866          .833          .833          .833          .766          .766
DJI-13         .846          .923          .846          .769          .769          .692
FINANCE        .836          .815          .836          .836          .858          .836
INDEXES        .835          .821          .798          .802          .807          .779
CHEM           .833          .833          .833          .833          .805          .819
SP-100         .824          .814          .814          .835          .835          .804
ETFS           .823          .794          .794          .794          .764          .794
MILITARY       .8            .8            .8            .844          .822          .822
TRANSP         .8            .7            .7            .8            .8            .8
SOFTWARE       .781          .781          .75           .765          .687          .656
ELECTRON       .778          .773          .793          .752          .762          .752
HOMEBLDG       .777          .888          .888          .888          .833          .833
MORNSTAR       .777          .731          .768          .777          .76           .756
GOLD           .754          .773          .66           .471          .566          .547
INDMATER       .744          .744          .795          .795          .785          .775
HACKERS        .74           .74           .777          .777          .666          .703
OILGAS         .74           .734          .746          .759          .734          .778
SEMI           .734          .73           .74           .72           .73           .72
CHINA          .734          .718          .703          .671          .671          .687
NASD-100       .72           .709          .709          .72           .688          .677
SP500          .709          .703          .715          .729          .713          .697
BIOTECH        .708          .716          .736          .748          .688          .685
RUS-1000       .707          .695          .71           .729          .721          .702
INSURANC       .696          .696          .727          .666          .666          .757
HOSPITAL       .685          .685          .714          .657          .657          .742
SOLAR          .684          .578          .684          .684          .684          .684
N=32
==============================================================================================
GAMING         .666          .7            .8            .733          .666          .7
UTILITY        .666          .555          .577          .622          .644          .511
REIT           .663          .658          .632          .694          .678          .601
INFRA          .636          .727          .727          .818          .636          .545
COMODITY       .633          .591          .507          .507          .521          .507
EDU            .625          .625          .625          .625          .625          .75
BEVERAGE       .6            .5            .4            .55           .5            .45
COMPUTER       .6            .64           .68           .68           .68           .72
COAL           .555          .555          .666          .666          .555          .555
RETAIL         .517          .517          .603          .655          .603          .62
N=10
=============================================================================================
JETS           .444          .222          .222          .333          .333          .333
PIPELINE       .444          .444          .444          .333          .333          .222
BONDFUND       .33           .294          .294          .303          .294          .303
FOOD           .285          .285          .357          .285          .285          .285
N=4
=================================================================================
=================================================================================
10/09/17
Short-Term Technical Warnings:
What it would take to trigger a short-term decline.
Peerless still has given no sell signal.
But a retreat back to the
DJI's rising 65-dma will become more likely than not if the uptrends
in the NYSE A/D Line and Accumulation Index are broken. A bigger
decline is not expected in that case because Peerless still will have
given no Sell and the NASDAQ's Accumulation Index positive consistency
is so high.
It should be also said that since 1983, there have been no significant
October
peaks without a Peerless Sell signal and there have been many cases
when the market kept rising steadily right through October, namely
1993, 1995, 1995, 2003, 2009, 2010 and 2012.
But a short-term retreat will become likely if the key ETFs close below
their 5-day ma pivot points. See the pertinent numbers in the
QuickSilver Table.
Today saw the major market ETFs (DJI, SPY, QQQ, IWM and MDY)
close below their openings. Before we dismiss this as simply the
result of
the reduced trading because of a banking holiday, we should appreciate that
all five of the ETFs named above produced red candlesticks, including
bearish-
looking "red popsicles" and "red rolling-pins".
This weakness was not seen in the tech sector. TECL and SOXL show
bullish across-the-board Quicksilver indicators. But we have learned
this
year to be careful with these ETFs, as they can suddenly swoon. The
tip-off
that this is about to occur after a very nice rally is when they open higher
but then drop intra-day below their previous day's close.
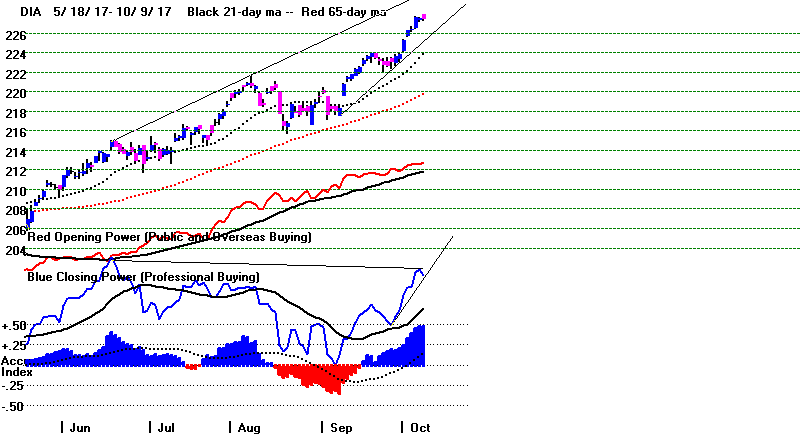
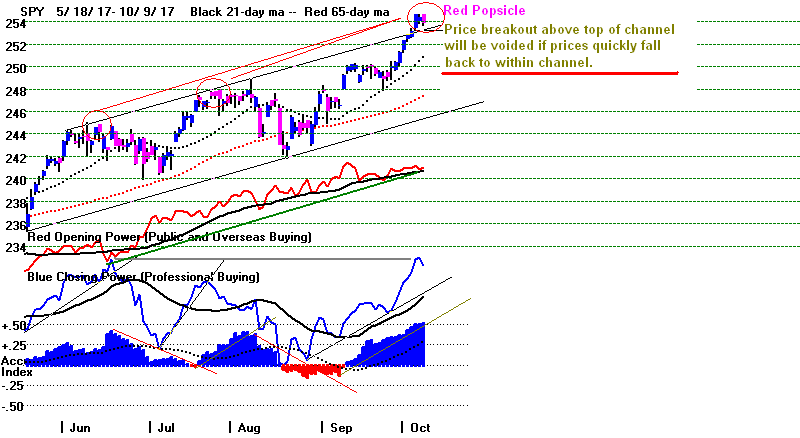
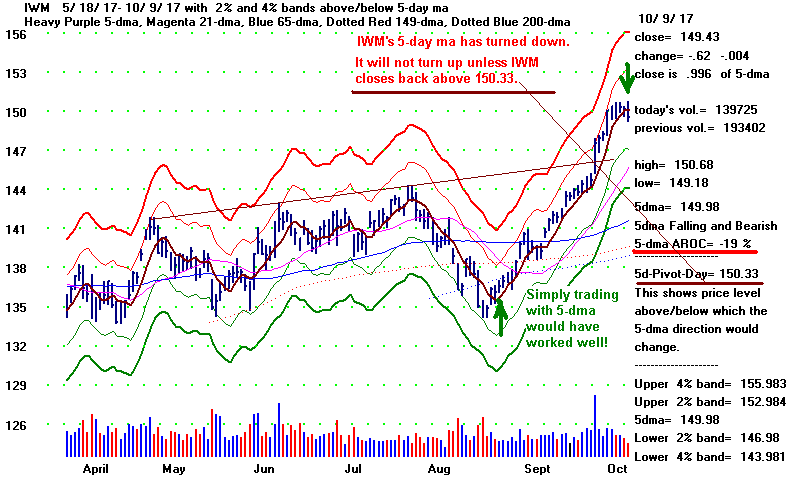
Because of the their nice recent
advance, short-term traders will need to
do some selling if their 5-day mvg. averages turn down. Closes by them
below their 5-day ma pivot-points would produce this effect.
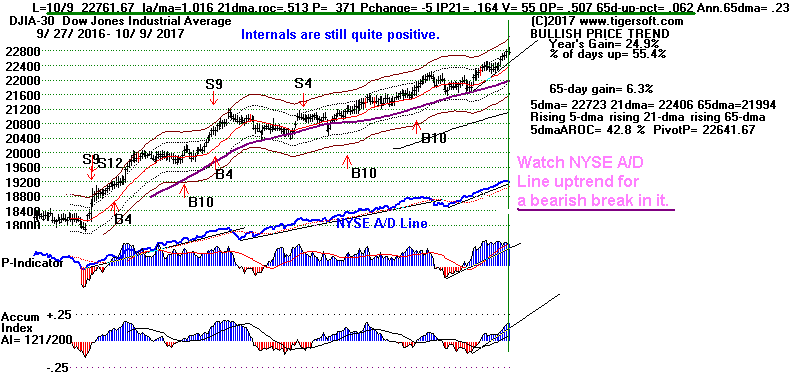


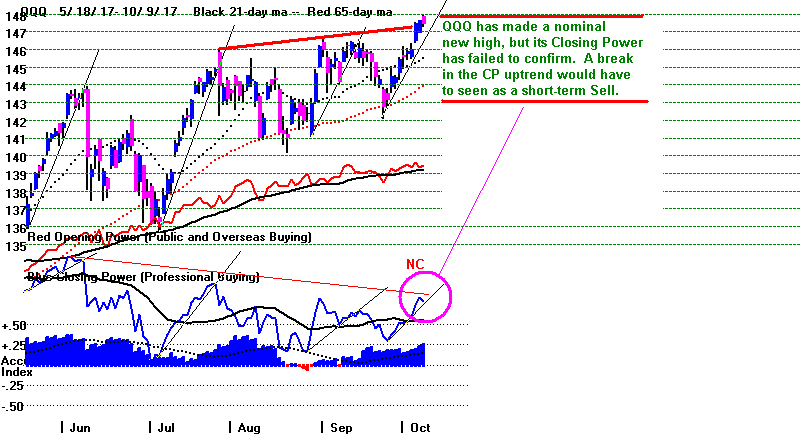
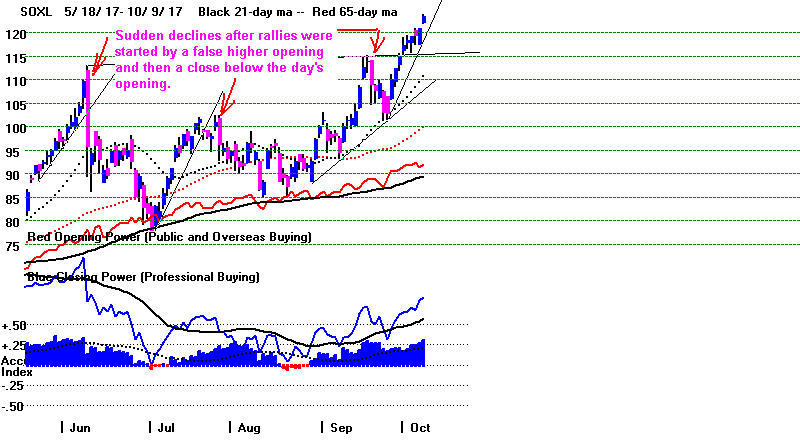
Charts 10/9/2017
PEERLESS DJI, Signals, Indicators Daily
DJI Split Volume 10-DayUp/Down
Vol
Hourly DJIA
A/D Line for
All Stocks
DJIA
S&P
OEX
NYSE
NASDAQ
COMPQX
with CP
DIA
SPY
QQQ
MDY
IWM-TNA
Short Term Interest Rates
DJI-Utilities
DJI-Transp
Nifty-30 Index
CrudeOil FAS
GLD
BBH
IBB
JETS
JNUG
KOL
NUGT
OIH
OIL
RSX
RETL SDS
SLV
SOXL
TECL
TMF
TNA UGA
(gasoline)
XIV YINN
Commodities: JJC, NIB,
CORN,
WEAT UUP
(Dollar)
AAPL ADBE
ALXN
AMAT
AMGN
AMZN BA
BABA
BIDU
CAT
FB
GOOG
GS
HD
IBM JPM
M (Macy's)
MASI
MSFT
NVDA QCOM
TSLA
TXN
ANDV,
CMG (Chipotle),
LRCX,
SWKS,
TOWN
Others REN, CVE
and SWN
10/9/2017
Bullish MAXCPs Bearish MINCPs
|
|
      QUICKSILVER on ETFS - 10/09/17
       Documentation  This is for short-term trading of leveraged ETFs.
       But it provides a useful short-term outlook of these sectors represented by
       the ETFs.
          Blue is Bullish and Red is Bearish.
          Candle-Stick is shortest-term.
          5-dma AROC and Close versus pivot point is next most short-term
          Closing Power direction is next
          IP21 is used to spot divergences mostly.
          So, when IP21 falls below +.15, non-confirmations become possible on
          price new highs.
      Across-the-Board Blue (Bullish):
      SOXL and TECL.  Also YINN, which closed down on Monday.
ETF      CLOSE   CHANGE     PIVOT-PT    5-dma AROC CLOS-PWR   CANDLE  IP21   ITRS
---------------------------------------------------------------------------------------------
DIA       227.53   -.02      226.24        50.5%   Bullish      RED  .472   0
---------------------------------------------------------------------------------------------
COMPQX    6579.74   -10.44   6531.71       48.1%   Bullish      RED   .379  -.011
---------------------------------------------------------------------------------------------
SPY       253.95   -.42      252.86        32.2%   Bullish      RED  .515  -.015
---------------------------------------------------------------------------------------------
QQQ       147.49   -.17      145.89        65.2%   Bullish      RED  .253  -.018
---------------------------------------------------------------------------------------------
MDY       329.63   -.96      330.04        6.5%    Bullish      RED  .407  -.016
---------------------------------------------------------------------------------------------
IWM       149.43   -.62      150.33       -19%     -------      RED  .375   .009
---------------------------------------------------------------------------------------------
FAS       58.28   -.37       57.47         110.7%   Bullish     RED  .438   .088
---------------------------------------------------------------------------------------------
RETL      27.31   -1.54      29.4         -317.6%   Bearish     RED  .42   -.082
           Closing Power made a 12-month low today.                (support)
---------------------------------------------------------------------------------------------
SOXL      123.53    2.53     118.42        263.3%   Bullish      BLUE .307   .252
          Strongest major market ETF today.
---------------------------------------------------------------------------------------------
TECL      94.02     +.63      90.61        225.9%   Bullish       BLUE.305   .096
---------------------------------------------------------------------------------------------
IBB       339.48   -1        337.85        12.4%   -------       RED  .194   .011
---------------------------------------------------------------------------------------------
YINN      32.21   -.44       31.98 watch +440.3%  Bullish        ---- .202   .173
          20-day stochastic Sell.  This system has gained 167.3% for last year.
---------------------------------------------------------------------------------------------
RSX       22.11   -.02       22.23 watch   6.8%   Bearish         RED  .114   .057
|
|
10/9 10/6 10/5 10/4
10/3 10/2 9/29 9/28
9/27 9/26 9/25 9/22
9/21 9/20 9/19 NEWHIGHS
271 371 555
444 652 700
441 407 441
235 221 304
208 347 408
NEWLOWS 29
21 25 19
28 25 27
25 23
20 20
31 33 38
39
--------------------------------------------------------------------------------------------------------------
MAXCPs 185 252 229
220 307 311
230 228 197 125
153 148 111
138 146
MINCPs 55 41
40 28 41
41 37
51 63
70 59
63 76 73
75
--------------------------------------------------------------------------------------------------------------
TTTNHs 74 93 104 109 102 153 97
106 120 114 98
92 70 78 85
TTTNLs
95 65 60 52 69 47
46
62 108
134 139 103 129 128 95
MAXCPs are Closing
Power new highs. MINCPs are Closing Power new lows for any given
day.
TTTNHs are Tiger Day Traders' Tool new highs. After opening, more
upside potential than downside risk.
TTTNLs are Tiger Day Traders' Tool new lows. After opening, more
downside potential than upside risk.
|
Count of Stocks at Clear<1> New Highs|
in Key Tiger Directories
2017-10-09
Group/Sector
No. Stks No. New Highs
Pct (NH/Number of Stocks)
-------------------------------------------------------------------------------------------
BIGMILitary
5
3
.6 (highest)
HOMEBLDG
18
5
.278
SOLAR
19
5
.263
DOWJONES
30
7
.233
NIFTY-30
30
7
.233
MILITARY
45
10
.222
INFRASTRUCTURE 11
2
.182
SEMI
116
21
.181
ELECTRON
194
32
.165
SP-100
97
15
.155
CHINA
64
8
.125
NASD-100
88
10
.114
COAL
9
1
.111
SOFTWARE
64
7
.109
MORNSTAR
238
23
.097
SP500
487
46
.094
RUS-1000
843
75
.089
others
BIGBANKS
7
0
GREEN
31
1
.032
REGBANKS
36
3
.083
AUTO
40
3
.075
CHEM
72
5
.069
DJI-13 (highest priced) 13
1
.077
FINANCE
92
5
.054
GAMING
30
1
.033
INDMATER
98
3
.031
INDEXES
212
14
.066
ETFS
68
4
.059
HACKERS
27
1
.037
OILGAS
158
2
.013
BIOTECH
254
13
.051
INSURANC
35
1
.029
TRANSP
20
0
COMPUTER
25
2
.08
COAL
9
1
.111
GOLD
53
2
.038
REIT
193
7
.036
EDU
8
0
RETAIL
58
1
.017
UTILITY
45
4
.089
PIPELINE
9
0
COMODITY
71
0
BEVERAGE
20
0
FOOD
14
0
BONDFUND
112
3
.027
HOSPITAL
7
0
JETS
9
0
-----------------------------------------------------
<1> New highs here are not just the equal of any previous high, they are
above them. The Newhighs directory includes these tied new highs. |
|
 RANKING OF KEY DIRECTORIES BASED PCT.OF STOCKS ABOVE 65-DMA
                             10/9/17
 Bullish = 40
 Bearish = 5
---------------------------------------------------------------------------------------
Directory     Current       day-1         day-2         day-3         day-4         day-5
----------------------------------------------------------------------------------------
BIGBANKS       1             1             1             1             1             1
BIGMIL         1             1             1             1             1             1
AUTO           .925          .9            .925          .95           .95           .875
DJI-13         .923          .846          .769          .769          .692          .692
REGBANKS       .916          .916          .916          .916          .916          .916
HOMEBLDG       .888          .888          .888          .833          .833          .833
DOWJONES       .866          .833          .833          .833          .766          .733
GREEN          .838          .935          .903          .838          .87           .87
CHEM           .833          .847          .819          .805          .819          .819
NIFTY          .833          .833          .833          .766          .766          .7
INDEXES        .82           .797          .801          .806          .778          .764
FINANCE        .815          .836          .836          .858          .836          .836
SP-100         .814          .824          .824          .835          .804          .793
MILITARY       .8            .822          .822          .822          .822          .844
ETFS           .794          .794          .794          .764          .779          .779
SOFTWARE       .781          .75           .765          .687          .671          .656
ELECTRON       .773          .793          .757          .762          .752          .737
GOLD           .754          .66           .49           .584          .528          .339
SEMI           .75           .767          .732          .75           .741          .732
INDMATER       .744          .795          .795          .785          .775          .724
HACKERS        .74           .777          .777          .666          .703          .666
OILGAS         .74           .753          .759          .734          .765          .759
MORNSTAR       .731          .768          .777          .76           .752          .739
INFRA          .727          .727          .818          .636          .545          .545
BIOTECH        .72           .736          .74           .696          .673          .692
CHINA          .718          .703          .671          .671          .671          .671
SP500          .704          .72           .733          .716          .694          .685
GAMING         .7            .8            .733          .666          .7            .7
TRANSP         .7            .7            .8            .8            .8            .7
NASD-100       .693          .693          .704          .67           .659          .67
RUS-1000       .69           .706          .725          .717          .693          .677
INSURANC       .685          .714          .657          .657          .714          .685
-----------------------------------------------------------------------------------------
REIT           .658          .632          .694          .678          .601          .611
COMPUTER       .64           .68           .68           .68           .72           .72
EDU            .625          .625          .625          .625          .75           .625
COMODITY       .591          .507          .507          .521          .507          .436
SOLAR          .578          .684          .684          .684          .684          .684
COAL           .555          .666          .666          .555          .555          .444
UTILITY        .555          .577          .622          .644          .511          .533
RETAIL         .517          .603          .655          .603          .603          .586
-----------------------------------------------------------------------------------------
BEVERAGE       .5            .4            .55           .5            .45           .4
------------------------------------------------------------------------------------------
PIPELINE       .444          .555          .333          .333          .222          .222
BONDFUND       .294          .294          .303          .294          .303          .285
FOOD           .285          .357          .285          .285          .285          .285
HOSPITAL       .285          .285          .285          .285          .428          .428
JETS           .222          .222          .333          .333          .333          .111
=================================================================================
=================================================================================
10/06/17
The weakness in Friday's job numbers
reflected the effects of last month's
hurricanes.
Thus, the market was not unsettled by them. On Friday, once
again the major
market ETFs steadily recovered all day after early weakness.
I would think the round number 23000 will
be the next area of concentrated
offerings of stock
shares. That seems to be where the DJI is headed next.
As long as the NYSE A/D Line uptrend is not violated, most traders should
continue hold their long positions. DIA, SPY and TECL look especially
good.
What Could Bring on A Peerless Sell?
Looking back over past October tops,
one gets the distinct impression that
there are very few tops without there first either being a Peerless sell
signal and/or
one or more of key Peerless Indicators becoming negative or nearly so.
There are
exceptions, namely 1950, 1954 and 1983, which I will show tomorrow
night.
Generally, the closer the DJI gets to the 3.5% upper band with some internal
strength weakness, the more likely Peerless will give a Sell.
What about the current IP21 (Accumulation Index) for the Peerless DJI
now? A break in the Accum. Index's uptrend in the next week or two
will raise
the odds of a pullback to the 50-day ma to about 55%. Such a decline
took place
in 22 of the 40 such cases since 2004 when the DJI was not in a bear
market
or starting a new bull market.
SPY, TECL and QQQ Look Good.
SPY is above
all resistance-lines and should be able to keep rising. Classic
technical
analysis tells us that when a stock breaks above
its uptrending channel's resistance-
line, calculate the height of the channel (8 points here) and add it to the
point
of breakout (253 here) to get a price target (261)
https://books.google.com/books/about/Technical_Analysis_of_Stock_Trends.html?id=Xu1QwIwCJdQC
Many of the big tech,
software stocks and semi-conductor
have turned up.
The result is that TECL and QQQ are again breaking out
above likely resistance and
embarking on new legs up.
Pct of Sector Making 12-month Highs
A new table I want to start producing shows the percentage of each
stock-sector
that is making a new 12-month high. For stock traders, this will us
help pick the
best sectors to be long. At present, the ones listed below are the
highest
ranked sectors. By comparison, 7% of QQQ's stocks are making new
highs
and 6% of the SP-500's stocks.
Pct of Sector Making 12-month Highs
60% Big Military 3/5
22% Homebuilding 4/18
16% Electronics 15/94
15% Hacking 4/27
14% Software 9/64
11% Military
5/45
10% Gambling 3/30
Two Bullish-Looking Morningstar
Sector Charts at New Highs
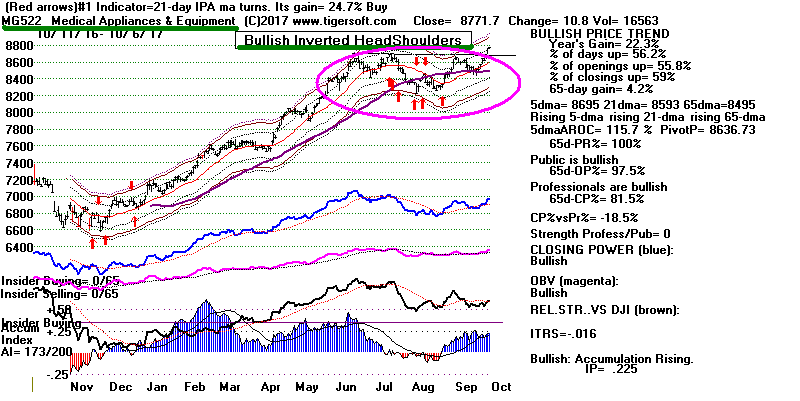 |
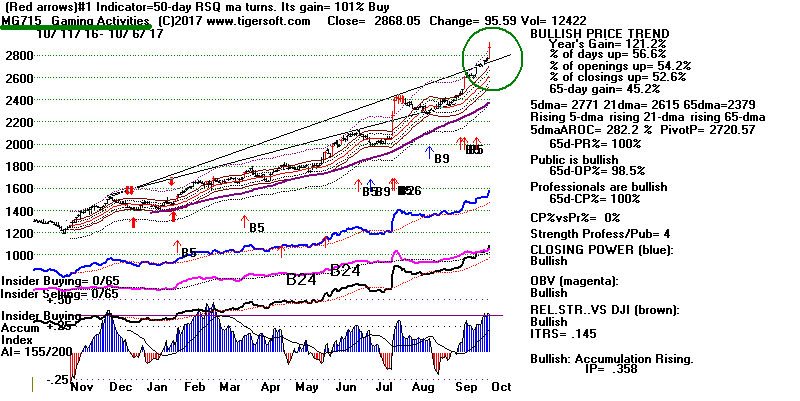 |
KEY CHARTS
QQQ Breakout. Next minimum target is 151.
SPY Breakout. Minimum upside target is 261.
DJIA is now being drawn to round
number 23000.
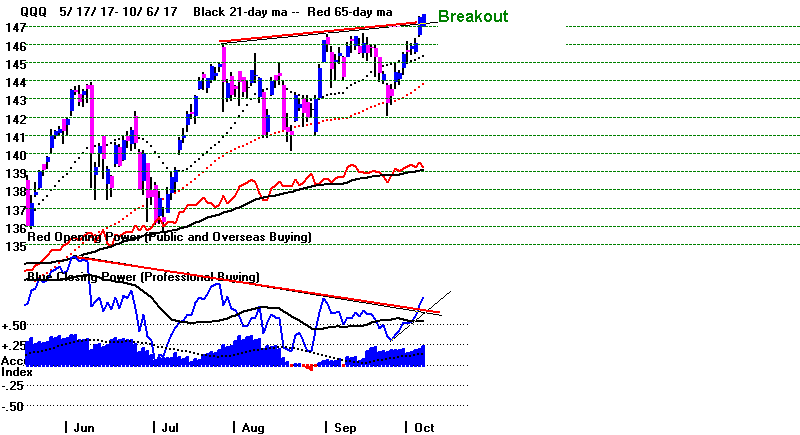
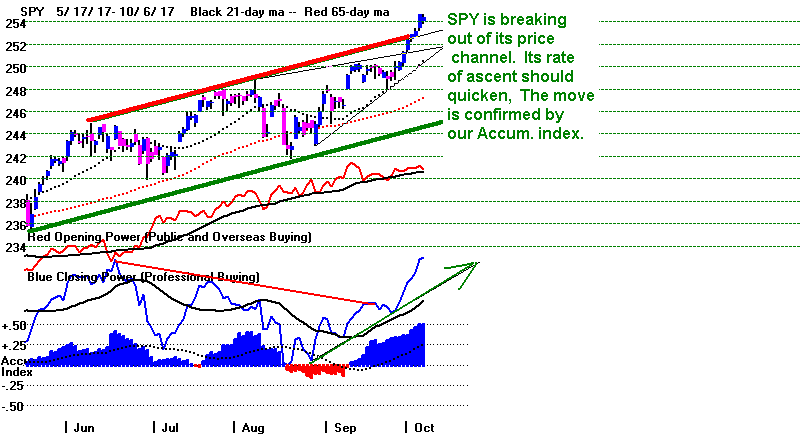
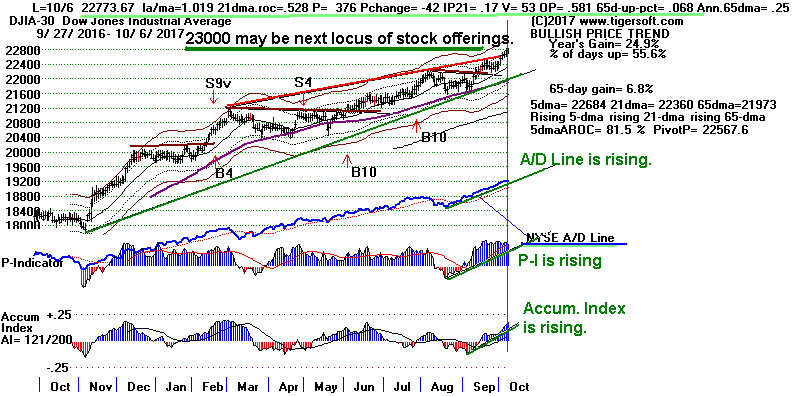
Peerless has given no
intermediate-term sell. None seems nearby despite
the DJI being 1.8% over the 21-dma. Our internal strength indicators
for Peerless and the DJI are all rising, most notably the NYSE A/D Line
and Accumulation Index. Except for their one-day declines on Friday,
across-the-board bullish internals are seen now for DIA, IWM, SOXL and
YINN.
I believe it is significant that the
Closing Powers are rated "Bullish"
now rising for nearly all the major market ETFs. Only IWM appears to be
at risk of having its 5-day ma turn down. It would only need to close
their 5-day ma turn down .05 for this to happen. Short-term traders
using QuickSilver would have to take profits. The pivot-point is the
next day's
close below which will cause the 5-day ma to turn down. QuickSilver
thrives
on volatility precisely because it is automatic and gives traders a way to
exit
volatile and/or leveraged ETFs.
                      Across-the-Board Blue (Bullish):
        DIA,IWM,SOXL and YINN (all did close down on Friday.)

                   QUICKSILVER on ETFS - 10/06/17
ETF       CLOSE   CHANGE     PIVOT-PT    5-dma AROC   CL-PWR   CANDLE  IP21   ITRS
---------------------------------------------------------------------------------------------
DIA       227.55   -.09      225.24        82.6%      Bullish     BLUE .481    -----
---------------------------------------------------------------------------------------------
COMPQX    6590.18   4.82     6516.72       72.1%      Bullish     BLUE .361    -.013
--------------------------------------------------------------------------------------------
SPY       254.37   -.29      252.32        62.1%      Bullish     BLUE .501    -.016
---------------------------------------------------------------------------------------------
QQQ       147.66    .2       145.58        75.6%      -------     BLUE .224    -.019
---------------------------------------------------------------------------------------------
MDY       330.59   -.32      329.2         64.7%      Bullish     BLUE.445   -.02
---------------------------------------------------------------------------------------------
IWM       150.05   -.21  150 watch this   62.4%      Bullish     BLUE .389   .009
---------------------------------------------------------------------------------------------
FAS       58.65    -.07       57           234%       Bullish     RED  .475   .09
---------------------------------------------------------------------------------------------
RETL      28.85   -.6        29.16        -68.5%      Bearish     RED  .436  -.036
---------------------------------------------------------------------------------------------
SOXL      121      1.55      117.26        243.4%    Bullish      BLUE .266   .212
---------------------------------------------------------------------------------------------
TECL      93.39    +.54       89.89        210.2%    Bullish      BLUE -.025 -.028
---------------------------------------------------------------------------------------------
IBB       340.48   -.37      338.64        101.8%    -------      BLUE .189   .02
---------------------------------------------------------------------------------------------
GLD       122.6    .58       119.46        142.2%    -------      BLUE .092   .019
---------------------------------------------------------------------------------------------
OIL       5.08   -.2         5.24         -285.3%    -------      ---- .127  -.059
---------------------------------------------------------------------------------------------
OIH       25.42   -.42       25.84        -125.8%    -------      RED  .312  -.032
---------------------------------------------------------------------------------------------
GASL      22.5   -1.29       23.66        -136.2%    -------      RED  .256  -.048
---------------------------------------------------------------------------------------------
UGA       27.72   -1.1  27.67 watch this  -76.5%     -------      RED  .216   .003
---------------------------------------------------------------------------------------------
UUP       24.37   -.04  24.32 watch this   39.1%     Bullish      RED  .193   -.043
---------------------------------------------------------------------------------------------
IEF       106.12  -.13  106.24 watch this -18.8%      Bearish      BLUE  -.189 -.05
---------------------------------------------------------------------------------------------
CORN      17.41    .04  17.47 watch this   -66%       Bullish      ---- .024   -.124
---------------------------------------------------------------------------------------------
WEAT      6.53     .04  6.54 watch this   -38.3%     -------      BLUE .087   -.158
---------------------------------------------------------------------------------------------
YINN      32.65   -1.18      29.39         565.2%    Bullish      BLUE .188   .193
---------------------------------------------------------------------------------------------
RSX       22.13   -.24  22.08 watch this   -36%       Bearish      RED  .114   .055
|
|
10/6 10/5 10/4 10/3
10/2 9/29 9/28
9/27 9/26 9/25 9/22
9/21 9/20 9/19 9/18 NEWHIGHS
371 555 444
652 700 441 407 441 235 221 304 208
347 408 406
NEWLOWS 21 25 19 28
25 27 25 23 20 20 31 33
38 39 29
----------------------------------------------------------------------------------------------------------------------
MAXCPs 252 229 220 307 311 230
228 197 125 153 148 111 138 146
159
MINCPs 41 40 28 41
41 37 51 63 70 59 63
76 73 75 51
----------------------------------------------------------------------------------------------------------------------
TTTNHs
93 104 109 102 153 97
106 120 114 98
92 70 78 85 86
TTTNLs
65 60 52 69 47
46
62 108
134 139 103 129 128 95
80
MAXCPs are Closing
Power new highs. MINCPs are Closing Power new lows for any given
day.
TTTNHs are Tiger Day Traders' Tool new highs. After opening, more
upside potential than downside risk.
TTTNLs are Tiger Day Traders' Tool new lows. After opening, more
downside potential than upside risk.
|
|
Charts 10/6/2017
PEERLESS DJI, Signals, Indicators Daily
DJI Split Volume 10-DayUp/Down
Vol
Hourly DJIA
A/D Line for
All Stocks
DJIA
S&P
OEX
NYSE
NASDAQ
COMPQX
with CP
DIA
SPY
QQQ
MDY
IWM-TNA
Short Term Interest Rates
DJI-Utilities
DJI-Transp
Nifty-30 Index
CrudeOil FAS
GLD
BBH
IBB
JETS
JNUG
KOL
NUGT
OIH
OIL
RSX
RETL SDS
SLV
SOXL
TECL
TMF
TNA UGA
(gasoline)
XIV YINN
Commodities: JJC, NIB,
CORN,
WEAT UUP
(Dollar)
AAPL ADBE
ALXN
AMAT
AMGN
AMZN BA
BABA
BIDU
CAT
FB
GOOG
GS
HD
IBM JPM
M (Macy's)
MASI
MSFT
NVDA QCOM
TSLA
TXN
ANDV,
CMG (Chipotle),
LRCX,
SWKS,
TOWN
Others REN, CVE
and SWN
10/6/2017
Bullish MAXCPs
Bullish Biotechs
Bearish MINCPs
|
 RANKING OF KEY DIRECTORIES BASED PCT.OF STOCKS ABOVE 65-DMA
              10/6/17
 Bullish = 41   ..... 72% +1% of all stocks and ETFs are above their 65-dma.
 Bearish = 5
---------------------------------------------------------------------------------------
Directory     Current       day-1         day-2         day-3         day-4         day-5
----------------------------------------------------------------------------------------
BIGBANKS       100%          1             1             1             1             1
BIGMIL         100%          1             1             1             1             1
GREEN          .935          .903          .838          .87           .87           .774
REGBANKS       .916          .916          .916          .916          .916          .916
AUTO           .9            .925          .95           .95           .875          .85
HOMEBLDG       .888          .888          .833          .833          .833          .833
CHEM           .847          .833          .791          .819          .805          .805
DJI-13         .846          .769          .769          .692          .615          .538
FINANCE        .836          .836          .858          .836          .836          .847
DOWJONES       .833          .833          .833          .766          .7            .633
NIFTY          .833          .833          .766          .766          .7            .733
MILITARY       .822          .844          .8            .822          .822          .755
SP-100         .822          .833          .833          .802          .781          .77
GAMING         .8            .733          .666          .7            .7            .7
INDMATER       .795          .795          .785          .775          .734          .704
INDEXES        .795          .8            .804          .776          .761          .733
ETFS           .794          .794          .764          .779          .764          .735
ELECTRON       .793          .757          .768          .752          .737          .721
HACKERS        .777          .777          .666          .703          .629          .629
MORNSTAR       .768          .777          .76           .752          .739          .714
SEMI           .767          .732          .75           .741          .732          .706
OILGAS         .759          .765          .734          .765          .765          .746
SOFTWARE       .75           .765          .687          .671          .656          .609
BIOTECH        .74           .74           .688          .681          .685          .673
INFRA          .727          .818          .636          .545          .545          .545
SP500          .72           .733          .716          .694          .683          .65
INSURANC       .714          .657          .657          .714          .685          .657
RUS-1000       .712          .729          .72           .699          .683          .657
NASD-100       .709          .72           .688          .677          .688          .666
CHINA          .703          .671          .671          .671          .671          .64
TRANSP         .7            .8            .8            .8            .7            .7
SOLAR          .684          .684          .684          .684          .684          .631
COMPUTER       .68           .68           .68           .72           .72           .64
N=33
----------------------------------------------------------------------------------------------
COAL           .666          .666          .555          .555          .444          .555
GOLD           .641          .49           .603          .547          .32           .415
REIT           .632          .694          .678          .601          .621          .58
EDU            .625          .625          .625          .75           .625          .625
RETAIL         .603          .655          .603          .603          .586          .603
UTILITY        .577          .622          .644          .511          .533          .444
PIPELINE       .555          .444          .333          .222          .222          .222
COMODITY       .507          .507          .521          .507          .45           .535
N=8
==============================================================================================
BEVERAGE       .4            .55           .5            .45           .45           .4
FOOD           .357          .285          .285          .285          .285          .285
BONDFUND       .294          .303          .294          .303          .285          .267
HOSPITAL       .285          .285          .285          .428          .428          .285
JETS           .222          .333          .333          .333          .111          .111
N=5
==============================================================================
10/5/2017
A DJI-23000 could occur very soon if we get a
very positive JOBS
Report tomorrow. The stock market is close to firing very well on all
cylinders. Enjoy it. Don't sell. The speed of the advance
may now
accelerate because so many finance and tech stocks are exciting
speculators. Seldom do we see so many charts with bullish breakouts.
See below how SPY has broken above out of its price channel. Usually
this means the uptrend in prices will be accelerating. Peerless cannot
easily give a sell signal until some weakness is shown. None is
apparent now.
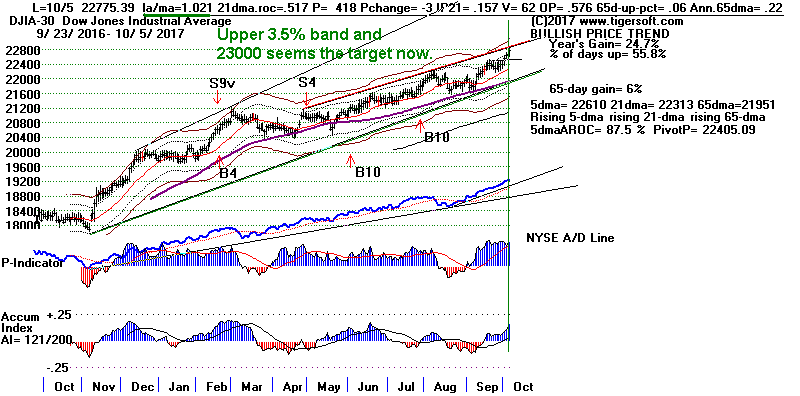
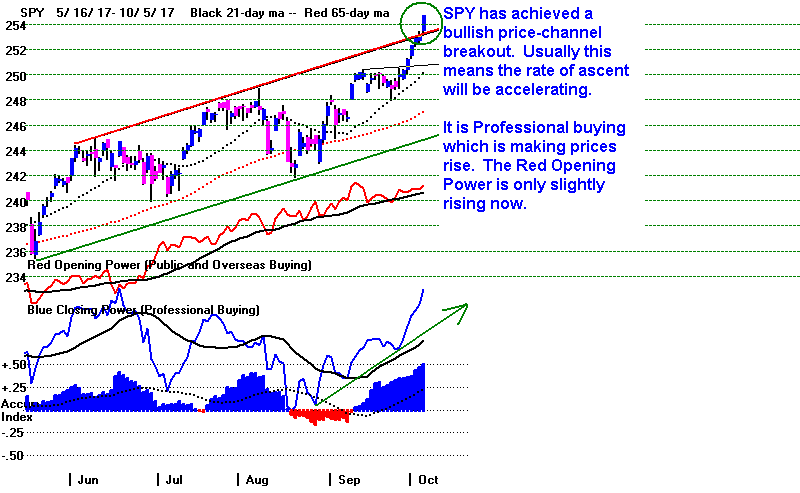
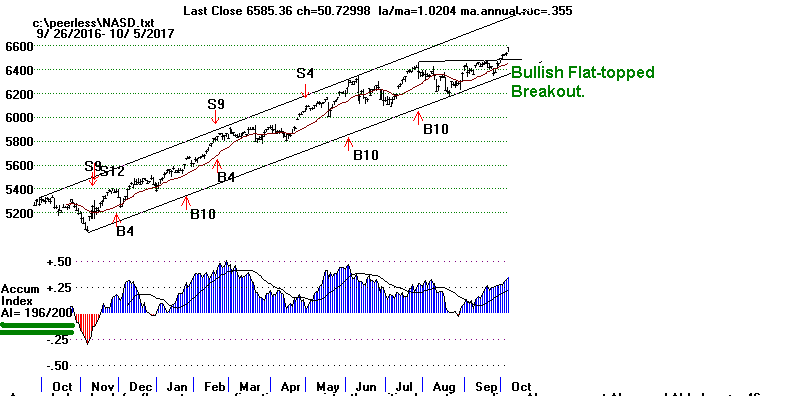
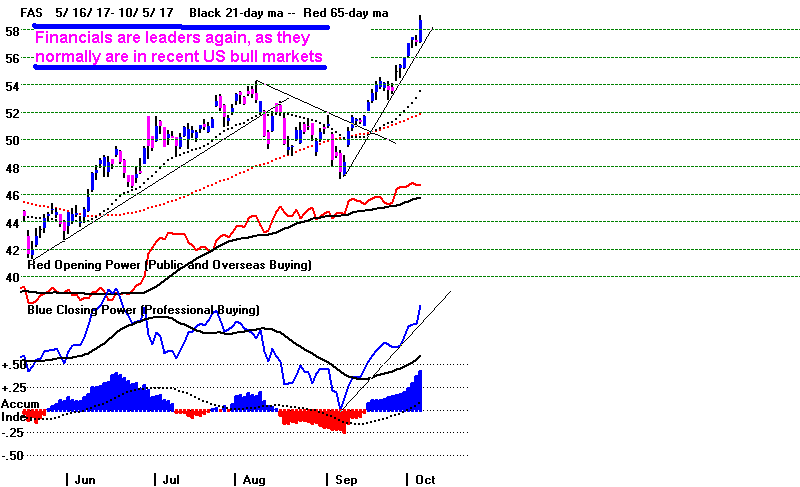
Enjoy The Advance. Even Higher Prices are Indicated
The DJI is being powered now by its Big Banks AND high priced Boeing.
The NASDAQ's AI/200 score is an extraordinarily high 196. It
high-priced
high tech leaders ("AAPL and friends") moved in synch upwards today,
rising bullishly back above their key 65-dma or destroying their potential
head and shoulders patterns or making new highs. The SP-500 has now
risen
8 straight days and seems above all likely resistance. The NYSE A/D
Line
made yet another high.
Now 72% of all the stocks and ETFs we follow are
above their 65-dma. Relatively unknown biotechs have come to life and
comprise more than 1/2 of the NASDAQ's top 50 gainers again today.
The ratios of new highs to new lows, MAXCPs to MINCPs and Tiger Day
Traders new highs to new lows are all quite bullish. Since we see no
bearish divergences in sight, don't sell your long positions seems the only
thing left to say. With the positive momentum to broad, I suspect the DJI
will have to rise to the full 3.5% band before it settles back some.
The DJI
is now 2.1% over the 21-day ma. DJI-23000 is the next point where
there may be enough selling to pose some meaningful resistance.
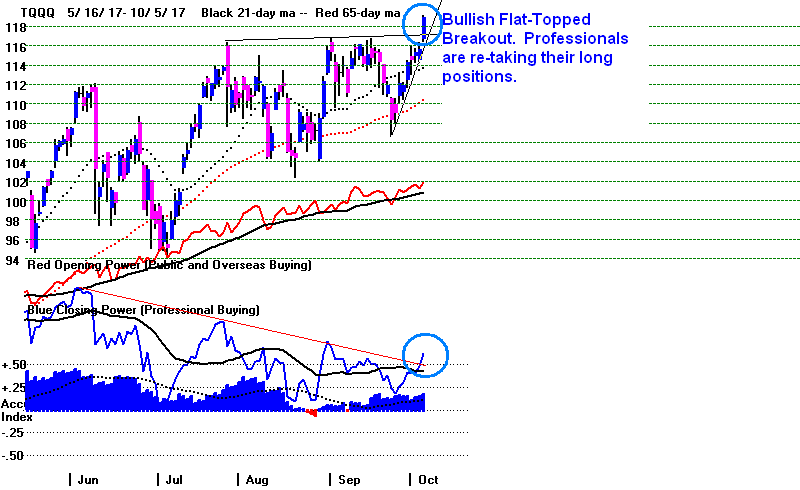
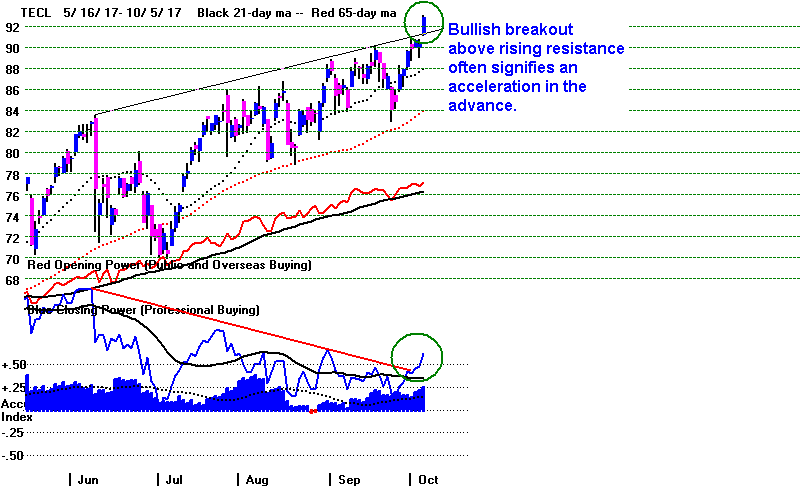
|
10/5 10/4 10/3 10/2 9/29 9/28 9/27
9/26 9/25 9/22 9/21 9/20 9/19 9/18
NEWHIGHS 555 444
652 700 441 407 441 235 221 304 208
347 408 406
NEWLOWS 25 19 28
25 27 25 23 20 20 31 33
38 39 29
--------------------------------------------------------------------------------------------------------------
MAXCPs 229 220 307 311 230
228 197 125 153 148 111 138 146
159
MINCPs 40 28 41
41 37 51 63 70 59 63
76 73 75 51
--------------------------------------------------------------------------------------------------------------
TTTNHs 104 109 102 153 97
106 120 114 98
92 70 78 85 86
TTTNLs
60 52 69 47
46
62 108
134 139 103 129 128 95
80
MAXCPs are Closing
Power new highs. MINCPs are Closing Power new lows for any given
day.
TTTNHs are Tiger Day Traders' Tool new highs. After opening, more
upside potential than downside risk.
TTTNLs are Tiger Day Traders' Tool new lows. After opening, more
downside potential than upside risk. |
Watch The Jobs' Numbers before Opening.
The US Jobs' Report comes
out Friday morning. Below see the monthly numbers in 1000s.
I show them in blue when they are above the same month a year
before and red when they
are below it. It takes a long string of (red) down months to
bring on a bear market. The
three recent (red) down-months is not a big problem for the
stock market yet. The stock
market normally leads these figures. By this theory, then
we should see a big jump,
way over 200,000 new jobs, either this month or next month.
Will we be disappointed? If we do not see a number over
200,000, a lot of
folks will be talking about how the stock market is getting
too far ahead of the economy.
In that environment, a rapid hiking of interest rates would
be dangerous. But even then,
history suggests short-term rates would have to go over 3% to
be dangerous for
the market. (This is what brought on the 1957 bear market).
My new Peerless book will show that the stock market is much
more affected by factors
other than the Employment Rate. More important are such
factors abrupt changes in the
direction of short-term interest rates, new taxes or tax
cuts, technological changes,
government spending and the perceived friendliness or
hostility of Government regulators,
especially in the area of anti-trust regulation.
Still, the Jobs report and the Inflation reports are very
important to Fed policy-makers.
So Friday morning, a low number, say below 150,000 new jobs
will likely be interpreted
as a sign of the economy's growth stalling out. This should
cause the Fed to delay raising rates
and so would actually be bullish. On the other hand, a big
job's number over 250,000 will,
no doubt, give the market a jolt upwards. But soon traders
then will start to worry that a
very high number of new jobs means that the economy is
getting "over-heated". This will
bring inflation and wage-hikes, the very things the Fed
usually chooses to fight with
higher interest rates.
| |
| Year |
Jan |
Feb |
Mar |
Apr |
May |
Jun |
Jul |
Aug |
Sep |
Oct |
Nov |
Dec |
| 2007 |
240 |
89 |
190 |
80 |
143 |
75 |
-34 |
-20 |
88 |
84 |
114 |
98 |
| 2008 |
17 |
-84 |
-78 |
-210 |
-186 |
-162 |
-213 |
-267 |
-450 |
-474 |
-766 |
-694 |
| 2009 |
-793 |
-702 |
-823 |
-687 |
-349 |
-471 |
-329 |
-213 |
-220 |
-204 |
-2 |
-275 |
| 2010 |
23 |
-68 |
164 |
243 |
524 |
-137 |
-68 |
-36 |
-52 |
262 |
119 |
87 |
| 2011 |
43 |
189 |
225 |
346 |
77 |
225 |
69 |
110 |
248 |
209 |
141 |
209 |
| 2012 |
358 |
237 |
233 |
78 |
115 |
76 |
143 |
177 |
203 |
146 |
132 |
244 |
| 2013 |
211 |
286 |
130 |
197 |
226 |
162 |
122 |
261 |
190 |
212 |
258 |
47 |
| 2014 |
190 |
151 |
272 |
329 |
246 |
304 |
202 |
230 |
280 |
227 |
312 |
255 |
| 2015 |
234 |
238 |
86 |
262 |
344 |
206 |
254 |
157 |
100 |
321 |
272 |
239 |
| 2016 |
126 |
237 |
225 |
153 |
43 |
297 |
291 |
176 |
249 |
124 |
164 |
155 |
| 2017 |
216 |
232 |
50 |
207 |
145 |
210 |
138 |
169(P) |
-33 |
|
|
|
| P : preliminary |
|
|
Charts 10/5/2017
PEERLESS DJI, Signals, Indicators Daily
DJI Split Volume 10-DayUp/Down
Vol
Hourly DJIA
A/D Line for
All Stocks
DJIA
S&P
OEX
NYSE
NASDAQ
COMPQX
with CP
DIA
SPY
QQQ
MDY
IWM-TNA
Short Term Interest Rates
DJI-Utilities
DJI-Transp
Nifty-30 Index
CrudeOil FAS
GLD
BBH
IBB
JETS
JNUG
KOL
NUGT
OIH
OIL
RSX
RETL SDS
SLV
SOXL
TECL
TMF
TNA UGA
(gasoline)
XIV YINN
Commodities: JJC, NIB,
CORN,
WEAT UUP
(Dollar)
AAPL ADBE
ALXN
AMAT
AMGN
AMZN BA
BABA
BIDU
CAT
FB
GOOG
GS
HD
IBM JPM
M (Macy's)
MASI
MSFT
NVDA QCOM
TSLA
TXN
ANDV,
CMG (Chipotle),
LRCX,
SWKS,
TOWN
Others REN, CVE
and SWN
10/5/2017
Bullish MAXCPs Bearish
MINCPs |
 RANKING OF KEY DIRECTORIES BASED PCT.OF STOCKS ABOVE 65-DMA
              10/5/17
  Bullish = 40
  Bearish = 6
---------------------------------------------------------------------------------------
Directory     Current       day-1         day-2         day-3         day-4         day-5
----------------------------------------------------------------------------------------
BIGBANKS       100%          1             1             1             1             1
BIGMIL         100%          1             1             1             1             1
AUTO           .925          .95           .95           .875          .85           .875
REGBANKS       .916          .916          .916          .916          .916          .916
GREEN          .903          .838          .87           .87           .774          .806
HOMEBLDG       .888          .833          .833          .833          .833          .722
MILITARY       .844          .822          .8            .822          .755          .8
FINANCE        .836          .858          .836          .836          .847          .858
SP-100         .835          .835          .793          .783          .783          .773
CHEM           .833          .805          .805          .805          .805          .763
DOWJONES       .833          .833          .766          .7            .666          .666
NIFTY          .833          .766          .766          .7            .733          .666
INFRA          .818          .636          .545          .545          .545          .545
INDEXES        .802          .807          .779          .765          .737          .741
TRANSP         .8            .8            .8            .7            .7            .7
INDMATER       .795          .785          .775          .734          .704          .704
ETFS           .794          .764          .779          .764          .72           .676
HACKERS        .777          .666          .703          .629          .629          .555
MORNSTAR       .777          .76           .752          .739          .714          .693
OILGAS         .772          .74           .765          .765          .746          .74
DJI-13         .769          .769          .692          .615          .538          .538
SOFTWARE       .765          .687          .671          .656          .593          .593
ELECTRON       .757          .768          .757          .737          .721          .721
BIOTECH        .744          .688          .673          .692          .665          .645
GAMING         .733          .666          .7            .7            .7            .7
SEMI           .732          .75           .741          .732          .706          .706
RUS-1000       .731          .721          .697          .683          .656          .646
SP500          .731          .713          .691          .683          .655          .643
NASD-100       .72           .688          .677          .688          .666          .612
REIT           .694          .678          .601          .621          .575          .575
SOLAR          .684          .684          .684          .684          .631          .631
COMPUTER       .68           .68           .72           .72           .64           .6
CHINA          .671          .671          .671          .671          .64           .625
N=31
-----------------------------------------------------------------------------------------------
COAL           .666          .555          .555          .444          .555          .444
INSURANC       .657          .657          .714          .685          .657          .628
RETAIL         .655          .603          .603          .586          .603          .586
EDU            .625          .625          .75           .625          .625          .625
UTILITY        .622          .644          .511          .533          .466          .422
BEVERAGE       .55           .5            .45           .45           .4            .4
COMODITY       .507          .521          .507          .45           .535          .535
N=9
-----------------------------------------------------------------------------------------------
GOLD           .471          .603          .566          .339          .415          .547
PIPELINE       .444          .444          .222          .222          .222          .222
JETS           .333          .333          .333          .111          .111          .111
BONDFUND       .303          .294          .303          .285          .276          .285
FOOD           .285          .285          .285          .285          .285          .285
HOSPITAL       .285          .285          .428          .428          .285          .285
N=6
==============================================================================
==============================================================================
10/4/2017
Is it time
for a pullback? The DJI has now risen 5
straight days. It is 1.8%
over the 21-dma. The Annualized Rate of
change for the DJI's 21-day ma is
only +.487. And today there were more down
than up on NYSE. Normally,
this would signify that the DJI needs to
retreat back to its rising 21-day ma.
That is NOT
the conclusion I reach. We have seen how
bullish it has been in the
past when the A/D Line is this strong going
into October. I've noted that we are
seeing now an unusually broad advance, in
that 70% of all the stocks and ETFs
we follow are above their 65-dma. (The
percentage is actually higher than
that because there are 250 or so negative
(Short) ETFs included in our tallies.)
See below how the number of new highs is 20x
the number of new lows.
Our MAXCPs are 8x the the number of MINCPs.
All this is significant. It
is much harder for so many stocks to change
direction all at once. As long
as the NYSE A/D Line is rising and there is
so little Red Distribution in the
DJI or the NASDAQ, I would expect the market
to continue to rise and
we should not be sellers yet.
Watch
The Jobs' Numbers on Friday.
The US Jobs' Report comes
out Friday morning. Below see the monthly numbers in 1000s.
I show them in blue when they are above the same month a year
before and red when they
are below it. It takes a long strong of (red) down months to
bring on a bear market. The
three recent (red) down-months is not a big problem for the
stock market yet. The stock
market normally leads these figures. By this theory, then
we should see a big jump,
way over 200,000 new jobs, either this month or next month.
Will we be disappointed? If we do not see a number over
200,000, a lot of
folks will be talking about how the stock market is getting
too far ahead of the economy.
In that environment, a rapid hiking of interest rates would
be dangerous. But even then,
history suggests short-term rates would have to go over 3% to
be dangerous for
the market. (This is what brought on the 1957 bear market).
My new Peerless book will show that the stock market is much
more affected by factors
other than the Employment Rate. More important are such
factors abrupt changes in the
direction of short-term interest rates, new taxes or tax
cuts, technological changes,
government spending and the perceived friendliness or
hostility of Government regulators,
especially in the area of anti-trust regulation.
Still, the Jobs report and the Inflation reports are very
important to Fed policy-makers.
So Friday morning, a low number, say below 150,000 new jobs
will likely be interpreted
as a sign of the economy's growth stalling out. This should
cause the Fed to delay raising rates
and so would actually be bullish. On the other hand, a big
job's number over 250,000 will,
no doubt, give the market a jolt upwards. But soon traders
then will start to worry that a
very high number of new jobs means that the economy is
getting "over-heated". This will
bring inflation and wage-hikes, the very things the Fed
usually chooses to fight with
higher interest rates.
| |
| Year |
Jan |
Feb |
Mar |
Apr |
May |
Jun |
Jul |
Aug |
Sep |
Oct |
Nov |
Dec |
| 2007 |
240 |
89 |
190 |
80 |
143 |
75 |
-34 |
-20 |
88 |
84 |
114 |
98 |
| 2008 |
17 |
-84 |
-78 |
-210 |
-186 |
-162 |
-213 |
-267 |
-450 |
-474 |
-766 |
-694 |
| 2009 |
-793 |
-702 |
-823 |
-687 |
-349 |
-471 |
-329 |
-213 |
-220 |
-204 |
-2 |
-275 |
| 2010 |
23 |
-68 |
164 |
243 |
524 |
-137 |
-68 |
-36 |
-52 |
262 |
119 |
87 |
| 2011 |
43 |
189 |
225 |
346 |
77 |
225 |
69 |
110 |
248 |
209 |
141 |
209 |
| 2012 |
358 |
237 |
233 |
78 |
115 |
76 |
143 |
177 |
203 |
146 |
132 |
244 |
| 2013 |
211 |
286 |
130 |
197 |
226 |
162 |
122 |
261 |
190 |
212 |
258 |
47 |
| 2014 |
190 |
151 |
272 |
329 |
246 |
304 |
202 |
230 |
280 |
227 |
312 |
255 |
| 2015 |
234 |
238 |
86 |
262 |
344 |
206 |
254 |
157 |
100 |
321 |
272 |
239 |
| 2016 |
126 |
237 |
225 |
153 |
43 |
297 |
291 |
176 |
249 |
124 |
164 |
155 |
| 2017 |
216 |
232 |
50 |
207 |
145 |
210 |
189(P) |
156(P) |
|
|
|
|
| P : preliminary |
|
|
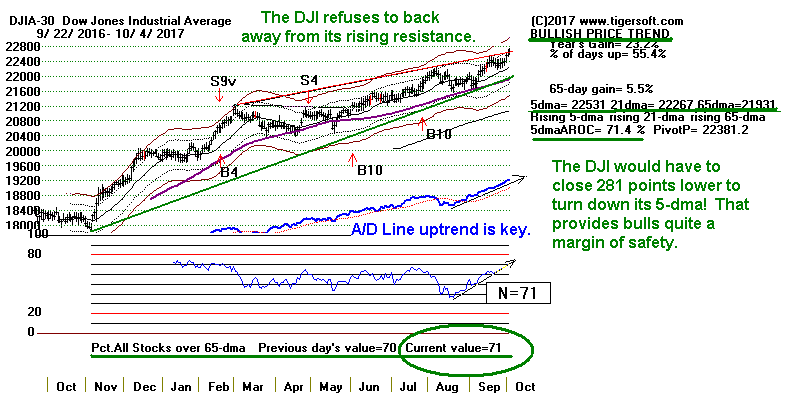
Charts 10/4/2017
PEERLESS DJI, Signals, Indicators Daily
DJI Split Volume 10-DayUp/Down
Vol
Hourly DJIA
A/D Line for
All Stocks
DJIA
S&P
OEX
NYSE
NASDAQ
COMPQX
with CP
DIA
SPY
QQQ
MDY
IWM-TNA
Short Term Interest Rates
DJI-Utilities
DJI-Transp
Nifty-30 Index
CrudeOil FAS
GLD
BBH
IBB
JETS
JNUG
KOL
NUGT
OIH
OIL
RSX
RETL SDS
SLV
SOXL
TECL
TMF
TNA UGA
(gasoline)
XIV YINN
Commodities: JJC, NIB,
CORN,
WEAT UUP
(Dollar)
AAPL ADBE
ALXN
AMAT
AMGN
AMZN BA
BABA
BIDU
CAT
FB
GOOG
GS
HD
IBM JPM
M (Macy's)
MASI
MSFT
NVDA QCOM
TSLA
TXN
ANDV,
CMG (Chipotle),
LRCX,
SWKS,
TOWN
Others REN, CVE
and SWN
10/4/2017
Bullish MAXCPs Bearish
MINCPs |
QUICKSILVER on ETFS - 10/04/17
Across-the-Board-Blue =
DIA IWM, SOXL, IBB, YINNETF CLOSE CHANGE PIVOT-PT 5dmaAROC CL-PWR CANDLE IP21 ITRS
---------------------------------------------------------------------------------------------
DIA 226.41 .17 223.6 73.3% Bullish BLUE .388 ----
-------------------------------------------------------------------------------------------
COMPQX 6534.63 2.92 6453.45 62.7% Bullish BLUE .326 -.03
---------------------------------------------------------------------------------------------
SPY 253.16 .3 250.35 61.9% Bullish BLUE .467 -.026
---------------------------------------------------------------------------------------------
QQQ 146.03 .14 144.41 54.1% Bearish BLUE .176 -.038
---------------------------------------------------------------------------------------------
MDY 329.84 -.2 325.96 70.3% Bullish BLUE .409 -.038
---------------------------------------------------------------------------------------------
IWM 149.85 -.48 147.83 81% Bullish RED .375 -.009
--------------------------------------------------------------------------------------------
FAS 57.16 -.31 55.4 198.6% Bullish RED .366 .035
---------------------------------------------------------------------------------------------
RETL 28.77 -.63 29.14 -138.2% ------- RED .387 .008
---------------------------------------------------------------------------------------------
SOXL 119.2 .78 112.42 403.4% Bullish BLUE .243 .169
---------------------------------------------------------------------------------------------
TECL 90.29 -.32 87.87 163.4% Bullish BLUE .217 .039
---------------------------------------------------------------------------------------------
IBB 340.48 2.63 330.55 155.5% Bullish BLUE .203 .003
---------------------------------------------------------------------------------------------
GLD 122.6 .58 119.46 142.2% ------- BLUE .092 .015
---------------------------------------------------------------------------------------------
OIL 5.16 -.07 5.39 -290.2% ------- RED .18 -.015
---------------------------------------------------------------------------------------------
OIH 25.67 -.04 26.04 -57.9% Bullish ---- .351 -.021
---------------------------------------------------------------------------------------------
GASL 23.3 -.25 23.3 -125.5% ------- RED .264 .026
---------------------------------------------------------------------------------------------
UGA 28.09 .28 28.81 -116.9% ------- BLUE .271 .045
---------------------------------------------------------------------------------------------
UUP 24.28 -.03 24.2 2.1% Bullish ---- .178 -.053
---------------------------------------------------------------------------------------------
IEF 106.36 -.03 106.65 -14.6% Bearish RED -.137 -.05
---------------------------------------------------------------------------------------------
CORN 17.3 -.06 17.48 -74.3% Bullish ---- .002 -.125
---------------------------------------------------------------------------------------------
WEAT 6.49 -.06 6.67 -188.9% ------- ---- .049 -.159
---------------------------------------------------------------------------------------------
YINN 32.26 .28 28.17 579.7% Bullish BLUE .134 .196
---------------------------------------------------------------------------------------------
RSX 22.29 .06 22.07 56.5% ------- ---- .245 .072
|
10/4 10/3 10/2 9/29 9/28
9/27 9/26 9/25 9/22 9/21 9/20 9/19 9/18
NEWHIGHS 444 652 700 441
407 441 235 221 304 208 347 408 406
NEWLOWS 19 28 25 27 25 23
20 20 31 33 38 39 29
--------------------------------------------------------------------------------------------------------------
MAXCPs 220 307 311 230 228 197 125
153 148 111 138 146 159
MINCPs 28 41 41 37 51 63
70 59 63 76 73 75 51
--------------------------------------------------------------------------------------------------------------
TTTNHs 109 102 153 97 106 120
114 98 92 70 78 85
86
TTTNLs
52 69 47
46
62 108
134 139 103 129 128 95
80
MAXCPs are Closing
Power new highs. MINCPs are Closing Power new lows for any given
day.
TTTNHs are Tiger Day Traders' Tool new highs. After opening, more
upside potential than downside risk.
TTTNLs are Tiger Day Traders' Tool new lows. After opening, more
downside potential than upside risk.
|
 RANKING OF KEY DIRECTORIES BASED PCT.OF STOCKS ABOVE 65-DMA
             10/4/17
  Bullish = 39
  Bearish = 5
---------------------------------------------------------------------------------------
Directory     Current       day-1         day-2         day-3         day-4         day-5
----------------------------------------------------------------------------------------
BIGBANKS       100%          1             1             1             1             1
BIGMIL         100%          1             1             1             1             1
AUTO           .95           .95           .875          .85           .875          .85
REGBANKS       .916          .916          .916          .916          .916          .916
FINANCE        .858          .836          .836          .847          .869          .847
GREEN          .838          .87           .87           .774          .838          .838
DOWJONES       .833          .766          .7            .666          .7            .633
HOMEBLDG       .833          .833          .833          .833          .722          .666
SP-100         .833          .802          .781          .781          .781          .76
MILITARY       .822          .8            .822          .755          .8            .777
INDEXES        .807          .779          .765          .737          .741          .732
CHEM           .805          .819          .791          .805          .763          .763
TRANSP         .8            .8            .7            .7            .7            .7
INDMATER       .785          .775          .734          .704          .704          .734
ETFS           .772          .787          .772          .727          .666          .681
DJI-13         .769          .692          .615          .538          .538          .461
ELECTRON       .768          .757          .742          .721          .721          .711
NIFTY          .766          .766          .7            .733          .7            .666
MORNSTAR       .76           .752          .739          .714          .693          .689
SEMI           .75           .741          .732          .706          .715          .715
OILGAS         .746          .772          .765          .746          .74           .753
RUS-1000       .723          .699          .681          .656          .649          .643
SP500          .716          .694          .683          .655          .646          .642
BIOTECH        .692          .673          .685          .673          .641          .649
NASD-100       .688          .677          .688          .666          .623          .666
SOFTWARE       .687          .671          .656          .593          .593          .64
SOLAR          .684          .684          .684          .631          .684          .736
COMPUTER       .68           .72           .72           .64           .6            .72
REIT           .678          .601          .621          .575          .58           .559
CHINA          .671          .671          .671          .64           .625          .671
N=29
==============================================================================================
GAMING         .666          .7            .7            .7            .7            .733
HACKERS        .666          .703          .629          .629          .555          .666
INSURANC       .657          .714          .685          .657          .657          .571
UTILITY        .644          .511          .533          .466          .422          .377
INFRA          .636          .545          .545          .545          .545          .545
EDU            .625          .75           .625          .625          .625          .625
RETAIL         .603          .603          .586          .603          .586          .586
GOLD           .584          .566          .358          .433          .528          .471
COAL           .555          .555          .444          .555          .444          .444
COMODITY       .521          .507          .45           .535          .535          .521
N=10
=============================================================================================
BEVERAGE       .5            .45           .45           .4            .4            .4
=============================================================================================
PIPELINE       .444          .333          .222          .222          .222          .222
JETS           .333          .333          .111          .111          .111          .111
BONDFUND       .294          .303          .285          .276          .285          .312
FOOD           .285          .285          .285          .285          .285          .285
HOSPITAL       .285          .428          .428          .285          .285          .285
N=5
===============================================================================
===============================================================================
10/3/2017
We are seeing a broad market advance now.
It should continue.
For a long time the DJI, the SP-500 and the highest priced tech
leaders have been the market's leaders. That is not so true now.
That puts the advance now on much firmer footing, I think. Contrast
the leadership posed now by the broad-based NASDAQ and Russell-2000
with the market earlier this year when the DJI's rise was powered
mostly by high-priced Goldman Sachs and later Boeing.
That this is no mere focus on dividend-paying stocks on the NYSE,
the long semi-dormant Russell-2000 (IWM) has now become the new leader
of the general market ETFs. With 70% of all the stocks and ETFs
that we follow now above their 65-dma, the leaders should find plenty
of support on their next declines. I especially like the NASDAQ's flat
topped
breakout into all-time high territory. Underpinning its advance is a
record high
AI/200 score of 196.
For the record, I take the operative Peerless signal to be a Buy B10.
The August S9-V was too marginal to bring more than a brief test of the
DJI's rising 50-day. Now that we are in October, Sell S9-V signals
are not allowed. They can only occur in the Summer. So, with the
P-I and IP21 quite positive, we cannot easily get a new Peerless Sell.
Still, we can not rule out some hesitation now. IWM has just risen
eight straight days; the DJI is now at a its rising red-resistance line
and its 1.9% upper band. Note also that the DJI's annualized 21-dma
rate
of ascent (AROC) is only 35%. This is hardly escape velocity.
Still a slow and steady DJI advance is technically sustainable, especially
if Congress delivers a big cut in the corporate tax rate and finds a way
to allow corporations to repatriate hoards of overseas profits.
Investors
are betting that all this money will used for lots and lots of buy-outs of
smaller tech companies.
Charts 10/3/2017
PEERLESS DJI, Signals, Indicators Daily
DJI Split Volume 10-DayUp/Down
Vol
Hourly DJIA A/D
Line for All Stocks
DJIA
S&P
OEX
NYSE
NASDAQ
COMPQX
with CP
DIA
SPY
QQQ
MDY
IWM-TNA
Short Term Interest Rates
DJI-Utilities
DJI-Transp
Nifty-30 Index
CrudeOil FAS
GLD
BBH
IBB
JETS
JNUG
KOL
NUGT
OIH
OIL
RSX
RETL SDS
SLV
SOXL
TECL
TMF
TNA UGA
(gasoline)
XIV YINN
Commodities: JJC, NIB,
CORN,
WEAT UUP
(Dollar)
AAPL ADBE
ALXN
AMAT
AMGN
AMZN BA
BABA
BIDU
CAT
FB
GOOG
GS
HD
IBM JPM M
(Macy's) MASI
MSFT
NVDA QCOM
TSLA
TXN
ANDV, CMG (Chipotle), LRCX,
SWKS,
TOWN
Others REN, CVE
and SWN
10/3/2017
Bullish MAXCPs
Bearish MINCPs |
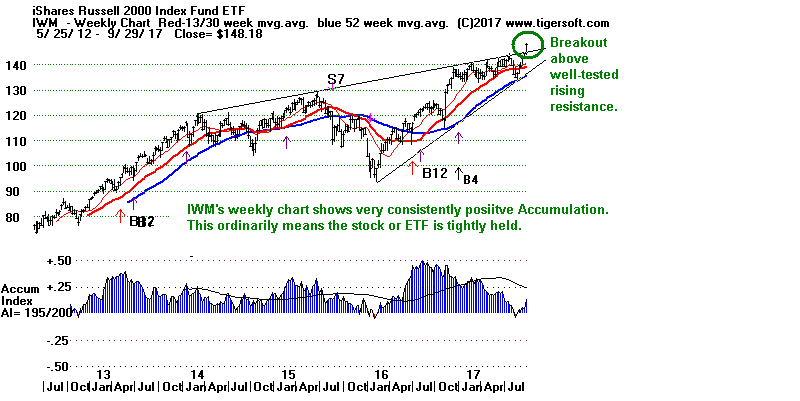
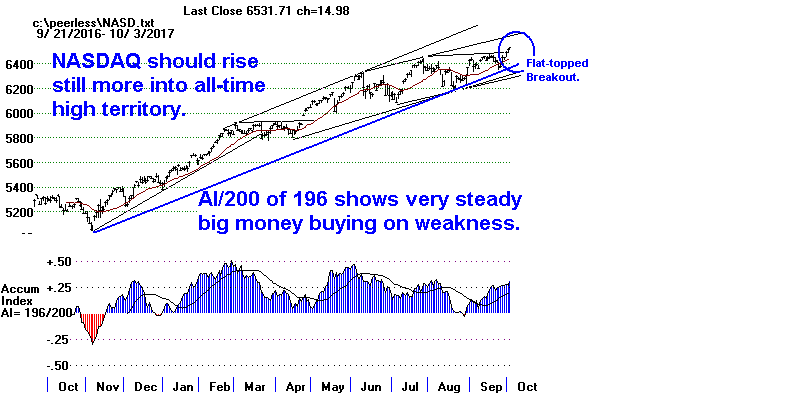
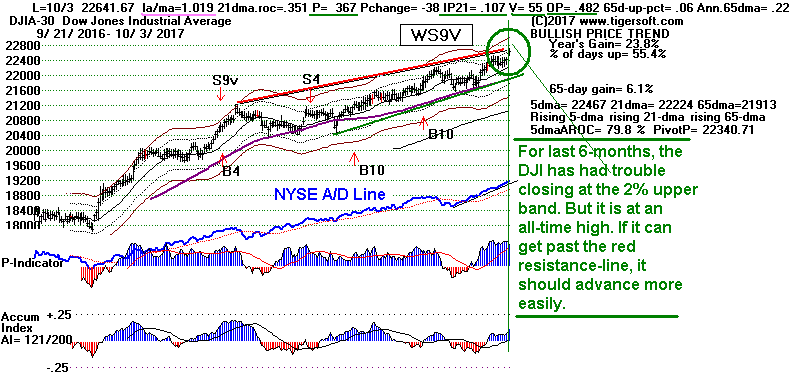


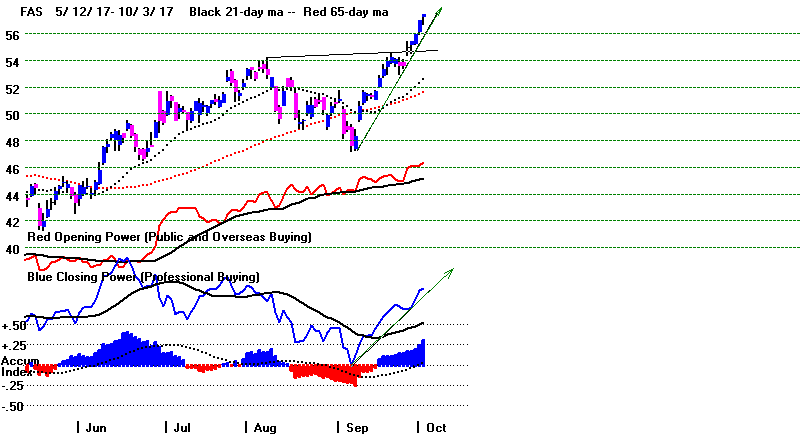
                 QUICKSILVER on ETFS - 10/03/17
                         Across-the-Board-Blue =
                  DIA IWM, FAS, SOXL, YINN
ETF      CLOSE     CHANGE    PIVOT-PT      5-dma AROC   CL-PWR   CANDLE  IP21   ITRS
---------------------------------------------------------------------------------------------
DIA       226.24     1        223.12        79.3%       Bullish   BLUE   .325    ---
---------------------------------------------------------------------------------------------
COMPQX    6531.71    14.99   6453.26       117.3%       Bullish   BLUE   .308   -.033
---------------------------------------------------------------------------------------------
SPY       252.86    .54      250.05        75.4%        Bullish   BLUE   .43    -.027
---------------------------------------------------------------------------------------------
QQQ       145.89    .31      144.46        94%          Bearish   BLUE   .157   -.044
---------------------------------------------------------------------------------------------
MDY       330.04    .84      325.24        120%         Bullish   BLUE   .367   -.032
---------------------------------------------------------------------------------------------
IWM       150.33    .33      147.44        193.8%       Bullish   BLUE   .365   .001
---------------------------------------------------------------------------------------------
FAS       57.47     .47       54.93        350.3%       Bullish   BLUE   .297   .066
---------------------------------------------------------------------------------------------
RETL      29.4      .24       29.58        123.4%       -------   RED    .421   .102
---------------------------------------------------------------------------------------------
SOXL      118.42    1.16     109.95        702.5%       Bullish   BLUE   .191   .157
---------------------------------------------------------------------------------------------
TECL       90.61    +.71      87.38        329.3        -------   BLUE   .187   .034
---------------------------------------------------------------------------------------------
IBB       337.85   -.79      330.09        145.1%       -------   RED    .163   -.02
---------------------------------------------------------------------------------------------
GLD       122.6     .58      119.46        142.2%       -------   BLUE   .092   .012
---------------------------------------------------------------------------------------------
OIL       5.23     -.01        5.47        -195%        Bullish   ----   .177   .033
---------------------------------------------------------------------------------------------
OIH       25.71    -.13       25.97        -25%         Bullish    RED   .392  -.01
---------------------------------------------------------------------------------------------
GASL      23.55   -.11       23.89         55.4%        -------   BLUE   .251  .128
---------------------------------------------------------------------------------------------
UGA       27.81    .14       28.75        -269.7%       -------   BLUE   .111   .057
---------------------------------------------------------------------------------------------
UUP       24.31   -.01       24.27         33%          Bullish   ----   .17   -.053
---------------------------------------------------------------------------------------------
IEF       106.39   .15      106.67        -38.9%        Bearish   BLUE  -.065  -.058
---------------------------------------------------------------------------------------------
CORN      17.36   -.11       17.56        -31.4%        Bullish   ----  -.038  -.14
---------------------------------------------------------------------------------------------
WEAT      6.55    .01        6.74         -82.9%        Bearish   ----  -.023  -.175
---------------------------------------------------------------------------------------------
YINN      31.98    2.59      28.84        591.7%        Bullish   BLUE   .132  .177
---------------------------------------------------------------------------------------------
RSX       22.23    .15       22.04        38.4%         -------   BLUE   .219  .069
Blue Closing bullishly still above 5-dma pivot
point.
Red closing is bearishly still below 5-dma pivot point.
Blue candle-stick color shows close is bullishly above opening.
Red candle-stick color shows close is bearishly < opening.
QuickSilver
considers an IP21>.15 and above its 21-dma to be bullish.
An IP21<-.15 and below its 21-dma is bearish.
Blue 5dma AROC is still rising.
Red 5dma AROC is bearishly falling.
|
10/3 10/2
9/29 9/28
9/27
9/26 9/25 9/22 9/21
9/20 9/19 9/18NEWHIGHS
652 700 441
407 441 235
221 304 208 347
408 406
NEWLOWS 28 25 27 25 23 20
20 31 33
38 39 29
--------------------------------------------------------------------------------------------------------------
MAXCPs
307 311 230 228 197 125 153 148
111 138 146 159
MINCPs
41 41 37 51 63 70 59
63 76 73
75 51
--------------------------------------------------------------------------------------------------------------
TTTNHs
102 153 97 106 120 114
98 92 70
78 85 86
TTTNLs
69 47 46 62 108 134
139 103 129
128 95
80
MAXCPs are Closing
Power new highs. MINCPs are Closing Power new lows for any
given day.
TTTNHs are Tiger Day Traders' Tool new highs. After opening, more
upside potential than downside risk.
TTTNLs are Tiger Day Traders' Tool new lows. After opening, more
downside potential than upside risk. |
 RANKING OF KEY DIRECTORIES BASED PCT.OF STOCKS ABOVE 65-DMA
10/3/17
Bullish = 38
Bearish = 8
---------------------------------------------------------------------------------------
Directory Current day-1 day-2 day-3 day-4 day-5
----------------------------------------------------------------------------------------
BIGBANKS 100% 1 1 1 1 1
BIGMIL 100% 1 1 1 1 1
AUTO .95 .875 .85 .875 .85 .85
REGBANKS .916 .916 .916 .916 .916 .861
GREEN .87 .87 .774 .838 .838 .741
FINANCE        .836          .836          .847          .869          .847          .815
HOMEBLDG       .833          .833          .833          .722          .666          .666
CHEM           .819          .805          .791          .763          .763          .75
SP-100         .804          .783          .773          .783          .773          .752
MILITARY       .8            .822          .755          .8            .777          .755
TRANSP         .8            .7            .7            .7            .7            .65
ETFS           .787          .772          .727          .666          .696          .742
INDEXES        .779          .765          .737          .741          .732          .755
OILGAS         .778          .772          .746          .74           .753          .74
INDMATER       .775          .734          .704          .704          .734          .693
DOWJONES       .766          .7            .666          .7            .666          .733
NIFTY          .766          .7            .733          .7            .666          .566
ELECTRON       .757          .742          .726          .721          .711          .659
MORNSTAR       .752          .739          .714          .693          .693          .676
EDU            .75           .625          .625          .625          .625          .625
SEMI           .741          .732          .706          .715          .715          .646
COMPUTER       .72           .72           .64           .6            .72           .48
INSURANC       .714          .685          .657          .657          .571          .514
HACKERS        .703          .629          .629          .555          .666          .555
GAMING         .7            .7            .7            .7            .733          .533
RUS-1000       .7            .683          .655          .649          .639          .636
SP500          .695          .683          .653          .647          .641          .635
DJI-13         .692          .615          .538          .538          .461          .538
SOLAR          .684          .684          .631          .684          .736          .578
BIOTECH        .677          .685          .665          .649          .641          .629
NASD-100       .677          .688          .666          .623          .645          .559
SOFTWARE       .671          .656          .593          .593          .625          .5
N=30
===============================================================================================
CHINA          .666          .666          .634          .619          .666          .65
RETAIL         .603          .586          .603          .586          .586          .551
REIT           .601          .621          .575          .58           .569          .621
COAL           .555          .444          .555          .444          .444          .444
GOLD           .547          .358          .452          .547          .452          .584
INFRA          .545          .545          .545          .545          .545          .545
UTILITY        .511          .533          .466          .422          .422          .644
COMODITY       .507          .45           .535          .535          .521          .549
N=8
===============================================================================================
BEVERAGE       .45           .45           .4            .4            .4            .4
HOSPITAL       .428          .428          .285          .285          .285          .285
JETS           .333          .111          .111          .111          .111          .111
PIPELINE       .333          .333          .222          .222          .222          .333
BONDFUND       .303          .285          .276          .285          .312          .517
FOOD           .285          .285          .285          .285          .285          .285
N=6
================================================================================
================================================================================
10/2/2017
The DJI finally made a new high today.
It and the SP-500 have
now reached the top of their price channels.
NYSE Volume still remains
low. Apparently, there is not enough volume to lift all the major
stocks and ETFs at once. Today bank
stocks, biotechs,
IWM and
MDY got infusions of funds, but "Apple
and 'friends' (ADBE,
AMZN,
FB, GOOG) went nowhere while big
Retailers were discounted.
BUY IBB
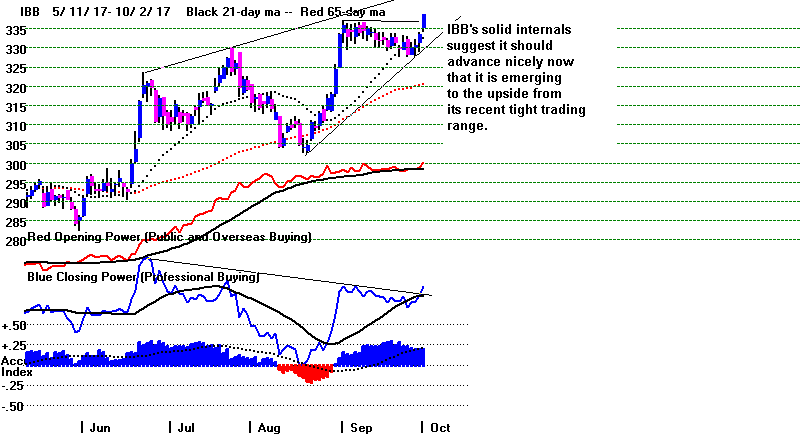
All our measures of technical strength remain bullish except
NYSE
volume. This has not stopped the rally so far. Why would it stop
it now. Breadth is very favorable.
DIA,
FAS, and IBB now
show "across-the-board" Quicksilver strength along with
SOXL
and IBB. It is usually more
bullish when the DJI's strength is
matched by the big banks. By this principle, the confirmed new
high made by FAS has to be viewed as most constructive.
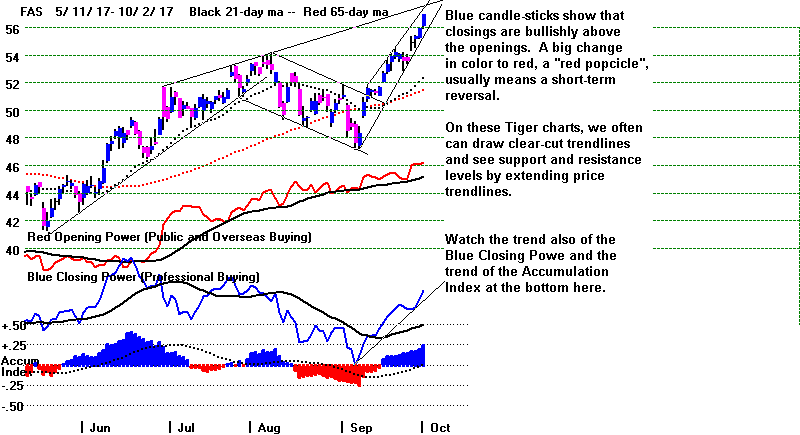
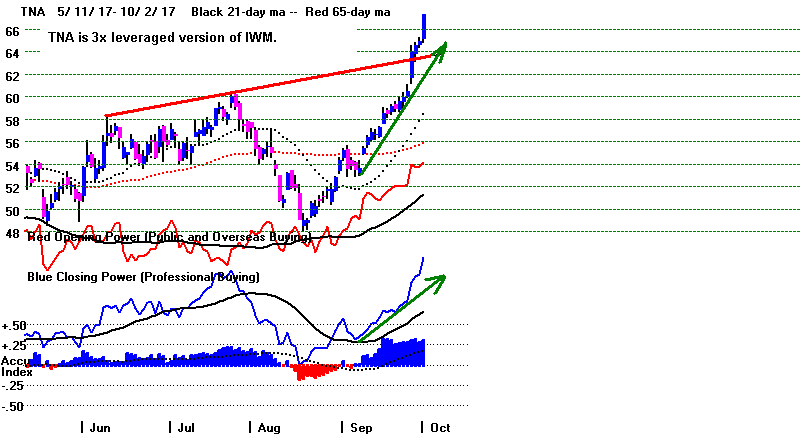
IWM's run into all-time high territory continues. This extended streak
of up-days is creating confidence enough for traders to buy lots of small
biotechs. Once again, most of the biggest percent gainers on the
NASDAQ
were smaller biotechs.
http://www.wsj.com/mdc/public/page/2_3021-gainnnm-gainer.html
I put together a page of bullish-looking biotechs. Here we are not
interested just in the high volume breakouts showing intense Accumulation,
but also inverted head/shoulders patterns in those biotechs that have
been beaten down mercilessly. See
tonight's special biotech page.
the market's technicals now are Quite Bullish.
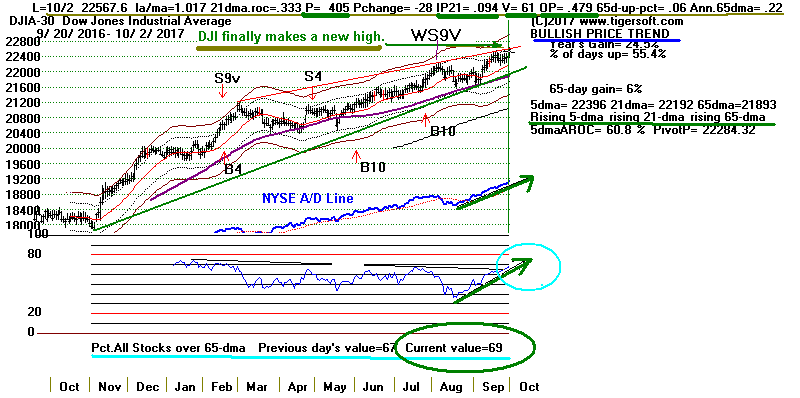
Charts 10/2/2017
PEERLESS DJI, Signals, Indicators Daily
DJI Split Volume 10-DayUp/Down
Vol
Hourly DJIA A/D
Line for All Stocks
DJIA
S&P
OEX
NYSE
NASDAQ
COMPQX
with CP
DIA
SPY
QQQ
MDY
IWM-TNA
Short Term Interest Rates
DJI-Utilities
DJI-Transp
Nifty-30 Index
CrudeOil FAS
GLD
BBH
IBB
JETS
JNUG
KOL
NUGT
OIH
OIL
RSX
RETL SDS
SLV
SOXL
TECL
TMF
TNA UGA
(gasoline)
XIV YINN
Commodities: JJC, NIB,
CORN,
WEAT UUP
(Dollar)
AAPL ADBE
ALXN
AMAT
AMGN
AMZN BA
BABA
BIDU
CAT
FB
GOOG
GS
HD
IBM JPM M
(Macy's) MASI
MSFT
NVDA QCOM
TSLA
TXN
ANDV, CMG (Chipotle), LRCX,
SWKS,
TOWN
Others REN, CVE
and SWN
10/2/2017
Bullish MAXCPs
Bearish MINCPs |
                  QUICKSILVER on ETFS - 10/02/17
                         Across-the-Board-Blue =
                  DIA IWM, FAS, SOXL
ETF       CLOSE    CHANGE     PIVOT-PT      5-dma AROC   CL-PWR   CANDLE  IP21   ITRS
---------------------------------------------------------------------------------------------
DIA       225.24    1.42     222.69           54.2%     Bullish    BLUE   .247   0
---------------------------------------------------------------------------------------------
COMPQX    6516.72  20.76    6380.16          113.6%     -------    BLUE   .268 -.025
---------------------------------------------------------------------------------------------
SPY       252.32    1.09     249.08           67.8%     -------    BLUE   .363 -.023
---------------------------------------------------------------------------------------------
QQQ       145.58     .13     143.17           96.5%     Bearish     RED   .136 -.035
---------------------------------------------------------------------------------------------
MDY       329.2     2.87     322.22          111.8%     Bullish    BLUE   .333 -.026
---------------------------------------------------------------------------------------------
IWM       150       1.82     144.61          187.7%     Bullish    BLUE   .343  .007
---------------------------------------------------------------------------------------------
FAS       57        1.03      53.59          307.1%     Bullish    BLUE   .237  .073
---------------------------------------------------------------------------------------------
RETL      29.16     -.09       28.68         202.2%     -------     RED   .429  .044
---------------------------------------------------------------------------------------------
SOXL      117.26    2.00     102.75        659.4%       Bullish    BLUE   .168  .14
---------------------------------------------------------------------------------------------
TECL       89.89     .31      84.82        332.0%       Bearish    BLUE   .139  .042
---------------------------------------------------------------------------------------------
IBB       338.64    5.05     328.21        109.4%       -------    BLUE   .187 -.003
---------------------------------------------------------------------------------------------
GLD       122.6      .58     119.46        142.2%       -------    BLUE   .092  .019
---------------------------------------------------------------------------------------------
OIL        5.24     -.14       5.44        -239.1%      Bullish    ----   .206  .058
---------------------------------------------------------------------------------------------
OIH       25.84     -.23      25.84         9.6%        Bullish    BLUE   .402 -.012
---------------------------------------------------------------------------------------------
GASL      23.66      .52      23.29        165.2%       -------    BLUE   .284  .129
---------------------------------------------------------------------------------------------
UGA       27.67     -.48      29.35       -367.6%       -------    BLUE   .274  .061
---------------------------------------------------------------------------------------------
UUP       24.32      .14      24.15        51.7%        Bullish    ----   .178 -.045
---------------------------------------------------------------------------------------------
IEF       106.24    -.28     107.22       -50.1%        Bearish    RED   -.138 -.053
---------------------------------------------------------------------------------------------
CORN      17.47     -.17      17.47       -14.3%        -------    RED   -.042 -.135
---------------------------------------------------------------------------------------------
WEAT       6.54     -.04      6.66        -75.1%        -------    ----   .006 -.183
---------------------------------------------------------------------------------------------
YINN      29.39      .28     28.57         263%         Bullish     RED   .073  .095
---------------------------------------------------------------------------------------------
RSX       22.08     -.21     22.06        -36.1%        -------     RED   .238  .059
Blue Closing bullishly still above 5-dma pivot
point.
Red closing is bearishly still below 5-dma pivot point.
Blue candle-stick color shows close is bullishly above opening.
Red candle-stick color shows close is bearishly < opening.
QuickSilver
considers an IP21>.15 and above its 21-dma to be bullish.
An IP21<-.15 and below its 21-dma is bearish.
Blue 5dma AROC is still rising.
Red 5dma AROC is bearishly falling.
|
DAILY TIGER SCAN NUMBERS
10/2
9/29 9/28
9/27
9/26 9/25 9/22 9/21
9/20 9/19 9/18NEWHIGHS 700 441
407 441 235
221 304 208 347
408 406
NEWLOWS 25 27 25 23 20
20 31 33
38 39 29
--------------------------------------------------------------------------------------------------------------
MAXCPs 311 230 228 197 125 153 148
111 138 146 159
MINCPs 41 37 51 63
70 59
63 76 73
75 51
--------------------------------------------------------------------------------------------------------------
TTTNHs
153 97 106 120 114
98 92 70
78 85 86
TTTNLs
47 46 62
108 134
139 103 129
128 95
80
MAXCPs are Closing
Power new highs. MINCPs are Closing Power new lows for any
given day.
TTTNHs are Tiger Day Traders' Tool new highs. After opening, more
upside potential than downside risk.
TTTNLs are Tiger Day Traders' Tool new lows. After opening, more
downside potential than upside risk. |
 RANKING OF KEY DIRECTORIES BASED PCT.OF STOCKS ABOVE 65-DMA
              10/2/17
Bullish = 37
Bearish = 9
---------------------------------------------------------------------------------------
Directory     Current       day-1         day-2         day-3         day-4         day-5
----------------------------------------------------------------------------------------
BIGBANKS       100%          1             1             1             1             1
BIGMIL         100%          1             1             1             1             1
REGBANKS       .916          .916          .916          .916          .861          .833
AUTO           .875          .85           .875          .85           .85           .825
GREEN          .87           .774          .838          .838          .741          .741
FINANCE        .836          .847          .869          .847          .815          .804
HOMEBLDG       .833          .833          .722          .666          .666          .555
MILITARY       .822          .755          .8            .777          .755          .711
CHEM           .805          .805          .75           .763          .736          .75
SP-100         .781          .781          .781          .77           .76           .75
OILGAS         .778          .753          .74           .753          .746          .721
ETFS           .772          .727          .666          .696          .742          .772
INDEXES        .765          .737          .741          .732          .755          .769
ELECTRON       .742          .726          .726          .711          .664          .659
MORNSTAR       .739          .714          .693          .693          .676          .676
INDMATER       .734          .704          .704          .734          .724          .724
SEMI           .732          .706          .715          .715          .646          .637
COMPUTER       .72           .64           .6            .72           .48           .44
DOWJONES       .7            .666          .7            .666          .733          .666
GAMING         .7            .7            .7            .733          .533          .566
NIFTY          .7            .733          .7            .666          .6            .666
TRANSP         .7            .7            .7            .7            .65           .65
BIOTECH        .688          .665          .641          .649          .625          .637
INSURANC       .685          .657          .657          .571          .542          .514
RUS-1000       .684          .656          .648          .639          .632          .628
SOLAR          .684          .631          .684          .736          .578          .578
SP500          .683          .655          .646          .64           .628          .622
NASD-100       .67           .647          .602          .625          .534          .556
N=28
============================================================================================
CHINA          .666          .634          .619          .666          .65           .603
SOFTWARE       .656          .593          .593          .625          .5            .484
HACKERS        .64           .64           .56           .68           .56           .52
EDU            .625          .625          .625          .625          .625          .5
REIT           .621          .575          .58           .569          .626          .575
DJI-13         .615          .538          .538          .461          .538          .384
RETAIL         .586          .603          .586          .586          .551          .534
INFRA          .545          .545          .545          .545          .545          .545
UTILITY        .533          .466          .422          .422          .555          .6
N=9
===========================================================================================
BEVERAGE       .45           .4            .4            .4            .4            .4
COMODITY       .45           .535          .535          .521          .549          .633
COAL           .444          .555          .444          .444          .444          .444
HOSPITAL       .428          .285          .285          .285          .285          .285
GOLD           .339          .452          .566          .471          .603          .735
PIPELINE       .333          .333          .222          .222          .333          .333
BONDFUND       .285          .276          .285          .312          .517          .553
FOOD           .285          .285          .285          .285          .285          .357
JETS           .111          .111          .111          .111          .222          .222
N=9
=================================================================================
=================================================================================
9/29/2017
Given that we are at the end of September,
the market's technicals now are Quite Bullish.
The
NYSE A/D Line keeps soaring to new highs ahead of the DJI.
As long as it does not break its uptrend, we have to be bullish. Most
of
our other indicators remain overwhelmingly bullish despite the
seasonal weakness that September often brings. The DJI and SP-500
remain stuck in rising wedge patterns. As a result, I believe there
is more upside potential in
IWM.
With IWM, however, there are
very few cases of it taking off in a big vertical ascent, like it is now
attempting. See
all IWM's yearly
charts since 2001 here. So,
we have to watch it to be sure that its price and Closing Power
uptrends are not violated.
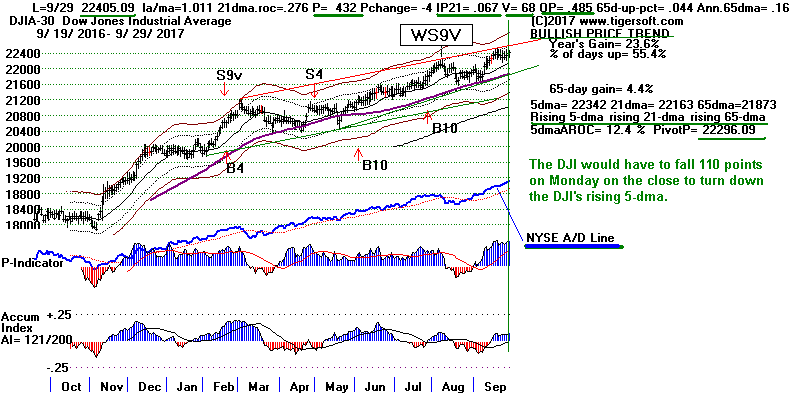
What happens when the NYSE A/D Line makes a new high at
end of September with the Peerless IP21 and V-I clearly positive?
In all 8 cases of this since 1932, the DJI worked higher for at least
the next two months: 1944, 1945, 1949, 1950, 1958, 1968, 2006 and 2010.
See them all here. But there was one top on
9/26/1976.
This
could have been spotted when the NYSE A/D Line uptrend was broken.
There was another case in
1997.
But its negative IP21 (Accum. Index)
made it easily picked out as bearish.
Watch SOXL and FAS now.
The semi-conductor ETF, SOXL, made a nominal new high on Friday. Semi-
conductors are very sensitive to any economic slow-down or expansion.
They tend to lead stock prices. A clear-cut breakout would be quite
bullish.
FAS, representing big banks, is in the same technical position. We
need to see
them make decisive breakouts with a big improvement in their Closing Power.
Professionals, as represented by the Closing Powers here, have been lagging.
To reinforce the market's bullishness now, we need to see that
Professionsals
are now switching to the long side. If they do, we should see the
market
continue to advance in October.
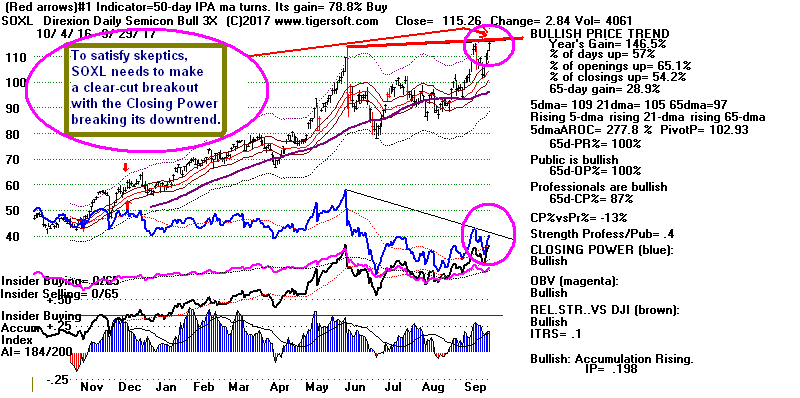
Watch FAS
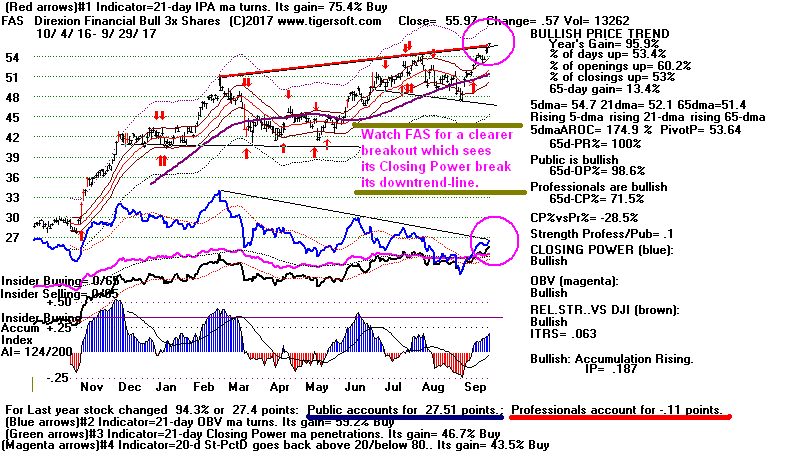
How's This for A
Flat-Topped Breakout?
Rallies like MDGL started to occur regularly in
unseasoned biotech stocks
in 1999-2000. We could be entering a very bullish period for small
biotechs
stocks that receive FDA approvals or show new success in clinical trials.
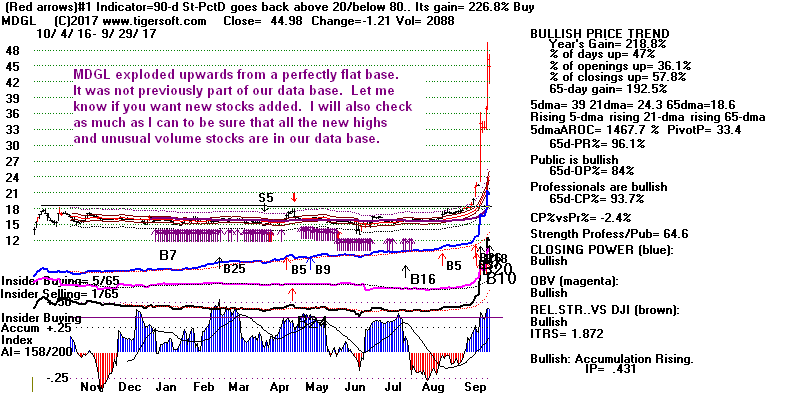
See Motley Fool's comments about this company being a potential take-over.
https://www.fool.com/investing/2017/09/30/3-biotech-stocks-that-soared-this-week-are-they-bu.aspx?yptr=yahoo
We did have in our data stocks' base SPPI and
it was recommended below $10 in our Stocks'
Hotline and on the MAXCP page here. Here is what the Motley Fool
people are now saying
about it:
SPPI "announced
promising results from pre-clinical testing of
experimental drug
poziotinib in treating non-small-cell lung cancer (NSCLC). Encouraging
pre-clinical results
sometimes boost small biotech stocks with no
approved products, but Spectrum has six
products already on the market. No one would have
been surprised if late-stage results
served as a nice catalyst for Spectrum. However,
it's practically unheard of for a stock like
Spectrum to soar on pre-clinical data. Keep in
mind, though, that poziotinib is also in a
couple of phase 2 studies targeting NSCLC and breast
cancer. The pre-clinical results
showed that in vitro responses for the drug in NSCLC
could be much more effective
than AstraZeneca's
Tagrisso and Boehringer Ingelheim's Gilotrif. If
these results are
also demonstrated in Spectrum's phase 2 study for
NSCLC, the company could have a
huge winner on its hands." (Italics added
here.)
Charts 9/29/2017
PEERLESS DJI, Signals, Indicators Daily
DJI Split Volume 10-DayUp/Down
Vol
Hourly DJIA A/D
Line for All Stocks
DJIA
S&P
OEX
NYSE
NASDAQ
COMPQX
with CP
DIA
SPY
QQQ
MDY
IWM-TNA
Short Term Interest Rates
DJI-Utilities
DJI-Transp
Nifty-30 Index
CrudeOil FAS
GLD
BBH
IBB
JETS
JNUG
KOL
NUGT
OIH
OIL
RSX
RETL SDS
SLV
SOXL
TECL
TMF
TNA UGA
(gasoline)
XIV YINN
Commodities: JJC, NIB,
CORN,
WEAT UUP
(Dollar)
AAPL ADBE
ALXN
AMAT
AMGN
AMZN BA
BABA
BIDU
CAT
FB
GOOG
GS
HD
IBM JPM M
(Macy's) MASI
MSFT
NVDA QCOM
TSLA
TXN
ANDV, CMG (Chipotle), LRCX,
SWKS,
TOWN
Others REN, CVE
and SWN
9/29/2017
Bullish MAXCPs
Bearish MINCPs
|
         COLOR CODED QUICKSILVER on KEY ETFS - 09/29/17
       Across-the-Board-Blue = IWM, FAS, SOXL
       FAS and SOXL need to breakout more decisively
       to achieve breakout-buy status for QuickSilver
       traders.
Across-the-Board-Blue = IWM, FAS, SOXL
ETF      CLOSE   CHANGE     PIVOT-PT      5-dma AROC   CL-PWR   CANDLE  IP21   ITRS
---------------------------------------------------------------------------------------------
DIA       223.82    .22      222.82        13.9%      -------   BLUE    .206   0
---------------------------------------------------------------------------------------------
COMPQX    6495.96    42.51   6370.59       53.8%      -------   BLUE      .278  -.019
---------------------------------------------------------------------------------------------
SPY       251.23    .88      248.93        35.9%      -------   BLUE      .36   -.019
---------------------------------------------------------------------------------------------
QQQ       145.45    1.04     142.8         39.3%      Bearish   BLUE     .188  -.026
---------------------------------------------------------------------------------------------
MDY       326.33    .37      321.95        79%        Bullish   BLUE      .314  -.027
---------------------------------------------------------------------------------------------
IWM       148.18    .35      144.5         133.1%     Bullish   BLUE    .324  -.001
---------------------------------------------------------------------------------------------
FAS       55.97    .57       53.64         174.9%     Bullish   BLUE    .187   .063
---------------------------------------------------------------------------------------------
RETL      29.25    .11       27.99         348.8%     -------   RED     .418   .04
---------------------------------------------------------------------------------------------
SOXL      115.26   2.84     102.93        277.8%      Bullish   BLUE    .199   .1
---------------------------------------------------------------------------------------------
TECL      5050.79    69.1    5003.55       105.7%     -------   BLUE   -.025  -.018
---------------------------------------------------------------------------------------------
IBB       333.59    3.04     331.4         55.3%      -------   BLUE      .188  -.002
---------------------------------------------------------------------------------------------
GLD       122.6    .58       119.46        142.2%     -------   BLUE      .092   .029
---------------------------------------------------------------------------------------------
OIL       5.38    -.01        5.5           92.3%     Bullish   ----    .199   .058
---------------------------------------------------------------------------------------------
OIH       26.07    .03       25.79         166.9%     Bullish   BLUE    .371  -.019
---------------------------------------------------------------------------------------------
GASL      23.14   -.16       22.89         379%       -------   BLUE    .282   .09
---------------------------------------------------------------------------------------------
UGA       28.15   -.66       29.8         -137.3%     -------   RED     .389   .06
---------------------------------------------------------------------------------------------
UUP       24.18   -.02       24.07         51.8%      Bullish   ----    .131  -.044
---------------------------------------------------------------------------------------------
IEF       106.52   -.13      107.31       -22%        Bearish   RED    -.052  -.039
---------------------------------------------------------------------------------------------
CORN      17.64    .16       17.52         45.7%      Bullish   BLUE    .041  -.136
---------------------------------------------------------------------------------------------
WEAT      6.58   -.09        6.64         -22.5%      -------   RED    -.011  -.179
---------------------------------------------------------------------------------------------
YINN      29.11    .94       27.89        -206.9%     Bullish   BLUE    .122   .091
---------------------------------------------------------------------------------------------
RSX       22.29    .22       22.24         104.3%     -------   BLUE    .275   .063
Blue Closing bullishly still above 5-dma pivot
point.
Red closing is bearishly still below 5-dma pivot point.
Blue candle-stick color shows close is bullishly above opening.
Red candle-stick color shows close is bearishly < opening.
QuickSilver
considers an IP21>.15 and above its 21-dma to be bullish.
An IP21<-.15 and below its 21-dma is bearish.
Blue 5dma AROC is still rising.
Red 5dma AROC is bearishly falling.
|
DAILY TIGER SCAN NUMBERS
9/29 9/28
9/27
9/26 9/25 9/22 9/21
9/20 9/19 9/18NEWHIGHS
441
407 441 235
221 304 208 347
408 406
NEWLOWS 27 25 23 20
20 31 33
38 39 29
--------------------------------------------------------------------------------------------------------------
MAXCPs 230 228 197 125 153 148
111 138 146 159
MINCPs
37 51 63
70 59
63 76 73
75 51
--------------------------------------------------------------------------------------------------------------
TTTNHs
97 106 120 114
98 92 70
78 85 86
TTTNLs
46 62
108 134
139 103 129
128 95
80
MAXCPs are Closing
Power new highs. MINCPs are Closing Power new lows for any
given day.
TTTNHs are Tiger Day Traders' Tool new highs. After opening, more
upside potential than downside risk.
TTTNLs are Tiger Day Traders' Tool new lows. After opening, more
downside potential than upside risk. |
        67% of All Stocks/ETFS are above their 65-dma


RANKING OF KEY DIRECTORIES BASED PCT.OF STOCKS ABOVE 65-DMA
               9/29/17
Bullish = 38
Bearish = 9
---------------------------------------------------------------------------------------
Directory     Current       day-1         day-2         day-3         day-4         day-5
----------------------------------------------------------------------------------------
BIGBANKS       100%          1             1             1             1             1
BIGMIL         100%          1             1             1             1             1
REGBANKS       .916          .916          .916          .861          .861          .861
FINANCE        .847          .869          .847          .815          .815          .826
AUTO           .846          .871          .846          .846          .82           .794
HOMEBLDG       .833          .722          .666          .666          .555          .611
CHEM           .805          .763          .75           .736          .75           .736
SP-100         .783          .783          .762          .762          .752          .731
GREEN          .774          .838          .838          .741          .741          .774
OILGAS         .759          .746          .753          .746          .734          .658
MILITARY       .755          .8            .777          .755          .711          .733
INDEXES        .737          .741          .732          .755          .769          .746
NIFTY          .733          .7            .666          .6            .666          .733
ETFS           .727          .666          .696          .742          .772          .833
ELECTRON       .726          .726          .716          .664          .654          .701
MORNSTAR       .714          .693          .693          .676          .68           .668
SEMI           .706          .715          .715          .646          .637          .706
INDMATER       .704          .704          .734          .724          .724          .744
GAMING         .7            .7            .733          .533          .566          .7
TRANSP         .7            .7            .7            .65           .65           .65
N=20
==============================================================================================
DOWJONES       .666          .7            .666          .733          .666          .733
BIOTECH        .665          .637          .637          .629          .625          .618
INSURANC       .657          .657          .571          .542          .514          .514
RUS-1000       .657          .649          .638          .632          .628          .612
SP500          .657          .647          .639          .629          .623          .597
NASD-100       .647          .602          .625          .534          .556          .59
COMPUTER       .64           .6            .72           .48           .44           .52
HACKERS        .64           .56           .68           .56           .52           .6
CHINA          .634          .619          .666          .65           .619          .65
SOLAR          .631          .684          .736          .578          .578          .789
EDU            .625          .625          .625          .625          .5            .5
RETAIL         .603          .586          .586          .551          .534          .5
SOFTWARE       .593          .593          .625          .5            .5            .609
REIT           .575          .58           .569          .626          .575          .502
COAL           .555          .444          .444          .444          .444          .444
INFRA          .545          .545          .545          .545          .545          .636
DJI-13         .538          .538          .461          .538          .384          .538
COMODITY       .535          .535          .521          .549          .647          .647
N=18
=============================================================================================
UTILITY        .466          .422          .422          .555          .6            .511
GOLD           .433          .566          .49           .622          .716          .679
BEVERAGE       .4            .4            .4            .4            .4            .4
PIPELINE       .333          .333          .222          .333          .333          .222
FOOD           .285          .285          .285          .285          .357          .5
HOSPITAL       .285          .285          .285          .285          .285          .285
BONDFUND       .276          .285          .312          .517          .553          .473
JETS           .111          .111          .111          .222          .222          .222
N=9
=================================================================================
=================================================================================
9/28/2017
Higher Prices
Are Expected. October 2017 Looks Safe for Now.
.
The Peerless internals are still too positive to predict an October
sell-off unless the NYSE A/D Line were suddenly to turn very weak
and break its solid-looking uptrend-line. I would prefer to be
long IWM to DIA. IWM has broken out past all likely resistance-lines,
while DIA and SPY are still struggling with their rising resistance not
much overhead.
Higher prices have to be expected. The very broad-based IWM is
running in all-time high territory after a fine-looking, confirmed
flat-top
breakout. Though, biggest tech stocks probably need more
consolidation,
the NASDAQ's high AI/200 score shows there is very little likelihood of any
serious sell-off in this sector.
The biggest tech stocks probably still need to
successfully re-test
their recent lows. Watch the development of the AAPL, AMZN, ADBE
and FB charts. A positive development here has been the move by
GOOG back above its 65-dma.
Let's see if the Big Banks' ETF, FAS, can achieve a decisive breakout
like IWM has this week. Our Tiger Index of Regional Banks just did, but
on mediocre volume. Usually, big banks suffer when the Dollar turns
weak. The Dollar is at a high inflection point. It is at its falling
65-dma.
Accumulation is too high to comfortably predict a sell-off in it. I
would
expect a refusal by the Dollar to sell off in here to be bullish for the
DJI-30.
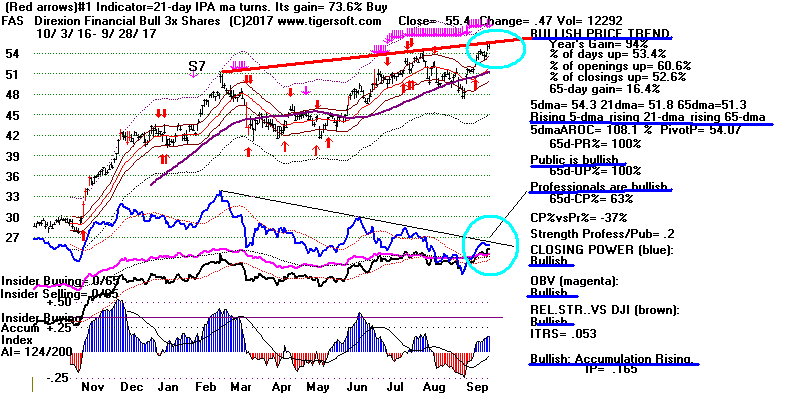
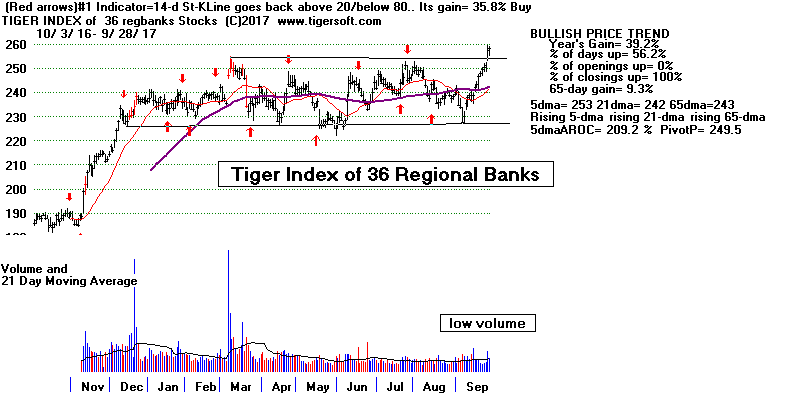
Charts 9/28/2017
PEERLESS DJI, Signals, Indicators Daily
DJI Split Volume 10-DayUp/Down
Vol
Hourly DJIA A/D
Line for All Stocks
DJIA
S&P
OEX
NYSE
NASDAQ
COMPQX
with CP
DIA
SPY
QQQ
MDY
IWM-TNA
Short Term Interest Rates
DJI-Utilities
DJI-Transp
Nifty-30 Index
CrudeOil FAS
GLD
BBH
IBB
JETS
JNUG
KOL
NUGT
OIH
OIL
RSX
RETL SDS
SLV
SOXL
TECL
TMF
TNA UGA
(gasoline)
XIV YINN
Commodities: JJC, NIB,
CORN,
WEAT UUP
(Dollar)
AAPL ADBE
ALXN
AMAT
AMGN
AMZN BA
BABA
BIDU
CAT
FB
GOOG
GS
HD
IBM JPM M
(Macy's) MASI
MSFT
NVDA QCOM
TSLA
TXN
ANDV, CMG (Chipotle), LRCX,
SWKS,
TOWN
Others REN, CVE
and SWN
9/28/2017
Bullish MINCPs
Bearish MINCPs |
COLOR CODED QUICKSILVER on KEY ETFS - 09/28/17
IWM and FAS
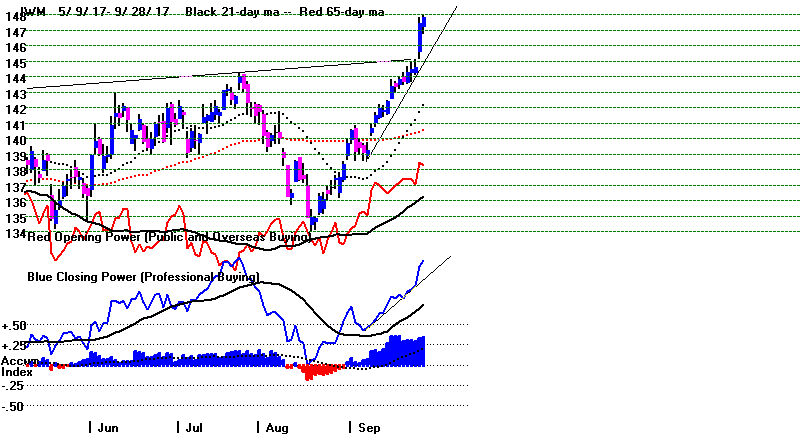
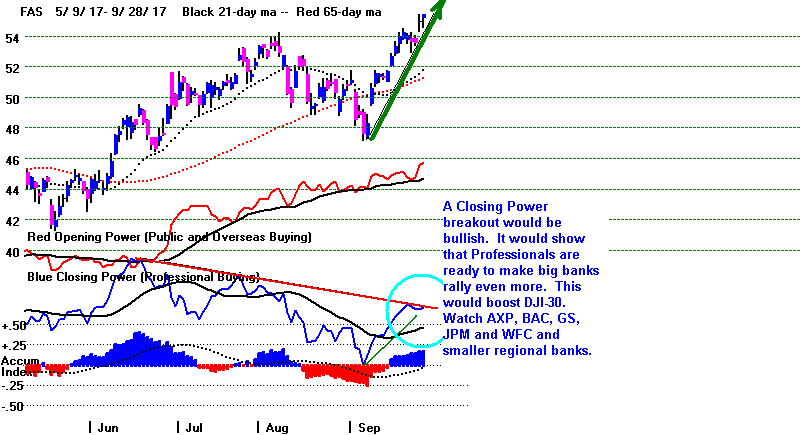
ETF      CLOSE   CHANGE     PIVOT-PT      5-dma AROC   CL-PWR   CANDLE  IP21   ITRS
---------------------------------------------------------------------------------------------
DIA       223.6    .48       223.2         2.9%        -------   BLUE .178   0
---------------------------------------------------------------------------------------------
COMPQX    6453.45    .19     6426.92       24%         -------   BLUE .271  -.023
---------------------------------------------------------------------------------------------
SPY       250.35    .3       249.44        19.2%       -------   BLUE .342  -.02
---------------------------------------------------------------------------------------------
QQQ       144.41   -.05      144.32       -1.7%        Bearish   BLUE .174  -.031
---------------------------------------------------------------------------------------------
MDY       325.96    .72      321.22        87.4%       Bullish   BLUE .355  -.028
---------------------------------------------------------------------------------------------
IWM       147.83    .39      144.3         142.8%      Bullish   BLUE .34   -.001
---------------------------------------------------------------------------------------------
FAS        55.4     .47       54.07        108.1       Bullish   BLUE .165   .165
---------------------------------------------------------------------------------------------
RETL       29.14   -.44       27.26        496.9       Bullish   RED  .165   .165
---------------------------------------------------------------------------------------------
YINN      28.17    -.67       30.3        -527.7%      Bearish   BLUE .104   .048
---------------------------------------------------------------------------------------------
SOXL      112.42    2.47     109.29        219.2%      -------   BLUE .204   .083
---------------------------------------------------------------------------------------------
TECL      87.87    .49       87.26         48.2%       Bearish   BLUE .165   .031
---------------------------------------------------------------------------------------------
IBB       5050.79  69.1    5003.55        105.7%       -------   BLUE-.025  -.017
---------------------------------------------------------------------------------------------
GLD       122.6    .58       119.46        142.2%      -------   BLUE .092   .031
---------------------------------------------------------------------------------------------
OIL       5.39    -.08        5.28          92.7%      Bullish   RED  .16   .062
---------------------------------------------------------------------------------------------
OIH       26.04    .07       25.21         215.3%      Bullish   ---- .365  -.041
---------------------------------------------------------------------------------------------
GASL      23.3   -.59        21.4          490.8%      -------   RED    .29   .035
---------------------------------------------------------------------------------------------
UGA       28.81    .06       28.95         30.9%       Bullish   RED  .331   .084
---------------------------------------------------------------------------------------------
UUP       24.2   -.07        23.93         51.9%       Bullish   ---- .17  -.048
---------------------------------------------------------------------------------------------
IEF       106.65   -.02      106.99         -7%        Bearish   BLUE-.02  -.036
---------------------------------------------------------------------------------------------
CORN      17.48   -.08       17.48         31.5%       Bullish   -----.046  -.128
---------------------------------------------------------------------------------------------
WEAT      6.67   -.07        6.61          22.5%       -------   ---- .019  -.159
Bullish = IWM,
MDY and OIH
Blue Closing bullishly still above 5-dma pivot
point.
Red closing is bearishly still below 5-dma pivot point.
Blue candle-stick color shows close is bullishly above opening.
Red candle-stick color shows close is bearishly < opening.
QuickSilver
considers an IP21>.15 and above its 21-dma to be bullish.
An IP21<-.15 and below its 21-dma is bearish.
Blue 5dma AROC is still rising.
Red 5dma AROC is bearishly falling.
|
DAILY TIGER SCAN NUMBERS
9/28
9/27
9/26 9/25 9/22 9/21
9/20 9/19 9/18NEWHIGHS
407 441 235
221 304 208 347
408 406
NEWLOWS 25 23 20
20 31 33
38 39 29
--------------------------------------------------------------------------------------------------------------
MAXCPs 228 197 125 153 148
111 138 146 159
MINCPs
51 63
70 59
63 76 73
75 51
--------------------------------------------------------------------------------------------------------------
TTTNHs 106
120 114
98 92 70
78 85 86
TTTNLs
62
108 134
139 103 129
128 95
80
MAXCPs are Closing
Power new highs. MINCPs are Closing Power new lows for any
given day.
TTTNHs are Tiger Day Traders' Tool new highs. After opening, more
upside potential than downside risk.
TTTNLs are Tiger Day Traders' Tool new lows. After opening, more
downside potential than upside risk. |
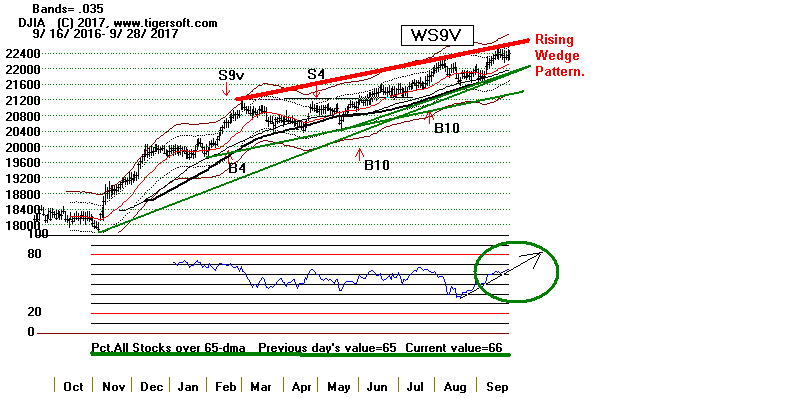
 RANKING OF KEY DIRECTORIES BASED PCT.OF STOCKS ABOVE 65-DMA
              9/28/17
Bullish = 37
Bearish = 8
---------------------------------------------------------------------------------------
Directory     Current       day-1         day-2         day-3         day-4         day-5
----------------------------------------------------------------------------------------
BIGBANKS       100%          1             1             1             1             1
BIGMIL         100%          1             1             1             1             1
REGBANKS       .916          .916          .861          .861          .861          .805
AUTO           .875          .85           .85           .825          .8            .75
FINANCE        .869          .847          .815          .815          .826          .771
GREEN          .838          .838          .741          .741          .774          .709
MILITARY       .8            .777          .755          .711          .733          .688
SP-100         .781          .77           .76           .75           .729          .739
CHEM           .763          .763          .722          .75           .736          .694
OILGAS         .753          .759          .746          .734          .658          .645
INDEXES        .741          .732          .755          .769          .746          .751
ELECTRON       .726          .716          .67           .654          .701          .68
HOMEBLDG       .722          .666          .666          .555          .611          .611
SEMI           .715          .715          .646          .637          .706          .681
INDMATER       .704          .734          .724          .724          .744          .734
DOWJONES       .7            .666          .733          .666          .733          .7
GAMING         .7            .733          .533          .566          .7            .7
NIFTY          .7            .666          .6            .666          .733          .833
TRANSP         .7            .7            .65           .65           .65           .7
MORNSTAR       .693          .693          .676          .68           .676          .668
SOLAR          .684          .736          .578          .578          .789          .736
ETFS           .666          .696          .742          .772          .833          .848
N=21
=============================================================================================
INSURANC       .657          .571          .542          .514          .514          .457
RUS-1000       .651          .639          .631          .628          .608          .617
SP500          .646          .64           .628          .622          .591          .618
BIOTECH        .641          .637          .622          .633          .61           .598
EDU            .625          .625          .625          .5            .5            .5
CHINA          .619          .666          .65           .619          .65           .682
NASD-100       .602          .625          .534          .556          .59           .59
COMPUTER       .6            .72           .48           .44           .52           .52
SOFTWARE       .593          .625          .5            .5            .609          .562
RETAIL         .586          .586          .551          .534          .5            .465
REIT           .58           .569          .626          .575          .502          .518
HACKERS        .56           .68           .56           .52           .6            .6
GOLD           .547          .49           .641          .735          .66           .584
INFRA          .545          .545          .545          .545          .636          .545
DJI-13         .538          .461          .538          .384          .538          .538
COMODITY       .528          .514          .542          .642          .642          .671
N=16
==============================================================================================
==============================================================================================
COAL           .444          .444          .444          .444          .444          .444
UTILITY        .422          .422          .555          .6            .511          .644
BEVERAGE       .4            .4            .4            .4            .4            .4
PIPELINE       .333          .333          .333          .333          .222          .111
BONDFUND       .285          .312          .517          .553          .473          .383
FOOD           .285          .285          .285          .357          .5            .571
HOSPITAL       .285          .285          .285          .285          .285          .285
JETS           .111          .111          .222          .222          .222          .222
N=8
=================================================================================
=================================================================================
