(C) 2017 William Schmidt, Ph.D.
www.tigersoft.com
william_schmidt@hotmail.com

 RANKING OF KEY DIRECTORIES BASED PCT.OF STOCKS ABOVE 65-DMA
              2/15/17
---------------------------------------------------------------------------------------
Directory     Current       day-1         day-2         day-3         day-4         day-5
----------------------------------------------------------------------------------------
HOSPITAL       1             .857          .857          .857          .857          .571
ETFS           .955          .955          .97           .97           .97           .97
GOLD           .924          .924          .962          .943          .924          .943
MORNSTAR       .907          .886          .878          .878          .857          .819
PIPELINE       .888          .888          .888          .888          .888          .888
BIGBANKS       .857          .857          .857          .714          .714          .714
FINANCE        .838          .849          .817          .795          .774          .698
NIFTY          .828          .828          .771          .8            .771          .685
NASD-100       .817          .763          .741          .741          .741          .709
COMPUTER       .8            .84           .76           .72           .72           .64
FOOD           .8            .8            .8            .8            .8            .8
N= 11

HACKERS        .777          .833          .777          .722          .777          .777
SP500          .775          .76           .746          .738          .702          .65
SP-100         .773          .762          .752          .752          .701          .69
RUS-1000       .768          .763          .755          .747          .713          .67
DOWJONES       .766          .766          .766          .766          .7            .766
SEMI           .766          .733          .733          .733          .708          .708
UTILITY        .755          .777          .844          .844          .777          .8
INDEXES        .752          .764          .76           .768          .756          .722
BEVERAGE       .75           .65           .65           .7            .65           .65
SOFTWARE       .75           .75           .703          .734          .718          .625
TRANSP         .75           .7            .7            .65           .6            .5
COMODITY       .746          .774          .732          .774          .774          .774
INDMATER       .74           .72           .78           .75           .71           .63
SOLAR          .736          .736          .736          .736          .473          .473
INFRA          .727          .818          .818          .818          .727          .545
REGBANKS       .722          .75           .722          .583          .527          .361
INSURANC       .71           .789          .763          .736          .736          .631
ELECTRON       .706          .68           .685          .68           .664          .639
GAMING         .7            .666          .666          .633          .6            .566
MILITARY       .688          .711          .733          .688          .644          .644
REIT           .677          .713          .786          .786          .718          .651
N=32
CHINA          .676          .692          .738          .723          .676          .615
JETS           .666          .666          .666          .666          .666          .555
BIOTECH        .649          .591          .556          .56           .548          .478
CHEM           .619          .563          .591          .577          .521          .507
HOMEBLDG       .611          .611          .722          .666          .666          .722
AUTO           .6            .625          .575          .575          .55           .5
BONDFUND       .567          .738          .855          .936          .918          .927
COAL           .555          .555          .444          .555          .555          .444
GREEN          .548          .451          .548          .516          .483          .451
OILGAS         .512          .581          .543          .575          .525          .456
EDU            .5            .5            .625          .5            .625          .5
RETAIL         .428          .428          .357          .41           .339          .285
==========================================================================================================
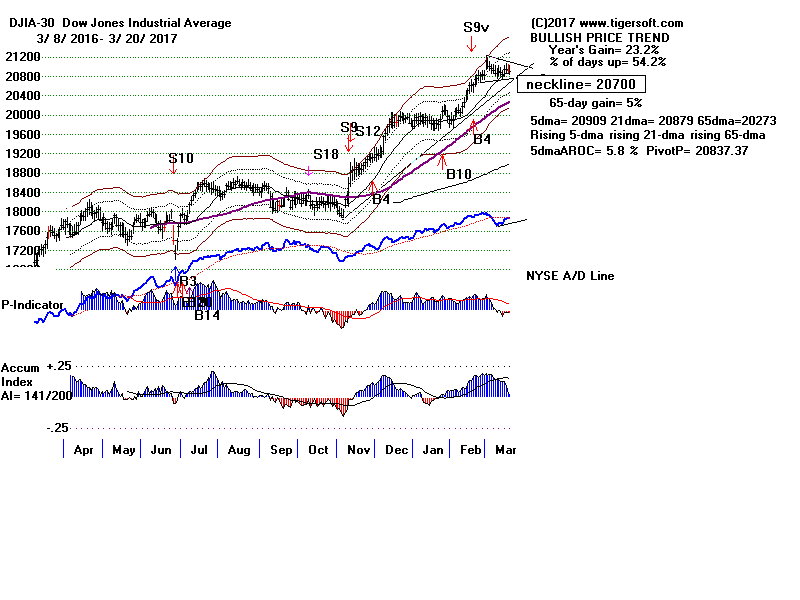
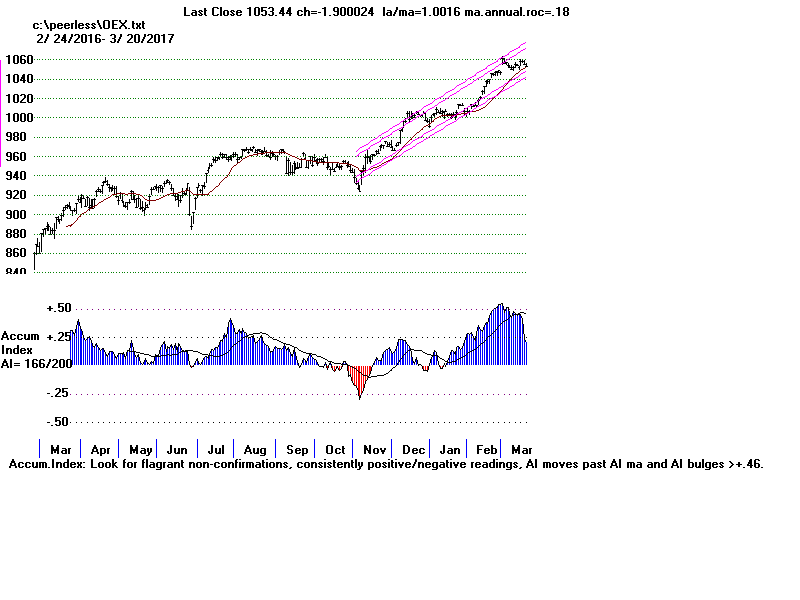
2-14-2017 I consider Peerless to continue
to be on a Buy.
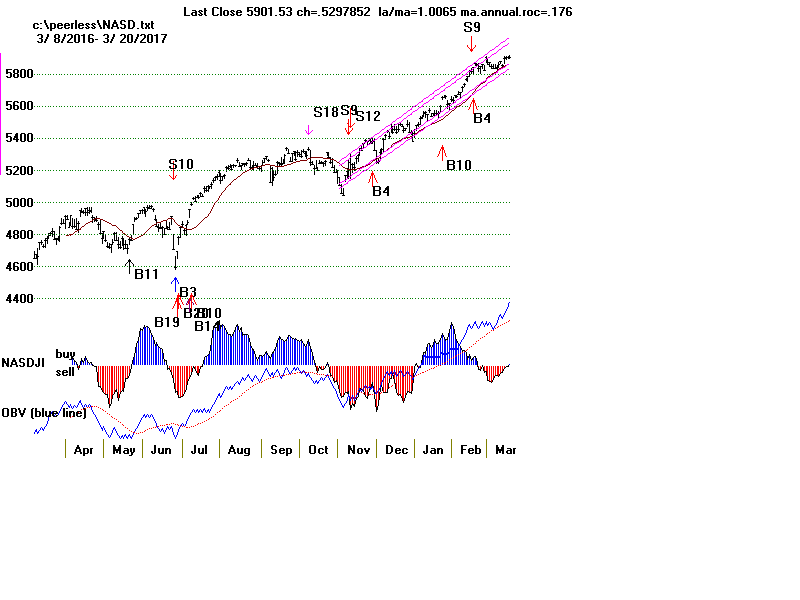
The breakouts by NASDAQ and the QQQ above their price channels into all-time
high territory
are quite bullish. And the nice thing now is that there are many traders
who cannot believe what
they are seeing and are not fully
invested because of their dislike of Trump. If I am right, they will
only gradually capitulate as the market moves higher.
NO SELL-S9V despite Peerless V-I Being -4 Today.
Please note that a new version of Peerless will be posted on the ESP Page
tomorrow.
.
Today the DJI did close over 17500. This was 2.4% over the 21-day ma.
Since the V-I Indicator was
a -8, earlier versions of the Peerless software have produced a Sell S9-V.
But I do not trust this Sell S9-V
for all the reasons I have been recently mentioning.
So, today I have changed the
software so that no S9-V can occur in February, March or early April with the
present key
values, especially with a negative V-I, until the DJI closes at least 3.4% over the 21-day ma.
Since it seems likely that another 1% advance higher from here would turn the
V-Indicator positive, we should
not expect a Sell signal for now. All this is in
keeping with what I have said
about respecting the strength of a bull
market where the DJI is running in
all-time high territory and the
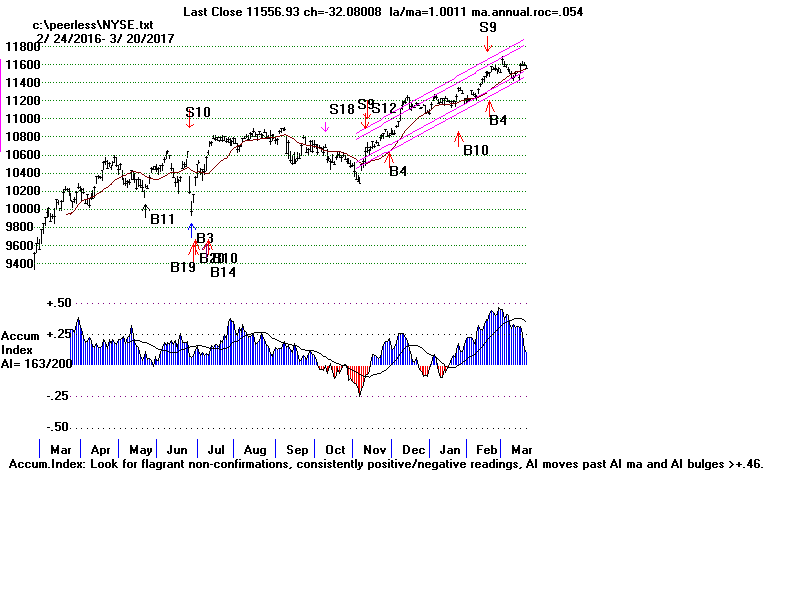
NYSE A/D Line is in an uptrend. In addition,
I want to underscore that bull markets
like the one we are seeing
now usually produce tops only when the
P-Indicator
or Accum. Index (IP21) become negative, or nearly so,
and the NYSE A/D Line
is clearly lagging.
Thirdly, Bull market advances that start in November tend not to run out
of steam until late April at the earliest.
Beyond this, I have frequently called attention to the importance of big tax
cuts, de-Regulation and Infrastructure
Government spending and suggested we look back at how well the stock market did
in 1925-8 and 1954-1957.
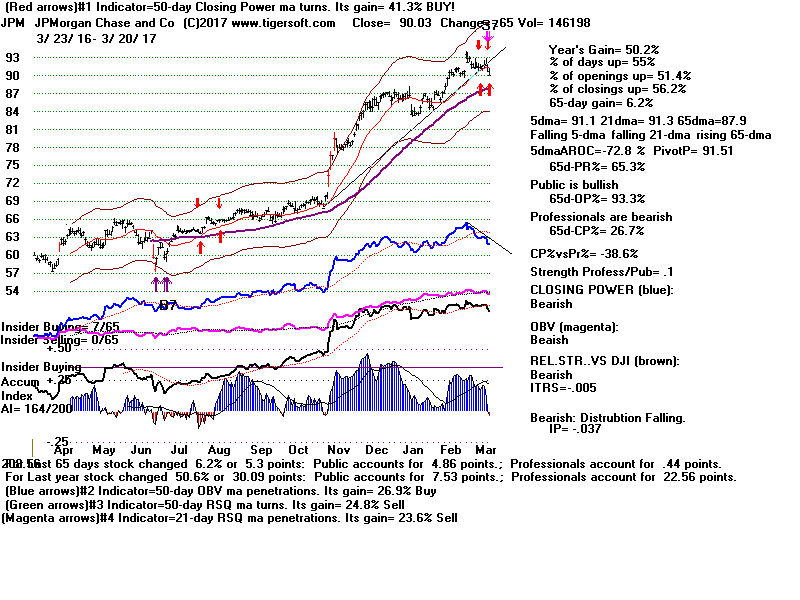
Today's DJI strength owed to big gains being made by the biggest Banks in the
DJIA,
namely JPM (+1.41) and GS (+3.19) and more nice gains by high priced AAPL (+1.73),
HD (+1.49) and UNH +1.14), . The larger market was not so strong, though the DJI impressively
reversed an early 20 point loss and closed at its highs. There were only
150 more stocks up than
down on the NYSE. We will probably need to see the broader market
participation to keep
the bull market going. The good news is that these stocks are making or
very close to making
all-time highs. As they breakout, they could stay in powerful uptrends
many months.
The 5-year charts show the bases these stocks and MMM are emerging from.
TO REGULARLY UPDATED INDEX and ETF CHARTS
2/14/17: PEERLESS DJI, Signals, Indicators
DJI-13 Hourly DJIA
S&P OEX NYSE NASDAQ COMPQX with Closing Power
DIA SPY QQQ MDY IWM
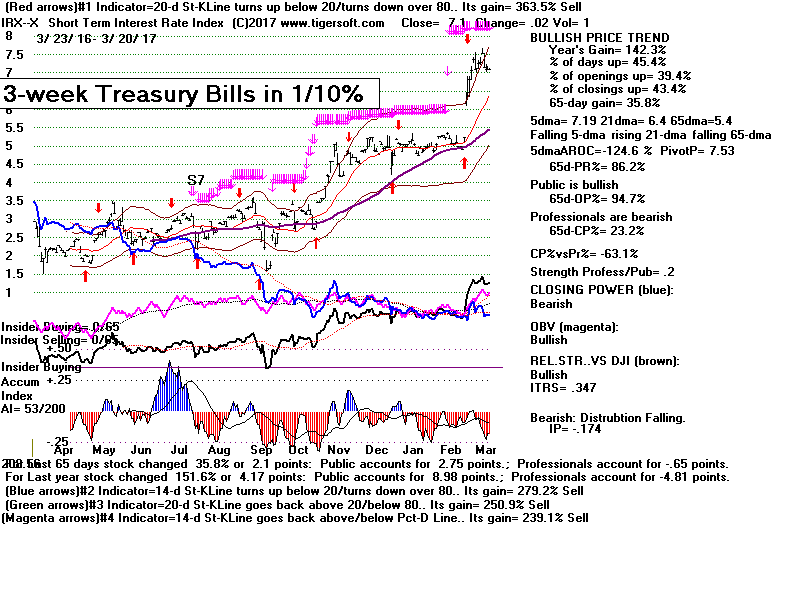
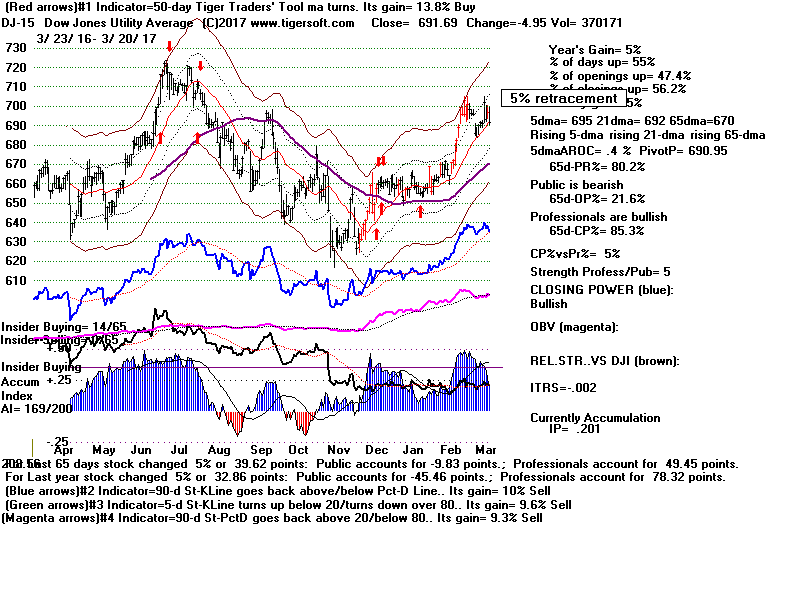
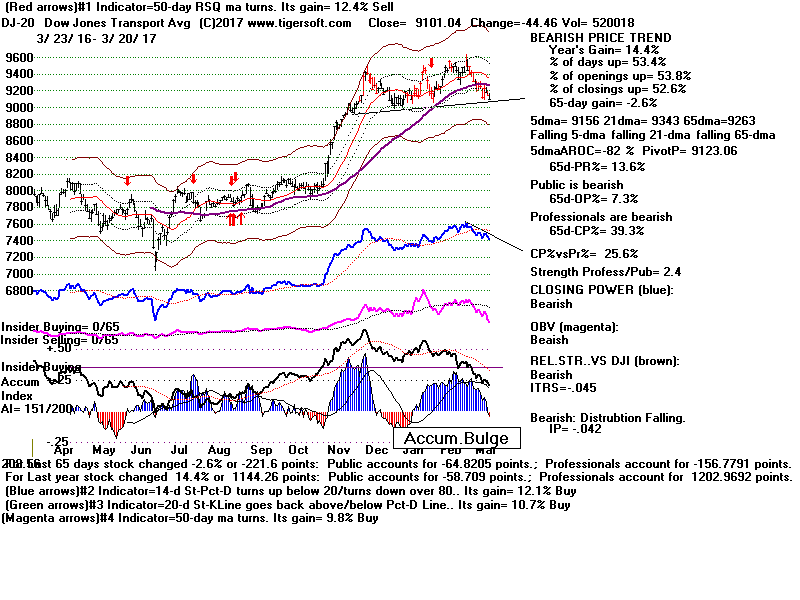
Short Term Interest Rates DJI-Utilities DJI-Transp A/D Line-6000 Stocks
CrudeOil FAS GASL GLD BBH BRZU IBB JETS
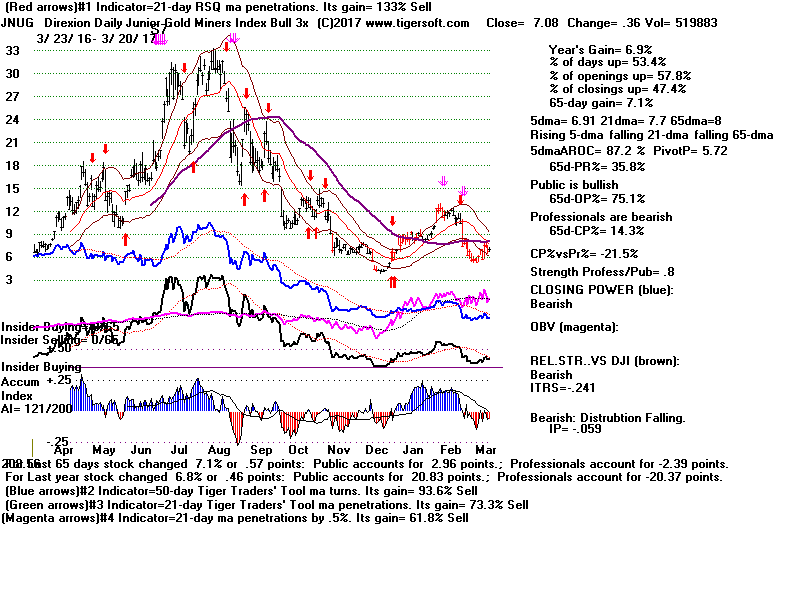
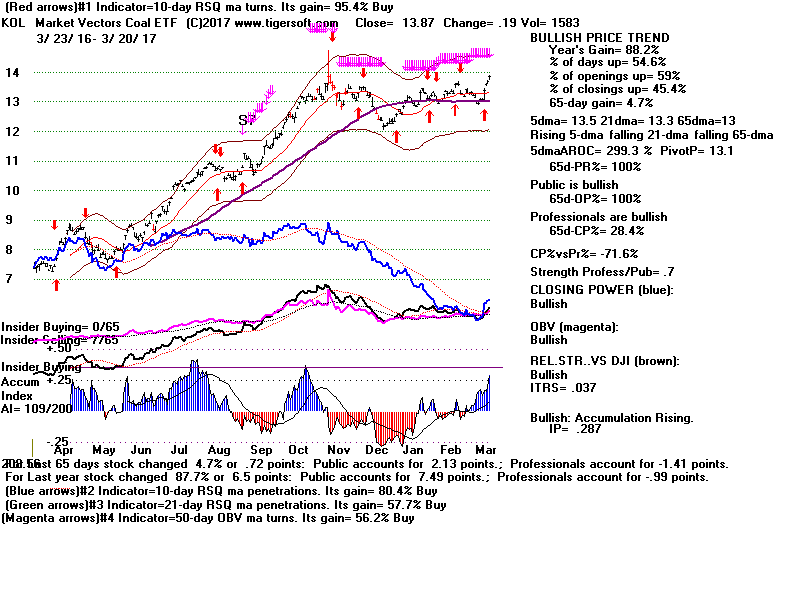
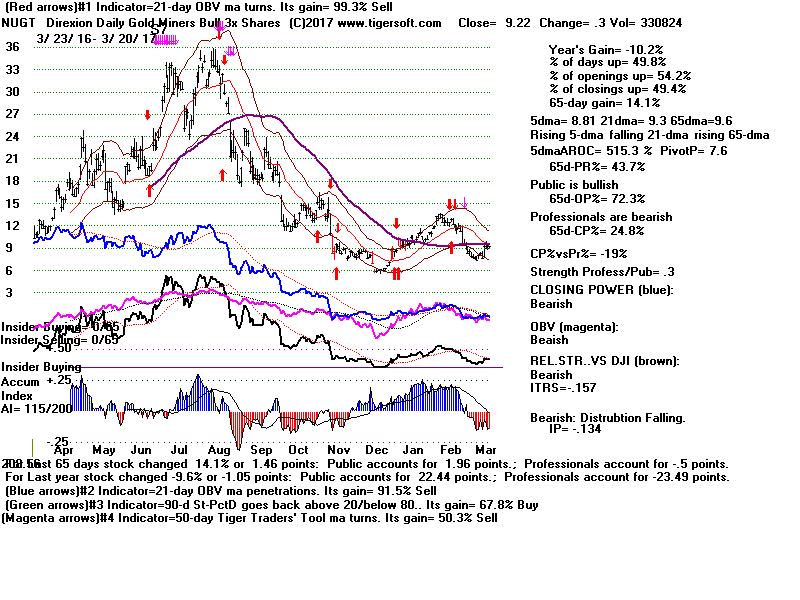
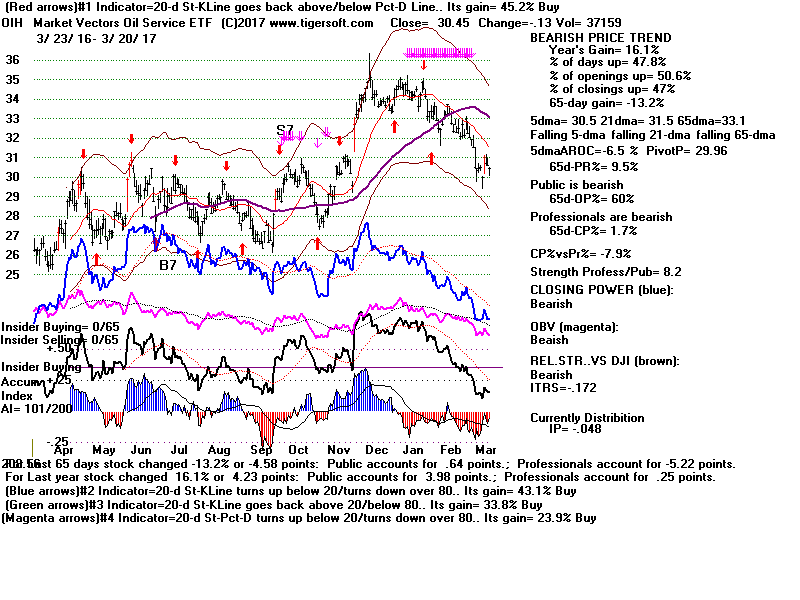
JNUG KOL NUGT OIH OIL
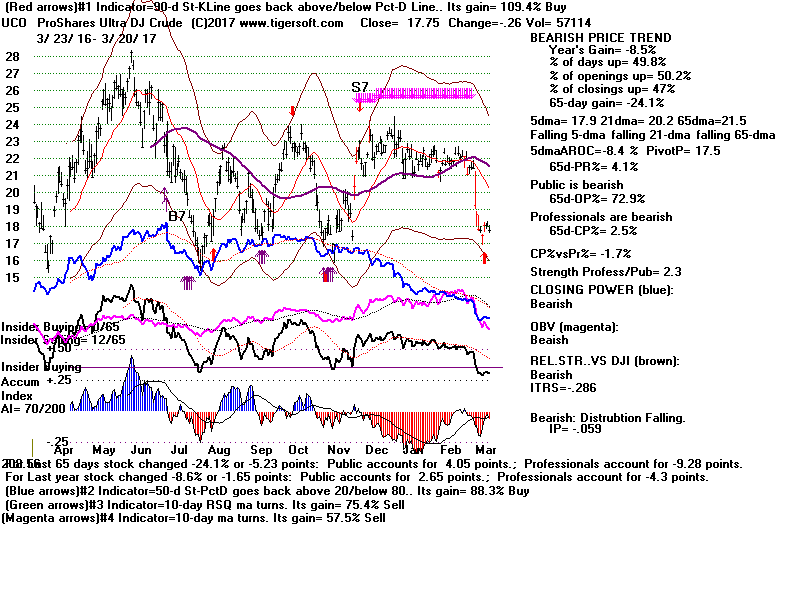
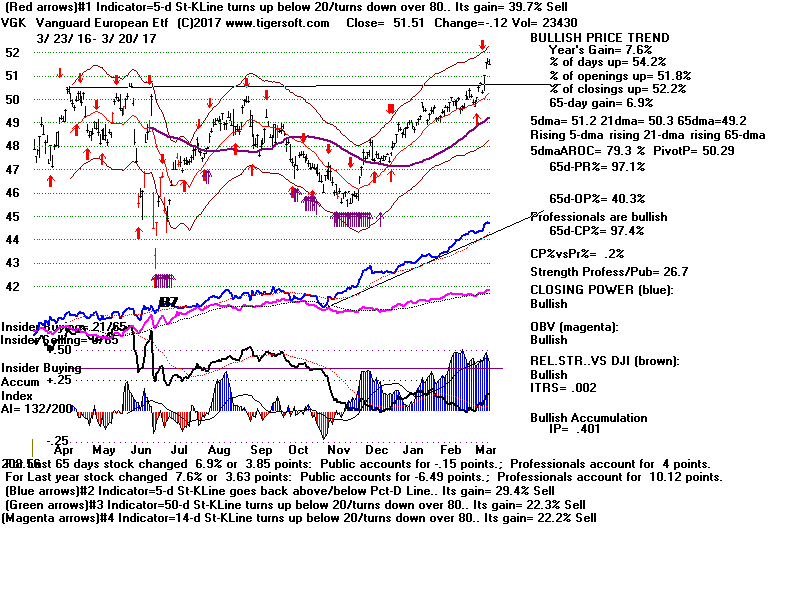
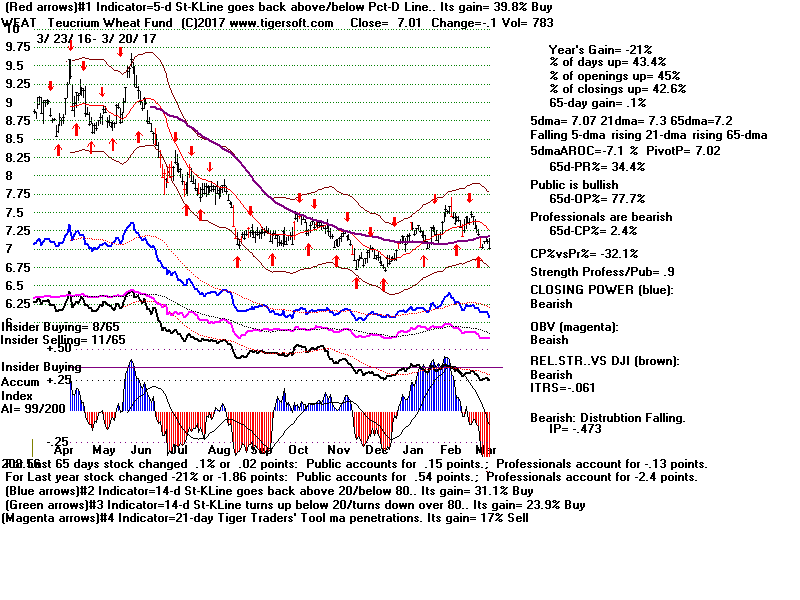
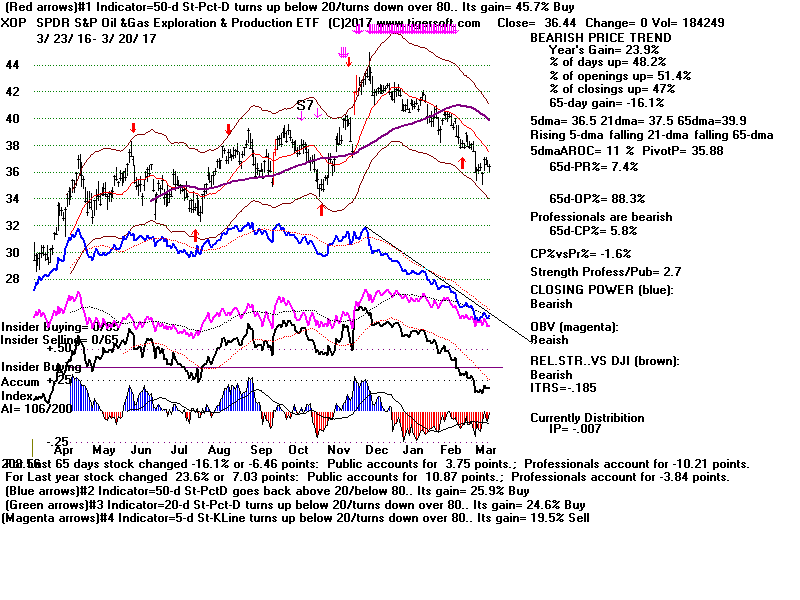
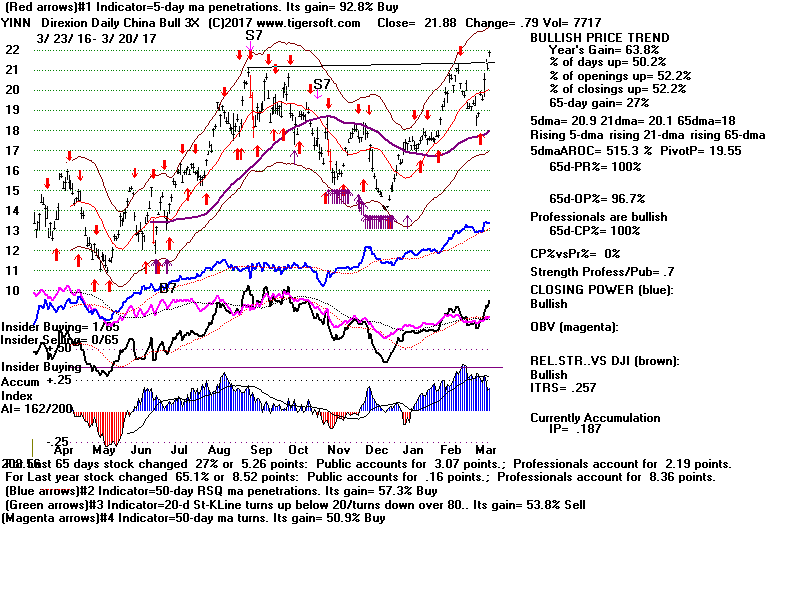
RSX RETL SLV SOXL TECL TMF TNA UCO VGK WEAT XOP YINN
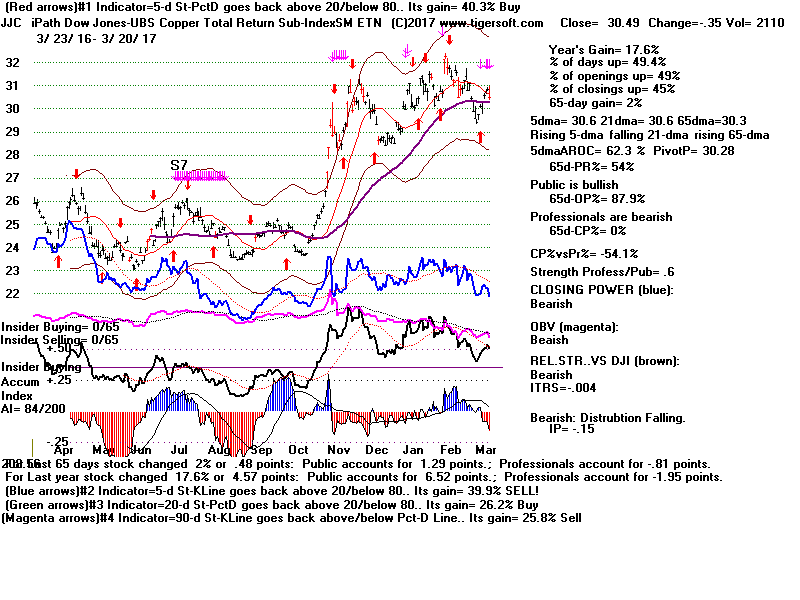
JJC - Copper
-----------------------
TO REGULARLY UPDATED STOCK CHARTS --------------------------------
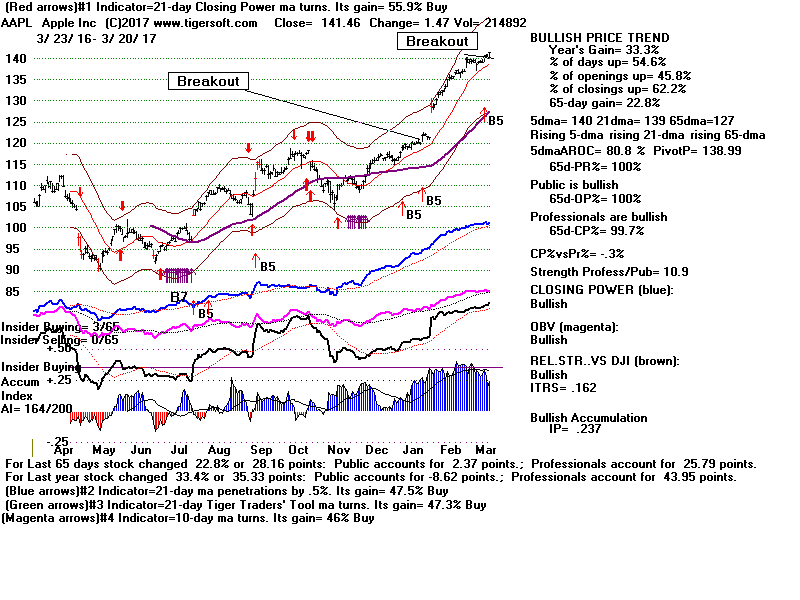
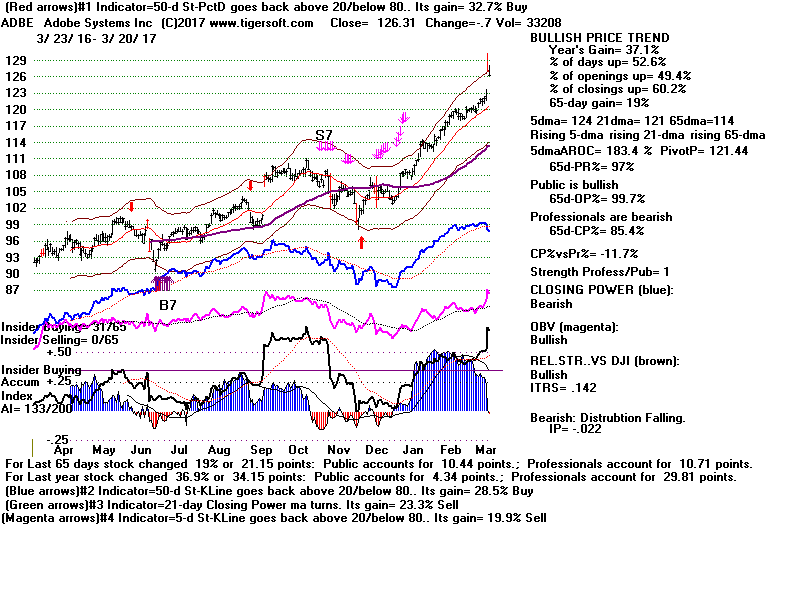
AAPL ADBE
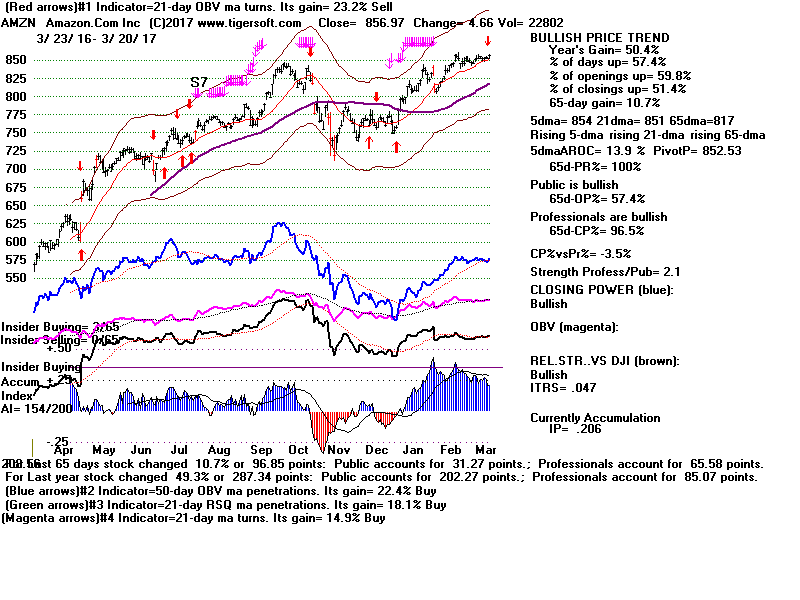
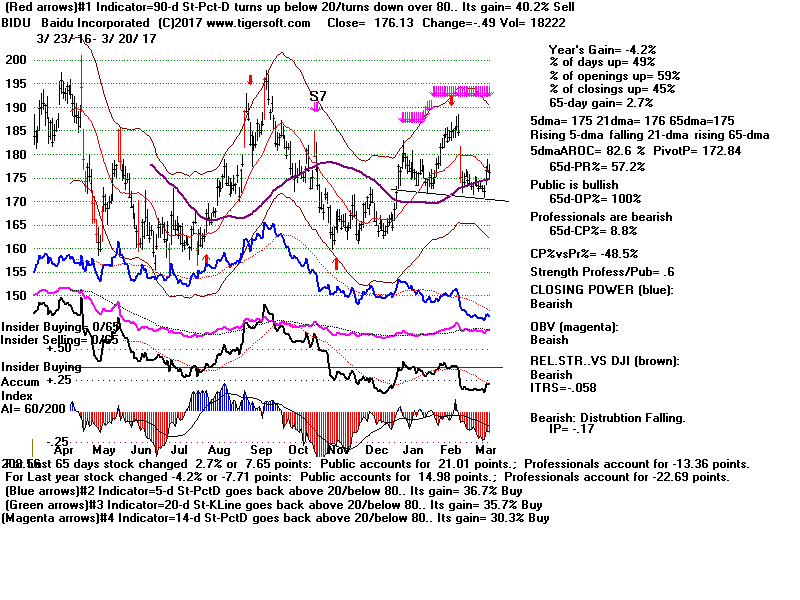
AMZN BIDU
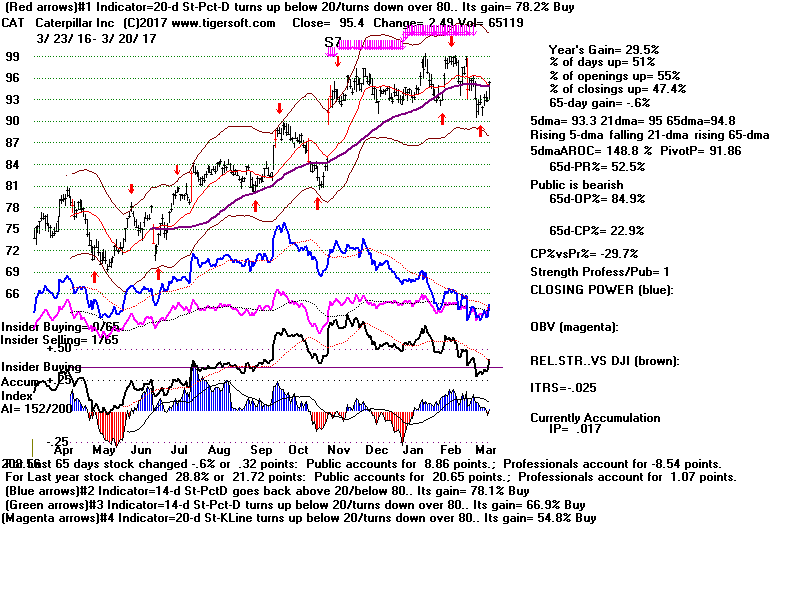
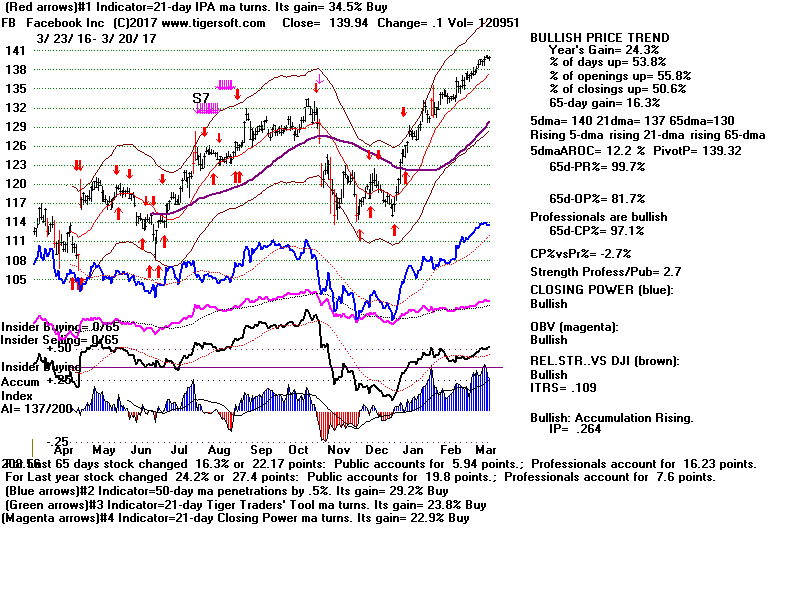
CAT FB
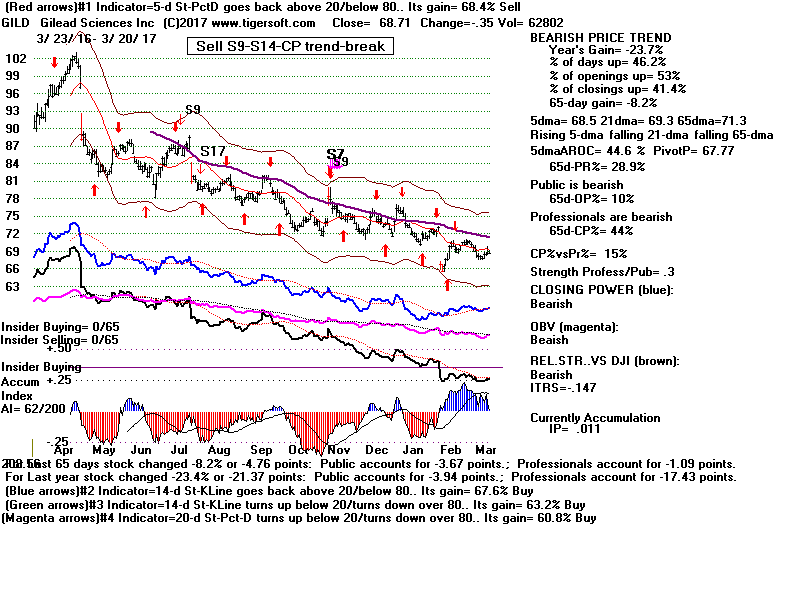
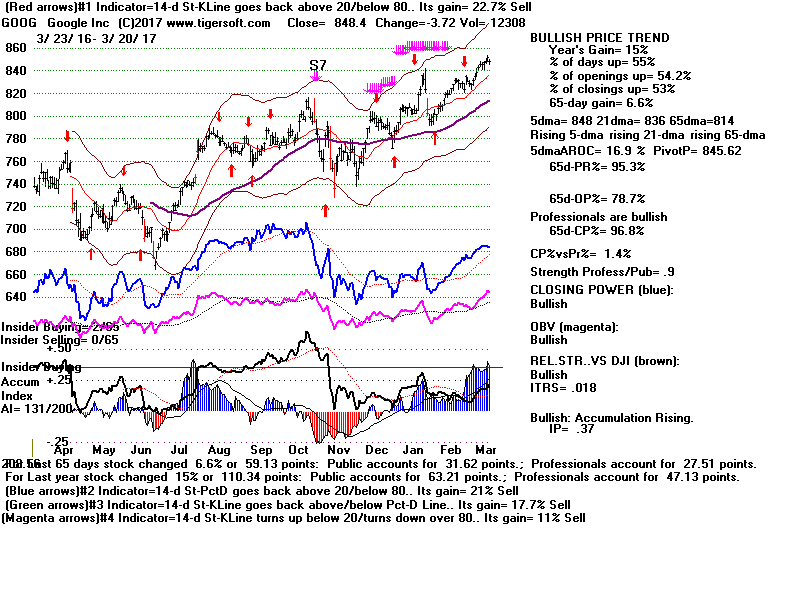
GILD GOOG
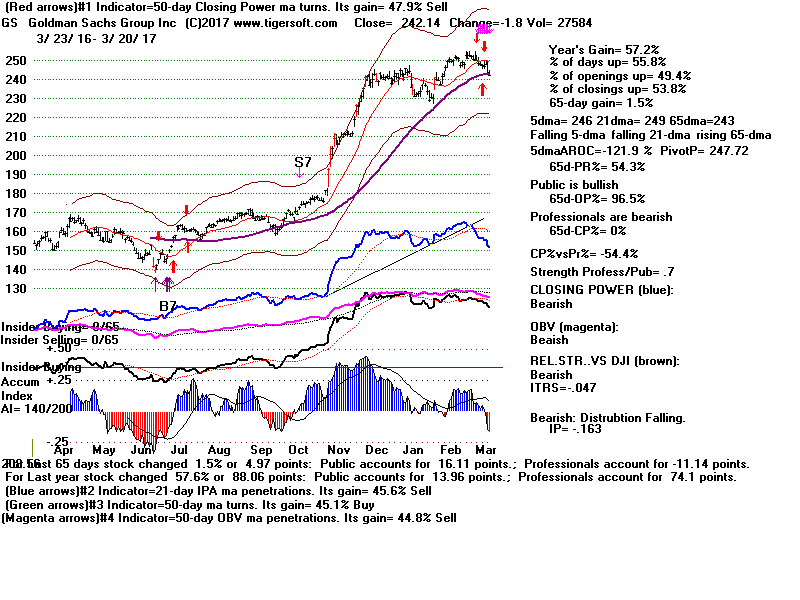
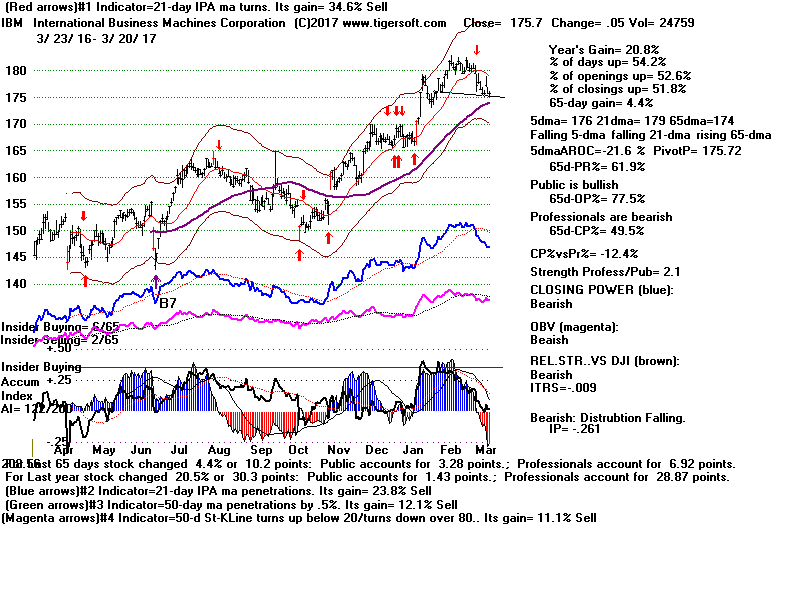
GS IBM
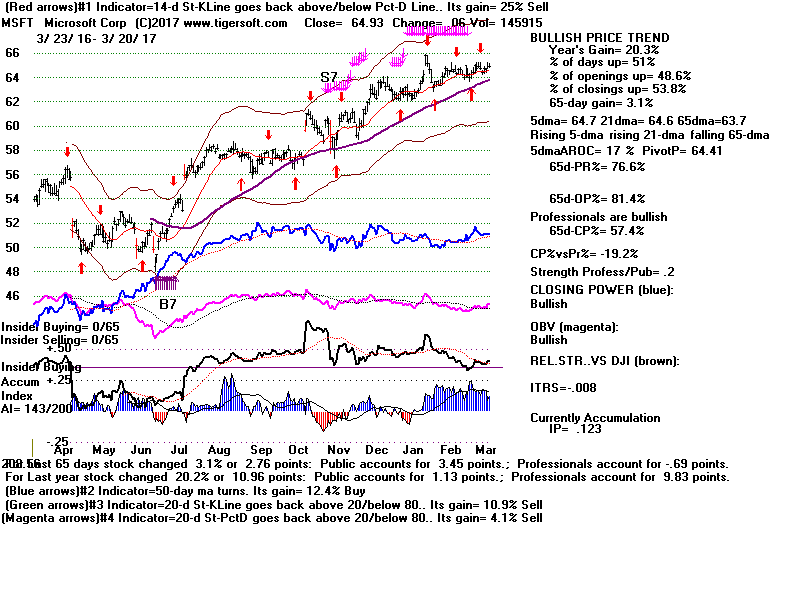
JPM MSFT
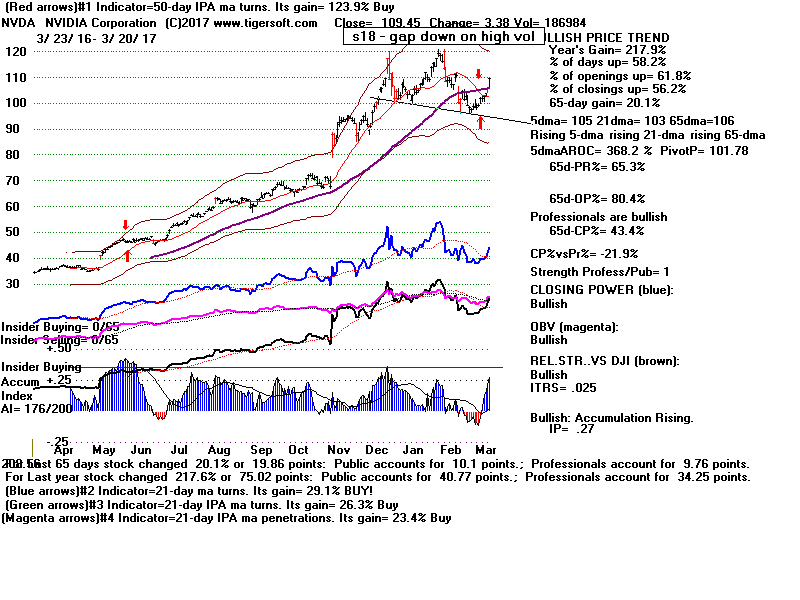
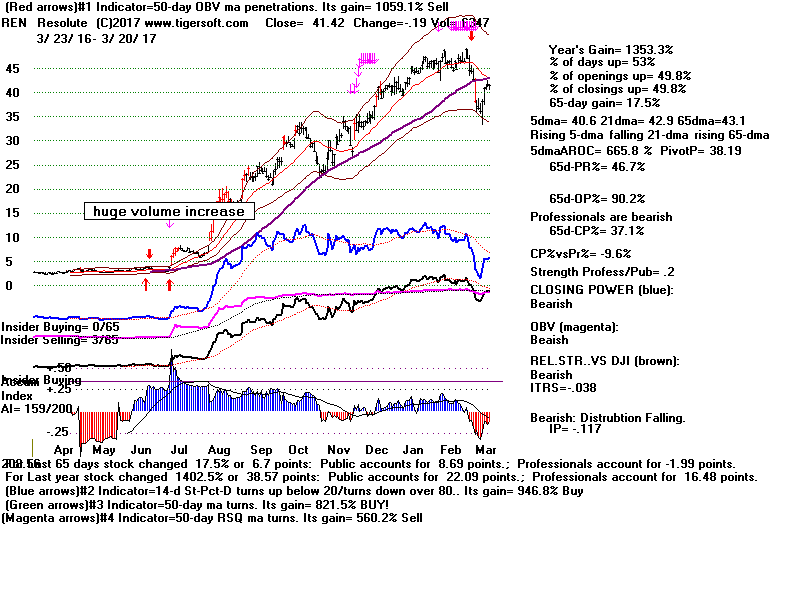
NVDA REN
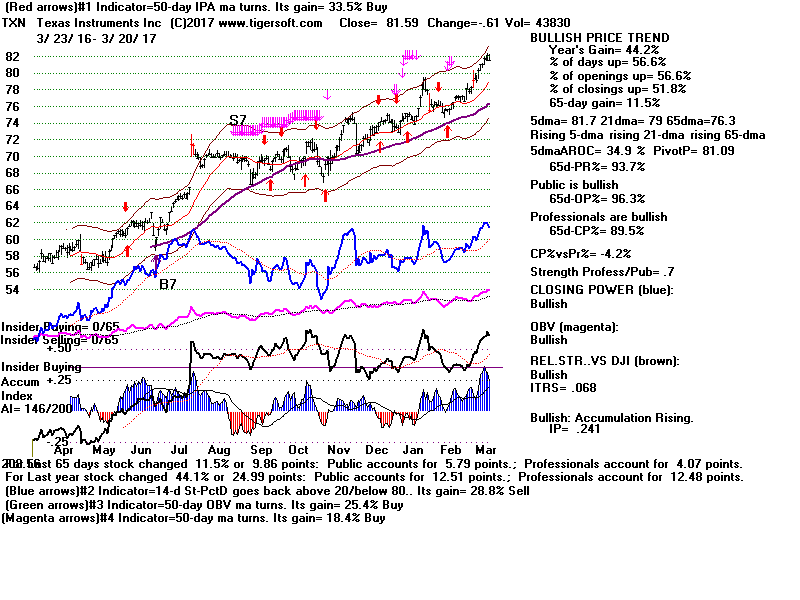
TXN
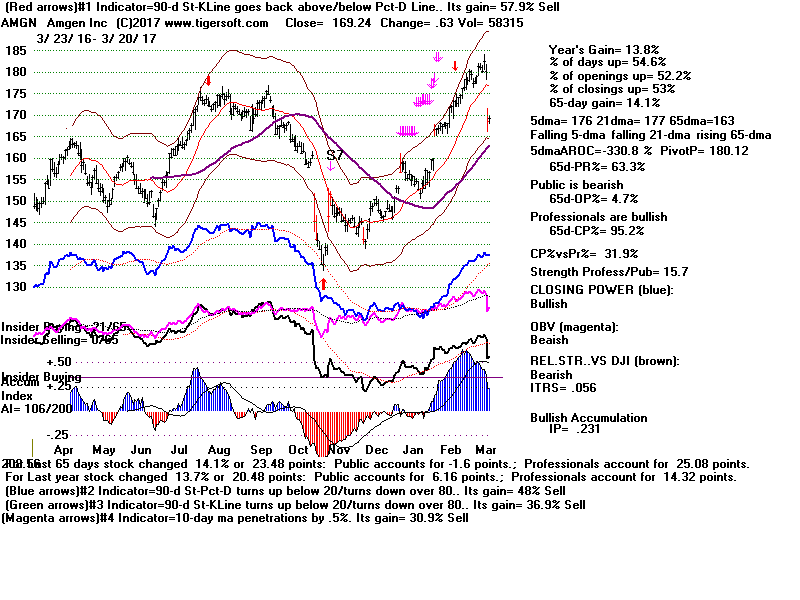
Biotechs AMGN
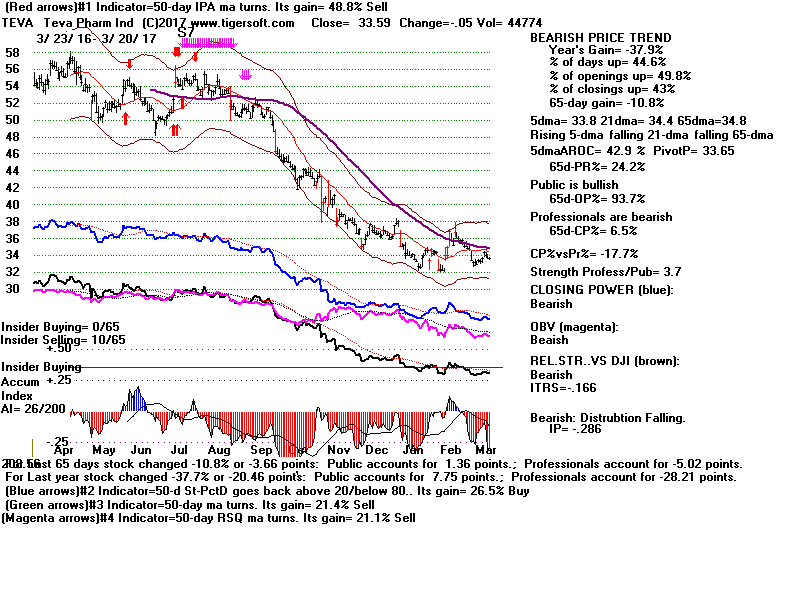
GILD TEVA
2/14/17:
BULLISH MAXCPs BEARISH MINCPS
 RANKING OF KEY DIRECTORIES BASED PCT.OF STOCKS ABOVE 65-DMA
              2/14/17
---------------------------------------------------------------------------------------
Directory     Current       day-1         day-2         day-3         day-4         day-5
----------------------------------------------------------------------------------------
NON-US ETFS    .955          .97           .97           .97           .97           .941
GOLD           .924          .943          .962          .924          .943          .943
PIPELINE       .888          .888          .888          .888          .888          .888
MORNSTAR       .886          .878          .878          .857          .84           .802
BIGBANKS       .857          .857          .714          .714          .714          .714
HOSPITAL       .857          .857          .857          .857          .571          .571
FINANCE        .849          .817          .795          .774          .72           .774
COMPUTER       .84           .76           .72           .72           .64           .72
HACKERS        .833          .777          .722          .777          .777          .777
NIFTY          .828          .771          .8            .771          .685          .657
INFRA          .818          .818          .818          .727          .545          .545
FOOD           .8            .8            .8            .8            .8            .8
N=12

INSURANC       .789          .763          .736          .736          .657          .657
UTILITY        .777          .844          .844          .777          .8            .711
COMODITY       .774          .732          .774          .774          .788          .732
DOWJONES       .766          .766          .766          .7            .766          .766
INDEXES        .764          .76           .768          .756          .722          .714
NASD-100       .763          .741          .741          .741          .709          .709
RUS-1000       .763          .755          .747          .713          .677          .663
SP-100         .762          .752          .752          .701          .711          .69
SP500          .76           .746          .738          .702          .659          .646
REGBANKS       .75           .722          .583          .527          .388          .444
SOFTWARE       .75           .703          .734          .718          .625          .671
BONDFUND       .738          .855          .936          .918          .927          .927
SOLAR          .736          .736          .736          .473          .473          .526
SEMI           .733          .733          .733          .708          .708          .75
INDMATER       .72           .78           .75           .71           .64           .67
REIT           .713          .786          .786          .718          .682          .625
MILITARY       .711          .733          .688          .644          .644          .644
TRANSP         .7            .7            .65           .6            .5            .5
CHINA          .692          .738          .723          .676          .615          .584
ELECTRON       .68           .685          .68           .664          .654          .685
N=32
GAMING         .666          .666          .633          .6            .566          .566
JETS           .666          .666          .666          .666          .555          .444
BEVERAGE       .65           .65           .7            .65           .65           .55
AUTO           .625          .575          .575          .55           .525          .55
HOMEBLDG       .611          .722          .666          .666          .722          .722
BIOTECH        .591          .556          .564          .548          .494          .517
OILGAS         .581          .543          .575          .525          .468          .487
CHEM           .563          .591          .577          .521          .507          .507
COAL           .555          .444          .555          .555          .444          .444
EDU            .5            .625          .5            .625          .625          .625
GREEN          .451          .548          .516          .483          .483          .451
RETAIL         .428          .357          .41           .339          .285          .214
==========================================================================================================
2-13-2017 Peerless remains on a
Buy. DIA, SPY, QQQ, FAS, TECL and the NASDAQ are
all making all-time highs where sellers cannot easily bunch their orders. Bullishly, the Opening and
Closing Powers are rising for all these ETFs and the NASDAQ. They should be held
long.
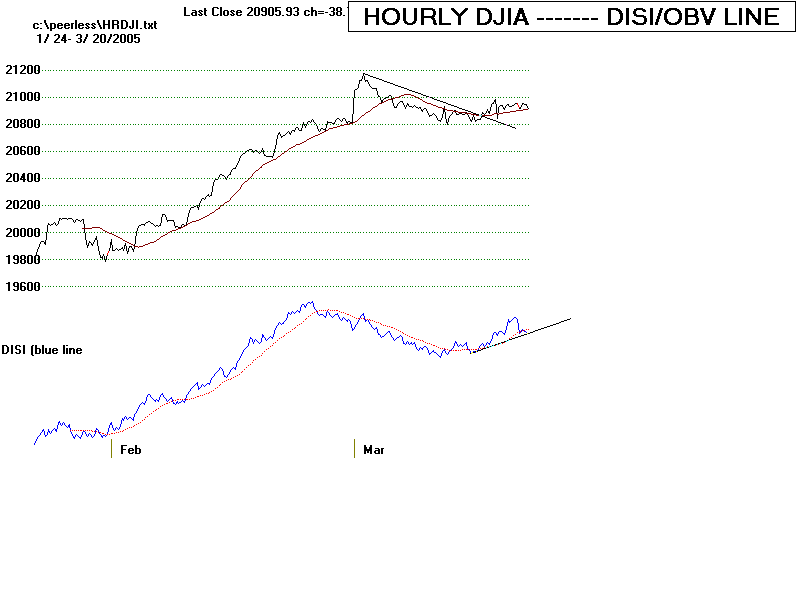
Beyond this, the NYSE A/D Line and Hourly DJI's OBV-DISI Line keeps making new
highs.
There is no head/shoulders top. I think that we should expect much
higher prices if volume expands
and smaller Russell-2000 stocks join the bull market. Usually
strength like we have seen since November
continues until late April or May. It's possible Janet Yellen could spoil
the party if she tells Congress this week
that interest rates will soon rise. But the market is going up because of
de-Regulation and fiscal stimulation
(prospective tax cuts and an expanded Public Works program. I doubt if
anything will de-rail these bullish forces.
In the news now is the story of the potential catastrophic dam failure at
Oroville, California. It is possible that
we are just one or two big Sierra Nevada Mountain Storms away from disaster.
Already 200,000 residents
in the water-shadow of the dam have had to evacuate. Spending money 15
years ago to strengthen the dam's
spill-ways might have prevented this impending catastrophe. This makes the
case forcefully once again for
a massive Public Works spending program. This fiscal stimulus would be
bullish for many stocks.
(See NY Times article tonight:
In Peril at Oroville Dam, a Parable on
Infrastructure. )
It's not likely that Democrats will want to bring charges of violating the 1799
(no mistake here about the
year) Logan Act against Trump as well as Flynn (who just resigned for talking to
Russian officials as a private citizen),
but they are in the minority in Congress. Even when the Dems were in the
majority in 1968, they
did nothing when Nixon's aids just before the Presidential Election talked to
South Vietnam's diplomats
who were negotiating a cease fire with North Vietnam.
(Source:
http://www.smithsonianmag.com/smart-news/notes-indicate-nixon-interfered-1968-peace-talks-180961627/
and
https://en.wikipedia.org/wiki/Logan_Act )
A Pause Now Would Be Constructive.
It would probably be a good thing if the DJI went sidewise
tomorrow. The numbers we are dropping off
21-days ago are negative ones. Sidewise action would allow the V-I and OBV-Pct
to rise. On the other
hand, another day's rally like today could easily give a Sell S9-V. If
NYSE Up Volume does not rise sharply
tomorrow above today's modest levels and if the DJI closes above
20500,
expect Peerless to give a Sell S9V.
This would be based on negative V-I readings with the DJI 2.4% over the 21-day
ma.
There are a few cases of February Sell S9-V signals with the DJI near its highs.
It may be instructive
look at them here. Each led to significant breaks in the market and declines
below the lower band.
But only in 2001 case did the decline start immediately after the Sell S9-V.
In this last case, the DJI
was struggling to hold up while the NASDAQ was collapsing in the wake of the
Internet/Tech Bubble Break
Environment Date of Sell S9-V
LA/MA PI IP-21
V-I OBVPct Outcome
(DJI close/
21-dma)
-----------------------------------------------------------------------------------------------------------------------------------
Bear Market 2/27/1970
1.03 +61
+.023 -1
-.007 DJI did not top out for four weeks.
Bull Market 2/12/1997
1.025 +59
+.103 -6
.021 DJI did not top out for four weeks.
Bull Market 2/18/1997
1.035 +95
+.908 -3
.027
Bull Market 2/19/1997
1.026 +94
+.073 -6
-.059
Late Bull M. 2/5/2001
1.025 +287 +.069
-3 +.049
DJI immediately declines.
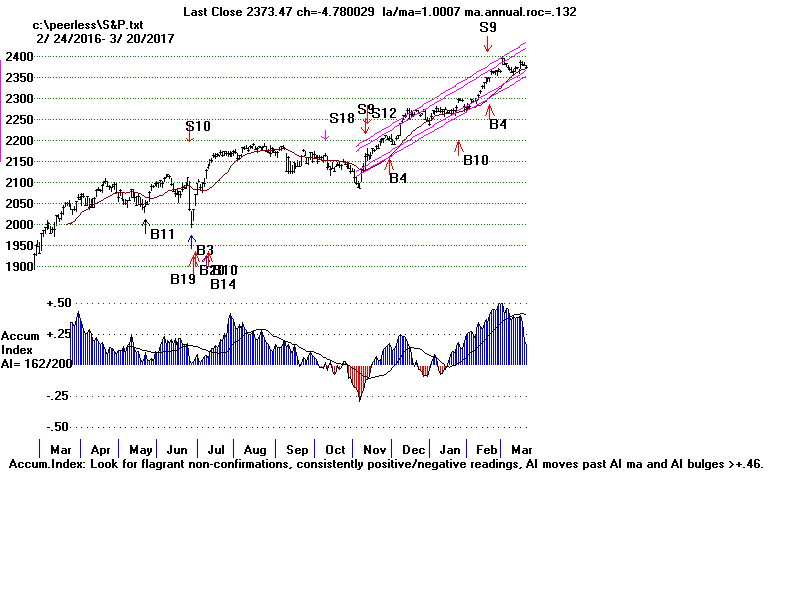
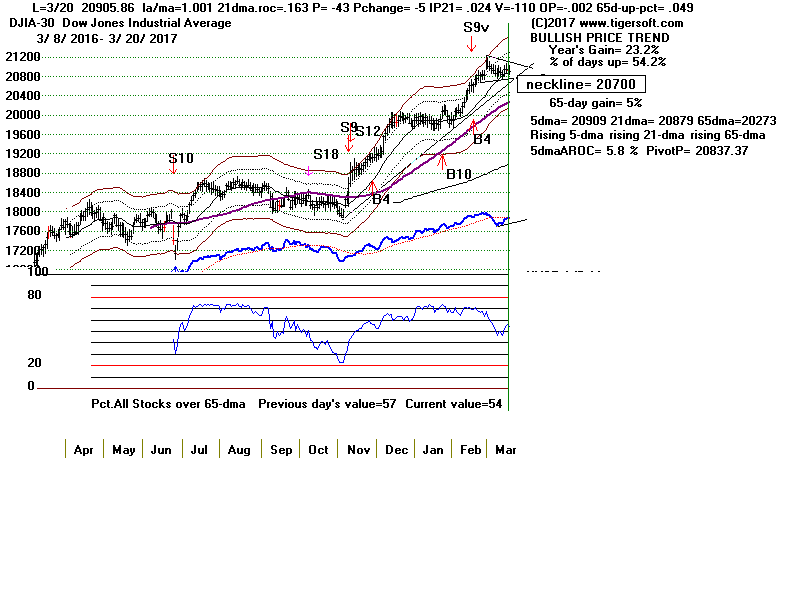
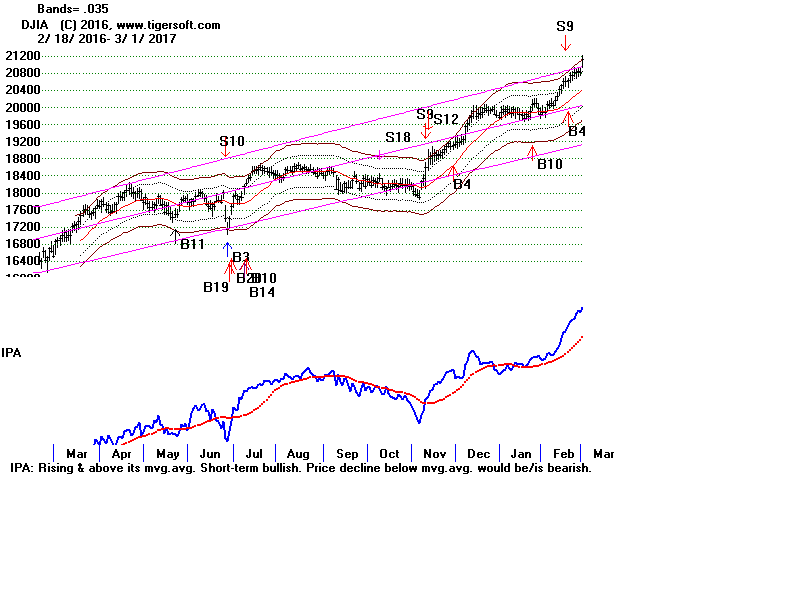
As you can see below, the DJI now stands 2.1% over the 21-day ma. This is
not far enough above
the 21-day ma to give a Peerless Sell. I would expect the V-I and OBVPct
readings to rise and
turn positive this week even if the DJI simply goes sidewise. This would
avert a Sell S9-V or
an S18 at the upper 3.5% upper band.
TO REGULARLY UPDATED INDEX and ETF CHARTS
2/13/17: PEERLESS DJI, Signals, Indicators
DJI-13 Hourly DJIA
S&P OEX NYSE NASDAQ COMPQX with Closing Power
DIA SPY QQQ MDY IWM
Short Term Interest Rates DJI-Utilities DJI-Transp A/D Line-6000 Stocks
CrudeOil FAS GASL GLD BBH BRZU IBB JETS
JNUG KOL NUGT OIH OIL
RSX RETL SLV SOXL TECL TMF TNA UCO VGK WEAT XOP YINN
JJC - Copper
----------------------- TO REGULARLY UPDATED STOCK CHARTS
--------------------------------
AAPL ADBE
AMZN BIDU
CAT FB
GILD GOOG
GS IBM
JPM MSFT
NVDA REN
TXN
Biotechs AMGN
GILD TEVA
2/13/17:
BULLISH MAXCPs BEARISH MINCPS
 RANKING OF KEY DIRECTORIES BASED PCT.OF STOCKS ABOVE 65-DMA
              2/13/17
---------------------------------------------------------------------------------------
Directory     Current       day-1         day-2         day-3         day-4         day-5
----------------------------------------------------------------------------------------
ETFS           .97           .97           .97           .97           .941          .955
GOLD           .943          .943          .943          .943          .943          .943
PIPELINE       .888          .888          .888          .888          .888          .888
MORNSTAR       .878          .878          .857          .84           .819          .823
BIGBANKS       .857          .714          .714          .714          .714          .857
HOSPITAL       .857          .857          .857          .571          .571          .571
BONDFUND       .855          .936          .918          .927          .882          .864
UTILITY        .844          .844          .777          .8            .711          .733
INFRA          .818          .818          .727          .545          .545          .636
FINANCE        .817          .795          .774          .72           .784          .838
FOOD           .8            .8            .8            .8            .8            .8
REIT           .786          .786          .718          .682          .64           .656
INDMATER       .78           .75           .71           .64           .69           .69
HACKERS        .777          .722          .777          .777          .777          .777
NIFTY          .771          .8            .771          .685          .657          .628
DOWJONES       .766          .766          .7            .766          .766          .733
INSURANC       .763          .736          .736          .657          .684          .736
COMPUTER       .76           .72           .72           .64           .72           .72
INDEXES        .76           .768          .756          .722          .726          .743
RUS-1000       .755          .747          .713          .677          .673          .697
SP-100         .752          .752          .701          .711          .701          .721
SP500          .746          .738          .702          .659          .652          .663
NASD-100       .741          .741          .741          .709          .72           .72
CHINA          .738          .723          .676          .615          .6            .63
SOLAR          .736          .736          .473          .473          .526          .473
MILITARY       .733          .688          .644          .644          .644          .644
COMODITY       .722          .763          .763          .777          .736          .763
HOMEBLDG       .722          .666          .666          .722          .722          .777
REGBANKS       .722          .583          .527          .388          .5            .638
SEMI           .721          .721          .696          .696          .745          .745
SOFTWARE       .703          .734          .718          .625          .671          .734
TRANSP         .7            .65           .6            .5            .5            .45
ELECTRON       .685          .68           .664          .654          .685          .716
N=32

GAMING         .666          .633          .6            .566          .566          .633
JETS           .666          .666          .666          .555          .555          .555
BEVERAGE       .65           .7            .65           .65           .55           .55
EDU            .625          .5            .625          .625          .75           .75
CHEM           .591          .577          .521          .507          .521          .549
AUTO           .575          .575          .55           .525          .575          .6
BIOTECH        .556          .564          .552          .498          .529          .541
GREEN          .548          .516          .483          .483          .451          .451
OILGAS         .543          .575          .525          .468          .5            .6
COAL           .444          .555          .555          .444          .555          .555
RETAIL         .357          .41           .339          .285          .232          .25
========================================================================================================
2-10-2017
Peerless remains on a Buy.
Significantly higher prices seem likely,
although the FED and Janet Yellen may try to dampen the
bulls' enthusiasm. We do need to see a big increase in NYSE UP volume to
avoid a Peerless Sell
signal if the DJI charges up too fast past 20500 this coming week. This is
because we will likely get a Sell S9V
if the V-Indicator stays negative and the DJI closes above 20480. We may
also get a rare Sell S18 based
on a negative OBVPct with the DJI above the 3.5% band.
But let's not be too quick to sell. At
a minimum. I would still want to see daily breadth turn negative
to "clinch" these Sells. And since there is so much skepticism that there
can be a bull market with
Trump as President, I would still probably remain a bull. Certainly,
I would also want to do more back-testing.
I'm not sure that we can trust such volume-based Sells in February or even in
March because of the strong tendency of
bull markets like ours to last until the end of| April, at least. As you
can see, the NYSE A/D Line is in a
steady uptrend. It and the Hourly DISI-OBV have bullishly been leading
prices to new highs. If the
market were in danger, I would expect weaker breadth and/or a sudden DJI
head/shoulders pattern.
Instead of these, we could be on the cusp of important channel breakouts by IWM,
NYSE, SPY and FAS.
For now, the DJI keep moving up into all-time high
territory where the path of least resistance is UP.
What will help such bullishness become a reality?
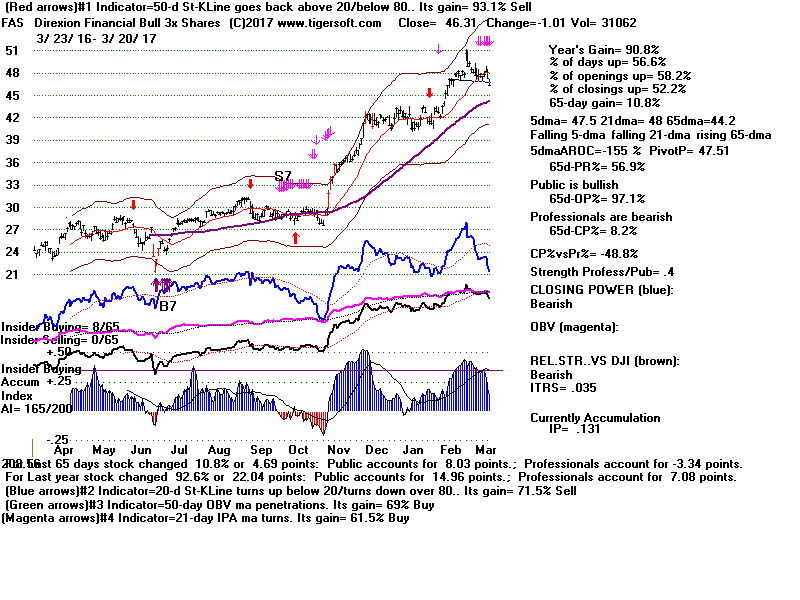
Most important this coming week would be
clear breakouts by FAS and IWM. A clear price breakout by
FAS above 140 would suggest the DJI will go
much higher, in that FAS would thereby be set up for a steep rise and it tends
to be traded very well with the
Buys and Sells of Peerless.
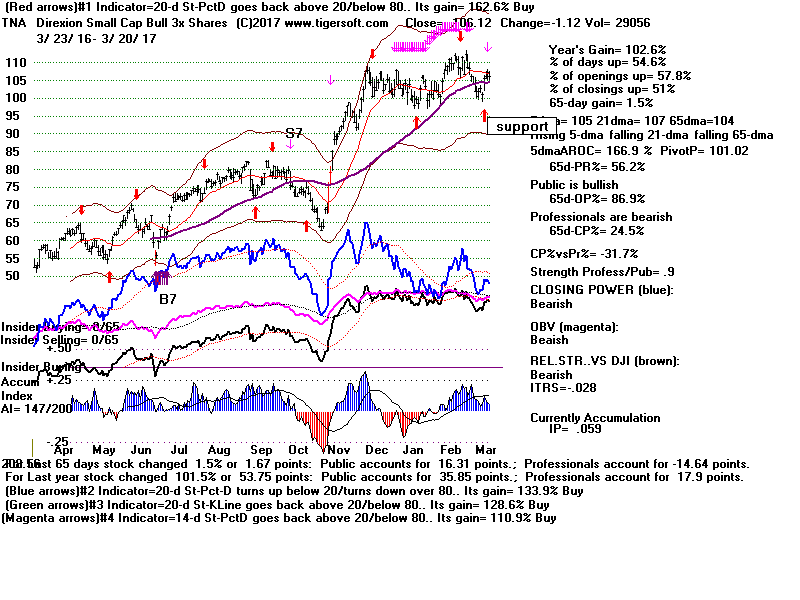
A decisive breakout by IWM (Russell-2000) would be important because it would
show that the bull market's
breadth is expanding, not contracting. Equally important, an clear-cut IWM
breakout would likely mean an
increase in trading volume, something which is needed if the DJI is to avoid a
Sell S9V on a close much above 20470
or a Sell S18 if the DJI should reach its 3.5% band with its OBVPct still
negative.
Fortunately, V-I and OBVPct should gradually move up because we will be dropping
off negative volume days for the next week from a month ago. See below how
a rise into positive territory
by these indicators would make the DJI resemble a number of the strongest past
market.
See Past DJI Bull Markets
and OBV-Pct
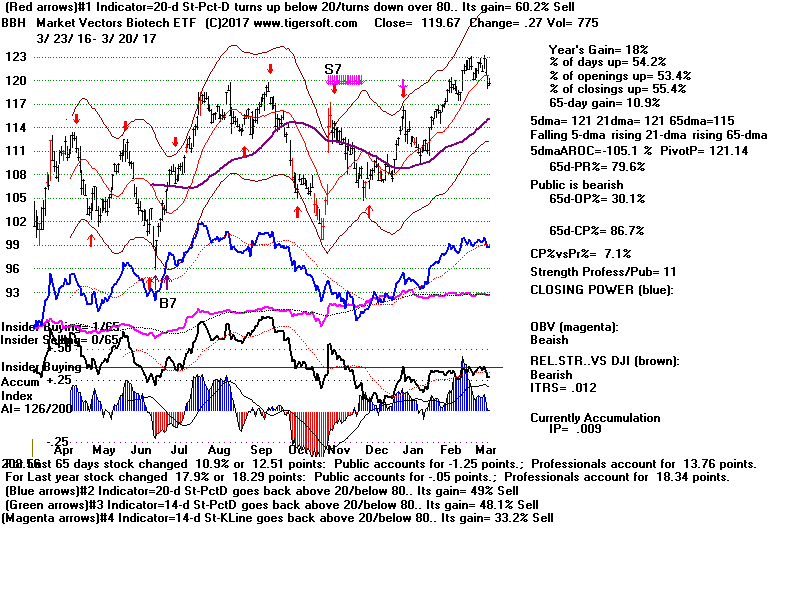
KEY ETFS' INTERNAL STRENGTH READINGS
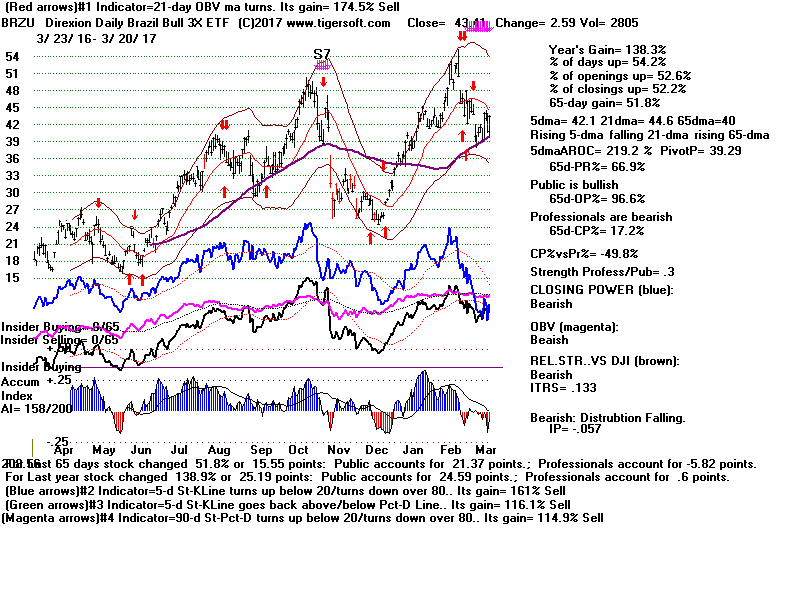
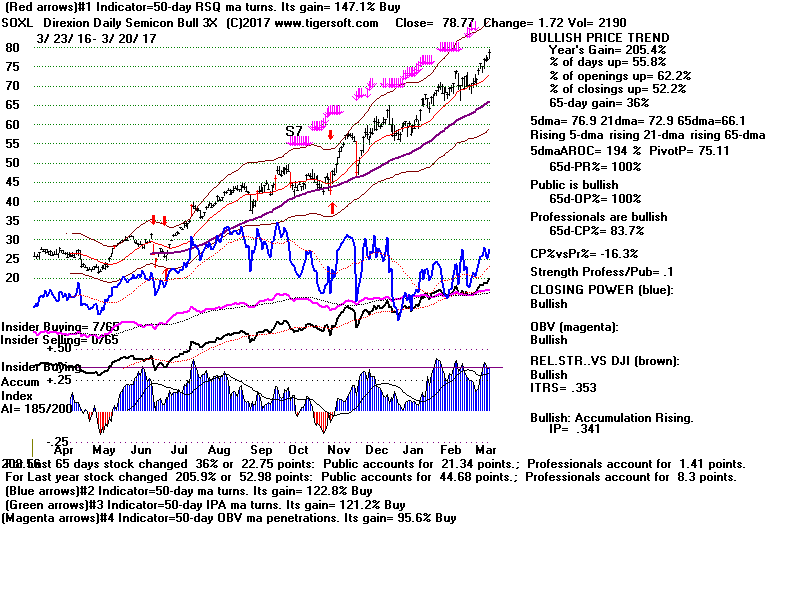
Only SOXL and OIL have falling 5-dma. I've added BRZU because of how
well it trades with Peerless Buys and Sells over the years. Note its very
level
of Accumulation.
2/10 Close below
which Opening Closing
IP21 ITRS
Price would turn 5-day ma
Power Power
down tomorrow (2/9)
--- Pivot Point ---
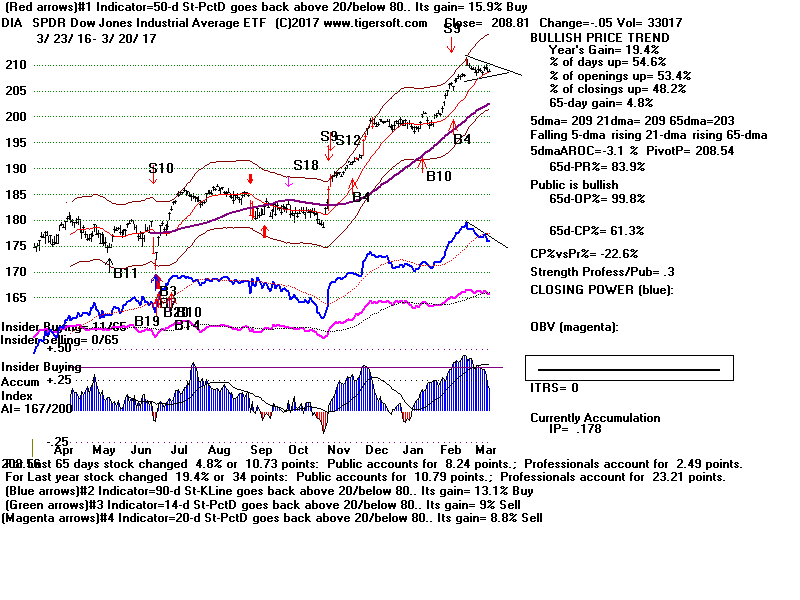
DIA 202.74 +1.02
200.28
rising rising
+.255 na
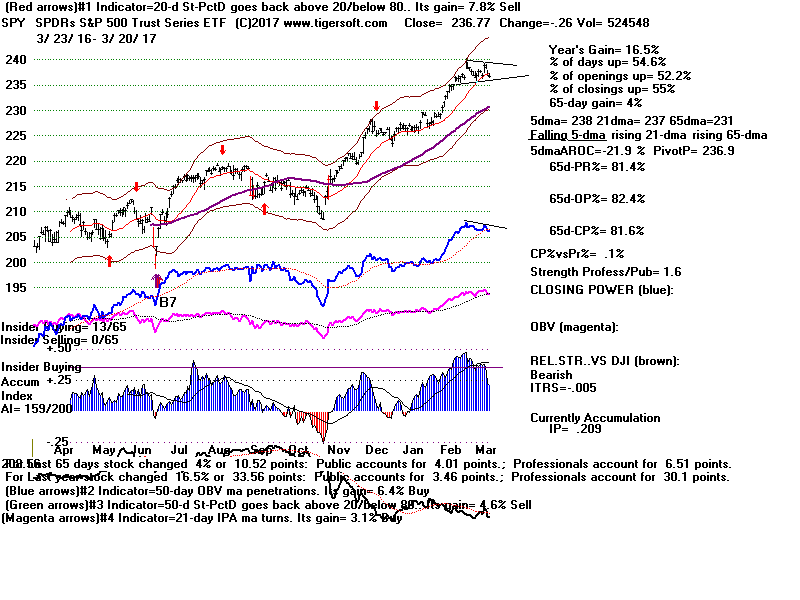
SPY 231.51 + .91
228.93
rising rising
+.288 -.012
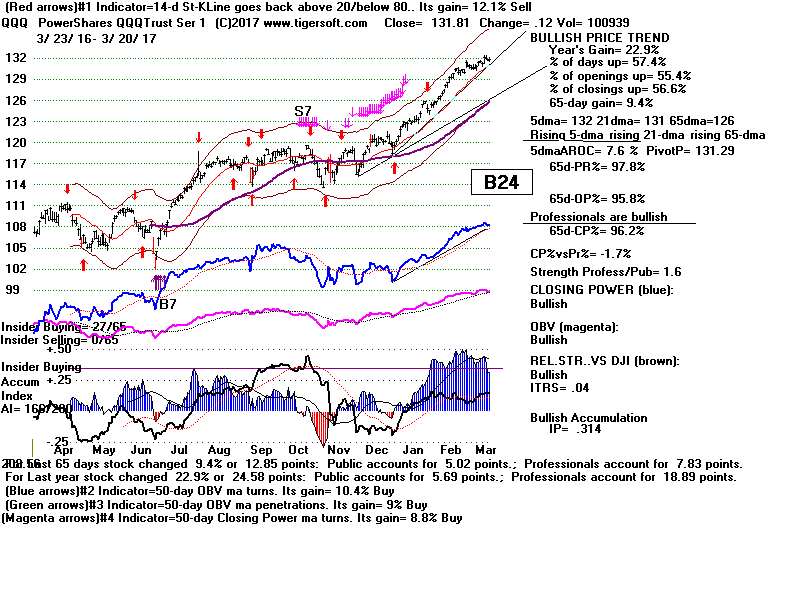
QQQ 127.38 +.42 125.83
rising rising
+.360 +.011
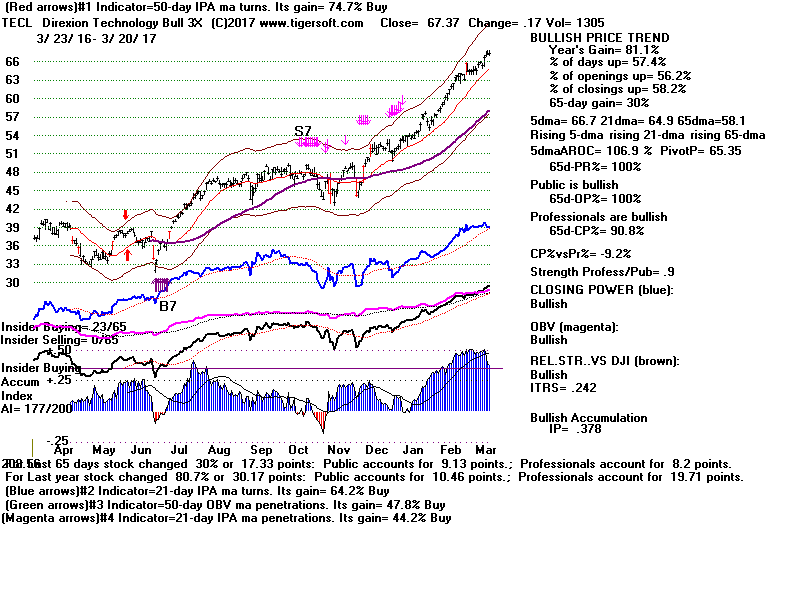
TECL 59.37+.36
57.95
rising rising
+.341 +.153 (3x leveraged)
SOXL
67.97 -0.16
68.86
rising falling
+.298 +.138 (3x leveraged)
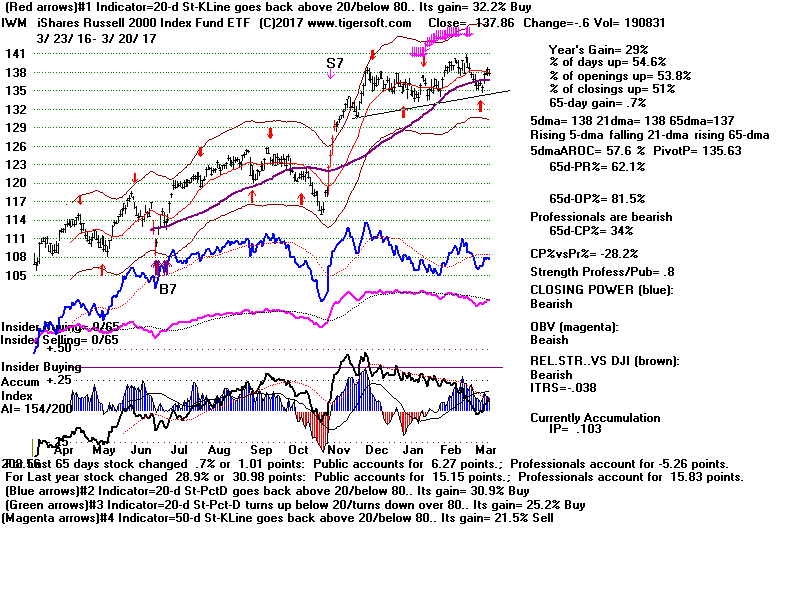
IWM 137.94 +1.04
135.84
rising ? +.071
-.017
FAS 44.00 +.44
42.88
rising
? +.139 +.146 (3x leveraged)
GLD 117.60 +.31
117.70
rising rising +.159
-.022
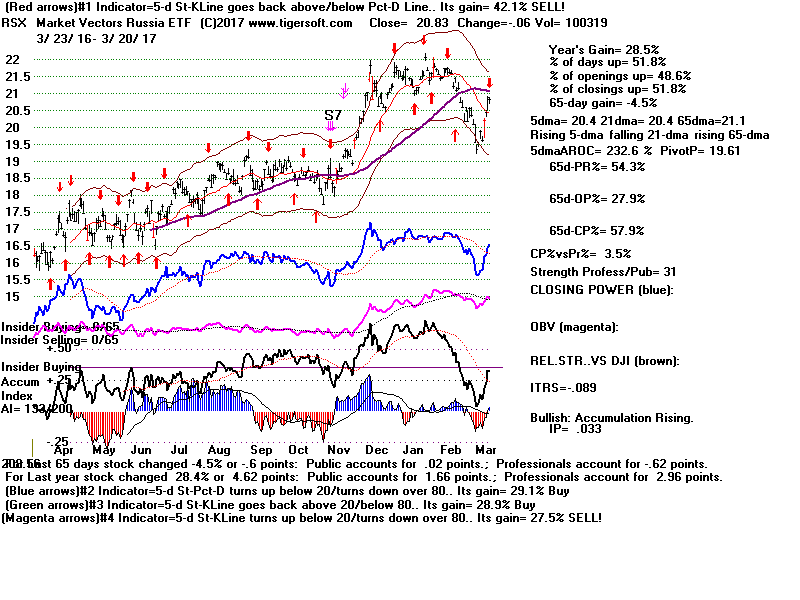
BRZU 45.83 +2.74 41.70
rising rising
+.131 +.452
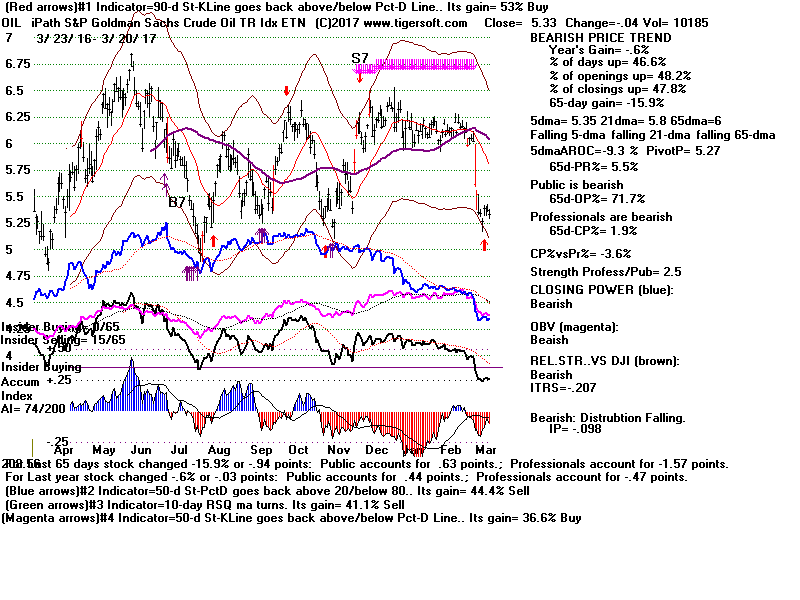
OIL
6.19 +.09 6.11
rising
falling
-.077 +.088
Don't overlook BRZU for profitable trading.
Below
see how well BRZU (3x-Brazil ETF) is traded using our 5-day Stochastic-K Buys
and Sells.
In addition, BRZU has usually been one of the best trading vehicles to buy when
Peerless gives a
reversing Buy signal.
See
http://tigersoft.com/BRAZIL/index.html
TO REGULARLY UPDATED INDEX and ETF CHARTS
2/10/17: PEERLESS DJI, Signals, Indicators
DJI-13 Hourly DJIA
S&P OEX NYSE NASDAQ COMPQX with Closing Power
DIA SPY QQQ MDY IWM
Short Term Interest Rates DJI-Utilities DJI-Transp A/D Line-6000 Stocks
CrudeOil FAS GASL GLD BBH BRZU IBB JETS
JNUG KOL NUGT OIH OIL
RSX RETL SLV SOXL TECL TMF TNA UCO VGK WEAT XOP YINN
JJC - Copper
-----------------------
TO REGULARLY UPDATED STOCK CHARTS --------------------------------
AAPL ADBE
AMZN BIDU
CAT FB
GILD GOOG
GS IBM
JPM MSFT
NVDA REN
TXN
Biotechs AMGN
GILD TEVA
2/10/17:
BULLISH MAXCPs BEARISH MINCPS
 RANKING OF KEY DIRECTORIES BASED PCT.OF STOCKS ABOVE 65-DMA
               2/10/17
---------------------------------------------------------------------------------------
Directory     Current       day-1         day-2         day-3         day-4         day-5
----------------------------------------------------------------------------------------
FOR. ETFS      .97           .97           .97           .941          .955          .985
GOLD           .943          .924          .962          .943          .943          .943
BONDFUND       .936          .918          .927          .882          .837          .801
PIPELINE       .888          .888          .888          .888          .888          .888
MORNSTAR       .878          .857          .84           .819          .827          .878
HOSPITAL       .875          .875          .5            .5            .5            .5
UTILITY        .844          .777          .8            .711          .733          .844
INFRA          .818          .727          .545          .545          .636          .636
FOOD           .8            .8            .8            .8            .8            .733
NIFTY          .8            .771          .685          .657          .628          .771
FINANCE        .795          .774          .72           .784          .87           .87
REIT           .786          .718          .682          .64           .671          .708
INDEXES        .768          .756          .722          .726          .752          .777
DOWJONES       .766          .7            .766          .766          .733          .766
COMODITY       .763          .763          .777          .736          .763          .777
SP-100         .752          .701          .711          .701          .721          .742
INDMATER       .75           .71           .64           .69           .7            .73
RUS-1000       .747          .713          .677          .673          .701          .742
NASD-100       .741          .741          .709          .72           .72           .72
SP500          .738          .702          .659          .652          .667          .717
INSURANC       .736          .736          .657          .684          .789          .789
SOLAR          .736          .473          .473          .526          .473          .526
SOFTWARE       .734          .718          .625          .671          .734          .718
SEMI           .733          .708          .708          .758          .766          .8
CHINA          .723          .676          .615          .6            .63           .63
HACKERS        .722          .777          .777          .777          .777          .777
COMPUTER       .72           .72           .64           .72           .72           .76
BIGBANKS       .714          .714          .714          .714          .857          .857
BEVERAGE       .7            .65           .65           .55           .5            .6
MILITARY       .688          .644          .644          .644          .666          .733
ELECTRON       .68           .664          .654          .685          .726          .752
N=31
HOMEBLDG       .666          .666          .722          .722          .777          .777
JETS           .666          .666          .555          .555          .555          .555
TRANSP         .65           .6            .5            .5            .45           .55
GAMING         .633          .6            .566          .566          .633          .666
REGBANKS       .583          .527          .388          .5            .638          .722
CHEM           .577          .521          .507          .521          .549          .591
AUTO           .575          .55           .525          .575          .6            .625
OILGAS         .575          .525          .468          .5            .6            .65
BIOTECH        .564          .552          .498          .525          .533          .525
COAL           .555          .555          .444          .555          .555          .444
GREEN          .516          .483          .483          .451          .451          .516
EDU            .5            .625          .625          .75           .75           .75
RETAIL         .41           .339          .285          .232          .25           .303
------------------------------------------------------------------------------------------------
=========================================================================================================
2-9-2017 Peerless remains on a Buy
The DJI's 100+ point gain has taken it into all-time high territory, but not yet
above the last rising resistance that could constrain it. I think that is
coming.
Tomorrow, let's see if we can get clear breakouts by the NASDAQ and QQQ
above their upper channel resistance lines. That should unleash them for
flashy
vertical advances.
Bulls will also want to see IWM (Russell-2000) and FAS (financials) make their
own
flat-top pattern breakouts to reinforce the strength seen in the DJI, NASDAQ,
QQQ, TECL
and many high techs like AAPL, ADBE and NVDA. Markets that move up
across-the-board
on rising volume at this stage tend to keep rising until the Summer.
Another thing that would help would be to see Intel and the
Semi-Conductor group turn back up. INTC's weakness
today has been attributed to its decision to build a large
new plant in Arizona at the request of the President instead
of overseas. Though generally a lot stronger than the DJI,
the rise on SOXL has been bumpy. It's TigerSoft chart says
it still has a rising 5-dma and its Closing Power is neutral.
These both would need to turn negative to justify selling it.
INTC has been lagging many other semi-conductors for some
time. Its weakness now may only show it is losing its competitive
advantage.
KEY ETFS' INTERNAL STRENGTH READINGS
2/9 Close below
which Opening Closing
IP21 ITRS
Price would turn 5-day ma
Power Power
down tomorrow (2/9)
--- Pivot Point ---
DIA 201.72 +1.21
200.38
rising rising
+.274 na
SPY 230.60 +1.36
229.34
rising rising
+.311 -.011
QQQ 126.96 +.46 125.68
rising rising
+.398 +.014
TECL 59.01+.62
58.60
rising rising
+.370 +.152 (3x leveraged)
SOXL 68.13 -1.83
68.15
rising ?
+.334 +.137 (3x leveraged)
IWM 136.9 +1.90
136.87
rising ? +.074
-.023
FAS 43.56 +1.31
41.25
rising falling
+.074 +.103 (3x leveraged)
GLD 117.29 -1.20 116.13
rising rising +.147
-.087
IWM and FAS (just below) showed bulges of high Accumulation 6 weeks ago and
have recently corrected to points close to their rising 65-dma. By our
Closing Power theories, a break in these CP downtrends would constitute
a reliable BUYs.
TO REGULARLY UPDATED INDEX and ETF CHARTS
2/9/17: PEERLESS DJI, Signals, Indicators
DJI-13 Hourly DJIA
S&P OEX NYSE NASDAQ COMPQX with Closing Power
DIA SPY QQQ MDY IWM
Short Term Interest Rates DJI-Utilities DJI-Transp A/D Line-6000 Stocks
CrudeOil FAS GASL GLD BBH BRZU IBB JETS
JNUG KOL NUGT OIH OIL
RSX RETL SLV SOXL TECL TMF TNA UCO VGK WEAT XOP YINN
JJC - Copper has
been added.
-----------------------
TO REGULARLY UPDATED STOCK CHARTS --------------------------------
AAPL ADBE
AMZN BIDU
CAT FB
GILD GOOG
GS IBM
JPM MSFT
NVDA REN
TXN
Biotechs AMGN
GILD TEVA
2/9/17:
BULLISH MAXCPs BEARISH MINCPS
 RANKING OF KEY DIRECTORIES BASED PCT.OF STOCKS ABOVE 65-DMA
               2/9/17
---------------------------------------------------------------------------------------
Directory     Current       day-1         day-2         day-3         day-4         day-5
----------------------------------------------------------------------------------------
Foreign ETFS   .97           .97           .941          .955          .985          .941
GOLD           .924          .943          .962          .943          .943          .943
BONDFUND       .918          .927          .882          .837          .783          .774
PIPELINE       .888          .888          .888          .888          .888          .888
HOSPITAL       .857          .571          .571          .571          .571          .571
MORNSTAR       .857          .84           .819          .827          .873          .802
FOOD           .8            .8            .8            .8            .733          .8
HACKERS        .777          .777          .777          .777          .777          .833
UTILITY        .777          .8            .711          .733          .844          .755
FINANCE        .774          .72           .784          .87           .87           .763
NIFTY          .771          .685          .657          .628          .771          .628
COMODITY       .76           .774          .732          .76           .774          .774
INDEXES        .756          .722          .726          .752          .773          .752
NASD-100       .741          .709          .72           .72           .72           .677
INSURANC       .736          .657          .684          .789          .789          .736
INFRA          .727          .545          .545          .636          .636          .727
COMPUTER       .72           .64           .72           .72           .76           .68
REIT           .718          .682          .64           .671          .708          .635
SOFTWARE       .718          .625          .671          .734          .718          .718
BIGBANKS       .714          .714          .714          .857          .857          .714
RUS-1000       .713          .677          .673          .701          .742          .676
INDMATER       .71           .64           .69           .7            .73           .74
SEMI           .708          .708          .758          .766          .783          .758
SP500          .702          .659          .652          .667          .717          .646
SP-100         .701          .711          .701          .721          .742          .67
DOWJONES       .7            .766          .766          .733          .766          .666
CHINA          .676          .615          .6            .63           .63           .615
N=27
HOMEBLDG       .666          .722          .722          .777          .777          .777
JETS           .666          .555          .555          .555          .555          .666
ELECTRON       .664          .654          .685          .726          .742          .701
BEVERAGE       .65           .65           .55           .5            .55           .45
MILITARY       .644          .644          .644          .666          .733          .555
EDU            .625          .625          .75           .75           .875          .75
GAMING         .6            .566          .566          .633          .666          .6
TRANSP         .6            .5            .5            .45           .55           .45
COAL           .555          .444          .555          .555          .444          .555
BIOTECH        .552          .498          .529          .533          .529          .501
AUTO           .55           .525          .575          .6            .65           .6
REGBANKS       .527          .388          .5            .638          .722          .5
OILGAS         .525          .468          .5            .6            .65           .606
CHEM           .521          .507          .521          .549          .591          .591
GREEN          .483          .483          .451          .451          .548          .516
SOLAR          .473          .473          .526          .473          .473          .473
RETAIL         .339          .285          .232          .25           .303          .267
---------------------------------------------------------------------------------------------
========================================================================================================
2-8-2017 Peerless remains on a Buy
The NYSE A/D Line keeps trending higher as does our very sensitive
Hourly DISI-OBV for the DJIA.
Volume could be higher on the upside I admit. But traders are naturally
cautious with the DJI, QQQ and NASDAQ approaching its rising resistance.
Investors are getting used to Trump's fulminations. Perhaps, he, too, will
get
used to the political system's checks and balances. I believe he realizes
that a strong stock market will make a good political ally. And, even more
important, I think Wall Street appreciates his need to boost the
market and not allow a Crash if he wants to create more jobs in the US.
So, I don't see any reason to disturb out long positions in QQQ, TECL,
SOXL and GLD. Each shows rising Closing Powers, 5-day moving
averages and very positive Accumulation. Each is currently outperforming
the DJIA.
See the Price Channels below in DJI, NASDAQ and QQQ.
Breakouts above these into all-time high territory should
bring a rapid acceleration of the rate of ascent.
Fewer Industry Groups Are Rallying.
There may be a new technical problem emerging that we will have to watch.
A lot fewer industry groups still show 67% or more of their stocks above
their 65-dma than two weeks ago. The market is becoming more defensive.
See how Bonds are rising a bit. Traders might want to take profits if
their
ETFs close below the 5-day ma pivot points below or their Closing Powers
turn bearish. However, the unusually high levels of Accumulation Index
(IP21)
do tell us that any declines now are apt to be quite shallow.
KEY ETFS' INTERNAL STRENGTH READINGS
2/8 Close below
which Opening Closing
IP21 ITRS
Price would turn 5-day ma
Power Power
down tomorrow (2/9)
--- Pivot Point ---
DIA 200.51 -.07
198.61
rising rising
+.233 na
SPY 229.24 +.30
227.77
rising rising
+.274 -.013
QQQ 126.50 +.21 125.32
rising rising
+.398 +.017
TECL 58.39 +.34
56.21
rising rising
+.346 +.153 (3x leveraged)
SOXL 69.96 +.34
66.91
rising rising
+.401 +.168 (3x leveraged)
IWM 135.0 -.04 134.81
rising falling +.068
-.041
FAS 42.25 -.42
41.25
rising falling
+.092 +.103 (3x leveraged)
GLD 118.49 +.73 115.84
rising rising +.201
+.001
TO REGULARLY UPDATED INDEX and ETF CHARTS
2/8/17: PEERLESS DJI, Signals, Indicators
DJI-13 Hourly DJIA
S&P OEX NYSE NASDAQ COMPQX with Closing Power
DIA SPY QQQ MDY IWM
Short Term Interest Rates DJI-Utilities DJI-Transp A/D Line-6000 Stocks
CrudeOil FAS GASL GLD BBH BRZU IBB JETS
JNUG KOL NUGT OIH OIL
RSX RETL SLV SOXL TECL TMF TNA UCO VGK WEAT XOP YINN
JJC - Copper has
been added.
Most Interesting ETF Chart:
-
----------------------- TO REGULARLY UPDATED STOCK CHARTS
--------------------------------
AAPL ADBE AMZN BIDU CAT FB GILD GOOG GS IBM JPM MSFT NVDA REN TXN
Biotechs AMGN GILD TEVA
2/8/17:
BULLISH MAXCPs BEARISH MINCPS
RANKING OF KEY DIRECTORIES BASED PCT.OF STOCKS ABOVE 65-DMA
 RANKING OF KEY DIRECTORIES BASED PCT.OF STOCKS ABOVE 65-DMA
              2/8/17
---------------------------------------------------------------------------------------
Directory     Current       day-1         day-2         day-3         day-4         day-5
----------------------------------------------------------------------------------------
ETFS           .97           .941          .955          .985          .941          .911
GOLD           .943          .943          .962          .943          .943          .924
BONDFUND       .927          .882          .837          .783          .756          .801
PIPELINE       .888          .888          .888          .888          .888          .888
MORNSTAR       .84           .819          .827          .873          .815          .815
FOOD           .8            .8            .8            .733          .8            .8
UTILITY        .8            .711          .733          .844          .755          .666
HACKERS        .777          .777          .777          .777          .833          .777
COMODITY       .774          .732          .76           .774          .774          .788
DOWJONES       .766          .766          .733          .766          .666          .7
HOMEBLDG       .722          .722          .777          .777          .777          .722
INDEXES        .722          .726          .752          .773          .752          .739
FINANCE        .72           .784          .87           .87           .784          .827
BIGBANKS       .714          .714          .857          .857          .714          .857
SP-100         .711          .701          .721          .742          .67           .649
NASD-100       .709          .72           .72           .72           .688          .688
SEMI           .708          .758          .766          .783          .758          .75
NIFTY          .685          .657          .628          .771          .628          .628
REIT           .682          .64           .671          .708          .635          .531
RUS-1000       .677          .673          .701          .742          .684          .665
N=20
SP500          .659          .652          .667          .717          .654          .638
INSURANC       .657          .684          .789          .789          .736          .657
ELECTRON       .654          .685          .726          .742          .706          .716
BEVERAGE       .65           .55           .5            .55           .45           .4
MILITARY       .644          .644          .666          .733          .577          .511
COMPUTER       .64           .72           .72           .76           .68           .6
INDMATER       .64           .69           .7            .73           .75           .73
EDU            .625          .75           .75           .875          .75           .875
SOFTWARE       .625          .671          .734          .718          .718          .703
CHINA          .615          .6            .63           .63           .615          .615
HOSPITAL       .571          .571          .571          .571          .571          .571
GAMING         .566          .566          .633          .666          .6            .566
JETS           .555          .555          .555          .555          .666          .666
INFRA          .545          .545          .636          .636          .727          .727
AUTO           .525          .575          .6            .65           .6            .675
CHEM           .507          .521          .549          .591          .591          .591
TRANSP         .5            .5            .45           .55           .45           .6
BIOTECH        .498          .529          .536          .529          .505          .498
GREEN          .483          .451          .451          .548          .516          .548
SOLAR          .473          .526          .473          .473          .473          .473
OILGAS         .468          .5            .6            .65           .612          .625
COAL           .444          .555          .555          .444          .555          .666
REGBANKS       .388          .5            .638          .722          .555          .666
RETAIL         .285          .232          .25           .303          .267          .232
N=1
=========================================================================================================
2-7-2017 Peerless remains on a Buy
Today's negative NYSE Breadth and heavy NYSE down
volume are not
so bearish as to be dangerous. But they do make watching the
Closing Power uptrends and 5-day ma of DIA, SPY, QQQ, TECL and SOXL
important for short-term traders. Understand that we favor being long
those ETFs with both
both Opening and Closing Power rising now, especially those with an IP21 above
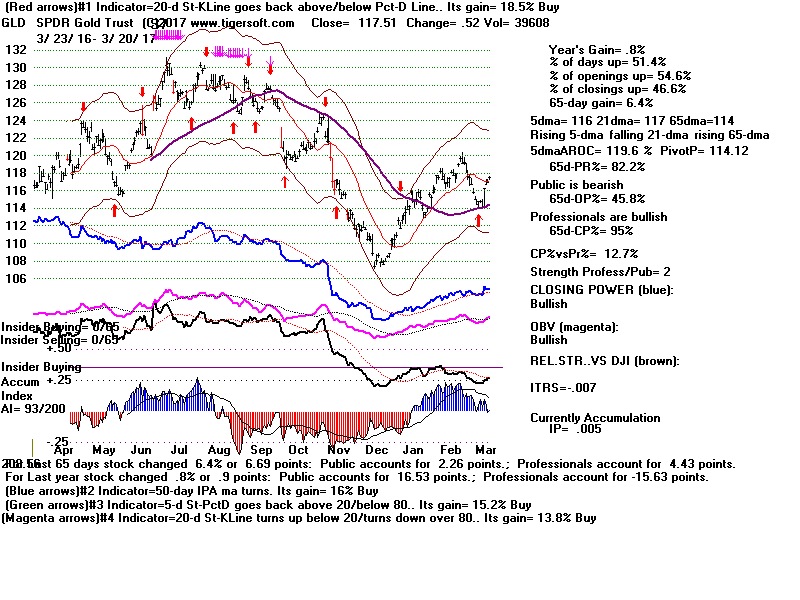
+.15 and a rising 5-dma and a positive Relative Strength ITRS. These are
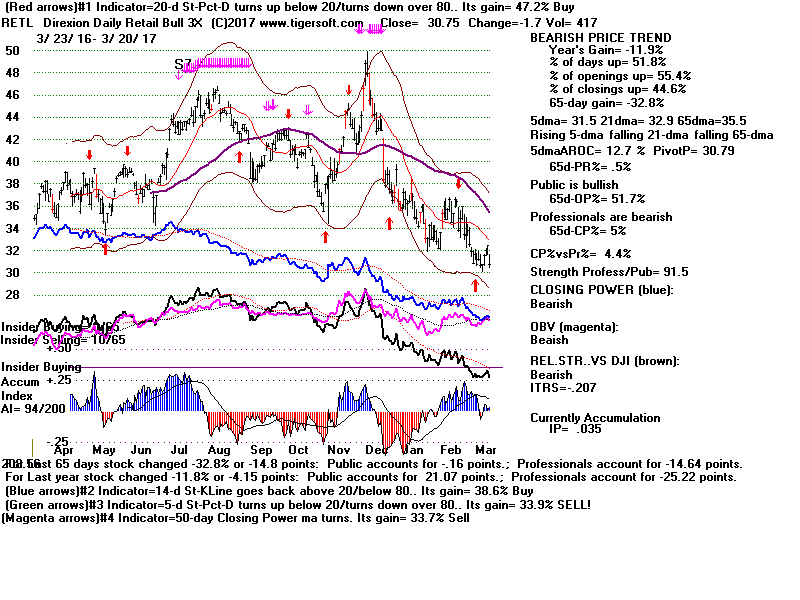
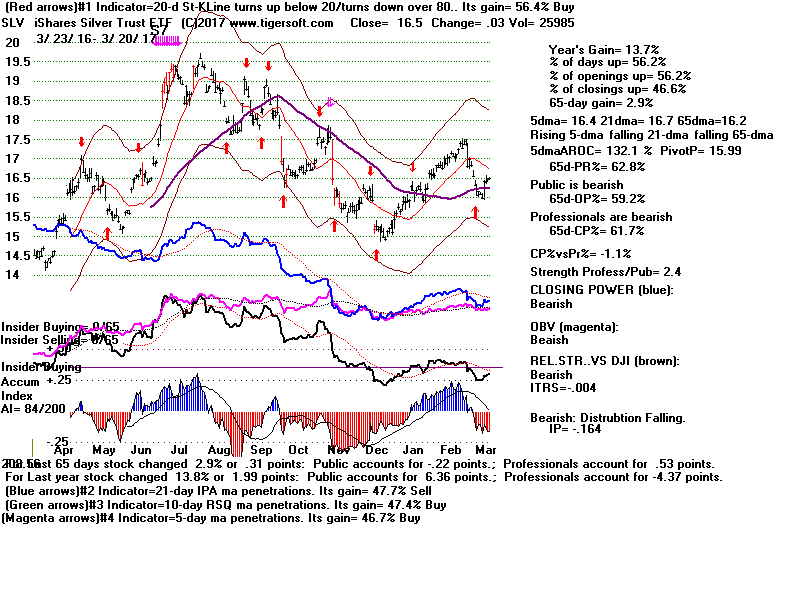
QQQ, TECL and SOXL. GLD also seems attractive now because it has completed
an inverted head and shoulders. RETL might be held short, too. Watch
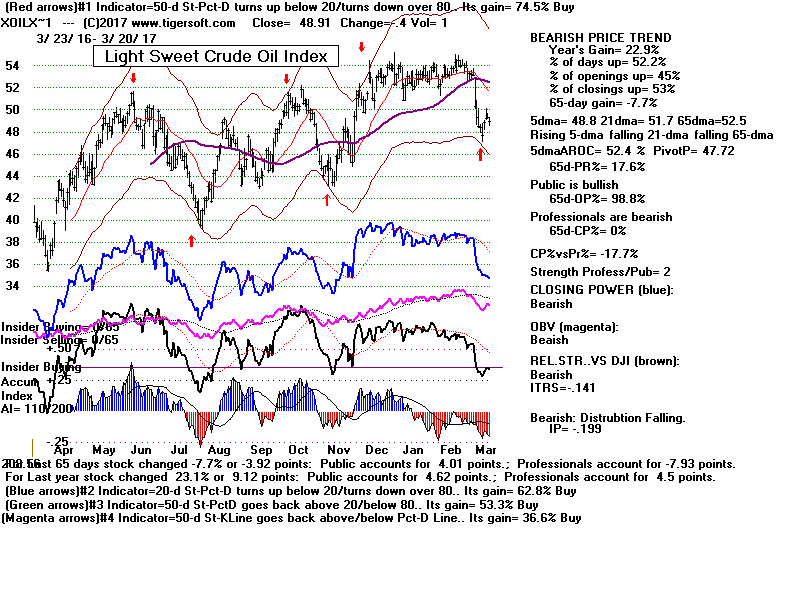
Crude Oil.
It seems likely to break its recent support and its 65-dma.
KEY ETFS' INTERNAL STRENGTH READINGS
2/7 Close below
which Opening Closing
IP21 ITRS
Price would turn 5-day ma
Power Power
down tomorrow (2/8)
--- Pivot Point ---
DIA 200.58
198.63
rising rising
+.197 na
SPY 228.94
227.62
rising rising
+.222 -.015
QQQ 126.29 125.43
rising rising
+.386 +.014
TECL 58.05
56.4
rising rising
+.311 +.156 (3x leveraged)
SOXL 69.62
67.16
rising rising
+.408 +.163 (3x leveraged)
IWM 135.04 135.15
rising falling
-.04 +.01
FAS 42.67
41.24
rising falling
+.092 +.103 (3x leveraged)
GLD 117.46 115.70
rising rising +.212
-.015
AAPL's continues rise continues to inordinately boost DIA,
QQQ,
TECL and the NASDAQ. I think as long as AAPL's Closing
Power keeps rising, it will be difficult for these ETFs
and the NASDAQ decline. AAPL, it seems, has become
the general market's current locomotive, taking the
place of Goldman Sachs, which still has almost twice AAPL's
weight in the DJI. Watch them. If their Closings turn weak
relative to their openings and the Closing Power uptrends are
broken, we will have to expect another pullback from the
the rising price channel's resistance line is approached.
TO REGULARLY UPDATED INDEX and ETF CHARTS
2/7/17: PEERLESS DJI, Signals, Indicators
DJI-13 Hourly DJIA
S&P OEX NYSE NASDAQ COMPQX with Closing Power
DIA SPY QQQ MDY IWM
Short Term Interest Rates DJI-Utilities DJI-Transp A/D Line-6000 Stocks
CrudeOil FAS GASL GLD BBH BRZU IBB JETS
JNUG KOL NUGT OIH OIL
RSX RETL SLV SOXL TECL TMF TNA UCO VGK WEAT XOP YINN
JJC - Copper has
been added.
Most Interesting ETF Charts:
RETL would seem to warrant short sales: OIL is still above its support.
Watch Japan equity ETFs. It appears as though Trump's tariffs will not
apply to
Japanese consumber electronics and autos.
------------------------ TO REGULARLY UPDATED STOCK CHARTS
--------------------------------
AAPL ADBE AMZN BIDU CAT FB GILD GOOG GS IBM JPM MSFT NVDA REN TXN
Biotechs AMGN GILD TEVA
2/7/17:
BULLISH MAXCPs BEARISH MINCPS
RANKING OF KEY DIRECTORIES BASED PCT.OF STOCKS ABOVE 65-DMA
 RANKING OF KEY DIRECTORIES BASED PCT.OF STOCKS ABOVE 65-DMA
               2/7/17
---------------------------------------------------------------------------------------
Directory     Current       day-1         day-2         day-3         day-4         day-5
----------------------------------------------------------------------------------------
GOLD           .943          .943          .962          .943          .924          .943
FOREIGN ETFS   .941          .955          .985          .941          .911          .911
PIPELINE       .888          .888          .888          .888          .888          .888
BONDFUND       .882          .837          .783          .756          .765          .783
MORNSTAR       .819          .827          .873          .815          .827          .852
FOOD           .8            .8            .733          .8            .8            .666
FINANCE        .784          .87           .87           .784          .827          .849
HACKERS        .777          .777          .777          .833          .777          .777
DOWJONES       .766          .733          .766          .666          .7            .766
SEMI           .758          .766          .783          .758          .758          .725
EDU            .75           .75           .875          .75           .875          1
COMODITY       .732          .76           .774          .774          .788          .774
INDEXES        .731          .752          .773          .752          .739          .752
HOMEBLDG       .722          .777          .777          .777          .722          .888
COMPUTER       .72           .72           .76           .68           .6            .76
NASD-100       .72           .72           .72           .688          .677          .763
BIGBANKS       .714          .857          .857          .714          .857          .857
UTILITY        .711          .733          .844          .755          .666          .844
SP-100         .701          .721          .742          .67           .659          .742
INDMATER       .69           .7            .73           .75           .75           .74
ELECTRON       .685          .726          .742          .706          .721          .706
INSURANC       .684          .789          .789          .736          .657          .71
RUS-1000       .673          .701          .742          .684          .67           .732
SOFTWARE       .671          .734          .718          .718          .703          .734
N=24
NIFTY          .657          .628          .771          .628          .628          .742
SP500          .652          .667          .717          .654          .64           .717
MILITARY       .644          .666          .733          .577          .533          .6
REIT           .64           .671          .708          .635          .531          .661
CHINA          .6            .63           .63           .615          .615          .6
AUTO           .575          .6            .65           .6            .675          .725
HOSPITAL       .571          .571          .571          .571          .571          .571
GAMING         .566          .633          .666          .6            .566          .666
COAL           .555          .555          .444          .555          .666          .666
JETS           .555          .555          .555          .666          .666          .555
BEVERAGE       .55           .5            .55           .45           .4            .5
INFRA          .545          .636          .636          .727          .727          .818
BIOTECH        .529          .536          .533          .505          .505          .513
SOLAR          .526          .473          .473          .473          .473          .473
CHEM           .521          .549          .591          .591          .591          .591
OILGAS         .5            .6            .65           .612          .643          .643
REGBANKS       .5            .638          .722          .555          .666          .75
TRANSP         .5            .45           .55           .45           .6            .55
GREEN          .451          .451          .548          .516          .58           .58

RETAIL         .232          .25           .303          .267          .232          .285
========================================================================================================
2-6-2017 Peerless remains on a Buy
The technicals for the DJI,
DIA, SP-500, SPY, NASDAQ and QQQ look quite
favorable. Both Opening and Closing Power trends are up, as are the 5-day
moving averages. High Accumulation values show strong underpinning
strength.
The NYSE A/D Line and Hourly OBV/DISI are both making new highs ahead
of the DJI itself.
De-regulation and lower taxes plus lot of Goldman graduates in Trump's Cabinet
are just what Wall Street wants. Seasonality is quite bullish, too.
Another thing to appreciate now: the averages are moving up in all-time high
territory, where sellers
cannot easily bunch orders except at the most recent highs. Professionals
see this
and know that if they can push prices into all-time high ground on breakouts,
very big gains lie ahead. With the averages below near the top of their
price
channels, there is a reasonable chance that prices will soon breakout above the
resistance
lines at the top of these channels. That will lead to quick vertical
ascents. Recall the
charts of the runaway Republican-President markets of 1925, 1954 and 1985.
I think that is what lies
ahead unless Trump acts way too belligerently or crazily. Gradually, more
and more folks are
becoming used to his defensiveness, his narcissism and his reality distortions.
Most important,
from a political point of view, clearly he's shrewd enough to recognize that a
Wall Street boom this
Spring will gain him tremendous political power and latitude. We should be able
to anticipate
and benefit from this.
| 1925 |
| 1953-1954 |
| 1985 |
While we are waiting for this breakout above the price channels, do not overlook
commodity ETFs. Gold has completed a bullish inverted head and shoulders
pattern
and Crude Oil seems bound to break its well developed support. NUGT and
JNUG are
far below their highs from last year.
TO REGULARLY UPDATED
INDEX and ETF CHARTS
2/6/17: PEERLESS DJI, Signals, Indicators DJI-IPA DJI-13 Hourly DJIA
S&P OEX NYSE NASDAQ COMPQX with Closing Power
DIA SPY QQQ MDY IWM
Short Term Interest Rates DJI-Utilities DJI-Transp A/D Line-6000 Stocks
CrudeOil FAS GASL GLD BBH BRZU IBB JETS
JNUG KOL NUGT OIH OIL
RSX RETL SLV SOXL TECL TMF TNA UCO VGK WEAT XOP YINN
JJC - Copper has
been added.
--------------------------------------------------------------------------------------------------------------------------------------------------------------------------------------------
------------------------ TO REGULARLY UPDATED STOCK CHARTS
--------------------------------
AAPL ADBE AMZN BIDU CAT FB GILD GOOG GS IBM JPM MSFT NVDA REN TXN
Biotechs AMGN GILD TEVA
2/6/17:
BULLISH MAXCPs BEARISH MINCPS
 RANKING OF KEY DIRECTORIES BASED PCT.OF STOCKS ABOVE 65-DMA
                             2/6/17
---------------------------------------------------------------------------------------
Directory     Current       day-1         day-2         day-3         day-4         day-5
----------------------------------------------------------------------------------------
ETFS           .955          .985          .941          .911          .897          .911
GOLD           .943          .943          .962          .924          .943          .811
PIPELINE       .888          .888          .888          .888          .888          .888
FINANCE        .87           .87           .784          .827          .849          .892
BIGBANKS       .857          .857          .714          .857          .857          .857
BONDFUND       .837          .783          .756          .765          .765          .702
MORNSTAR       .827          .873          .815          .827          .848          .823
FOOD           .8            .733          .8            .8            .666          .466
INSURANC       .789          .789          .736          .657          .71           .71
HACKERS        .777          .777          .833          .777          .777          .777
HOMEBLDG       .777          .777          .777          .722          .888          .888
SEMI           .766          .783          .758          .758          .741          .775
COMODITY       .76           .774          .774          .788          .774          .633
INDEXES        .752          .773          .752          .739          .752          .731
EDU            .75           .875          .75           .875          1             .875
DOWJONES       .733          .766          .666          .7            .766          .733
UTILITY        .733          .844          .755          .666          .844          .666
ELECTRON       .726          .742          .706          .721          .721          .737
SP-100         .721          .742          .67           .659          .731          .69
COMPUTER       .72           .76           .68           .6            .76           .68
SOFTWARE       .718          .703          .703          .687          .734          .734
NASD-100       .709          .709          .677          .666          .763          .731
INDMATER       .7            .73           .75           .75           .75           .79
RUS-1000       .7            .741          .683          .669          .737          .712
REIT           .671          .708          .635          .531          .666          .619
N=25
MILITARY       .666          .733          .577          .533          .644          .622
SP500          .665          .715          .652          .638          .719          .696
REGBANKS       .638          .722          .555          .666          .75           .777
INFRA          .636          .636          .727          .727          .818          1
GAMING         .633          .666          .6            .566          .666          .6
CHINA          .63           .63           .615          .615          .6            .584
NIFTY          .628          .771          .628          .628          .742          .8
AUTO           .6            .65           .6            .675          .725          .75
OILGAS         .6            .65           .612          .643          .643          .612
HOSPITAL       .571          .571          .571          .571          .571          .571
COAL           .555          .444          .555          .666          .666          .666
JETS           .555          .555          .666          .666          .555          .555
CHEM           .549          .591          .591          .591          .619          .633
BIOTECH        .536          .533          .509          .505          .513          .412
BEVERAGE       .5            .55           .45           .4            .45           .3
SOLAR          .473          .473          .473          .473          .473          .473
GREEN          .451          .548          .516          .58           .58           .516
TRANSP         .45           .55           .45           .6            .55           .75

RETAIL         .25           .303          .267          .232          .285          .25
N=1


==========================================================================================================================
===========================================================================================================================


   2-3-2017  Peerless remains on a Buy.

             The DJI shot up past the 20000. The steeply rising Hourly DISI-OBV
          tells us the short-term still looks good.  That the NYSE AD Line has
          made another new high ahead of DJI prices should also shore up
          our confidence.


                            Seasonality looks bullish, too.

                    See  how the DJI has generally behaved after February

                    4th in each year since 1965.


                    Trading Days   Avg. Pct.   Pct. of Years
                    ahead            Gain      DJI  Rose
                    -------------------------------------------
                     5               0.2%          59.2%

                    10               0.2%          53.2%

                    21               0.9%          61.2%

                    42               1.7%          63.3%

                    65                3.5%          73.5%


              Most likely, the market and key ETFs will keep on
              rising in the price channel shown  below.  Except for IWM (Russell-2000),
              all the major market ETFs' Closing Powers and
              5-day mvg. averages will probably be rising at tomorrow's close.  Their
              high  current Accumulation Index (IP21) readings bode well, too.

              QQQ, FAS, TECL, SOXL and GDXX should be held long.  Only RETL might be held short on
              account of the fact that less than 33% of  the retail stocks we regularly
              count are above their 65-dma.  But my preference now would be use a few of our
              Bearish MINCPs as hedging short sales.
              -------------------------------------------------------------------